


Abstract
Traffic congestion not only severely impacts residents’ daily travel quality and increases travel costs, but also triggers traffic accidents, causes environmental pollution, and leads to resource waste. There is a practical need to implement engineering measures simultaneously across multiple intersections to mitigate urban road traffic congestion, which necessitates in-depth research into selecting critical intersection clusters. Based on existing research, the relationship between vehicle emissions and the degree of saturation was derived. The network efficiency evaluation metric was refined using the degree of saturation, and a model linking vehicle emissions to network efficiency was established. A validation experiment was designed using the core road network of Xining City, Qinghai Province, as an example. The results indicate that vehicular exhaust emissions per kilometer are proportional to the saturation degree metric value. The network efficiency metric is inversely proportional to the network’s overall (or average) saturation degree. Vehicular exhaust emissions exhibit an inverse relationship with network efficiency. As the road traffic operational state shifts from congestion to free-flow conditions, for every 1-unit increase in network efficiency value, the average exhaust emissions per vehicle per kilometer decrease by 3.976 kg. Different congestion mitigation node selection schemes correspond to varying total emission reductions during the morning peak. When ranked by the magnitude of increase in network efficiency (from the largest increase to the smallest), the corresponding total morning peak emission reductions gradually decrease in a stepwise manner. According to the and experimental results, compared to the worst node cluster selection scheme, the optimal node cluster selection scheme can reduce vehicular exhaust emissions by 4441 kg and 6616 kg, respectively. These findings provide valuable theoretical and practical insights for implementing energy-saving and emission reduction strategies in urban traffic management.
1. Introduction
With the gradual increase in China’s urbanization rate and the rapid growth of motor vehicle ownership, coupled with temporal (including weekdays and non-working days) and spatial variations in road traffic volume [1], the conflict between limited urban space and transportation supply and the continuously rising travel demand has become increasingly prominent. The resulting traffic congestion not only severely impacts residents’ daily travel quality and increases travel costs, but also triggers traffic accidents, causes environmental pollution, and leads to resource waste, which is detrimental to the sustainable development of urban economies and societies. Consequently, urban traffic congestion has garnered increasing public concern [2].
Urban road networks are interconnected systems composed of intersections and road segments. Ensuring the smooth operation of intersections and road segments is crucial for guaranteeing the reliable functioning and overall performance of the road network. However, due to signal control, intersections often become “bottlenecks” and are prone to congestion. Delays at intersections typically account for a significant share of total travel delay. On the one hand, through the control function of traffic signals, conflicting traffic flows are separated temporally, enhancing vehicle operational safety [3]. On the other hand, this causes vehicles on the approaches to stop periodically, resulting in vehicle delay [4]. When severe traffic congestion occurs at an intersection, it affects the traffic conditions on its upstream and downstream road segments. If congestion spreads further, the impacted area of the road network becomes wider [5].
Given that intersections (hereinafter referred to as nodes) differ in their positions within the road network and their connectivity strength with neighboring nodes, their impact on the overall traffic operation of the network also varies. To address traffic congestion, it is necessary to identify critical node clusters that have a more significant impact on the traffic operation of the road network. In this exploratory study, we aim to investigate the selection and identification of critical urban road intersection groups (hereinafter referred to as node groups) from an energy conservation and emission reduction perspective. The second Section presents a literature review, primarily introducing existing methods for identifying critical nodes. In the third Section, we describe the materials and methods, mainly presenting the data sources and foundation of this study. The fourth Section is dedicated to relationship derivation, aiming at establishing the relationship between vehicle emissions and overall network efficiency. The fifth Section presents the experimental study, primarily designed to compare the differences between node group selection for traffic congestion mitigation and the corresponding emission reductions. The sixth Section concludes the paper, summarizing the relevant findings, limitations, and directions for future work.
2. Literature Review
To study the impact of nodes on the network, influence (including traffic congestion) can be applied to the nodes, and subsequently, their effect on the entire network can be assessed. Such methods are commonly referred to as simulated attack methods. The primary way in which simulated attack methods exert influence is by directly removing the target nodes [6]. The impact of the attack on the entire network is then evaluated mainly by selecting specific metrics, which primarily include relative loss of network efficiency [7,8,9,10,11], network average path length [12], and relative loss of the largest connected component [13,14,15], among which relative loss of network efficiency is the most frequently used. Gao, T., Deng, Z., Fan, B., Cao, N., and Han, Y. selected relative loss of network efficiency [7,8,9,10,11] as an indicator to evaluate the impact of attacks on the entire network. Xing, Y.Y. did the same by selecting average path length of the network [12]. whereas Xing, Y., Lu, P.L. and Xing, Y.Y. selected relative loss of the largest connected component for the same purpose [13,14,15].
Since traffic congestion does not cause physical impairment to the urban road traffic network, employing an attack method that directly removes nodes is evidently not very appropriate. Furthermore, existing node attacks are limited to single-point attacks and do not involve simultaneous attacks on multiple nodes; however, traffic congestion mitigation requires implementing measures simultaneously across multiple nodes. Moreover, the existing evaluation metrics for the impact of attacks on the network do not involve energy conservation and emission reduction.
Based on the above considerations, this research specifically focuses on the selection of critical intersection clusters in urban road congestion mitigation and their effects on energy conservation and emission reduction [16].
3. Materials and Methods
The relationship between vehicle emissions and factors such as vehicle speed and the degree of road congestion (including saturation) can vary due to the combined influence of different urban topographies, road gradients, lane numbers and widths, and the degree of intersection congestion [17,18].
The Portable Emission Measurement System (PEMS) is an onboard device installed in vehicles to measure combustion byproducts, including exhaust flow rate, O2, CO2, CO, NOx, and HC, in real time. It can also capture information such as vehicle operating time, location, altitude, and speed, thereby enabling simultaneous acquisition of real-time road traffic status and emission data. In this study, the urban core area of Xining City, Qinghai Province, was selected as the study area, and relevant experiments were conducted based on PEMS to collect data on vehicle exhaust emissions, speed, and other indicators. The relationship between vehicle emissions and traffic delay rate was derived [19], and this dataset served as the primary data source for the subsequent research and analysis presented in this paper.
4. Relationship Between Emissions and Network Efficiency
The degree of saturation is typically expressed as the ratio of actual traffic volume to capacity and is used to evaluate the operational status of road traffic. Generally, a higher degree of saturation corresponds to lower traffic operational efficiency and a poorer level of service (LOS).
4.1. Relationship Between Speed and Saturation Degree
According to the “Code for Design of Urban Road Engineering” (CJJ37-2012), the relationship between the average operating speed V and saturation degree α on general urban road sections is shown in Table 1.
Table 1.
Correspondence between speed and saturation of road sections.
Based on the data in Table 1, the following linear relationship exists between speed and saturation degree:
V = −34.78α + 67.53, R2 = 0.93, Pvalue = 0.031 < 0.05.
4.2. Relationship Between Emissions and Speed
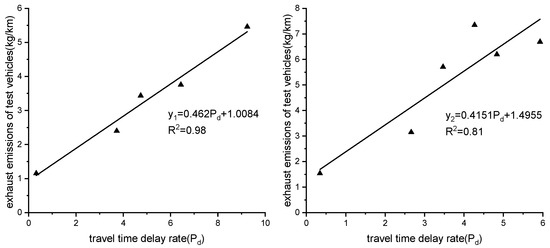
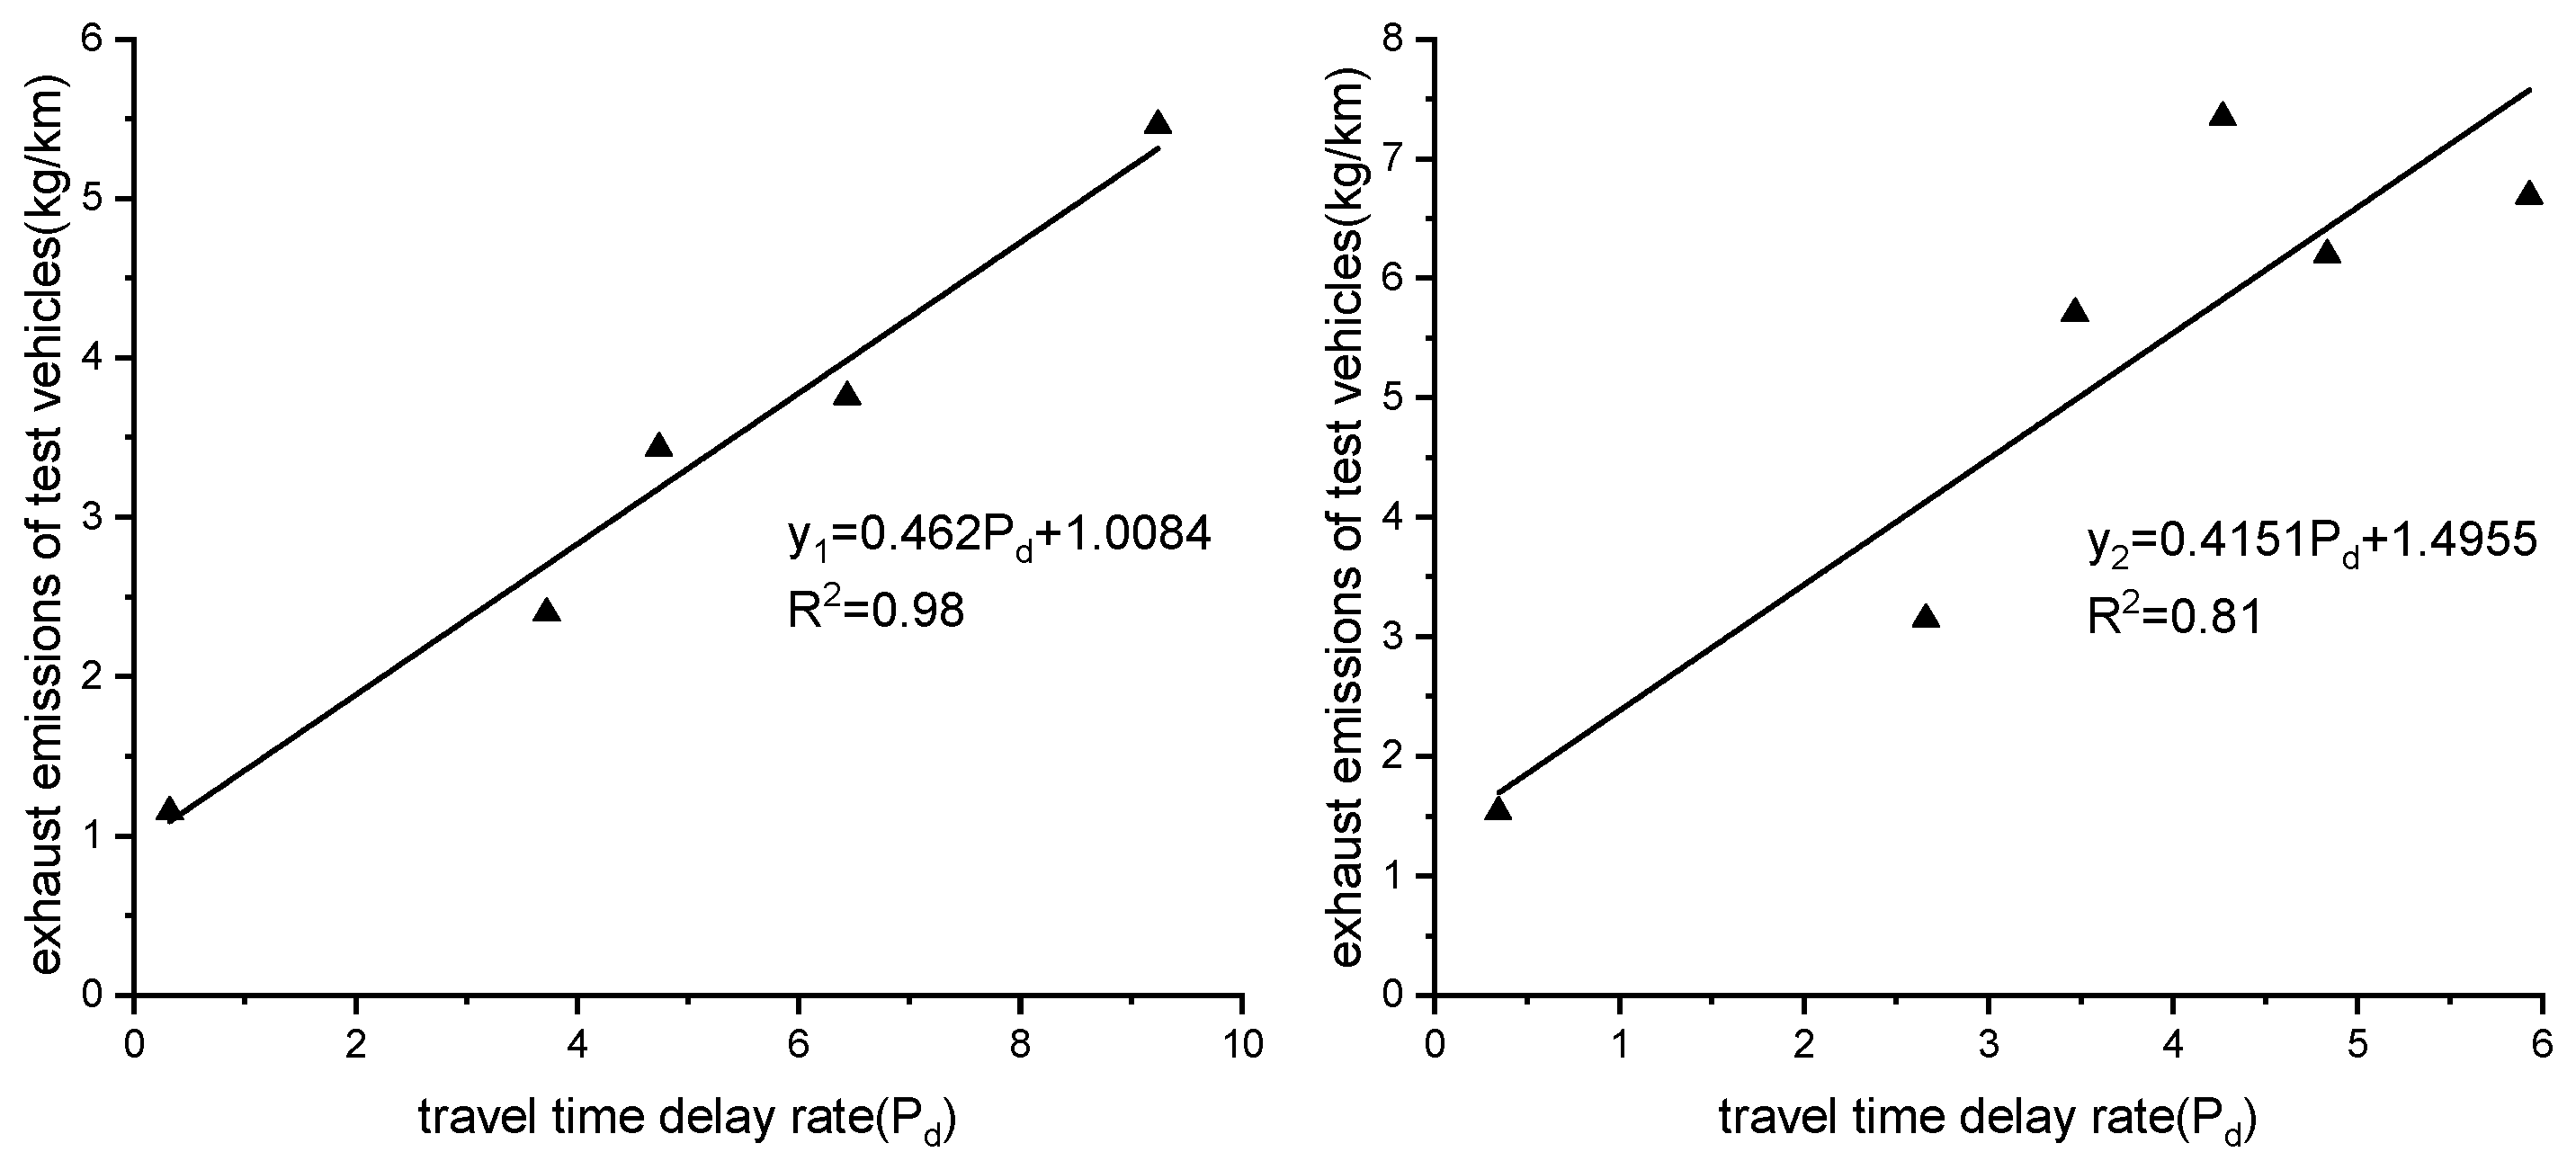
Shengyuan Ma et al. [19] measured the relationship between vehicle exhaust emissions and travel delay rate () in Xining City, as shown in Table 2 and Figure 1.
Table 2.
Exhaust emissions on each road section of Xinning Road during the morning peak.
Figure 1.
Relationship between travel time delay rate and exhaust emissions of test vehicles on each section of Xinning Road during the morning peak.
According to Figure 1, the relationship between vehicle emissions () and travel delay rate () for the Xinning Road section (South to North) in Xining City is
The relationship between vehicle emissions () and travel delay rate () for Xinning Road (North to South) in Xining City is
The calculation formula for the travel delay rate in Equations (2) and (3) is shown in Equation (4), where T is the average travel time. If the travel distance is fixed, the travel delay rate can be equivalent to the average speed delay rate , as shown in Equation (5):
Considering that the maximum speed on Xinning Road in Xining City is 36.3 km/h for the South to North direction and 35 km/h for the North to South direction [18], substituting the maximum speed and Equation (5) into Equations (2) and (3), respectively, yields:
Based on the actual driving speed range, the speed range was determined to be from 12.5 km/h to 36.5 km/h. Emissions for the South-to-North and North-to-South directions were calculated separately using Equations (6) and (7), and the average values were then taken, as shown in Table 3.
Table 3.
Data relationship between speed and emissions.
Based on the speed and average emission value data in Table 3, the relationship between emission quantity and speed can be further obtained, as shown in Equation (8):
Equation (8) shows that as speed increases, exhaust emissions per kilometer per vehicle exhibit a gradual decrease. Therefore, traffic congestion significantly increases vehicle exhaust emissions.
4.3. Relationship Between Emissions and Saturation Degree
Substituting Equation (1) into Equation (8) yields the relationship between vehicle emissions and the degree of saturation, as shown in Equation (9):
Equation (9) indicates that vehicular exhaust emissions per kilometer are proportional to the degree of saturation. A higher degree of saturation indicates more congested road traffic, resulting in greater vehicular exhaust emissions.
4.4. Road Network Efficiency Considering Saturation Degree
4.4.1. Definition of Network Efficiency
To better characterize the operational state of urban road networks and to capture their relationship with vehicle emissions, relevant fundamental concepts from complex networks are introduced.
In a network, the path efficiency between any two points can be defined as the reciprocal of their shortest path, as shown in the following equation:
where is the length of the shortest path from node to node in the network.
Building upon the efficiency between two points, the efficiency of the entire network can be further defined, as shown in the following equation:
where E is the efficiency of the overall network, and N is the total number of nodes in the entire network.
4.4.2. Improved Network Efficiency
In fact, the efficiency between any two nodes in the network depends not only on their distance but also on the congestion levels of the road segments and nodes traversed along the path. The more severe the congestion, the lower the passage efficiency between the two points. In this paper, we consider the impact of node congestion level on efficiency and further improve Equation (10), yielding the following:
where is the saturation degree of the k-th node, and t is the total number of nodes traversed along the shortest path from node i to node j. Furthermore, the formula for calculating the improved overall network efficiency is obtained as follows:
Equation (13) indicates that the improved overall network efficiency metric is inversely proportional to the overall (or average) degree of saturation of the network. That is, the smaller the degree of saturation, the greater the improved network efficiency, and consequently, the higher the network operational efficiency. Conversely, the greater the degree of saturation, the smaller the improved network efficiency, and consequently, the lower the network operational efficiency.
4.5. Relationship Between Emissions and Network Efficiency
The impact of different node group selections on overall network vehicle emissions is characterized through changes in the overall network improvement efficiency. Based on the data in Table 1, the operational state of urban road traffic is further classified into three levels, namely, free flow, stable flow, and congested flow (the first two are categorized as unimpeded flow). Representative saturation degree values for these three operational states are 0.2, 0.6, and 0.8, respectively, as shown in Table 4.
Table 4.
Correspondence between traffic operation state classification and saturation degree.
To facilitate the study and comparison of the impact of different intersection cluster selections on road network congestion mitigation, the concept of Benchmark Improved Network Efficiency () is introduced.
Definition: Benchmark Improved Network Efficiency () refers to the network efficiency achieved when the saturation degree of all nodes in the network is set to a specific value.
Based on Table 4 and the definition of Benchmark Improved Network Efficiency, it includes Free Flow Benchmark Improved Network Efficiency (), Unimpeded Flow Benchmark Improved Network Efficiency (), and Congested Flow Benchmark Improved Network Efficiency ().
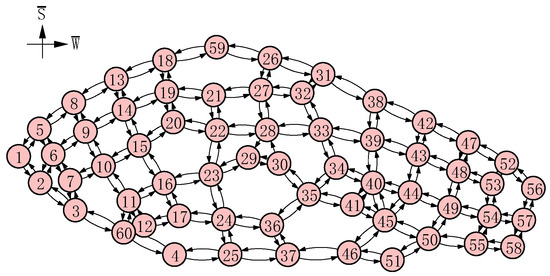
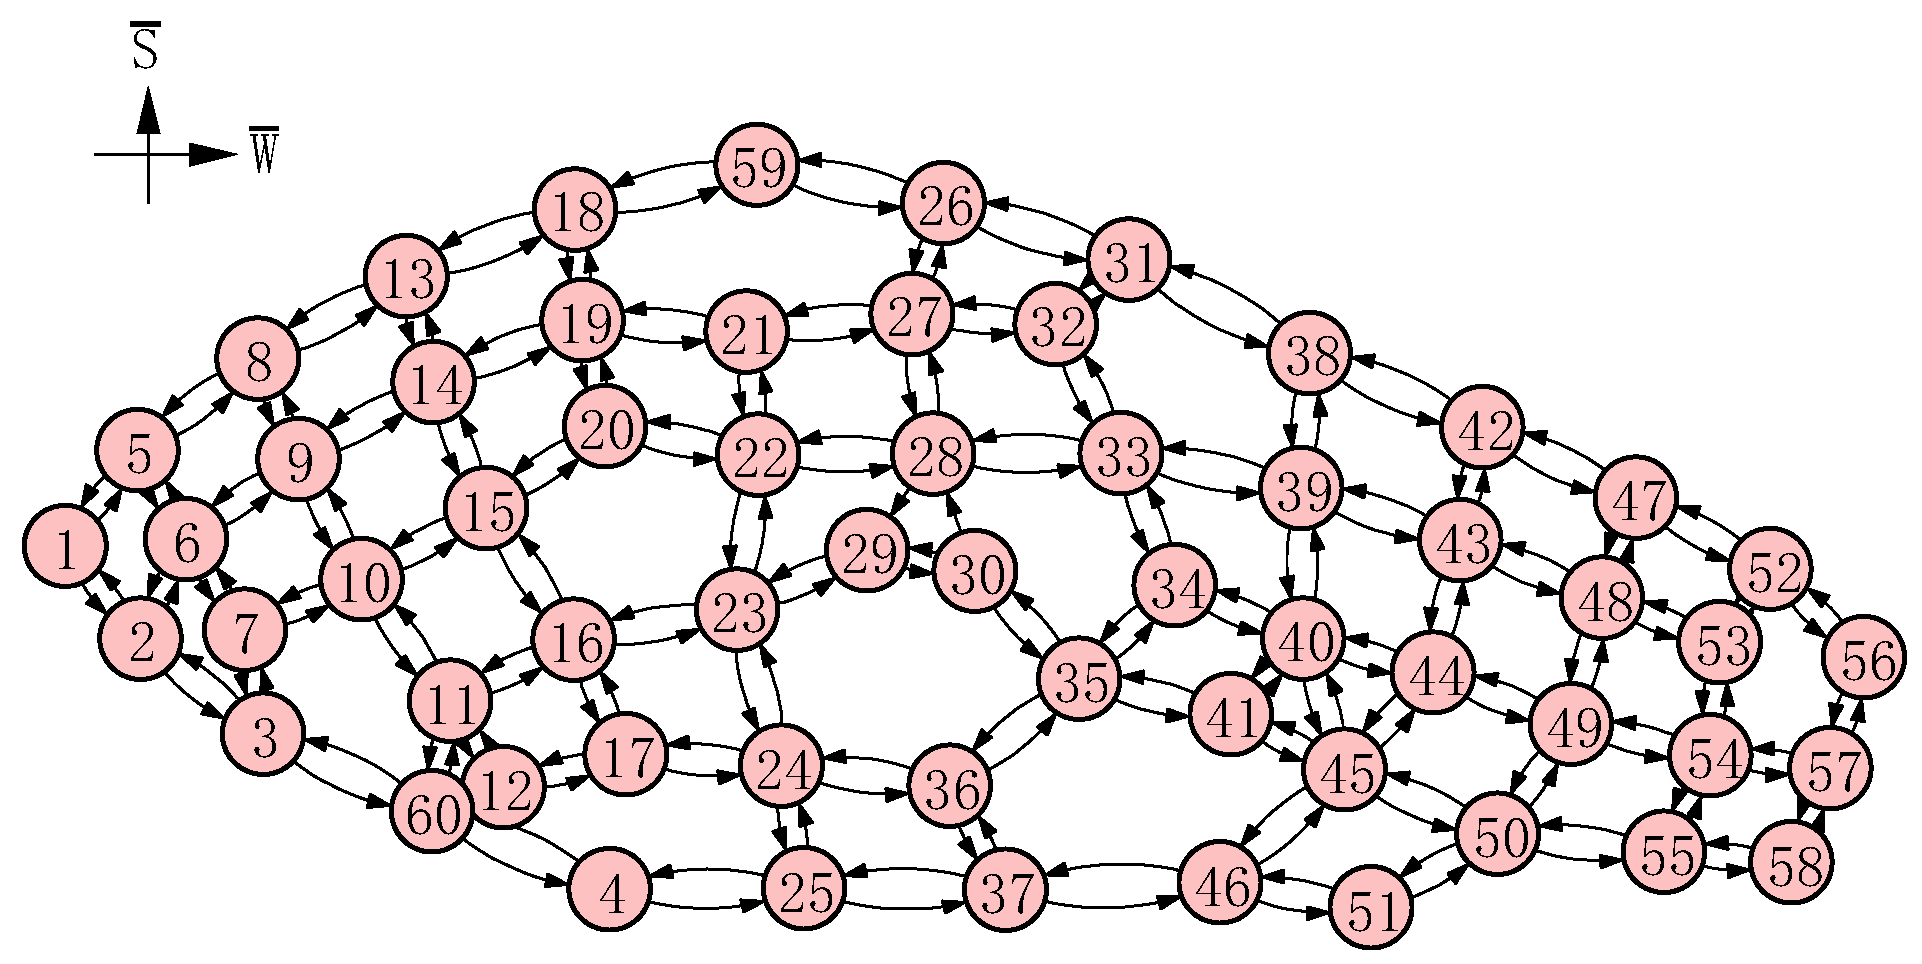
Using the 60 road intersections in the urban core area of Xining City, Qinghai Province, as an example, the road network’s structural topology is shown in Figure 2 (The numbers in the figure represent the digital codes of road intersections).
Figure 2.
Roads and intersections in the core area of Xining City.
Based on the correspondence between the representative degrees of saturation (0.2, 0.6, and 0.8) for the operational state classifications and the benchmark network efficiencies (0.1892, 0.0631, and 0.0473), the relationship between the degree of saturation and network efficiency can be further derived, as shown in the following equation:
By substituting Equation (14) into Equation (9), the relationship between vehicle emissions and network efficiency can be further obtained as follows:
Equation (15) indicates that vehicular exhaust emissions exhibit an inverse relationship with the improved network efficiency. As the road traffic operational state shifts from congestion to smooth flow, for every 1-unit increase in the E′ value, the average exhaust emissions per vehicle per kilometer decrease by 3.976 kg.
5. Intersection Cluster Selection and Emission Reduction
To analyze the impact of intersection clustering selection schemes on changes in network efficiency and on energy conservation and emission reduction, the experiment design and data analysis were conducted using MatlabR2020a.
5.1. Experimental Process Design
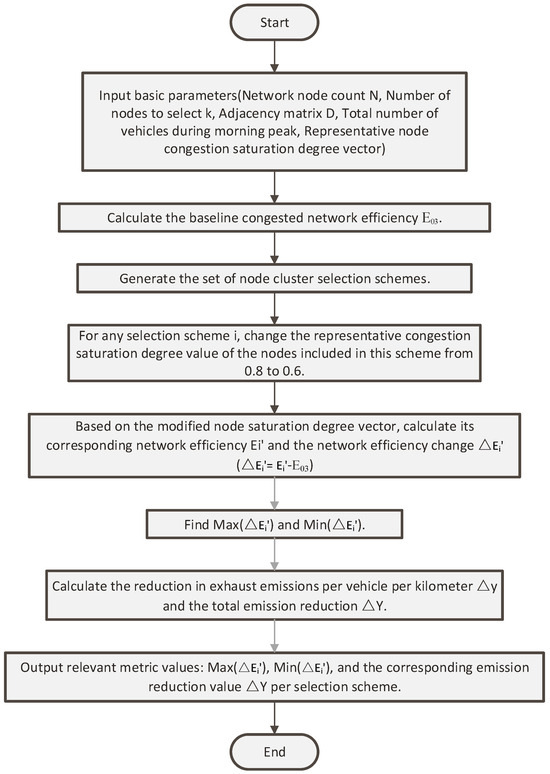
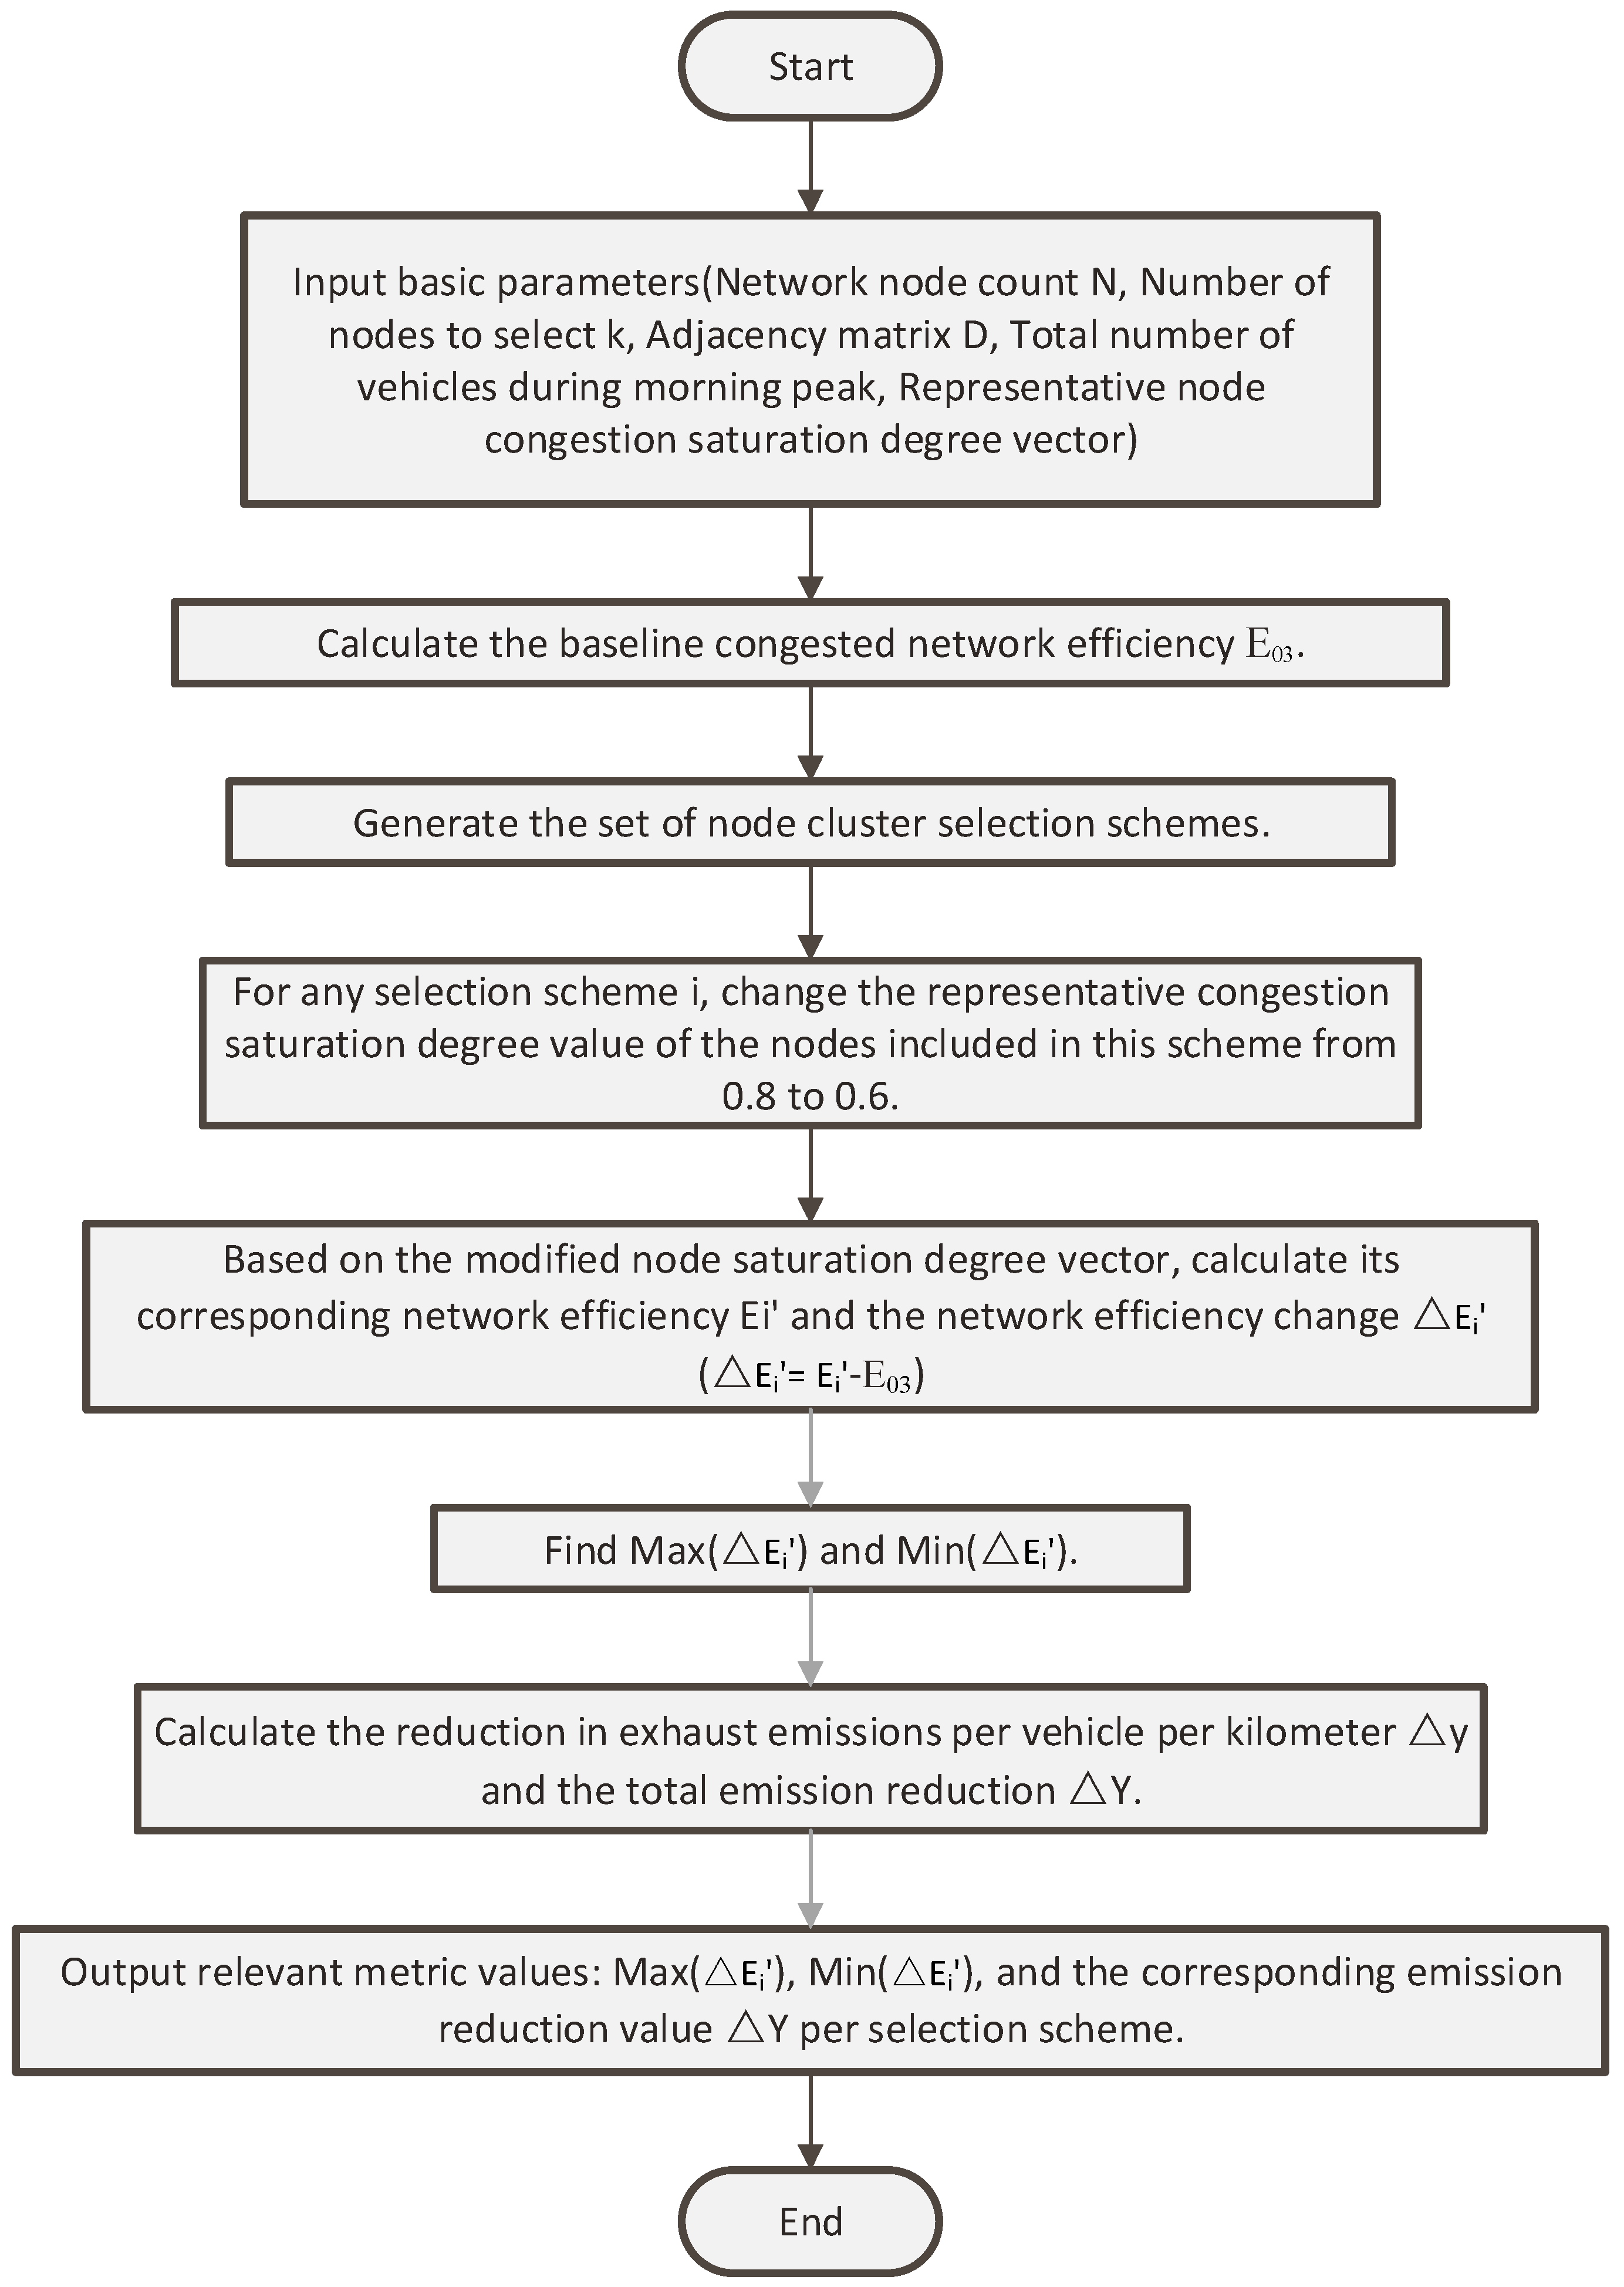
The experimental subjects were the road network and its intersections in the core area of Xining City, Qinghai Province (topology structure shown in Figure 2). The experimental process is shown in Figure 3 and consists mainly of three parts: basic parameter input, calculation and analysis, and output of related metrics. Among the basic parameters, the number of network nodes N is 60; the values in the representative node congestion degree of saturation vector are all 0.8; the distance values in the adjacency matrix were obtained from surveys; the total number of vehicles during the morning peak was determined to be 414,500 (4.145 × 10⁵) vehicles, based on reference [20]; the average travel distance was determined to be 5.5 km, based on reference [21].
Figure 3.
Flow chart of the experiment.
5.2. Analysis of Experimental Results
5.2.1. Relationship Between Selection Schemes, Network Efficiency Change, and Emission Reduction
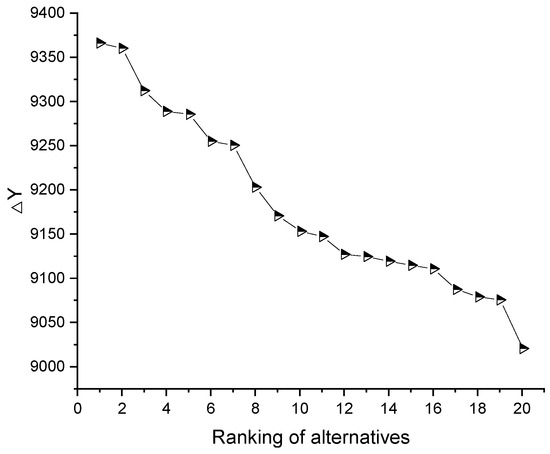
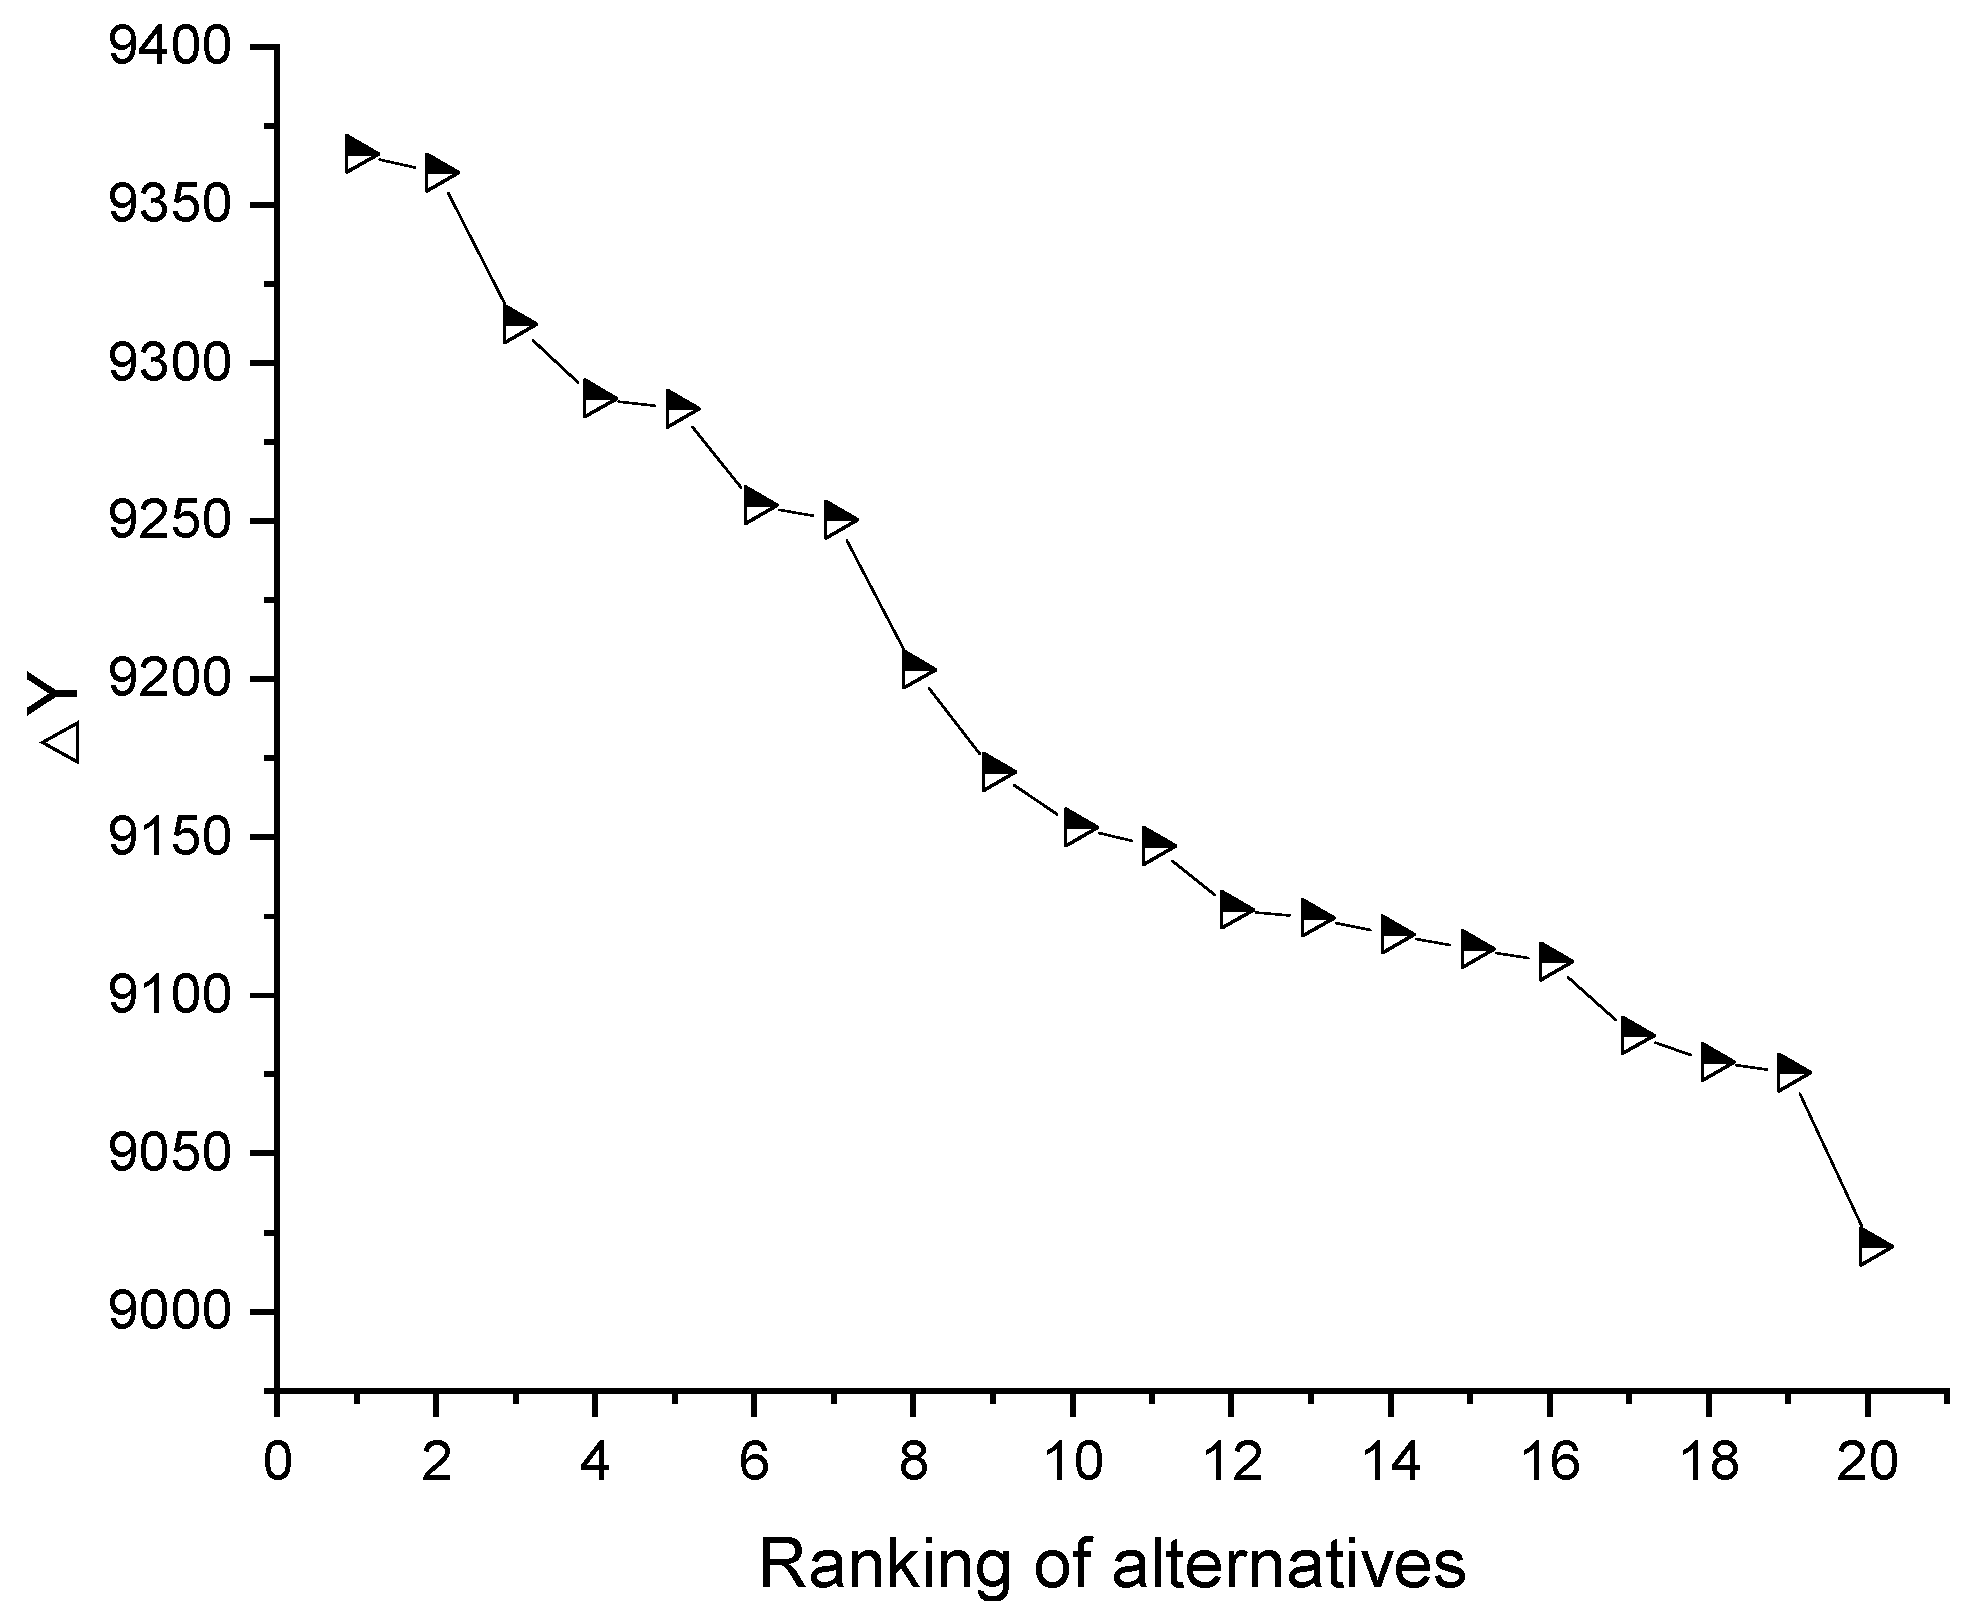
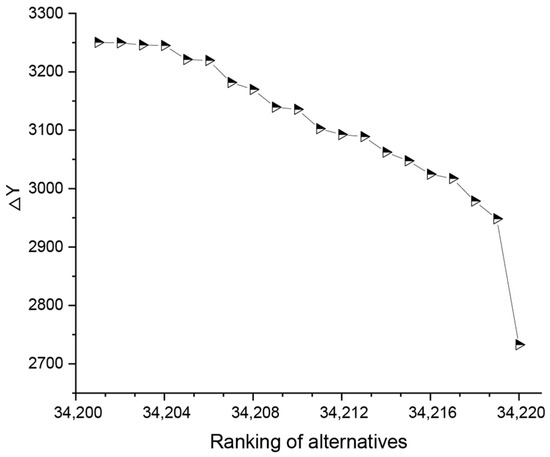
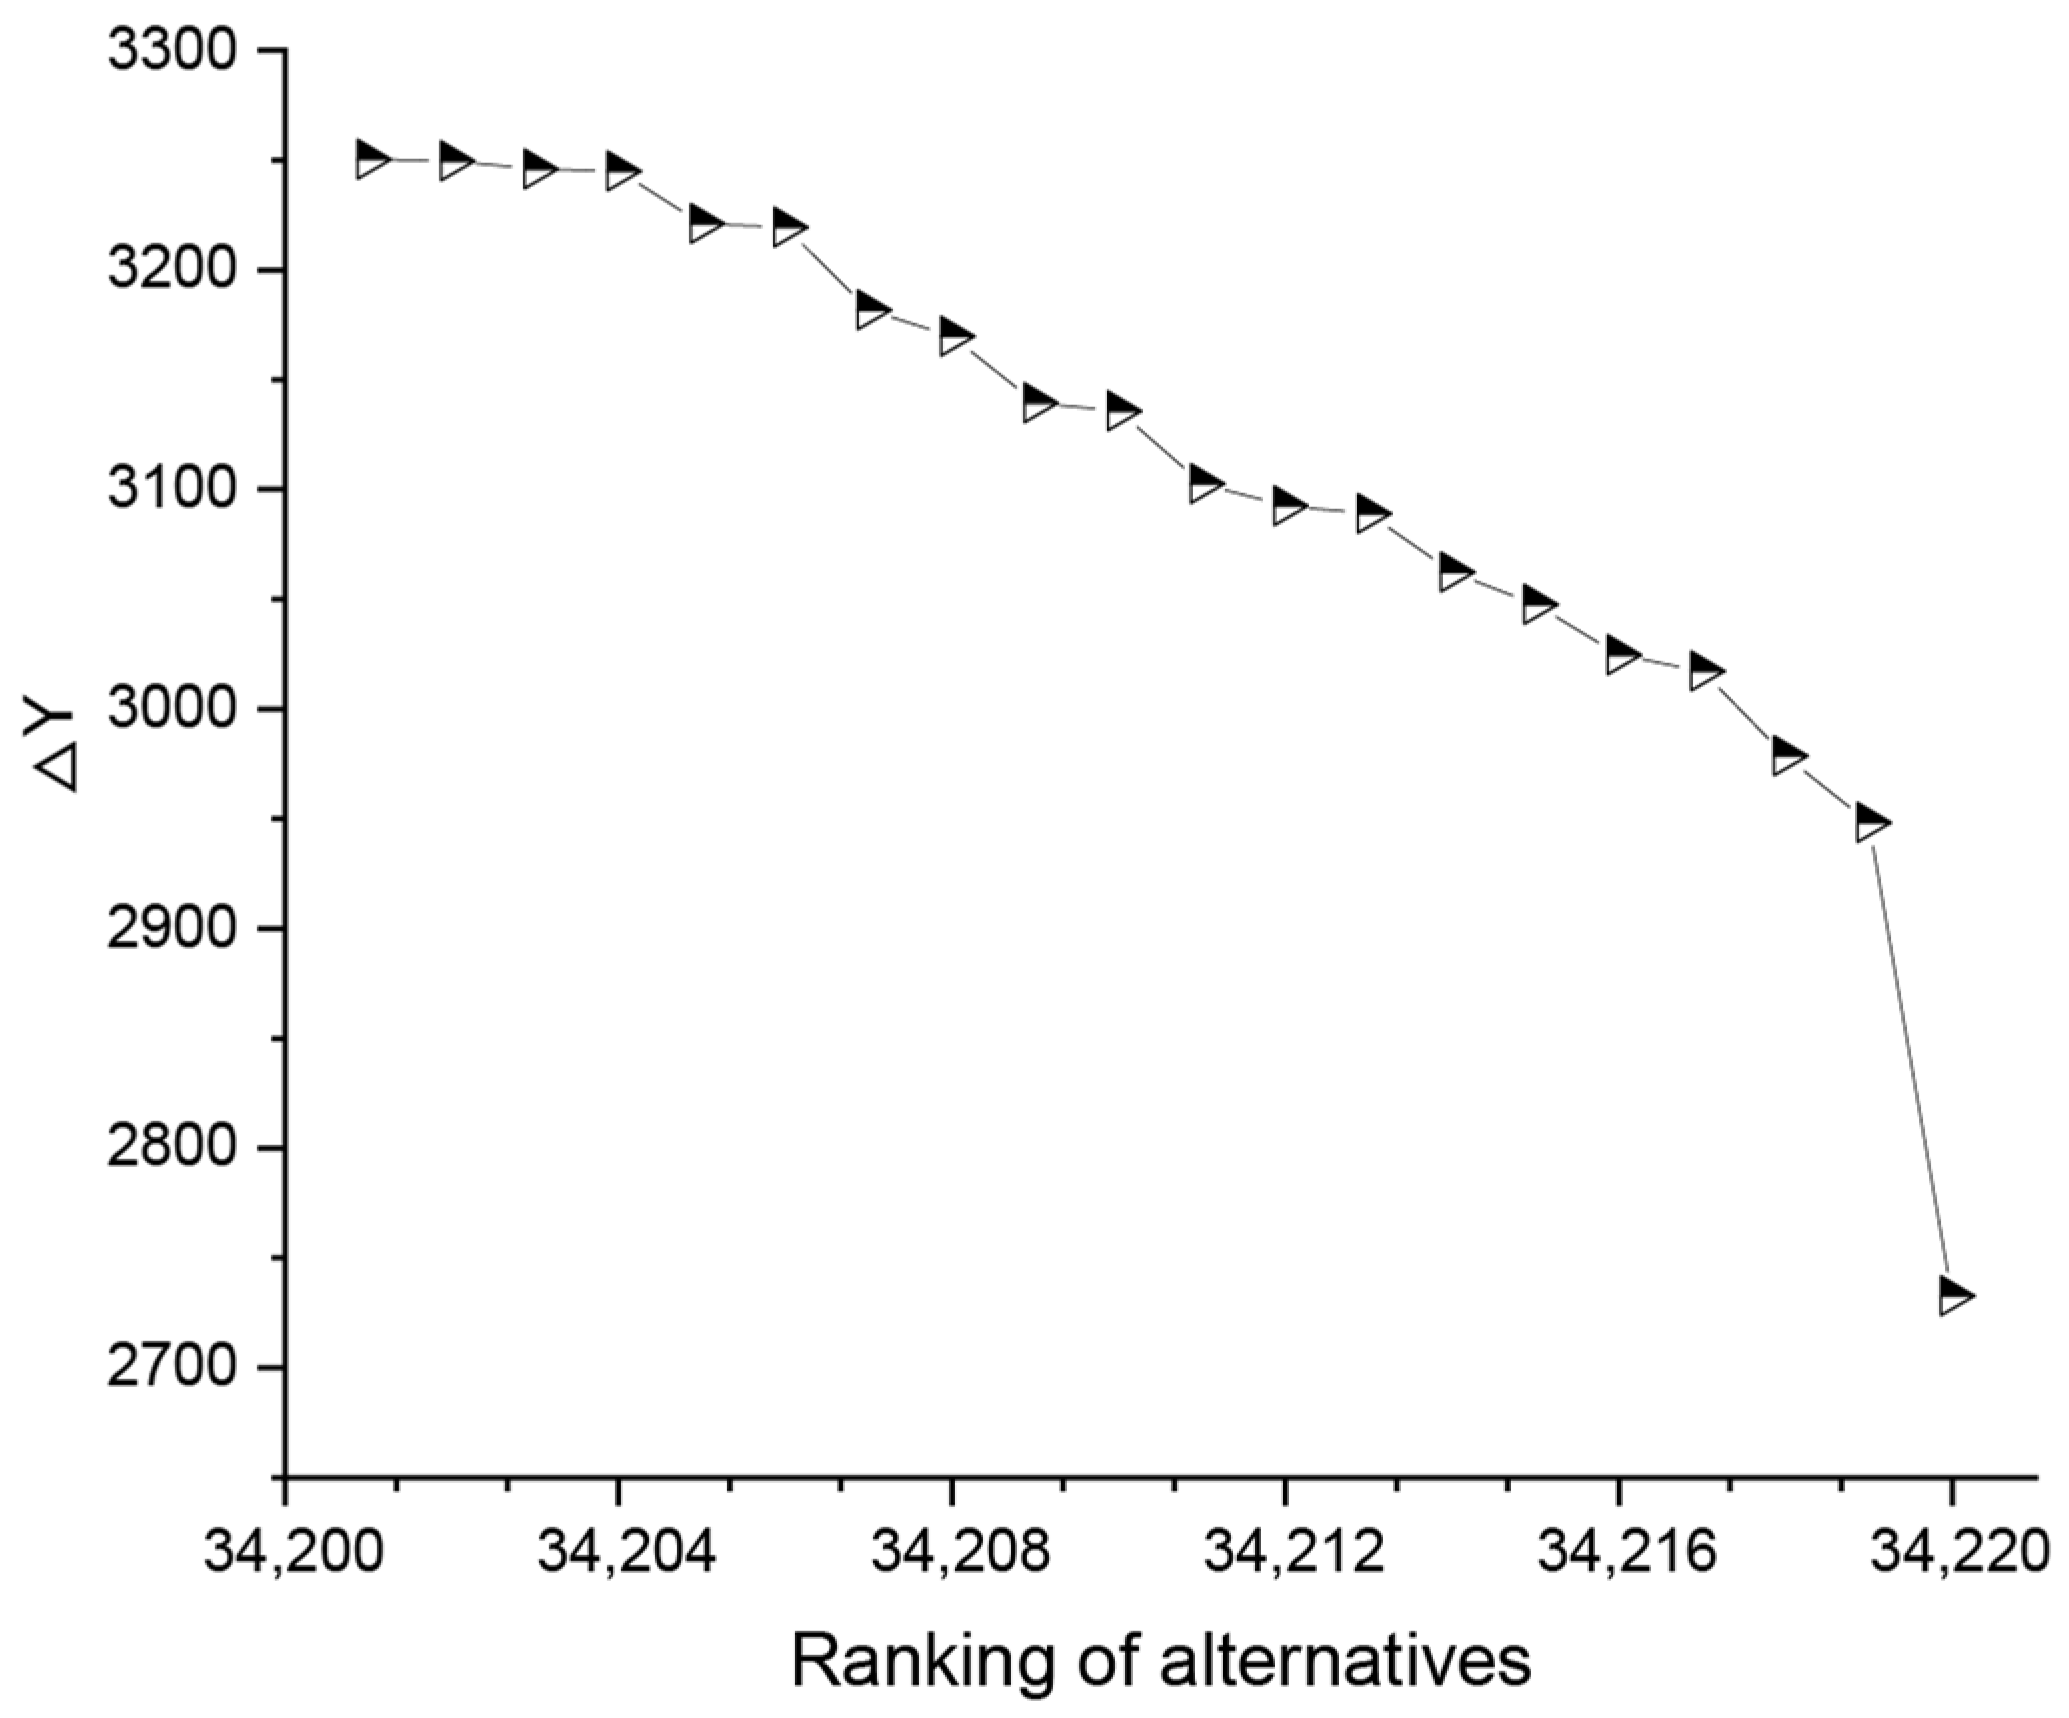
Due to computational power and time constraints, this experiment focused on and . Taking the experiment as an example, its results were sorted in descending order based on the network efficiency change value and the total morning peak emission reduction . The top 20 and bottom 20 schemes were selected, with the results shown in Table 5, Figure 4 and Figure 5.
Table 5.
Statistics of experimental results for .
Figure 4.
Relationship between selection scheme and emission reduction (top 20).
Figure 5.
Relationship between selection scheme and emission reduction (last 20).
As seen in Table 5 and Figure 4 and Figure 5, during the transition of the road traffic network from congestion to smooth flow, the corresponding total morning peak emission reduction varies depending on the congestion mitigation node scheme. If sorted in descending order by the network efficiency change value , the corresponding total morning peak emission reduction also gradually decreases in a stepwise manner.
5.2.2. Differential Analysis of Selection Schemes and Emission Reduction
Based on the and experimental results, the data shown in Table 6 were obtained. Table 6 shows that during the morning peak, if 2 nodes are selected for congestion mitigation out of the 60 nodes in the core area, selecting nodes 40 and 50 reduces vehicular emissions by 4441 kg more than selecting nodes 1 and 56. If 3 nodes are selected for congestion mitigation out of the 60 nodes in the core area, selecting nodes 22, 28, and 33 reduces vehicular emissions by 6616 kg more than selecting nodes 1, 56, and 58. If the congestion mitigation period is extended from the morning peak to the evening peak, and then from daily to monthly (or even annually), this value would increase further. This demonstrates that, in the process of mitigating urban road traffic congestion, the selection of node clusters is inextricably linked to energy conservation and emission reduction. Suboptimal selection of node clusters can lead to a significant increase in vehicular exhaust emissions. Conversely, optimal selection can achieve significant energy conservation and emission reduction effects.
Table 6.
Experimental results.
6. Conclusions
To investigate and analyze the relationship between node cluster selection and energy conservation and emission reduction during urban road traffic congestion mitigation, the relationship between vehicle emissions and the saturation degree was derived from the existing literature and research outcomes. Considering the impact of the saturation degree on travel, the network efficiency evaluation metric was refined. A model linking vehicle emissions to network efficiency was established. A validation experiment was designed using the core road network of Xining City, Qinghai Province, as an example. The results indicate the following:
- Vehicular exhaust emissions per kilometer are proportional to the degree of saturation. A higher degree of saturation indicates more congested road traffic, resulting in greater vehicular exhaust emissions.
- The improved network efficiency metric is inversely proportional to the overall (or average) degree of saturation of the network. That is, a lower degree of saturation corresponds to a higher improved network efficiency and, consequently, a higher network operational efficiency. Conversely, a higher degree of saturation corresponds to a lower improved network efficiency and, consequently, lower network operational efficiency.
- Vehicular exhaust emissions exhibit an inverse relationship with the improved network efficiency. As the road traffic operational state shifts from congestion to smooth flow, for every 1-unit increase in the improved network efficiency value, the average exhaust emissions per vehicle per kilometer decrease by 3.976 kg.
- During the transition of the road traffic network from congestion to smooth flow, the corresponding total morning peak emission reduction varies depending on the congestion mitigation node scheme. When sorted in descending order by the change in network efficiency, the corresponding total morning peak emission reduction decreases gradually in a stepwise manner.
- According to the and experimental results, compared to the worst node cluster selection scheme, the optimal node cluster selection scheme can reduce vehicular emissions by 4441 kg and 6616 kg, respectively.
- The relationship between vehicle emissions and factors such as vehicle speed and road congestion (including saturation) can vary due to the combined influence of different urban topographies, road gradients, lane numbers and widths, and the degree of intersection congestion. Specifically for this paper, we performed both polynomial and linear relationship fitting. Considering that the choice between these fittings does not affect the ranking of important node groups for the study area (Xining City, Qinghai Province), and given that the P-values for the employed linear approximation are all less than 0.05, meeting practical engineering requirements, we adopted the simpler linear approximation for our analysis.
- Based on the exploration in this article and relevant research conclusions, in the process of mitigating urban road traffic congestion, the selection of node clusters is inextricably linked to energy conservation and emission reduction. Suboptimal selection of node clusters can lead to a significant increase in vehicular exhaust emissions. Conversely, optimal selection can achieve significant energy conservation and emission reduction effects.
Due to computational and time constraints, this study focused on the and experiments. In the future, we will investigate the relationship between selection schemes for four or more node clusters and energy conservation and emission reduction effects by optimizing algorithms and enhancing computational power. Furthermore, the variation in the energy conservation and emission reduction effects with increasing numbers of node clusters will be analyzed.
Additionally, the traffic congestion mitigation simulation in this study was relatively simple. In future work, we plan to incorporate additional indicators and factors, such as different vehicle compositions, queue lengths, and actual road segment lengths and widths. More in-depth and detailed research will also be conducted through large-scale traffic simulation experiments, combined with various traffic congestion mitigation strategies and measures.
Author Contributions
Conceptualization, Z.M.; data curation, Z.M. and X.W.; investigation, Z.M.; methodology, Z.M.; writing—original draft preparation, Z.M.; writing—review and editing, X.W. and J.C. All authors have read and agreed to the published version of the manuscript.
Funding
This work was supported by the 2024 Qinghai “Kunlun Talents·High-End Innovation and Entrepreneurship Talent” Project (QHKLYC-GDCXCY-2024-102), the Graduate Innovation Project of Qinghai Minzu University (66M2024025).
Data Availability Statement
The data supporting the findings of this study are available from the corresponding author upon reasonable request.
Conflicts of Interest
The authors declare that they have no conflicts of interest.
Abbreviations
The following abbreviations are used in this manuscript:
| PEMS | Portable Emission Measurement System |
| LOS | Level of Service |
References
- Macioszek, E.; Kurek, A. Road traffic distribution on public holidays and workdays on selected road transport network elements. Transp. Probl. 2021, 16, 127–138. [Google Scholar] [CrossRef] [Scilit]
- Boeing, G.; Pilgram, C.; Lu, Y. Urban street network design and transport-related greenhouse gas emissions around the world. Transp. Res. Part D Transp. Environ. 2024, 127, 103961. [Google Scholar] [CrossRef] [Scilit]
- Elassy, M.; Al-Hattab, M.; Takruri, M.; Badawi, S. Intelligent transportation systems for sustainable smart cities. Transp. Eng. 2024, 16, 100252. [Google Scholar] [CrossRef] [Scilit]
- Tian, C. Study on the Stochastic Delay at Urban Signalized Intersection. Master’s Thesis, Chang’an University, Xi’an, China, 2009. [Google Scholar]
- Shi, J. Study on the Identification of Traffic Status and the Method for Mining Congestion Propagation Rule of Intersections. Master’s Thesis, Soochow University, Suzhou, China, 2020. [Google Scholar]
- Shen, L. Based on Vulnerability and Elastic Recoveryof the Reliability of Urban Road Network Traffic Safety Assessment Methods. Master’s Thesis, Chongqing Jiaotong University, Chongqing, China, 2014. [Google Scholar]
- Gao, T.; Chen, K.; Li, F. Topologe analysis of urban rail transit network. J. Chang. Univ. (Nat. Sci. Ed.) 2018, 38, 97–106. [Google Scholar]
- Deng, Z. Study on the Vulnerability of Road Network Traffic System Considering the Characteristics of Congestion Propagation. Master’s Thesis, Chongqing Jiaotong University, Chongqing, China, 2019. [Google Scholar]
- Fan, B.; Zheng, C.X.; Tang, L.R.; Wu, R.Z. Critical nodes identification for vulnerability analysis of power communication networks. IET Commun. 2020, 14, 703–713. [Google Scholar] [CrossRef] [Scilit]
- Cao, N.; Cao, H.Q. Exploring the robustness of urban bus network: A case from Southern China. Chin. J. Phys. 2020, 65, 389–397. [Google Scholar] [CrossRef] [Scilit]
- Han, Y.; Li, W.Y.; Yang, G. Traffic Network Reliability in Tourist Attractions Based on Node Importance. J. Transp. Inf. Saf. 2019, 37, 128–137. [Google Scholar]
- Xing, Y.Y. Complex Network Property and Vulnerability of Urban Rail Transit Networks. Ph.D. Thesis, Shanghai JiaoTong University, Shanghai, China, 2017. [Google Scholar]
- Xing, Y.; Lu, J.; Chen, S.; Dissanayake, S. Vulnerability analysis of urban rail transit based on complex network theory: A case study of Shanghai Metro. Public Transp. 2017, 9, 501–525. [Google Scholar] [CrossRef] [Scilit]
- Lu, P.L.; Guo, X.D.; Dong, X. Importance identification method of complex network nodes based on betweenness and degree entropy. J. Lanzhou Univ. Technol. 2020, 46, 111–115. [Google Scholar]
- Xing, Y.Y.; Lu, J.; Chen, S.D. Weighted Complex Network Analysis of Shanghai Rail Transit System. Discret. Dyn. Nat. Soc. 2016, 2016, 1290138. [Google Scholar] [CrossRef] [Scilit]
- Yang, Q.; Zhu, R.H.; Zhao, X.Q. Calculation decoupling analysis scenario prediction of carbon emissions of transportation in China. J. Chang. Univ. (Nat. Sci. Ed.) 2014, 34, 77–83. [Google Scholar]
- Xia, R.; Wang, Y.; Feng, Y.; Chen, T.; Qin, J. A study on the relationship between vehicle operating conditions and NOx emission characteristics. E3S Web Conf. 2024, 522, 01008. [Google Scholar] [CrossRef] [Scilit]
- Zang, J.; Hu, X.; Li, Z.; Song, G.; Shi, K. Fast estimation and pattern discovery of dynamic vehicle emissions on road networks based on the traffic performance index: A case study of Beijing. Urban Clim. 2025, 62, 102537. [Google Scholar] [CrossRef] [Scilit]
- Ma, S.Y.; Deng, J.F.; Ma, Z.F.; Guan, H.Z. Experimental study on road traffic state evaluation and emission correlation of plateau cities based on PEMS: A case study of Xining City. J. Qinghai Norm. Univ. (Nat. Sci.) 2018, 34, 43–50. [Google Scholar]
- Ma, Z.F. Transportation Engineering Technology and Applications; Lanzhou University Press: Lanzhou, China, 2019; p. 179. [Google Scholar]
- Beijing Urban Construction Design Development Group Co., Ltd. Xining City Urban Traffic Survey Report 2017; Beijing Urban Construction Design Development Group Co., Ltd.: Beijing, China, 2018; p. 54. [Google Scholar]

Disclaimer/Publisher’s Note: The statements, opinions and data contained in all publications are solely those of the individual author(s) and contributor(s) and not of MDPI and/or the editor(s). MDPI and/or the editor(s) disclaim responsibility for any injury to people or property resulting from any ideas, methods, instructions or products referred to in the content. |
© 2026 by the authors. Licensee MDPI, Basel, Switzerland. This article is an open access article distributed under the terms and conditions of the Creative Commons Attribution (CC BY) license.