


Abstract
With the rapid deployment of advanced driver assistance systems (ADAS), accurate sensor calibration is increasingly important for reliable functional performance. This study investigates how different geometric calibration settings of the front radar are associated with the behavior of a production adaptive cruise control (ACC) system. Static radar calibration was repeatedly performed on a Volkswagen e-Golf using different vertical and horizontal orientation settings. Vehicle tests were conducted at the ZalaZONE automotive proving ground under controlled conditions at 50 and 100 km/h with different ACC following-distance settings, while inter-vehicle distance was independently measured using a 2D LiDAR sensor. At 50 km/h, three repeated runs per evaluated configuration showed only small changes in steady-state following distance, with a maximum mean deviation of approximately 1.04% for following-distance setting No. 1 and mean differences within approximately ±0.25% for setting No. 3. At 100 km/h, no statistically significant difference was found among the evaluated calibration settings, although larger between-run variability occurred for the horizontally offset configurations. More pronounced differences were observed during transient phases. Overall, the results indicate limited and system-specific sensitivity of steady-state ACC following behavior to the tested geometric radar calibration deviations.
1. Introduction
Transportation is an essential part of everyday life, and one of its most important aspects is road safety. With the development of vehicle technology and the introduction of European Union regulations, road safety has continuously improved, resulting in a gradual decrease in the number of accidents. This improvement is largely related to Regulation (EU) 2019/2144, which requires vehicle manufacturers to equip certain vehicle categories with advanced driver assistance systems (ADAS) that improve safety. The most important of these include the advanced emergency braking system (AEBS), lane departure warning (LDW), intelligent speed control systems like adaptive cruise control (ACC), fatigue detection system (FDS), and event data recorder (EDR). The proper operation of these ADAS functions is critical, as they can significantly reduce the risk of human error by warning the driver, controlling certain vehicle functions, or intervening in the driving process when necessary. The level and type of intervention depend on the level of vehicle and system automation, as well as on the specific ADAS function. Since 2022, several advanced driver assistance systems have become mandatory for new vehicle types in the European Union as part of the type-approval process, contributing to the broader objective of reducing road fatalities and serious injuries [1,2].
For the purposes of our study, adaptive cruise control (ACC) is particularly important. ACC is a longitudinal vehicle automation function that controls the vehicle speed to maintain the cruising speed set by the driver when the road ahead is clear, while maintaining the desired following distance when another vehicle is travelling in front. During operation, dedicated sensors measure the distance to the preceding vehicle and the rate at which this distance changes. Based on this information, the system uses the accelerator and brakes to maintain the selected safe following distance [3,4].
ACC systems available in vehicles typically use discrete time-gap settings, which can be interpreted as short, medium, or long following distance settings rather than as specific numerical time gaps. Since manufacturers do not disclose the operation of ACC systems in full detail, many studies estimate the actual time gap by recording vehicle trajectories during stable, steady-state car-following tests. Measurements conducted by Makridis et al. show that the investigated systems typically maintain time gaps of approximately 1.2–2.2 s. Their results also indicate that the actual time gap may vary depending on the ACC system configuration and the driving situation [5].
A common finding from real-world tests is that many production ACC systems do not exhibit string-stable behavior when vehicles travel in a platoon. Even small speed changes in the target vehicle, i.e., the leading vehicle, can affect the traffic behind it and may generate stop-and-go waves. Gunter et al. investigated this phenomenon in several vehicle-based studies, where in some cases these small disturbances became so significant that the ACC system of the last following vehicle had to be disengaged [6,7]. In an early study, Liang and Peng examined several aspects of ACC control strategies and highlighted the constant time-gap policy as an approach that can support stability objectives. By applying this principle, disturbances and unnecessary decelerations within a vehicle platoon can be reduced [8].
Makridis et al. have actively investigated several topics related to ACC systems. In their 2021 study, based on experiments conducted under controlled conditions and included in the OpenACC database, they found that the same vehicle platoon can appear either stable or unstable depending on the selected time-gap setting. While shorter time-gap settings may often lead to the amplification of small speed variations, larger time-gap settings can help reduce these effects. Test track measurements played an important role in ensuring the accuracy of the study, as they provided repeatable and controlled test conditions [9].
Mohammed et al. also conducted measurements under controlled conditions at the ZalaZONE automotive proving ground, where they investigated following distance and time-gap settings using vehicles from different manufacturers and equipped with different sensor technologies. Their study focused on the operation and distance-keeping behavior of different ACC sensor technologies, applying the ISO 15622:2018 standard as a reference. The results showed that, under controlled conditions, specific characteristics of ACC systems can be investigated in a stable and systematic manner [10].
Mohammed and Horváth investigated steady-speed car-following behavior under controlled conditions using three vehicles equipped with different ACC sensor technologies, including camera-, radar-, and combined camera-radar-based systems. Their experiments showed that ACC systems maintained relatively consistent following distances over a wide range of constant vehicle speeds, while the resulting time headways depended on the specific vehicle and sensor configuration. However, the effect of intentionally introduced geometric radar misalignment on the steady-state and transient behavior of a production ACC system was not addressed in that study [11].
Knoop et al. also investigated ACC systems using platoon type tests conducted in real road traffic. One of the main findings of the study was that the seven vehicle platoon was string unstable, meaning that small speed changes in the lead vehicle appeared with a delay and were amplified toward the rear of the platoon. In an extreme example, when the lead vehicle reduced its speed from 100 to 70 km/h, the speed of the last vehicle dropped to approximately 40 km/h, which could create a potentially hazardous situation in real traffic. The authors concluded that current Level 2 systems are not suitable for maintaining stable platoons of more than three or four vehicles over longer periods because of these following instabilities [12].
Further comparative studies suggest that the instability of these systems often results from response delays caused by the processing of sensor signals and the time required for the vehicle to accelerate or brake. Studies have also shown that cooperative adaptive cruise control (CACC) systems can reduce these problems by using vehicle-to-vehicle (V2V) communication. In a cooperative ACC system, the following vehicle can use speed and acceleration information shared by the lead vehicle, allowing it to react earlier to changes in traffic conditions. As a result, the system can maintain more stable following distances and reduce the effects of disturbances within the vehicle platoon [13].
More recently, Lim et al. investigated a radar-only cooperative ACC approach that estimates the preceding vehicle’s acceleration without relying on direct V2V communication. Their simulation and real vehicle results showed that conventional ACC was more sensitive to rapid acceleration and braking disturbances, while the proposed estimation-based approach reduced spacing error propagation and improved transient response [14].
Research on ACC systems has primarily focused on system behavior and control-related calibration. Gunter et al. [15] investigated system modeling, while Wang et al. [16] focused on the related estimation methodology. However, it is also important to consider that these systems must operate accurately and reliably under all conditions. Recent studies have shown that geometric radar misalignment can affect target detection, angular accuracy, object classification, and the overall performance of active-safety and automated-driving functions, highlighting the importance of reliable radar alignment and calibration [17,18].
In our research, we focused on the geometric calibration of ACC system sensors and investigated system operation across several calibration conditions, ranging from the nominal manufacturer-defined condition to more extreme geometric configurations. Particular attention was given to time-gap-related parameters and system stability. Our literature review showed that these factors are among the most critical aspects of ACC research, while testing them under real-world conditions can be challenging because continuously changing traffic and environmental conditions make platooning experiments difficult to conduct in a repeatable way. In addition, there is currently a limited amount of scientific literature dealing with the geometric calibration, verification, and testing of ADAS sensors, particularly for ACC systems. Studies that perform these investigations under controlled conditions and subsequently verify the results in a laboratory environment are especially limited. The novelty of the present study lies in the controlled experimental investigation of how deliberately introduced geometric radar calibration settings are associated with the steady-state and transient behavior of a production-vehicle ACC system. Unlike studies focusing primarily on ACC control strategies or traffic level performance, the present work directly compares multiple vertical and horizontal radar calibration settings using independent LiDAR-based inter-vehicle distance measurements under repeatable test track conditions. The present study is limited to a single production vehicle and its specific radar-based ACC implementation; therefore, the results are interpreted as system-specific experimental observations rather than as general characteristics of ACC systems.
2. Materials and Methods
Environmental sensors used in passenger vehicles have become essential components, as highlighted in the Introduction, and Regulation (EU) 2019/2144 [2] requires the use of several ADAS functions in modern vehicles. The presence of advanced driver assistance systems also requires a wide range of additional electronic and software components from developers and suppliers. These systems are implemented by OEMs as integrated parts of the vehicle and are tested, adjusted, and validated in advance to ensure safe operation. At the same time, there is still a possibility that the sensors used by these systems may require geometric recalibration and verification. This is important because faults in ADAS operation may appear in different ways. Some faults produce direct and easily noticeable signs, while others may only become apparent later, or may not be detected by the driver at all. Direct signs usually appear when, due to a certain event, the system becomes partially or completely unavailable. This can be caused, for example, by impaired sensor detection or a change in the sensor alignment. In such cases, the vehicle infotainment system typically warns the driver, while the controller disables the affected ADAS function. Indirect faults are more difficult to identify, because the system may become misaligned or operate incorrectly without any warning from the vehicle. In these cases, potentially dangerous situations may develop without the driver being aware of the underlying problem.
Manufacturers require the realignment and recalibration of ADAS sensors in the following cases:
- The sensor mounting structure or the surrounding area is damaged, for example, as a result of a collision;
- The sensor is exposed to an external impact, such as physical shock, water ingress, or contamination;
- The sensor or its mounting structure is removed or disassembled;
- The vehicle suspension or wheel alignment has been modified;
- Following a software update, if recalibration is requested by the vehicle system.
It is also important to understand which types of sensors are used to support different ADAS functions in passenger vehicles. These may include short-, medium-, and long-range radar sensors located at the front, rear, or sides of the vehicle, mono and stereo cameras with front, rear, or 360° coverage, LiDAR sensors, and ultrasonic sensors. Each type of environmental sensor requires a different calibration method and equipment, and they must be adjusted and verified according to different procedures. The most commonly used method among manufacturers is static calibration, which is generally carried out in a specially equipped laboratory using dedicated calibration tools and systems. Dynamic calibration is also used, although this process is more difficult to perform because of the continuously changing traffic environment.
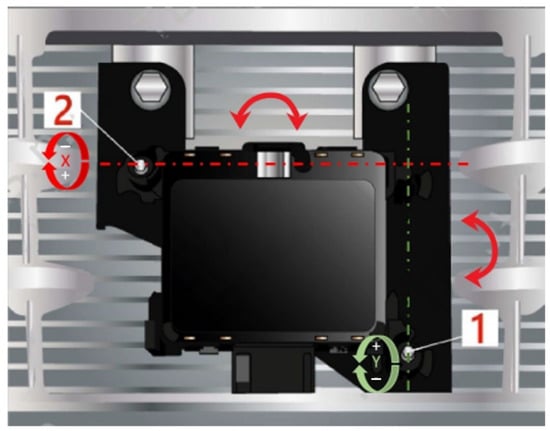
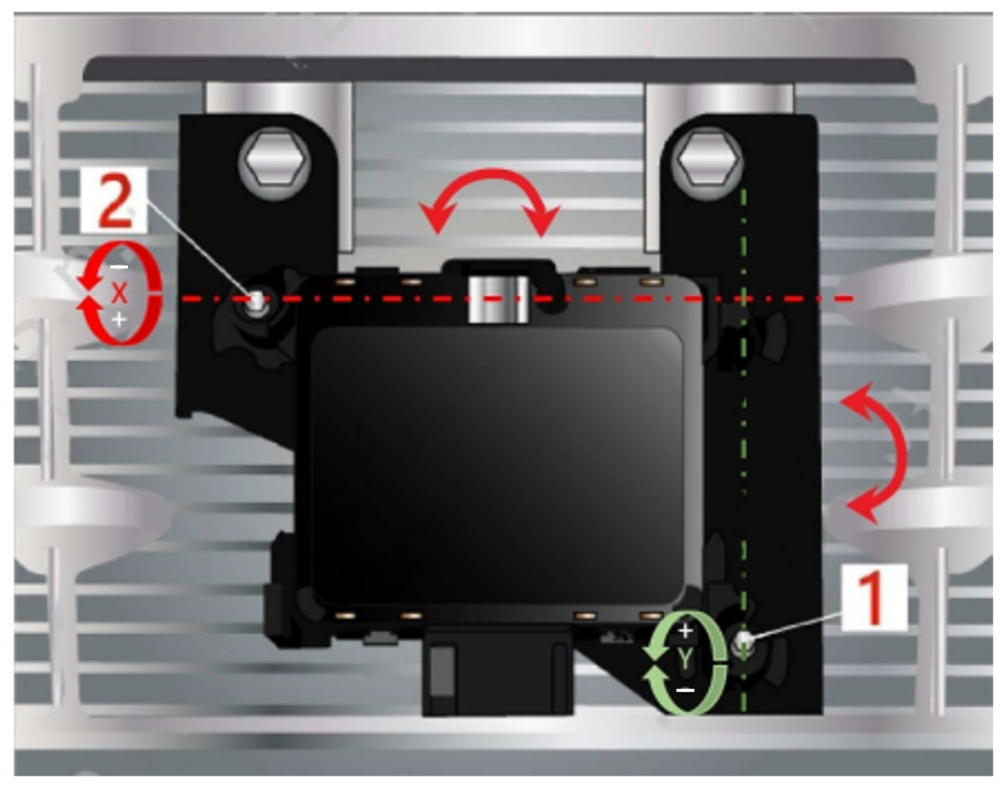
In our research, the static calibration procedures were carried out in a dedicated laboratory according to the manufacturer’s specifications with the Texa RRCS3 (Texa, Monastier di Treviso, Italy) universal calibration kit. This helped us perform the calibration accurately and provided the conditions required for proper verification. In our case, an ACC system was investigated using a seventh-generation 2019 electric Volkswagen Golf (Volkswagen, Wolfsburg, Germany). The vehicle is equipped with a front radar sensor located below the license plate in a simple housing. After removing the housing, this type of sensor can be adjusted relatively easily, with both horizontal and vertical angle settings available, as illustrated in Figure 1.
Figure 1.
Front radar sensor angle adjustment in the X (2) and Y (1) directions.
The angle adjustment was performed using the upper left adjustment screw (No. 2) and the lower right adjustment screw (No. 1) along the indicated X and Y axes. A special 3.5 mm socket type tool was used for this purpose. Its specific design ensures that the position of the environmental sensors can only be adjusted using the appropriate dedicated tool. It is important to note that, after a certain level of adjustment, changing one axis can also affect the other axis. Therefore, this interaction must be carefully monitored during calibration, and in some cases the values to be stored may need to be verified several times. In our tests, we also had to consider the adjustment angle limits specified by the manufacturer, within which proper and accurate system operation is ensured. These limits were used as the primary basis for defining test cases. The manufacturer-specified angle adjustment limits are:
- Horizontal adjustment angle: [−2.00°; +2.00°];
- Vertical adjustment angle: [−0.5°; +4.00°].
The calibration settings were selected to represent several different geometric radar conditions, including configurations both within and beyond the manufacturer-specified adjustment ranges. The intention was not to apply uniformly spaced angular increments, but rather to investigate a range of practically achievable calibration states obtained step by step during the adjustment procedure. The adjustment process started from the nominal manufacturer’s defined condition, after which vertical and horizontal deviations were introduced in successive calibration steps. All calibration procedures were performed under controlled laboratory conditions. After each calibration, the diagnostic system reported the resulting vertical and horizontal angular values, and these values were recorded in the corresponding calibration report. Therefore, the angular values presented in Table 1 represent the calibration values reported by the diagnostic system after completion of each adjustment rather than predefined target angles. The diagnostic system did not provide a separate measurement uncertainty value for the reported calibration angles; therefore, an independent uncertainty estimate cannot be assigned to the individual settings. The investigated calibration configurations are summarized in Table 1.
Table 1.
Calibration settings applied during the tests.
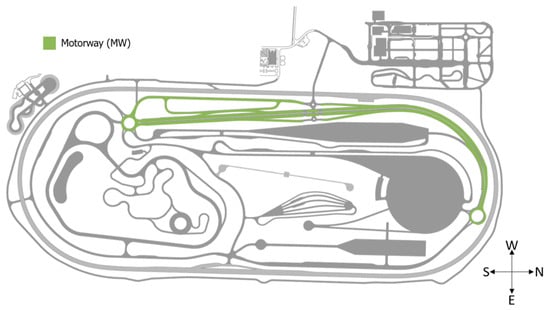
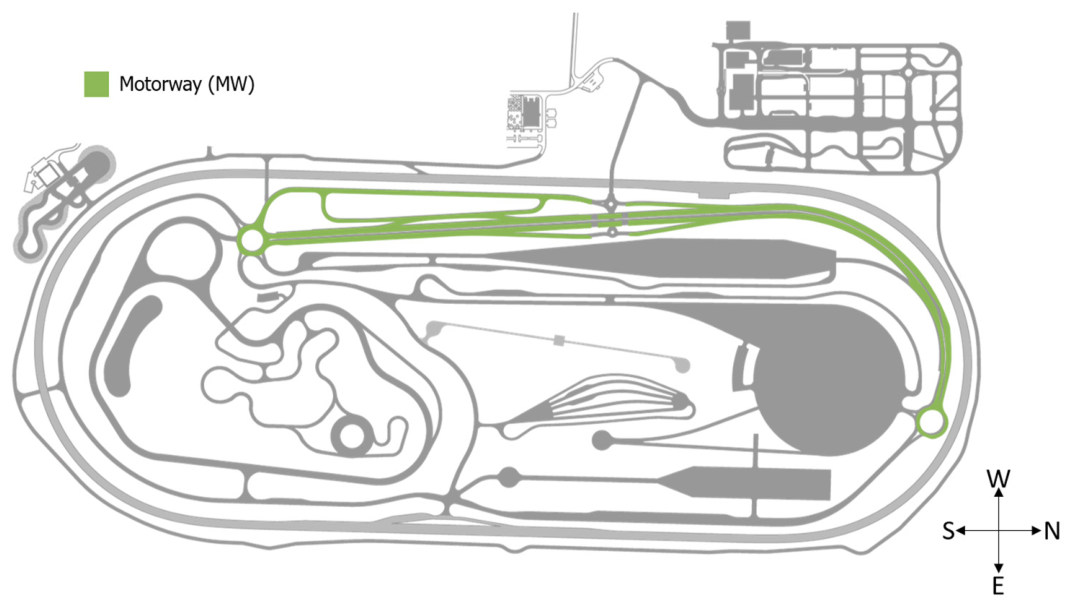
Our tests were carried out in a controlled environment, as our previous literature review showed that this is a critical factor for obtaining reliable results. A controlled environment offers several advantages: external influences can be minimized, and the individual test procedures can be reproduced easily and accurately. These aspects were particularly important in our research because the same test scenario had to be repeated several times using different geometric calibration settings. In this study, a controlled environment refers to a closed test track with infrastructure that closely represents real road conditions, while eliminating unnecessary disturbances and external influencing factors. Only the elements relevant to the test are present during the measurements. The tests were performed at the ZalaZONE automotive proving ground, where the motorway section was selected. This track element was considered the most suitable for testing ACC related functions, as it allows different following distances and vehicle speeds to be applied on an approximately 1.5 km long, 2 × 2 lane road section, as shown in Figure 2.
Figure 2.
Test scenarios conducted on the motorway section of the ZalaZONE Proving Ground (www.zalazone.hu, accessed on 27 July 2026).
During the tests, the measurements were started from the South roundabout shown on the left side of Figure 2, proceeding toward the North roundabout shown on the right side. These roundabouts allowed us to complete repeated test runs while evaluating the system. It is important to note that the test engineer conducting the measurements held an AVL ZalaZONE Driver Training certification, which allowed the tests to be carried out in a controlled, safe, and consistent manner while making full use of the characteristics of the test track. Several speed profiles and following distance settings were defined for the tests. Vehicle speeds of 50 and 100 km/h were applied, while short (following profile No. 1), medium (following profile No. 3), and long (following profile No. 5) distance settings were used for all six test case types. This resulted in a total of 36 different test configurations. Each configuration was repeated between three and five times. The experimental setup consisted of one lead vehicle and one ACC equipped following vehicle, multi-vehicle platoon behavior was outside the scope of the present study. For the quantitative evaluation at 50 km/h, three valid repeated runs were analyzed for each calibration setting and for following distance settings No. 1 and No. 3. At 100 km/h, three repeated runs were analyzed for each calibration setting using following distance setting No. 1, for which valid quasi-steady-state intervals could be identified within the measurement range of the LiDAR sensor. For each run, the mean following distance, standard deviation, and corresponding time gap were determined separately over the selected steady-state or quasi-steady-state interval. The repeated runs were subsequently compared to evaluate between-run repeatability. As a supplementary statistical evaluation, 95% confidence intervals were calculated for the calibration-specific repeated run mean values, and a one-way analysis of variance (ANOVA) was applied separately to the 50 km/h following distance settings No. 1 and No. 3 and to the 100 km/h following distance setting No. 1 to examine differences among the calibration settings. The corresponding effect size was expressed using eta squared (η2). As an additional descriptive evaluation of transient behavior, the representative curves at 50 km/h for following distance settings No. 1 and No. 3, as well as at 100 km/h for following distance setting No. 1, were assessed using the maximum transient following distance, the time of the maximum response, and the settling time within a ±5% band around the final steady-state value. As the original time-series data were not available for retrospective processing, these metrics were estimated from the plotted curves and are therefore reported as approximate values.
Since the investigated system was an ACC system, the following parameters were essential to record:
- Vehicle speed (km/h).
- Following distance (m).
- ACC system activation status (1/0).
- Accelerator pedal position (%).
- Additional vehicle-specific data.
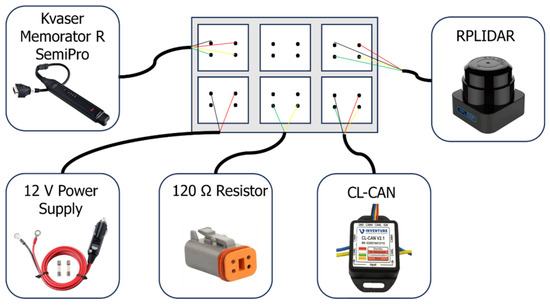
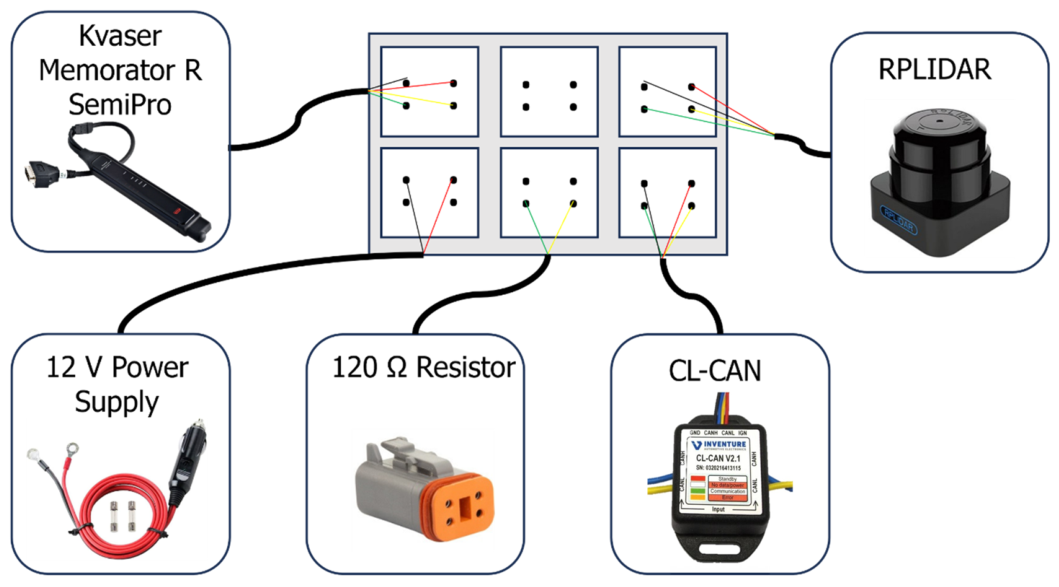
The measured data were mainly recorded from the vehicle communication network in the form of CAN data, allowing real-time data acquisition at a sampling frequency of approximately 100 Hz. The CAN network was accessed through the vehicle Gateway control unit using a contactless CL-CAN sensor (Inventure, Budapest, Hungary). The sensor was connected to the measurement laptop through a Kvaser Memorator R SemiPro interface (Kvaser AB, Mölndal, Sweden). With a communication speed of 500 kbit/s, the data transmitted on the network could be recorded reliably in serial format. The internal radar and ACC-specific signals could not be reliably decoded from the recorded CAN communication because the relevant manufacturer-specific signal definitions were not available. External diagnostic software was also tested but did not provide interpretable radar or ACC parameters. Therefore, an independent LiDAR-based system was used to measure the actual inter-vehicle distance. The measurement system was also equipped with a two-dimensional RPLiDAR S1 (Shanghai Slamtec Co., Ltd., Shanghai, China) sensor for distance measurement. The LiDAR sensor was installed on the target vehicle and was used to measure the following distance of the vehicle under test. The complete measurement setup, with the individual devices connected through a common hub, is shown in Figure 3.
Figure 3.
Measurement system used during the tests. The wire colors indicate the following connections: yellow—CAN High, green—CAN Low, red +12 V power supply, black—ground (GND).
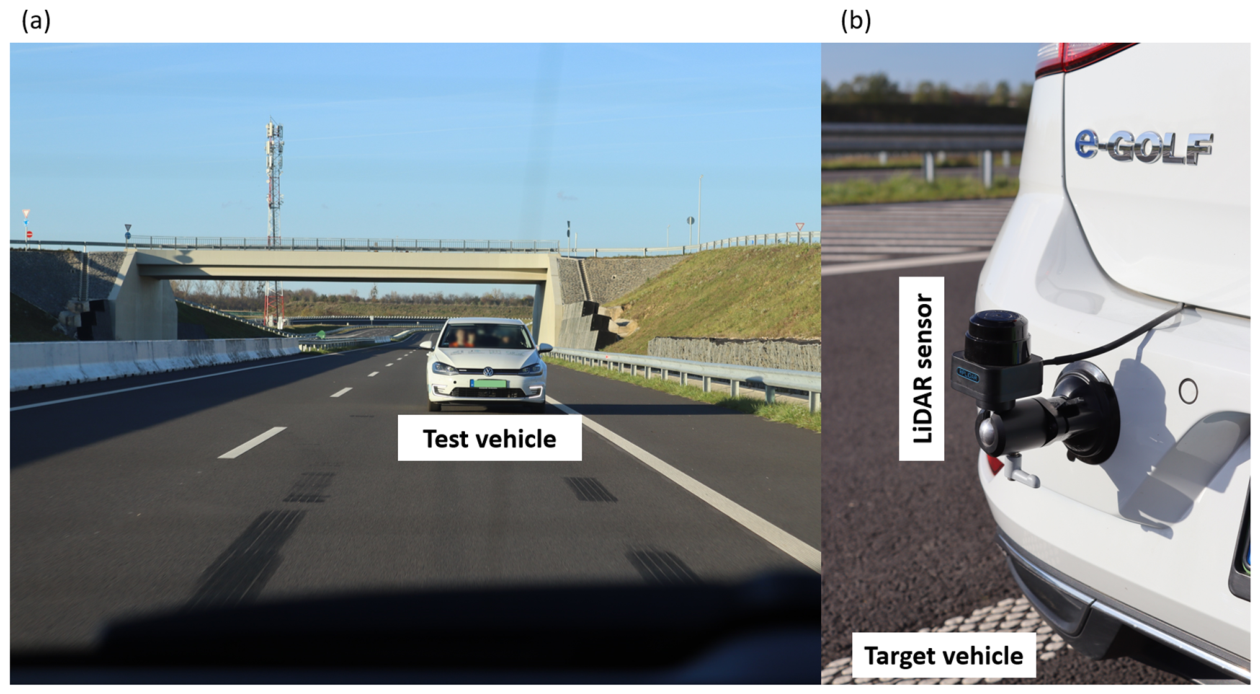
The most important component of the measurement system was clearly the two-dimensional LiDAR sensor, which had to be configured very carefully. Among the most important parameters were its orientation, which had to be defined relative to the connector cable, the lateral and longitudinal distance settings, which determined the sensing range, and the field of view (FOV), which also had to be specified accurately. This was especially important because the mounting height of the sensor was approximately the same as the height of the lane divider and the guardrail. For the FOV setting, an asymmetric configuration was selected, with a wider field of view in one direction and a narrower one in the other. This was necessary because the sensor was mounted on the rear bumper of the target vehicle, to the left of the license plate.
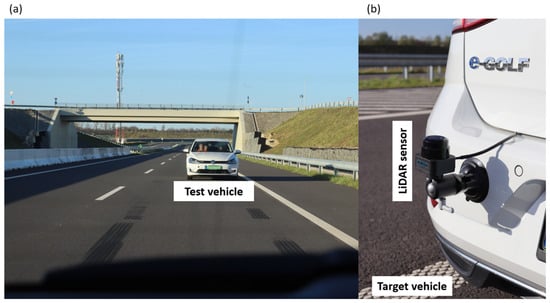
These factors had a critical influence on measurement accuracy, since the sensor always identified the closest detected point in the software, and this point had to correspond to the test vehicle. Otherwise, false measurement data would have been recorded. During the tests, the lane was selected in a way that ensured the test vehicle remained at a suitable distance from both the lane divider and the guardrail. The details of this arrangement are shown in Figure 4.
Figure 4.
Test execution: (a) Test vehicle during measurement on the motorway section. (b) Placement of the 2D LiDAR sensor on the rear of the leading target vehicle.
3. Results and Discussion
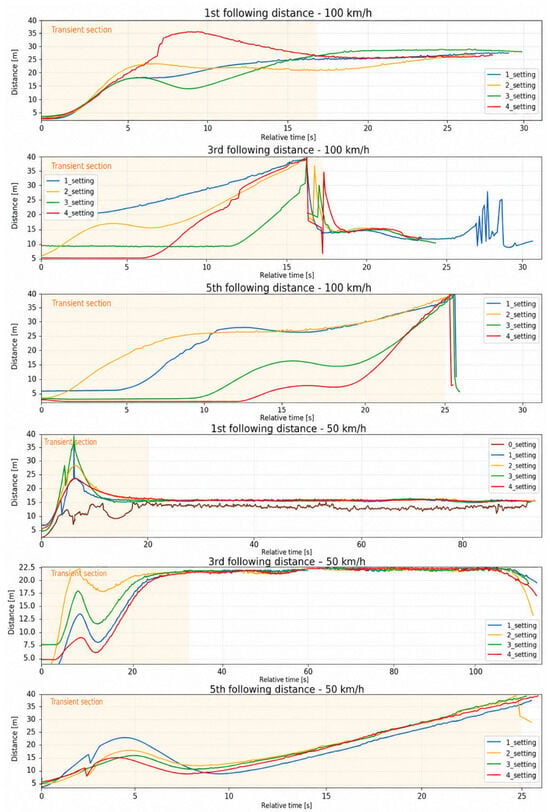
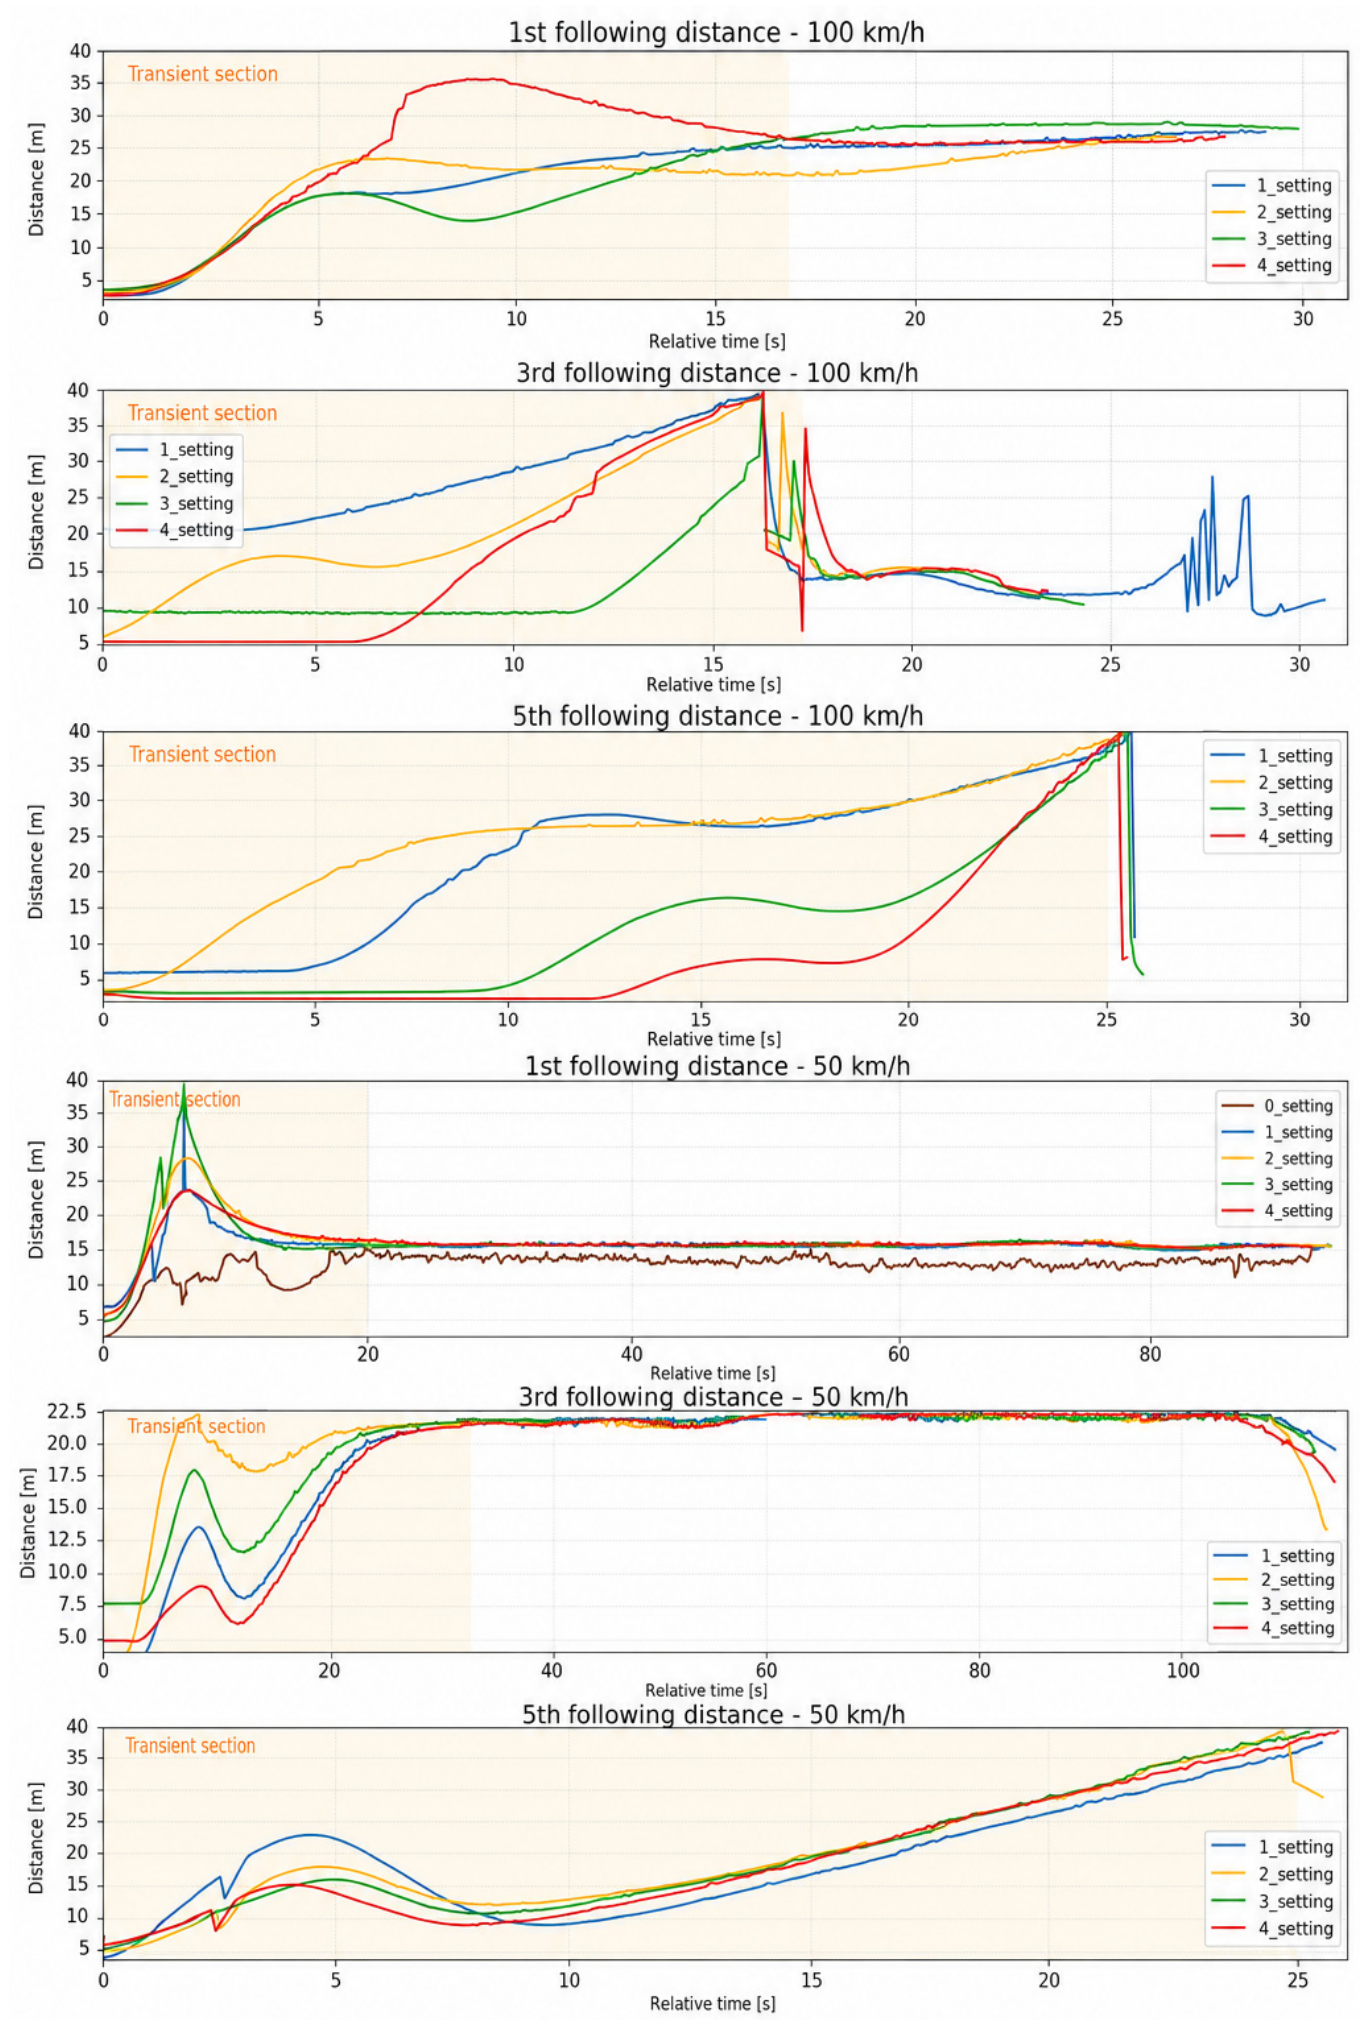
For the main part of the evaluation, we focused primarily on the operation of the ACC system, with following distance considered as the main critical parameter. The following distance was determined using the previously described 2D LiDAR sensor, which continuously measured the closest detected point and recorded the longitudinal and lateral position of the test vehicle. The sensor had to be configured specifically for the target, namely the investigated e-Golf. During the initial measurements, the sensor orientation was not yet perfectly calibrated, which resulted in some false data being recorded. These cases are discussed where relevant, but they are not shown separately among the valid measurement results in every case. In the first stage of the evaluation, the following distance measured along the longitudinal axis was examined. For each calibration setting, the steady-state mean following distance and standard deviation were quantified separately for each repeated run. At 50 km/h, three valid repeated runs were evaluated for each calibration setting and for following distance settings No. 1 and No. 3, allowing the repeatability of the steady-state results to be assessed. Calibration setting No. 0 represented the initial nominal radar configuration and was tested at 50 km/h with following distance setting No. 1. However, during this initial measurement, the LiDAR orientation was not yet correctly adjusted, and the recorded data were therefore not suitable for quantitative evaluation. The corresponding curve is retained in Figure 5 only as an illustrative example of the initial measurement condition and was excluded from the statistical comparison. Calibration setting No. 1 was therefore used as the analytical baseline for comparison within the valid measurement series, while calibration setting No. 0 represents the nominal manufacturer-defined condition. Settings No. 2 and No. 3 were mainly used to evaluate the effect of changes in vertical sensor orientation. Settings No. 4 and No. 5 were used to investigate the effect of horizontal misalignment, which was also supported by the change in the lateral target position recorded by the LiDAR sensor. Since the vertical orientation in setting No. 3 and the horizontal orientation in setting No. 5 were outside the ranges specified by the manufacturer, these configurations were investigated as extreme cases. The distance–time curves clearly show the results summarized in Figure 5. All curves were aligned in time to the same reference event, while the steady-state and transient sections were separated for evaluation. Signal loss occurring above the approximately 35–40 m range, followed by sudden high amplitude changes in the measured values, cannot be interpreted as a real response of the ACC system, as this behavior was caused by the maximum measurement range of the LiDAR sensor. This means that at 50 km/h, following distance settings No. 1 and No. 3 remained within the measurable range of approximately 35–40 m. At 100 km/h, however, only following distance setting No. 1 provided usable results, while the other measurements had to be excluded from the evaluation. Following distance setting No. 1 corresponds to a time gap of approximately 1.0 s, setting No. 3 to approximately 1.6 s, and setting No. 5 to approximately 2.1 s. Based on these values, the corresponding distances can be estimated easily. At a vehicle speed of 50 km/h, which corresponds to 13.89 m/s, the vehicle travels 13.89 m in one second. At 100 km/h, the corresponding speed is 27.78 m/s, which is approximately twice this distance per second.
Figure 5.
Summary of the ACC system results obtained with different calibration settings.
For following distance setting No. 1, the three repeated runs resulted in average following distances between 16.32 and 16.55 m across calibration settings No. 1–4. The corresponding within-run standard deviations ranged from 0.15 to 0.34 m, while the calculated time gaps ranged from 1.175 to 1.192 s. When the three repeated runs were considered together, the mean following distances for calibration settings No. 1–4 were 16.350, 16.473, 16.520, and 16.517 m, respectively. Using calibration setting No. 1 as the analytical baseline, the largest mean deviation was approximately +1.04%. For following distance setting No. 3, the individual repeated-run average distances ranged from 22.78 to 22.95 m, with within-run standard deviations between 0.27 and 0.35 m and time gaps between 1.640 and 1.652 s. The corresponding mean following distances across the three repeated runs were 22.873, 22.817, 22.833, and 22.920 m for calibration settings No. 1–4, respectively. Relative to the analytical baseline, the calibration-dependent mean differences remained within approximately ±0.25%. The between-run standard deviation of the mean following distance ranged from 0.020 to 0.042 m for following distance setting No. 1 and from 0.021 to 0.036 m for following distance setting No. 3, indicating low variability between the three repeated runs under the investigated conditions. These results show that, during the measurements performed at 50 km/h, the longitudinal following distance remained stable and showed limited sensitivity under the investigated conditions to changes in the calibration settings. However, calibration setting No. 5 is not included in the 50 km/h quantitative results because the corresponding measurement series was affected by a measurement error and did not provide sufficiently reliable data for evaluation. This limitation was specific to the 50 km/h measurement set; at 100 km/h, calibration setting No. 5 provided an evaluable quasi-steady-state interval and was therefore included in the subsequent analysis. The detailed repeated-run results of the evaluation are presented in Table 2.
Table 2.
Detailed statistical results of the tests performed at 50 km/h.
Based on the repeated measurements, the investigated calibration deviations were associated with only small changes in the steady-state following distances under the tested conditions. For following distance setting No. 1, the mean following distance across the three runs differed by a maximum of approximately 1.04% relative to calibration setting No. 1, while for following distance setting No. 3 the mean differences remained within approximately ±0.25%. The low between-run variability further indicates that these steady-state results were consistently reproduced across the three repeated measurements.
As a supplementary statistical evaluation, the repeated-run mean following distances were compared using one-way ANOVA. Differences among the calibration settings were statistically significant for both following distance setting No. 1 (F = 21.91, p < 0.001, η2 = 0.89) and following distance setting No. 3 (F = 6.53, p = 0.015, η2 = 0.71). The corresponding 95% confidence intervals for calibration settings No. 1–4 were 16.27–16.42 m, 16.42–16.52 m, 16.47–16.57 m, and 16.41–16.62 m, respectively, for following distance setting No. 1, and 22.82–22.92 m, 22.73–22.90 m, 22.76–22.91 m, and 22.83–23.01 m, respectively, for following distance setting No. 3. Given the limited number of repeated runs (n = 3 per calibration setting), these inferential statistical results should be interpreted as supplementary evidence rather than as a basis for broader statistical generalization.
In contrast, considerably larger differences were observed in the transient sections of the distance–time curves, particularly in the rise behavior and overshoot. The observed differences suggest that the dynamic response of the ACC system may be more sensitive to changes in radar calibration than the steady-state following distance. These results are presented in Figure 5. To provide a quantitative description of these transient differences, the representative curves at 50 km/h for ACC levels No. 1 and No. 3, as well as at 100 km/h for ACC level No. 1, were additionally evaluated using the metrics defined in the methodology. As summarized in Table 3, the estimated maximum transient following distance and settling time varied across the investigated calibration settings, while the time of the maximum response also showed configuration-dependent differences. At 50 km/h, for ACC level No. 1, the maximum transient distance ranged from approximately 23.0 to 37.0 m and the estimated settling time from approximately 14 to 18 s. For ACC level No. 3, the corresponding values ranged from approximately 9.0 to 22.0 m and from approximately 24 to 29 s, respectively. At 100 km/h with ACC level No. 1, the estimated maximum transient following distance ranged from approximately 23.5 to 35.5 m, the time of maximum response from approximately 7.5 to 17.0 s, and the settling time from approximately 16 to 24 s. These values provide a descriptive quantitative comparison of the representative transient responses and should be interpreted as approximate estimates derived from the plotted curves rather than as repeated-run transient statistics. For ACC level No. 5, a stable final steady-state value was not reached within the evaluable interval; therefore, the settling time could not be reliably quantified and this setting was excluded from the transient metric comparison in Table 3.
Table 3.
Approximate transient-response metrics are estimated from the representative curves at 50 and 100 km/h.
For the tests performed at 100 km/h, only shorter quasi-steady-state sections could be identified when using following distance setting No. 1. Three repeated runs were evaluated for each calibration setting, and the individual run average following distances ranged from 26.08 to 28.94 m. Considerable between-run variability was observed for calibration settings No. 4 and No. 5, while calibration settings No. 1–3 showed more consistent repeated-run results. For following distance settings No. 3 and No. 5 at 100 km/h, the inter-vehicle distance exceeded the effective measurement range of the LiDAR sensor; therefore, these configurations were excluded from the quantitative evaluation. The sensor provided valid data only when the test vehicle was within its measurement range, which explains the large amplitude fluctuations observed in the recorded signals. At 100 km/h, the vehicle travels at approximately 27.78 m/s. When this value is considered together with the larger time-gap settings of No. 3 and No. 5, the corresponding following distances exceed the maximum measurement range of the LiDAR sensor, which was approximately 35–40 m. The results obtained at 100 km/h with following distance setting No. 1 are presented in Table 4. For each repeated run, a 10 s quasi-steady-state interval was selected from the recorded measurement for quantitative evaluation. These intervals were not required to occur at the same absolute time within each run, but were selected to represent the most stable evaluable section within the LiDAR measurement range.
Table 4.
Detailed repeated-run results of the tests performed at 100 km/h.
Based on the three repeated measurements performed at 100 km/h with following distance setting No. 1, the mean following distances for calibration settings No. 1–5 were 27.827, 28.517, 28.460, 28.357, and 27.957 m, respectively. Relative to calibration setting No. 1, which was used as the analytical baseline for the valid measurement series, the mean deviations remained within approximately +2.5%, while the corresponding mean time gaps were close to 1.0 s for all calibration settings. The between-run standard deviation was 0.081 m for calibration setting No. 1, 0.093 m for No. 2, 0.131 m for No. 3, 0.527 m for No. 4, and 1.626 m for No. 5, indicating substantially greater run-to-run variability for the two horizontally offset configurations, particularly calibration setting No. 5.
As a supplementary statistical evaluation, the repeated-run mean following distances were compared using one-way ANOVA analysis. No statistically significant difference was found among the five calibration settings (F = 0.49, p = 0.741, η2 = 0.16). The corresponding 95% confidence intervals were 27.63–28.03 m, 28.29–28.75 m, 28.14–28.79 m, 27.05–29.67 m, and 23.92–32.00 m for calibration settings No. 1–5, respectively. Given the limited number of repeated runs and the increased between-run variability observed for calibration settings No. 4 and No. 5, these results should be interpreted cautiously and as system-specific trends under the present test conditions.
The selected calibration settings also made it possible to compare the system-level behavior associated with different vertical and horizontal sensor orientations. The comparison of calibration settings No. 1, No. 2, and No. 3 primarily reflects changes in vertical orientation. At 50 km/h, the repeated-run results showed only small differences in steady-state following distance even for calibration setting No. 3, where the vertical orientation of 5.10° was outside the manufacturer-specified range. At 100 km/h, calibration settings No. 4 and No. 5, representing horizontal offsets, showed larger between-run variability than calibration settings No. 1–3. Therefore, the repeated measurements do not support a consistent calibration-dependent shift in steady-state following distance for the horizontally offset configurations, but rather indicate increased variability under these test conditions. Overall, for the investigated vehicle and radar-based ACC implementation, the steady-state longitudinal following behavior showed limited and non-uniform sensitivity to the tested geometric calibration deviations.
4. Limitations
One of the main limitations of the study was the effective measurement range of approximately 35–40 m of the 2D LiDAR sensor used to determine the reference distance. This limitation was particularly relevant during the tests performed at the higher speed of 100 km/h and with larger ACC following distance settings, since the distance between the test vehicle and the target vehicle exceeded the detection range of the sensor. As a result, for following distance settings No. 3 and No. 5, neither the complete settling process nor the steady-state following distance could be evaluated reliably. Therefore, for the measurements performed at 100 km/h with following distance setting No. 1, shorter 10 s quasi-steady-state intervals were selected and compared for each calibration setting. These intervals did not necessarily occur at the same point in time during each test run. For this 100 km/h evaluation, three repeated runs were analyzed for each calibration setting. While calibration settings No. 1–3 showed relatively low between-run variability, substantially larger variability was observed for calibration settings No. 4 and No. 5. Accordingly, the 100 km/h results for the horizontally offset calibration settings should be interpreted cautiously, particularly with regard to any calibration-dependent change in steady-state following distance.
A further limitation was that, during the initial nominal calibration setting No. 0, the orientation of the LiDAR sensor had not yet been properly adjusted. Therefore, this nominal manufacturer-defined condition could not be included in the quantitative comparison, and calibration setting No. 1 was used only as the analytical baseline for the valid measurement series. Consequently, the relative differences reported in the quantitative analysis should be interpreted as deviations from the analytical baseline (calibration setting No. 1) rather than as deviations from the nominal manufacturer-defined calibration condition. For the quantitative evaluation at 50 km/h, three valid repeated runs were analyzed for each included calibration setting and following distance setting. This allowed the repeatability of the steady-state results to be assessed in addition to the variability observed within the individual runs. However, the number of repeated measurements remains limited, and the statistical interpretation of the results should therefore be considered in the context of the specific vehicle, ACC implementation, and controlled test conditions investigated.
Another limitation of the measurement method is that the LiDAR sensor measured the actual distance between the two vehicles, while the radar’s internal target-distance and ACC-specific signals were not available for direct comparison. As described in the measurement methodology, these manufacturer-specific signals could not be reliably decoded from the available CAN communication. Therefore, the present study evaluates the system-level relationship between geometric radar calibration and ACC behavior, but does not allow the observed differences to be attributed specifically to changes in radar sensing or to the subsequent control response of the ACC system. Future studies with access to decoded internal radar and ACC signals could provide a more detailed analysis of this relationship.
A further limitation of the present study is that the experiments were conducted using a single production vehicle equipped with one specific radar-based ACC implementation and a single lead-vehicle car-following scenario. Consequently, the observed effects of geometric radar calibration should not be interpreted as general tolerance characteristics of ACC systems or radar sensors from other manufacturers. The results describe the behavior of the investigated vehicle and system under the specific controlled test conditions considered in this study and should therefore be regarded as indicative system-specific trends. Future research should extend the experimental framework to additional vehicle models, radar and ACC implementations, road environments, and multi-vehicle scenarios to determine the extent to which the observed trends are transferable to other systems.
5. Conclusions
The aim of our research was to investigate how different geometric calibration settings of the front radar sensor are associated with the behavior of the adaptive cruise control system of a production passenger vehicle. The tests were carried out in a controlled proving-ground environment using different vertical and horizontal radar orientations, two vehicle speeds, and several ACC following distance settings. The actual longitudinal distance between the vehicles was measured using an independent 2D LiDAR measurement system.
Based on the repeated measurements obtained at 50 km/h, the investigated geometric calibration deviations were associated with only small changes in the steady-state following distance of the investigated ACC system. For following distance setting No. 1, the mean following distances calculated from three repeated runs ranged from 16.35 to 16.52 m, with a maximum mean deviation of approximately 1.04% relative to calibration setting No. 1, which served as the analytical baseline for the valid quantitative comparison. For following distance setting No. 3, the corresponding mean values ranged from 22.82 to 22.92 m, while the mean deviations remained within approximately ±0.25%. The low between-run variability observed for both following distance settings indicates good repeatability of the steady-state results within the investigated test conditions. For the investigated vehicle and radar-based ACC implementation, the steady-state longitudinal following behavior therefore showed limited sensitivity to the tested geometric calibration deviations under the examined conditions. This is also supported by the fact that no substantial change in steady-state following distance was observed even with a vertical setting of 5.10°, which was outside the calibration range specified by the manufacturer.
More pronounced differences were observed during the transient phases of the ACC response. The descriptive quantitative evaluation of the representative curves showed that, at 50 km/h, the maximum transient following distance ranged from approximately 23.0 to 37.0 m for ACC level No. 1 and from approximately 9.0 to 22.0 m for ACC level No. 3, with estimated settling times of approximately 14–18 s and 24–29 s, respectively. At 100 km/h with ACC level No. 1, the estimated maximum transient following distance ranged from approximately 23.5 to 35.5 m, the time of maximum response from approximately 7.5 to 17.0 s, and the settling time from approximately 16 to 24 s. These results suggest that the differences associated with the tested calibration settings were more apparent in the magnitude and settling behavior of the transient response than in the final steady-state following distance. However, these transient metrics were estimated from representative plotted curves and should therefore be interpreted as descriptive rather than repeated-run statistical results.
Among the tests performed at 100 km/h, following distance setting No. 1 provided sufficiently reliable results for repeated-run evaluation. The mean following distances calculated from three repeated runs ranged from 27.83 to 28.52 m across calibration settings No. 1–5, while the corresponding mean time gaps remained close to 1.0 s. No statistically significant difference was identified among the five calibration settings in the supplementary ANOVA analysis. However, calibration settings No. 4 and No. 5 showed substantially greater between-run variability than settings No. 1–3, indicating that the horizontally offset configurations produced less consistent repeated-run results under the investigated conditions. Therefore, the 100 km/h measurements do not support a consistent calibration-dependent shift in steady-state following distance, but rather suggest increased variability for the horizontally offset settings.
Overall, within the investigated vehicle, radar-based ACC implementation, and controlled test conditions, changes in geometric radar calibration were associated with measurable but generally small differences in steady-state ACC following behavior. The repeated measurements at 50 km/h showed good consistency across runs, while the 100 km/h measurements indicated increased run-to-run variability for the horizontally offset calibration settings rather than a consistent shift in steady-state following distance. The larger differences observed during the dynamic phases suggest that correct geometric calibration may be more relevant to transient system behavior than to the final steady-state following distance under the investigated conditions. The combined use of a controlled proving-ground environment and an independent distance measurement system provided a suitable methodological basis for evaluating these effects at the system level.
As a continuation of this research, we plan to investigate the communication of the vehicle radar sensor on the CAN network in more detail in order to record internal ACC-specific signals. This would allow us to evaluate both the radar sensing behavior and the control response of the ACC system more directly. In addition, the use of a distance measurement sensor with a larger measurement range would make it possible to investigate higher following distance settings and higher vehicle speeds, thereby enabling a more complete evaluation of the system. Finally, additional calibration steps should be defined to investigate both positive and negative geometric radar positions for vertical as well as horizontal angular adjustments.
Author Contributions
Conceptualization, G.S. and M.J.; methodology, G.S. and M.J.; software, M.I.; validation, G.S., M.I. and M.J.; formal analysis, G.S.; investigation, G.S.; resources, M.I.; data curation, M.J.; writing—original draft preparation, G.S.; writing—review and editing, G.S. and M.J.; visualization, G.S.; supervision, G.S.; project administration, G.S. All authors have read and agreed to the published version of the manuscript.
Funding
This research received no external funding.
Informed Consent Statement
Written informed consent was obtained from all individuals shown in Figure 4 for participation in the study and for the publication of the related image. The individuals shown in Figure 4 are authors of this manuscript. In the revised version of the manuscript, identifiable facial features have been obscured to protect the identity of the individuals.
Data Availability Statement
Data is contained within this article.
Acknowledgments
The authors acknowledge Széchenyi István University for providing institutional and technical support.
Conflicts of Interest
The authors declare no conflicts of interest.
References
- Costa, A.; Innamaa, S.; Malin, F. Safety impact of advanced driver assistance systems in Europe in 2030. J. Saf. Res. 2025, 95, 290–300. [Google Scholar] [CrossRef] [Scilit] [PubMed]
- European Parliament and Council. Regulation (EU) 2019/2144 of the European Parliament and of the Council on Type-Approval Requirements for Motor Vehicles. 2019. Available online: https://eur-lex.europa.eu/eli/reg/2019/2144/oj/eng (accessed on 27 August 2026).
- Bareket, Z.; Fancher, P.S.; Peng, H.; Lee, K.; Assaf, C.A. Methodology for assessing adaptive cruise control behavior. IEEE Trans. Intell. Transp. Syst. 2003, 4, 123–131. [Google Scholar] [CrossRef]
- Makridis, M.; Mattas, K.; Ciuffo, B. Response Time and Time Headway of an Adaptive Cruise Control. An Empirical Characterization and Potential Impacts on Road Capacity. IEEE Trans. Intell. Transp. Syst. 2020, 21, 1677–1686. [Google Scholar] [CrossRef] [Scilit]
- Makridis, M.; Mattas, K.; Ciuffo, B.; Re, F.; Kriston, A.; Minarini, F.; Rognelund, G. Empirical Study on the Properties of Adaptive Cruise Control Systems and Their Impact on Traffic Flow and String Stability. Transp. Res. Rec. 2020, 2674, 471–484. [Google Scholar] [CrossRef] [Scilit]
- Gunter, G.; Gloudemans, D.; Stern, R.E.; McQuade, S.; Bhadani, R.; Bunting, M.; Monache, M.L.D.; Lysecky, R.; Seibold, B.; Sprinkle, J.; et al. Are Commercially Implemented Adaptive Cruise Control Systems String Stable? IEEE Trans. Intell. Transp. Syst. 2021, 22, 6992–7003. [Google Scholar] [CrossRef] [Scilit]
- Gunter, G.; Janssen, C.; Barbour, W.; Stern, R.E.; Work, D.B. Model-Based String Stability of Adaptive Cruise Control Systems Using Field Data. IEEE Trans. Intell. Veh. 2020, 5, 90–99. [Google Scholar] [CrossRef] [Scilit]
- Liang, C.Y.; Peng, H. Optimal adaptive cruise control with guaranteed string stability. Veh. Syst. Dyn. 1999, 32, 313–330. [Google Scholar] [CrossRef] [Scilit]
- Makridis, M.; Mattas, K.; Anesiadou, A.; Ciuffo, B. OpenACC. An open database of car-following experiments to study the properties of commercial ACC systems. Transp. Res. Part C Emerg. Technol. 2021, 125, 103047. [Google Scholar] [CrossRef] [Scilit]
- Mohammed, D.; Nagy, V.; Jagicza, M.; Józsa, D.; Horváth, B. Efficiency of adaptive cruise control in commercial vehicles. Pollack Period. 2024, 19, 1–7. [Google Scholar] [CrossRef] [Scilit]
- Mohammed, D.; Horváth, B. Steady-Speed Traffic Capacity Analysis for Autonomous and Human-Driven Vehicles. Appl. Sci. 2024, 14, 337. [Google Scholar] [CrossRef] [Scilit]
- Knoop, V.L.; Wang, M.; Wilmink, I.; Hoedemaeker, D.M.; Maaskant, M.; Van der Meer, E.J. Platoon of SAE Level-2 Automated Vehicles on Public Roads: Setup, Traffic Interactions, and Stability. Transp. Res. Rec. 2019, 2673, 311–322. [Google Scholar] [CrossRef] [Scilit]
- Milanés, V.; Shladover, S.E. Modeling cooperative and autonomous adaptive cruise control dynamic responses using experimental data. Transp. Res. Part C Emerg. Technol. 2014, 48, 285–300. [Google Scholar] [CrossRef] [Scilit]
- Lim, J.; Kim, G.; Jeong, C.; Kang, C. Radar-Only Cooperative Adaptive Cruise Control Under Acceleration Disturbances: ACC, KF-CACC, and Multi-Q IMM-KF CACC. Appl. Sci. 2025, 15, 12199. [Google Scholar] [CrossRef] [Scilit]
- Gunter, G.; Stern, R.E.; Work, D.B. Modeling adaptive cruise control vehicles from experimental data: Model comparison. In 2019 IEEE Intelligent Transportation Systems Conference (ITSC); IEEE: Auckland, New Zealand, 2019; pp. 3049–3054. [Google Scholar] [CrossRef] [Scilit]
- Wang, Y.; Gunter, G.; Nice, M.; Monache, M.L.D.; Work, D.B. Online Parameter Estimation Methods for Adaptive Cruise Control Systems. IEEE Trans. Intell. Veh. 2021, 6, 288–298. [Google Scholar] [CrossRef] [Scilit]
- Bobaru, A.; Nafornita, C.; Copacean, G.; Vesa, V.C.; Skutek, M. Contributions to Unsupervised Online Misalignment Detection and Bumper Error Compensation for Automotive Radar. Sensors 2023, 23, 6785. [Google Scholar] [CrossRef] [Scilit] [PubMed]
- Burza, R.M. Overview of Radar Alignment Methods and Analysis of Radar Misalignment’s Impact on Active Safety and Autonomous Systems. Sensors 2024, 24, 4913. [Google Scholar] [CrossRef] [Scilit] [PubMed]

Disclaimer/Publisher’s Note: The statements, opinions and data contained in all publications are solely those of the individual author(s) and contributor(s) and not of MDPI and/or the editor(s). MDPI and/or the editor(s) disclaim responsibility for any injury to people or property resulting from any ideas, methods, instructions or products referred to in the content. |
© 2026 by the authors. Licensee MDPI, Basel, Switzerland. This article is an open access article distributed under the terms and conditions of the Creative Commons Attribution (CC BY) license.