


Highlights
What are the main findings?
- Capillary whole-blood glucose measured with the handheld meter showed limited agreement with venous serum glucose measured by the laboratory method.
- Although the average difference between methods was small, agreement for individual cows was poor, with wide limits of agreement and frequent differences in glucose classification.
What are the implications of the main findings?
- The handheld and laboratory measurements should not be used interchangeably for clinical assessment of individual cows.
- Laboratory confirmation remains important when accurate glucose determination is required, especially for values close to clinical decision thresholds.
Abstract
Blood glucose concentration is commonly used to assess energy metabolism in dairy cows. Handheld glucose meters allow rapid measurement under farm conditions, but their performance in cattle may differ from that obtained with laboratory methods. This study evaluated the agreement between capillary whole-blood glucose measured with the Accu-Chek® Instant handheld glucose meter and venous serum glucose measured with a laboratory biochemical analyzer. A total of 93 Holstein–Friesian animals provided 117 paired glucose measurements; 24 animals were sampled on two occasions. Capillary blood was collected from the vulvar mucosa and measured immediately, while venous blood was collected from the coccygeal vein and processed to serum for laboratory analysis. The mean glucose concentration was 3.27 ± 0.51 mmol/L in capillary whole blood and 3.44 ± 0.42 mmol/L in venous serum. The mean paired difference was 0.17 mmol/L (95% CI, 0.06–0.27 mmol/L; p = 0.0018). The correlation between methods was weak (r = 0.267), and Lin’s concordance correlation coefficient was 0.246. Bland–Altman analysis showed limits of agreement from −0.94 to 1.27 mmol/L. A significant proportional bias was also identified (β = −0.302; 95% CI, −0.562 to −0.042; p = 0.023). Categorical agreement was limited (Cohen’s κ = 0.241), and 47 of 117 paired measurements were classified into different glucose categories. These findings show that the two measurement approaches are not interchangeable for individual-cow assessment. The observed differences may reflect not only device performance but also differences in sampling site, sample matrix, and sample handling.
1. Introduction
Glucose is the principal carbohydrate involved in energy metabolism and is essential for maintaining physiological homeostasis, milk production, immune function, and reproductive performance in dairy cows [1,2,3]. During the transition period, particularly during late gestation and early lactation, glucose demand increases substantially because of fetal growth, colostrum production, lactose synthesis, and activation of the immune system [2,3,4]. Unlike monogastric species, ruminants rely predominantly on hepatic gluconeogenesis to maintain blood glucose concentrations because most dietary carbohydrates are fermented in the rumen and only a limited amount of glucose is directly absorbed from the intestine [1,3]. During early lactation, energy intake may fail to meet the rapidly increasing requirements for milk production, resulting in negative energy balance and mobilization of body reserves. Inadequate metabolic adaptation during this period is associated with an increased risk of metabolic disorders, including ketosis [2,3,4].
Blood glucose concentration is commonly determined by laboratory analysis of serum or plasma obtained from venous blood, which remains the reference method because of its analytical accuracy, precision, and standardized methodology [5,6]. However, laboratory testing requires blood collection, sample transport, centrifugation, and biochemical analysis, which may delay clinical decision-making under farm conditions [5,7]. Portable handheld glucometers provide rapid cow-side measurements using small capillary blood samples and therefore represent an attractive tool for rapid metabolic assessment [6,7,8]. However, most commercially available handheld glucose meters are designed for human use, and their analytical performance cannot be assumed to be equivalent in cattle [5,9]. Nevertheless, differences in sampling site, sample matrix, device calibration, hematocrit, peripheral perfusion, preanalytical handling, and analytical methodology may influence glucose measurements and reduce agreement with laboratory reference methods [5,8,9,10].
Several studies have evaluated the analytical performance of portable glucometers in dairy cattle; however, the reported agreement with laboratory glucose measurements has been inconsistent [6,7,8,9,10]. Lopes et al. [9] evaluated six handheld glucose meters designed for human use and reported considerable device-dependent variation in precision and agreement with laboratory measurements. Mair et al. [7] demonstrated considerable variation in analytical performance among three handheld glucometers when capillary blood collected from the vulvar region was compared with laboratory glucose measurements. Similarly, López et al. [10] reported limited agreement between capillary blood glucose measured using a handheld glucometer and laboratory serum glucose concentrations, concluding that the evaluated device was not suitable for routine clinical application. Collectively, these studies indicate that the performance of handheld glucose meters depends on the specific device and the protocol used and that results obtained with one device should not be directly applied to another [5,7,8,9,10].
However, as the available data are specific to a particular device and protocol, additional evaluation under the intended conditions of use is necessary before clinically assessing glucose readings from dairy cows obtained using handheld meters [5,9,10,11]. Therefore, the aim of this study was to evaluate the agreement between capillary whole-blood glucose concentrations measured using the Accu-Chek® Instant handheld glucose meter and venous serum glucose concentrations determined using the laboratory biochemical method. We hypothesized that capillary whole-blood glucose concentrations measured using the Accu-Chek® Instant would agree with venous serum glucose concentrations determined using the laboratory method and would not show proportional bias across the observed glucose range.
2. Materials and Methods
The animal study protocol was approved by the State Food and Veterinary Service of the Republic of Lithuania (VMVT) (Approval No. G2-298, approved on 10 March 2025).
2.1. Animals and Study Design
This observational method-comparison study was conducted on a commercial dairy farm operated by the LSMU Practical Training and Testing Centre in Lithuania between February and April 2025. The lactating cows were housed in a free-stall barn, managed as a single feeding group, and received the same total mixed ration (TMR) formulated according to the nutritional requirements of lactating dairy cows. Dry cows were housed separately in a different barn. Cows were milked using an automatic milking system (DeLaval VMS™, DeLaval, Tumba, Sweden), with milking frequency determined individually according to milk yield and voluntary cow traffic.
A total of 93 individual Holstein–Friesian animals were included in the study, providing 117 paired glucose measurements because 24 animals were sampled on two occasions. At the first sampling, the study population included 8 nulliparous heifers, 37 primiparous cows, and 47 multiparous cows; parity information was unavailable for one animal. Among lactating cows, median parity was 2 (range, 1–5), median days in milk were 119 days (IQR, 61–221; range, 9–624; n = 81). Individual milk yield, body condition score, and exact time since feed intake were not consistently available for all animals and were therefore not included in the analysis. Health status was assessed using herd management records, individual medical records, and clinical examination on the day of sampling. Animals showing clinical signs of mastitis, lameness, digestive disorders, systemic illness, or other apparent health abnormalities were excluded. However, because BHBA, NEFA, and other metabolic biomarkers were not assessed, subclinical metabolic disorders could not be excluded.
Blood samples were collected during the morning feeding period (10:00–13:00) while cows were standing at the feed bunk. Animals were restrained only minimally in accordance with routine farm procedures to reduce handling stress during sampling.
The study compared capillary whole-blood glucose concentrations measured immediately using the handheld glucose meter with venous serum glucose concentrations determined using a laboratory biochemical analyzer.
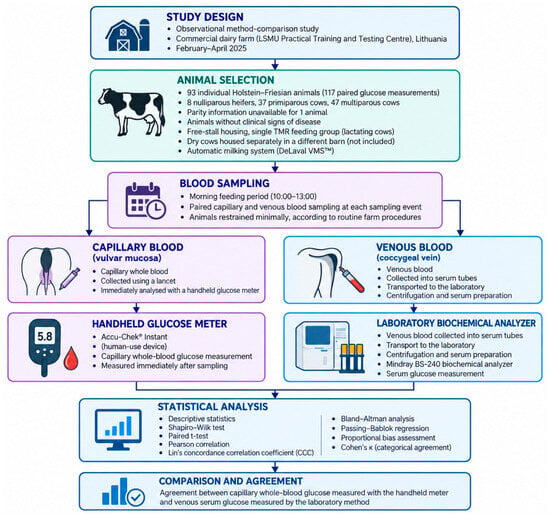
A schematic overview of the experimental design is presented in Figure 1, including animal selection, blood collection, glucose determination and statistical analysis. Blood sampling procedures were based primarily on the methodology described by López et al. [10], with minor modifications reflecting the management conditions of the participating dairy farm.
Figure 1.
Schematic overview of the study workflow. The content and structure were prepared by the authors; ChatGPT (OpenAI) assisted with the visual arrangement and illustrative elements.
2.2. Blood Sampling and Glucose Measurement
At each sampling event, capillary and venous blood samples were collected consecutively during the same sampling session. Capillary blood was collected from the vulvar mucosa using a sterile single-use lancet. The first drop of blood was discarded to minimize potential contamination with tissue fluid. Capillary blood glucose concentration was measured immediately after sampling using the Accu-Chek® Instant handheld glucose meter (Roche Diabetes Care GmbH, Mannheim, Germany), a blood glucose monitoring system intended for human use and not validated by the manufacturer for bovine blood [5,12,13]. In the present study, the agreement between measurements obtained using this device and laboratory serum glucose measurements was evaluated in cattle. Venous blood was collected from the coccygeal vein into red-top serum tubes (VACUETTE®, Greiner Bio-One, Kremsmünster, Austria) and transported to the laboratory within 90 min. Serum was obtained after centrifugation at 1500× g for 10 min, and glucose concentration was analyzed within 2 h after collection. The exact tube additive composition, transport temperature, and exact timing of serum separation after centrifugation were not recorded prospectively. During sampling, ambient temperature ranged from 8 to 12 °C [12]. Glucose concentrations obtained using both measurement approaches were expressed in mmol/L.
2.3. Laboratory Analysis
Serum glucose concentration was determined using an automated biochemical analyzer (Mindray BS-240, Shenzhen Mindray Bio-Medical Electronics Co., Shenzhen, China) employing the glucose oxidase–peroxidase enzymatic method. Instrument calibration and internal quality-control procedures were performed according to the manufacturer’s recommendations before routine sample analysis.
2.4. Statistical Analysis
Statistical analyses were performed using IBM SPSS Statistics version 30.0 (IBM Corp., Armonk, NY, USA) and Python version 3.13.5. Figures were prepared using GraphPad Prism version 11.1.0 (GraphPad Software, Boston, MA, USA). Python-based analyses were performed using NumPy version 2.3.5, SciPy version 1.17.0, and statsmodels version 0.14.6. Normality of the paired differences between venous serum and capillary whole-blood glucose concentrations was assessed using the Shapiro–Wilk test. Continuous variables are presented as mean ± standard deviation (SD) or median and interquartile range (IQR), as appropriate. A paired t-test was used to determine whether the mean difference between venous serum and capillary whole-blood glucose concentrations differed from zero. The linear association between capillary whole-blood and venous serum glucose concentrations was evaluated using Pearson’s correlation coefficient (r). Pearson’s correlation coefficient was reported descriptively without an inferential p-value because statistical significance of the correlation was not used to assess agreement between the two measurement approaches. Concordance between the two measurement approaches was assessed using Lin’s concordance correlation coefficient (CCC), together with the bias-correction factor (Cb) and 95% confidence interval (CI) [14,15]. Agreement between the two measurement approaches was further evaluated using Bland–Altman analysis by calculating the mean difference (venous serum − capillary whole blood) and the 95% limits of agreement (LoA) [16]. Proportional bias was assessed by linear regression of the paired differences (venous serum − capillary whole blood) against the mean of the two measurements. Passing–Bablok regression was performed with capillary whole-blood glucose as the independent variable and venous serum glucose as the dependent variable; the slope and intercept were reported with 95% CIs [17]. For clinical interpretation, glucose concentrations were classified into three categories: hypoglycaemia (<2.5 mmol/L), normoglycaemia (2.5–3.5 mmol/L) and hyperglycaemia (>3.5 mmol/L). Categorical agreement between the two measurement approaches was evaluated using Cohen’s kappa coefficient (κ) with a 95% CI. Because 24 animals were sampled on two occasions, within-animal dependence was accounted for in the relevant inferential analyses. Animal-level cluster bootstrap resampling was used to obtain 95% confidence intervals for Lin’s CCC, Passing–Bablok regression coefficients, and Cohen’s κ, while cluster-robust standard errors at the animal level were used for the proportional-bias regression. The paired t-test was retained as a secondary comparison of the mean paired difference at the sampling-event level and was not used as a measure of agreement. The corresponding 95% confidence interval and p-value were not adjusted for within-animal clustering and are presented only as a secondary summary of the mean paired difference. A value of p < 0.05 was considered statistically significant.
3. Results
3.1. Comparison of Glucose Concentrations Measured by the Two Methods
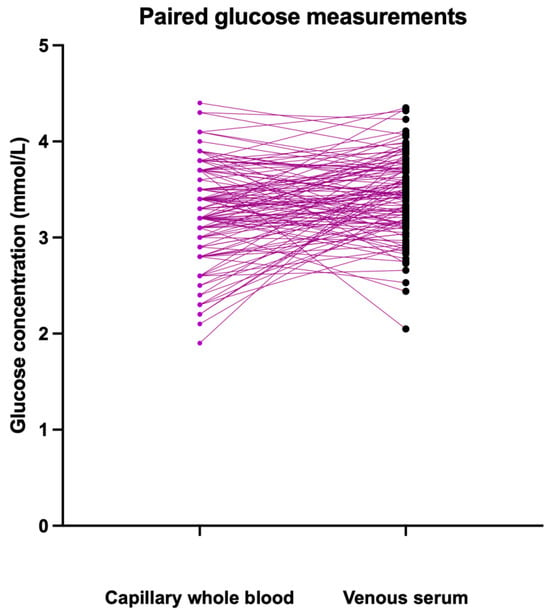
Mean capillary whole-blood glucose concentration was 3.27 ± 0.51 mmol/L, whereas mean venous serum glucose concentration was 3.44 ± 0.42 mmol/L. The mean paired difference (venous serum − capillary whole blood) was 0.17 mmol/L (95% CI: 0.06–0.27 mmol/L; p = 0.0018) (Table 1). The paired differences did not significantly deviate from a normal distribution (Shapiro–Wilk W = 0.983, p = 0.150), supporting the use of the paired t-test. The individual paired measurements are shown in Figure 2.
Table 1.
Comparison of capillary whole-blood and venous serum glucose concentrations.
Figure 2.
Paired capillary whole-blood and venous serum glucose measurements obtained during the same sampling event. Each line connects the two measurements from one paired observation.
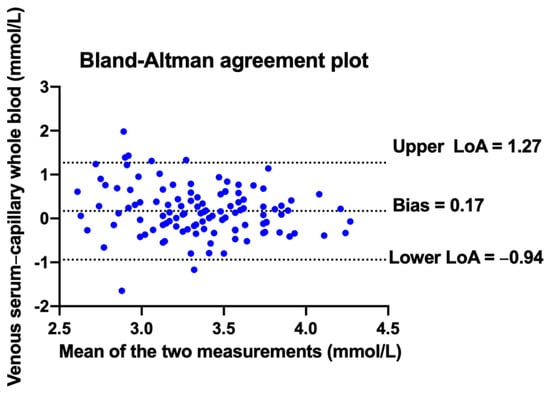
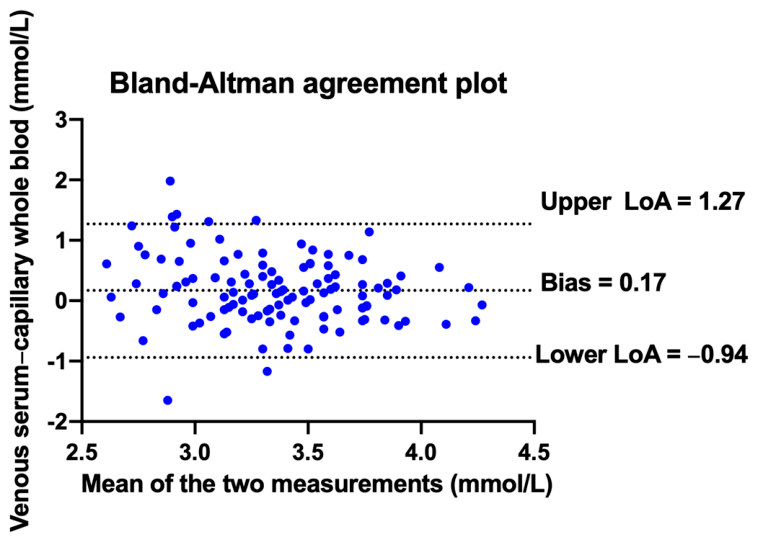
Bland–Altman analysis showed a mean difference of 0.17 mmol/L, with 95% limits of agreement from −0.94 to 1.27 mmol/L (Figure 3). A significant proportional bias was detected (β = −0.302; 95% CI: −0.562 to −0.042; p = 0.023).
Figure 3.
Bland–Altman plot showing the difference between venous serum and capillary whole-blood glucose concentrations against the mean of the two measurements. The solid line indicates the mean difference, and the dashed lines indicate the 95% limits of agreement.
3.2. Association and Agreement Between Capillary and Venous Serum Glucose Measurements
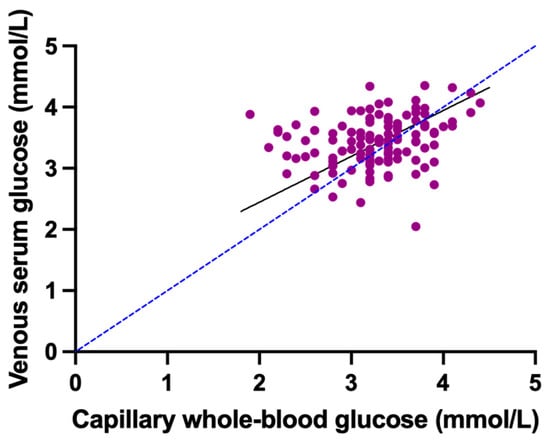
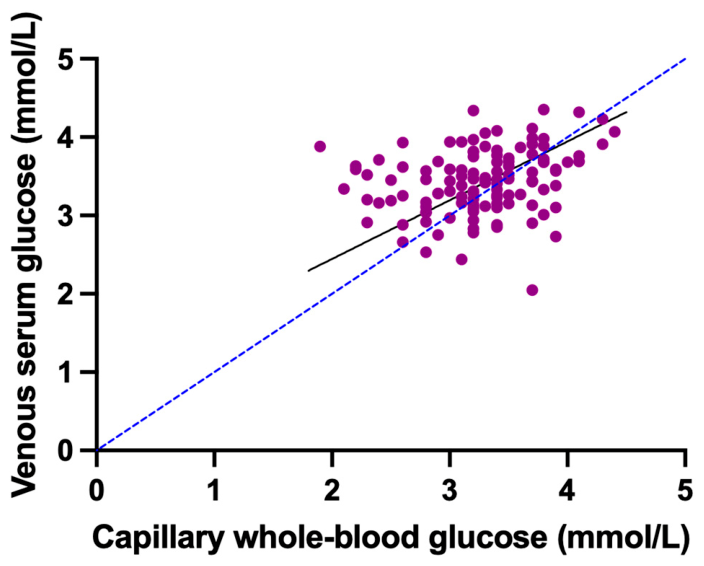
Passing–Bablok regression yielded the equation: venous serum glucose = 0.945 + 0.750 × capillary whole-blood glucose (Figure 4). The slope was 0.750 (95% CI: 0.580–0.967), and the intercept was 0.945 mmol/L (95% CI: 0.220–1.537). Because the 95% CI for the slope did not include 1 and the 95% CI for the intercept did not include 0, the Passing–Bablok analysis indicated both proportional and constant bias between the two measurement approaches.
Figure 4.
Passing–Bablok regression of venous serum glucose concentrations on capillary whole-blood glucose concentrations. The solid line represents the Passing–Bablok regression line, and the dashed line represents the line of identity (y = x).
Pearson correlation analysis showed a weak positive association between capillary whole-blood and venous serum glucose concentrations (r = 0.267). Lin’s concordance correlation coefficient was 0.246 (95% CI: 0.073–0.411), with a bias-correction factor (Cb) of 0.922, indicating limited concordance between the two measurement approaches.
The anonymized dataset containing all 117 paired measurements from 93 individual animals is provided in Supplementary Table S1.
3.3. Categorical Agreement of Glucose Classification
Categorical agreement between the two measurement approaches was limited (Cohen’s κ = 0.241; 95% CI: 0.089–0.397; Table 2). Overall, 70 of 117 paired measurements (59.8%) were classified into the same glucose category by both approaches, whereas 47 measurements (40.2%) were classified differently. Concordant classification occurred in 48 observations within the 2.5–3.5 mmol/L category and in 22 observations within the >3.5 mmol/L category. Only two observations had venous serum glucose concentrations < 2.5 mmol/L, and neither was classified in the corresponding low-glucose category by the handheld meter.
Table 2.
Cross-classification and categorical agreement between capillary whole-blood glucose measurements obtained using the handheld glucose meter and venous serum glucose measurements obtained using the laboratory method.
4. Discussion
The present study evaluated the agreement between capillary blood glucose concentrations measured using a handheld glucometer and venous serum glucose concentrations determined by laboratory analysis in dairy cows without clinical signs of disease. Although the mean difference was relatively small (0.17 mmol/L), capillary whole-blood glucose concentrations obtained using the handheld meter were, on average, lower than venous serum glucose concentrations determined using the laboratory method. Because sampling site, sample matrix, preanalytical handling, and analytical method differed simultaneously, the observed difference cannot be attributed solely to analytical bias of the handheld device. Similar systematic differences between handheld glucometers and laboratory reference methods have been reported previously in cattle, although the magnitude of agreement has varied considerably between studies and devices [7,9,11]. These findings indicate that the two measurement approaches should not be considered interchangeable for glucose determination in individual dairy cows.
4.1. Agreement Between Capillary and Venous Glucose Measurements
The paired comparison and Bland–Altman analyses demonstrated limited agreement between the handheld glucometer and the laboratory reference method. Although the mean difference between the two measurement approaches was only 0.17 mmol/L, the 95% limits of agreement were considerably wider (−0.94 to 1.27 mmol/L). Previous studies have reported inconsistent agreement between handheld glucometers and laboratory glucose measurements, with analytical performance varying according to the device evaluated, blood sample type, and analytical methodology [6,7,8,9,10].
Importantly, correlation and agreement describe different aspects of method comparison [15,18]. Pearson correlation showed only a weak positive association between the two measurements (r = 0.267). More importantly, Lin’s concordance correlation coefficient was low (CCC = 0.246), despite a relatively high bias-correction factor (Cb = 0.922). The relatively high Cb indicates that systematic deviation from the line of identity was limited, suggesting that the low concordance was mainly related to poor precision and wide scatter of individual measurements rather than a large overall shift between the two approaches. A significant proportional bias was also detected (β = −0.302; p = 0.023). The negative slope indicates that the difference between venous serum and capillary whole-blood glucose decreased as the average glucose concentration increased. Thus, capillary measurements tended to be relatively lower than venous serum measurements at the lower end of the glucose range, while the difference became smaller and could reverse at higher glucose concentrations. This pattern may be related to differences in sample matrix or to the calibration of a human-use glucose meter when applied to bovine blood. However, the present study design does not allow these effects to be separated. These findings further illustrate that correlation alone is insufficient to assess agreement between two analytical methods [15]. The Bland–Altman findings therefore provide a more clinically relevant indication of interchangeability than correlation alone [16,18].
Lopes et al. [9] evaluated six handheld glucose meters designed for human use and reported substantial device-dependent differences in agreement with laboratory measurements. In the present study, the weak association, low concordance, wide limits of agreement, and proportional bias indicate limited agreement between the two measurement approaches at the individual-cow level. These findings support previous evidence that handheld glucose meter performance is device- and protocol-specific and should be evaluated under the intended conditions of use before clinical implementation in cattle [5,7,8,9,10].
4.2. Physiological and Technical Factors Influencing Glucose Measurements
Several physiological and technical factors may explain the small systematic difference observed between capillary blood and venous serum glucose concentrations. Differences between capillary whole-blood and venous serum glucose concentrations may reflect local tissue perfusion, glucose exchange between blood and peripheral tissues, and possible dilution of capillary samples by tissue fluid [5,7,10]. At the vulvar mucosa sampling site, a small capillary blood drop may contain a variable amount of interstitial fluid, particularly if local tissue compression occurs during sample collection. This could contribute to lower measured glucose concentrations. Future studies should further evaluate this potential source of variation, for example by assessing hematocrit or other suitable indicators of sample quality. In addition, analytical differences between the two methods should be considered. The Accu-Chek® Instant is intended for human blood glucose monitoring and reports plasma-equivalent glucose values under its intended use conditions [12,13]; however, whether this calibration performs similarly in bovine blood is uncertain [5,8,9]. In contrast, serum glucose was determined using a standardized glucose oxidase–peroxidase method on an automated biochemical analyzer with routine internal quality-control procedures. Differences in sample matrix, hematocrit, species-specific erythrocyte characteristics, and calibration algorithms may therefore contribute to the limited agreement observed in the present study [5,8,9].
Preanalytical handling may also have contributed to the observed differences. Capillary glucose was measured immediately after collection, whereas venous blood was transported before serum separation and laboratory analysis. Continued cellular glycolysis before serum separation may decrease glucose concentration [19]; however, such an effect would be expected to lower, rather than increase, venous serum glucose. The ambient temperature during capillary measurements (8–12 °C) was within the operating temperature range specified by the manufacturer for the Accu-Chek® Instant [12]. However, measurements performed near the lower end of the specified range may still contribute to variability in test-strip performance and cannot be completely excluded as a source of imprecision.
4.3. Clinical Implications
From a practical perspective, handheld glucometers provide rapid results, are easy to use, and can be applied directly under farm conditions. Although the mean difference was small, 47 of 117 paired measurements (40.2%) were classified into different glucose categories by the two approaches. This categorical disagreement is clinically more relevant than the mean difference alone because different classification may affect interpretation when glucose concentrations are close to a clinical decision threshold. However, the observed systematic bias together with the weak correlation and limited agreement with the laboratory reference method indicate that the evaluated handheld glucometer should not be considered interchangeable with laboratory analysis. Laboratory confirmation remains advisable whenever accurate glucose determination is required, particularly in animals with suspected metabolic disorders or when glucose concentrations are close to clinical decision thresholds. Only two observations had venous serum glucose concentrations < 2.5 mmol/L, and neither was classified in the corresponding low-glucose category by the handheld meter. This number was too small to reliably estimate the sensitivity of the handheld approach for detecting hypoglycemia. Therefore, the present dataset does not allow reliable assessment of diagnostic performance in the low-glucose range. Accordingly, capillary whole-blood measurements obtained using the handheld meter should not be considered interchangeable with laboratory venous serum glucose measurements, particularly when values are close to clinical decision thresholds.
4.4. Strengths and Limitations
One strength of this study was the paired sampling design, with capillary and venous blood samples collected during the same sampling event under routine commercial dairy farm conditions. This approach minimizes biological variation between animals and increases the clinical relevance of the comparison.
The principal limitation of this study is that sampling site, sample matrix, preanalytical handling, and analytical method differed simultaneously between the two measurement approaches. Consequently, the present design cannot distinguish the relative contributions of sampling-site effects, matrix effects, preanalytical factors, and device-specific analytical bias to the observed disagreement. Measuring venous whole blood with the handheld glucose meter would have allowed a clearer separation of sampling-site effects from device-related effects; however, this comparison was not included in the original study design. Several limitations should also be acknowledged. First, the study population consisted exclusively of dairy cows without clinical signs of disease, resulting in a relatively narrow range of glucose concentrations. Only two observations had venous serum glucose concentrations below 2.5 mmol/L, which limits interpretation of performance at low glucose concentrations. In addition, BHBA, NEFA, and other metabolic biomarkers were not assessed; therefore, subclinical metabolic disorders could not be excluded. Consequently, the agreement observed in this study may not fully represent device performance in cows with severe metabolic disturbances such as clinical ketosis, hypoglycemia, or other diseases associated with altered glucose metabolism. The study was conducted on a single farm and evaluated one handheld glucose meter model, which may limit generalizability to other herds, management systems, and devices.
4.5. Future Perspectives
Future studies should evaluate handheld glucometers across a broader range of physiological and pathological conditions, particularly during the transition period and in cows affected by metabolic diseases. Future validation studies should include a larger number of animals with low glucose concentrations, including cows with suspected ketosis or hypoglycemia, to allow a more reliable assessment of diagnostic performance in the clinically relevant low-glucose range. Additional studies should specifically evaluate the effects of hematocrit, peripheral perfusion, tissue-fluid contamination, sample temperature, and preanalytical handling on capillary-to-venous glucose differences. Future method-comparison studies should measure glucose in the same venous blood sample using both the handheld meter and the laboratory method, while obtaining a paired capillary sample concurrently. This design would allow the effects of sampling site, sample matrix, and analytical method to be evaluated separately. The development of calibration algorithms specifically adapted for bovine blood may further improve agreement between handheld devices and laboratory reference methods [5,8,9].
5. Conclusions
Under the conditions of this study, capillary whole-blood glucose measurements obtained using the Accu-Chek® Instant were not interchangeable with venous serum glucose measurements determined using the laboratory method. Although the mean difference was small (0.17 mmol/L), individual differences were wide, concordance was low, proportional bias was present, and 40.2% of paired measurements were classified into different glucose categories. Because sampling site, sample matrix, preanalytical handling, and analytical method differed simultaneously, the observed disagreement cannot be attributed solely to the handheld device. Laboratory confirmation remains appropriate when precise glucose determination is required or when results are close to clinical decision thresholds.
Supplementary Materials
The following supporting information can be downloaded at: https://www.mdpi.com/article/10.3390/dairy7050091/s1, Table S1: Anonymized paired capillary whole-blood and venous serum glucose measurements from 117 paired observations obtained from 93 individual animals.
Author Contributions
Conceptualization, R.A. and D.M.; methodology, D.M., M.T., R.A. and G.R.G.O.; validation, D.M., M.T. and R.A.; formal analysis, D.M. and P.K.; investigation, D.M., M.T., M.C.S., G.L., G.Š., S.G. and A.G.; resources, R.A.; data curation, D.M., M.T., M.C.S., G.L., G.Š., S.G. and A.G.; writing—original draft preparation, D.M.; writing—review and editing, D.M., M.T., R.A., G.R.G.O., P.K. and V.R.; visualization, D.M.; supervision, R.A., G.R.G.O. and P.K.; project administration, D.M. All authors have read and agreed to the published version of the manuscript.
Funding
This research received no external funding.
Institutional Review Board Statement
The animal study protocol was approved by the State Food and Veterinary Service of the Republic of Lithuania (VMVT) (Approval No. G2-298, approved on 10 March 2025).
Informed Consent Statement
Not applicable. The animals were owned by the LSMU Practical Training and Testing Centre, and permission to conduct the study was obtained from the administration of the Centre.
Data Availability Statement
The original data supporting the conclusions of this article are included in the Supplementary Materials (Table S1). Further inquiries can be directed to the corresponding author.
Acknowledgments
During the preparation of this manuscript, the authors used ChatGPT (OpenAI; ChatGPT Plus subscription) to improve the English language, refine the scientific writing, enhance the clarity of the manuscript, and assist in the visual arrangement of Figure 1, including the placement of illustrative elements within the author-designed schematic workflow. The authors reviewed and edited all generated content and take full responsibility for the final version of the manuscript.
Conflicts of Interest
The authors declare no conflicts of interest.
References
- Aschenbach, J.R.; Kristensen, N.B.; Donkin, S.S.; Hammon, H.M.; Penner, G.B. Gluconeogenesis in dairy cows: The secret of making sweet milk from sour dough. IUBMB Life 2010, 62, 869–877. [Google Scholar] [CrossRef] [Scilit] [PubMed]
- Drackley, J.K. Biology of dairy cows during the transition period: The final frontier? J. Dairy Sci. 1999, 82, 2259–2273. [Google Scholar] [CrossRef] [Scilit] [PubMed]
- Gross, J.J.; Bruckmaier, R.M. Review: Metabolic challenges in lactating dairy cows and their assessment via established and novel indicators in milk. Animal 2019, 13, s75–s81. [Google Scholar] [CrossRef] [Scilit] [PubMed]
- Daros, R.R.; Weary, D.M.; von Keyserlingk, M.A.G. Invited review: Risk factors for transition period disease in intensive grazing and housed dairy cattle. J. Dairy Sci. 2022, 105, 4734–4748. [Google Scholar] [CrossRef] [Scilit] [PubMed]
- Gerber, K.L.; Freeman, K.P. ASVCP guidelines: Quality assurance for portable blood glucose meter (glucometer) use in veterinary medicine. Vet. Clin. Pathol. 2016, 45, 10–27. [Google Scholar] [CrossRef] [Scilit] [PubMed]
- Wittrock, J.A.M.; Duffield, T.F.; LeBlanc, S.J. Short communication: Validation of a point-of-care glucometer for use in dairy cows. J. Dairy Sci. 2013, 96, 4514–4518. [Google Scholar] [CrossRef] [Scilit] [PubMed]
- Mair, B.; Drillich, M.; Klein-Jöbstl, D.; Kanz, P.; Borchardt, S.; Meyer, L.; Schwendenwein, I.; Iwersen, M. Glucose concentration in capillary blood of dairy cows obtained by a minimally invasive lancet technique and determined with three different hand-held devices. BMC Vet. Res. 2016, 12, 34. [Google Scholar] [CrossRef] [Scilit] [PubMed]
- Megahed, A.A.; Hiew, M.W.H.; Townsend, J.R.; Messick, J.B.; Constable, P.D. Evaluation of an electrochemical point-of-care meter for measuring glucose concentration in blood from periparturient dairy cattle. J. Vet. Intern. Med. 2015, 29, 1718–1727. [Google Scholar] [CrossRef] [Scilit] [PubMed]
- Lopes, R.B.; Valldecabres, A.; Silva-del-Río, N. Technical note: Glucose concentration in dairy cows measured using 6 handheld meters designed for human use. J. Dairy Sci. 2019, 102, 9401–9408. [Google Scholar] [CrossRef] [Scilit] [PubMed]
- López, C.; Hincapié, V.; Carmona, J.U. Comparison of two methods for the measurement of blood plasma and capillary blood glucose in tropical highland grassing dairy cows. Animals 2023, 13, 3536. [Google Scholar] [CrossRef] [Scilit] [PubMed]
- Kendall, S.J.; Green, S.E.; Edwards, S.M.; Oetzel, G.R.; White, H.M. Validation of an on-farm portable blood analyzer for quantifying blood analytes in dairy cows. Res. Vet. Sci. 2024, 171, 105228. [Google Scholar] [CrossRef] [Scilit] [PubMed]
- Roche Diabetes Care. Accu-Chek® Instant Blood Glucose Monitoring System: Product Specification Sheet. Available online: https://www.accu-chek.co.uk/hcp/sites/g/files/papvje176/files/2022-05/Accu-Chek%20Instant%20Product%20Specification%20sheet%20%28Nov%202021%29.pdf (accessed on 15 September 2026).
- Roche Diabetes Care. Accu-Chek® Instant Test Strip Package Insert. Available online: https://www.accu-chek.co.uk/document/accu-chek-instant-test-strip-insert/download?inline= (accessed on 15 September 2026).
- Lin, L.I. A concordance correlation coefficient to evaluate reproducibility. Biometrics 1989, 45, 255–268. [Google Scholar] [CrossRef] [Scilit]
- Buczinski, S. Reliability associated with the measurement of continuous variables in veterinary medicine: What the different possible indicators tell, and how to use and report them. Animals 2023, 13, 2793. [Google Scholar] [CrossRef] [Scilit] [PubMed]
- Bland, J.M.; Altman, D.G. Statistical methods for assessing agreement between two methods of clinical measurement. Lancet 1986, 1, 307–310. [Google Scholar] [CrossRef] [Scilit]
- Passing, H.; Bablok, W. A new biometrical procedure for testing the equality of measurements from two different analytical methods. Application of linear regression procedures for method comparison studies in clinical chemistry, Part I. J. Clin. Chem. Clin. Biochem. 1983, 21, 709–720. [Google Scholar] [CrossRef] [Scilit] [PubMed]
- Moore, A.R. A review of Bland–Altman difference plot analysis in the veterinary clinical pathology laboratory. Vet. Clin. Pathol. 2024, 53, 75–85. [Google Scholar] [CrossRef] [Scilit] [PubMed]
- Kang, P.; Wolf, C.E.; Thomas, V.L.; Melanson, S.E.F.; Tolan, N.V. Preanalytic considerations for preventing in vitro glycolysis: Practical recommendations for fasting and glucose tolerance testing. Diabetes Care 2026, 49, e24–e25. [Google Scholar] [CrossRef] [Scilit] [PubMed]

Disclaimer/Publisher’s Note: The statements, opinions and data contained in all publications are solely those of the individual author(s) and contributor(s) and not of MDPI and/or the editor(s). MDPI and/or the editor(s) disclaim responsibility for any injury to people or property resulting from any ideas, methods, instructions or products referred to in the content. |
© 2026 by the authors. Licensee MDPI, Basel, Switzerland. This article is an open access article distributed under the terms and conditions of the Creative Commons Attribution (CC BY) license.