


Abstract
Batteries, especially useful for portable instruments, are the most widely used alternative to direct current. Their operating principle is based on irreversible or reversible chemical reactions, which are called primary (non-rechargeable) or secondary (rechargeable), respectively. Primary batteries never completely discharge and their residual charge depends on the energy demand of the instrument in which they are used. Even if correctly disposed of, therefore, and with the possibility of recycling the constituent materials and purchasing and using consciously, only 2 of the 3Rs, namely “Recycle” and “Reuse”, are respected; recovering the residual charge would also allow compliance with the last of the 3Rs, namely “Reduce”. Direct energy recovery methods have been proposed but the simplest method to “reduce”, analogously to what is done with secondary batteries, remains being recharging, which, unfortunately, is a risky operation, as it can cause the battery to explode or leak corrosive solution. Following our previous research, in which we proposed a method for measuring the residual charge of alkaline batteries, we now propose a method for charging the batteries whose residual charge we measured in our previous work. In this research, a hand-built external circuit, Arduino UNO R3, was used to generate the charging pulses and as a controller and measuring instrument and an Open-Source protocol for the recharging process. The results demonstrated the feasibility of the method, as the voltage of 50% of the batteries increased and, further, only 18% of the batteries leaked and none exploded.
1. Introduction
Chemical reactions can be irreversible or reversible; in the case of redox reactions used to make batteries, we obtain primary (non-rechargeable) or secondary (rechargeable) batteries, respectively. Growing attention to environmental issues has led to the 3R paradigm (Reduce, Reuse, Recycle). Secondary batteries comply with all 3Rs even if, due to the use of PTFE (polytetrafluoroethylene) solution to produce the anode, a minimum of 50 charge cycles is necessary to allow a robust reduction in the potential environmental impact [1]. Primary batteries, even when purchased and used wisely, cannot comply with the “reuse” R. Furthermore, depending on the energy needs of the device in which they are used, they never fully discharge, resulting in energy waste; a significant energy waste occurs when assembled battery packs are disposed of because they are apparently discharged when in reality only one of them is.
Direct energy recovery methods have been proposed [2], but the simplest method for achieving “reuse”, analogously to what is done with secondary batteries, remains being recharging. Taking into account the huge amount of batteries used and disposed of, this waste of energy calls for studies on recovery methods. According to a report by the European Portable Battery Association, approximately 295,000 tonnes (or an estimated 12 billion units) of portable batteries were placed on the market in the EEA plus Switzerland in 2022 [3]; in the same year, close to one-half (46%) of the portable batteries and accumulators sold in the EU were collected, from 2009 to 2022, the collected amount doubled [4].
There is practically no literature on the recharging of alkaline primary batteries. In the 1990s, some electronics magazines proposed DIY (Do It Yourself) charging projects [5]. The only real bibliographic reference is a communication at an IEEE conference [6], but a constant current charging method is always used, which is highly unsuitable for this application. Using constant voltage and/or constant current certainly leads to damaging the alkaline battery, perhaps leading to a dangerous explosion. Other charging methods must be found [7]. To improve the response to the 3R paradigm [8,9], it is necessary to propose a safer charging approach.
The literature, instead, reports some attempts to produce rechargeable alkaline batteries. On the market, over the years, some alkaline rechargeable batteries have been seen, not to be confused with the “new” Zinc Ion secondary batteries (ZIB, or Ni-Zn) which use neutral or weakly acidic solutions as electrolyte, produce 1.6 V at rest, and also present various crystallographic forms of MnOx in the cathode, as described in a 2021 thesis [10].
In the 1990s, several studies were conducted on the production of rechargeable alkaline batteries obtained by modifying both the chemical composition and the shape of the electrodes [11]. These batteries were marketed under various brands, including the 1300 mA Rayovac (now Energizer), the 1600 mA Pure Energy (https://aphnetworks.com/article_images/reviews/pure_energy_xl/xlaa_tds.pdf, accessed on 17 May 2026), Envirocell, Alkava from Korea, and Demacell in Swedish. A comprehensive timeline of all attempts to produce rechargeable alkaline batteries is provided in a single-page but richly referenced paper [12]. This type of battery was perhaps unsuccessful both because of the low number of possible charge cycles and because of its initial capacity (about half that of a normal alkaline battery), which halves after a few charges [13]. The industry has also produced specific integrated circuits for recharging this type of alkaline battery, such as Unitrode with BQ2902/03 [14], and in the bibliography we also find some articles comparing some commercial “chargers” for this type of battery [15].
Given the wide range of applications, there are probably hundreds of types of batteries (used in pacemakers or cruise missiles) that differ in shape (cylindrical, prismatic or button) and chemical composition (see Table S1).
They can be purchased at easily accessible locations such as electronics stores, supermarkets, shopping malls, and hardware stores. Most are disposable primary batteries, but rechargeable batteries are often also available in the same stores. Commonly used portable batteries are designed to be “stackable” with each other and come in one of the following common sizes: LR8D425 (AAAA), LR03 (AAA), LR6 (AA), LR23 (A), LR12 (B), LR14 (C), LR20 (D), LR25 (F), LR1 (N), 8LR932 (A23), 8LR732 (A27), 3LR12 (4.5 V), 6LR61 (9 V PP3), 4LR25Y (6 V lantern), 2R10 (BP1-3 V), 4LR61 (J), and others such as camera batteries, button batteries, etc.
In our previous study, we chose to measure the residual charge of AA alkaline batteries because, due to their high availability and affordability, they serve as a primary power source for both consumers and industrial applications, making them the most prevalent battery size across North America [16].
Alkaline battery manufacturers state in their datasheets [17,18] (and often also on the battery itself) that they are not rechargeable; for example, in the technical datasheet Duracell [19] we can read: 7.3 Charging; All batteries listed in this bulletin are of the primary type and are not designed to be recharged. Attempts to recharge an alkaline battery may cause an imbalance within the cell, leading to gassing and possibly explosion on either charge or discharge cycles.
A detailed description of the chemical reactions taking place in an alkaline battery is given in the doctoral thesis [20] and many studies on the cathodic discharge mechanism are available in the literature, just as an example by using Raman spectroscopy, FT-IR, SEM-ED and XR-PD analysis [21].
Anyway, the two simplified reactions are [22]:
Cathode: MnO2 + H2O + e− → MnOOH + OH−
MnOOH + H2O + e− → Mn(OH)2 + OH−
MnOOH + H2O + e− → Mn(OH)2 + OH−
Anode: Zn + 4OH− → Zn(OH)42− + 2e−
The pH of the electrolyte is particularly important for the cathodic reaction [23], but even more important are the crystalline forms of Mn, which, simplifying, we can identify as Ramsdellite > Groutellite > Groutite [24]. Manganese, which in its various crystalline forms has important industrial applications across a wide range of sectors [25].
In fact, Jean Pannetier et al. [26] state that an alkaline battery can be recharged when less than 40% has reacted because the intermediate component HxMnO2 has the same structure (ramsdellite) as MnO2 so that the cathodic reaction is reversible; as the discharging continues, MnOOH (groutite) forms, which does not re-transform back into ramsdellite if H+ is taken out.
We must also take into account the suggestions of a now deceased French battery manufacturer [27] who probably knew his products well and with too much zeal gave suggestions contrary to planned obsolescence and the 3Rs, which had not yet been born, which we can quote: “Possibilités de réversibilité partielle. Les possibilités de réversibilité partielle des piles alcalines au bioxyde de manganèse peuvent être mises à profit pour réaliser, sous certaines conditions, une recharge électrique des piles alcalines. Cette recharge, par passage de courant inverse sous des conditions examinées plus loin, ne sera valable que si la cellule n’a subi qu’une décharge partielle. Si la cellule a été complètement déchargée, le nombre de cycles “charge-décharge” que l’on pourra effectuer sera réduit à quelques unités. Par contre, si chaque décharge est limitée à 20 ou 30% de la capacité de la pile dans le régime consi déré, il sera possible d’effectuer plusieurs dizaines de cycles “charge-décharge”. Pratiquement, on peut considérer que la décharge doit être arrêtée (dans la mesure où l’on désire atteindre les meilleures possibilités de recharge de la cellule) lorsque la tension de l’élément atteint, en service, la valeur de 1,25 V. Au-delà de 1,25 V. apparaissent des réactions chimiques irréversibles qui limiteront les possibilités de recharge.”
Before attempting to recharge it is necessary to know the state of the battery, both from a structural point of view and with regard to the remaining charge in order to evaluate the efficiency of the recharging process. Few studies on the residual charge still present in discarded alkaline batteries are available, among these our previous work which estimates the residual charge of an AA, using a microcontroller, through a short discharge controlled over time [28,29], a work which evaluates the energy left in discarded alkaline batteries by comparing two values in V at no load and with a known load [30], a paper instead studies the remaining power in the solar-cell battery by using a method to compute remaining power in the battery from its actually measured discharge characteristics [31]. It is worth mentioning studies that try to recover the residual charge of a battery before disposal and recycling [2], which is present in over 50% of the batteries we tested [28,29].
Instead, there are hundreds of studies on charging a secondary battery; an interesting review by E. Lemaire-Potteau et al. [7] presents various charging methods for secondary batteries, and a careful reading suggests a combination of pulse charging and burst charging to remove any gas bubbles that may have formed on the electrodes and depolarize the cell.
Regarding pulse charging, an interesting review by Wiljan Vermeer et al. [32] compares both the frequency and the waveform of dozens of research studies on the topic. We decided to use a frequency of a few Hz based on what Vermeer stated: “impedance is an equivalent circuit component which models diffusion processes and has a constant phase of 45°”. It describes the low-frequency behavior of the battery below 1 Hz and “More specifically, when charging with a pulse frequency equal to the minimum impedance frequency, ten out of twelve reviewed studies claim positive results” [32].
When charging a battery, even if not recommended as in the case of primary batteries, it is necessary to take into account the activation energy, which is the minimum energy required to start the electrochemical process that allows the reverse of the discharge process. It is therefore necessary to overcome an energy barrier to allow the charge transfer and start the conversion of electrical energy into chemical energy. It is not the aim of this work to calculate the value of the activation energy, as in [33], but it is necessary to take it into account in the circuit design.
One possible graph showing the activation energy involved in charging a lithium-ion battery is that shown in Figure 4 (our Figure S1 in the file type-composition-use-of-Alkaline-batteries.doc in Supplementary Materials) of the paper by Po-Tuan Chen et al., to quote: “Figure 4. Relative energy of reversing reaction of Li complex reduction” [34] (see the file type-composition-use-of-Alkaline-batteries.doc in Supplementary Materials).
To overcome the activation energy of an unfavorable reaction, we can use voltage pulses produced by discharging a capacitor.
A capacitor discharge pulse generator typically consists of a capacitor, a charging and discharging switch, and a load. A square wave generator [35] activates one or the other of the switches; when the discharging switch is closed, the capacitor discharges through the load, creating a voltage and current pulse. The characteristics of the pulse (e.g., duration, amplitude, shape) are determined by the capacitor’s capacitance, the load’s impedance, and the process time.
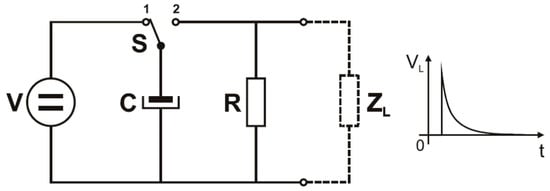
To attempt to recharge an alkaline battery, we built a circuit similar to that shown in the following Figure 1, copied from a paper by Matej Reberšek et al. [36]. The waveform is exactly that required to overcome the activation energy but without overcharging the battery; our experimental waveform is instead reported in the following Figure 12 (Section 2.5).
Figure 1.
A typical circuit of capacitor discharge, copied from a paper by Matej Reberšek et al., open source journal [36].
A similar circuit is also shown in Figure 1 of the paper by J. Bonthond et al. [37] where also values for the electronic components are provided; in Figure S2 we reported the Appendix A of a paper by Ernesto E Mazon Valadez et al. [38] were the use of MosFets as circuit switches and logic gates in the control circuit are shown.
2. Materials and Methods
For the instrument construction, we need:
- (a)
- An instrument, including the one we used in a previous study [28,29] to measure the battery’s state of charge, here during charging, and a protocol.
- (b)
- A square-wave signal generator to drive the charge module (CH in Figure 2).
- (c)
- A switch system to connect the battery alternately to the charging and the measurement system.
- (d)
- Software to manage the timing of each process and the values to be measured, comparing them with the set thresholds.
- (e)
- Software that transforms the obtained values into graphical form for easier comparison.
- (f)
- And, of course, a good number of AA alkaline batteries used to obtain simple statistics.
Arduino finds wide application in university teaching laboratories, for example in engineering education [39], but also in high school laboratories [40], and even in similar projects for monitoring rechargeable batteries [41]. To facilitate understanding of our instrument, it is built in modules (Figure 2), also with electrochemistry teaching in mind, and to facilitate the detection of any malfunctions. The modular construction does not compromise but rather improves the quality of the instrument, which must be comparable to a university laboratory-grade instrument.
Figure 2.
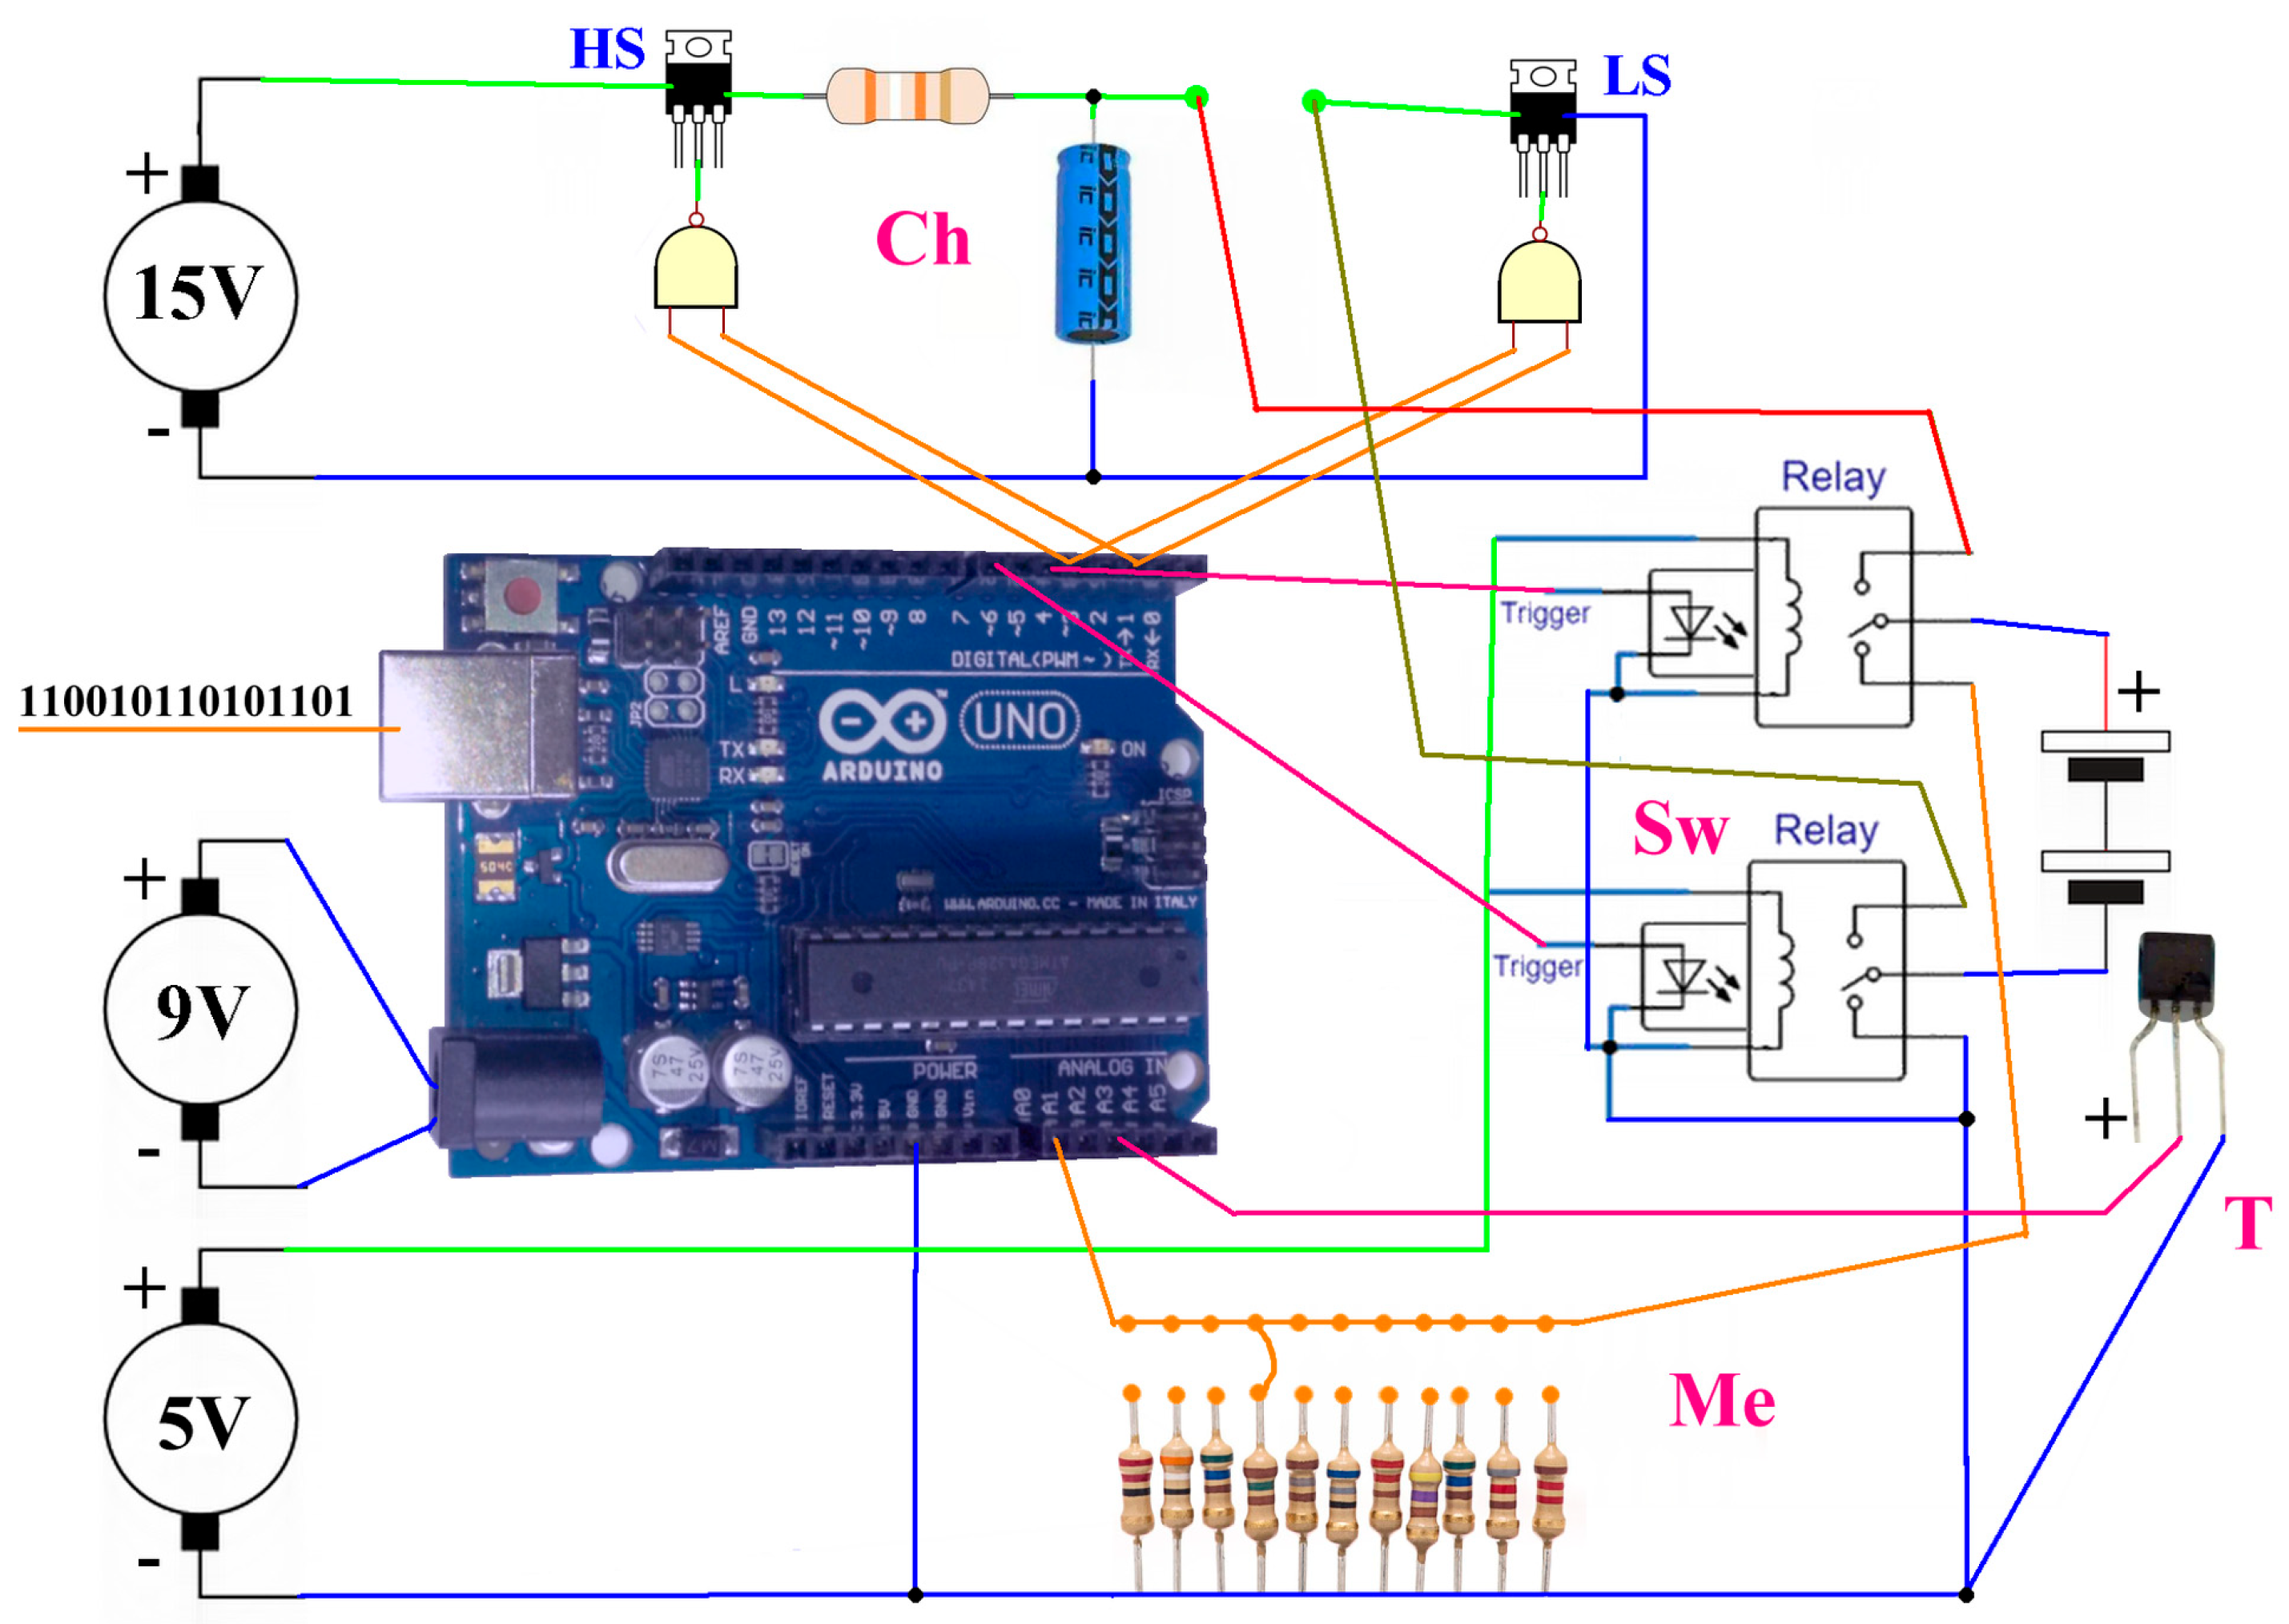
Block structure of the instrument: on the left the power supplies; at the top the battery charging module, Ch; in the center Arduino; on the right the switches, Sw, with the various connections; at the bottom, Me, the charge measurement module; and on the far right the temperature sensor, for monitoring the T of the battery compartment. Circuits are under Copyright CC BY-NC-ND 4.0 EN [42].
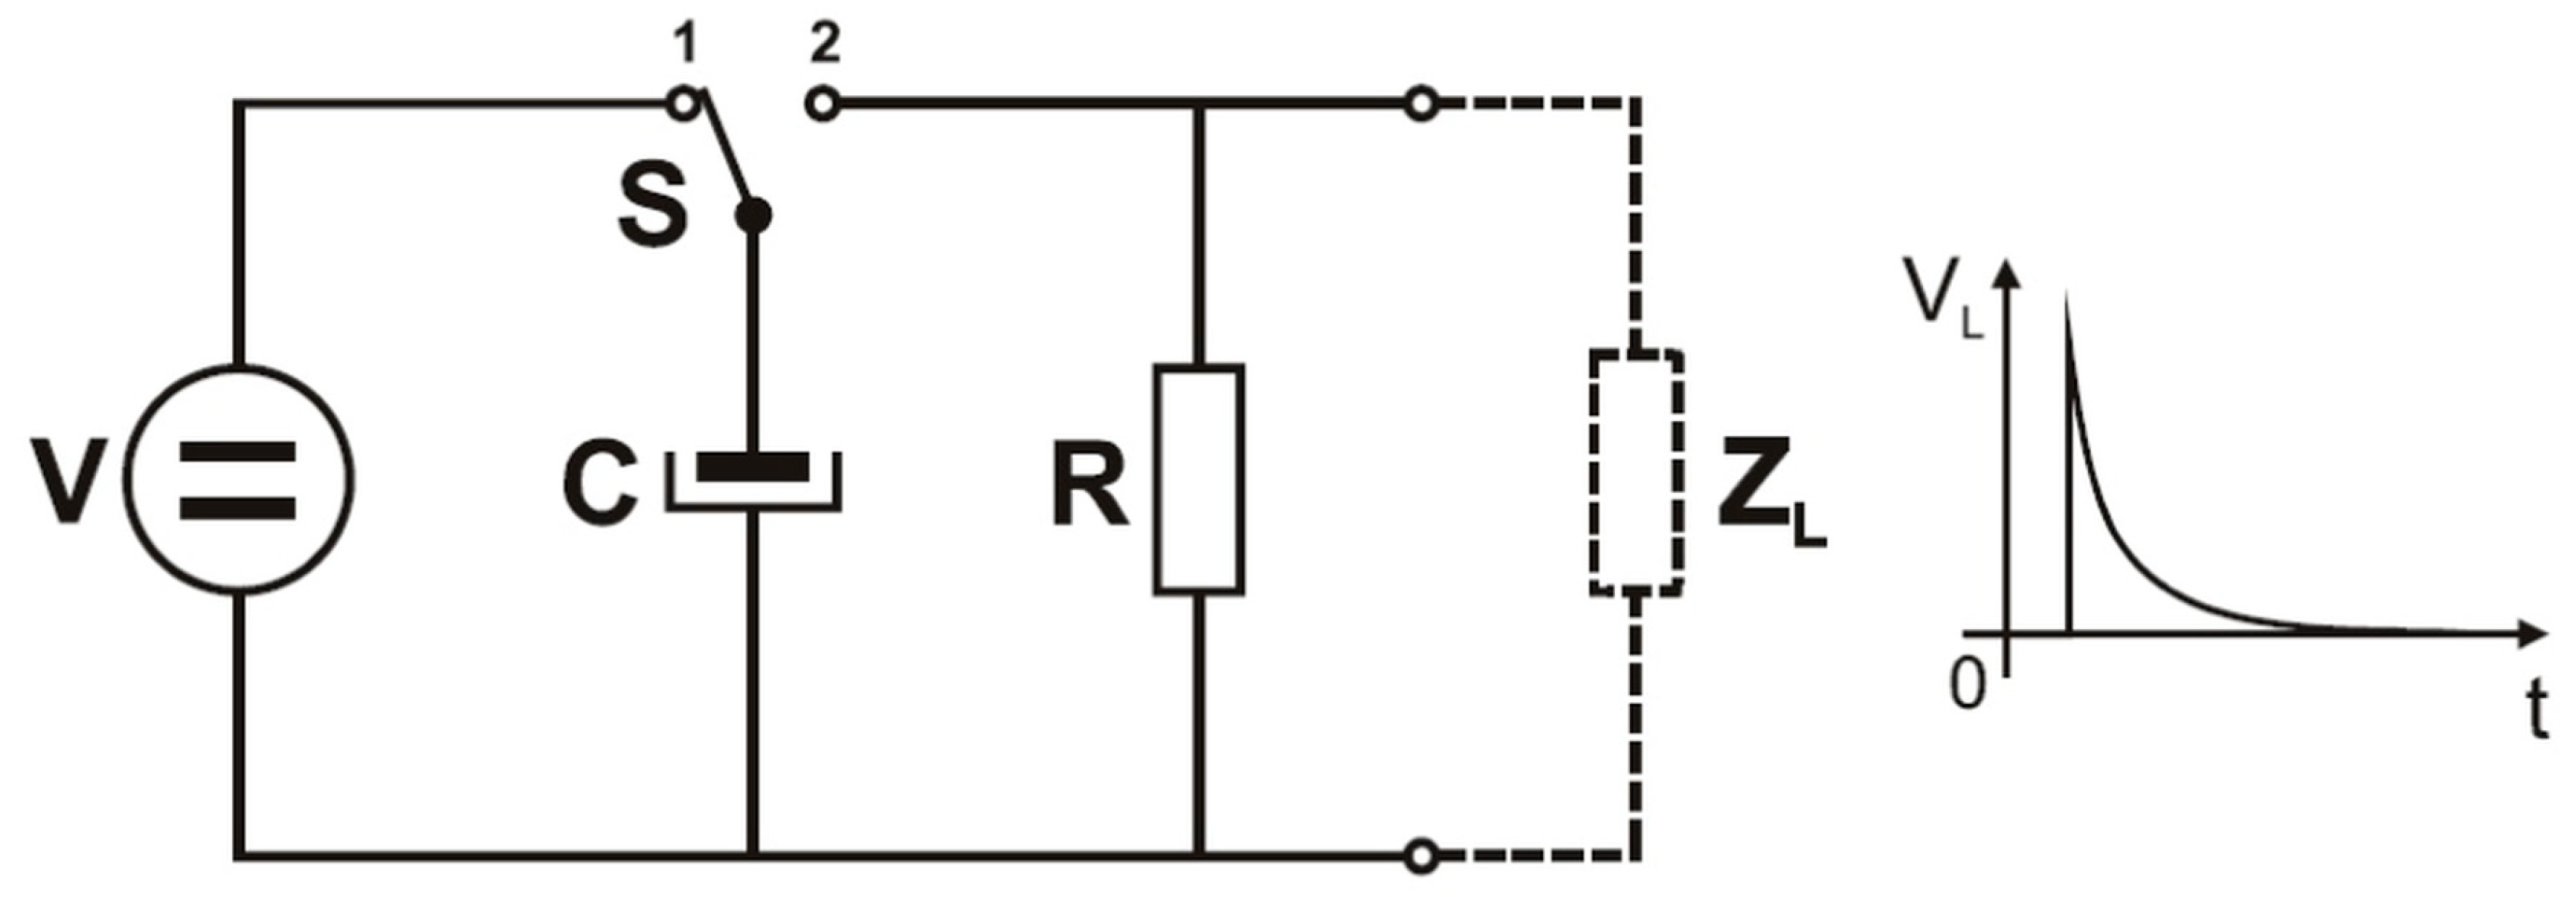
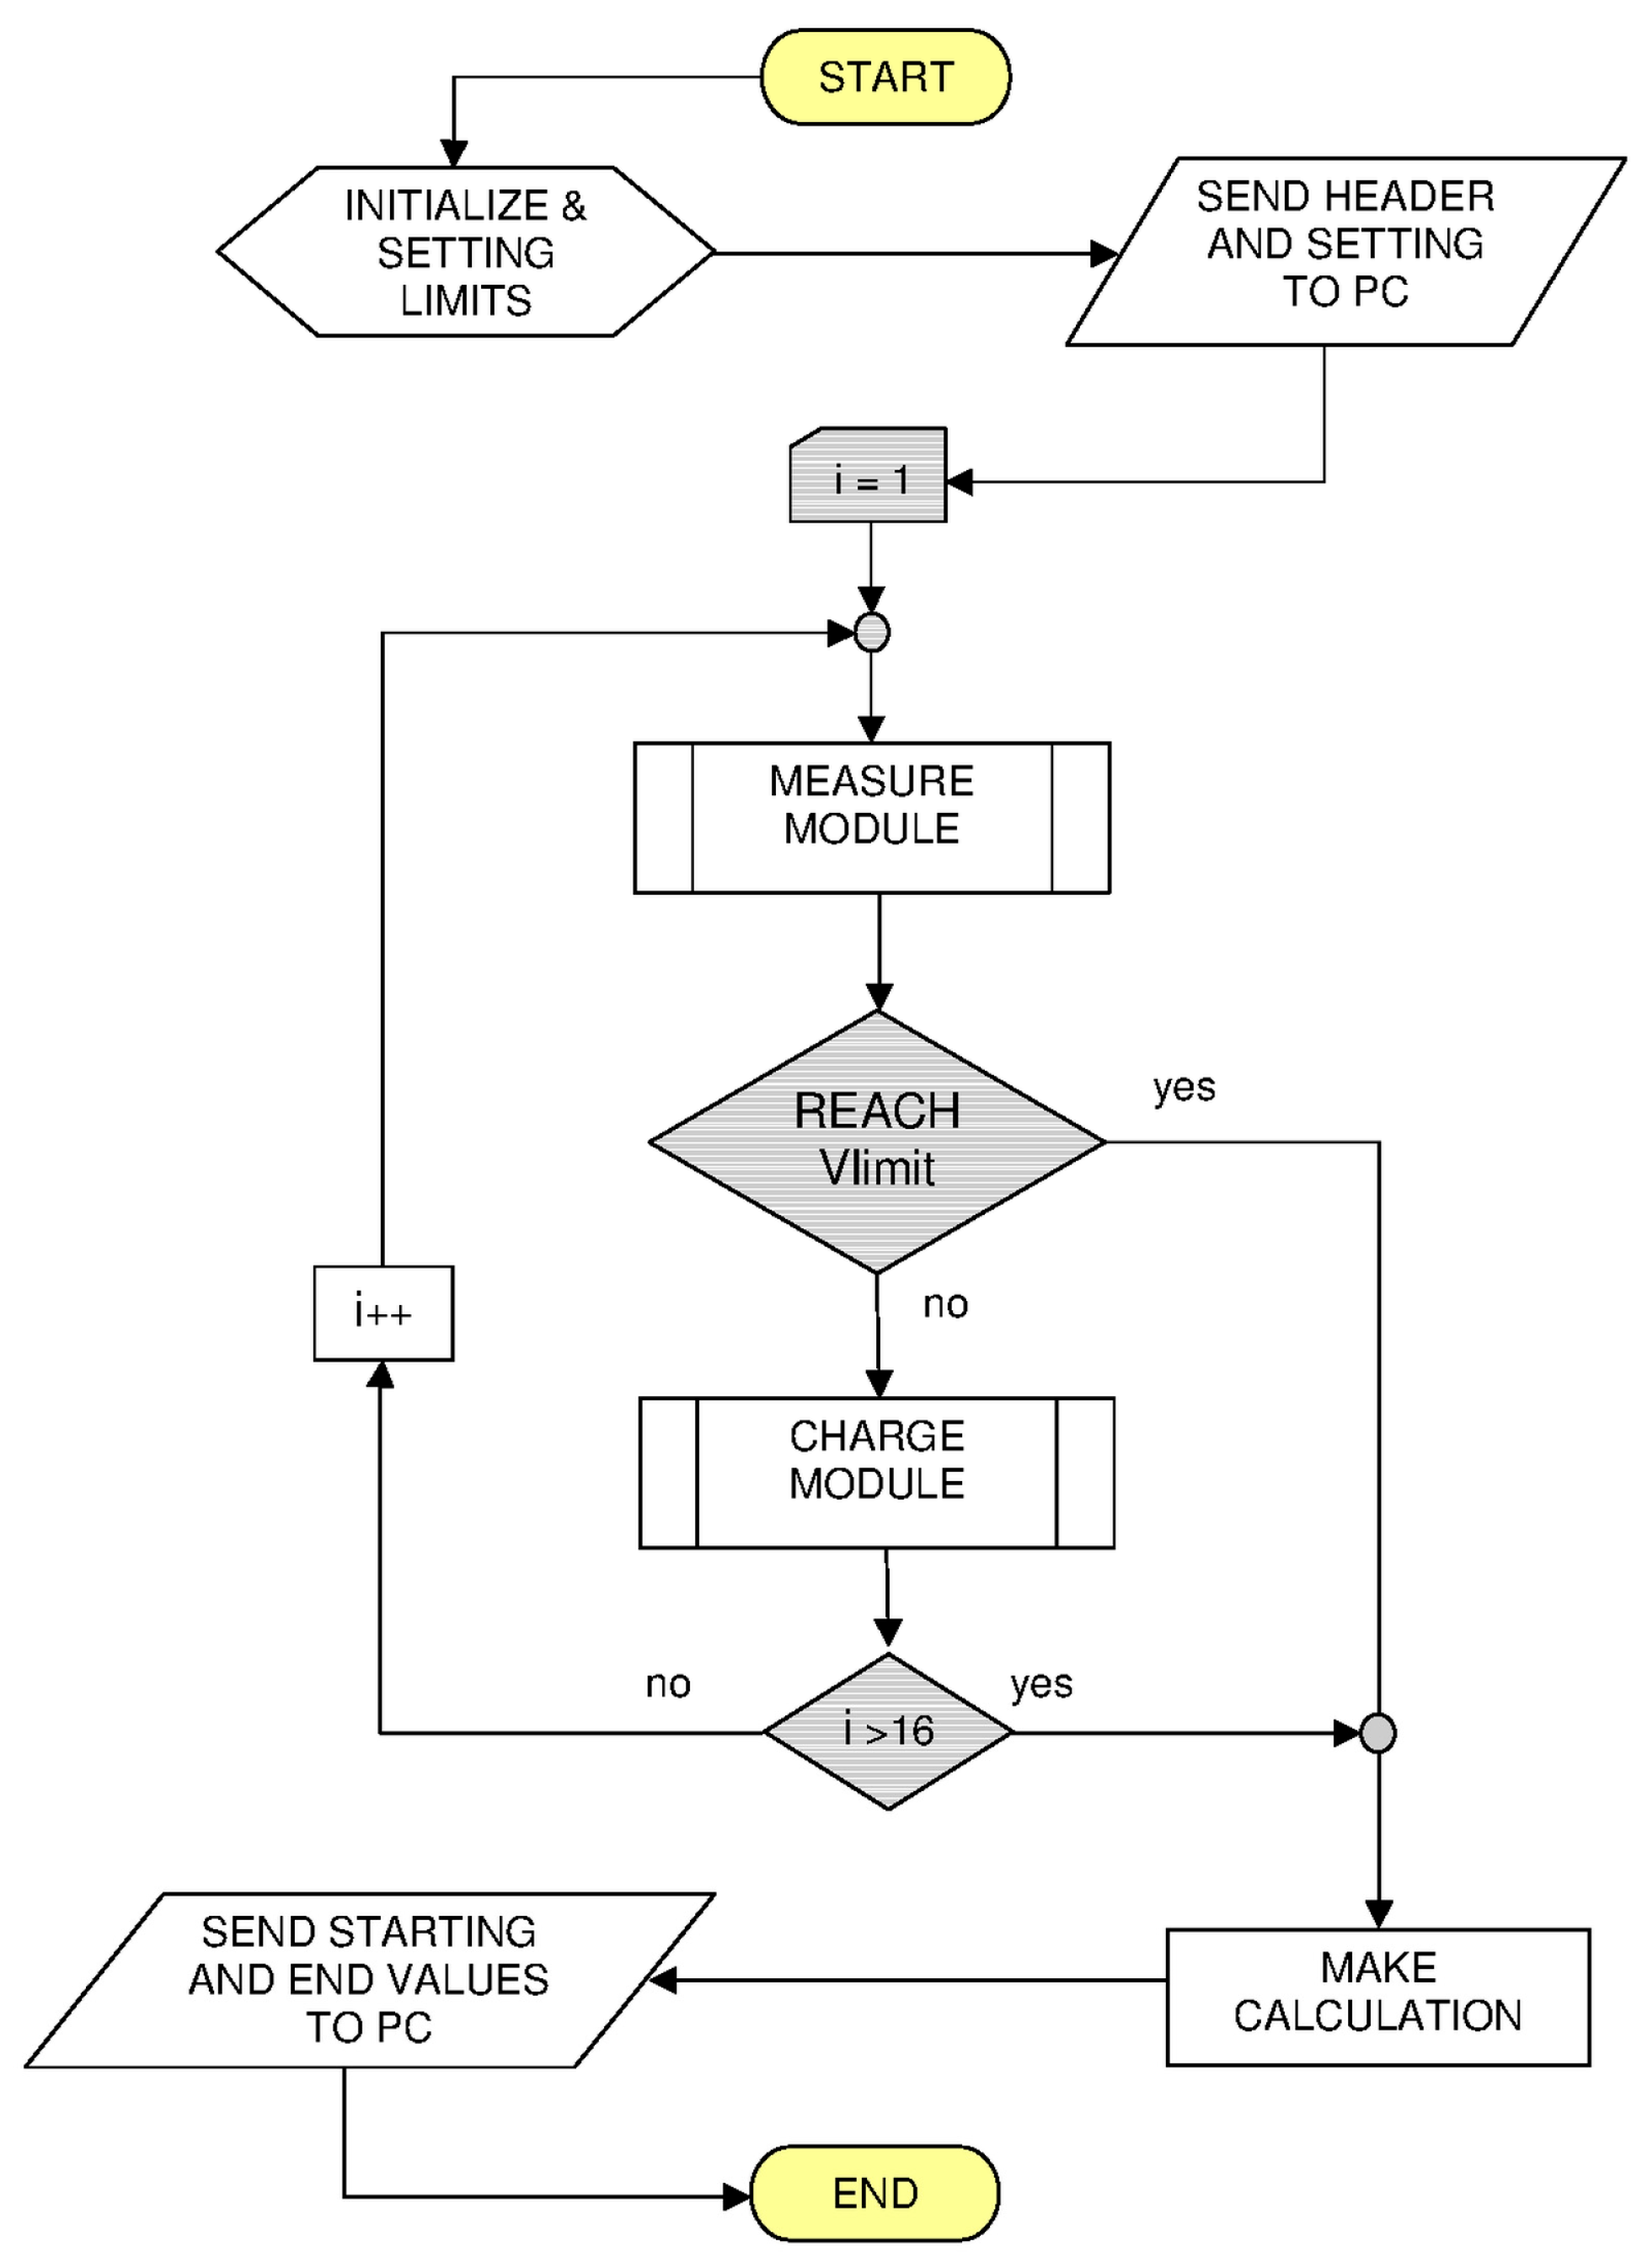
The entire protocol is presented as a flowchart in Figure 3; it includes two subroutines for measuring the battery voltage and for charging it, respectively; data is then elaborated and sent to a PC. After setting the parameters, the measurement subroutine starts by measuring the initial battery voltage. The measurement is repeated after each charging cycle until the set threshold voltage is reached. An oversampling subroutine [43] (already used in one of our previous works [28,29]) is used, which, by adding one bit to the Arduino converter, allows for halving the resolution, obtaining 2.44 mV at 5 V, which is more than sufficient for charging measurements.
Figure 3.
Flowchart of the full procedure used to charge the alkaline battery. The two modules (subroutines) for measuring and charging are described in detail below.
To comply with the 3R paradigm—Reduce, Reuse, Recycle [8,9]—even in the construction of the measuring/charging instrument, we used parts, pieces, and electrical and electronic components recovered from old, broken, and disused instruments. These are abundant in a chemistry or, rather, electrochemistry laboratory, having reached the end of their life cycle but conserved for parts recovery.
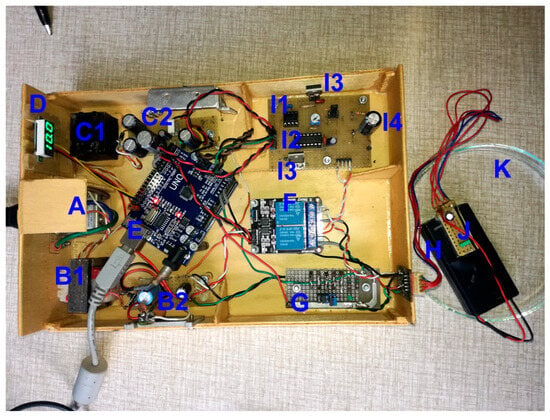
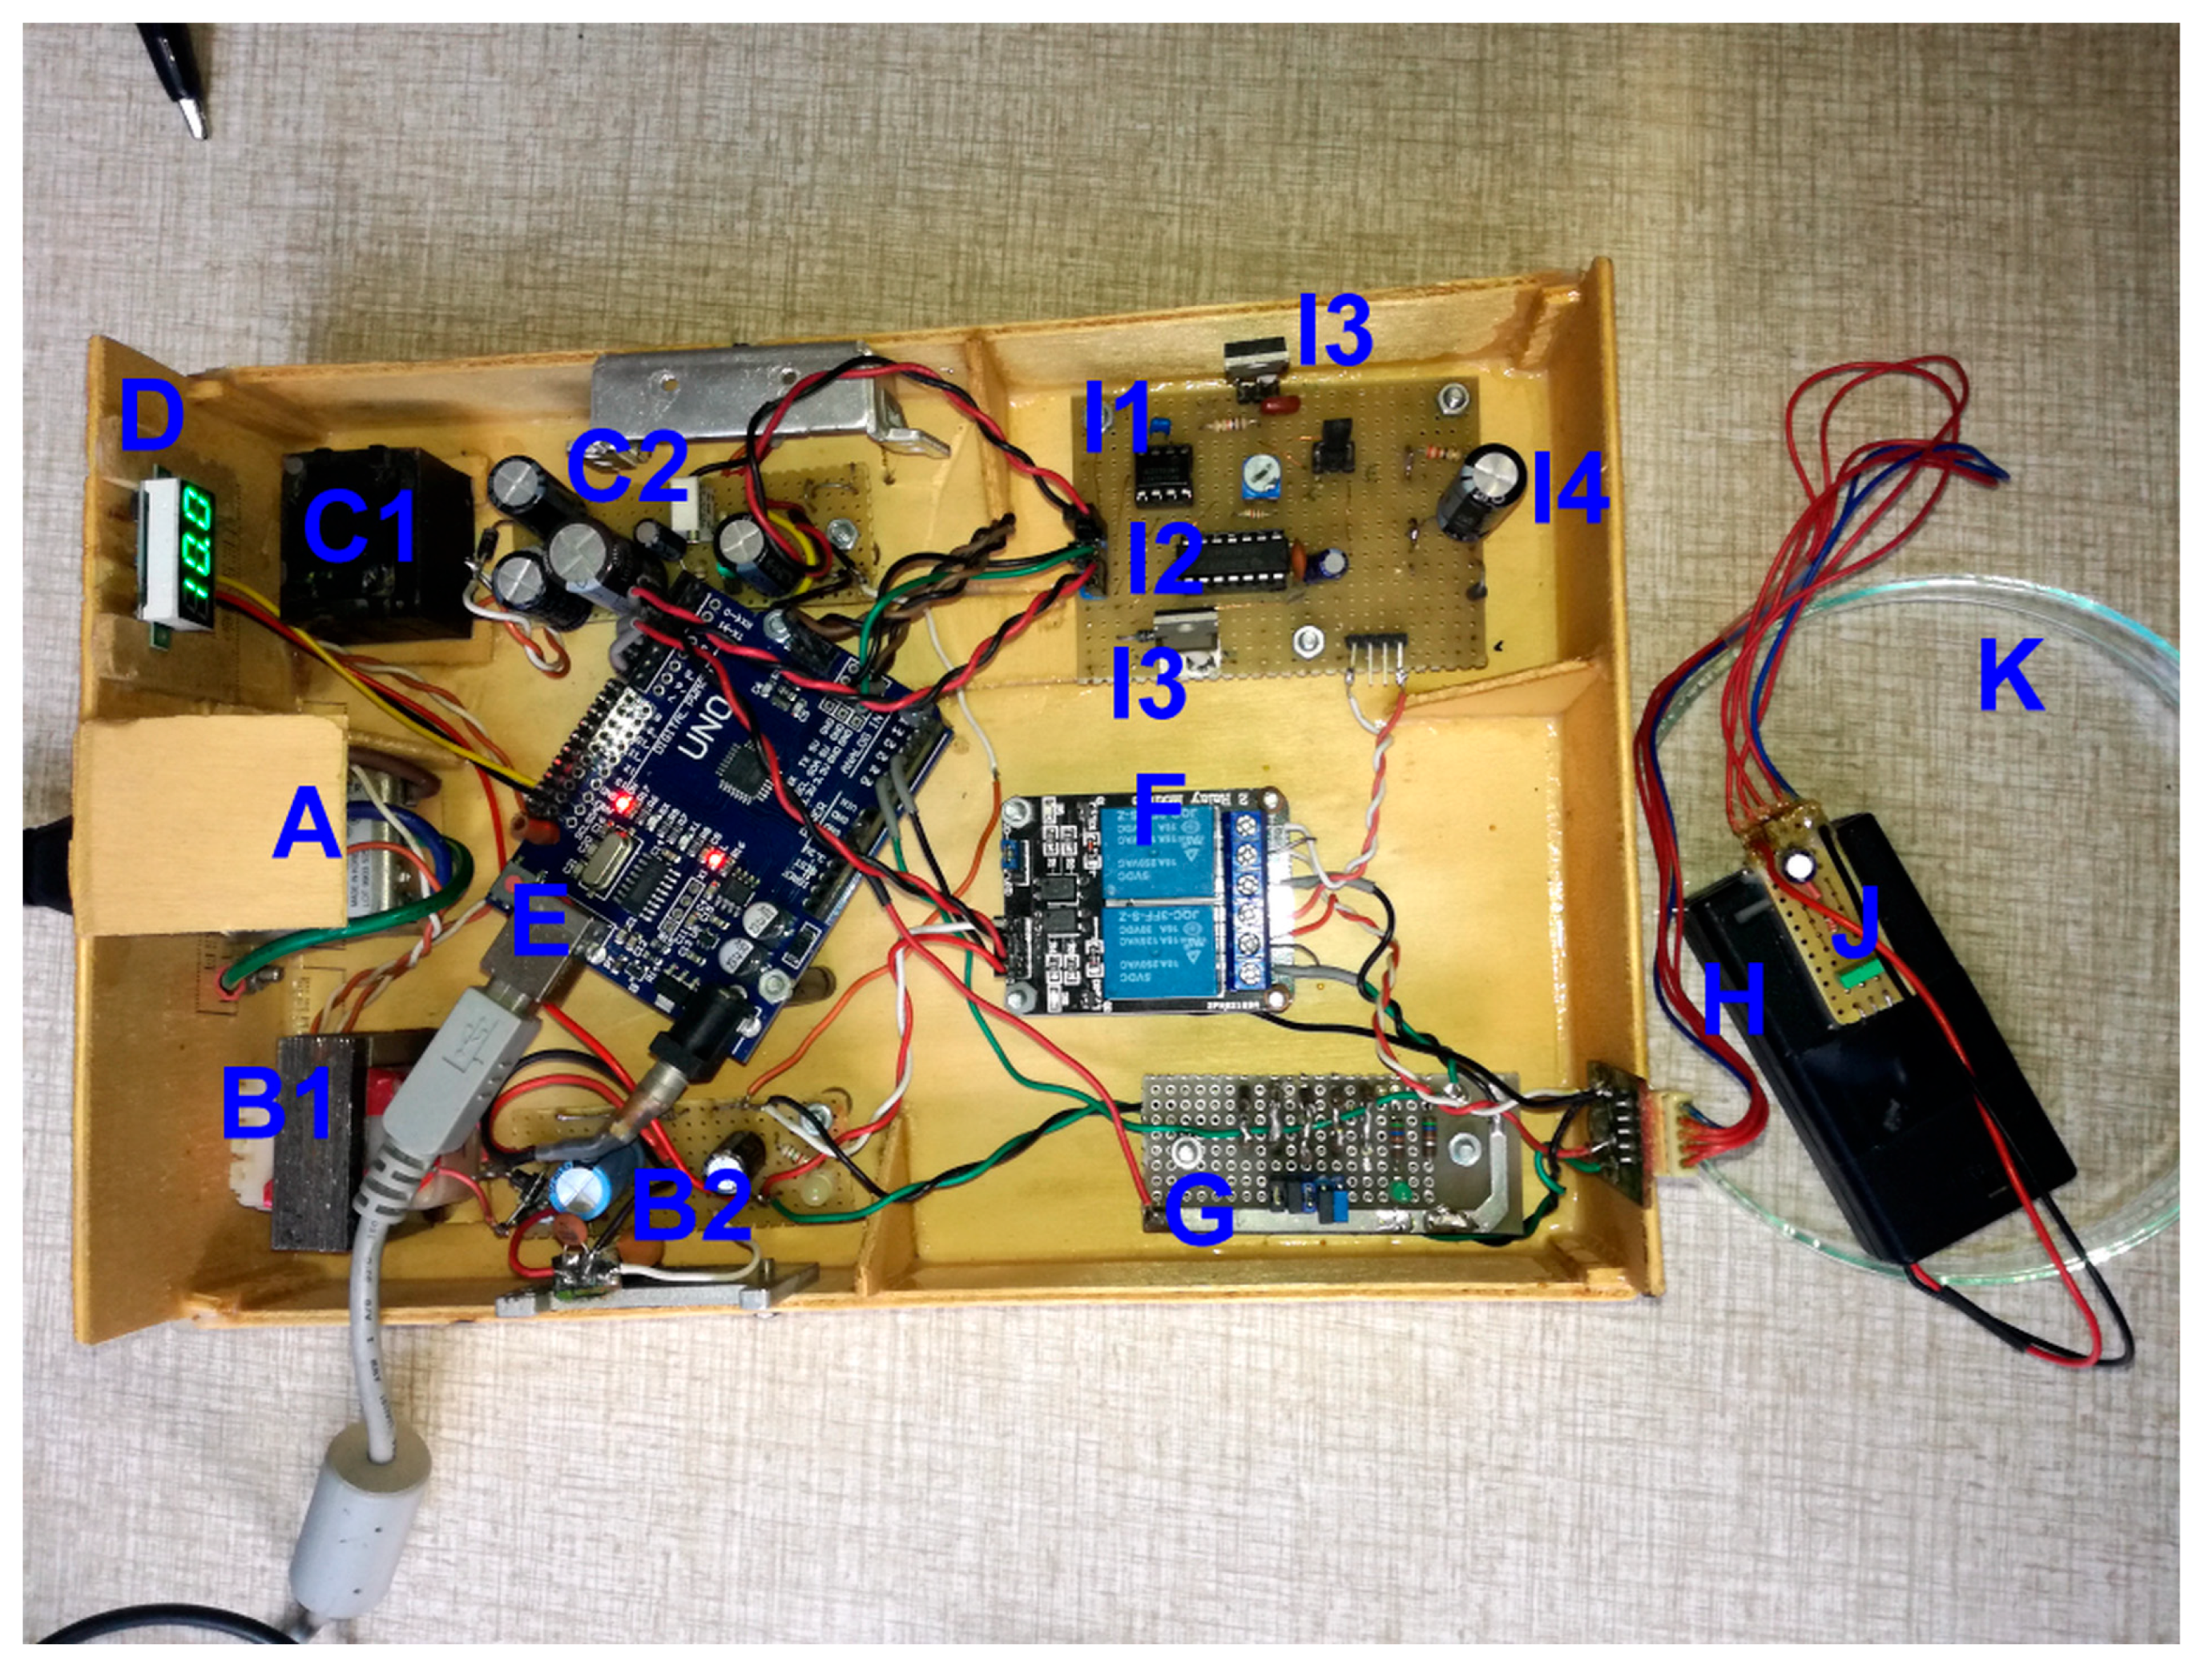
Figure 4 shows the hand-built device inside a container also made of recycled wood.
Figure 4.
Photo of the complete device.
In A we can see the connection to the 230 V mains and the EMI filter (electromagnetic interference filter), in B1 and B2 the not tons stabilized 9 V power supply for the Arduino and the stabilized 5 V power supply for the relays, in C1 and C2 the stabilized, variable power supply up to 15 V for the charging module and in D the applied voltage, in E the Arduino UNO R3 (Arduino LLC., Ivrea, Italy), in F the pair of relays of the measurement module, in G the various resistors for measure, in H the AA battery holder, in I the charging module with I1 the frequency divider, I2 the NOT logic gates, I3 the two MOSFETs, I4 the capacitor, finally in J the temperature measurement circuit and in K the glass Petri dish to collect any liquid leaks.
The Supplementary Materials contain both this high-resolution photo and other photos of the instrument and its modules.
A detailed description of the modules and their connections follows.
2.1. Power Supply Module
Three stabilized power supplies are used (see left side of Figure 2). The 9 V one is dedicated solely to Arduino, while the 5 V one is used to power the relays that require more current than Arduino can supply. The 15 V power supply is actually variable voltage, using a common LM317 IC (Texas Instruments Inc., Dallas, TX, USA), to charge the capacitor to the required voltage. All the power supplies require a small amount of power, less than 5 W.
2.2. Switch Module
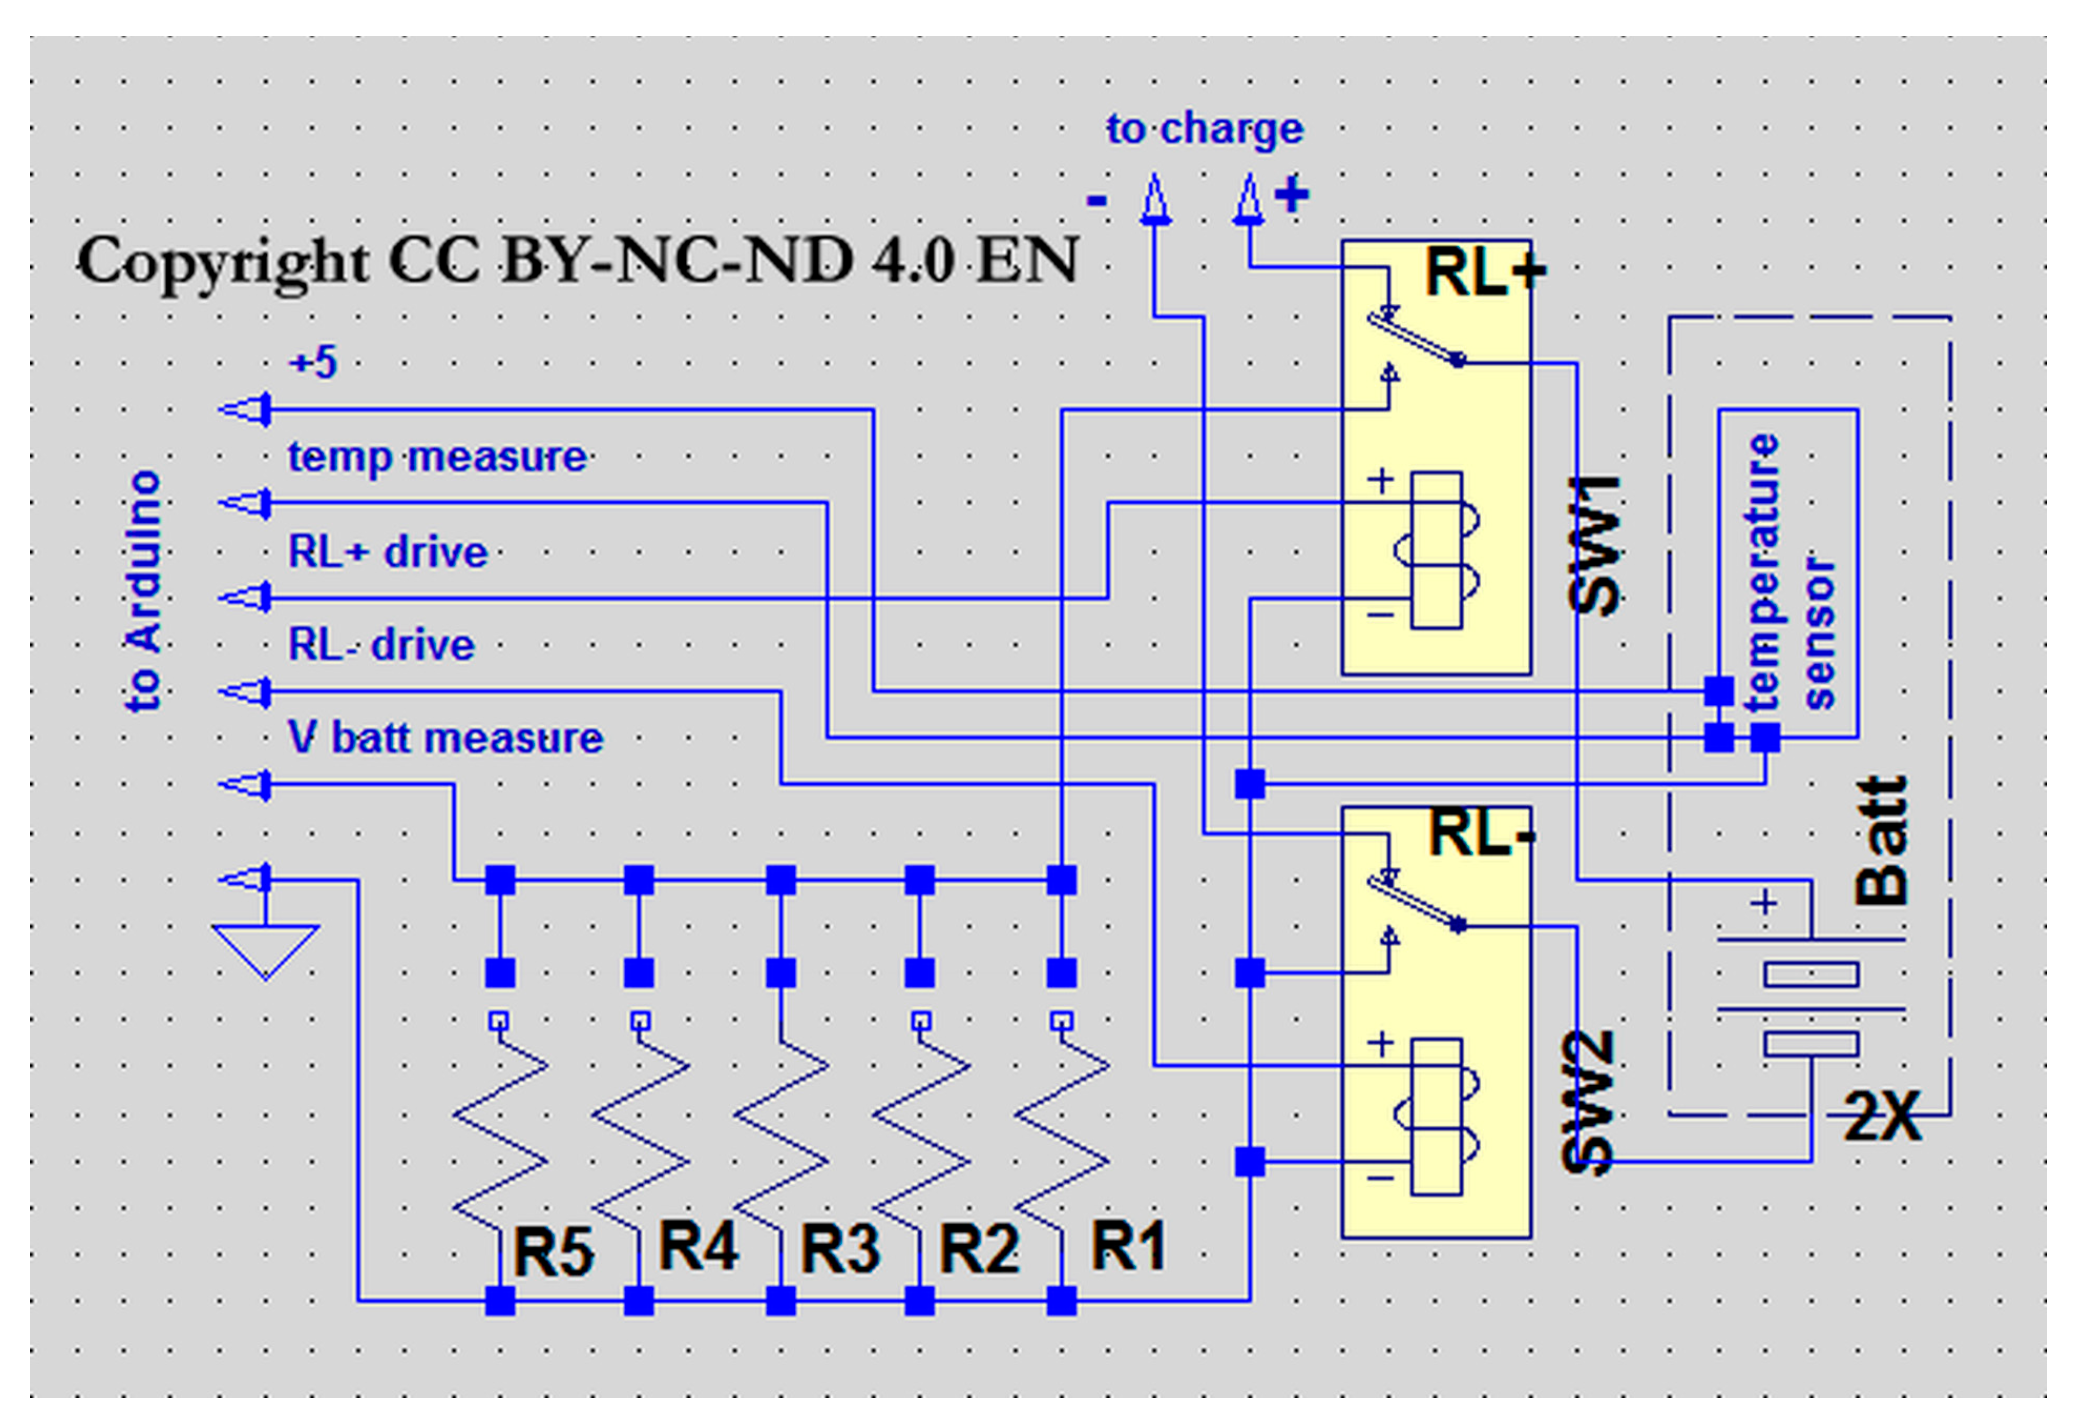
The battery to be charged is connected, via this module, alternately to the charging module or the measurement module. The two relays (right side in Figure 2) allow the two modules to be completely separated so that charging occurs with only the battery as the “load” and the subsequent measurement is not influenced by the frequencies of the MOSFETs and other similar components. The relays are powered by 5 V and are equipped with optocouplers to avoid overloading the Arduino outputs; its pin 5 controls the positive relay and its pin 7 controls the negative battery relay (Figure 2).
2.3. Module for the Measurement of the Charge State
An exhaustive description is available in our previous work [28,29]. The constant-load method is often used to measure the state of charge, or rather the discharge over time, of batteries with a power of 100 Ah or 240 Ah [44] but also of 0.65 Ah or 2 Ah [45].
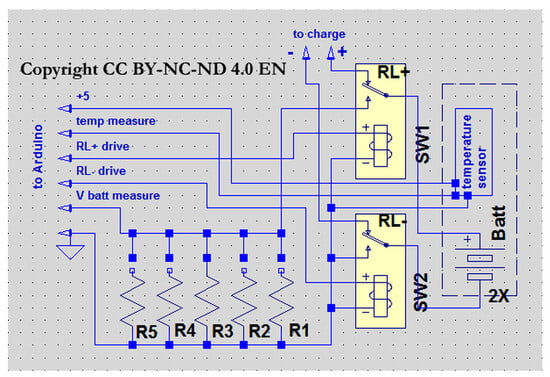
Figure 2 and Figure 5 show that using appropriate jumpers, you can connect one of the various resistors (R3 in the case of Figure 5), or multiple resistors in parallel, or none at all to obtain the desired total resistance, also depending on the battery type (AAA, AA, C, D, etc.). The two relays are mechanical and, as above said, with optocouplers to avoid overloading the Arduino output pins, and the actuation coils receive a separate power supply (see right of Figure 5 and F in Figure 4). This allows for the use of any relay—5 V, 12 V, or 24 V—and prevents current spikes from disturbing the rest of the circuit. The voltage value is measured by Arduino pin 14 (ch14 = A0) at time intervals set by the software.
Figure 5.
Schematic of relay and measurement modules; the temperature module shown as a draft on the right will be better described below; circuits are under Copyright CC BY-NC-ND 4.0 EN [42].
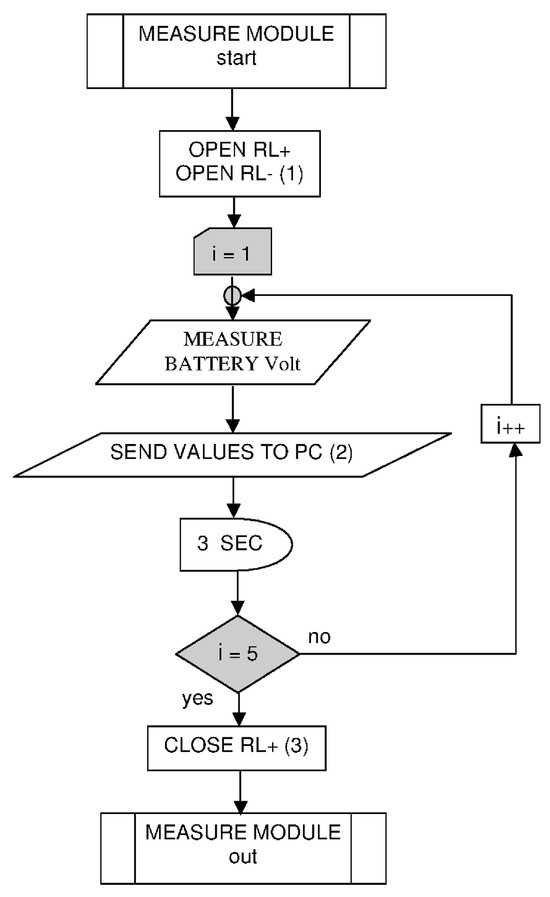
The measurement protocol (Figure 6) foresees: (1) Arduino deactivates the relays by connecting the battery to the measurement module and to the resistance set by the jumpers; in (2) the last measured value is sent to the PC and stored in memory; in (3) one of the relays is open to leave the battery “float”.
Figure 6.
Flowchart of the measure subroutine.
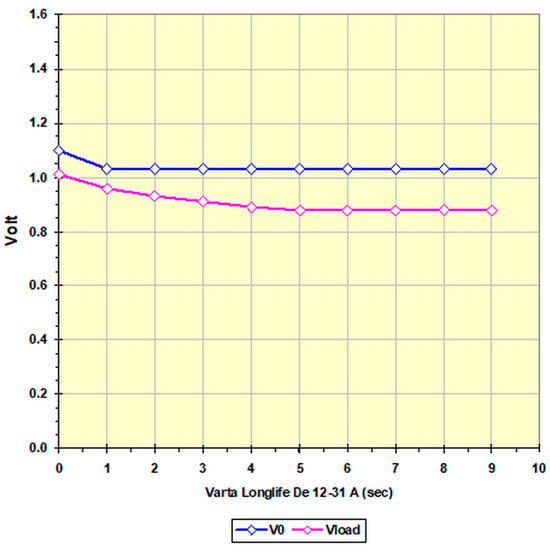
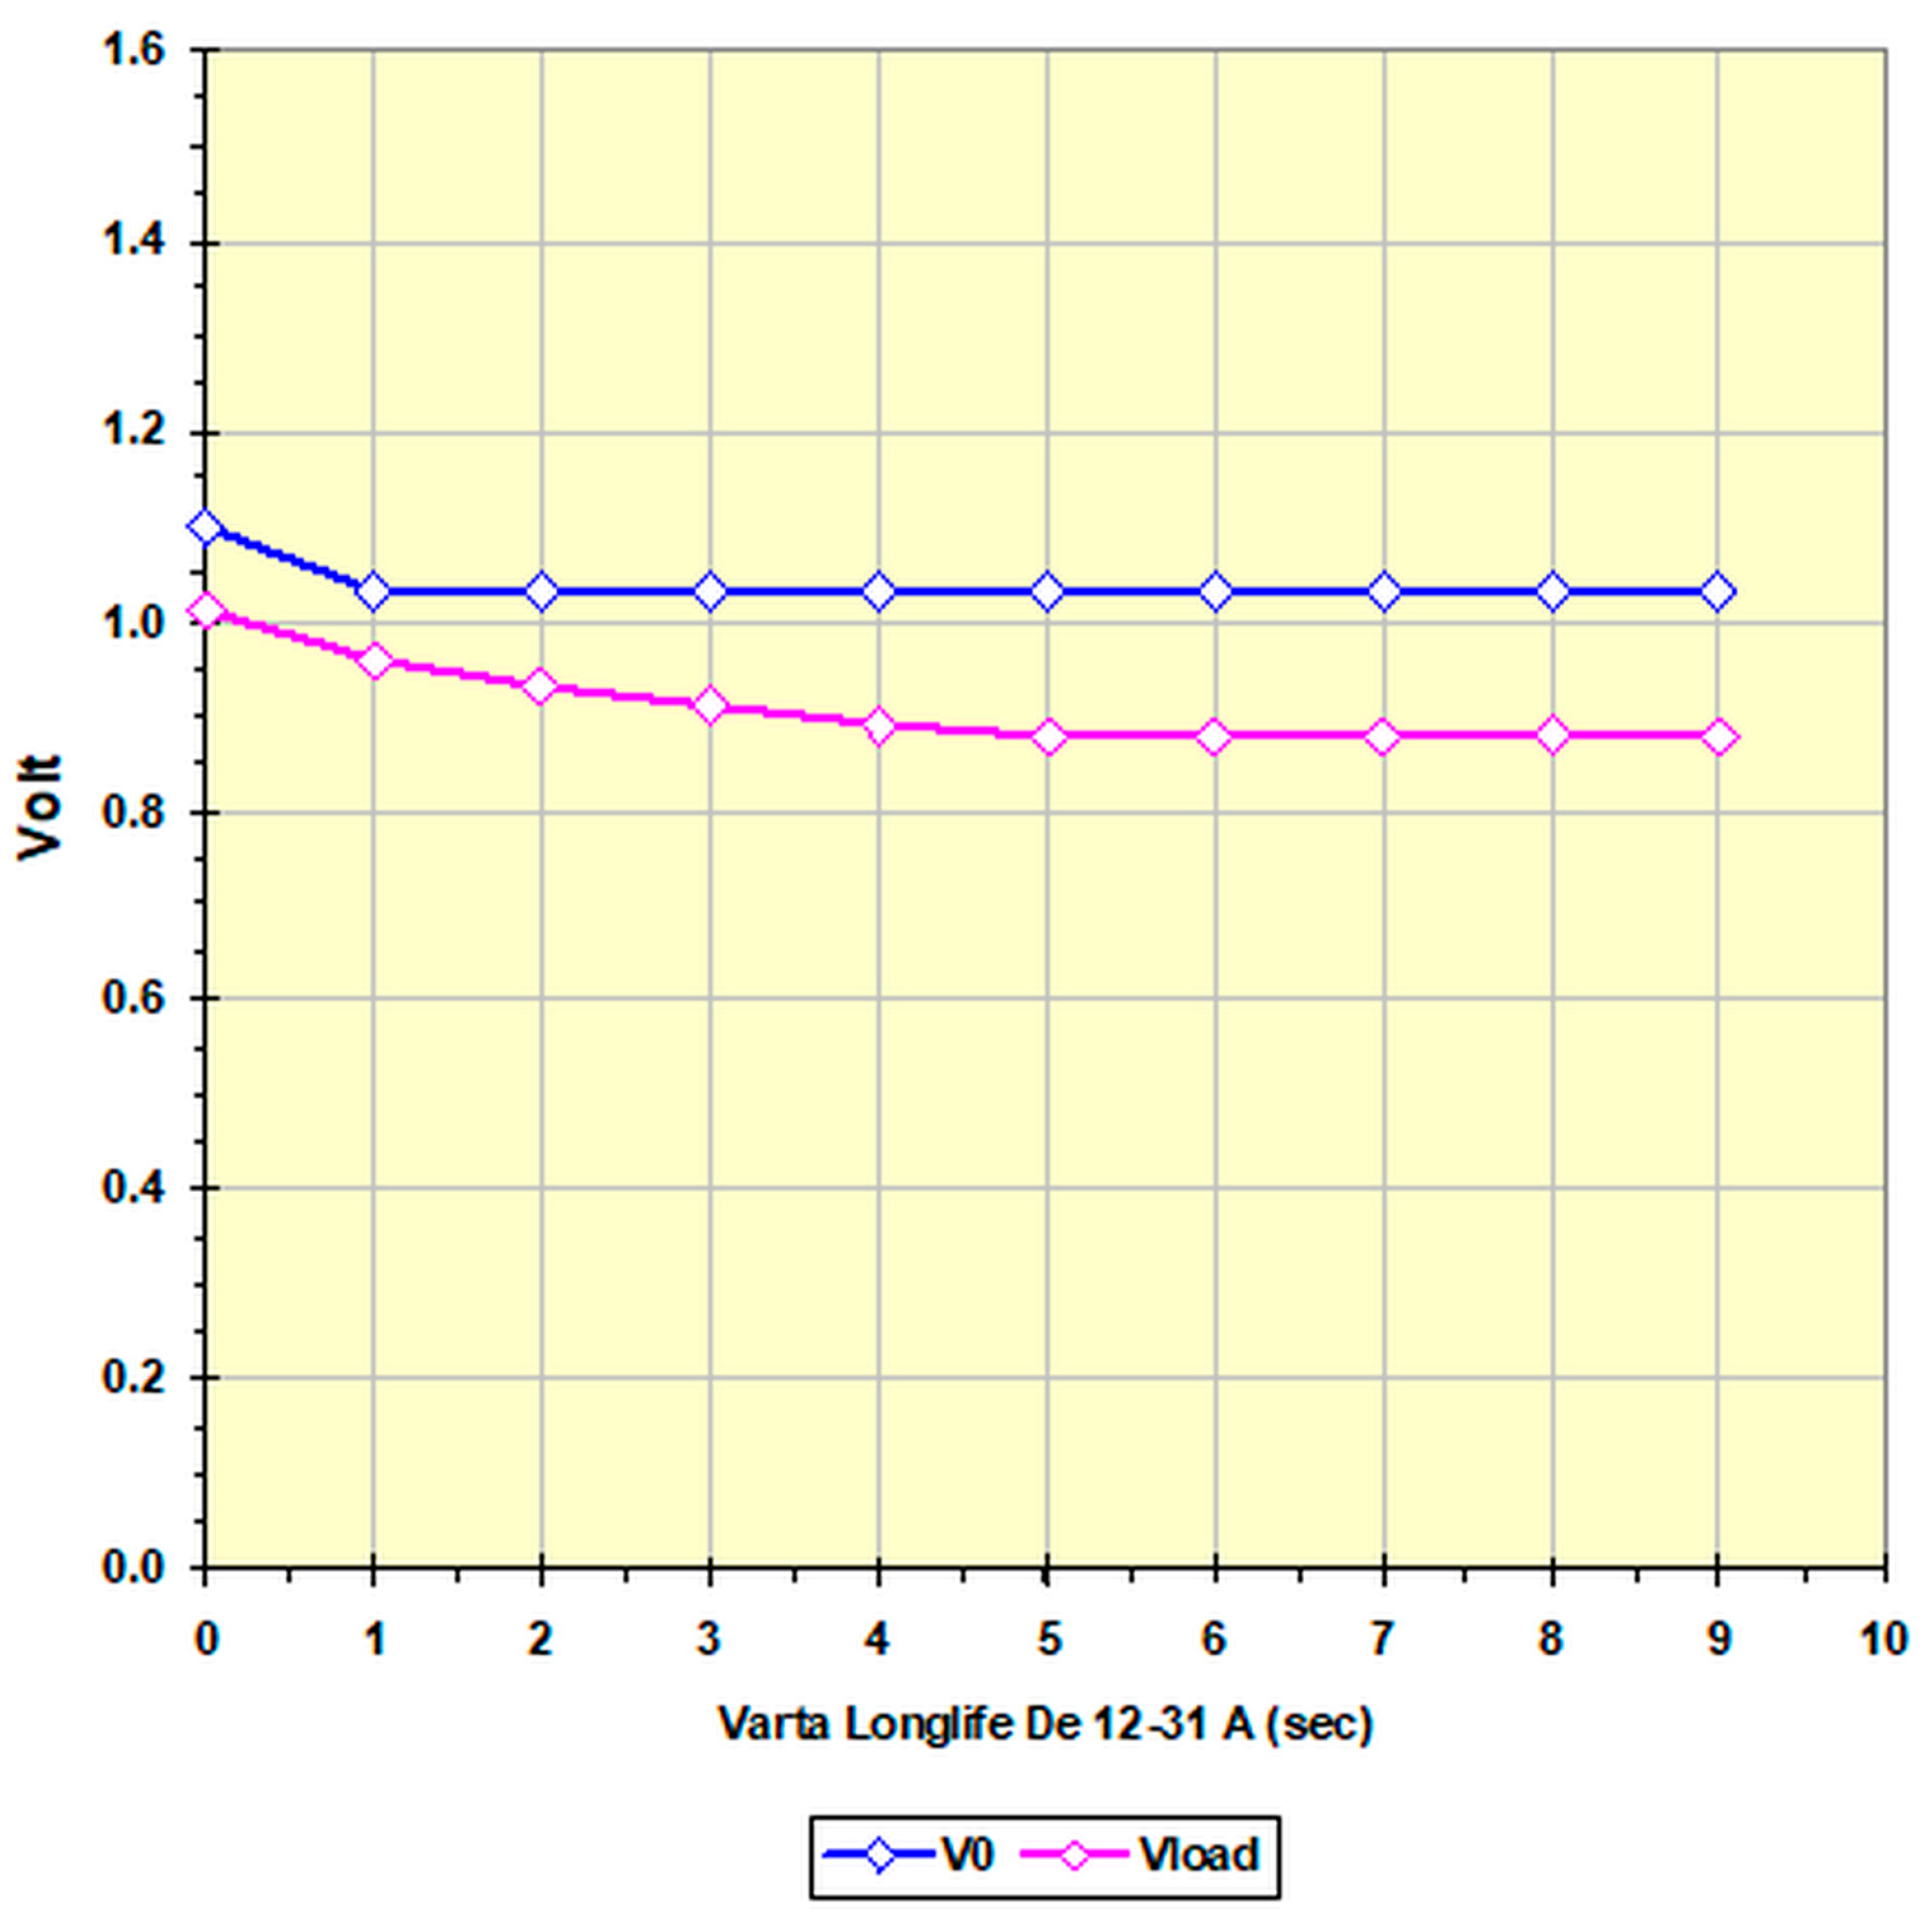
Figure 7 shows an example of the curves obtained in one of our previous studies measuring the residual charge of an AA alkaline battery [28,29]; the final point of the pink curve, obtained under a 100 Ω load, will be used to evaluate the efficiency of the recharging process by comparing its value first and after the recharging process. The software, however, produces the entire table and sends it to the PC, so further processing can still be done. To determine the difference in state of charge, the measurement process performed in the previous research [28,29] was repeated for 82 batteries (41 couples with similar SOC of the same brand) after charging.
Figure 7.
Example of the measurement of the residual charge of an AA alkaline battery at no load (blue line) and with 100 Ω loads (pink line).
2.4. Temperature Measurement Module
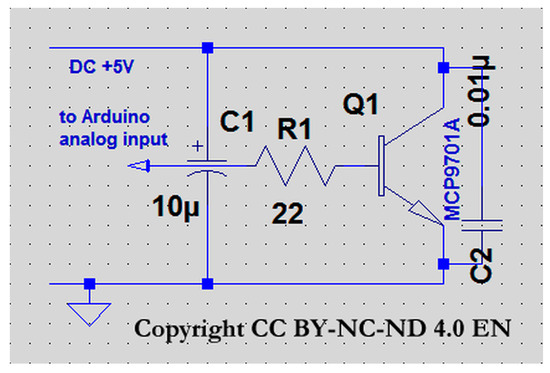
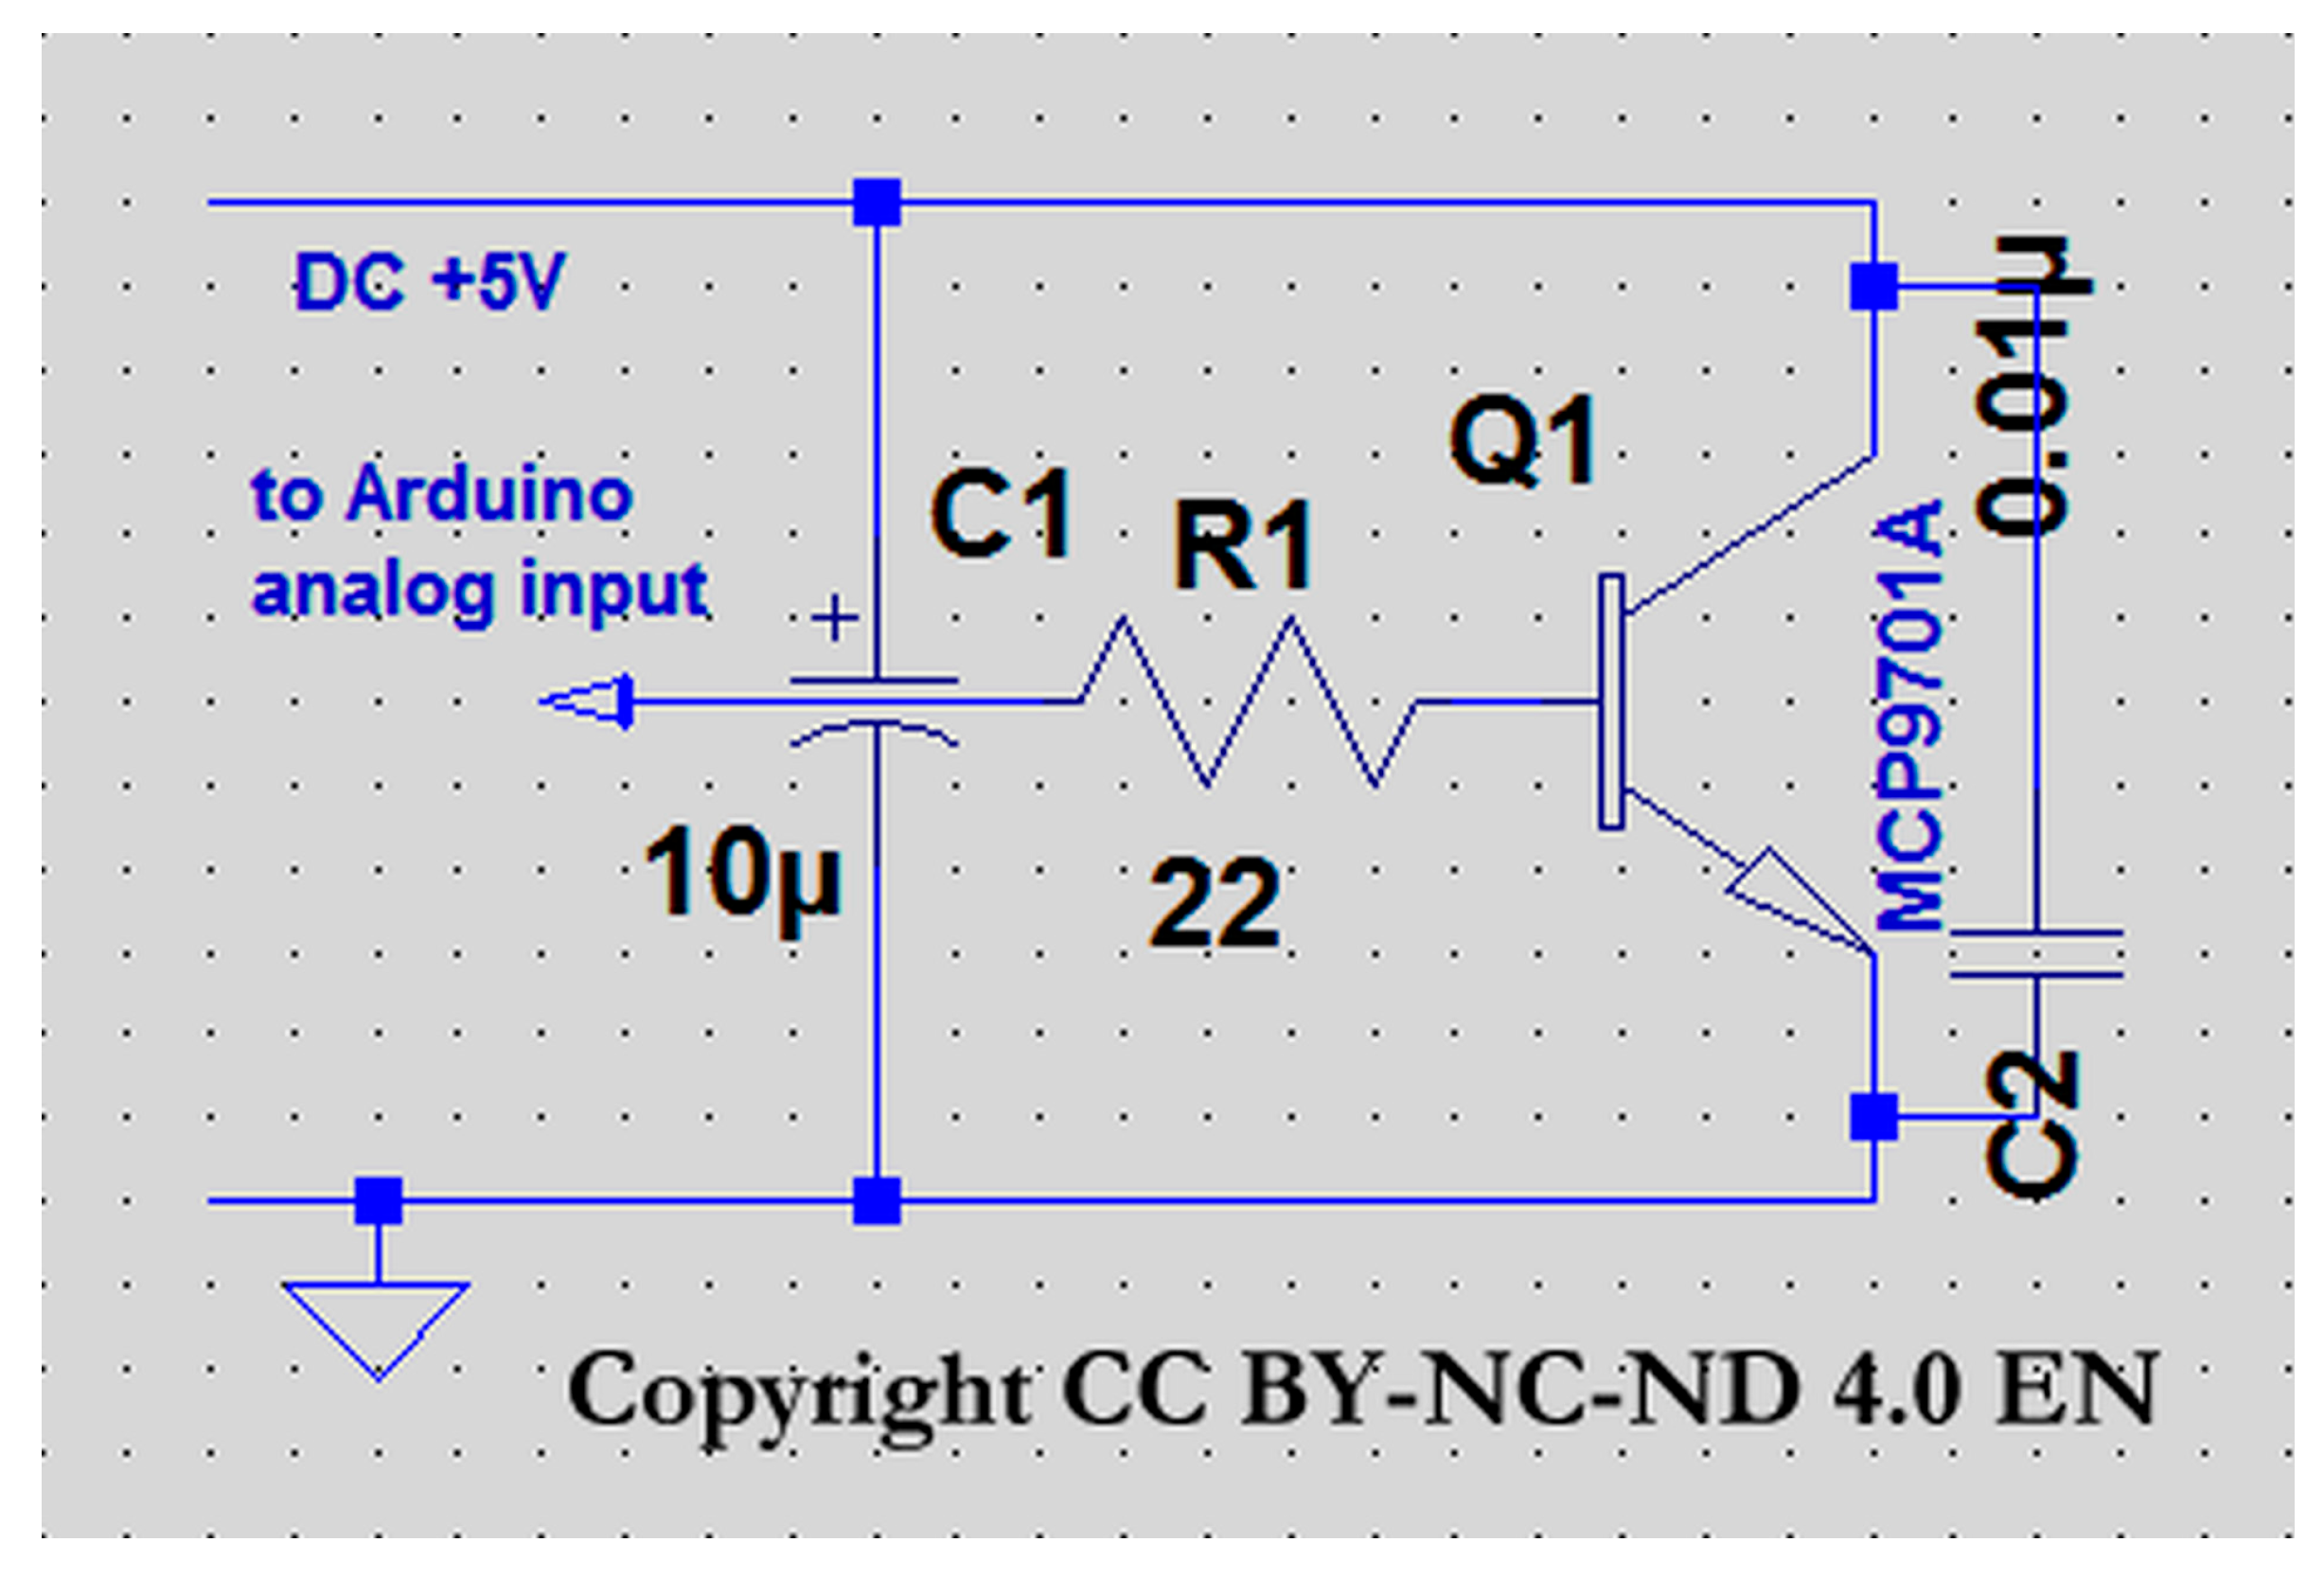
Dozens and dozens of temperature sensors that can be interfaced with Arduino are available on the market. Comparisons between the various sensors can also be found in the literature [46]. To simplify the software (also designed for use in an electrochemistry teaching lab), we looked for a sensor with an analog output with good accuracy and sensitivity, at a very low price, preferably in a TO92 case, which is easier to solder. Among the rarely used members of the MCP970x family (Microchip Technology Inc., Chandler, AZ, USA) (perhaps because they do not appear on blogs, forums, YouTube, etc.), to monitor the battery holder temperature during measurements, we chose the MCP9701A (low-power linear active thermistor), due to its best features (see Table 1) and low cost (0.6–0.8 euro each). The module schematic, reported in Figure 8 was designed after carefully reading both “Using Microcontroller I/O Pin” and “Layout Considerations” of the datasheet [47]).
Table 1.
Main characteristics of the MCP970x family of temperature probes.
Figure 8.
Electrical circuit of the temperature measurement module inserted in the battery.
The Arduino UNO R3’s analog-to-digital converter (ADC) operates at 10 bits between 0 and 5 V, thus achieving a resolution of 4.88 mV. The sensor selected displays voltages that should vary between 0.5 and 1.4 V; the ADC resolution could be improved. Arduino has an internal function called AREF (Analog Reference) that allows you to vary the converter’s Vmax by applying a voltage to a specific pin. The easiest voltages to obtain, other than the default 5 V, are the 3.3 V present on an Arduino UNO R3 pin, which can be connected to the AREF pin with a wire, adding a 10 μF capacitor to GND, and then executing the analogReference (EXTERNAL) command; or the 1.1 V internal to the ATmega328P, again by adding the capacitor and executing the analogReference (INTERNAL) command. With these two additional voltages, we can go from a resolution of 4.88 mV for 5 V, to 3.22 mV for 3.3 V and to 1.07 mV for 1.1 V, always for 10 bits.
With the chosen temperature sensor, 1.1 V would be reached for a temperature of 35 °C, which is generally sufficient for the measurement, but since we need all 5 V to measure the voltage of the battery pair, the software will continuously switch between the two analogReferences with subsequent times in ms waiting for stabilization. The file V-Bits-Temp_calibration_v1.5.xls in Supplementary Materials shows the calibration.
2.5. Charging Module
This is the main module of the instrument. In Figure 1, we have already seen the structure and, on its right, the waveform to be applied to the batteries, here in pairs, in series to better exploit both the charging time and the capacitor voltage. The S switch cannot be a relay because even operating at a low switching frequency of 20 Hz, i.e., 20 switches per second, results in 1,728,000 switches in a day, and no relay would survive. It requires a solid-state switch, a transistor, a FET, or better yet, a MOSFET (HS and LS in Figure 2), which exhibits very low resistance once activated.
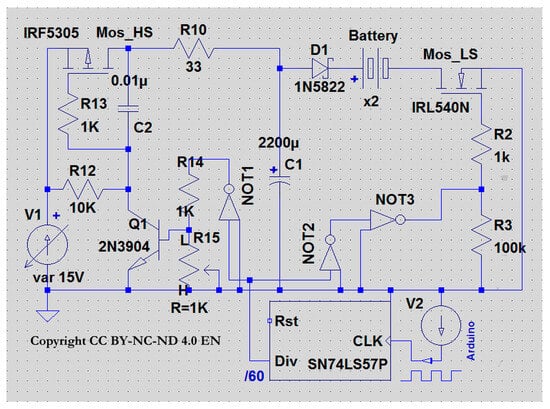
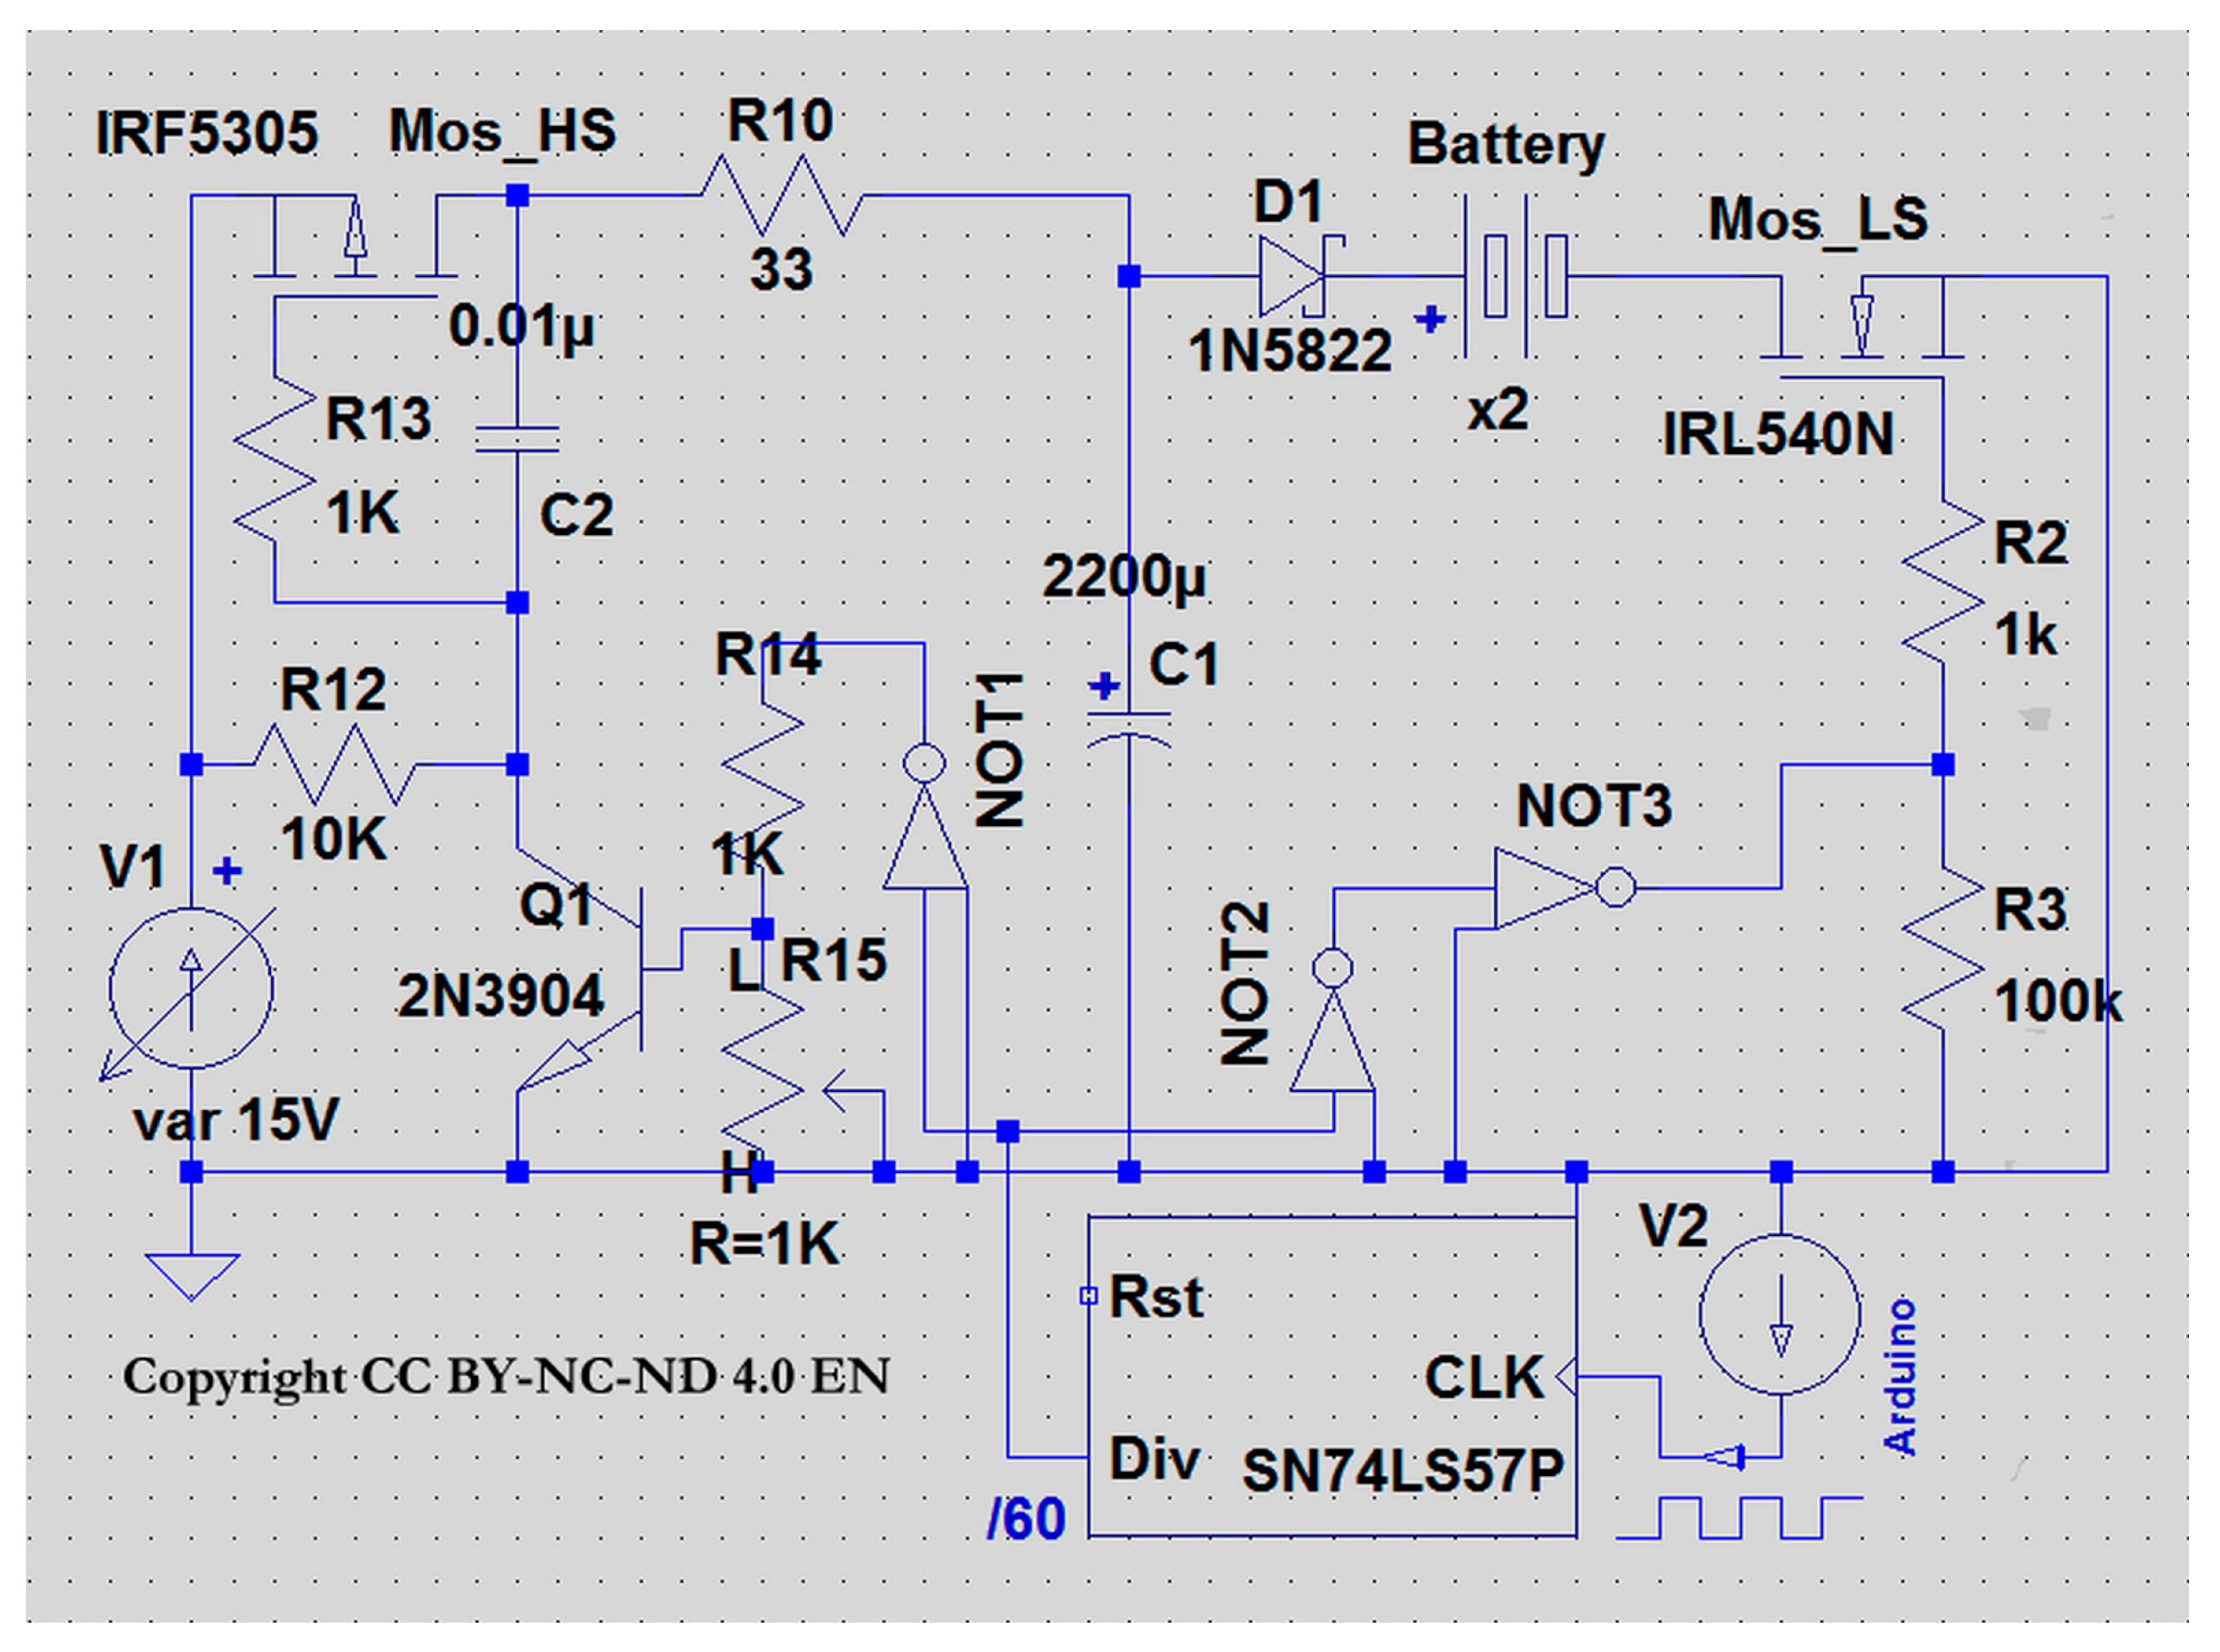
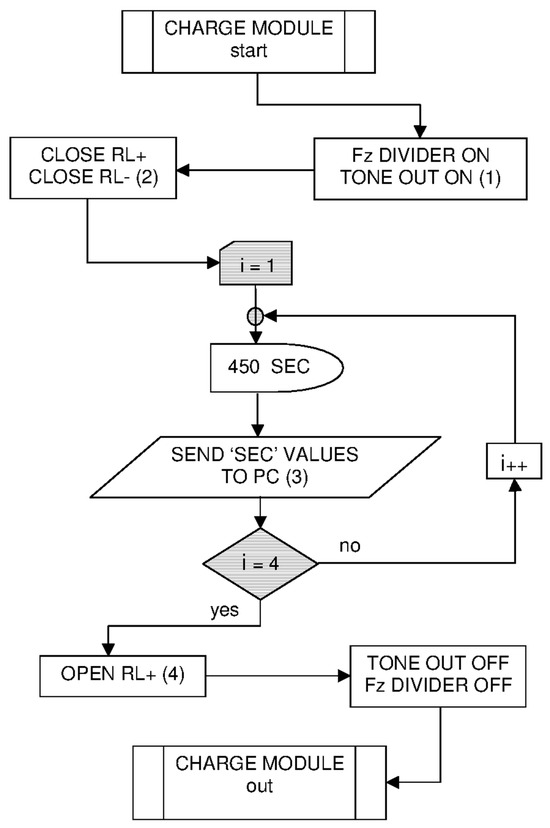
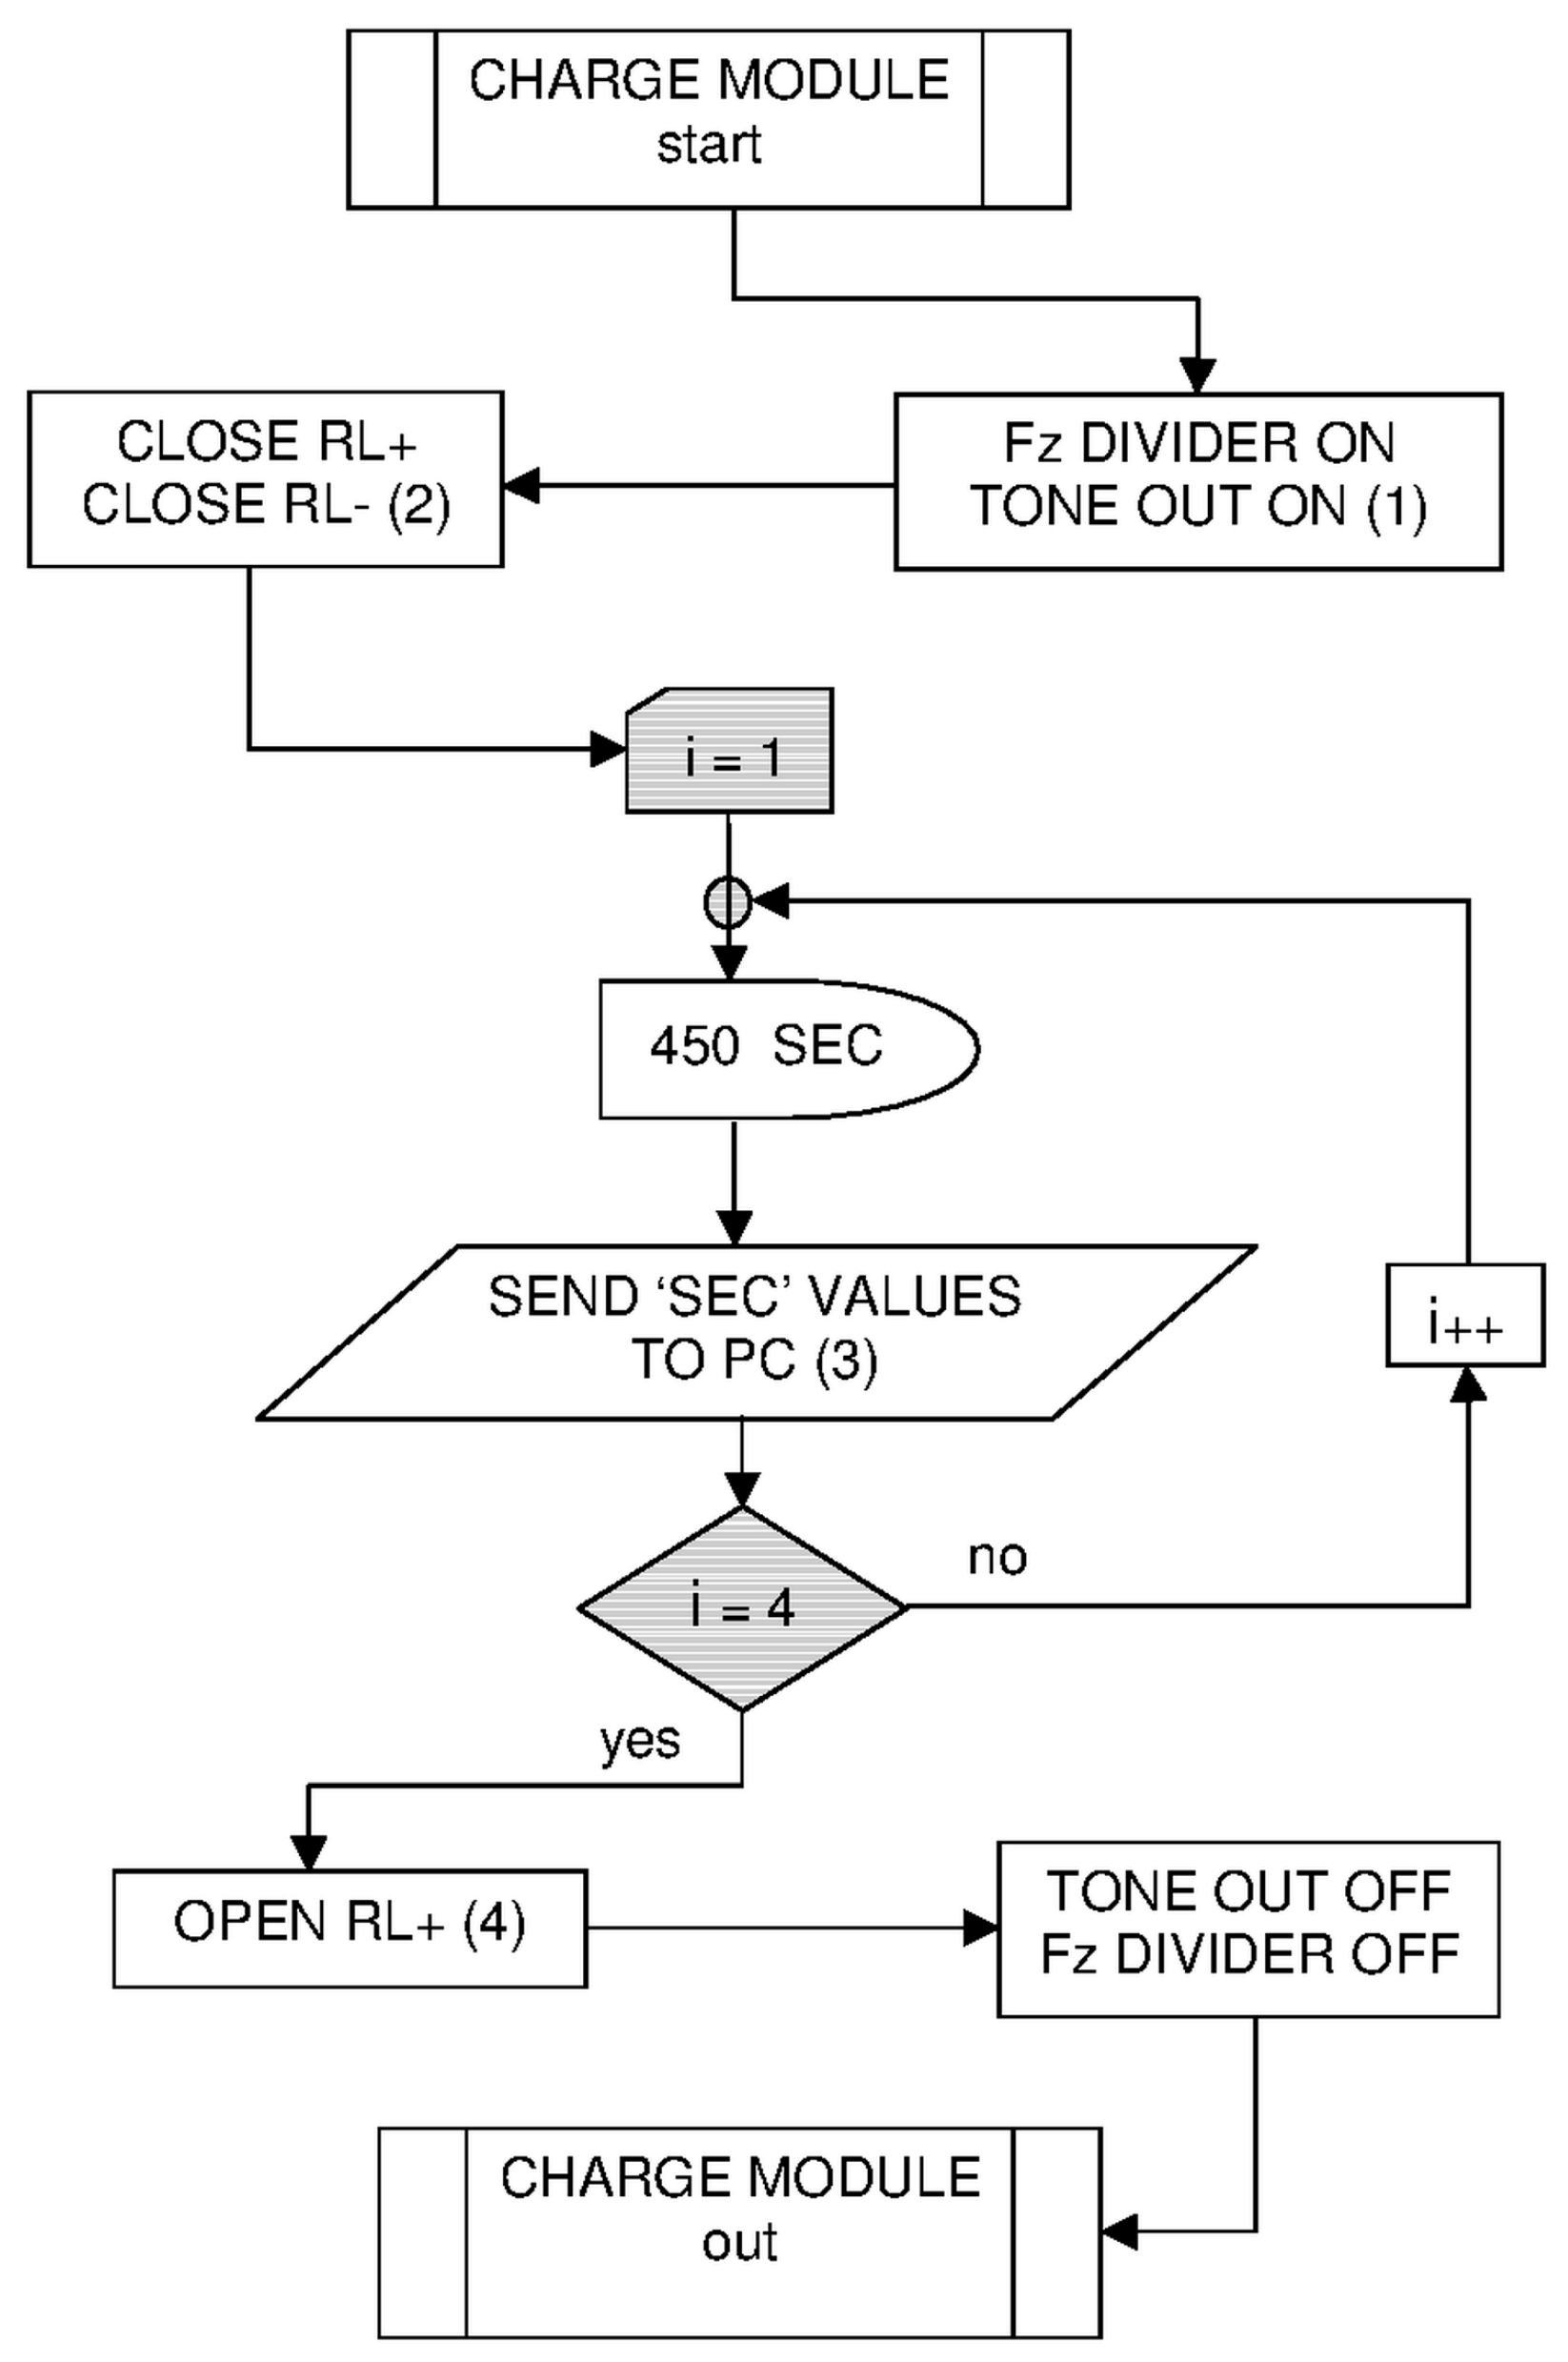
The structure is better clarified by analyzing the upper part of Figure 2, more detailed in Figure 9, and the flowchart in Figure 10.
Figure 9.
Electrical circuit of the charging module.
Figure 10.
Flowchart of the charge subroutine.
At the bottom right of Figure 9, a square wave between 0 and 5 V is the signal coming from Arduino pin 4. Since the Arduino’s ToneOutCH function cannot generate signals lower than 30 Hz (to avoid using more complex timer-based methods), a frequency divider is needed to obtain the required few Hz value. A D-type flip-flop is typically used, which divides by 2, and using it in cascade results in divisions of 4 or 8. However, there are dedicated circuits such as the SN74LS94 (Texas Instrument, Dallas, TX, USA) or even simpler ones such as the SN74LS57 (Texas Instrument, Dallas, TX, USA) used here, which divide the input frequency up to a maximum of 60 times. To obtain a clean square wave capable of driving the MOSFET gate, we use a 74LS04 gate (Texas Instrument, Dallas, TX, USA), a single NOT gate for the IRF5305 MOSFET (International Rectifier, El Segundo, CA, USA) on the positive pole (called the High Side) that charges the capacitor, and a double NOT gate to drive the IRL540N (International Rectifier, El Segundo, CA, USA) that connects the battery to ground (called the Low Side). Using two NOT gates allows us to phase-invert the square wave and obtain the alternating, inverted activation of the two MOSFETs as required by the project.
The other electronic components serve to properly drive the two MOSFETs while trying to avoid self-oscillation.
The variable voltage power supply sets the maximum charging voltage of the capacitor. A MOSFET charges the capacitor through a resistor when activated by the Arduino signal. Voltage is also applied to the positive terminal of the battery, but its negative terminal is disconnected because the other MOSFET is open or disabled. With a signal from the Arduino, the two MOSFETs are activated alternately, so that the capacitor charges in one cycle and discharges in the other.
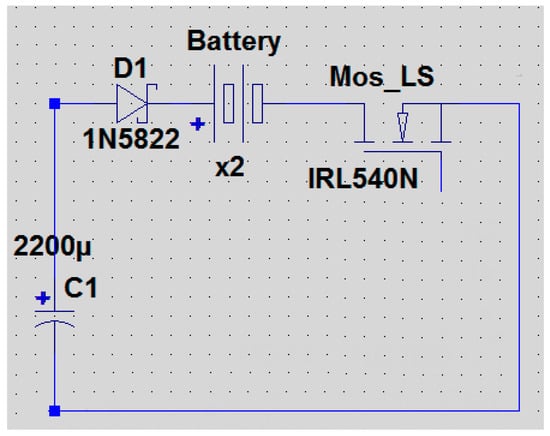
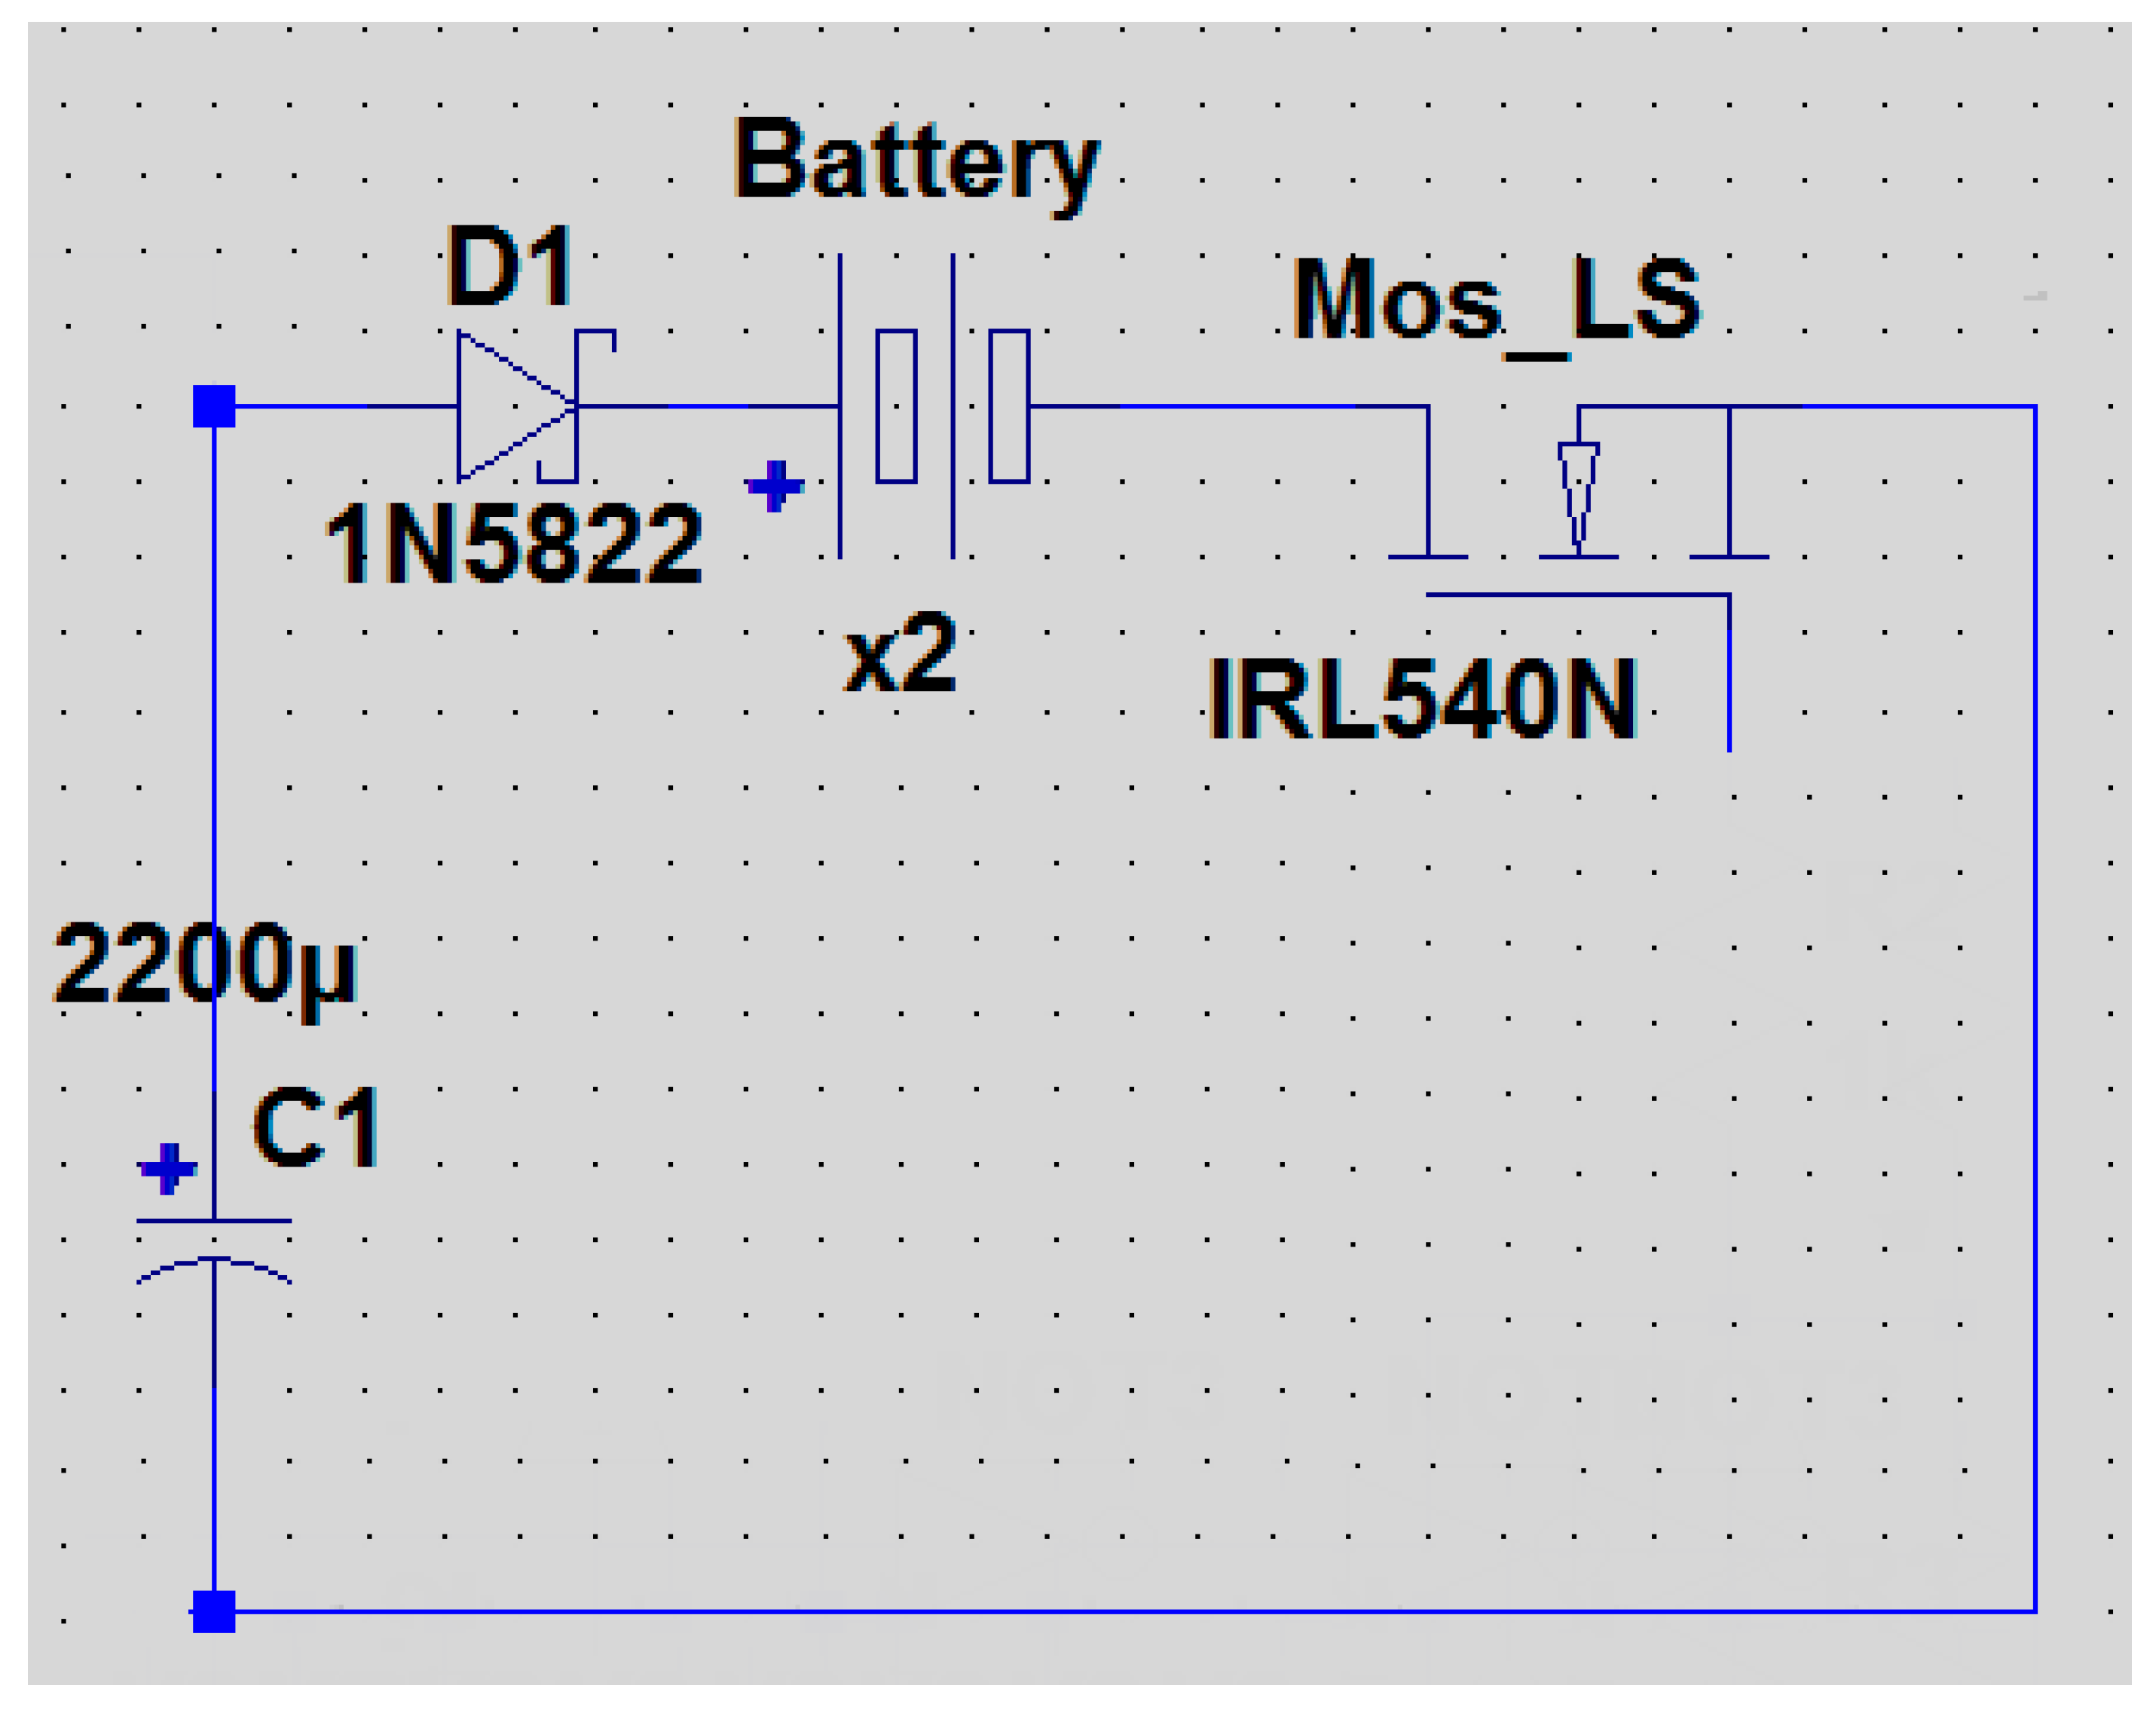
The most important part of the charging circuit is the one that tries to reproduce the waveform of Figure 1; the decision to propose the project as open-source requires us to describe this part as best as possible. To this end, we report and describe it in Figure 11, simplified with respect to Figure 9.
Figure 11.
Simplified recharge module, the top right part of Figure 9.
The capacitance value was optimized using a small sample of batteries (not among those being measured) to obtain the peak voltage shown in Figure 12. Assuming an internal resistance (ESR) of a depleted battery between 2 and 10 Ω, the simplified circuit in Figure 11 must be built with components designed to minimize their resistance. Figure 10 shows a series in which the capacitor is the generator and the battery pair is the user. The first resistance to minimize is the internal resistance of the capacitor itself, and we chose the TDK B41896C5228M 2200 μF with an ESR value of 0.023 Ω. Another critical point is the MOSfet, which must have the lowest possible on-state drain-source resistance (RDS(on)); the IRL540 we chose has RDS(on) = 0.077 Ω; an alternative could be the IRLZ44N with approximately 0.022 Ω. The diode must be a Schottky diode, and to avoid a current limit, we chose the 1N5822, with a nominal current of 3 A and 80 A peak, but the Very Small Conduction Losses, Extremely Fast Switching, Low Forward Voltage Drop type is manufactured only by STMicroelectronics. The oscilloscope measurement of the battery waveform (Figure 12) must be performed using a 10x probe, minimizing the interference introduced by the probe itself. Furthermore, the oscilloscope must be connected to a 1:1 isolating transformer to make the measurement system floating (or a battery-powered scope meter should be used).
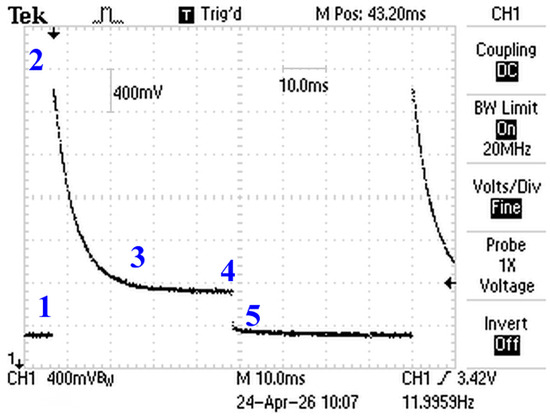
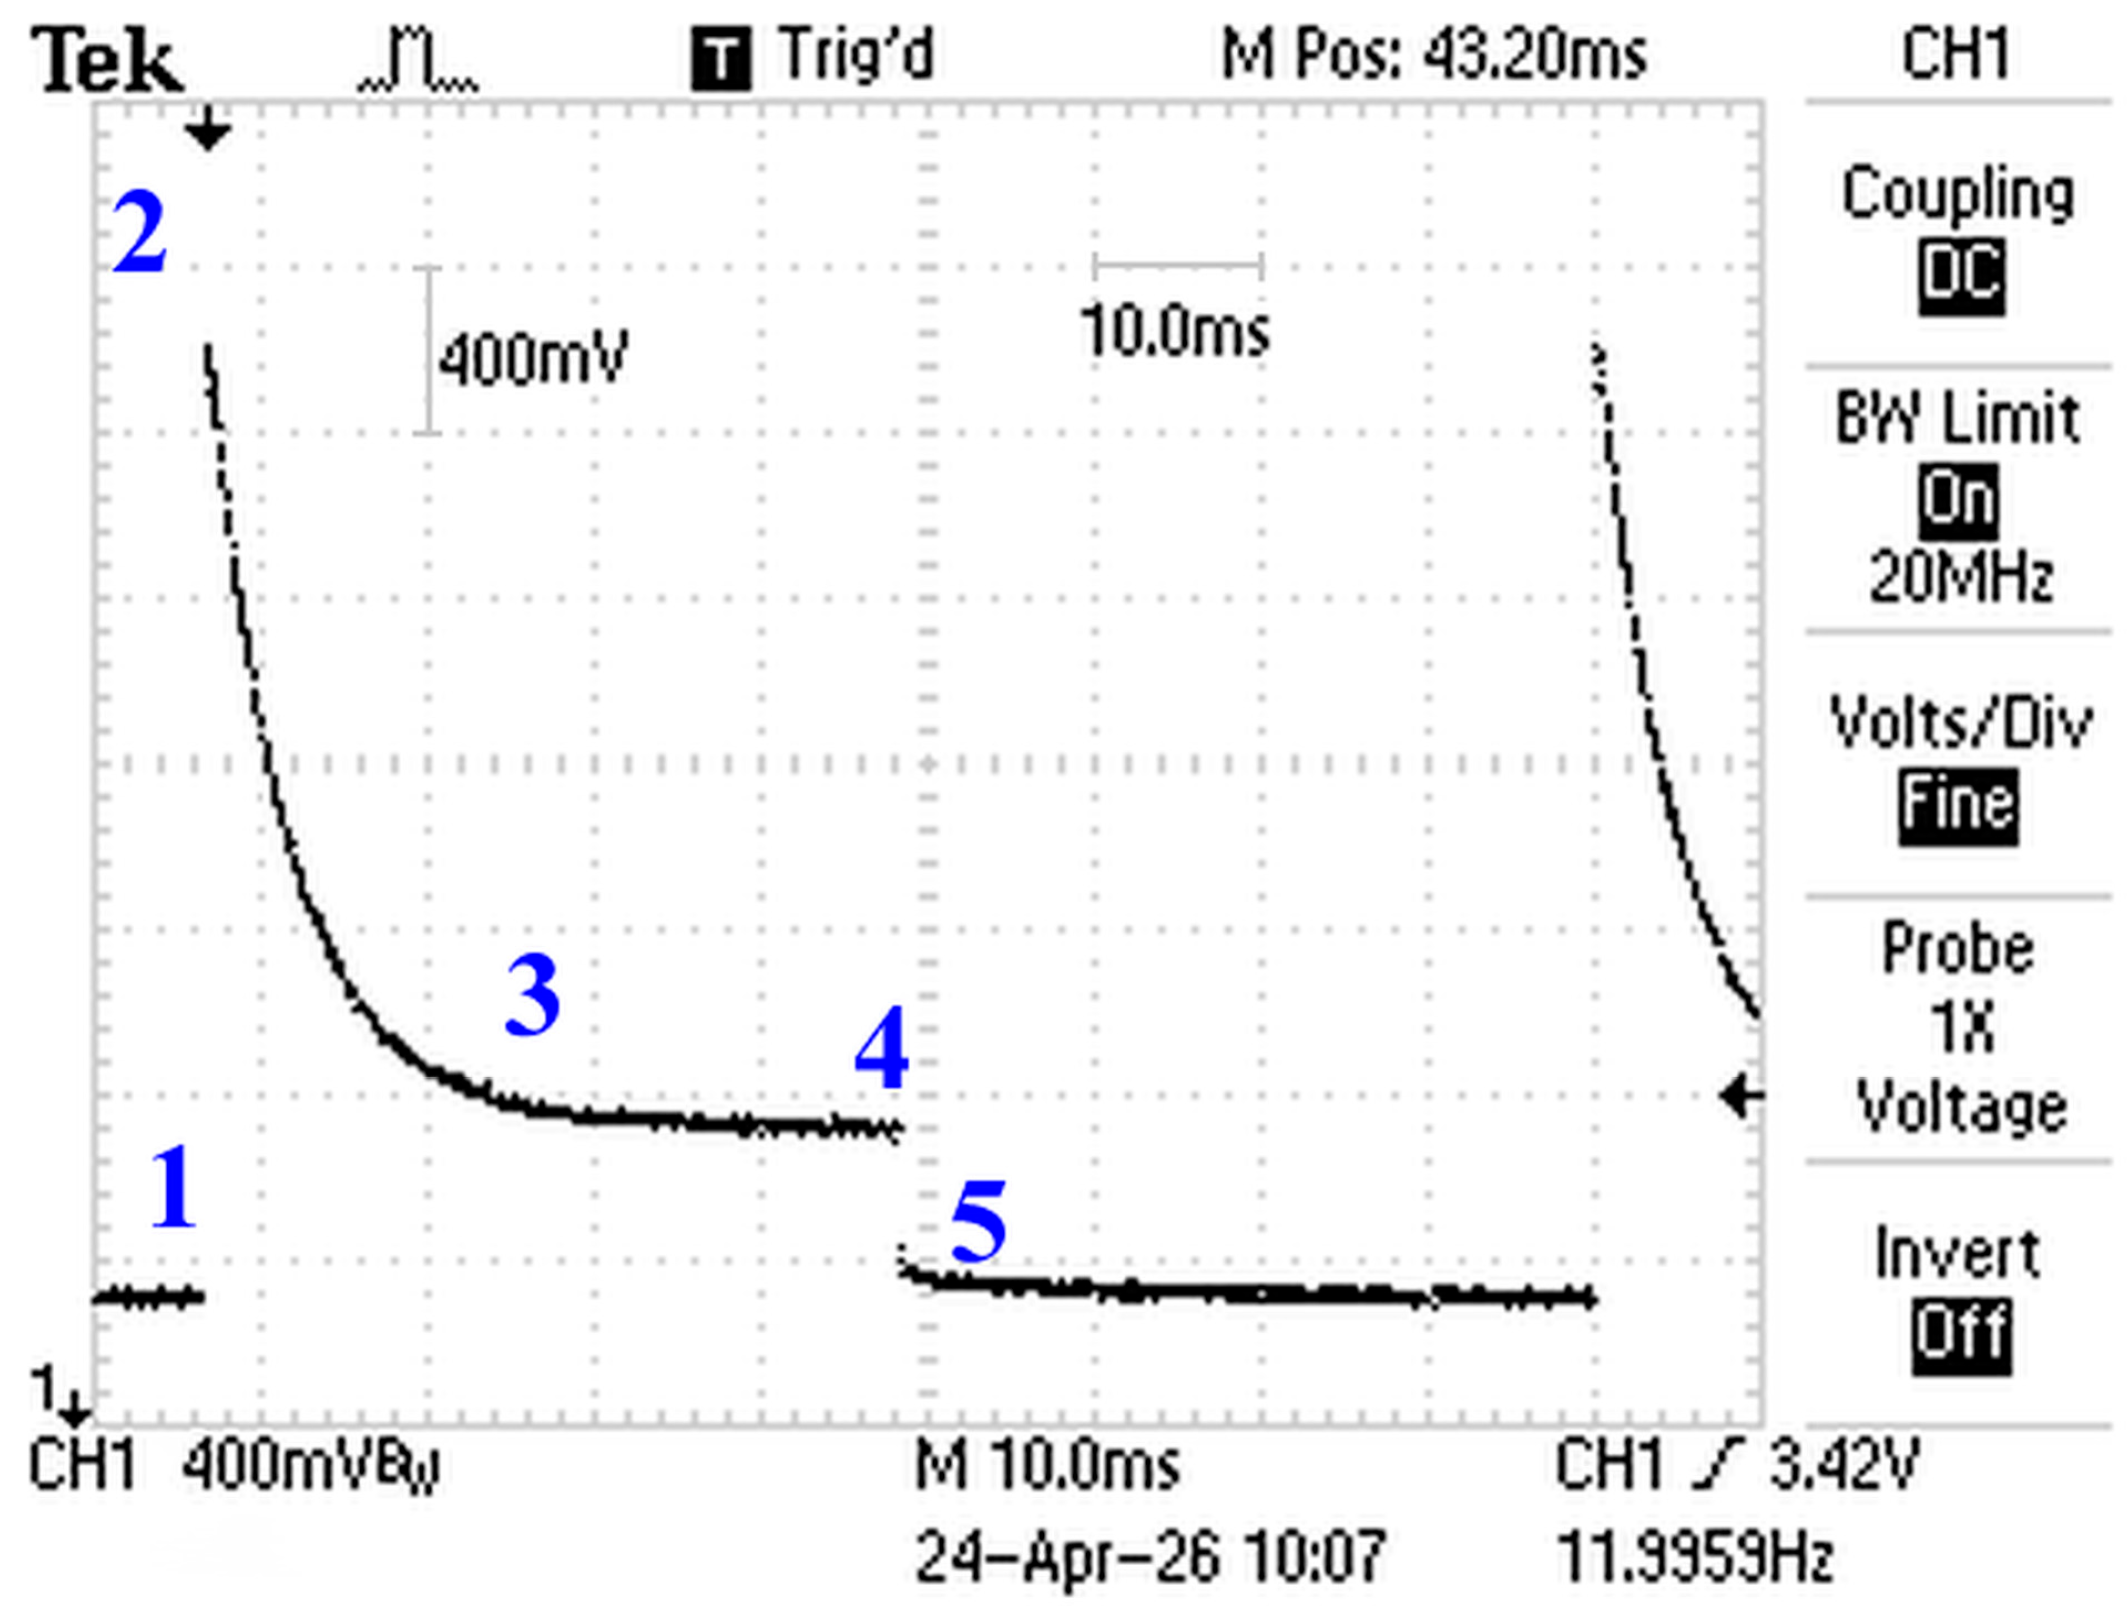
Figure 12.
Screenshot of the waveform directly detected in the battery holder.
Figure 12 shows a screenshot of the waveform detected in the battery holder using an oscilloscope (Tektronix TDS 1002B, Tektronix Inc. Beaverton, OR, USA) powered by a 1:1 transformer to avoid ground loops and with an input impedance of 10 MΩ to avoid disturbing the measurement.
To obtain this waveform, the circuit in Figure 9 was designed and built. Given the open-source nature (but under Copyright CC BY-NC-ND 4.0 EN [42]) of this project, we will analyze it point by point.
Point 1 corresponds to the end of the charging period of the capacitor, 2200 μF in this circuit (also shown in blue inside the charging module in Figure 2). At point 1, the HS MOSFET turns off, the LS MOSFET turns on, and the capacitor discharges to the battery pair, resulting in a maximum voltage peak of 5 V (3.42 V in this case) at point 2. The capacitor discharges according to curve 3 until reaching point 4, which shows the battery pair charging, here approximately 0.5 V. Finally, at point 5, we see the HS MOSFET turn on and the LS MOSFET turn off simultaneously, resulting in the battery disconnection and the capacitor charging. The voltage at point 4 is expected to gradually increase as the charging process continues. We measure approximately 82 ms, resulting in a value of approximately 12 Hz, to run a complete cycle. On the bottom right of Figure 12, we can see the peak voltage, 3.42 V, applied by the capacitor to the 2 batteries that resulted suitable for overcoming the activation energy of the recharging reactions.
2.6. Arduino Module as Main Controller
We use a classic Arduino UNO R3 as shown in Figure 2, but the circuit is designed to also accommodate the SMD (Surface-Mount Device) version (Figure 4), which has a lower current draw on individual pins. Figure 2 shows the separate, stable power supply for Arduino. The appropriate pins then provide both the signals to activate the relays and the voltages for the temperature module. Special attention must be paid to the ground loops, which are required for low-noise measurements, taking care not to create harmful loops.
2.7. Software Module
The most important part of the instrument is Arduino, a successful board developed in Italy in 2005 [48], especially for the simplified programming of the microcontroller on the board.
One of the strengths of all Arduino boards is the ability to repeatedly upload management software (called Sketch) to the microcontroller (Atmel AVR ATmega328P in the Arduino UNO R3 [49]) until the correct implementation is found. The boards can operate, measure, and display results (even with the help of special boards called Shield) without being connected to a computer or external software, ensuring complete independence and portability, as well as good precision of the times and acquired values [50].
All Arduino boards, 27 of which are currently in production and 40 of which have been retired, are programmed using the Integrated Development Environment (IDE), which is available for Windows, macOS and Linux. The programming language is based on a variant of C and C++, with which many users are already familiar. The IDE interface simplifies the use of the language and performs all the necessary programming functions. Programmers can create functions and subroutines and call them from the main routine, as well as use modules, libraries, and other functions written by thousands of other users (hopefully well written).
Our sketch is written, starting from scratch, using the Arduino language without using libraries and without reusing other people’s sketches. It is compiled with Arduino IDE 1.8.19 and is also compatible with all 2.x versions.
The software pays particular attention to the use of relays to connect the battery to either the measurement module or the charging module, avoiding any interaction between the modules. The capacitor’s discharge voltage, well above Arduino’s 5 V max, would instantly damage the Arduino if a current passed between the two modules. The sketch is available in Supplementary Materials as AlkalineRecharge1.5.ino, and the file generated by a charge is also available as AA-Conad-Alcaline-Plus-dic27-AB_charge.txt.
The instrument must be calibrated with a power supply, voltmeter, and digital thermometer. To avoid overloading the software, only the volt/bit calibration, not the temperature calibration, should be included in the sketch. Excel files with the corresponding table/graphs of the two calibrations are included in the EDF.
3. Results
From the 156 batteries whose charge we measured in our previous work [29], 41 pairs of the same brand, model, expiration date, and with similar residual charge were selected. These were subjected to the charging process and then, again using the method described in Figure 7, their residual charge was re-measured.
In the study, we also included pairs of batteries with residual charge equal to or slightly above 0 V to study capacitive discharge charging even for deeply discharged cells that are expected to be non-rechargeable.
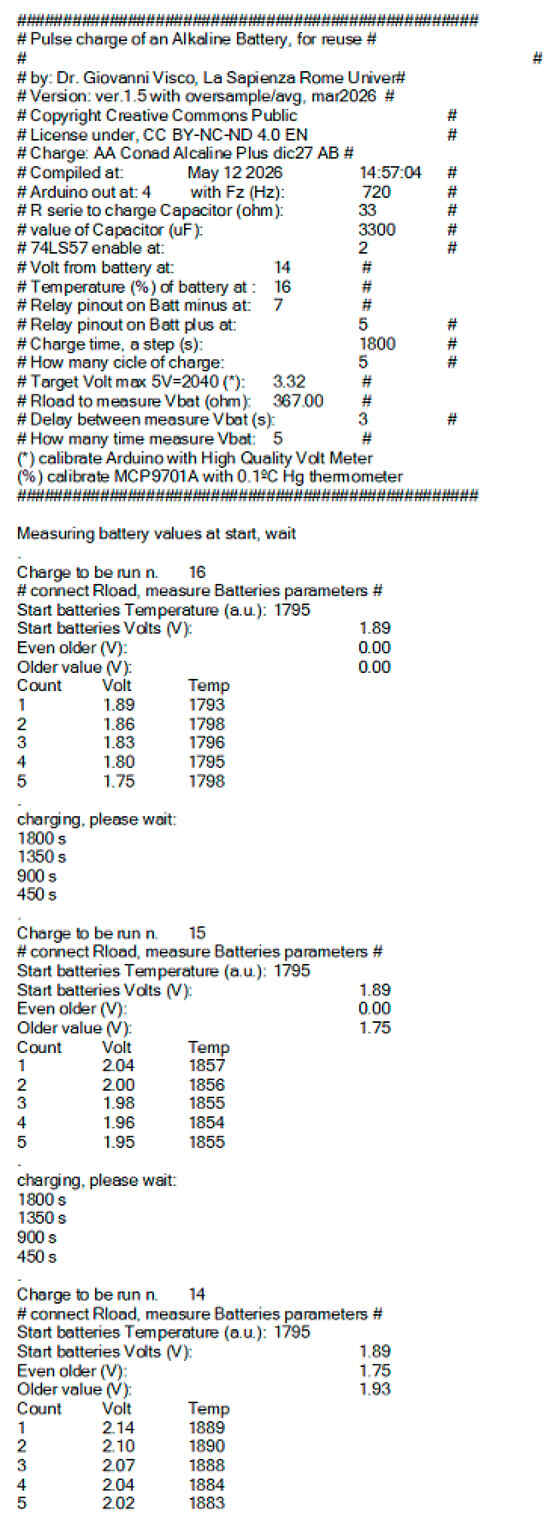
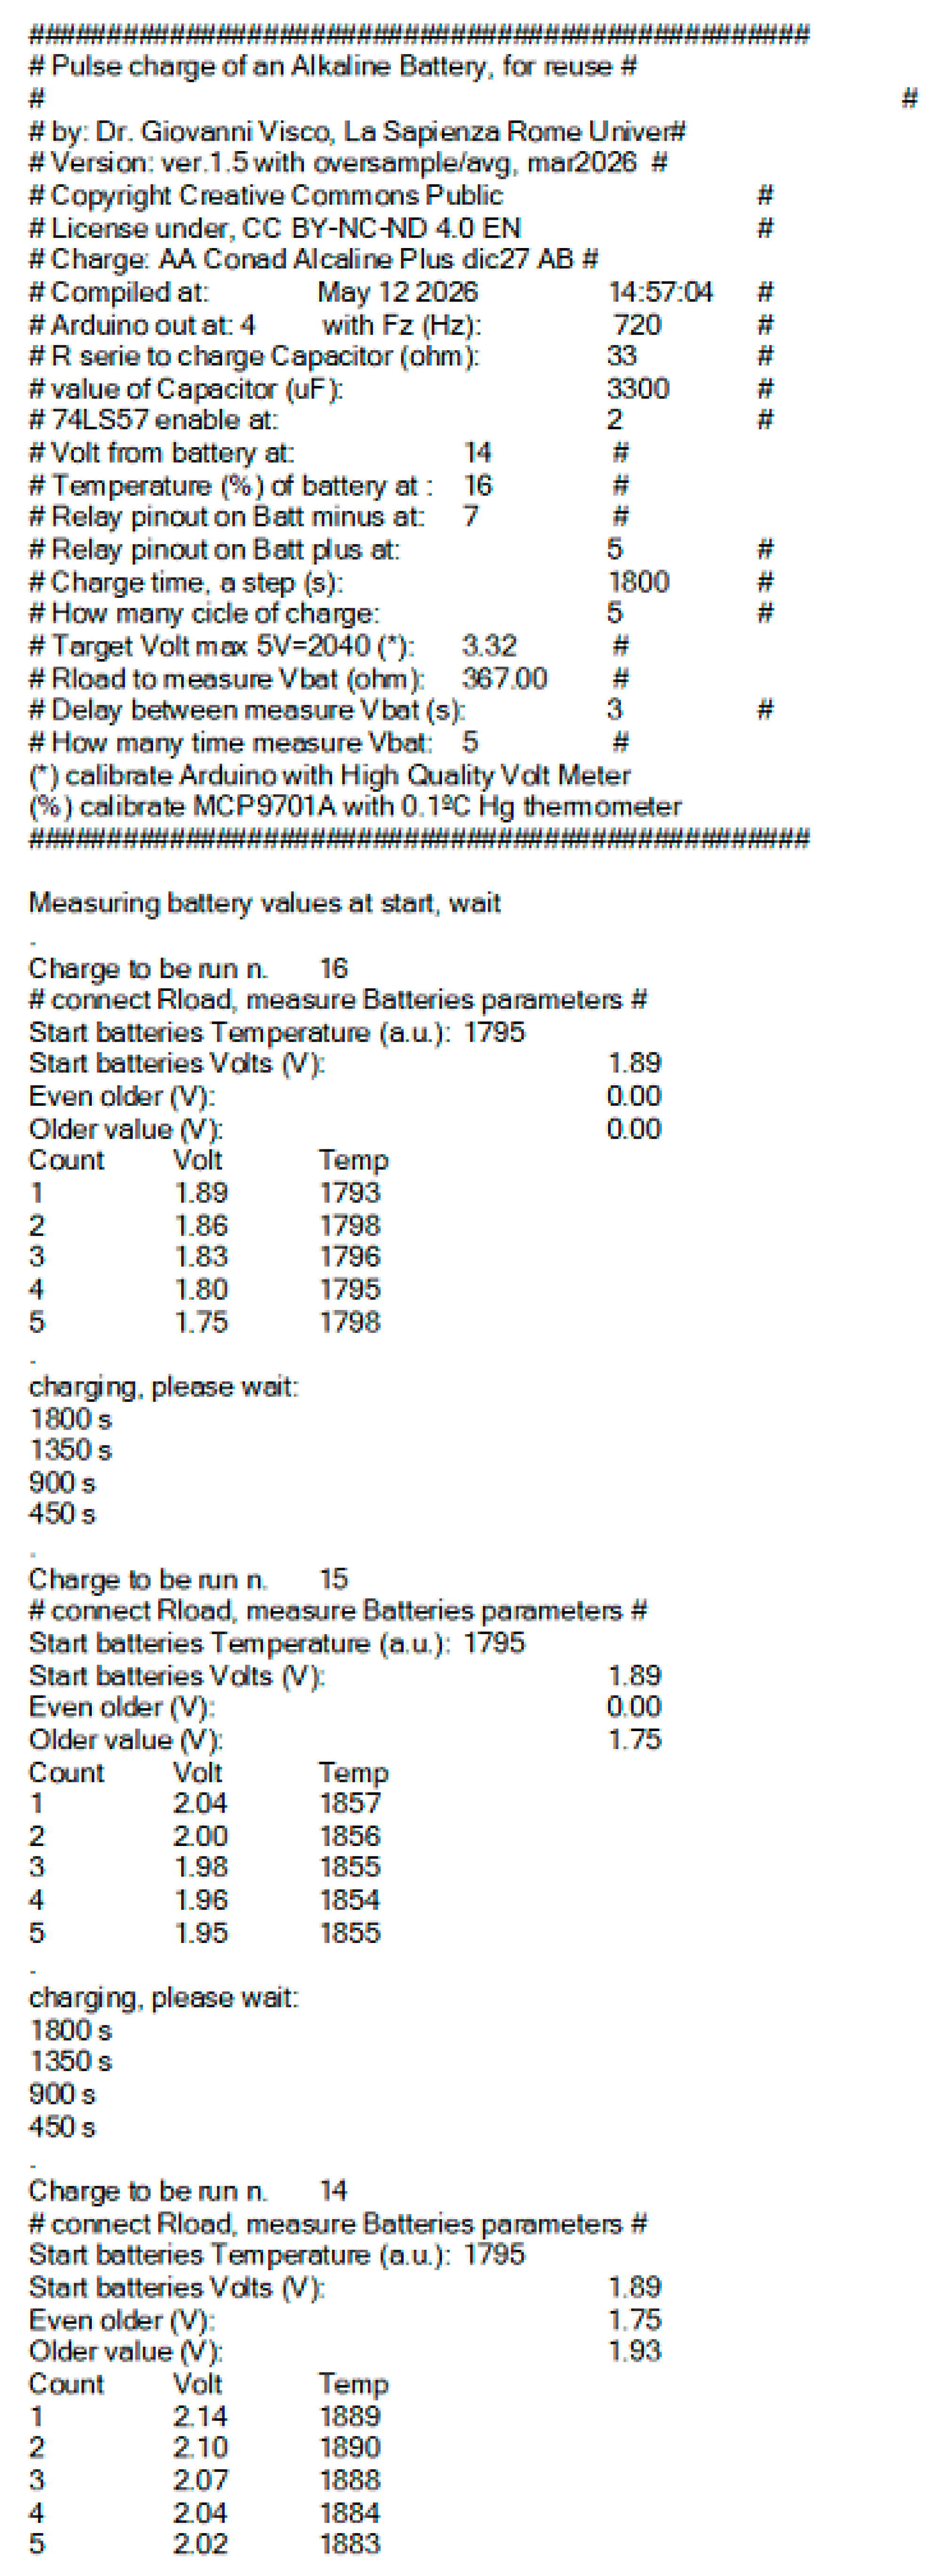
As an example of the charging sketch, we show in Figure 13 the initial part of the AA-Conad-Alcaline-Plus-dic27-AB_charge.txt file, which is instead reproduced in its entirety in the Supplementary Materials. It begins with the list of all the parameters set in the software (and easily modifiable with a minimum of experience with Arduino). The parameters set include the maximum potential that the battery pair could be achieved before stopping the process, with a maximum number of 16 charging cycles. Based on this, for each charging cycle, the initial value measured before the charging cycle and the maximum values reached in the three previous charging cycles are reported. During charging, five measurements of the residual charge and temperature are taken.
Figure 13.
Beginning part of the text come out from the sketch during recharge.
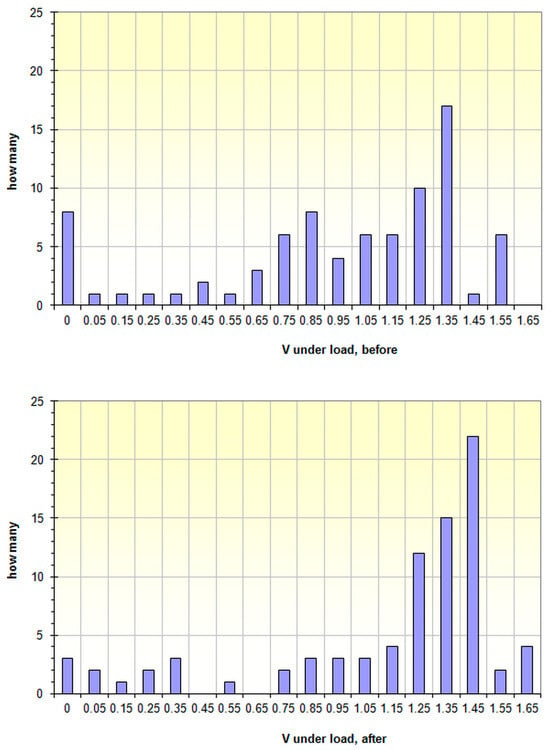
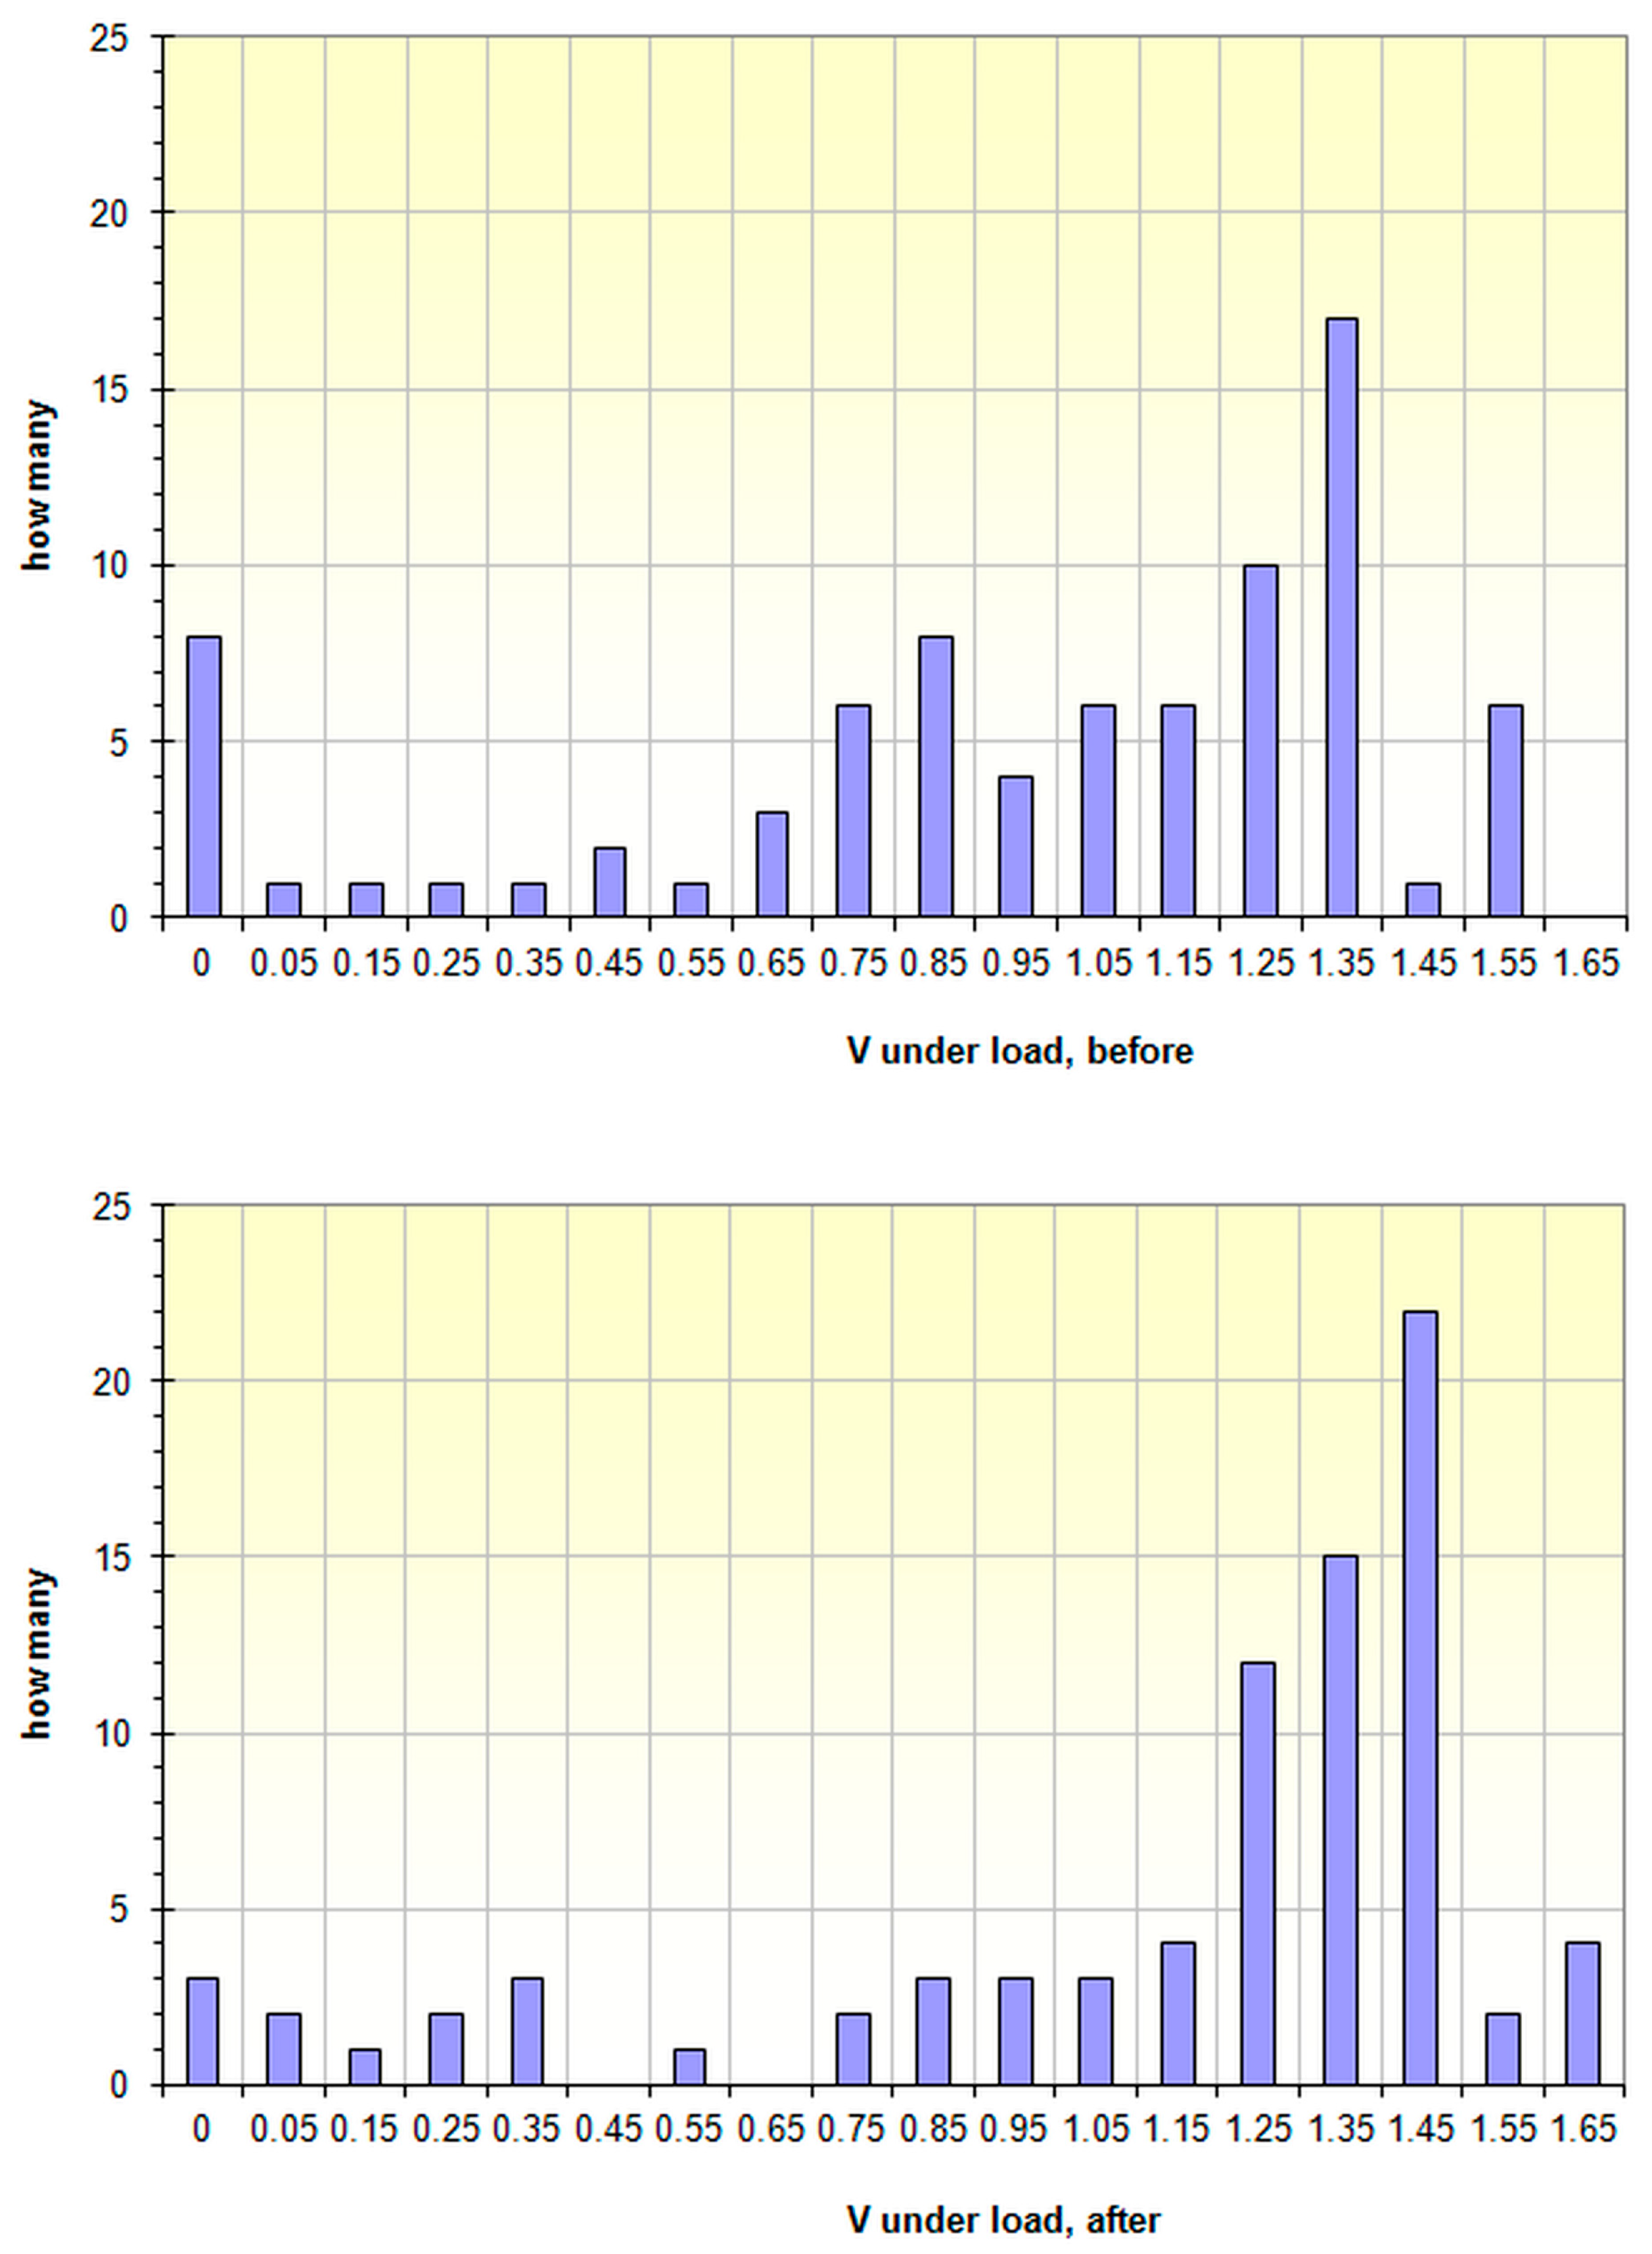
Figure 14 and Table 2 summarize the results obtained for the 82 batteries (41 pairs) whose residual charge was measured both before and after the charging process. It can be seen that almost all the batteries recovered some of their energy during charging and, above all, the maximum values measured after charging shifted toward higher values and were contained within a narrower range, including values between 1.2 and 1.4 V; these correspond to those of still functional batteries.
Figure 14.
Comparison of the residual charge of the 82 batteries measured both before (top) and after (bottom) charging.
Table 2.
State of charge of the 82 batteries the measurement of which was carried out both before and after the charging process.
Table 2 shows that 18.3% of the tested batteries exhibited leakage (indicated in red with “YES”). In most of them an expected decrease in residual charge after charging was also evident, which negatively impacted the data statistics. Only two batteries leaked immediately after the measurement, while the remaining ones leaked during the week of monitoring, which was carried out to account for a possible slow effect of the increase in internal pressure. Since the charging protocol is the same for all tested batteries, we believe that the loss is related to their previous use and not to the expiration date or residual charge, as can be visually verified by the data in sheet “diff” (see A70-F84) of the file Alkaline_REcharged-measure-v1.1.xls in the EDF. We do not have the same number of batteries for each brand; therefore, even though the percentage of leaking batteries appears to vary between brands, it would be incorrect to look for a correlation between brand and leaking. However, leakage can occur also during the normal use; in fact, the American Federal Trade Commission already stated in 1964 that battery producers cannot declare that they are Leakproof [51].
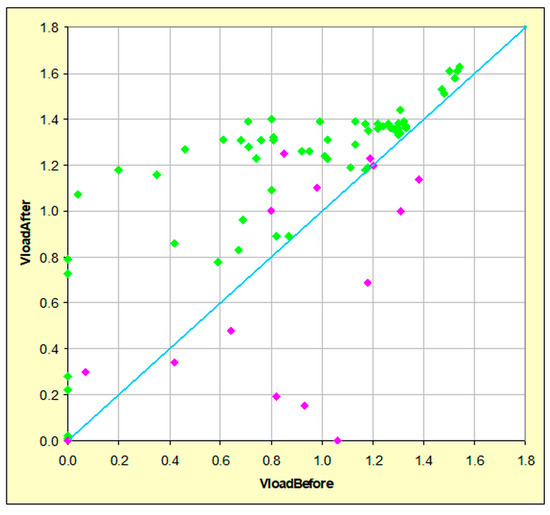
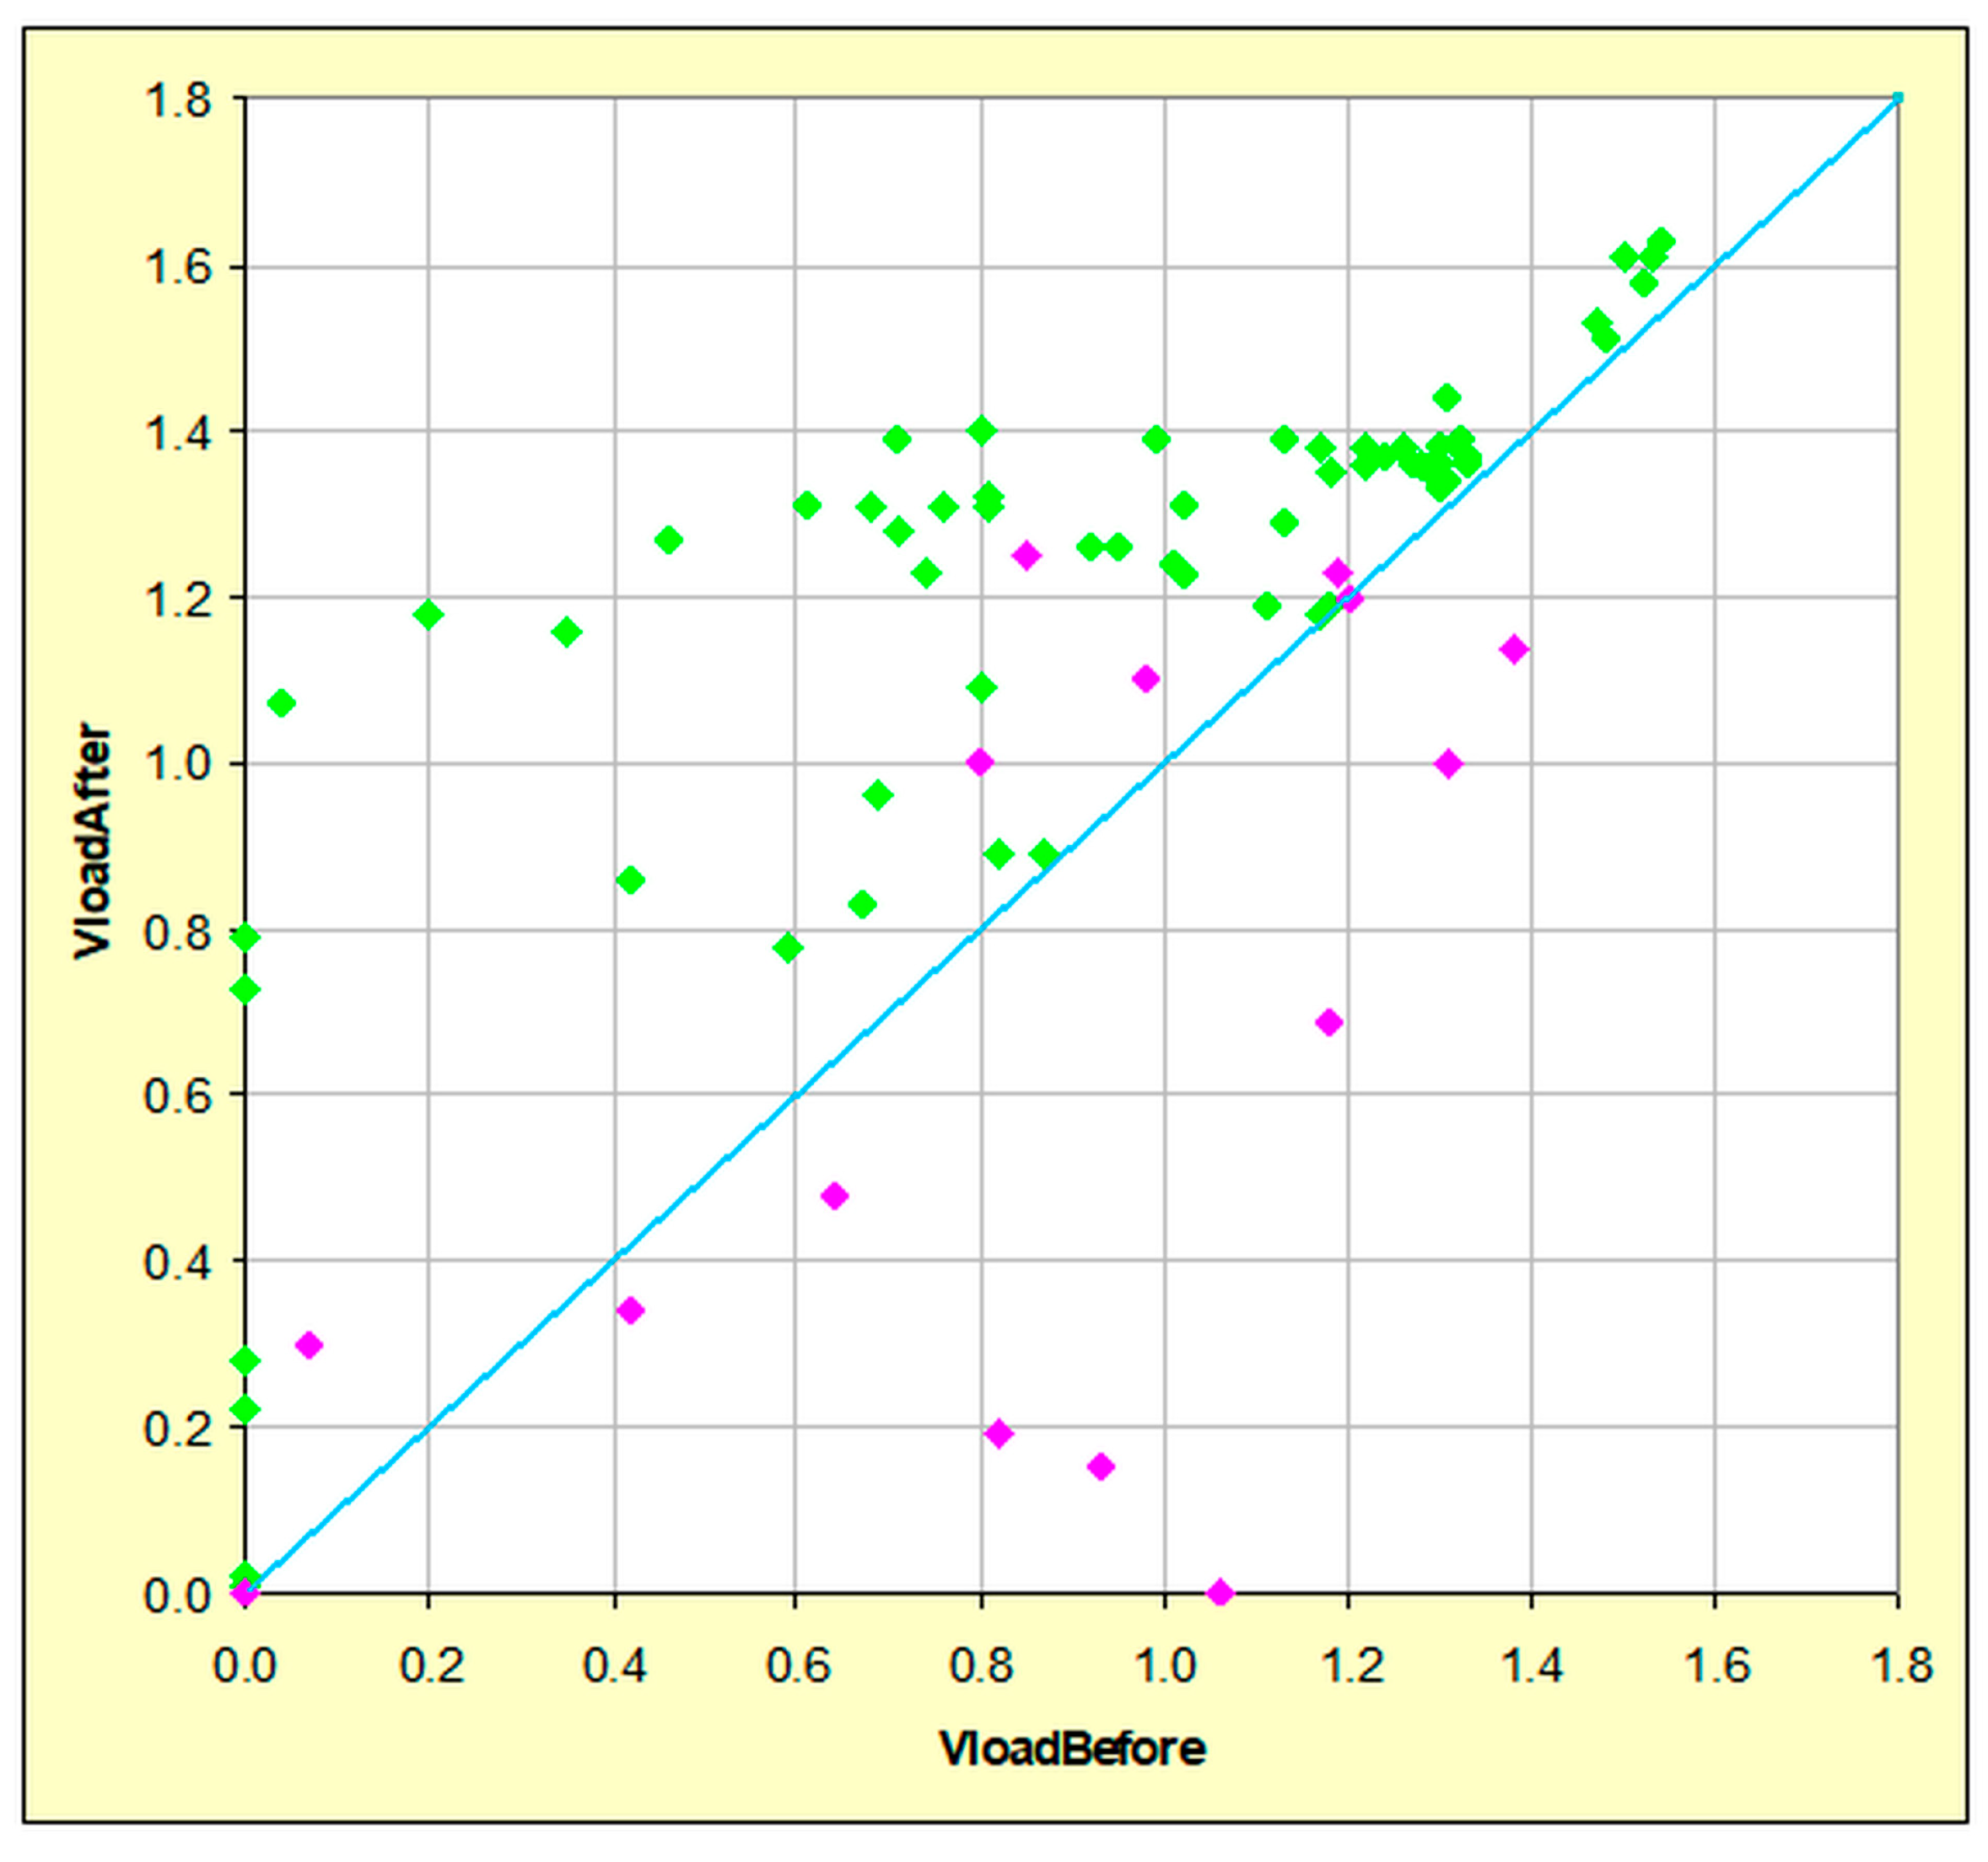
The correlation graph between the residual charge measured before and after charging (Figure 15) better highlights the charging results. It clearly evidences that only for the majority of the batteries that experienced a leak the charging process resulted inefficient, while, excluding some values with zero residual charge before charging, a more or less significant increase is observed, which for initial values above 0.5 V increases the values after charging between 1.2 and approximately 1.4 V. It is also noted that for already high initial values, as expected, the increase is smaller while very few batteries reached the voltage of 1.5 V, which is that of a new battery; so future research will need to investigate the reasons for incomplete charging.
Figure 15.
Correlation graph between the measured residual charge before and after the recharging process. The pink and green dots refer to batteries that have leaked or not leaked fluid respectively.
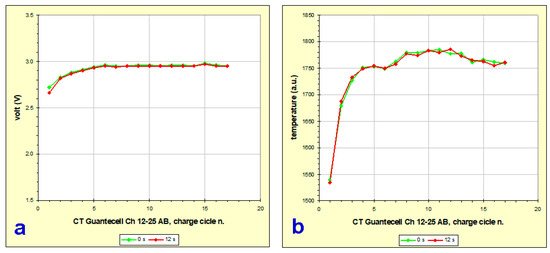
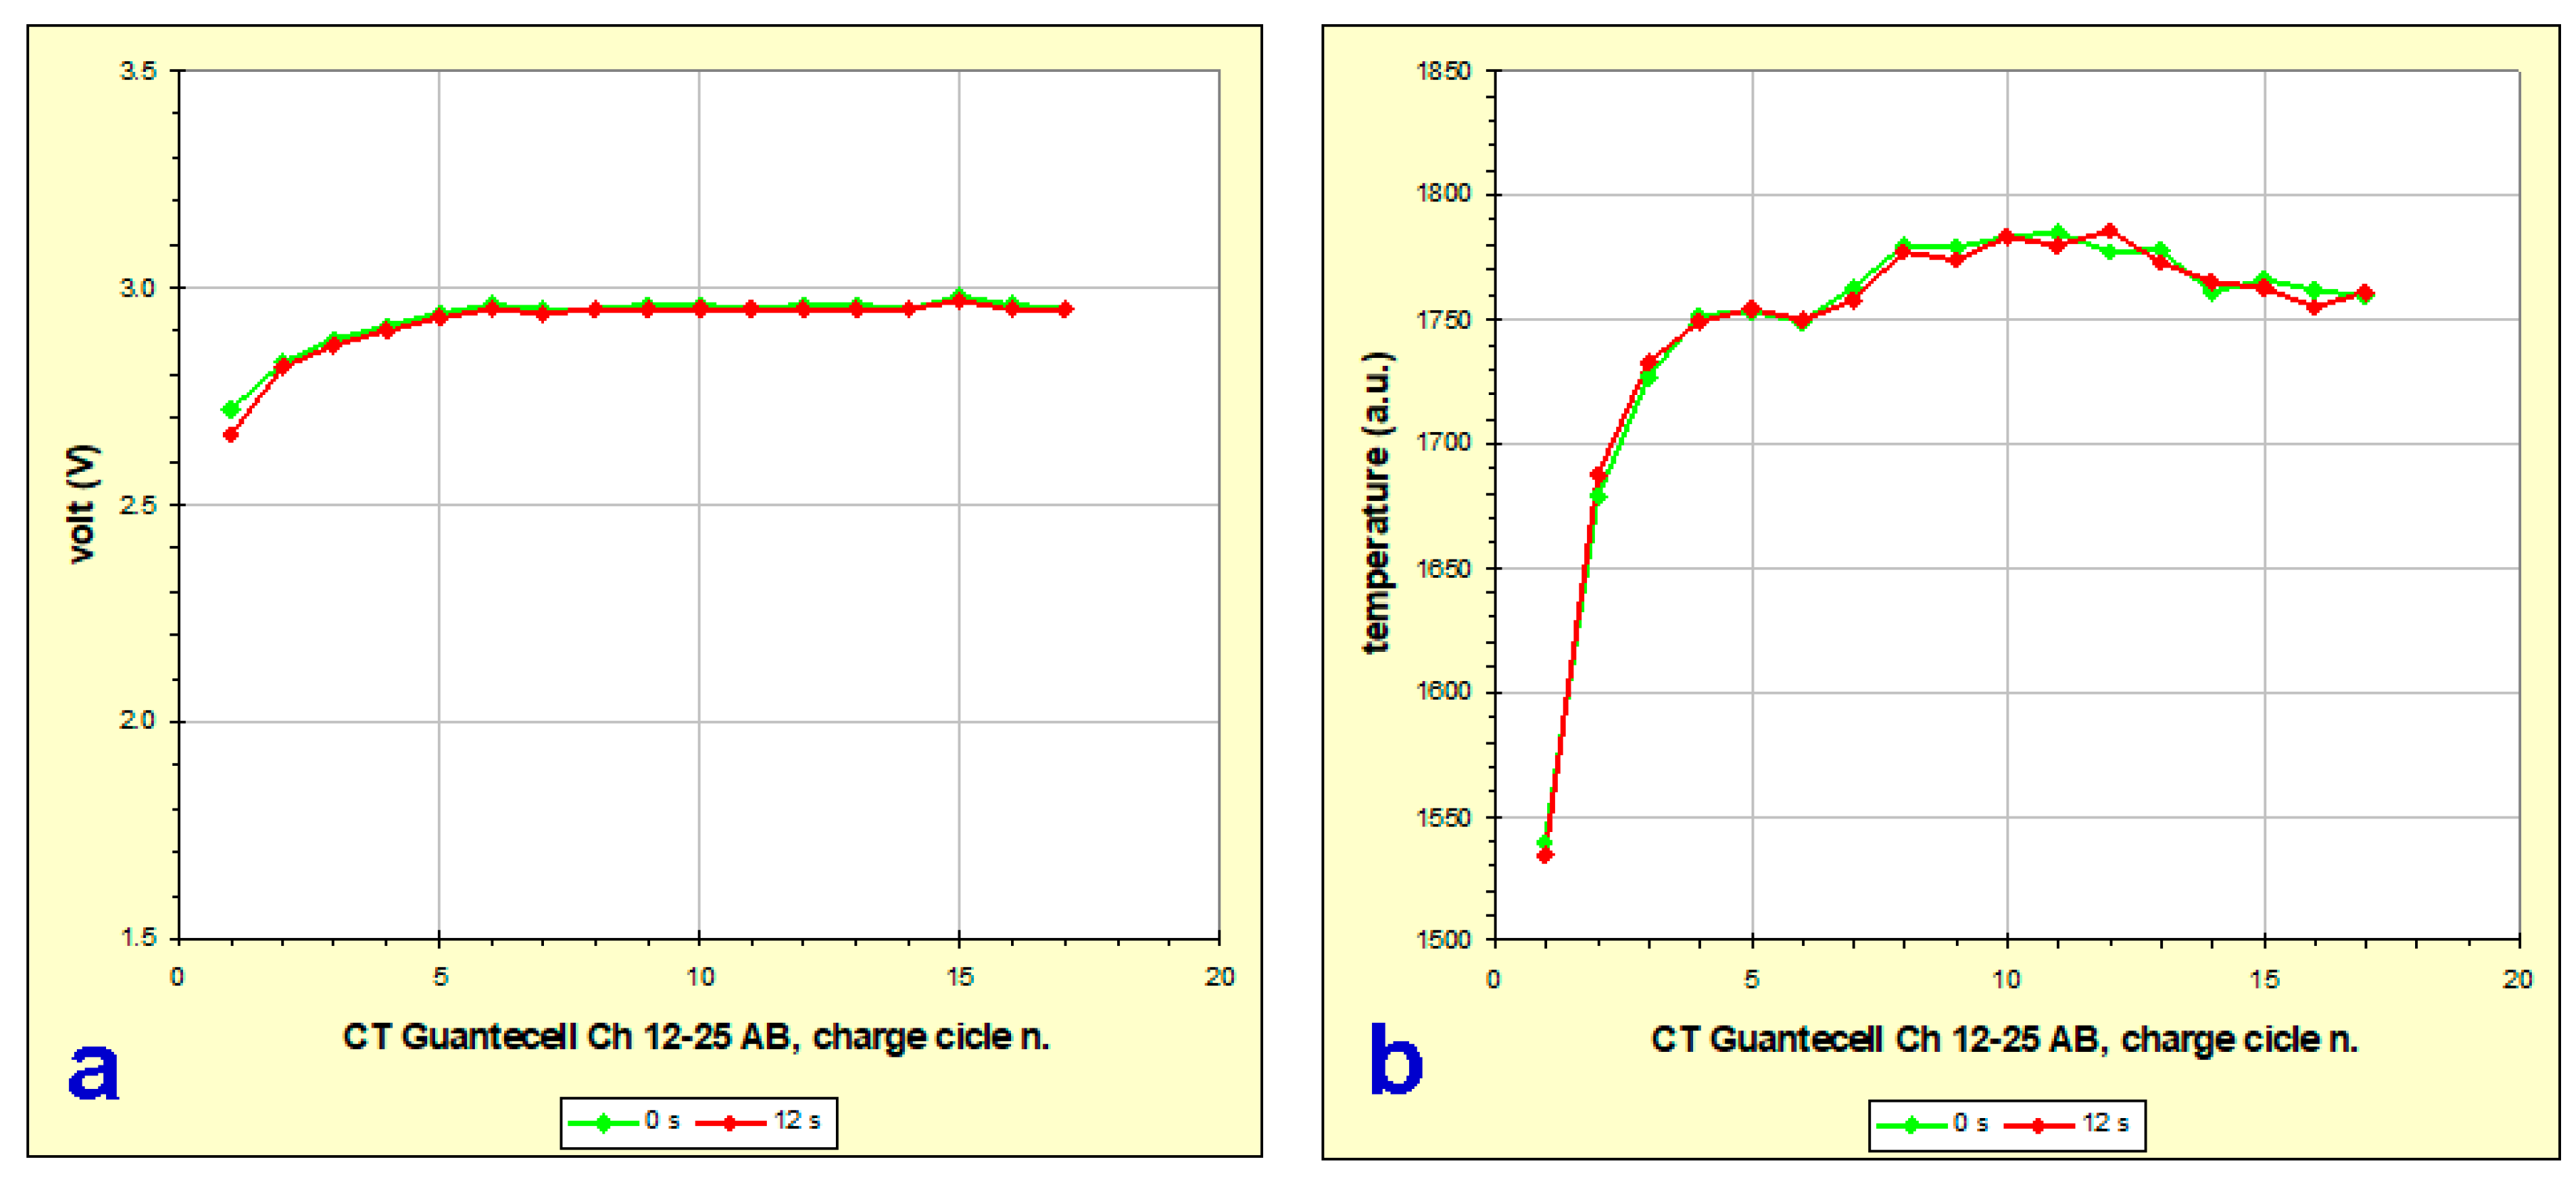
Using the data from the excel file Alkaline_in-re-charge.xls, reported in Supplementary Materials, we obtain as an example the trend of the residual charge (Figure 16a) and of the temperature of the battery holder (Figure 16b) during the charging process of a batteries couple (AA CT Guantecell Ch 12-25 AB).
Figure 16.
(a) Trend of the residual charge during the recharging process of a battery couple; (b) trend of the battery holder temperature during the recharging process of a battery couple.
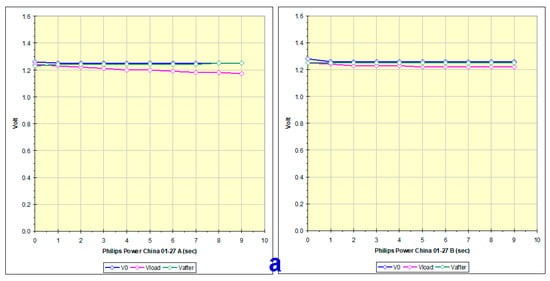
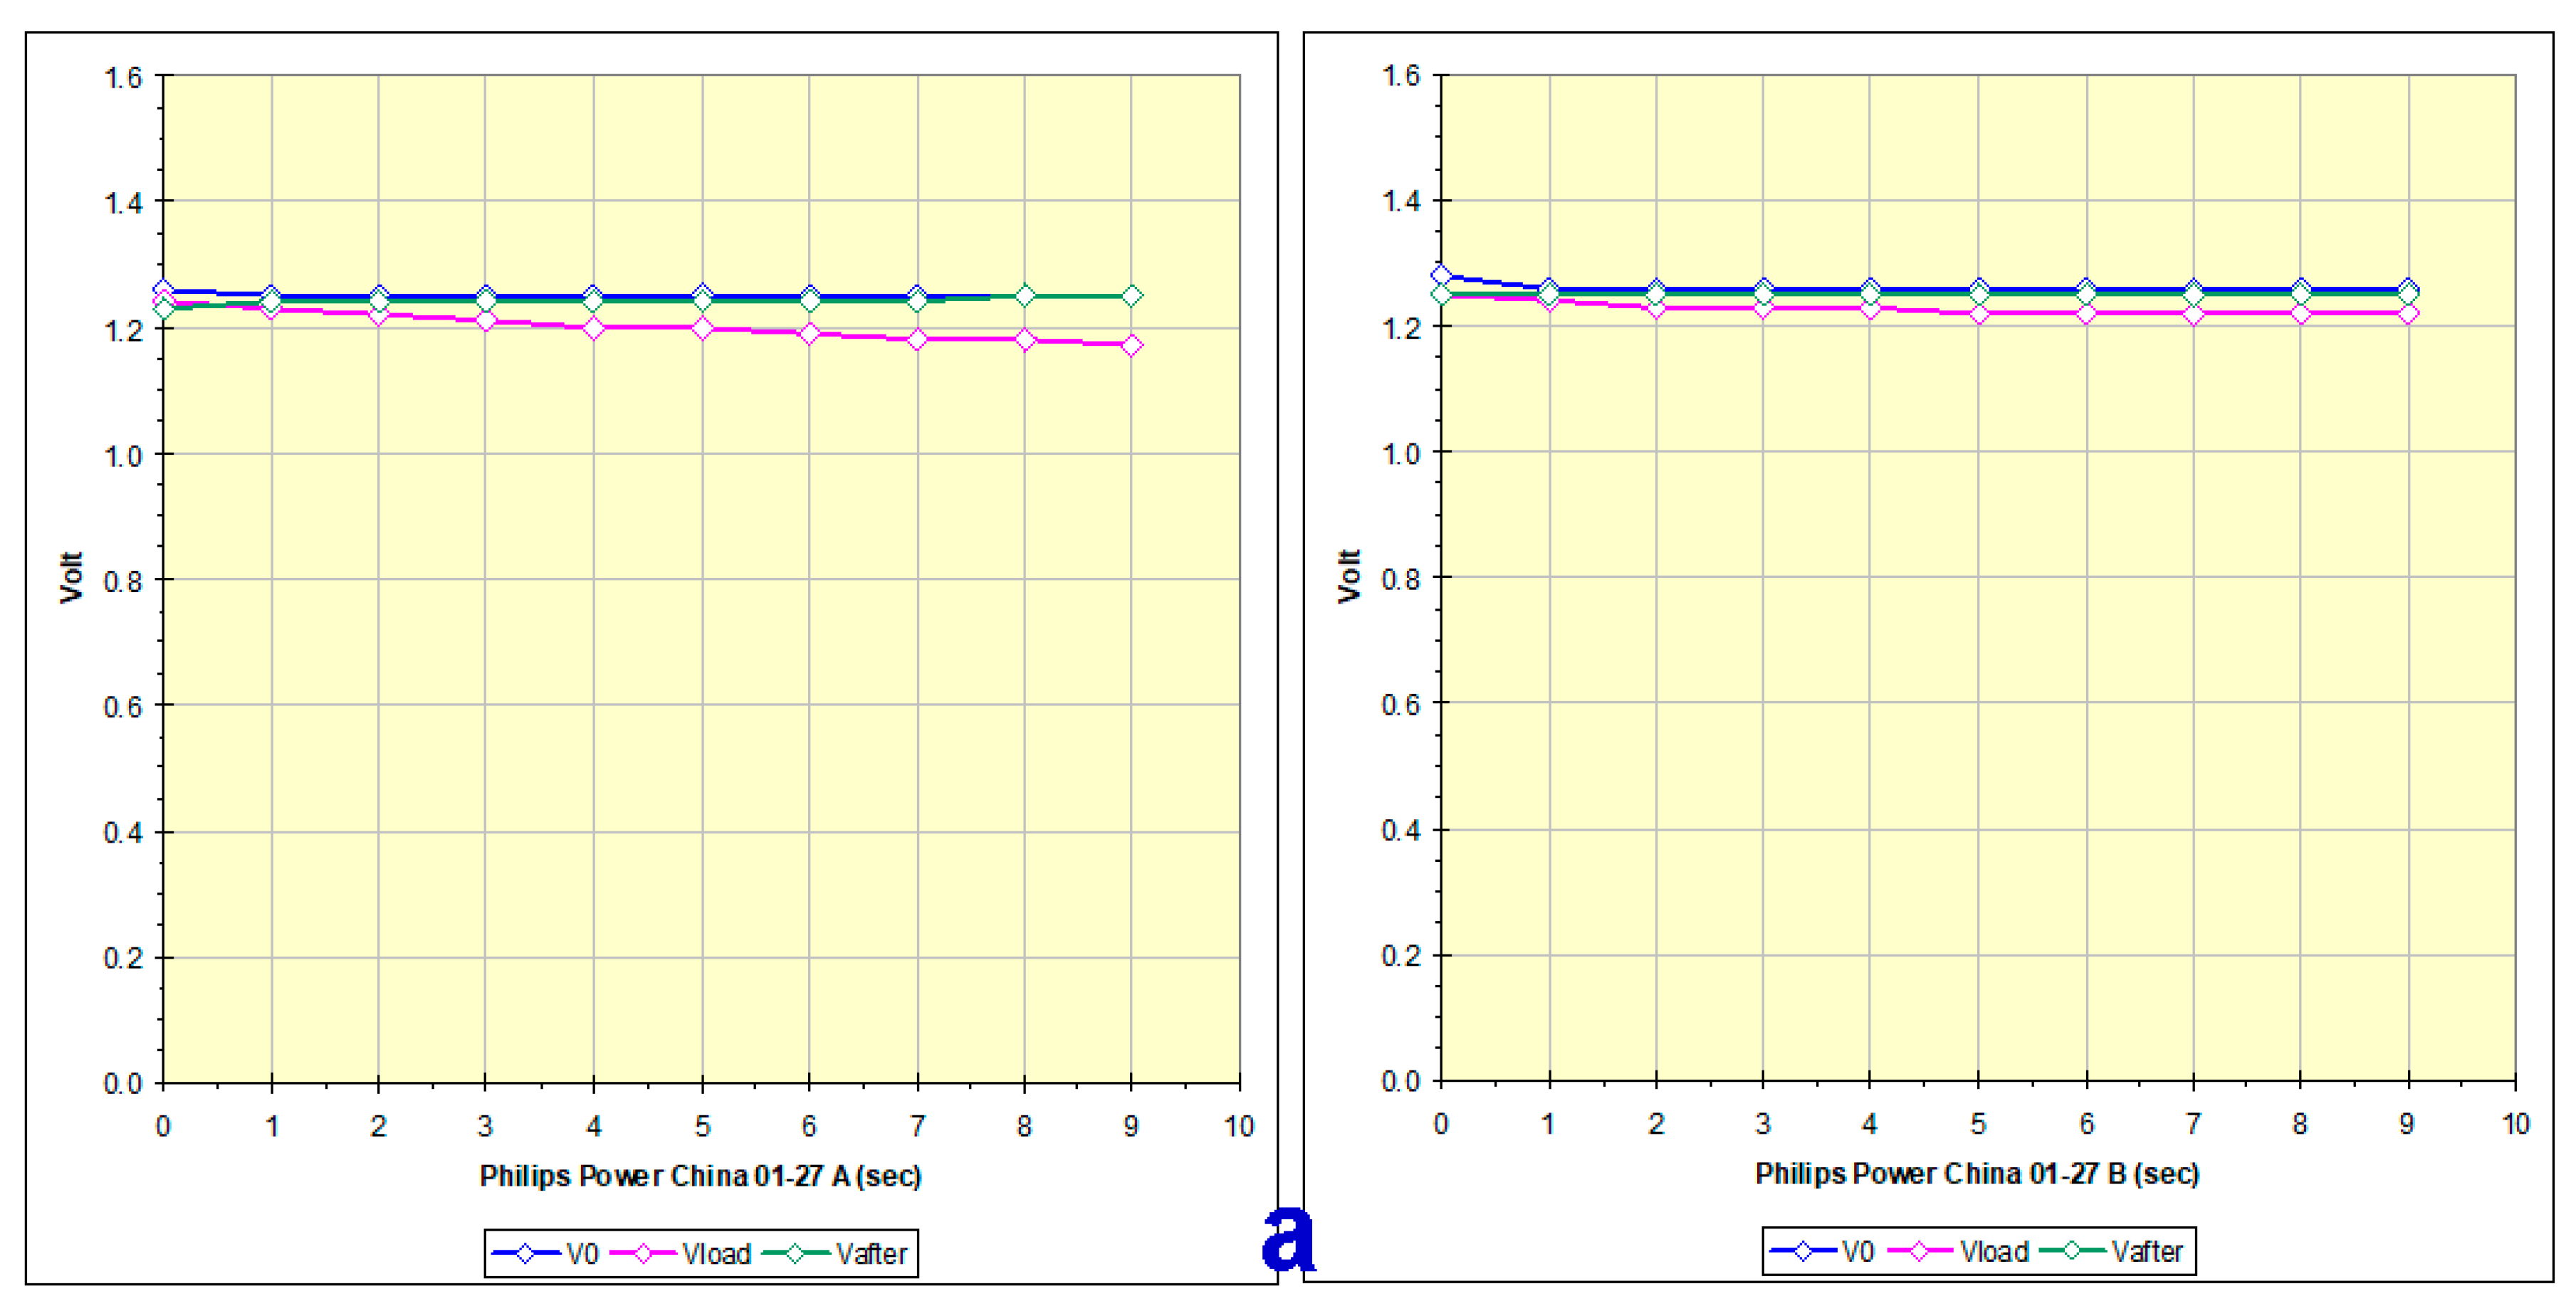
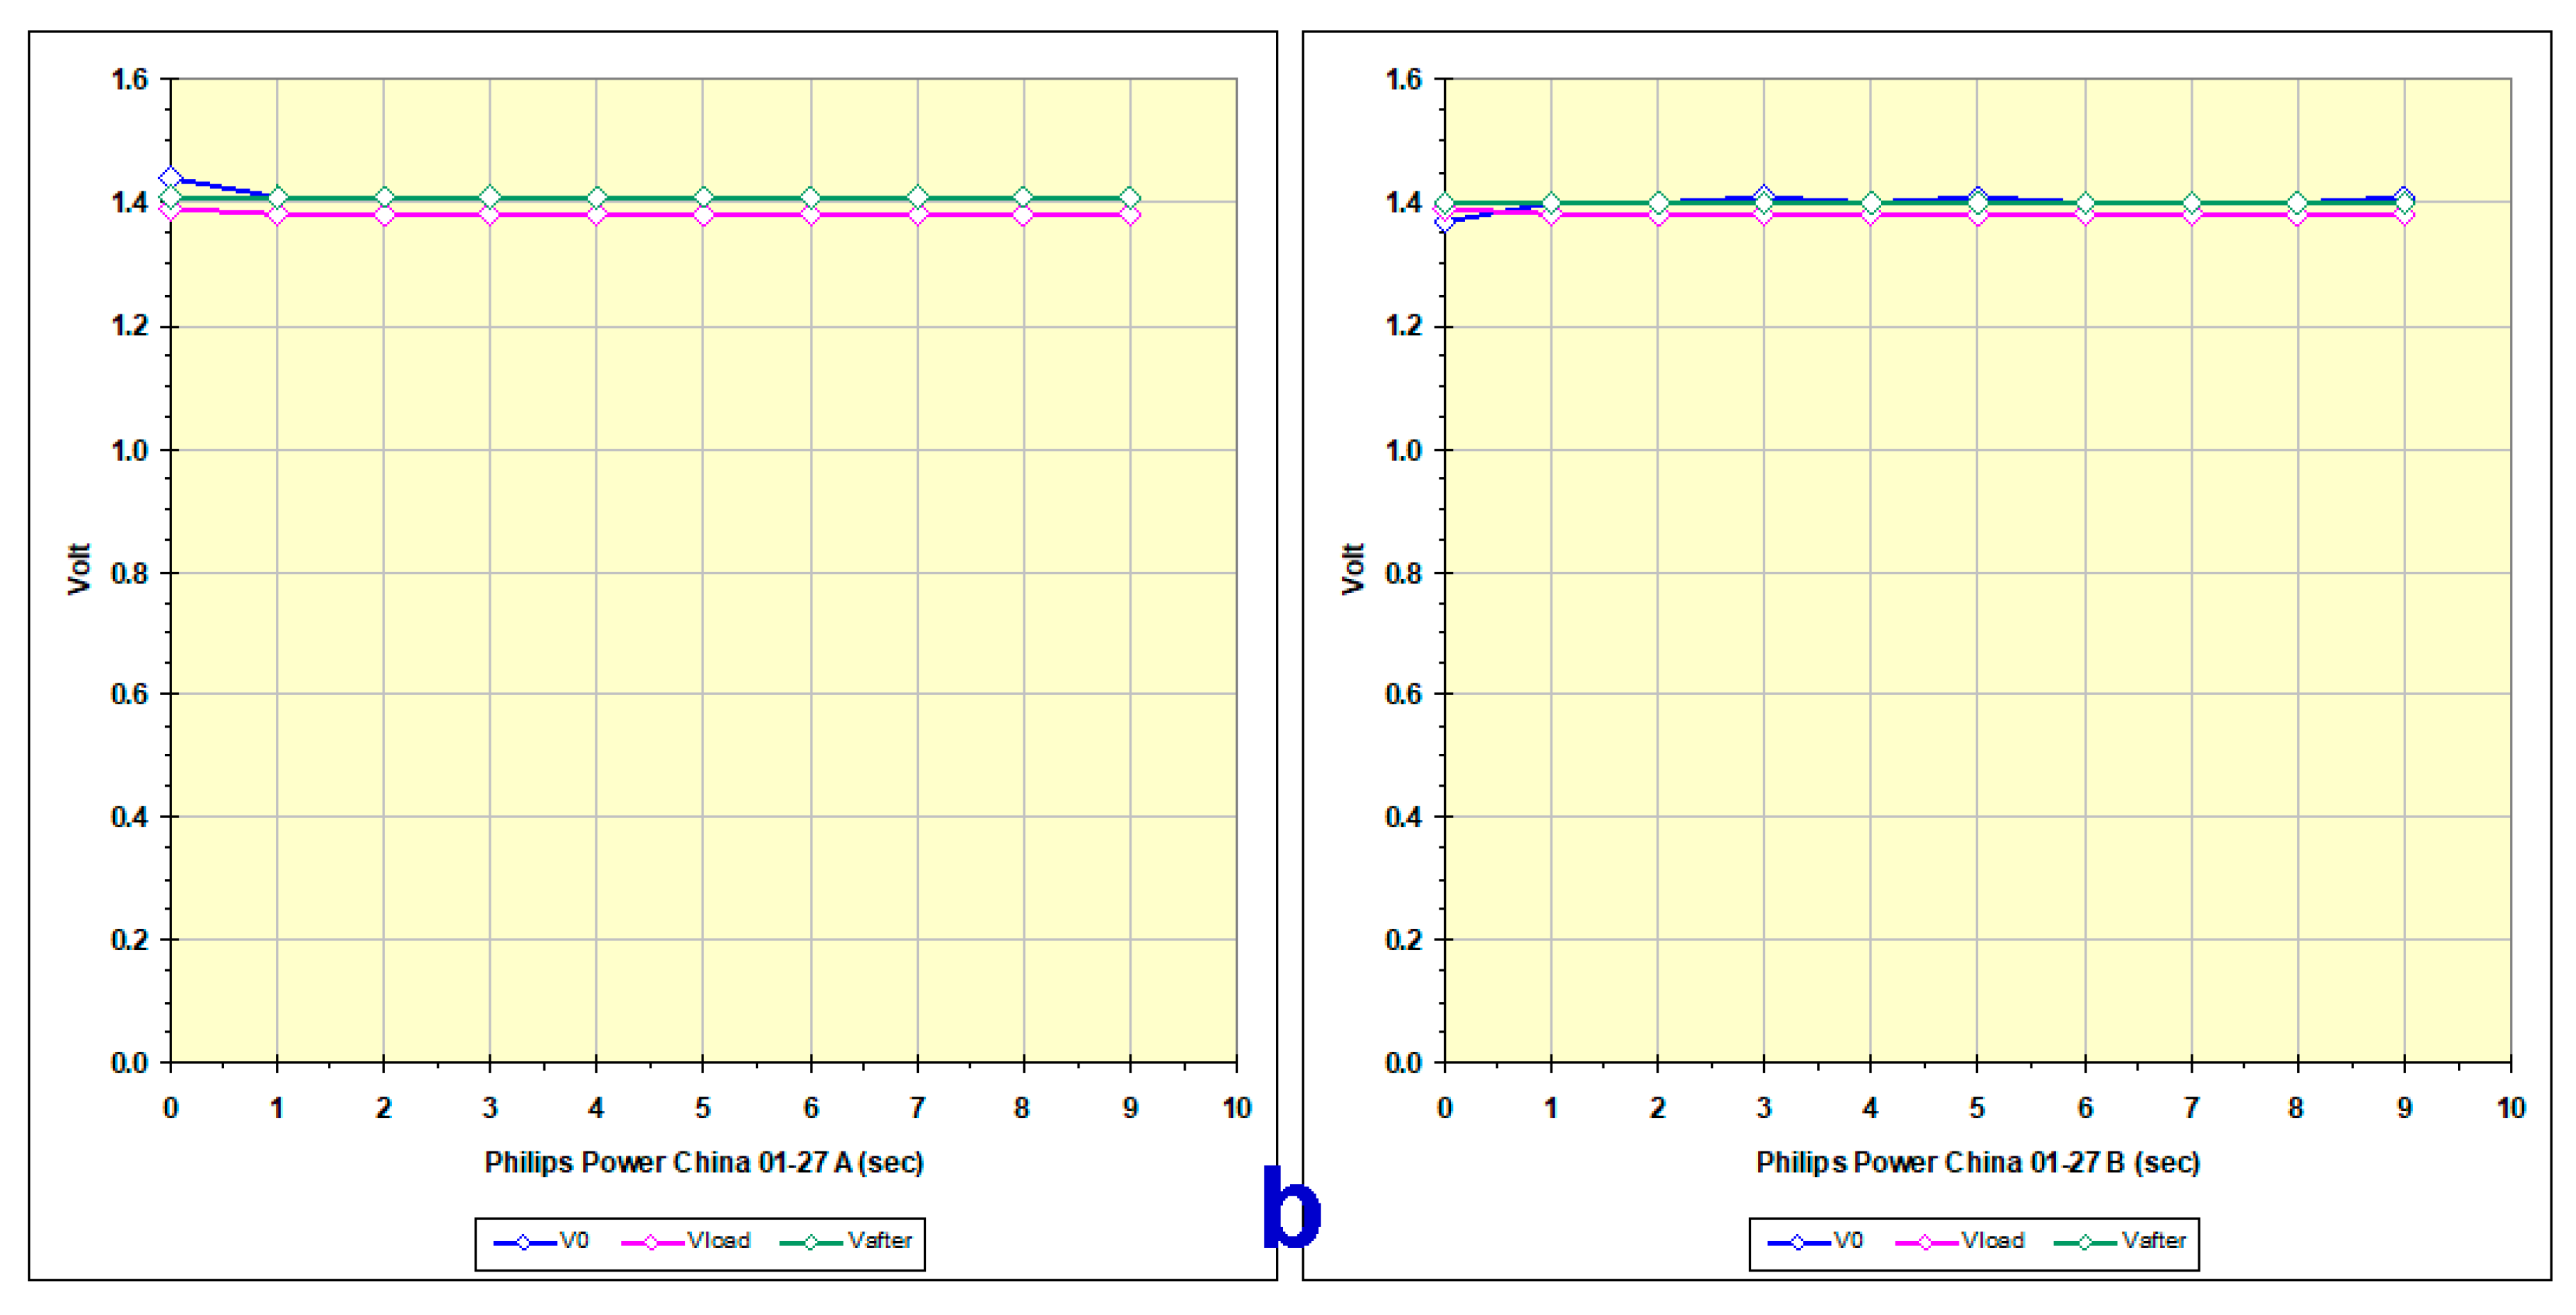
As mentioned above, the difference between the residual charge measured first and after the recharging process is used to evaluate the efficiency of the process itself. So, just as an example, we report the graphs of the residual charge measured before and after (Figure 17a,b) the charging process of the pair of Philips Power China 01-27 batteries.
Figure 17.
(a) Trend of the residual charge of a pair of batteries of the same brand and initial voltage during its measurement before charging; (b) trend of the residual charge of a pair of batteries of the same brand and initial voltage during its measurement after charging.
Comparing the four graphs, we note an increase in voltage for both batteries in the pair, but more importantly, an improvement in the pink curve, which shows the slow discharge behavior under low load, now constant and almost superimposable on the two curves measured at high impedance. The endpoint of the purple curve for each battery allows us to construct a table that we can use to generate statistics and efficiency calculations.
The data in Table 2 and in Figure 14 are processed to obtain statistical data, reported in Table 3, that better represent the results. An increase in the mean value and a reduction in the standard deviation are noted. The median is not affected by extremely high or low values, so we can observe a strong increase in its value, confirmed by the reduction in the difference between the third and second quartile (Q3-Q2).
Table 3.
Statistical data for the measures of the residual charge under low load for the 82 tested batteries.
4. Conclusions
Using pulse charging via capacitor discharge, a good number of alkaline batteries can be brought back to daily use by reversing the chemical reactions occurring between their electrodes. Discharging a capacitor is an excellent method for overcoming any activation energies associated with reverse reactions without continuously subjecting the battery’s chemical system to high currents or voltages, thereby achieving voltage values that do not cause the battery to overcharge. After charging, the batteries were left to rest for at least a week, then analyzed for any leakage, which unfortunately occurs in approximately 18% of them (only two batteries leaked immediately after the recharging and SOC measurement), although it is present in only two or three brands. On the contrary, no battery exploded during the charging process or the rest period. In any case, the entire procedure must be considered potentially dangerous and can therefore only be performed by experts in safe conditions. Figure 14 and Figure 15, as well as Table 2, show an increase in residual charge after charging for almost all batteries, but very few fully charge, even though there appears to be a limit of 1.4 V. It can be noted that, with a few exceptions, only for batteries that have leaked (pink dots) the state of charge (SOC) not increase (values below the perfect correlation line, light blue line). The percentage of batteries with residual charge above 1.2 V, and therefore still usable, increases from 41.4% to 67.0%. Table 3 shows that the median values have increased by 0.24 V and the arithmetic mean by 0.19 V, with a reduction in data dispersion, as evidenced by the smaller standard deviation and interquartile range. Subsequent work, already planned on a much larger number of batteries for better statistics, involves studying the capacitor charging frequency and its capacitance, as well as the charging resistance, i.e., the peak voltage applied to the battery, to achieve more charge cycles, a lower leakage rate, and a higher final voltage. Given our propensity for open-source, the software, written for Arduino Uno R3, has a lot of comments inside and the circuits presented are also well described, so those can become a pilot system and then a commercial product, but all the presented projects are under Copyright CC BY-NC-ND 4.0 EN [42].
Supplementary Materials
The following supporting information can be downloaded at: https://www.mdpi.com/article/10.3390/chemistry8080104/s1. Reference [52] is cited in Supplementary Materials. All the supplementary files are collected and saved in only one zip file. The S.M. contains: (1) 4 files IMG_20251217_**.jpg with photos of the instrument and some of its details at high resolution; (2) 4 files named AA-Energizer-Red-12-21-****.txt containing data on the residual charge of a couple of batteries, measured before (very low) and after recharging, using the instrument and protocol developed in our previous research [29]; (3) the file AA-Conad-Alcaline-Plus-dic27-AB_charge.txt produced by the sketch during the recharging process; (4) the file Alkaline1.5.ino with the sketch ver.1.5 with which the recharging is carried out; (5) the file Alkaline_in-re-charge.xls with measurements during the charging process, with graphs not presented in the paper; (6) the file Alkaline_REcharged-measure-v1.1.xls with the residual charge measurements of the 82 batteries with additional comparison tables and graphs not presented in the paper; (7) the file Alkaline_extract_before-after.xls for MS Excel 2003 or later contains scripts for extracting data from the Arduino .txt files in the previous paper, which measures the remaining charge, and for extracting data from the .txt files in this paper; it also illustrates one of the worst-case scenarios for battery recharging attempts (batteries Energizer Red 12-21 A-B); (9) th file V-Bits-Temp_calibration_v1.5.xls for MS Excel 2003 show the calibration of volt/bit and temperature/bit performed before the measurement and saved in the sketch; (9) the file Duracell-permission.htm, containing Duracell’s permission to mention their batteries; (10) the file type-composition-use-of-Alkaline-batteries.doc contains tables showing the composition of some brands of alkaline batteries, the figures referred to but not included in the paper, and a number of quotes from various European agencies on sustainability and statistics relating to the battery sector.
Author Contributions
Each author has contributed to the development of this work and endorses the version submitted The following contributions are awarded to the authors: conceptualization, G.V.; methodology, G.V., M.T., M.C.; software, G.V.; validation, M.A., M.C.; formal analysis, M.T., M.P.S.; investigation, G.V., M.A.; resources, G.V., M.C.; data curation, G.V.; writing, original draft preparation, G.V., M.P.S., M.C.; writing, review and editing, M.C., M.T., M.P.S.; visualization, M.C.; supervision, M.T., M.P.S.; project administration, M.P.S. All authors have read and agreed to the published version of the manuscript.
Funding
This research received no external funding.
Data Availability Statement
The original contributions presented in this study are included in the article/Supplementary Material. Further inquiries can be directed to the corresponding author.
Acknowledgments
The authors would like to thank the Markets and Supermarkets and electronic store for donating the batteries that had to be disposed of; the materials used for this work. Once the work was completed, all the batteries were disposed of in accordance with current Italian legislation, i.e., at municipal collection points.
Conflicts of Interest
The authors declare no conflicts of interest. Brands mentioned in any section of the work are written only for reference necessary for classification and calculation. No form of “quality” can be inferred from the published data.
References
- Dolci, G.; Tua, C.; Grosso, M.; Rigamonti, L. Life cycle assessment of consumption choices: A comparison between disposable and rechargeable household batteries. Int. J. Life Cycle Assess. 2016, 21, 1691–1705. [Google Scholar] [CrossRef] [Scilit]
- Lee, C.-H.; Wang, W.-C.; Jiang, J.-A.; Hsu, S.-H.; Lee, C.-W. A Method for Draining Leftover Energy From Waste Lead–Acid Batteries Prior to Recycling. IEEE Trans. Ind. Inform. 2025, 21, 3438–3447. [Google Scholar] [CrossRef] [Scilit]
- European Portable Battery Association (EPBA). The Collection of Waste Portable Batteries in Europe in View of the Achievability of the Collection Rates Stipulated by the EU Batteries Directive and EU Batteries Regulation, Short Update with 2021 and 2022 Data. 14 October 2024. Available online: https://www.epbaeurope.net/assets/Report-on-the-portable-battery-collection-rates---Short-Update-Jun-24---Final_2.pdf (accessed on 17 May 2026).
- Eurostat. Waste Statistics—Recycling of Batteries and Accumulators. November 2024. Available online: https://ec.europa.eu/eurostat/statistics-explained/index.php?title=Waste_statistics_-_recycling_of_batteries_and_accumulators (accessed on 17 May 2026).
- Régénérateur Pour Piles Alcalines. Elektor Magazine, December 1996; p. 20.
- Baicu, L.; Andrei, M.; Dumitrascu, B. Embedded system for charging alkaline batteries. In Proceedings of the 2023 IEEE 29th International Symposium for Design and Technology in Electronic Packaging (SIITME), Craiova, Romania, 18–22 October 2023; pp. 246–250. [Google Scholar] [CrossRef] [Scilit]
- Lemaire-Potteau, E.; Perrin, M.; Genies, S. Batteries, Charging Methods. In Encyclopedia of Electrochemical Power Sources, Reference Module in Chemistry, Molecular Sciences and Chemical Engineering; Garche, J., Ed.; Elsevier B.V.: Amsterdam, The Netherlands, 2009; pp. 413–423. ISBN 978-0-444-52093-7. [Google Scholar]
- Riggle, D. Schools teach the new 3 R’s. BioCycle 1990, 31, 61. [Google Scholar]
- Bagozzi, R.P.; Dabholkar, P.A. Consumer recycling goals and their effect on decisions to recycle: A means-end chain analysis. Psychol. Mark. 1994, 11, 313–340. [Google Scholar] [CrossRef] [Scilit]
- Safa Okşaş, A. Synthesis and Characterization of Manganese Dioxide Cathodes for Zn-Ion Batteries. Master’s Thesis, Politecnico di Milano, Milan, Italy, 2021; pp. 1–92. [Google Scholar]
- Qu, D.Y.; Conway, B.E.; Bai, L.; Zhou, Y.H.; Adams, W.A. Role of dissolution of Mn(iii) species in discharge and recharge of chemically-modified MnO2 battery cathode materials. J. Appl. Electrochem. 1993, 23, 693–706. [Google Scholar] [CrossRef] [Scilit]
- Daniel-Ivad, J.; Kordesch, K. Rechargeable Alkaline Manganese Technology: Past-Present-Future. In Proceedings of the 201st Meeting of The Electrochemical Society, Philadelphia, PA, USA, 12–17 May 2002; p. 257. [Google Scholar]
- Farrington, M.D. Rechargeable alkaline manganese dioxide cells. A test report. J. Power Sources 1997, 65, 87–92. [Google Scholar] [CrossRef] [Scilit]
- Texas Instruments Incorporated. Using the BQ2902/3 Rechargeable Alkaline ICs. Application Notes. 1999. Available online: https://www.ti.com/lit/an/slua029/slua029.pdf (accessed on 17 May 2026).
- Douglas, M.E. Alkaline Single Cell Batteries and Rechargers: Results of Preliminary Tests; Conservation Advisory Science Notes No. 119; Department of Conservation: Wellington, New Zealand, 1995; p. 17. [Google Scholar]
- Tiwari, P. North America Alkaline Battery Market Outlook to 2028; Ken Research, KROD9543. December 2024. Available online: https://www.kenresearch.com/industry-reports/north-america-alkaline-battery-market (accessed on 17 May 2026).
- Sichuan Changhong Newenergy Technology Co., Ltd. LR6 Safety Data Sheet. 2018. Available online: https://maxell-usa.com/wp-content/uploads/2020/06/SDS-Alkaline-Battery-LR6-AA-Cell.pdf (accessed on 17 May 2026).
- TruForce. Alkaline Battery Product Safety Data Sheet. 2015. Available online: https://www.heiserusa.com/resources/spec/HEI-INFO-TruForceBatteryPSDS.pdf (accessed on 17 May 2026).
- Duracell. Alkaline Manganese Dioxide Battery. 2014. Available online: https://www.microbattery.com/pub/media/tech-specs/duracell/duracell-alkaline-battery-017-2014.pdf (accessed on 17 May 2026).
- Johansen, J. Mathematical Modelling of Primary Alkaline Batteries. Ph.D. Thesis, Queensland University of Technology, Brisbane, QLD, Australia, 2007. Available online: https://eprints.qut.edu.au/16412/1/Jonathan_Johansen_Thesis.pdf (accessed on 17 May 2026).
- Bernardini, S.; Bellatreccia, F.; Della Ventura, G.; Ballirano, P.; Sodo, A. Raman spectroscopy and laser-induced degradation of groutellite and ramsdellite, two cathode materials of technological interest. RSC Adv. 2020, 10, 923–929. [Google Scholar] [CrossRef] [Scilit] [PubMed]
- Lim, M.B.; Lambert, T.N.; Chalamala, B.R. Rechargeable alkaline zinc–manganese oxide batteries for grid storage: Mechanisms, challenges and developments. Mater. Sci. Eng. R Rep. 2021, 143, 100593. [Google Scholar] [CrossRef] [Scilit]
- Balachandran, D.; Morgan, D.; Ceder, G. First Principles Study of H-insertion in MnO2. J. Solid State Chem. 2002, 166, 91–103. [Google Scholar] [CrossRef] [Scilit]
- Post, J.E.; Heaney, P.J. Neutron and synchroton X-ray diffraction study of the structures and dehydration behaviors of ramsdellite and groutellite. Am. Mineral. 2004, 89, 969–975. [Google Scholar] [CrossRef] [Scilit]
- Post, J.E. Manganese oxide minerals: Crystal structures and economic and environmental significance. Proc. Natl. Acad. Sci. USA 1999, 96, 3447–3454. [Google Scholar] [CrossRef] [Scilit] [PubMed]
- Pannetier, J.; Chabre, Y.; Filhol, A. Why Can’t Alkaline Batteries Be Recharged? D1B, CRG—High Intensity Two-Axis Powder Diffractometer, video for M6 French Métropole Television. 1995. Available online: https://www.ill.eu/users/instruments/instruments-list/d1b/examples/why-cant-alkaline-batteries-be-recharged (accessed on 17 May 2026).
- Société Les Piles Wonder. Caractéristiques Générales des Piles Alcalines au Bioxyde de Manganèse. 1985. Available online: http://seme.cer.free.fr/regeneration-piles-alcalines-wonder.pdf (accessed on 17 May 2026).
- Bodo, E.; Tomassetti, M.; Pagnanelli, F.; Sammartino, M.P.; Marchetti, A.; Castrucci, M.; Visco, G. Measuring the Remaining State-of-Charge of an Alkaline, Primary, Battery with Arduino and hand-made Instrument. In Proceedings of the 1st Joint Conference of ACee-GISEL, Padova, Italy, 21–23 July 2025. [Google Scholar]
- Visco, G.; Sammartino, M.P.; Marchetti, A.; Castrucci, M.; Tomassetti, M. Proposal for a Protocol and a Handmade Arduino-Based and Open Source Device for Measuring the Residual Charge of Alkaline Batteries in View of an Attempt to Recharge Them. Methods Protoc. 2026, 9, 66. [Google Scholar] [CrossRef] [Scilit] [PubMed]
- Sabbaghi, M.; Behdad, S. Estimating energy left in discarded alkaline batteries: Evaluating consumption and recovery oppor-tunities. Waste Manag. 2024, 189, 58–67. [Google Scholar] [CrossRef] [Scilit] [PubMed]
- Usuda, S.; Sunagawa, T.; Miyoshi, K.; Lei, J. A study of the remaining battery power indication circuit for independent solar cell control systems. In Proceedings of the ICEMS 2005: Eighth International Conference on Electrical Machines and Systems, Nanjing, China, 27–29 September 2005; Volume 2, pp. 954–958. [Google Scholar]
- Vermeer, W.; Stecca, M.; Mouli, G.R.C.; Bauer, P. A Critical Review on The Effects of Pulse Charging of Li-ion Batteries. In Proceedings of the IEEE 19th International Power Electronics and Motion Control Conference (PEMC), Gliwice, Poland, 25–29 April 2021; pp. 217–224. [Google Scholar]
- Lin, Y.-C.; Li, Y.-R.; Chung, K.-J. Estimating activation energy of the LiFePO4 battery using dual dynamic stress accelerated degradation tests. In Proceedings of the 23rd ISSAT International Conference on Reliability and Quality in Design, Chicago, IL, USA, 3–5 August 2017. [Google Scholar]
- Chen, P.-T.; Yang, F.-H.; Sangeetha, T.; Gao, H.-M.; Huang, K.D. Moderate Energy for Charging Li-Ion Batteries Determined by First-Principles Calculations. Batter. Supercaps 2018, 1, 209–214. [Google Scholar] [CrossRef] [Scilit]
- Kasri, N.F.; Piah, M.A.M.; Adzis, Z. Compact High-Voltage Pulse Generator for Pulsed Electric Field Applications: Lab-Scale Development. J. Electr. Comput. Eng. 2020, 2020, 1–12. [Google Scholar] [CrossRef] [Scilit]
- Rebersek, M.; Miklavcic, D. Advantages and Disadvantages of Different Concepts of Electroporation Pulse Generation. Automatika 2011, 52, 12–19. [Google Scholar] [CrossRef] [Scilit]
- Bonthond, J.; Vossenberg, E.B. A capacitor discharge, quasi-trapezoidal pulse generator for particle extraction. In Proceedings of the Digest of Technical Papers: Tenth IEEE International Pulsed Power Conference, Albuquerque, NM, USA, 3–6 July 1995; Volume 2, pp. 957–962. [Google Scholar] [CrossRef] [Scilit]
- Mazon Valadez, E.E.; Bordonal, R.R.; Freire, J.E.; Uliana, J.H.; Arsalani, S.; Collazos-Burbano, D.A.; Carneiro, A.A.O.; Pavan, T.Z. Pulse generators for enhanced magnetomotive ultrasound: Toward a cost-effective imaging for tissue characterization. Rev. Sci. Instrum. 2024, 95, 1–13. [Google Scholar] [CrossRef] [Scilit] [PubMed]
- Wood, B.M.; Ganago, A.O. Using Arduino in Engineering Education: Motivating Students to Grow from a Hobbyist to a Professional. In Proceedings of the ASEE Annual Conference and Exposition, Salt Lake City, UT, USA, 24–27 June 2018. [Google Scholar]
- Zachariadou, K.; Yiasemides, K.; Trougkakos, N. A low-cost computer-controlled Arduino-based educational laboratory system for teaching the fundamentals of photovoltaic cells. Eur. J. Phys. 2012, 33, 1599–1610. [Google Scholar] [CrossRef] [Scilit]
- Jamaluddin, A.; Sihombing, L.; Supriyanto, A.; Purwanto, A.; Nizam, M. Design real time Battery Monitoring System using LabVIEW Interface for Arduino (LIFA). In Proceedings of the 2013 Joint International Conference on Rural Information & Communication Technology and Electric-Vehicle Technology, Bandung, Indonesia, 26–28 November 2013; pp. 1–4. [Google Scholar] [CrossRef] [Scilit]
- Creative Commons Public Licence. Available online: https://creativecommons.org/share-your-work/ (accessed on 17 May 2026).
- Adams, R.W. Design and Implementation of an Audio 18-Bit Analog-To-Digital Converter Using Oversampling Techniques. J. Audio Eng. Soc. 1986, 34, 153–166. [Google Scholar]
- Meisner, L.; Buniak, J. Battery Capacity Testing with Constant-Resistance Loads. In Proceedings of the Battcon 2016 Stationary Battery Conference, Boca Raton, FL, USA, 9–12 May 2016. [Google Scholar]
- Diard, J.-P.; Le Gorrec, B.; Montella, C. EIS study of electrochemical battery discharge on constant load. J. Power Sources 1998, 70, 78–84. [Google Scholar] [CrossRef] [Scilit]
- Škultéty, E.; Pivarčiová, E.; Karrach, L. The Comparing of the Selected Temperature Sensors Compatible with the Arduino Platform. Manag. Syst. Prod. Eng. 2018, 26, 168–171. [Google Scholar] [CrossRef] [Scilit]
- Microchip Technology Inc. MCP9700/9700A–MCP9701/9701A Datasheet. Available online: https://ww1.microchip.com/downloads/en/DeviceDoc/20001942G.pdf (accessed on 17 May 2026).
- Kushner, D. The Making of Arduino, How Five Friends Engineered a Small Circuit Board That’s Taking the DIY World by Storm, IEEE Spectrum. 2011. Available online: https://spectrum.ieee.org/the-making-of-arduino (accessed on 17 May 2026).
- AVR Microcontrollers. Wikipedia. Available online: https://en.wikipedia.org/wiki/AVR_microcontrollers (accessed on 17 May 2026).
- D’Ausilio, A. Arduino: A low-cost multipurpose lab equipment. Behav. Res. Methods 2012, 44, 305–313. [Google Scholar] [CrossRef] [Scilit] [PubMed]
- Federal Trade Commission. Part 403—Deceptive Use of “Leakproof,” “Guaranteed Leakproof,” etc., as Descriptive of Dry Cell Batteries; Title 16—Commercial Practices. May 1964; pp. 207–209. Available online: https://tile.loc.gov/storage-services/service/ll/cfr/cf/r1/98/10/45/-T/16/CI/P4/03/cfr1981045-T16CIP403/cfr1981045-T16CIP403.pdf (accessed on 17 May 2026).
- Available online: https://www.epbaeurope.net/assets/EPBA-Infographic-Primary-Batteries-15Sept2020-1.pdf#toolbar=0 (accessed on 17 May 2026).

Disclaimer/Publisher’s Note: The statements, opinions and data contained in all publications are solely those of the individual author(s) and contributor(s) and not of MDPI and/or the editor(s). MDPI and/or the editor(s) disclaim responsibility for any injury to people or property resulting from any ideas, methods, instructions or products referred to in the content. |
© 2026 by the authors. Licensee MDPI, Basel, Switzerland. This article is an open access article distributed under the terms and conditions of the Creative Commons Attribution (CC BY) license.