


Abstract
We investigated the electronic structures of the wide-bandgap semiconductor Ta2O5 in the presence of oxygen vacancies using standard density functional theory. The emergence of flat bands is observed in certain structural phases due to these vacancies. For instance, when the concentration of oxygen vacancies reaches 10% in the γ1, B, and δ phases of Ta2O5, a flat band appears near the Fermi energy. Further analysis reveals that in certain regions within the Brillouin zone, electrons in flat bands exhibit effective masses 103 times larger than that of free electrons, with some locations even being 104 times higher, thus demonstrating pronounced heavy-fermion-like behavior. Experimental schemes based on electron cyclotron resonance for the detection of such behavior are suggested.
1. Introduction
Heavy-fermion materials belong to a class of strongly correlated electronic systems, where the charge carriers can exhibit significantly enhanced effective mass at relatively low temperatures, typically up to 100 to 1000 times that of free electrons. Common heavy-fermion materials typically consist of lanthanide and actinide metal compounds with incompletely filled f-electron shells, such as CeAl3, CeCu2Si2, and UBe13, as well as a few d-electron transition metal compounds like LiV2O4 and CaCu3Ir4O12. In 1975, first observation on heavy-fermion behavior in CeAl3 has been reported [1]. Below 0.2 K, the resistivity and specific heat of CeAl3 were observed to exhibit the characteristic properties of Landau’s Fermi-liquids: electrical resistivity and heat capacity temperature dependences, where is the Sommerfeld coefficient.
Typical heavy fermions primarily involve metal compounds of rare earth elements, including Ce, Yb, Pr, U, Pu, and Np [2,3,4,5,6,7,8,9,10,11,12,13,14,15,16]. The charge carriers in these materials can show significantly enhanced effective masses at comparably low temperatures. These materials have a narrow bandgap, with Fermi levels often residing in either the conduction or valence bands, thereby exhibiting metallic characteristics. For instance, the first heavy-fermion superconductor, CeCu2Si2 [2], displays a normal state with heavy-fermion behavior and an electron specific heat coefficient of 1 J/(mol∙K2), with a superconducting transition temperature of approximately 0.6 K. The YbRh2Si2 compound, based on ytterbium, exhibits anti-ferromagnetic behavior under atmospheric pressure, with a Néel temperature of approximately 0.07 K and superconductivity at a critical temperature of around 2 mK [12,13,14].
Recently, observations of heavy-fermion-like behavior have also been reported in heterojunction systems comprising transition metal chalcogenides and twisted trilayer graphene [17,18,19,20,21,22,23,24,25,26,27]. The preparation of heterojunctions in two-dimensional quantum materials at different rotation angles and stacking orders leads to the formation of moiré superlattices, which further induce the renormalization of electron band structures in the heterojunctions, resulting in the formation of electron flat-band structures. The temperature dependence of resistivity in MoTe2/WSe2 bilayer films exhibits a plateau near T ≈ 40 K, and the carrier effective mass extracted from quite low-temperature resistivity data is significantly enhanced (m* ≈ 5m0 to 10m0, where m0 denotes the free electron mass), indicating heavy-fermion-like behavior [17,18]. Feng Wang and colleagues [19] discovered a moiré superlattice in a stacked three-layer graphene heterostructure, exhibiting a periodicity of 15 nm. This heterostructure possesses a flat-band bandwidth of approximately 10 meV, significantly lower than the Coulomb repulsion energy (around 25 meV). Therefore, the observed heavy-fermion-like behavior is exclusively confined to comparably low temperatures and limited to metallic or narrow-bandgap materials. To date, there is a lack of reports on heavy-fermion-like behavior at room temperature or in wide-bandgap materials.
In this study, we systematically investigate the band structures of various phases of the wide-gap semiconductor Ta2O5, a versatile material with essential applications in optoelectronics [28,29], resistive random-access memory (RRAM) [30,31,32], and catalysis [33,34,35]. Notably, in certain polymorphs such as the γ1 [36], B [37], and δ [38] phases of Ta2O5 with introduced oxygen vacancies, we observe flat-band phenomena accompanied by electron effective masses significantly larger than that of free electrons (up to 1000 me), indicating possible heavy-fermion-like behavior. To our knowledge, this is the first report on possible heavy-fermion-like behavior in a wide-gap semiconductor. Furthermore, cyclotron resonance experimental schemes are proposed to detect such heavy-fermion-like behavior.
2. Computational Methods
Our first-principles calculations were carried out using the Vienna ab initio simulation package (VASP) [39,40], which is based on Density Functional Theory (DFT). The electron wave functions are expanded using a plane-wave basis set and the projector-augmented-wave (PAW) potentials are employed for the electron–ion interactions [41,42]. The exchange-correlation interactions of electrons are described by the generalized gradient approximation (GGA) within the PBE formalism [43]. The energy cutoff for plane waves is 600 eV. In order to ensure the convergence of the calculations, the k-meshes for the calculations of the B and δ phase are 2 × 4 × 4 and 6 × 6 × 12, respectively. The γ1 phase was modeled using a 1 × 1 × 2 supercell, and accurate calculations were performed with a k-meshes of 10 × 10 × 4. All the k-meshes are generated using the Monkhorst–Pack scheme [44]. To check the electronic energy dispersion properties, the HSE06 hybrid exchange-correlation functional [45,46] was also used to calculate the band structure and for comparison with results obtained from DFT–GGA calculations.
3. Results and Discussion
3.1. Effective Masses of Electrons
In this Section, we investigate the electronic properties of defective Ta2O5, specifically focusing on configurations with a 10% oxygen vacancy (Vo) content in the γ1, B, and δ phases. In accordance with our previous investigation [47], the O atoms in Ta2O5 can be classified into two categories based on the bonding arrangement between the O and Ta atoms: O bonded with two Ta bonds (two-coordination) and O bonded with three Ta bonds (three-coordination). The type 1 vacancy arises from the removal of two-coordinated O from bulk Ta2O5, while the type 2 vacancy results from the elimination of three-coordinated O. In this study, the 10% vacancies were constructed as follows: for the γ1 phase, a 1 × 1 × 2 supercell was built and one three-coordinated (type 2) O atom was removed; for the B phase, two two-coordinated (type 1) O atoms were removed from the primitive cell; for the δ phase, one two-coordinated (type 1) O atom was removed from the primitive cell. Full ionic relaxations were performed for all defective structures after O removal.
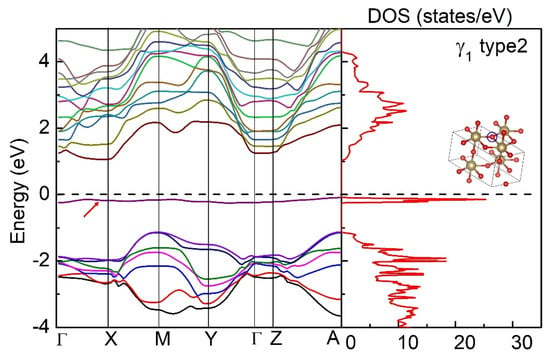
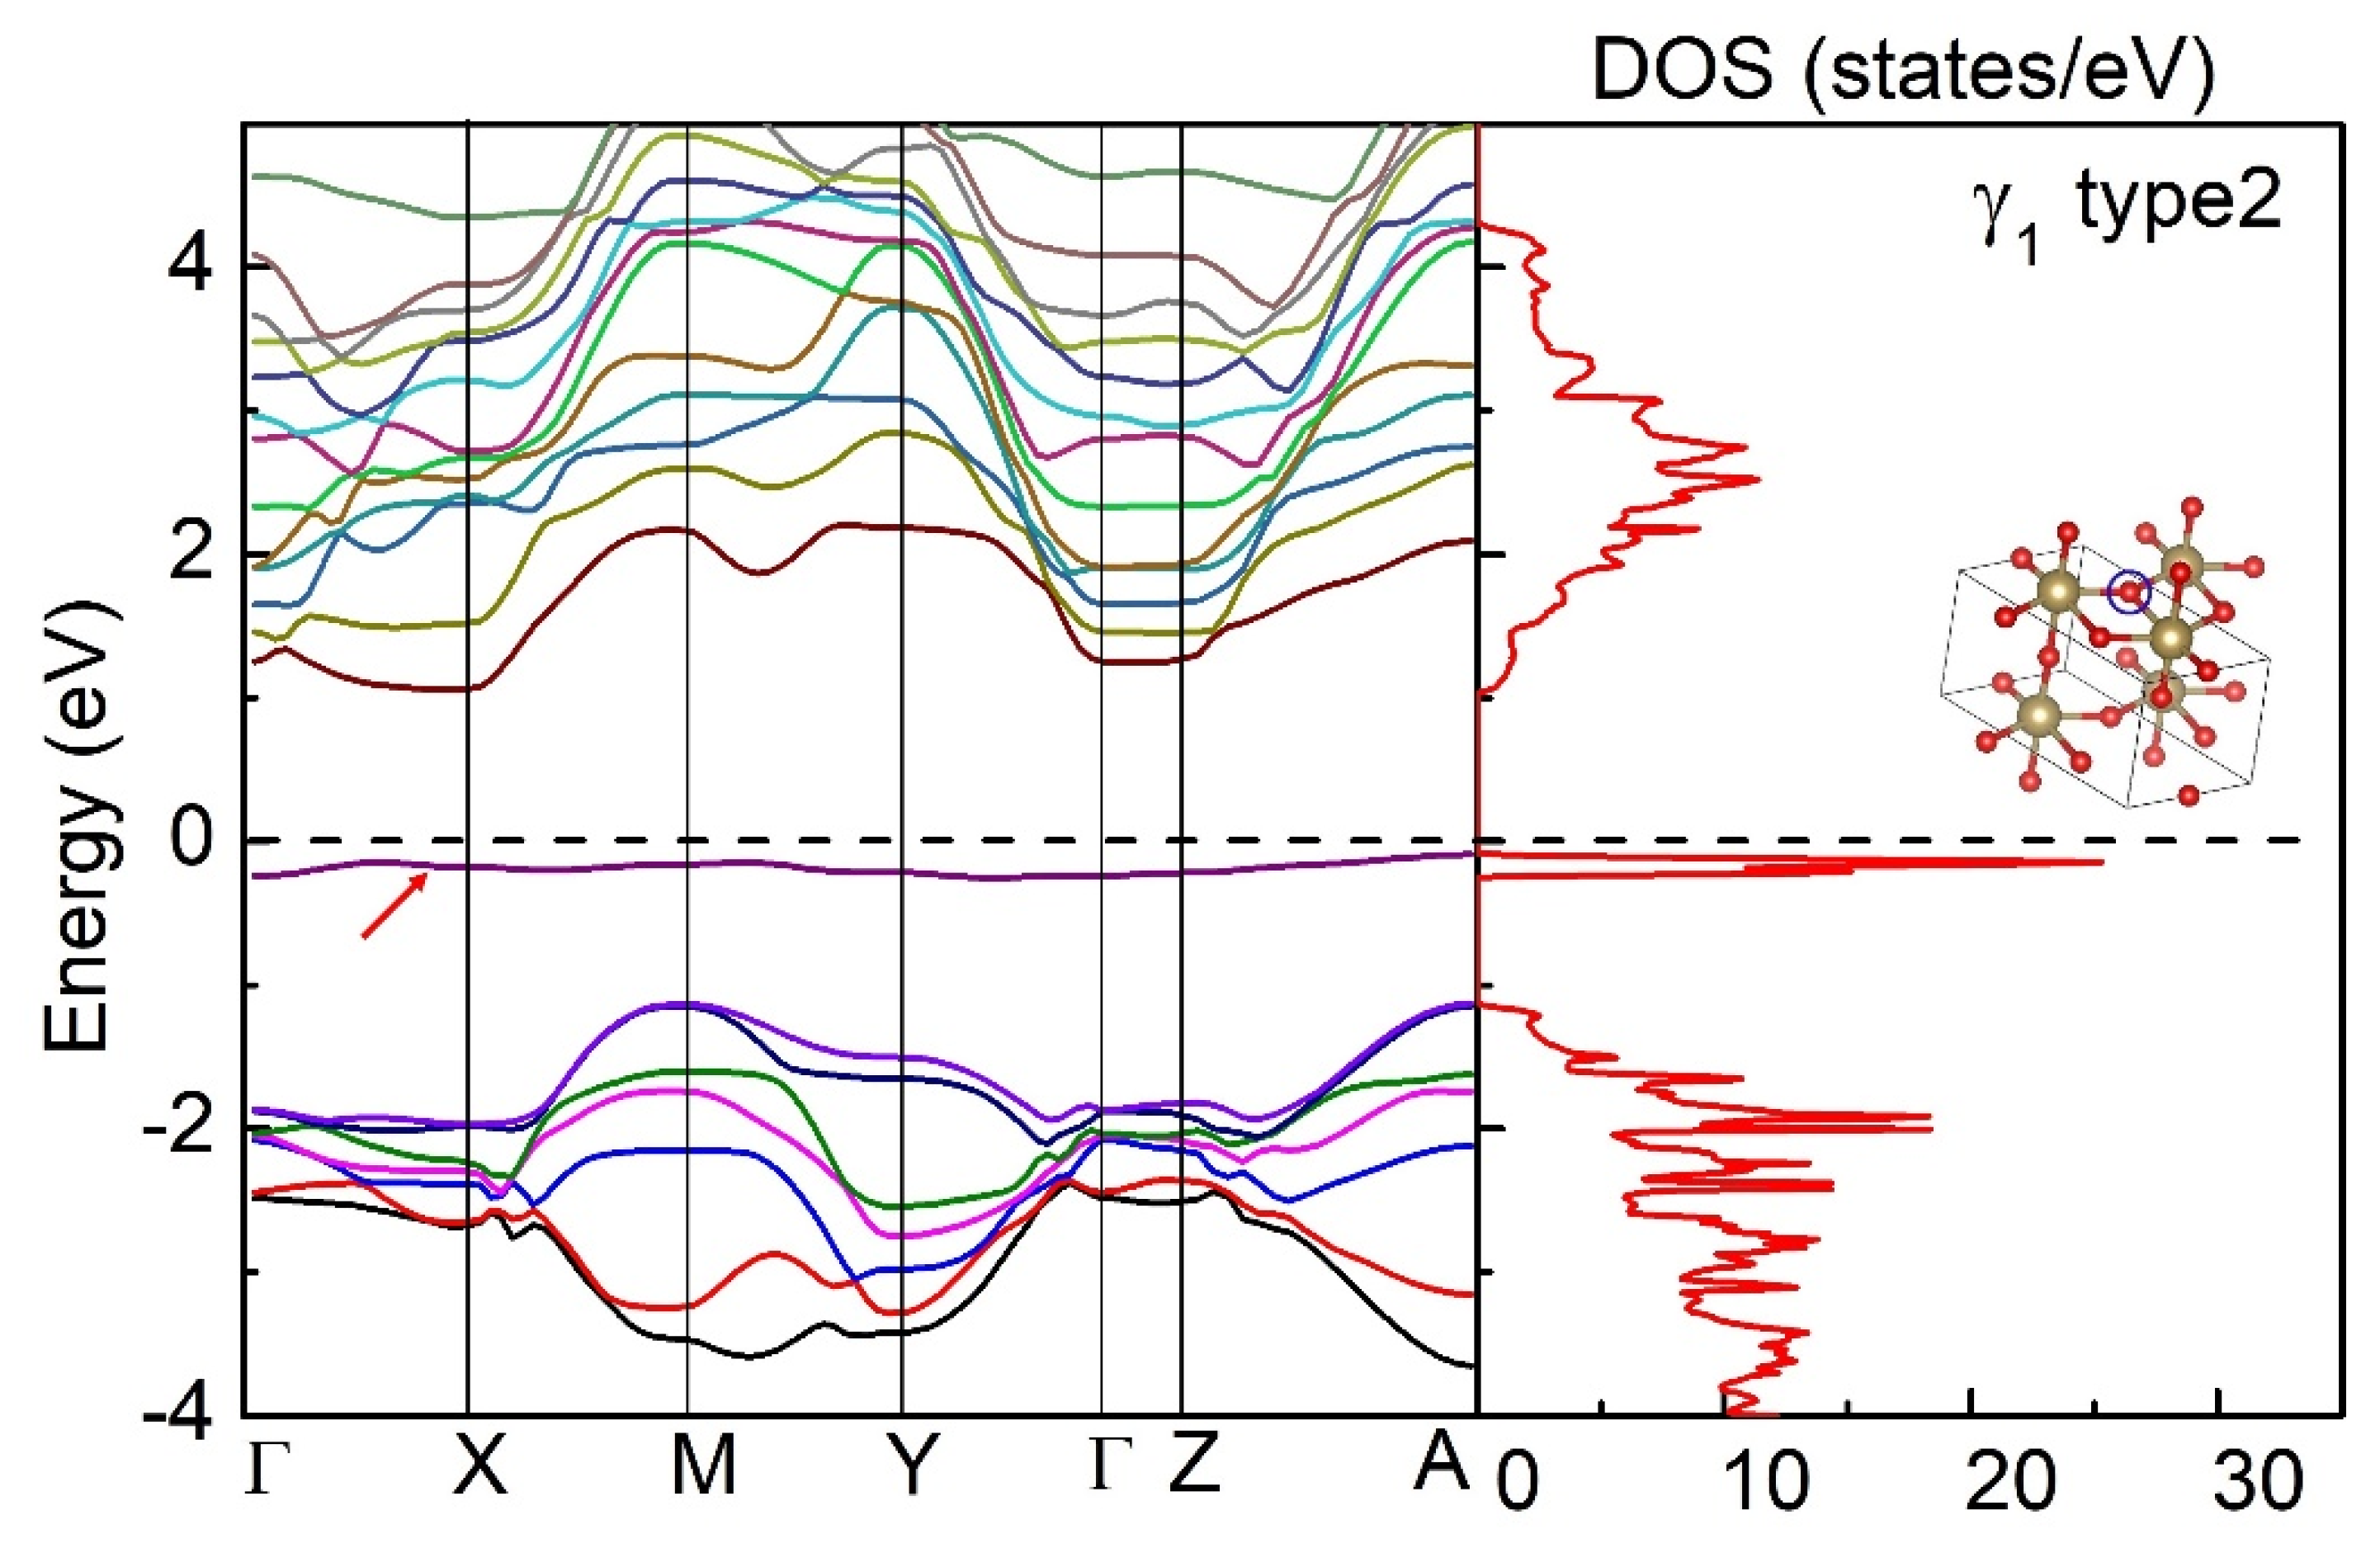
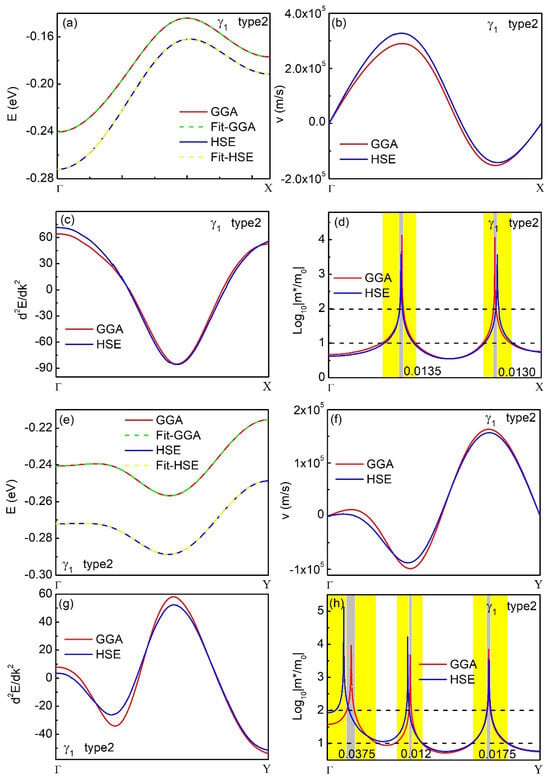
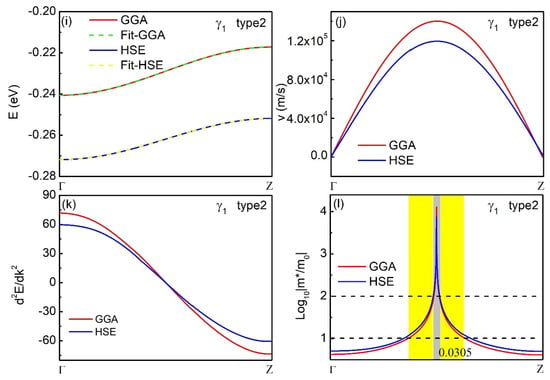
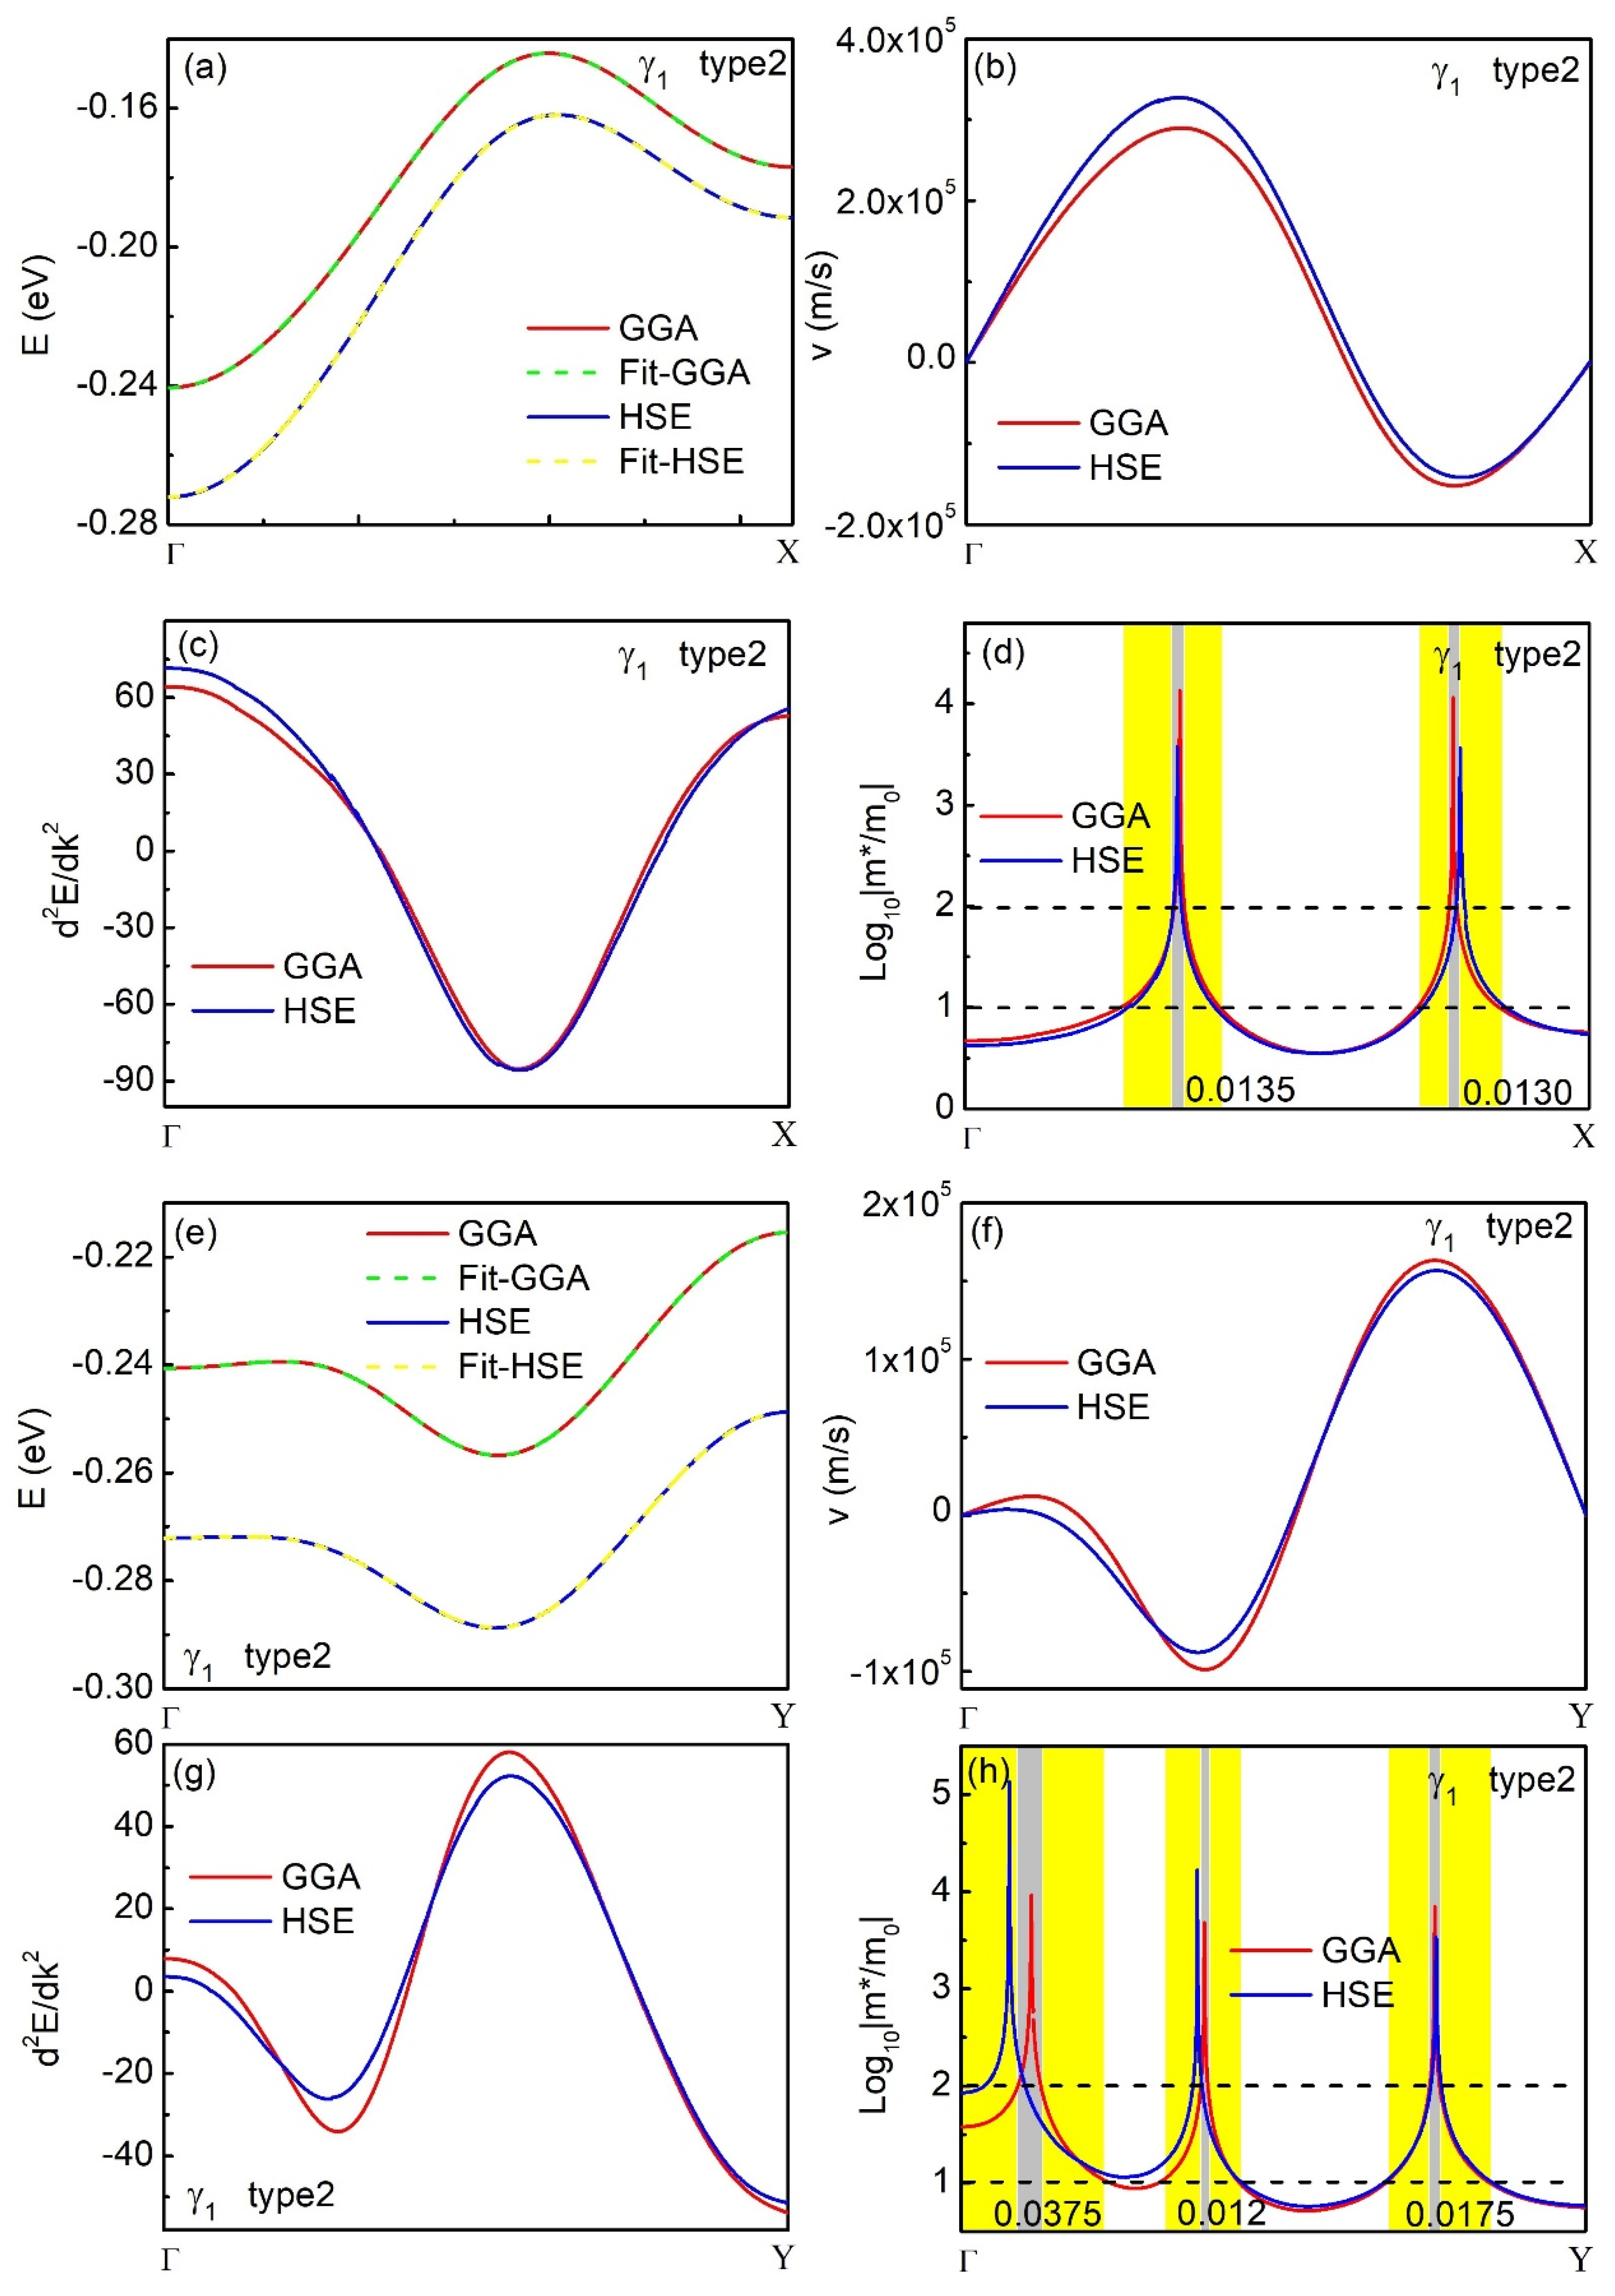
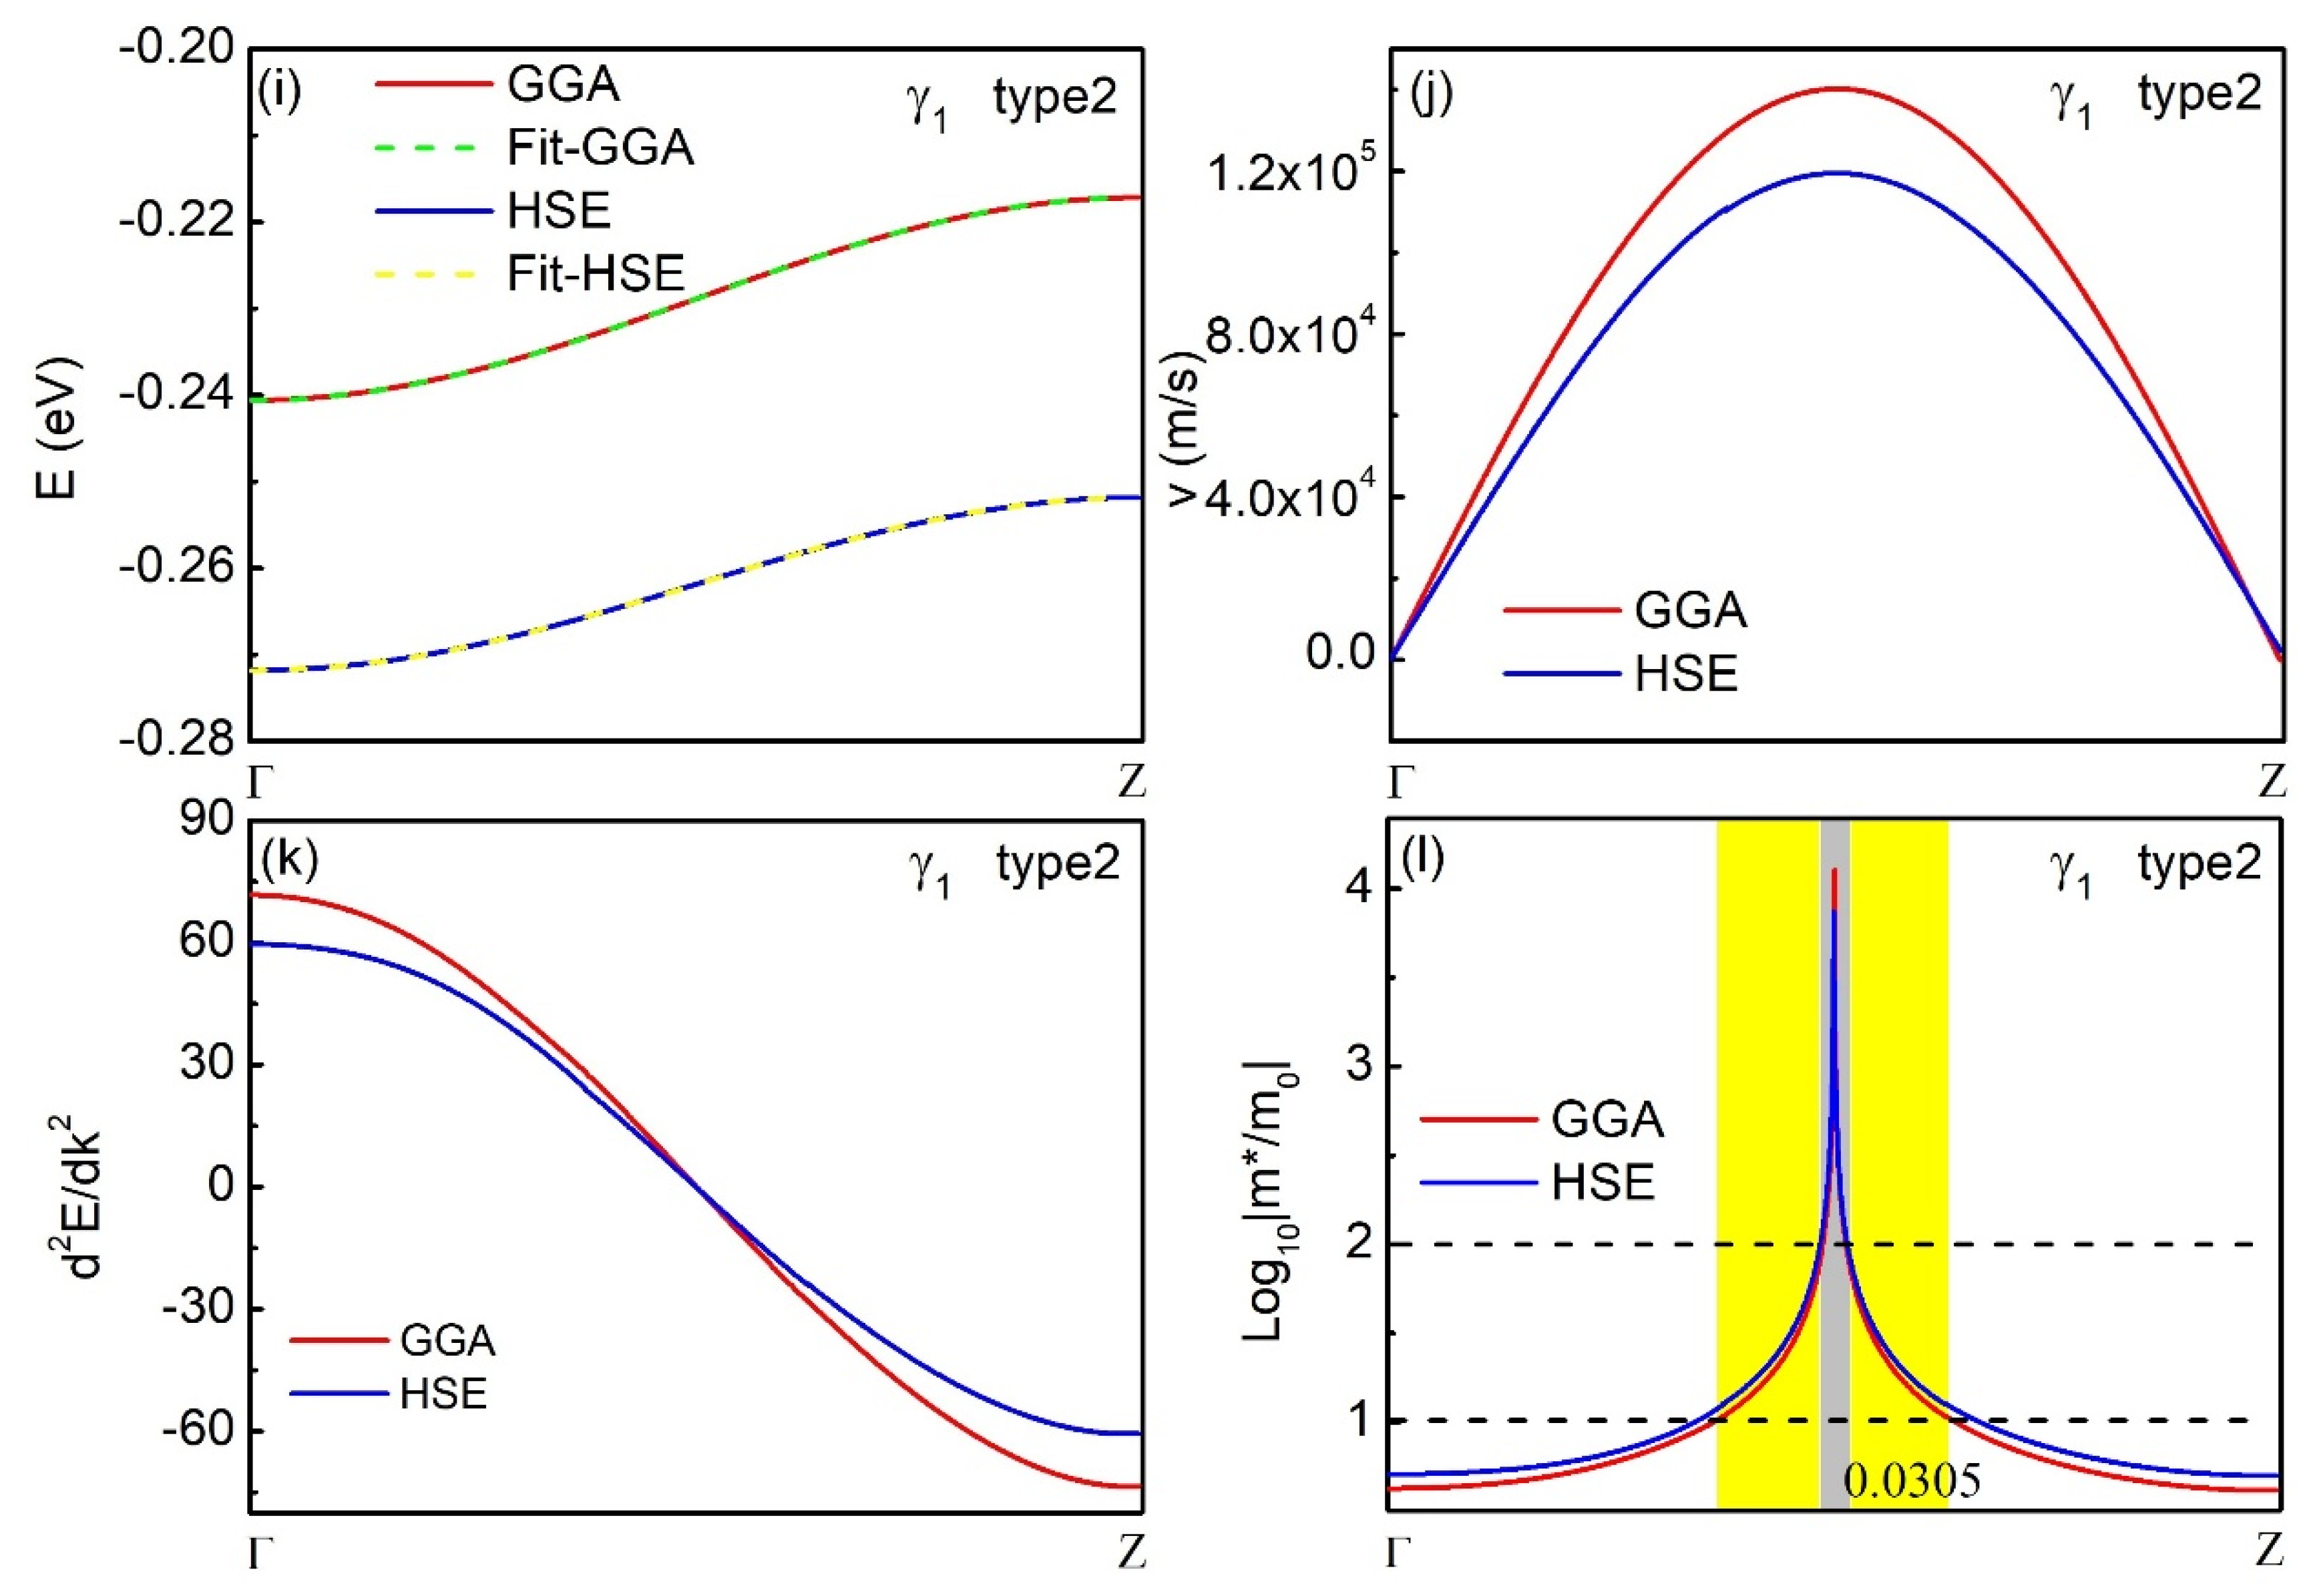
The electron band structures and density of states (DOS) of the γ1 phase with a type 2 oxygen vacancy concentration of 10% are illustrated in Figure 1. The bandgap determined using the DFT–GGA method is 1.1 eV. The band structure reveals the presence of a flat band adjacent to the Fermi surface, specifically indicated by the red arrow. The flat band in three directions, Γ–X, Γ–Y, and Γ–Z, was further analyzed using GGA and HSE methods as depicted in Figure 2a, Figure 2e and Figure 2i, respectively. Band fitting was additionally conducted, with detailed information on the fitting method provided in Appendix A. The flat-band bandwidths calculated using the GGA (HSE) method in the Γ–X, Γ–Y, and Γ–Z directions are determined to be 96.3 (110.0) meV, 41.3 (40.0) meV, and 23.4 (20.0) meV, respectively. According to the fitting results, further calculations were conducted on the first and second derivatives of the energy in order to determine the velocity (v) of the electron in three directions, as well as its effective mass (m*). The numbers in Figure 2d,h,l represent the gray column region, which denotes the proportion of the band region corresponding to an effective mass equal to or greater than 102 times that of a free electron (|m*| ≥ 102|m0|) in the given direction. The flat band exhibits regions with effective masses exceeding 1000 times that of a free electron mass along all three high-symmetry directions. Moreover, at certain locations, the effective mass reaches as high as 104 times that of a free electron mass, demonstrating pronounced heavy-fermion behavior.
Figure 1.
The band structures and density of states (DOS) of defective γ1-Ta2O5 with a vacancy concentration of 10% (for type 2 Vo) using the DFT–GGA method. The Fermi level, indicated by horizontal dashed lines, is positioned at 0 eV. The inclined arrow indicates the presence of a flat band adjacent to the Fermi surface. Different colors represent different energy bands. The structural inset shows the 1 × 1 × 2 supercell, where the blue circle marks the removed (vacancy) three-coordinated (type 2) oxygen atom.
Figure 2.
The band structure (a,e,i), electron velocity v (b,f,j), second derivative of the energy d2E/dk2 with respect to momentum (c,g,k), and effective mass m* (d,h,l) of the electron in the Γ–X (a–d), Γ–Y (e–h) and Γ–Z (i–l) directions of the γ1 phasecalculated using the GGA and HSE methods. The yellow shaded regions (d,h,l) denote the momentum-space intervals where |m*| ≥ 10 m0, while the gray shaded regions denote intervals where |m*| ≥ 102 m0. The numbers indicate the fraction of the Brillouin zone (in percentage) occupied by the gray regions (|m*| ≥ 102 m0) along the given direction.
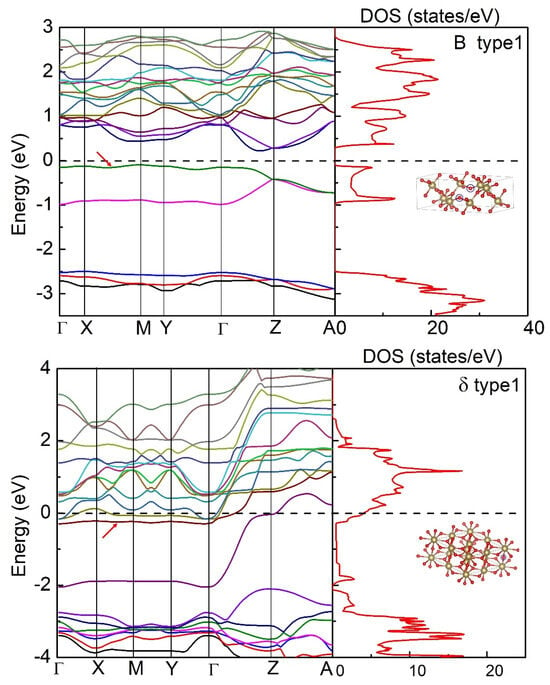
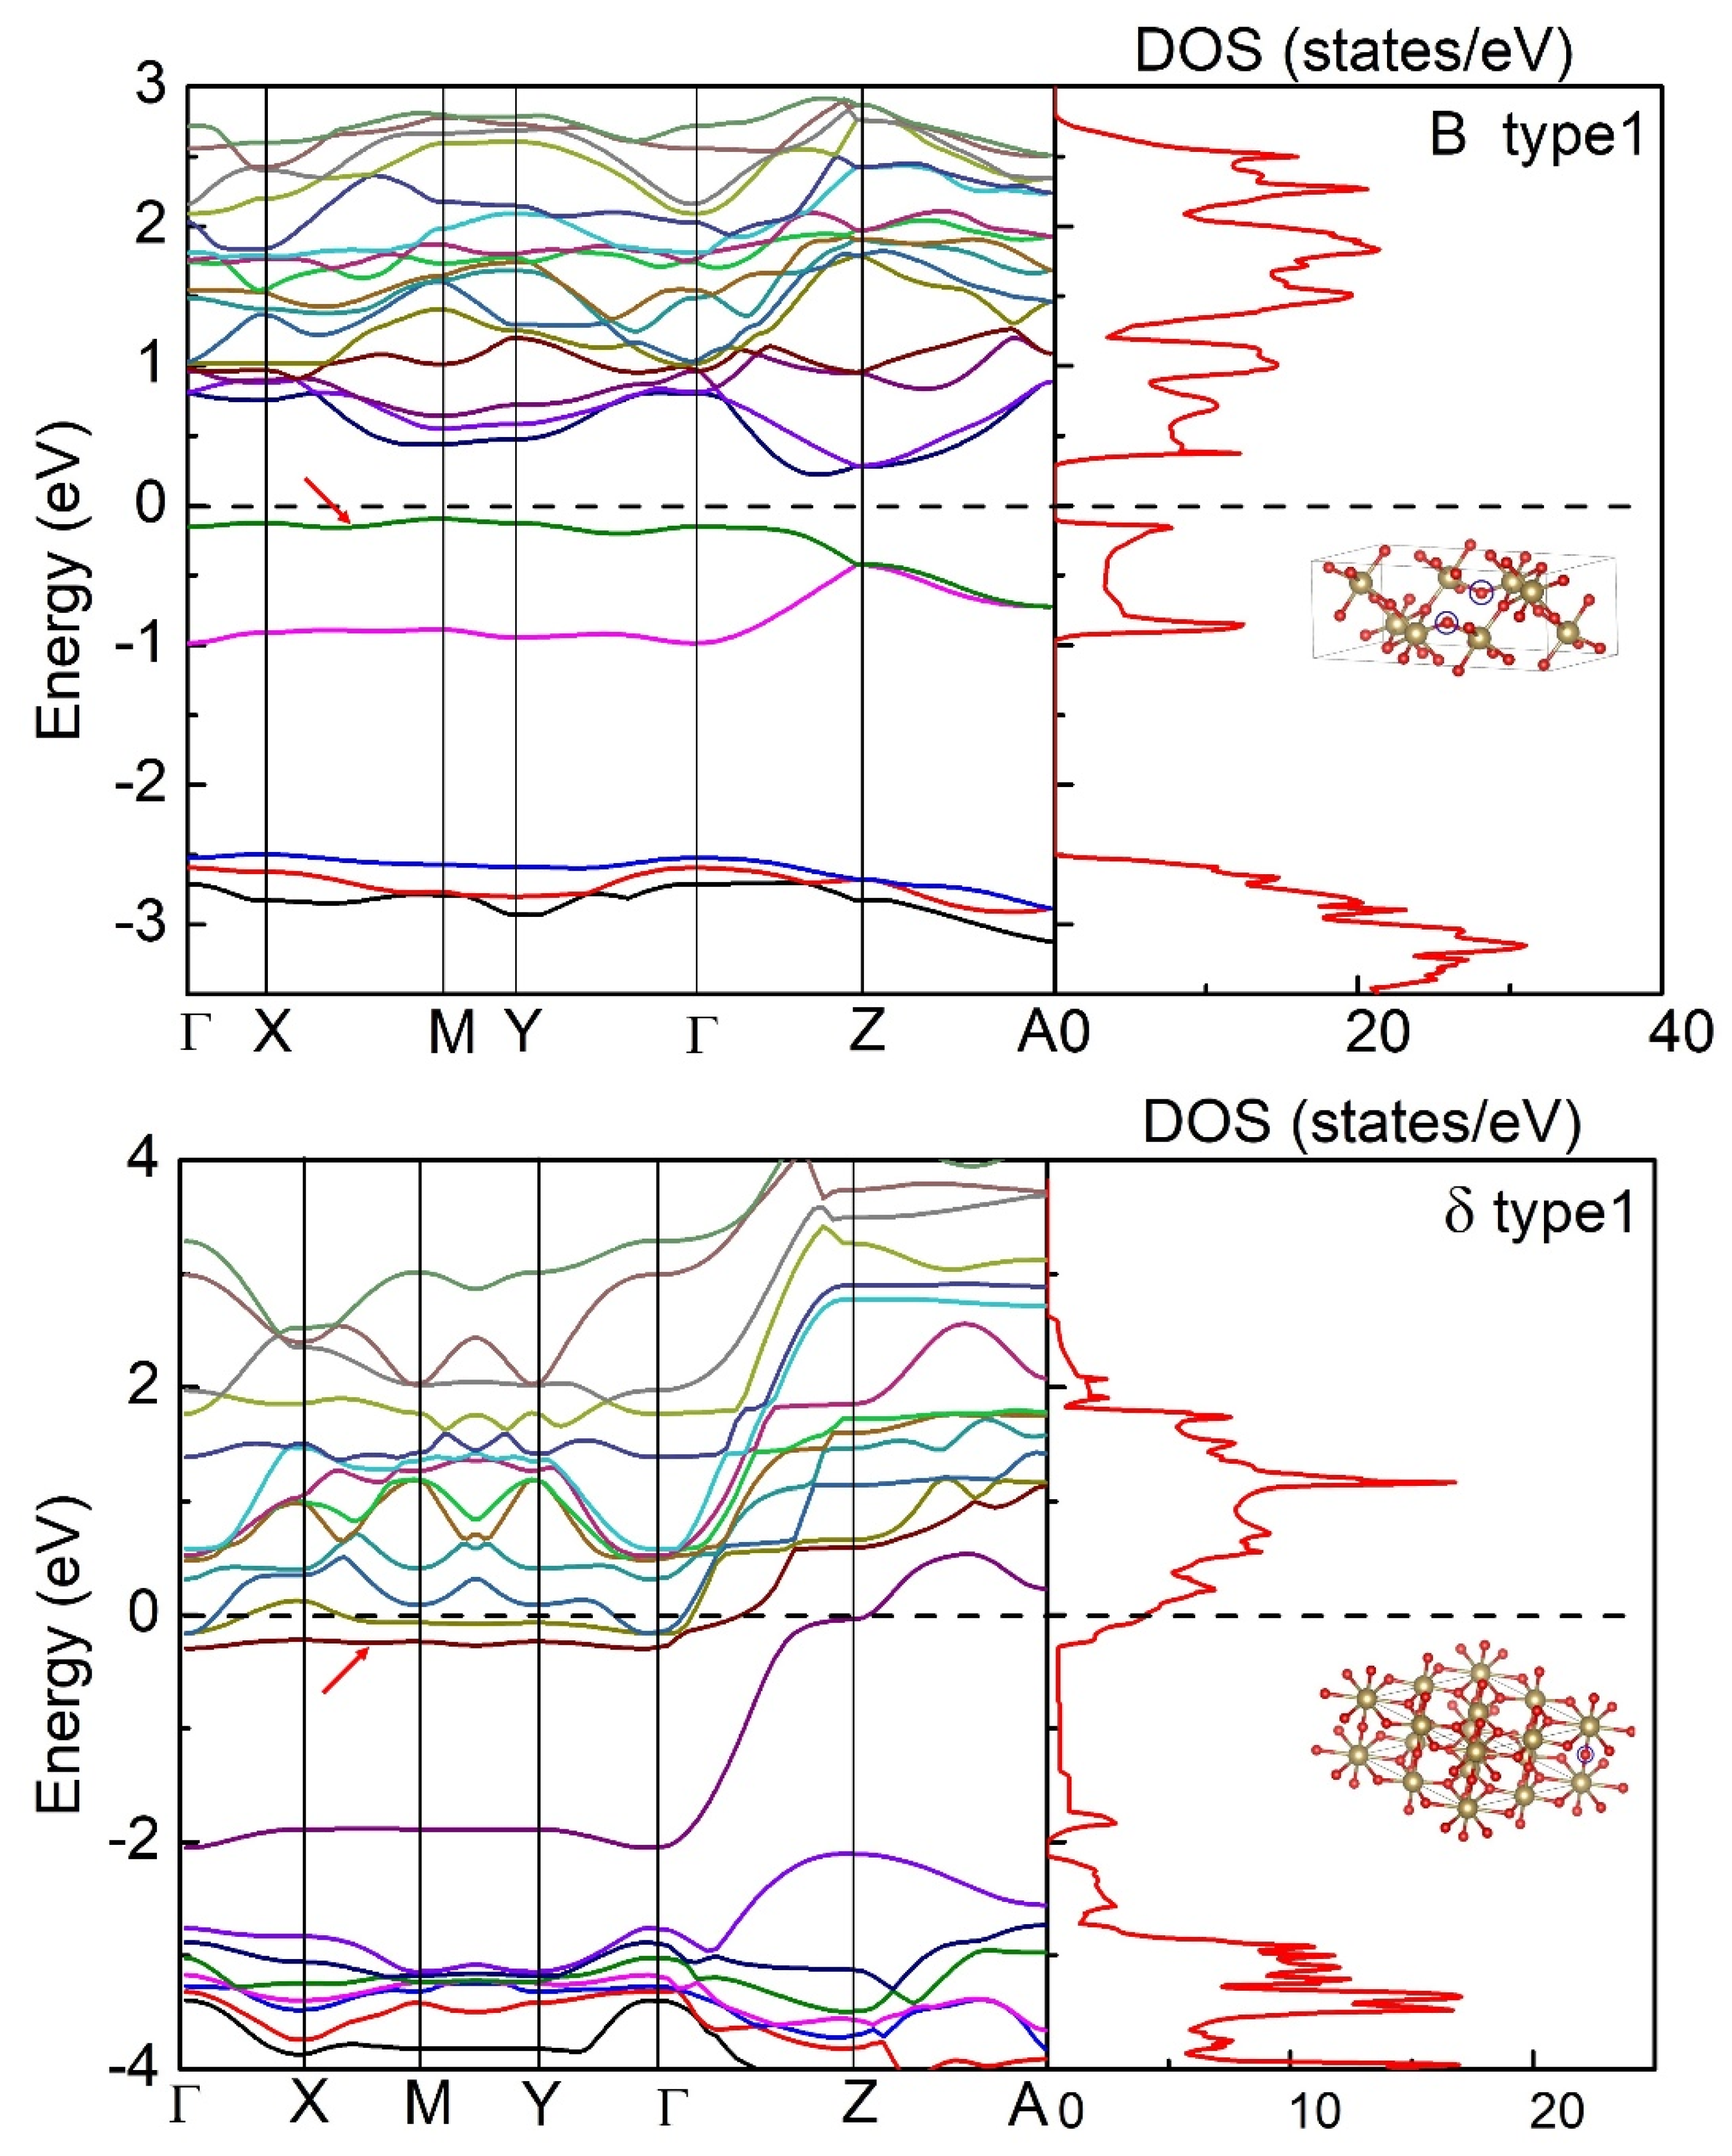
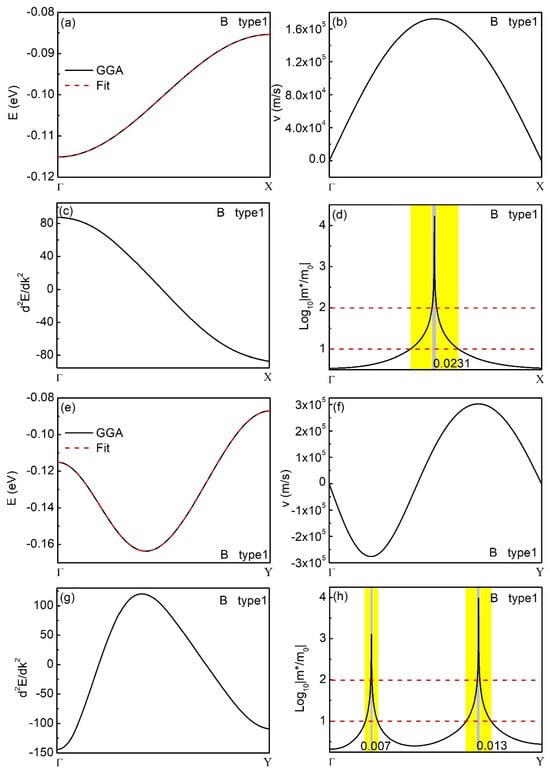
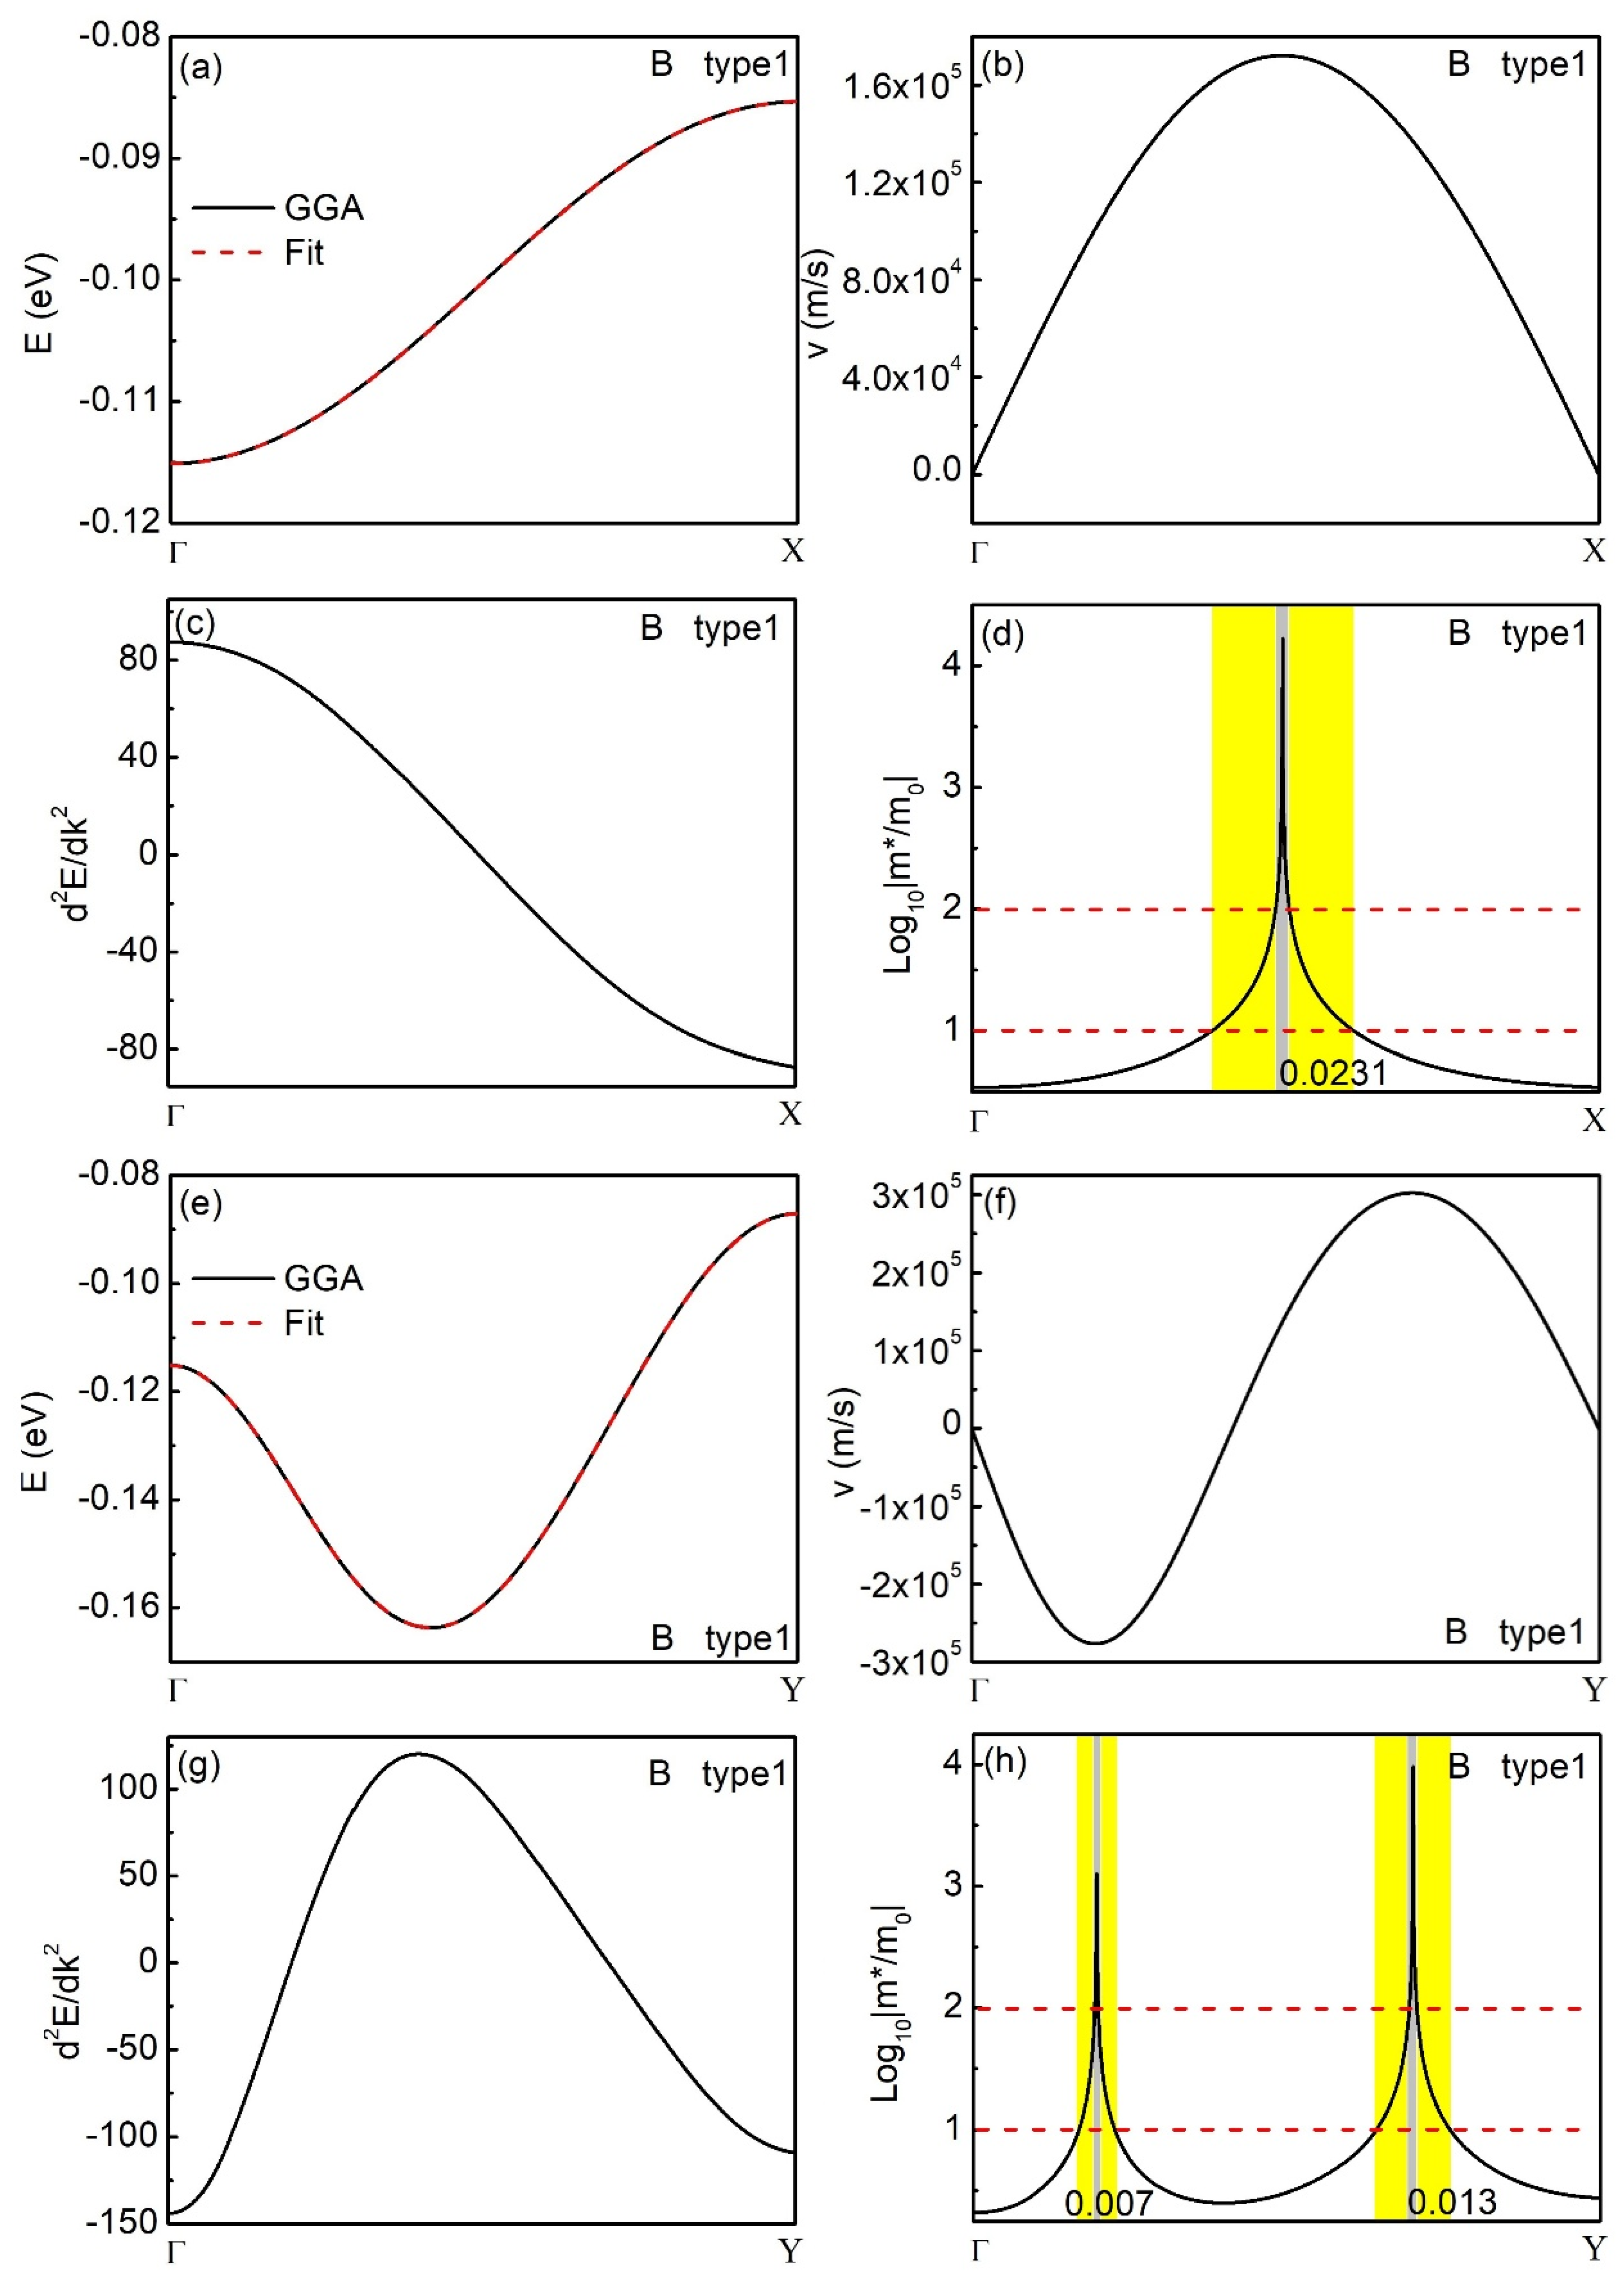
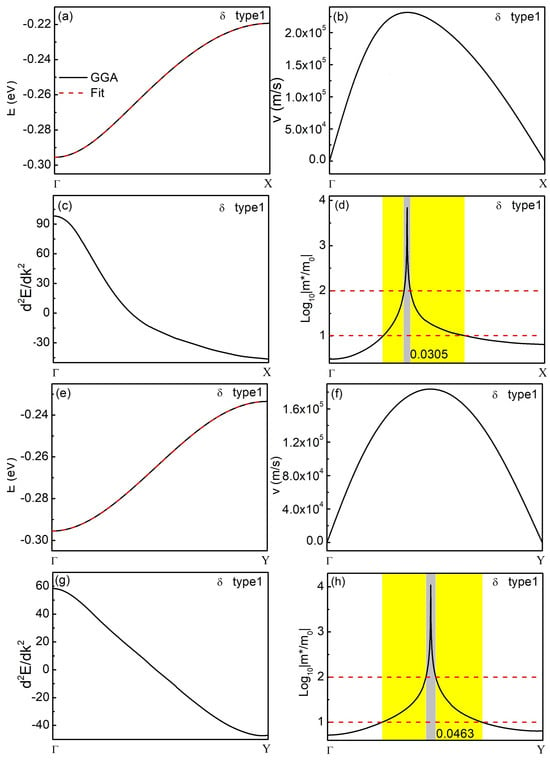
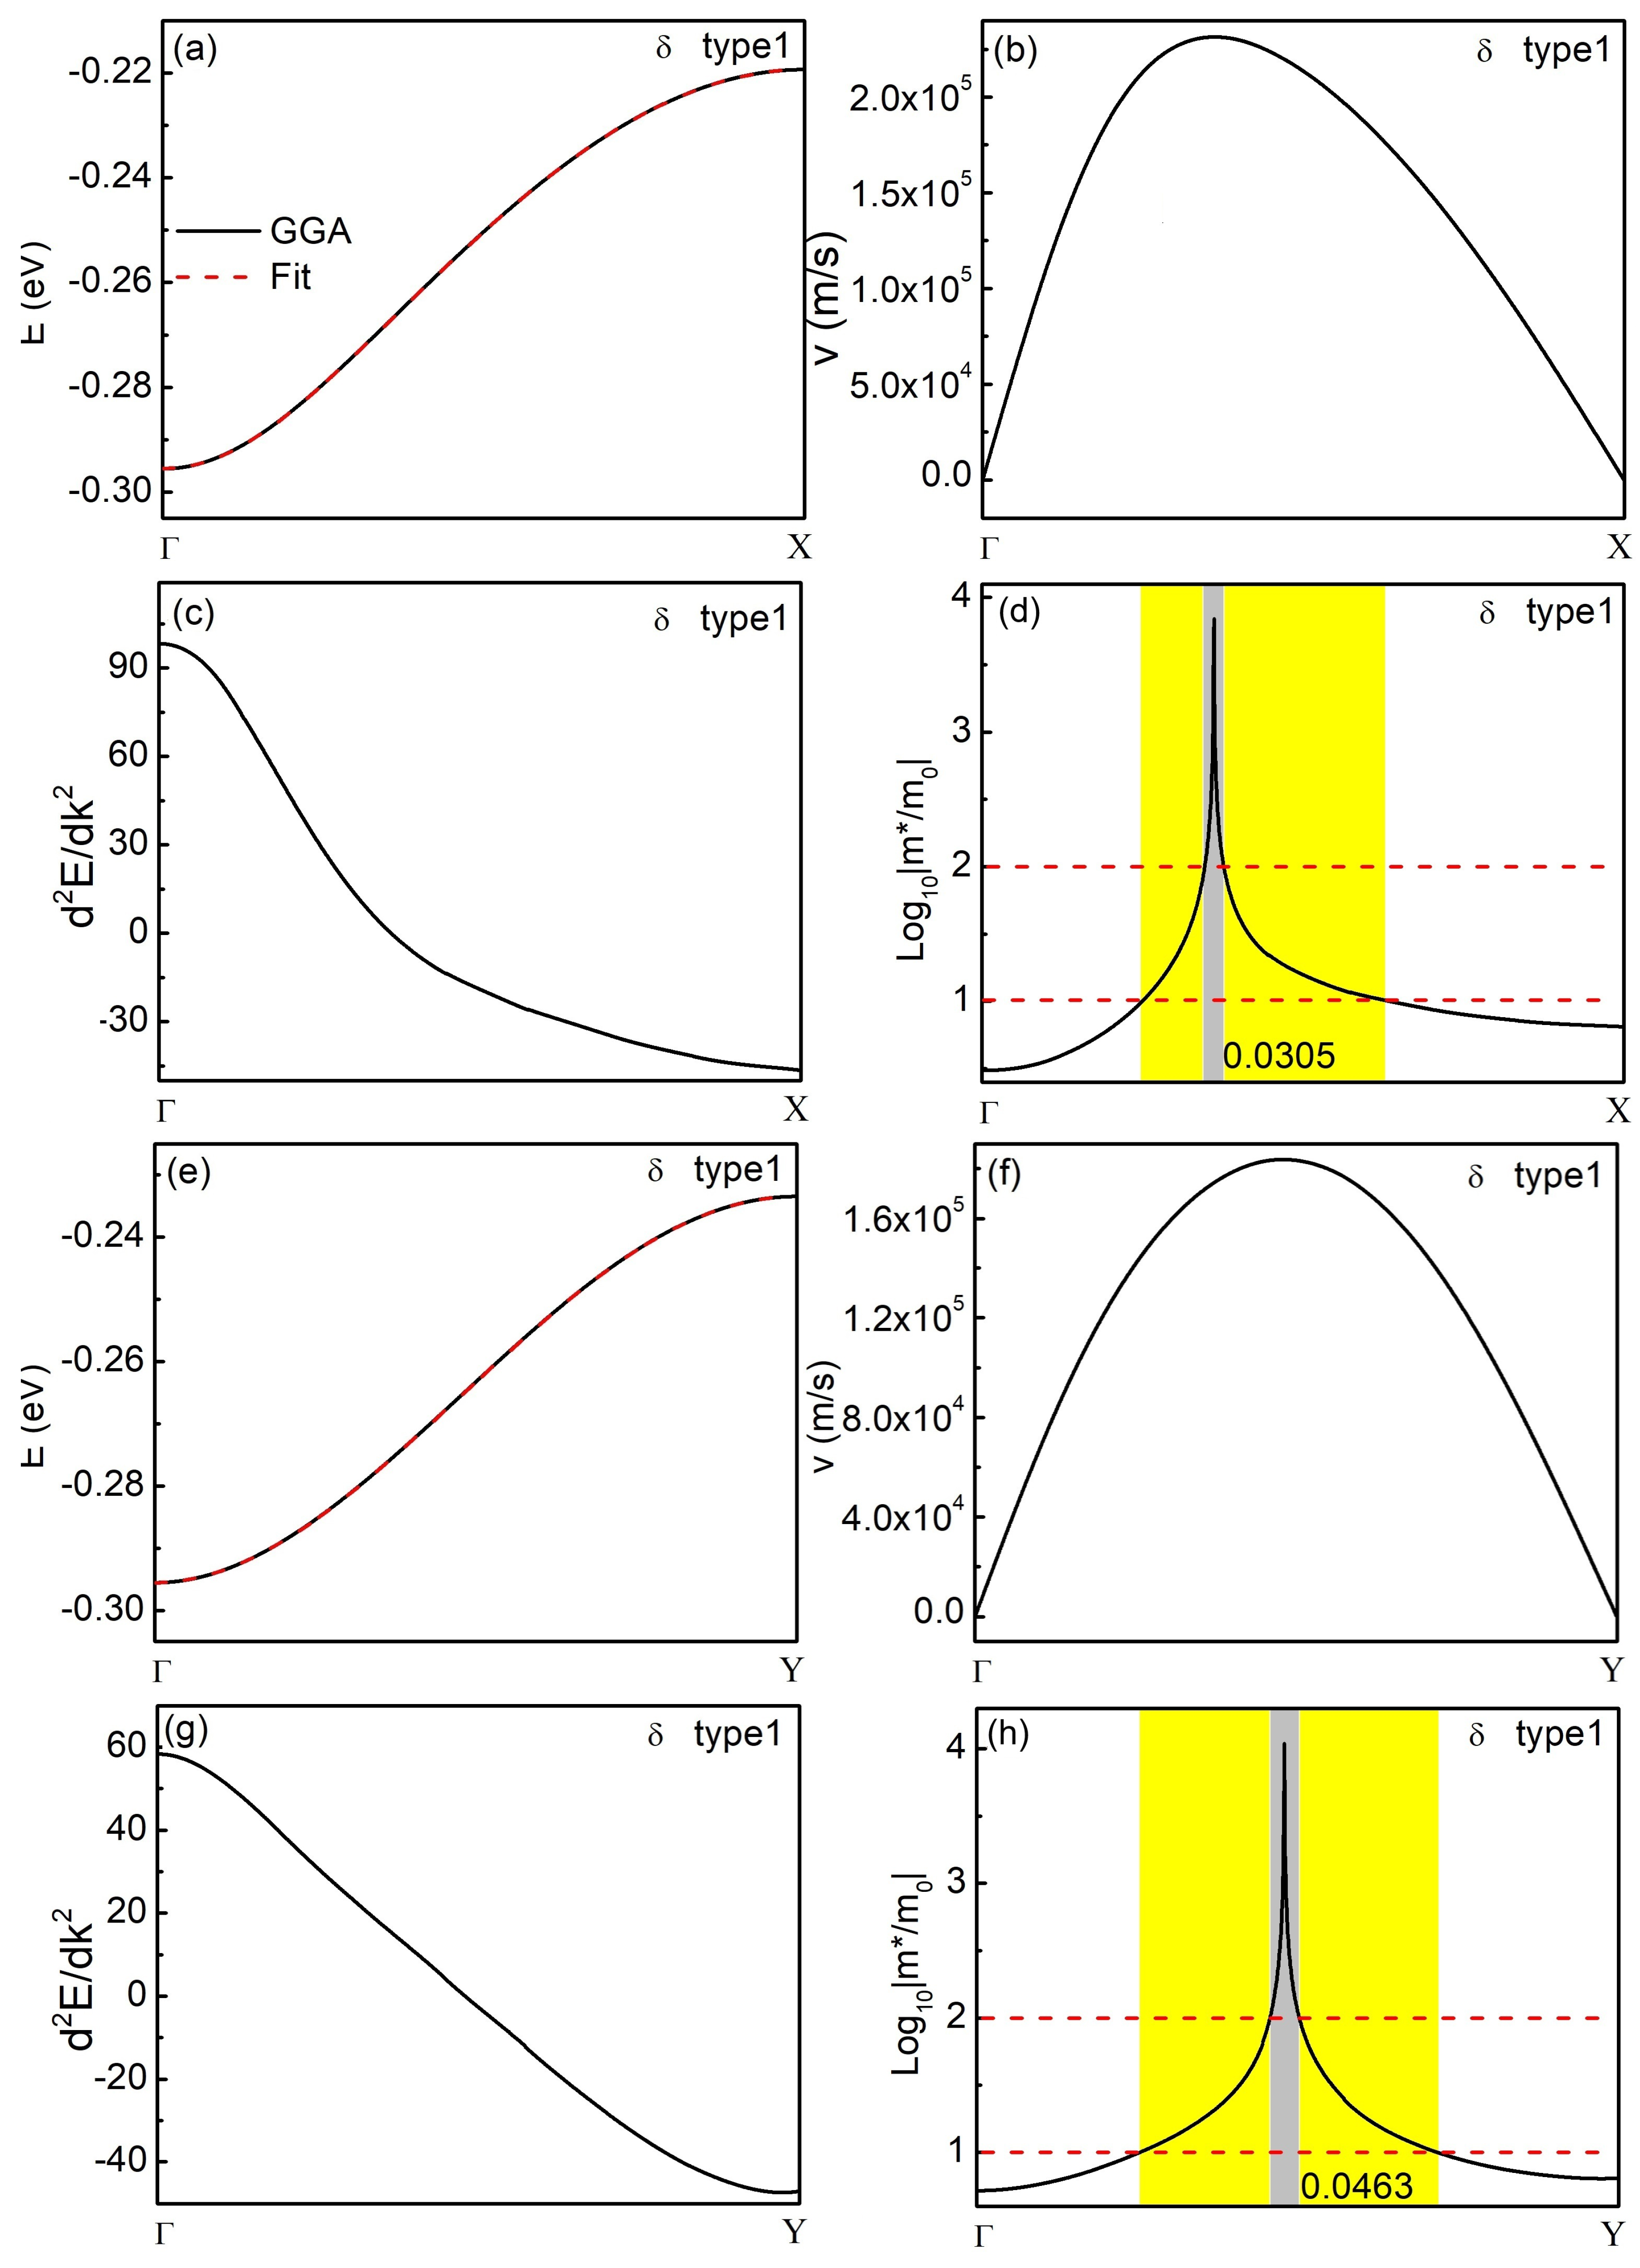
We conducted a comprehensive investigation into the electronic properties of alternative structural phases of Ta2O5 and observed that, in addition to the γ1 phase, both the oxygen vacancy in the B phase and the δ phase also exhibited pronounced heavy Fermi behavior. Figure 3 displays the bands and density of states (DOS) for the B phase (Figure 3 (upper))and δ phase (Figure 3 (lower)), both with a 10% oxygen vacancy (type 1) concentration. The energy band diagrams reveal the presence of a flat band near the Fermi energy in both phases, specifically denoted by the arrow in the figure. The B phase exhibits a bandgap of 0.36 eV, whereas the δ phase displays metallic characteristics with no discernible bandgap. Similar to the γ1 phase, the GGA method is employed for calculating flat bands along the Γ–X and Γ–Y directions, as illustrated in Figure 4 and Figure 5. The bandwidth of the flat band in the Γ–X and Γ–Y directions is 29.8 meV and 76.6 meV, respectively, in phase B, whereas it measures 76.2 meV and 62.1 meV in the δ phase. By fitting the E–k curve, subsequent calculations were performed to determine the velocity and effective mass, as illustrated in Figure 4 and Figure 5. The observation in Figure 4d,h and Figure 5d,h indicates that, similar to the γ1 phase, specific regions within the two flat bands of both the B and δ phases demonstrate effective masses surpassing those of a free electron by over 1000 times, with the maximum reaching up to 10,000 times, thus exhibiting characteristics associated with heavy-fermion behavior.
Figure 3.
The band structures and density of states (DOS) of defective B-Ta2O5 (upper) and δ-Ta2O5 (lower) with a vacancy concentration of 10% (for type 1 Vo) using the DFT–GGA method. The Fermi level, indicated by horizontal dashed line, is positioned at 0 eV. The inclined arrow indicates the presence of a flat band adjacent to the Fermi surface. Different colors represent different energy bands. The structural insets show the structures of the B and δ phases, where the blue circles mark the removed two-coordinated (type 1) oxygen atoms (two vacancies in the B phase; one vacancy in the δ phase).
Figure 4.
The band structures (a,e), electron velocity v (b,f), second derivative of the energy d2E/dk2 (c,g), and effective mass m* (d,h) of the electron in the Γ–X (a–d) and Γ–Y (e–h) directions of the B phase calculated using GGA and HSE methods. The yellow shaded regions denote |m*| ≥ 10 m0, and the gray shaded regions denote |m*| ≥ 102 m0. The numbers indicate the percentage of the Brillouin zone occupied by the gray regions along each direction.
Figure 5.
The band structures (a,e), electron velocity v [(b,f), second derivative of the energy dE/dk2 (c,g), and effective mass m* (d,h) of the electron in the Γ–X (a–d) and Γ–Y (e–h) directions of the δ phase were calculated using GGA and HSE methods. The yellow shaded regions denote |m*| ≥ 10 m0, and the gray shaded regions denote |m*| ≥ 102 m0. The numbers indicate the percentage of the Brillouin zone occupied by the gray regions along each direction.
To better quantify the extent of the heavy-mass regions, we marked in Figure 2d,h,l, Figure 4d,h and Figure 5d,h not only the regions with |m*| ≥ 102 m0 (gray shading) but also the regions with |m*| ≥ 10 m0 (yellow shading). Compared with typical wide-bandgap semiconductors, where the electron effective masses are usually less than m0, the observation of |m*| ≥ 10 m0 over substantial regions of the Brillouin zone already represents a dramatic enhancement. This indicates that the heavy-fermion-like behavior is not restricted to quite small regions but extends over a significant portion of momentum space.
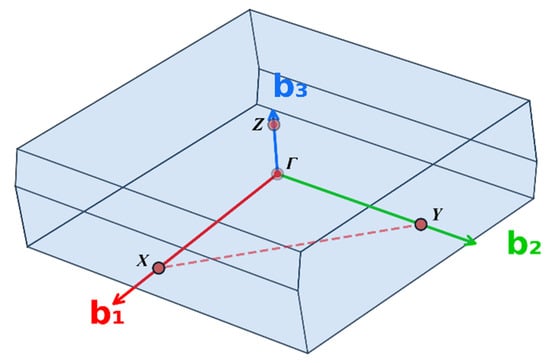
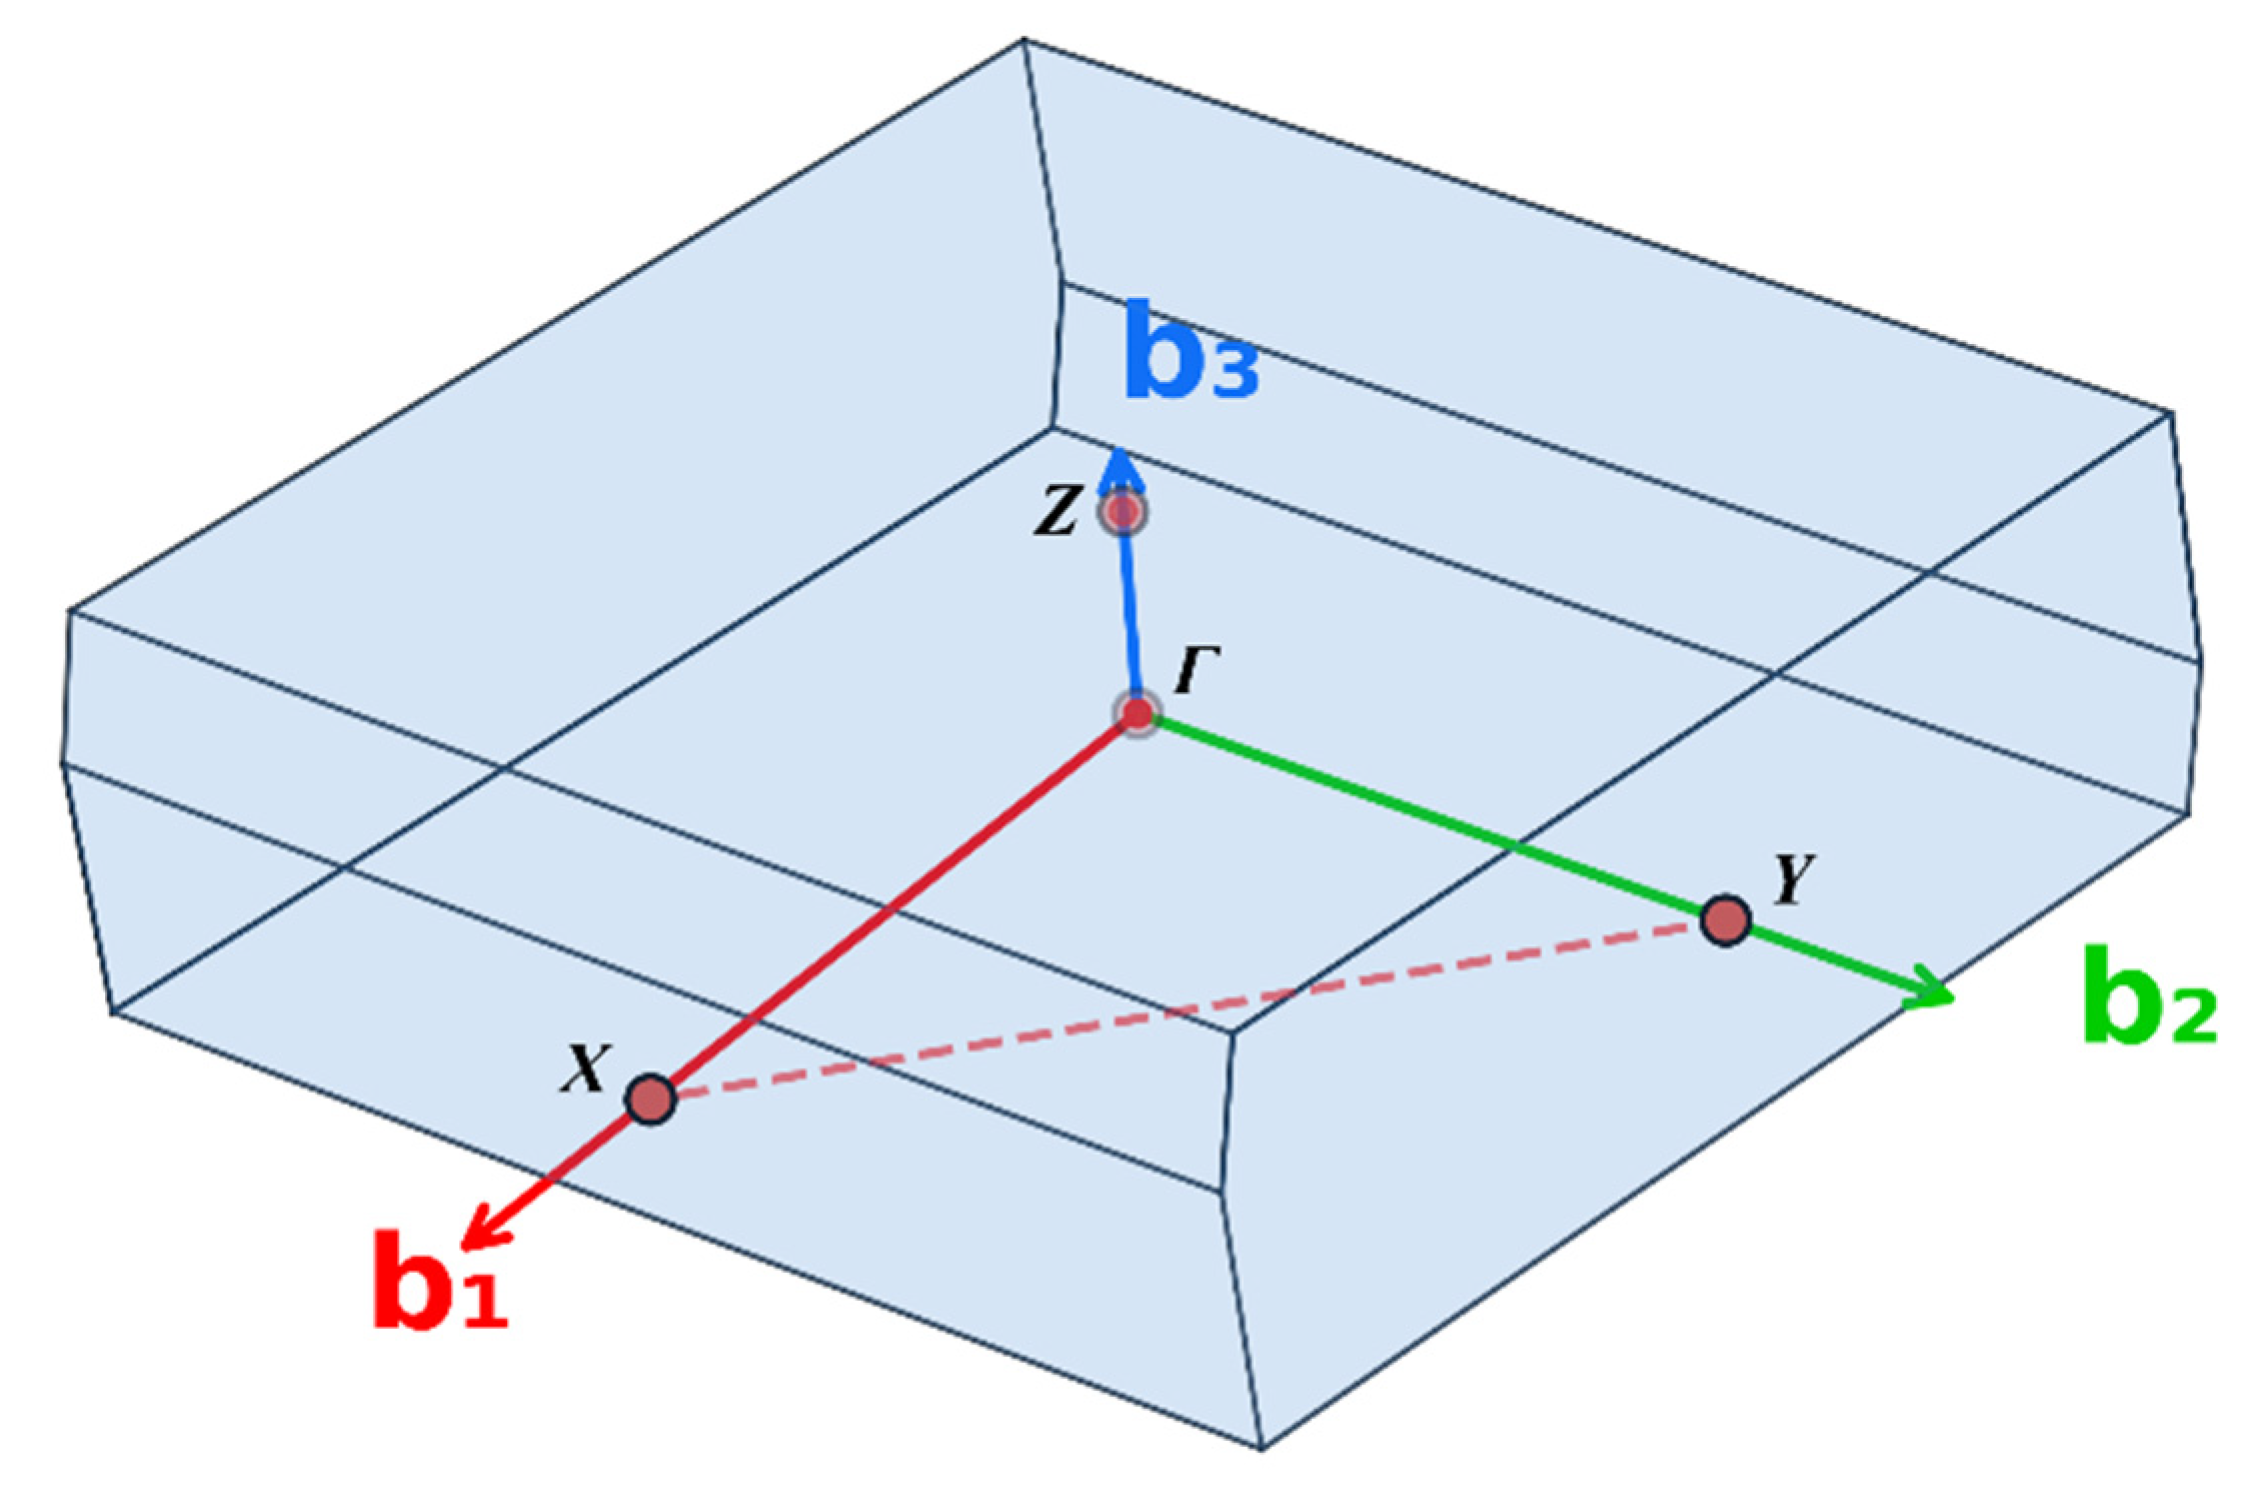
Under orthogonal transformation, the kx, ky, and kz axes of momentum space can serve as the principal axes of the effective-mass tensor, with the off-diagonal components vanishing. Therefore, the anisotropy can be fully characterized by comparing the masses along the Γ–X, Γ–Y, and Γ–Z directions (see Figure 6 for the Brillouin zone geometry). Table 1 lists the peak positions of log10∣m∗/m0∣ along the three directions. The highest peaks are found along Γ–X and Γ–Z, while the Γ–Y direction exhibits relatively lower peaks. However, as shown in Figure 2d,h,l, Figure 4d,h and Figure 5d,h, the regions with ∣m∗∣ ≥ 10 m0 cover substantial portions of the Brillouin zone along all three directions, indicating that the heavy-effective-mass features are not confined to isolated points and are experimentally accessible along multiple orientations.
Figure 6.
Schematic illustration of the first Brillouin zone of the γ1 phase of Ta2O5, defined by reciprocal lattice vectors b1, b2, and b3. The dashed line connects points X and Y to indicate that the points lie in the same horizontal plane.
Table 1.
Peak positions of the effective mass along the Γ–X, Γ–Y, and Γ–Z directions in the γ1 phase, given as the logarithmic value log10|m∗/m0|. See text for details.
3.2. Structural Stability of Defective γ1 Phase
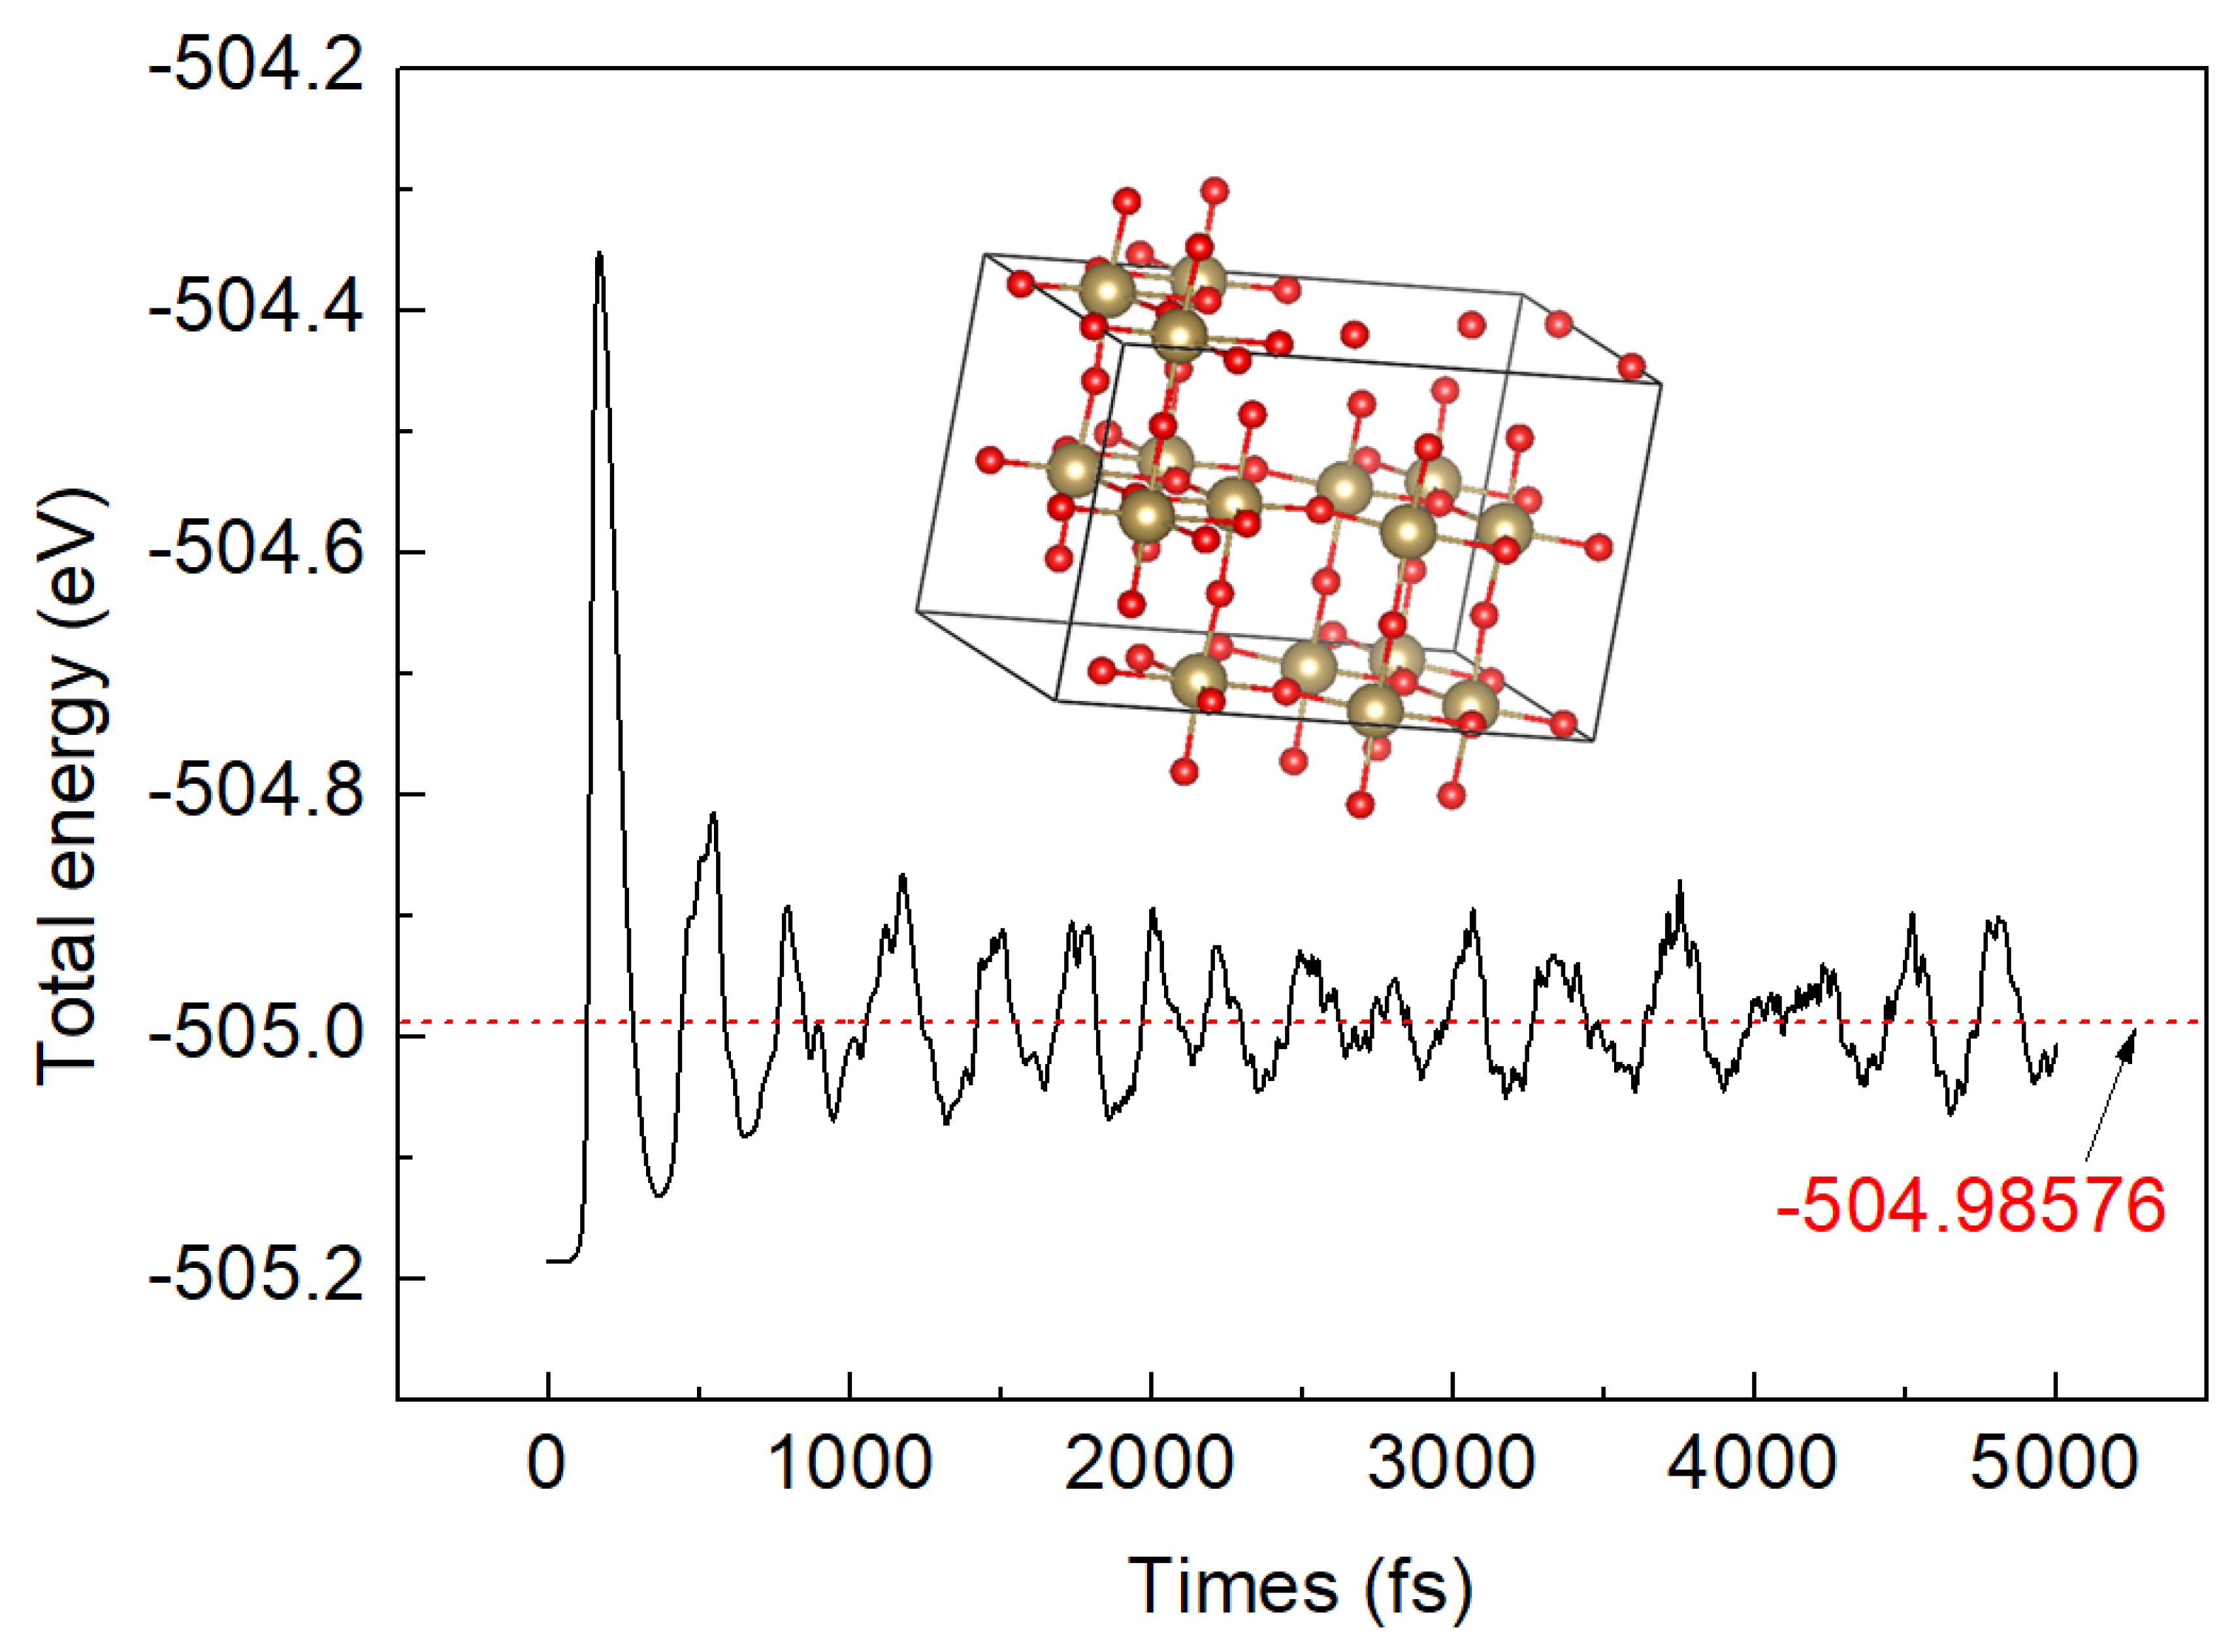
To assess the dynamical stability of the γ1 phase with 10% oxygen vacancies (type 2), we performed ab initio molecular dynamics (AIMD) simulations at 30 K for 5 ps under the NVT ensemble using a 2 × 2 × 1 supercell. The time evolution of the total energy E0 is presented in Figure A2 (Appendix B). The energy fluctuates around a constant mean value throughout the entire trajectory with no observable drift. Quantitatively, the time-averaged total energy at 30 K differs from the 0 K ground-state energy of the final AIMD configuration by 0.01792 eV. This confirms that the high-vacancy configuration resides in a deep and stable potential energy well. For this 10% vacancy configuration, the calculated oxygen vacancy formation energy is approximately 7.21 eV at 300 K (see Appendix C for details), which is about 2 eV higher than that of a single vacancy in the LSR phase (about 5 eV) [48], reflecting the significant concentration effect on defect energetics.
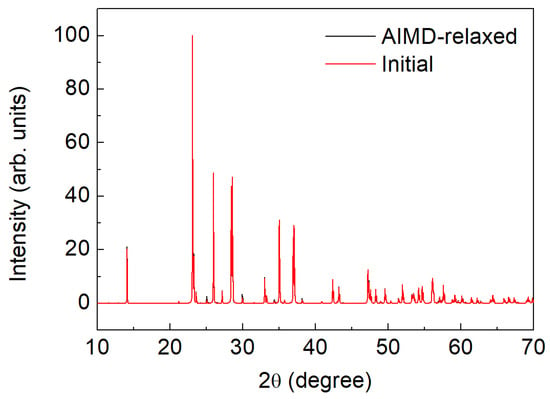
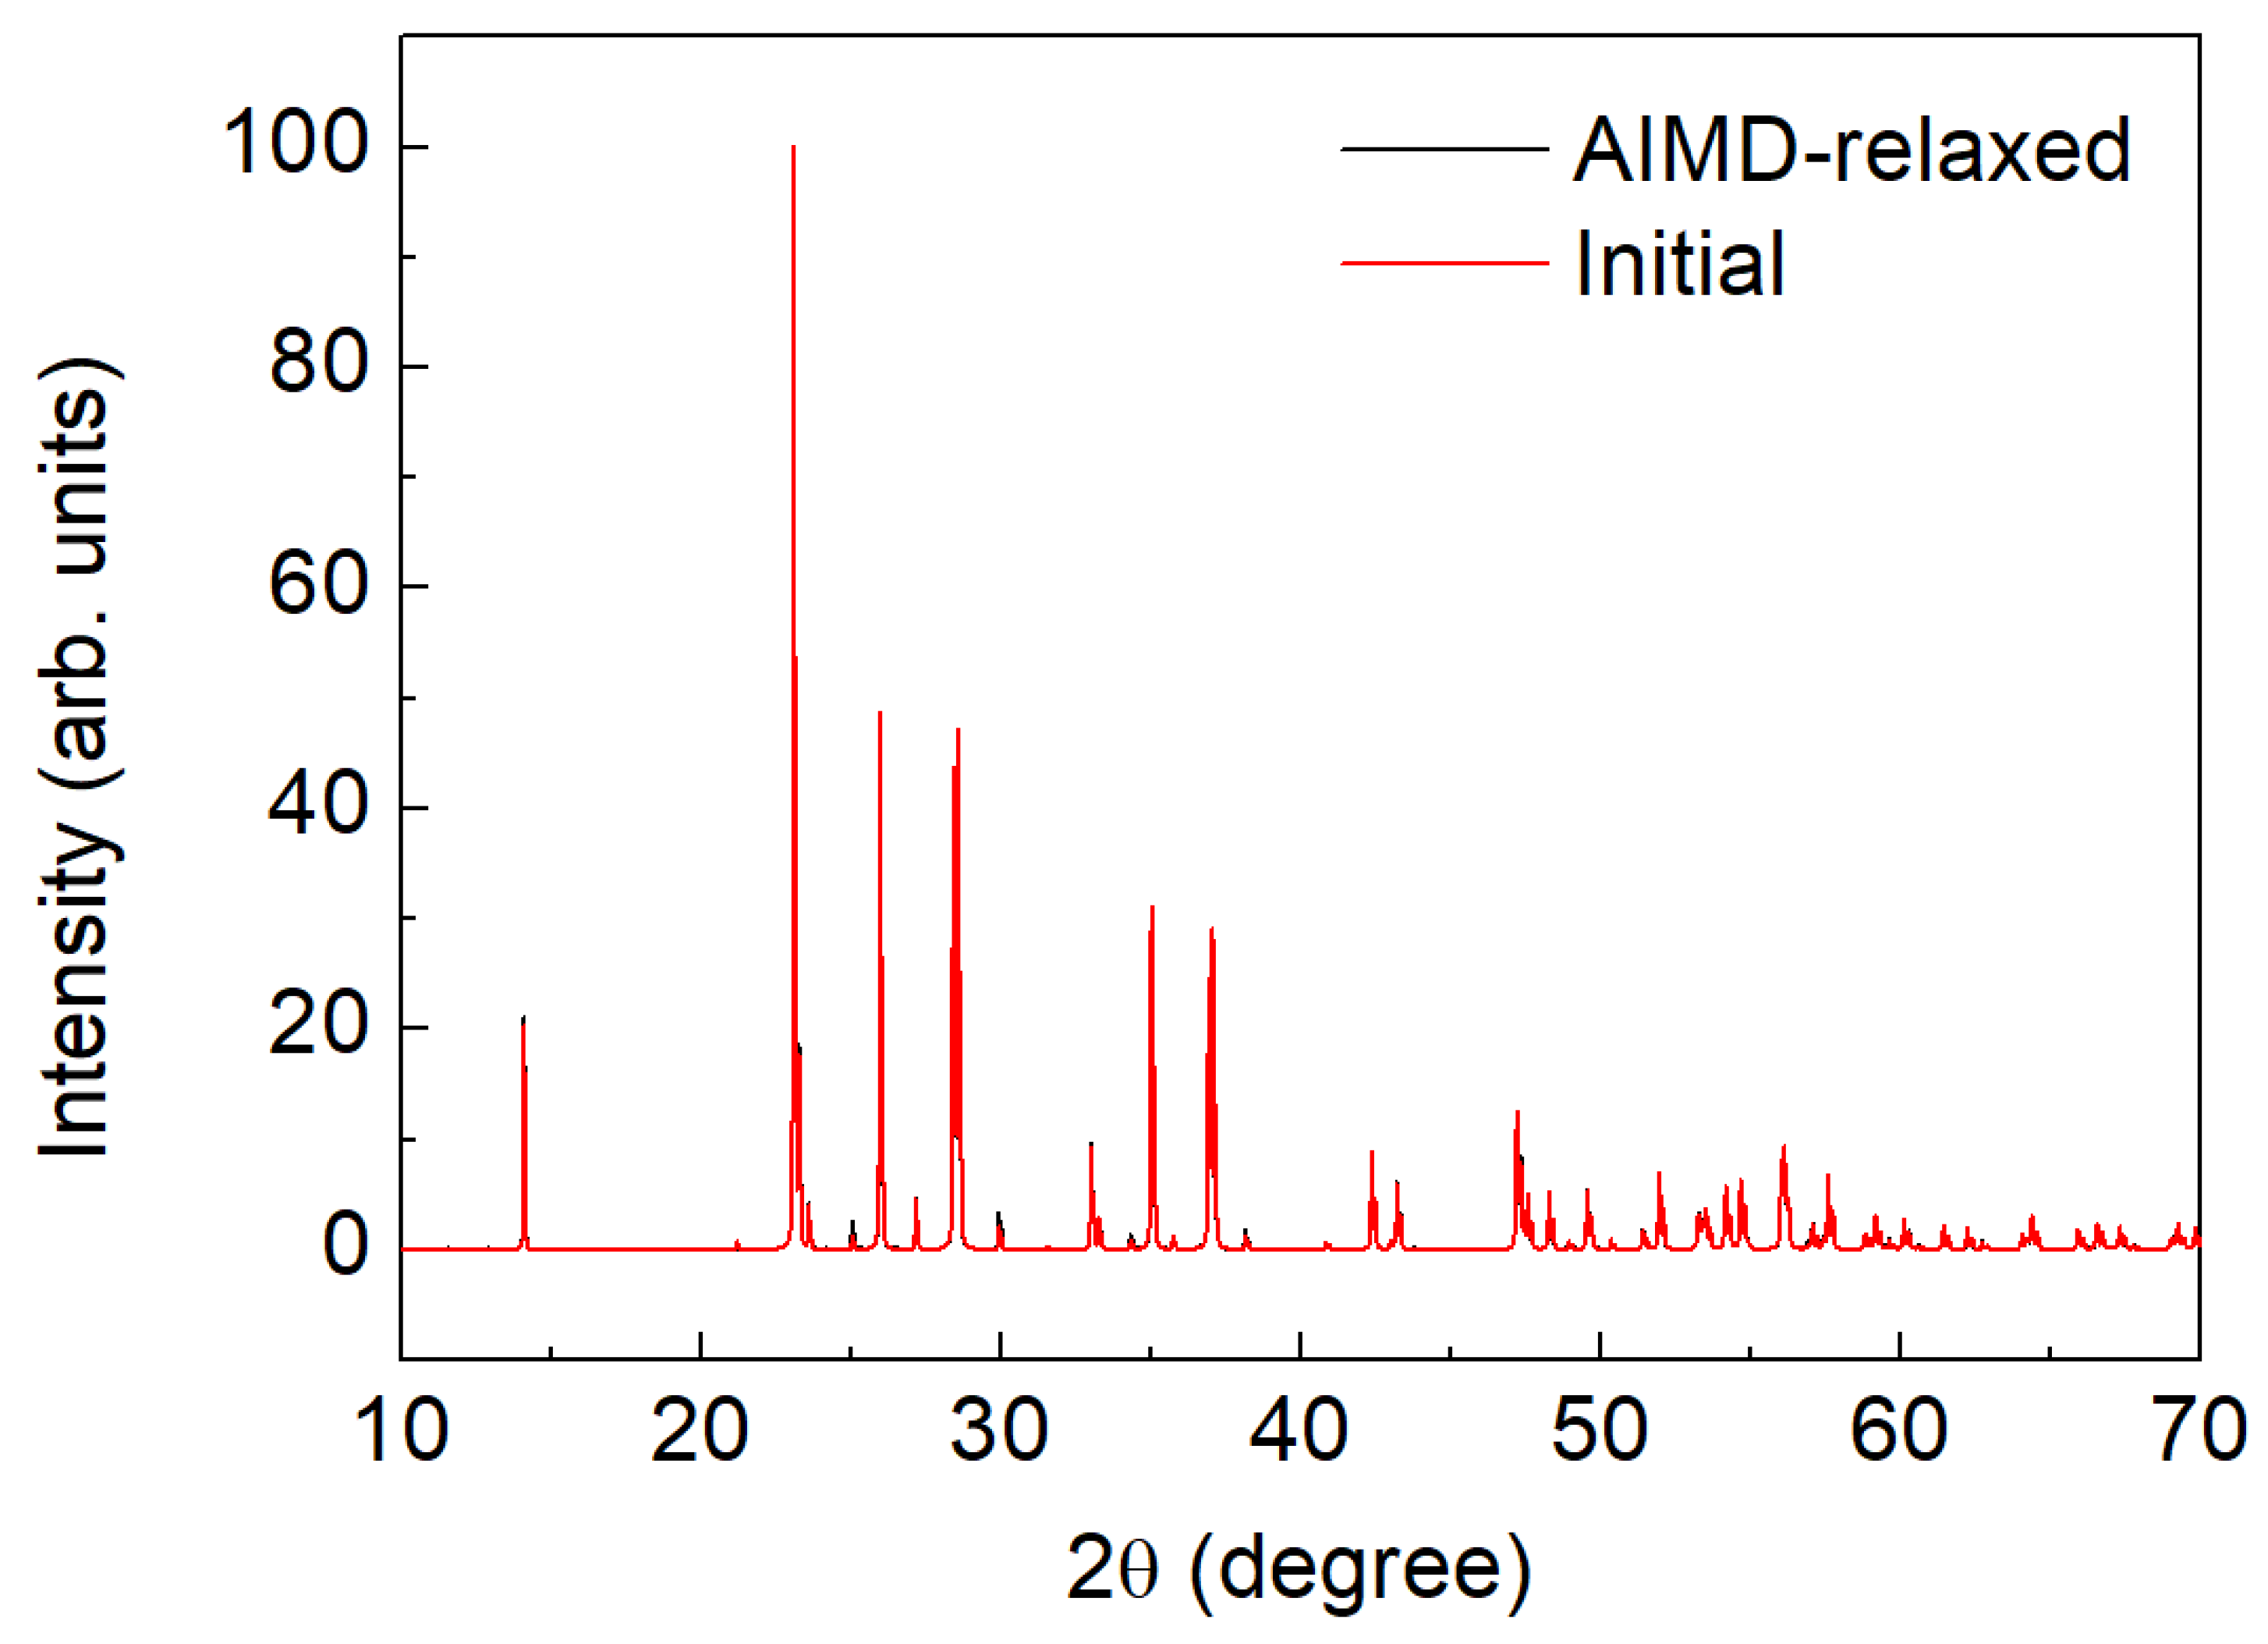
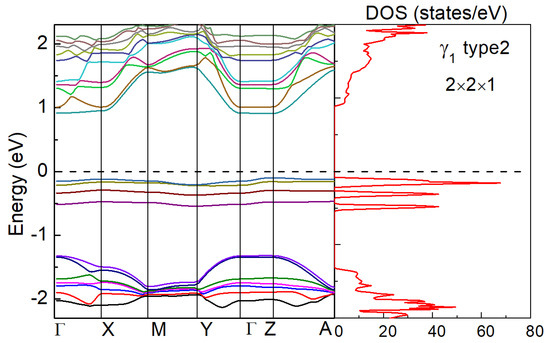
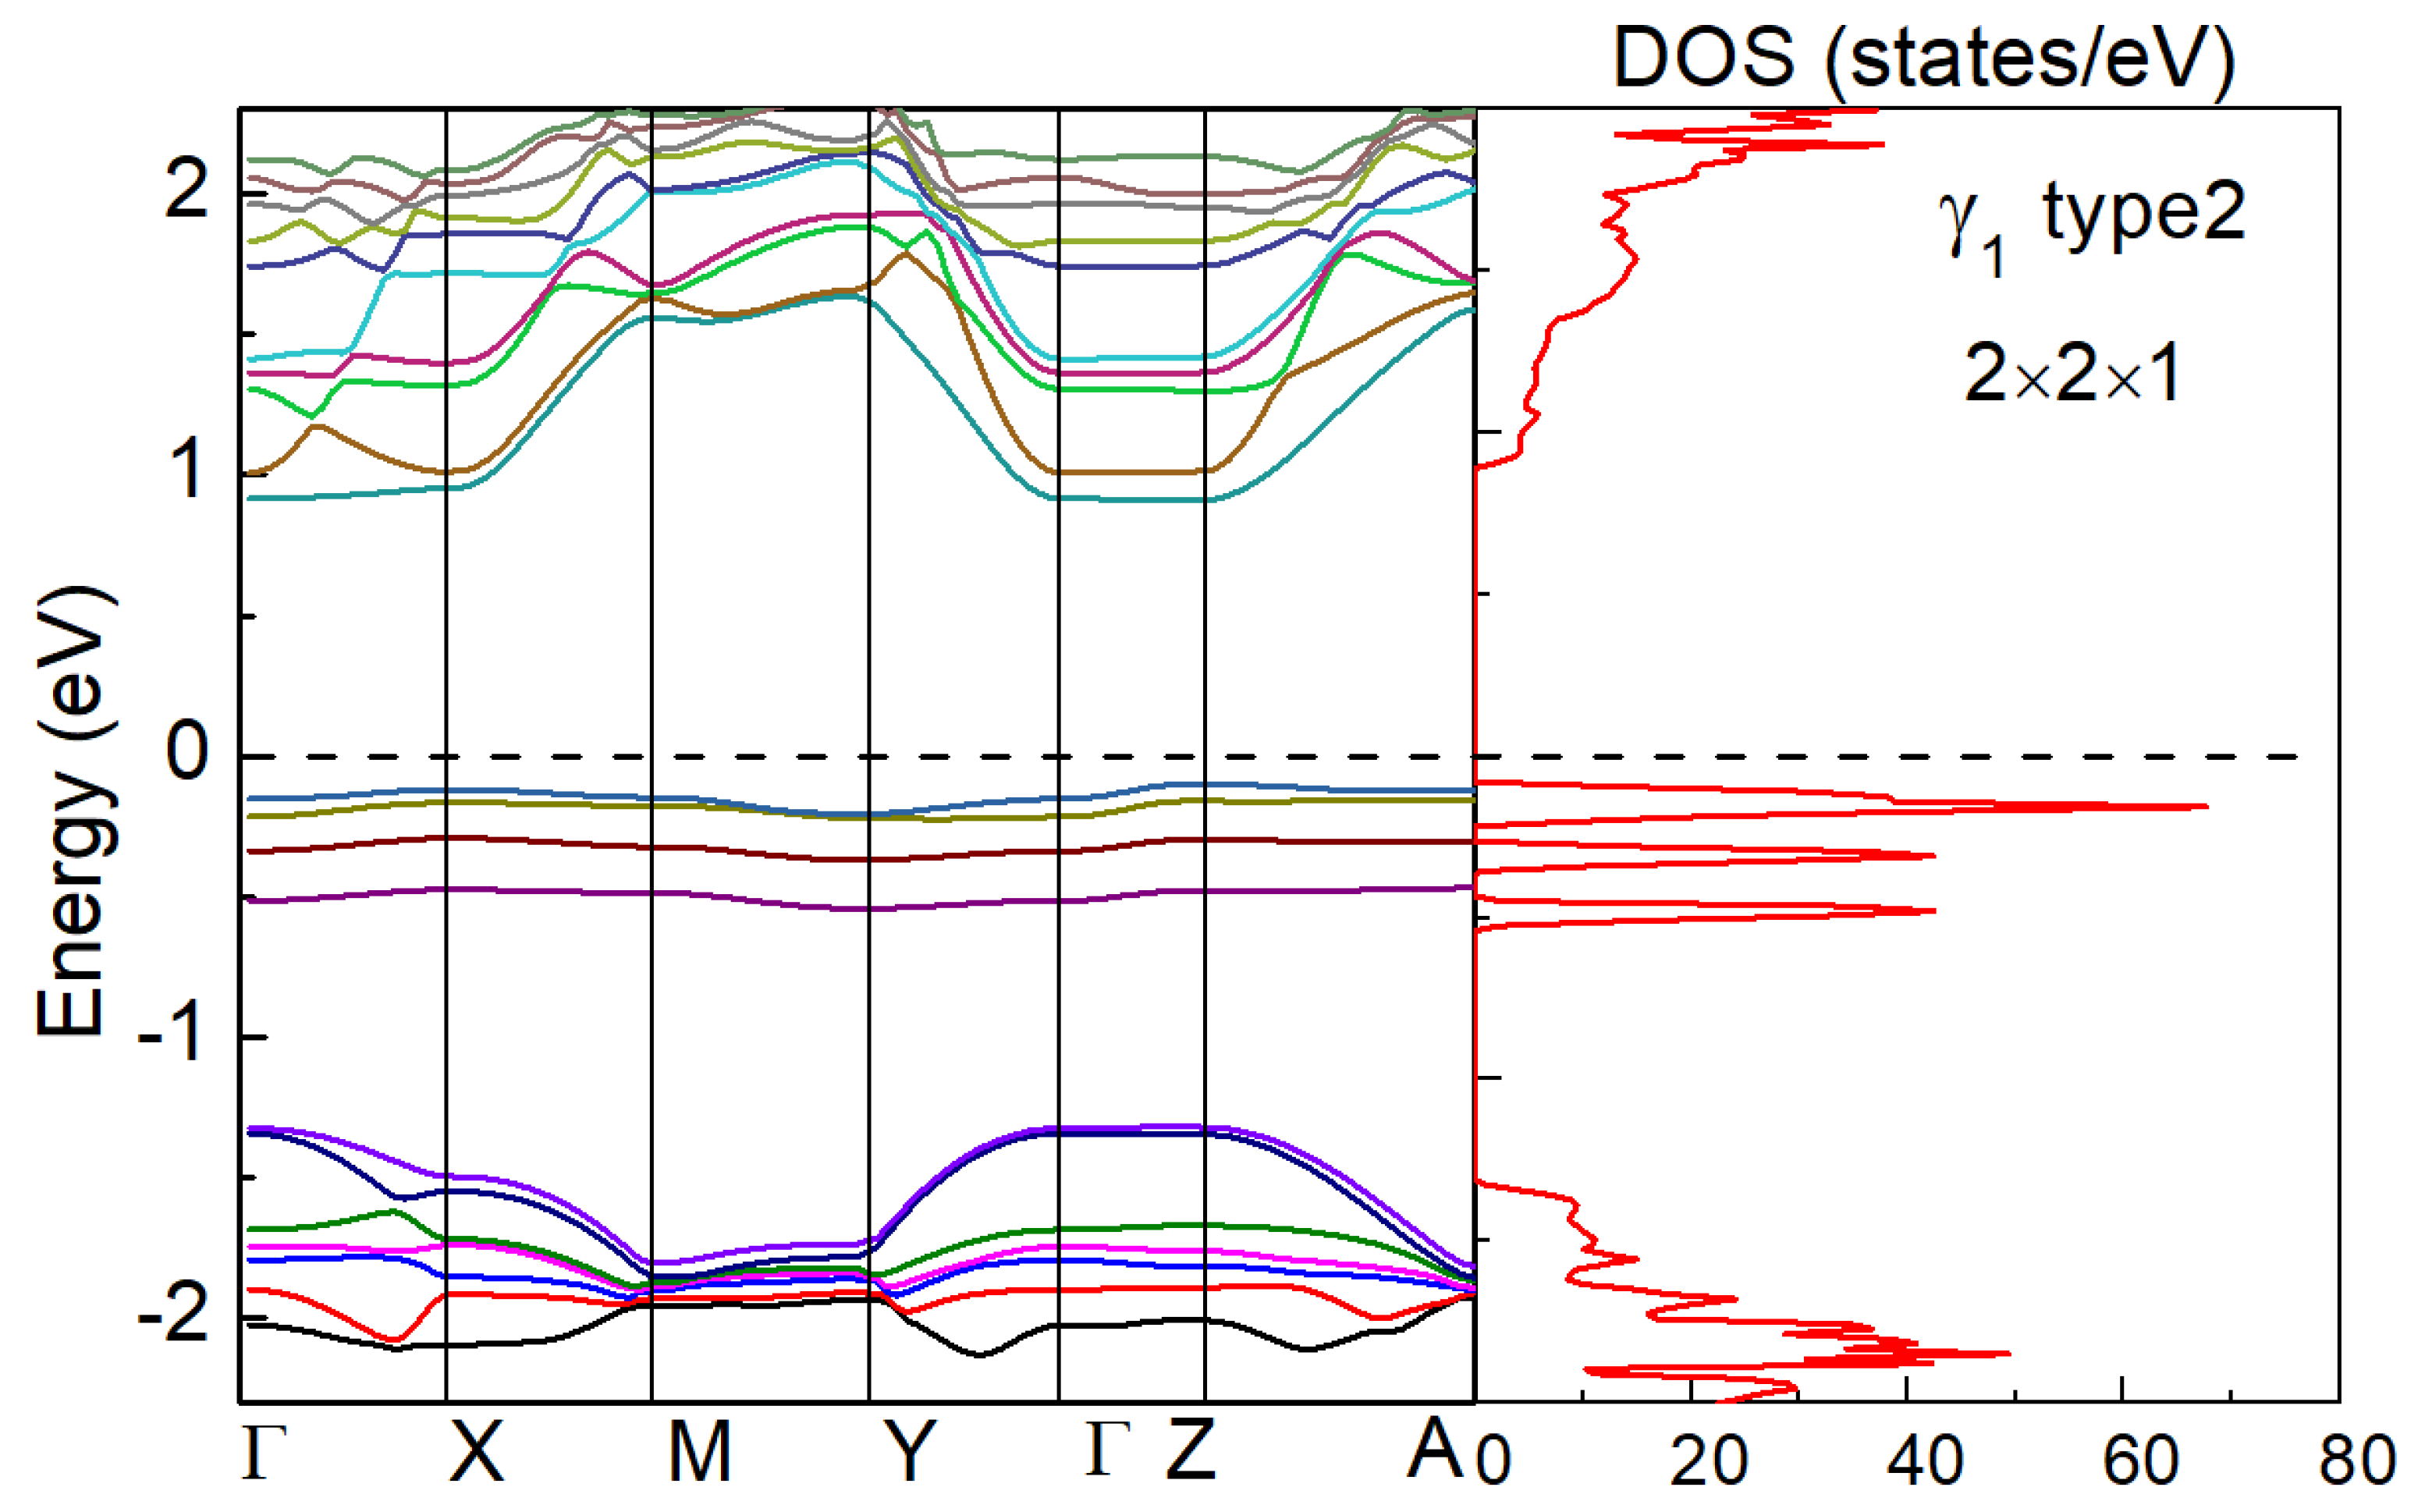
The XRD pattern of the AIMD-relaxed structure is compared with that of the structurally relaxed initial structure in Figure 7. The peak positions remain essentially unchanged, confirming that the crystalline structure is well preserved. Furthermore, the band structure and DOS of the final configuration are presented in Figure 8, where the flat bands near the Fermi level persist after thermal evolution, with four flat bands clearly resolved. This confirms the robustness of the heavy-fermion-like electronic feature.
Figure 7.
XRD patterns (where θ is the diffraction angle) of the γ1 phase with 10% oxygen vacancies (type 2) in the 2 × 2 × 1 supercell: initial (structurally relaxed structure before AIMD, red line) and AIMD-relaxed (crystal structure after 5 ps AIMD simulation at 30 K, black line). The red line largely overlaps with the black line, indicating that the initial and AIMD-relaxed structures are nearly identical.
Figure 8.
Band structure and density of states (DOS) of the γ1 phase with 10% oxygen vacancies (type 2) after 5 ps AIMD simulation at 30 K, calculated using the final crystal configuration (2 × 2 × 1 supercell). The Fermi level, indicated by horizontal dashed line, is positioned at 0 eV. Different colors represent different energy bands.
3.3. Experimental Proposal
To test the theoretical predictions, let us provide some experimental proposals regarding the measurement of the effective masses of electrons in the oxygen-deficient Ta2O5. Here we present a scheme based on cyclotron resonance of electrons in a strong magnetic field, which is a standard technique for effective mass determination applicable to semiconductors regardless of their bandgap width.
The principle is as follows. The sample is placed at cryogenic temperatures (e.g., liquid helium temperature) under a magnetic field and irradiated with monochromatic electromagnetic waves. When the wave frequency ω matches the cyclotron frequency ωc of the carriers, resonant absorption occurs. The effective mass m∗ is then obtained from the resonance condition
For a given cyclotron frequency of , the required magnetic field is determined by with e the elementary charge Taking the effective masses obtained from our DFT calculations ( ∼102–104 ), the corresponding magnetic field ranges from approximately 0.36 T to 35.7 T, which are within the capabilities of existing steady-state high-field facilities (for instance, SHMFF in Hefei, providing up to 45.22 T [49,50]). This supports the experimental feasibility of the proposed cyclotron resonance scheme.
Conversely, using the effective masses derived from our first-principles calculations, the corresponding resonant frequency becomes k-dependent: .
To observe a well-defined resonance peak, the condition must be satisfied, where is the carrier mean free scattering time. The critical value is defined by , giving
With and the computed electron velocity , the corresponding real-space critical length is estimated as
For the Γ–X direction, represents the minimum sample thickness required along the real-space X-direction for the resonance to be observable.
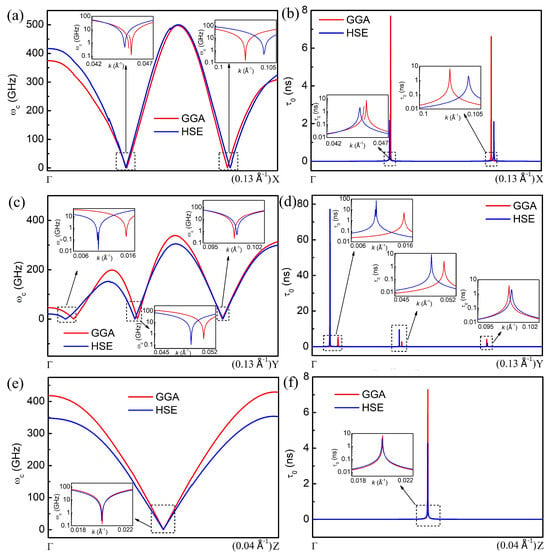
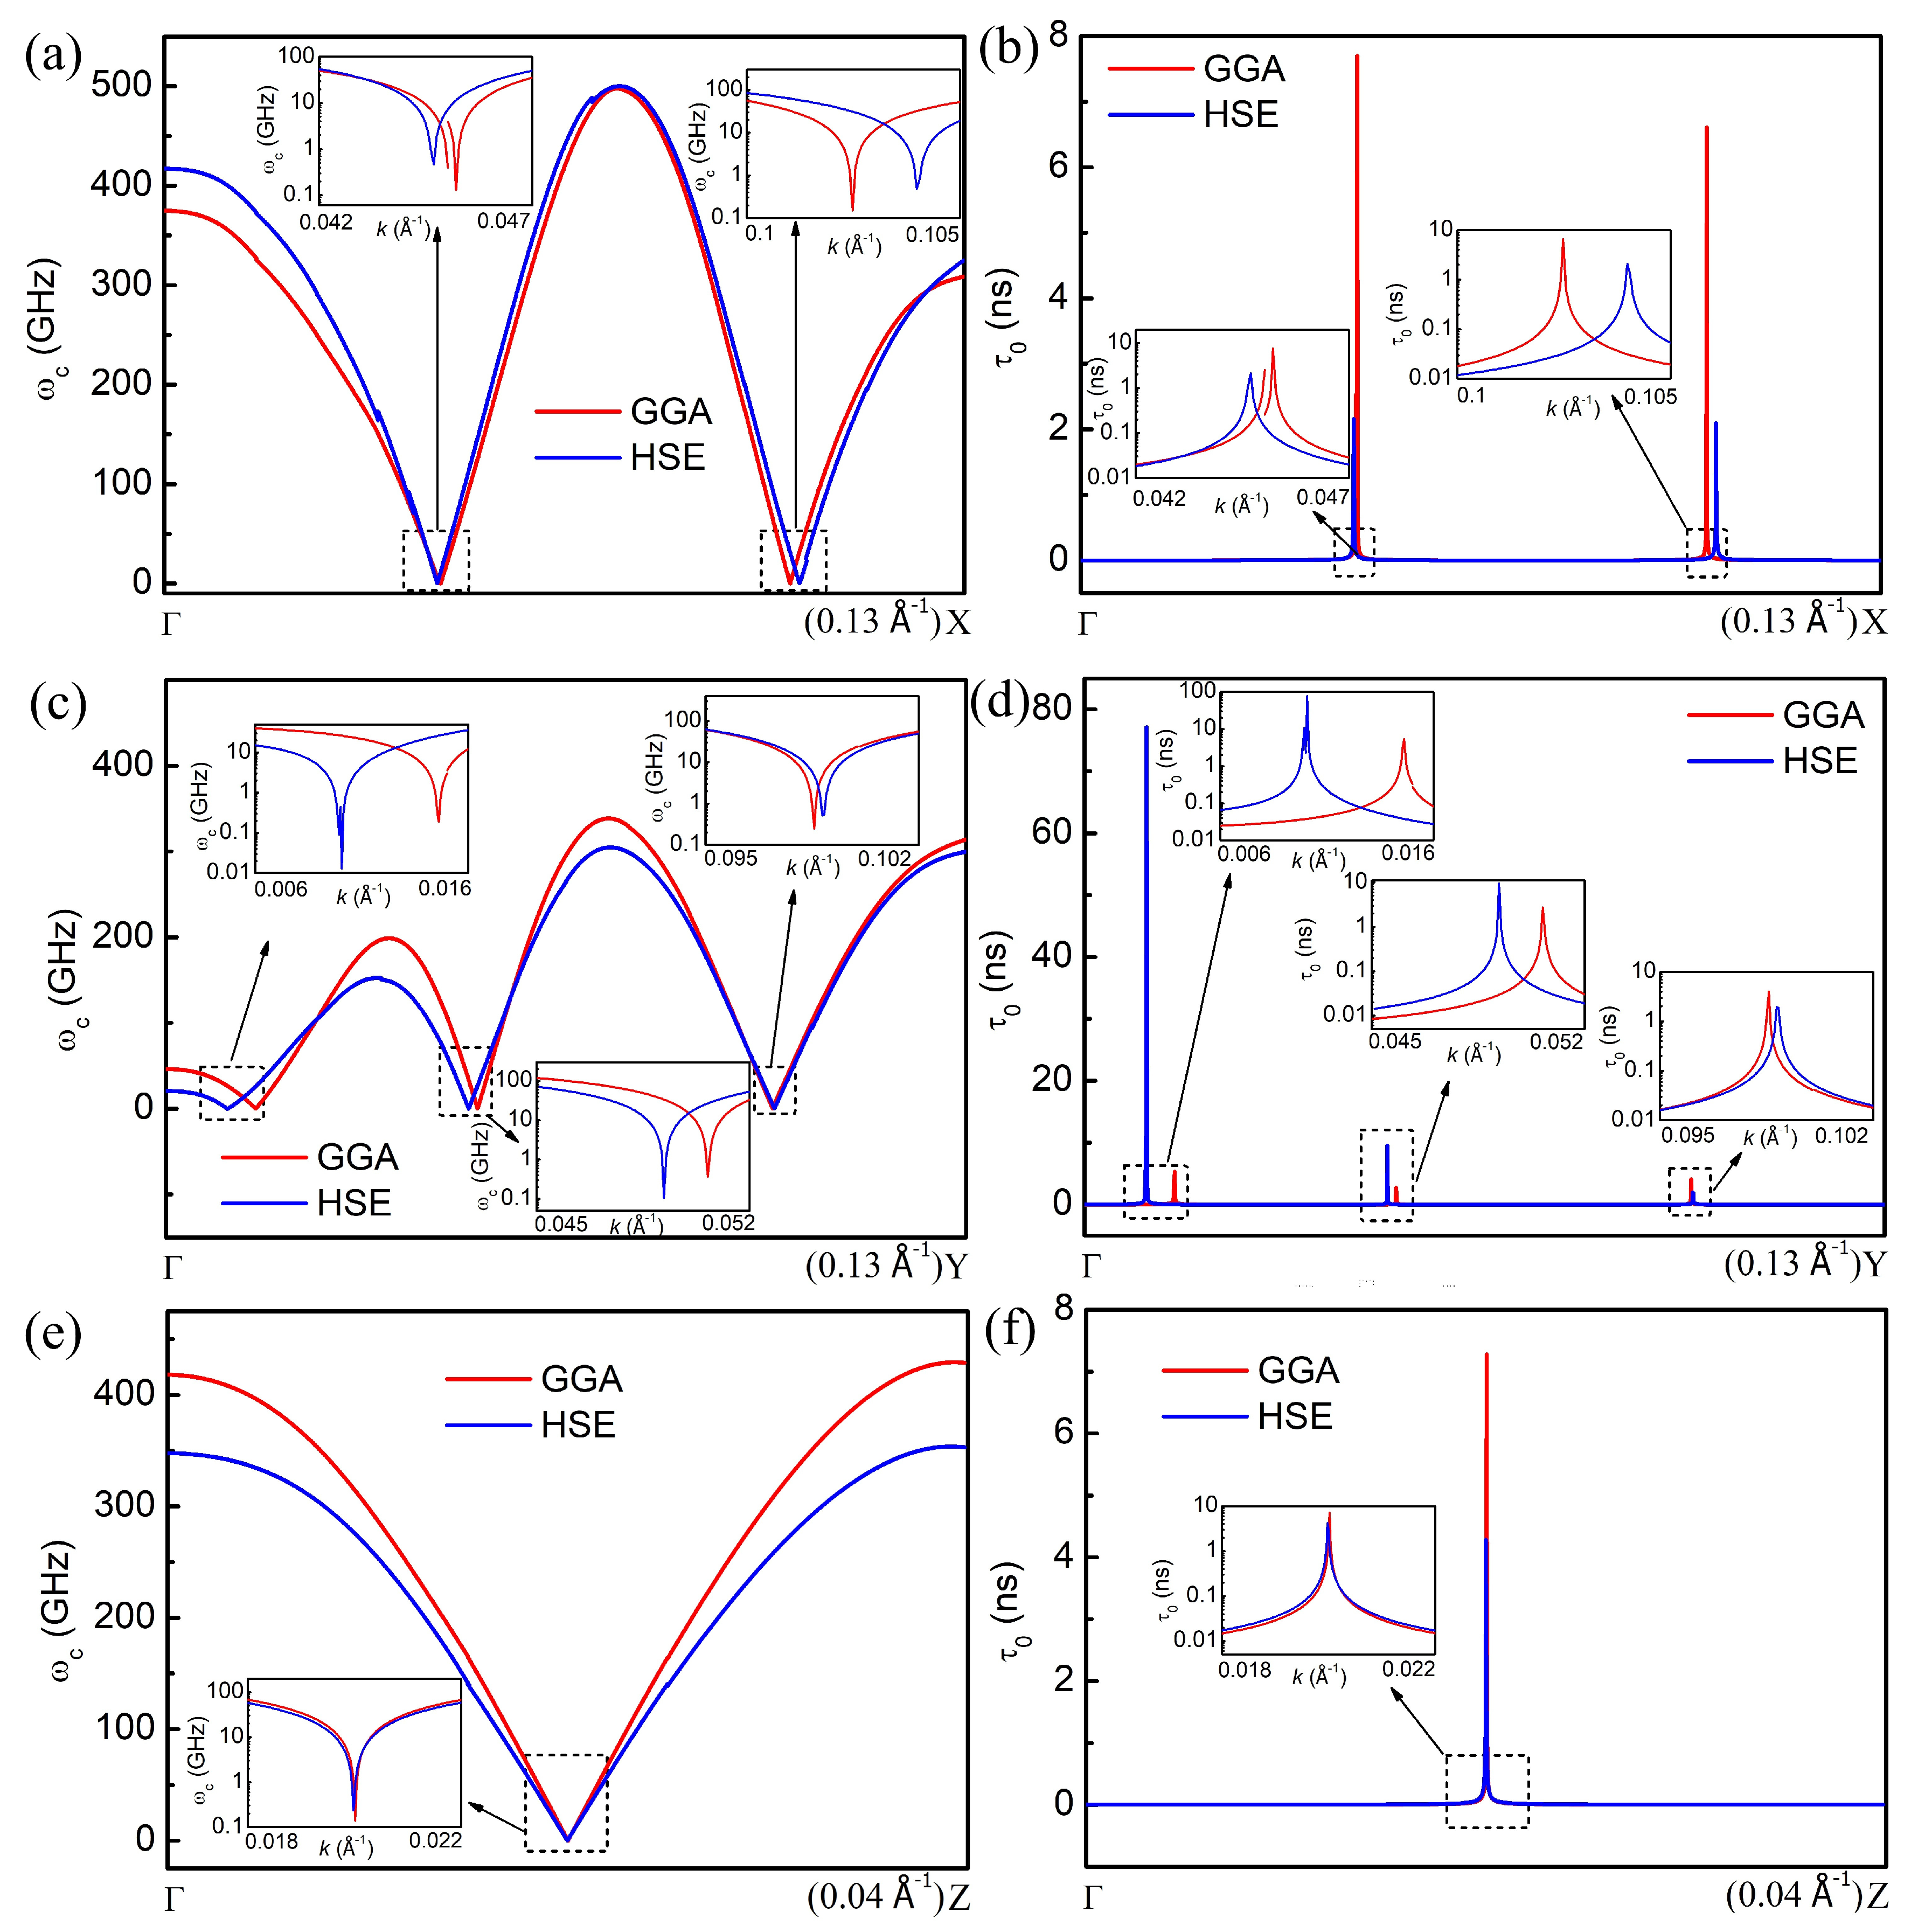
For the γ1 phase, as shown in Figure 9, ωc(k) drops to values on the order of 10−2 to 101 GHz in the flat-band regions where |m*| ≥ 102|m0|, corresponding to photon energies ℏωc in the sub-meV range (far-infrared to microwave regime). Concurrently, τ0(k) increases sharply to about 0.01–10 ns in these regions, indicating that long carrier scattering times are required to satisfy the cyclotron resonance condition ωcτ > 1. The insets provide magnified views of the flat-band regions, revealing that τ0(k) varies by several orders of magnitude within these narrow k intervals. The GGA and HSE results exhibit consistent qualitative trends, with HSE predicting slightly larger ωc values (and correspondingly smaller τ0 values) due to the modestly larger bandwidths obtained from the hybrid functional.
Figure 9.
Calculated cyclotron resonance frequency ωc(k) (a,c,e) and critical scattering time τ0(k) (b,d,f) for the γ1 phase of Ta2O5 with 10% oxygen vacancy (type 2), obtained using GGA and HSE methods for the Γ–X (a,b), Γ–Y (c,d), and Γ–Z (e,f) directions. The magnetic field is set to B = 10 T. The insets show magnified views of the dashed-box regions, with the vertical axis plotted on a logarithmic scale (base 10).
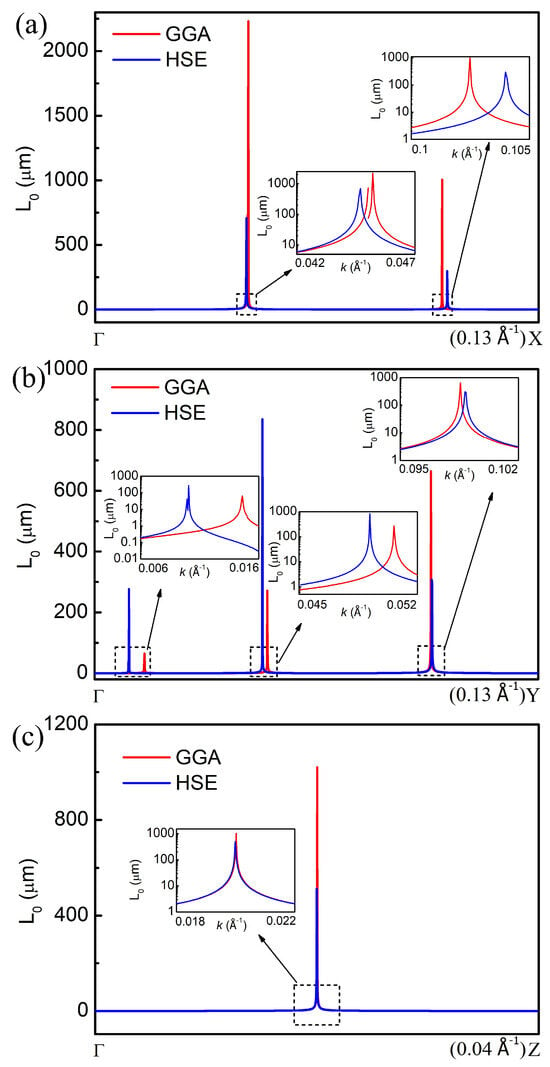
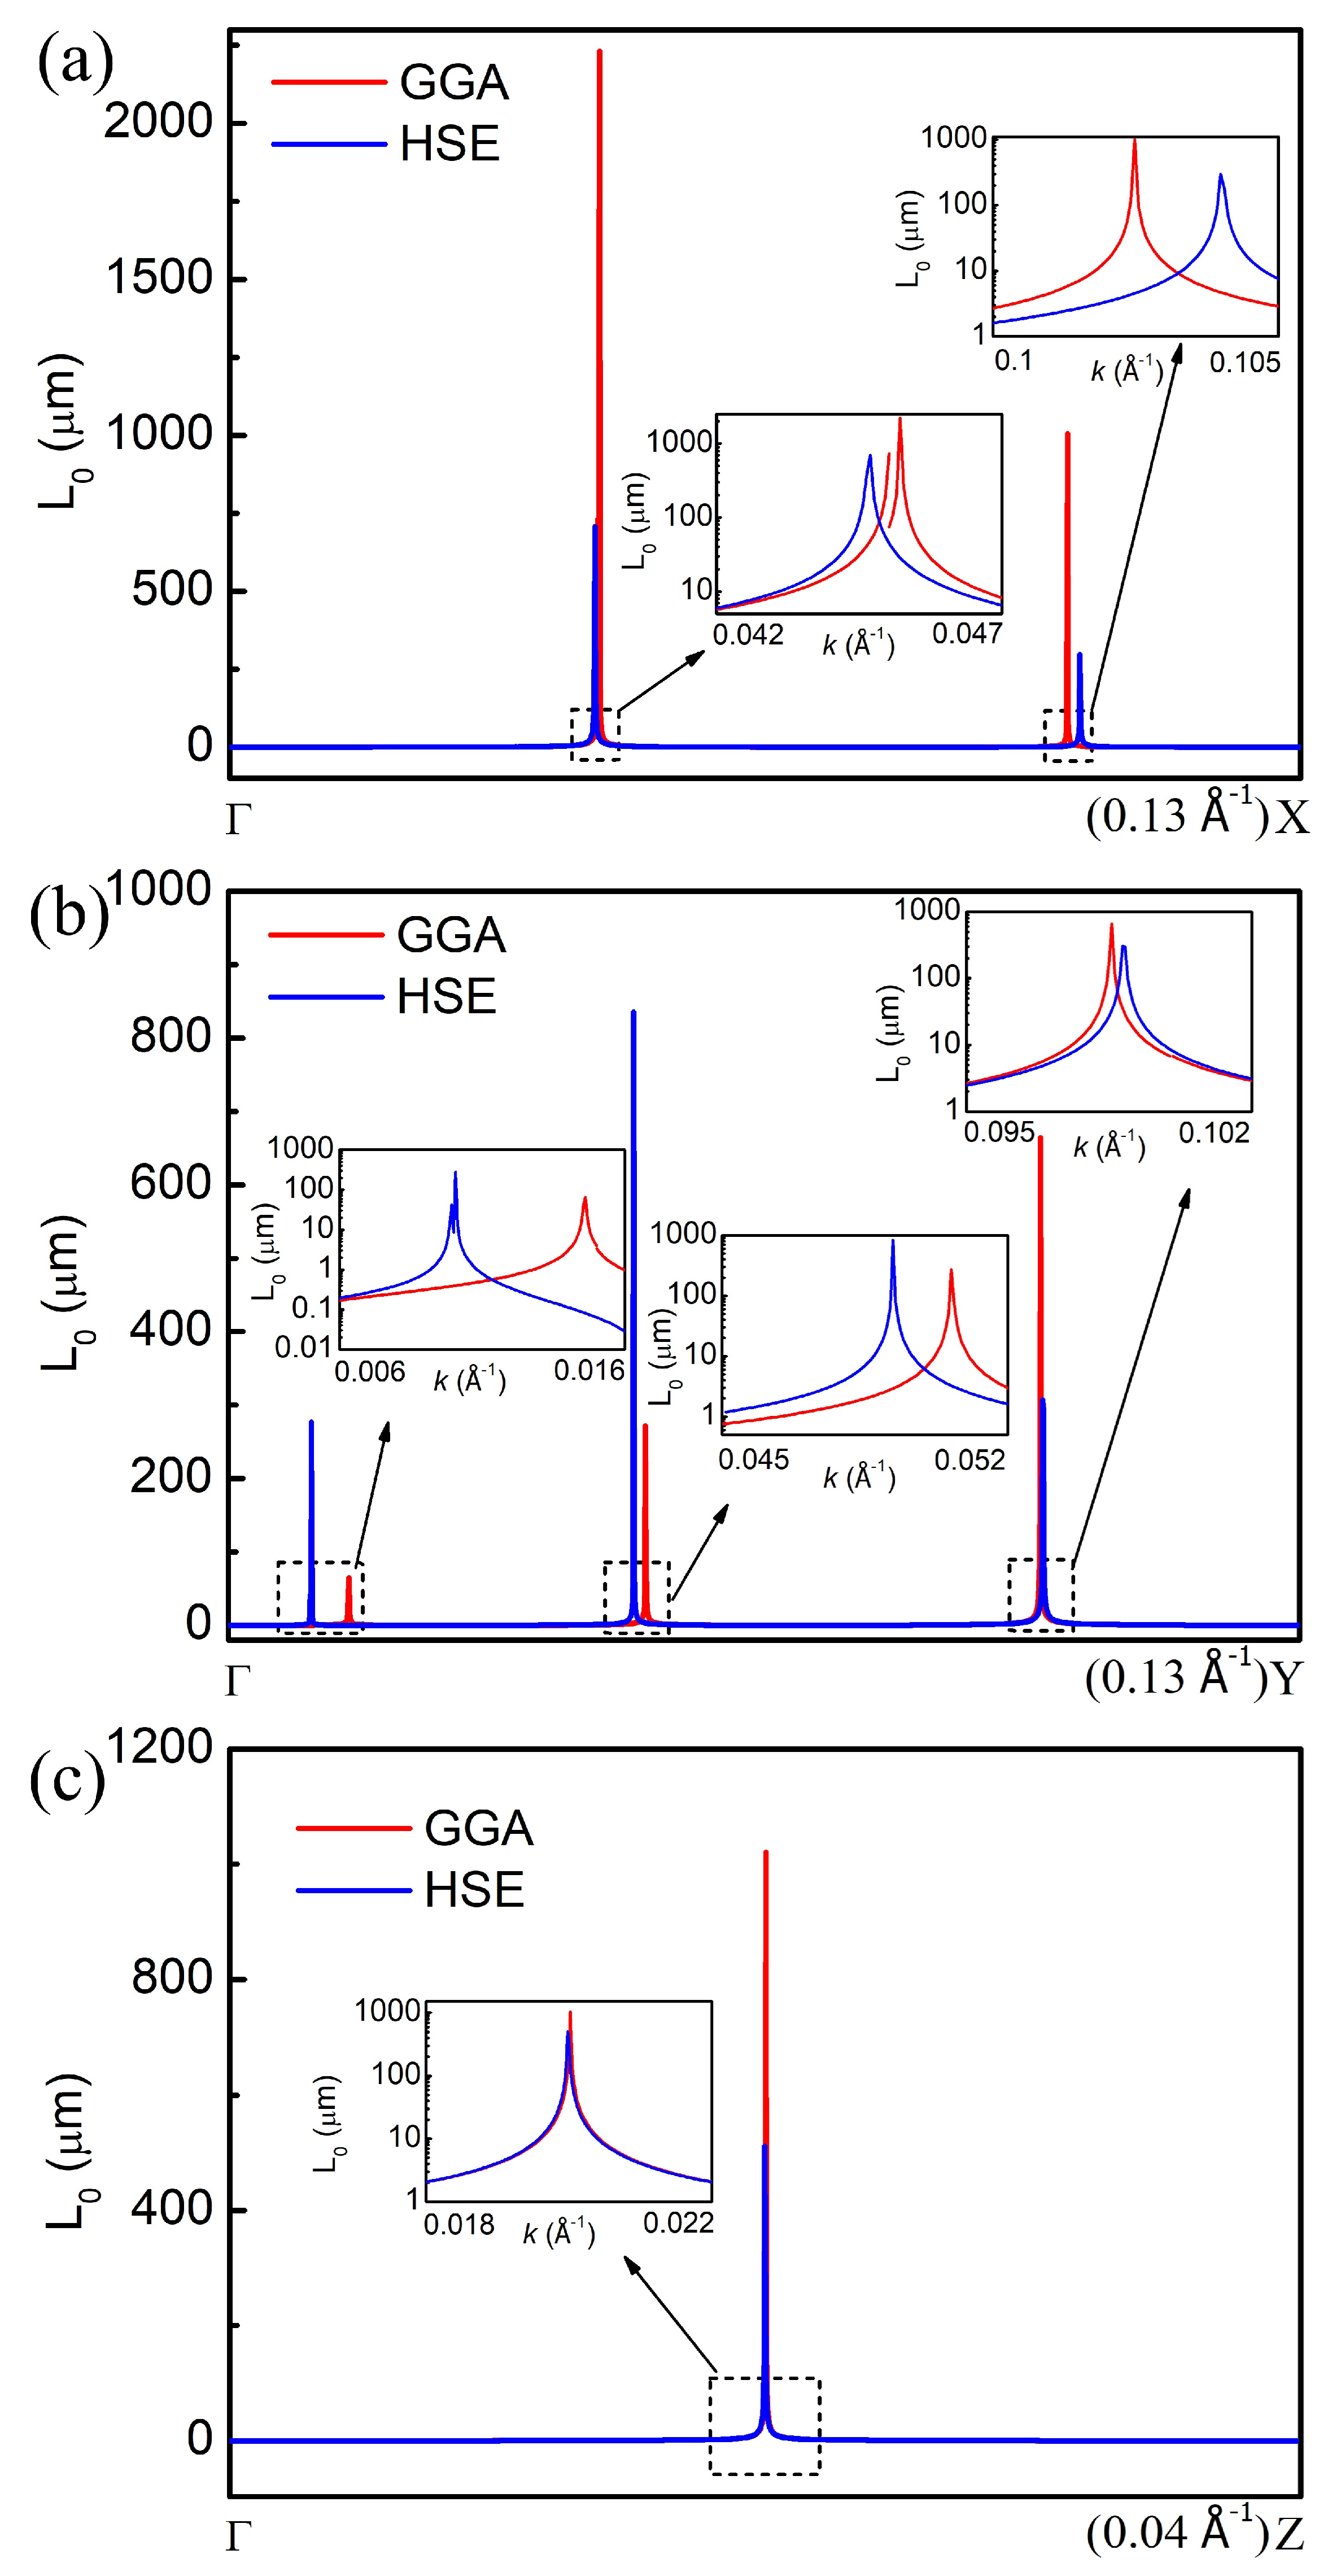
The critical length L0(k) for the γ1 phase is presented in Figure 10. Along the Γ–X direction, L0 reaches values on the order of 103 μm in the flat-band regions, implying that the sample dimension along the crystallographic X direction must be at least on this scale to allow a well-defined cyclotron resonance measurement. Such a requirement is demanding but achievable with high-quality single crystals of Ta2O5. Along the Γ–Y and Γ–Z directions, L0 is relatively smaller (about 102 μm), suggesting that measurements along these orientations may be more experimentally accessible. The HSE results yield slightly smaller L0 values compared to GGA, consistent with the correspondingly smaller effective masses obtained from the hybrid functional. This consistency reinforces the robustness of our predictions.
Figure 10.
Calculated critical length L0(k) for the γ1 phase of Ta2O5 with 10% oxygen vacancy (type 2), obtained using GGA and HSE methods the Γ–X (a), Γ–Y (b), and Γ–Z (c) directions. The magnetic field is set to B = 10 T. The insets show magnified views of the dashed-box regions, with the vertical axis plotted on a logarithmic scale (base 10).
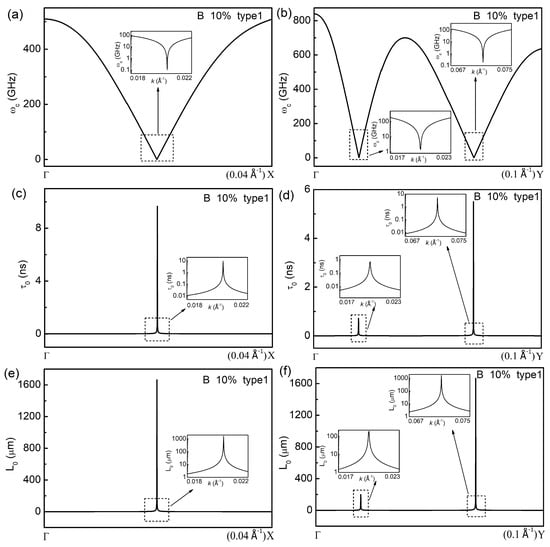
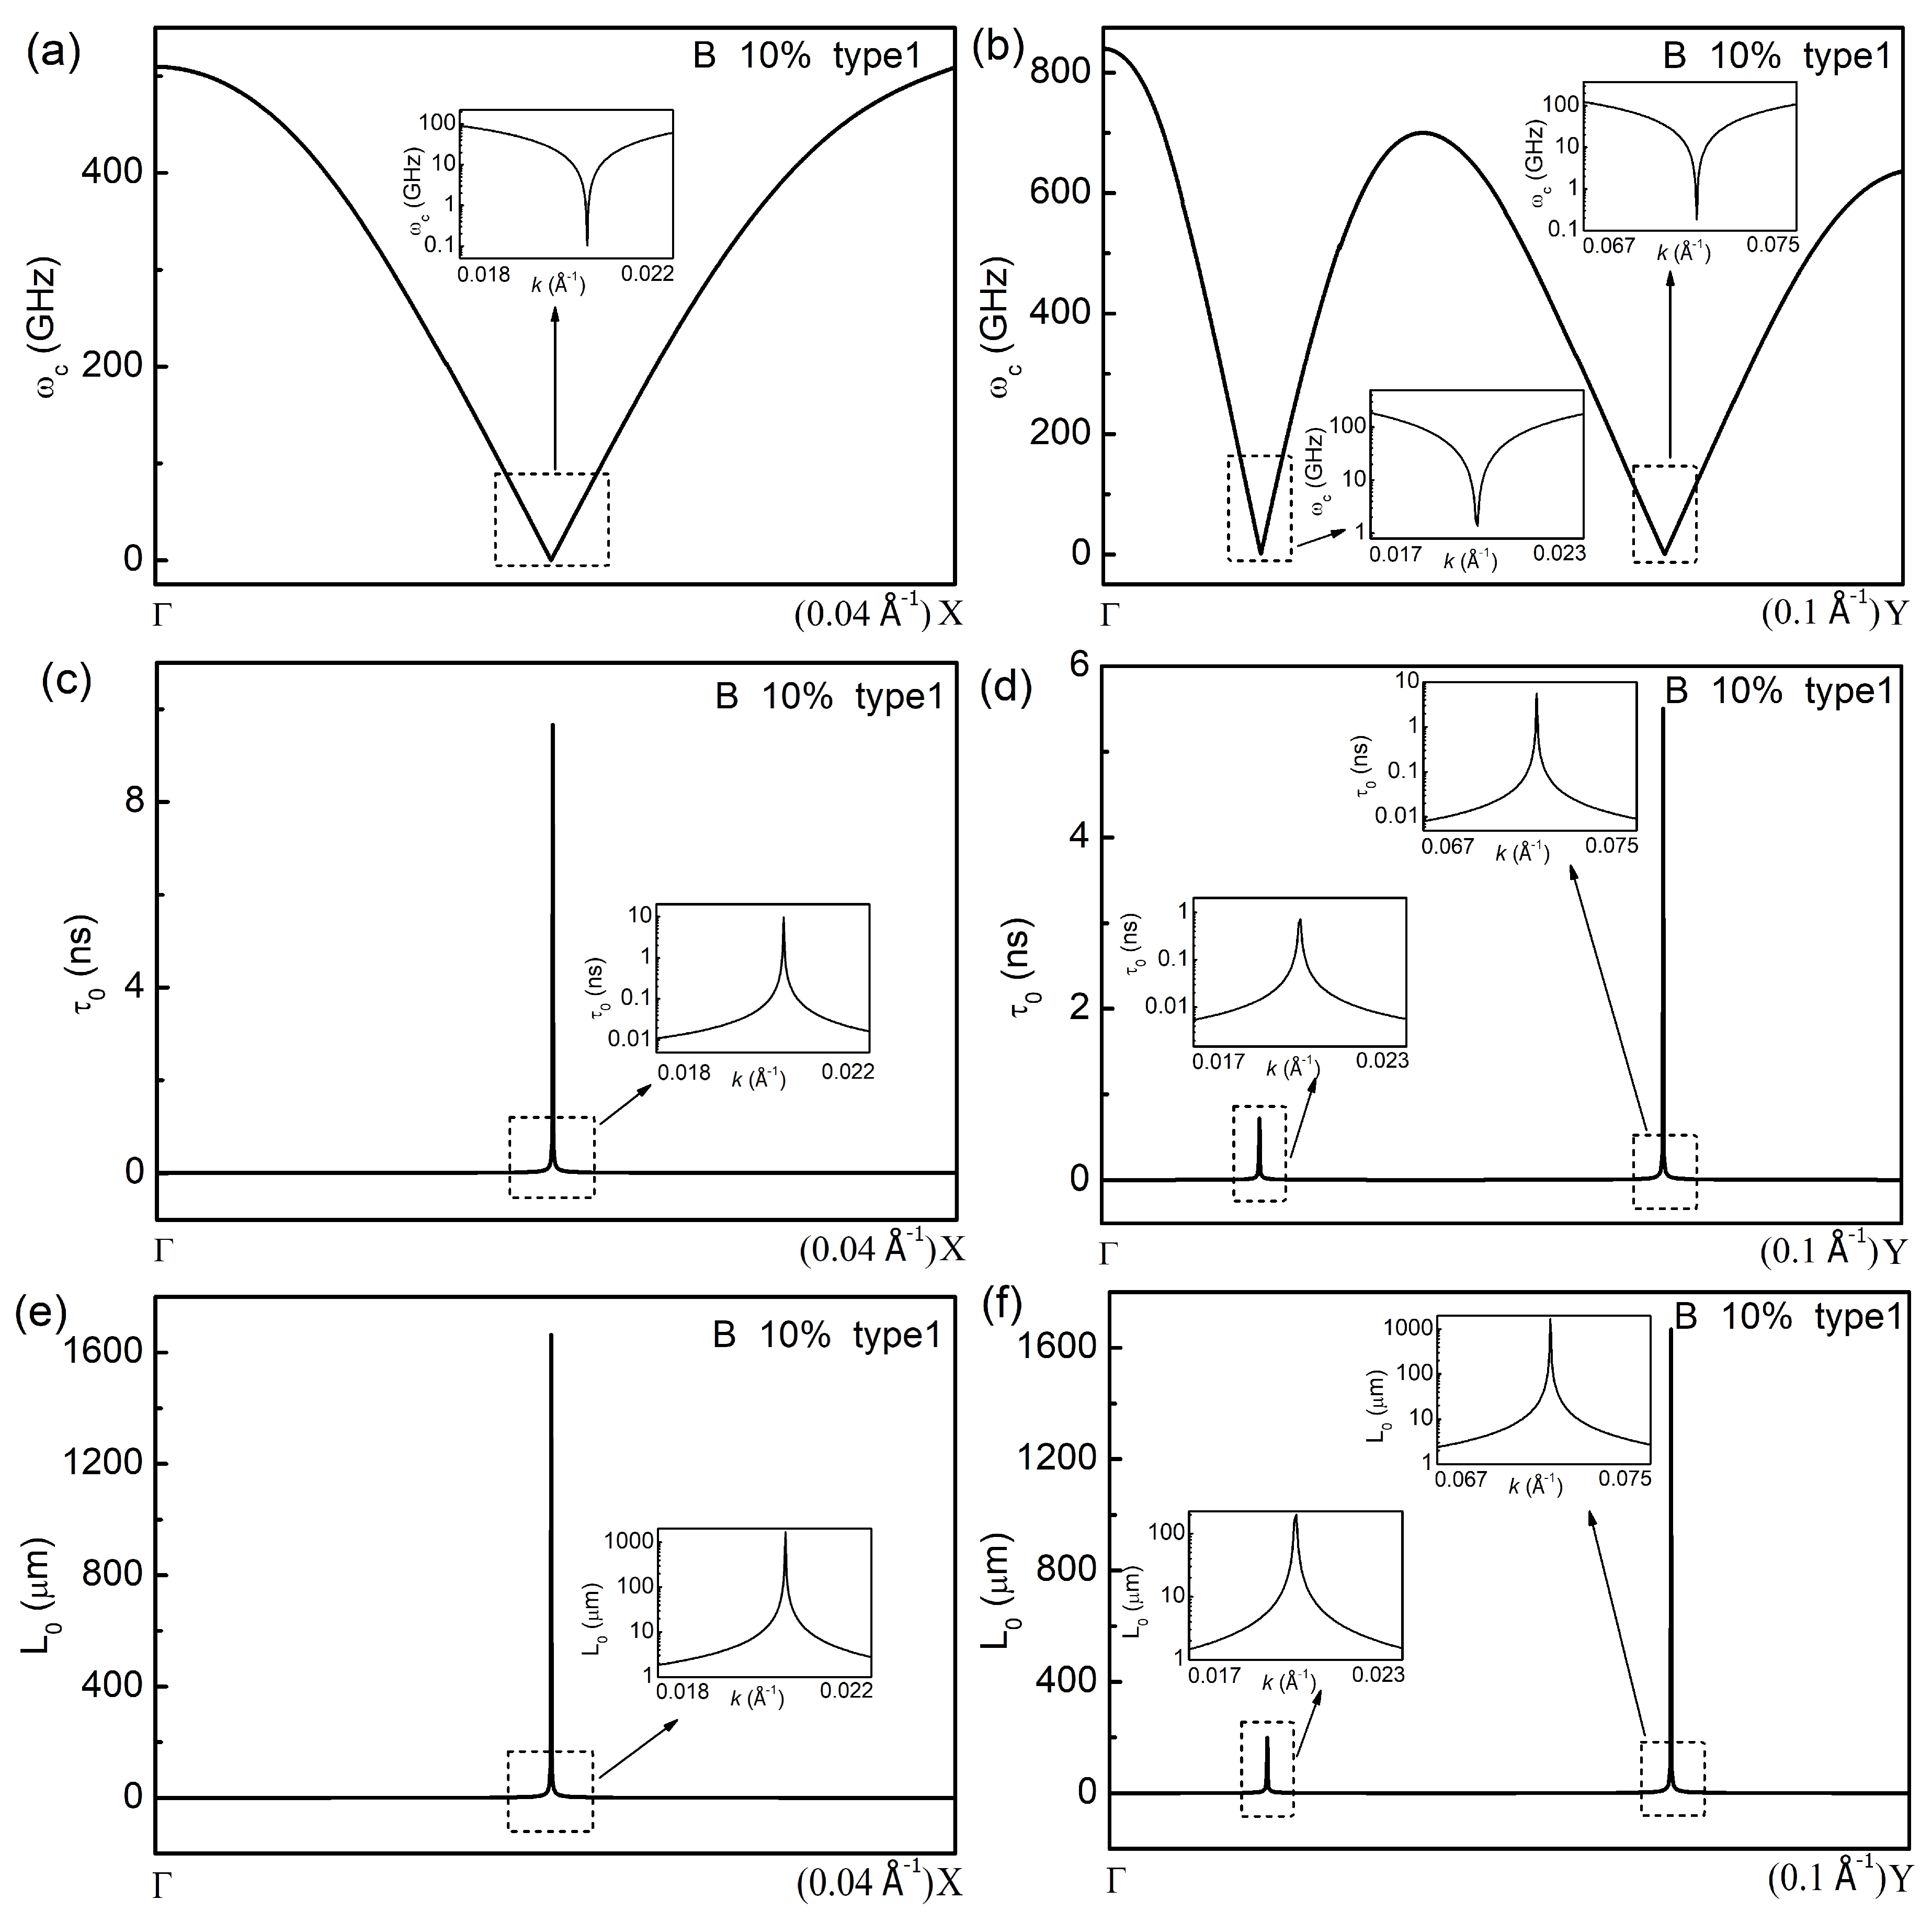
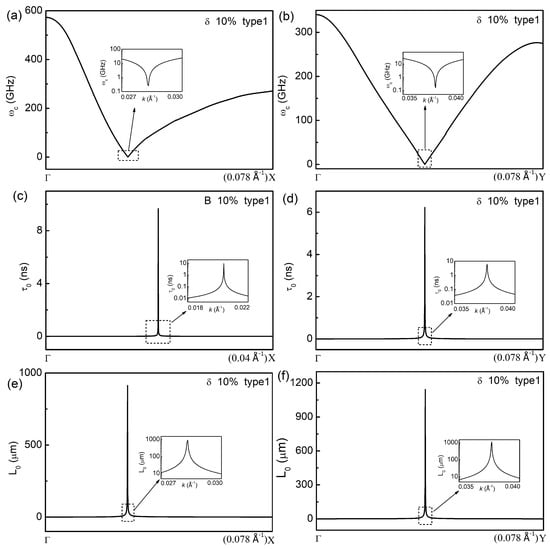
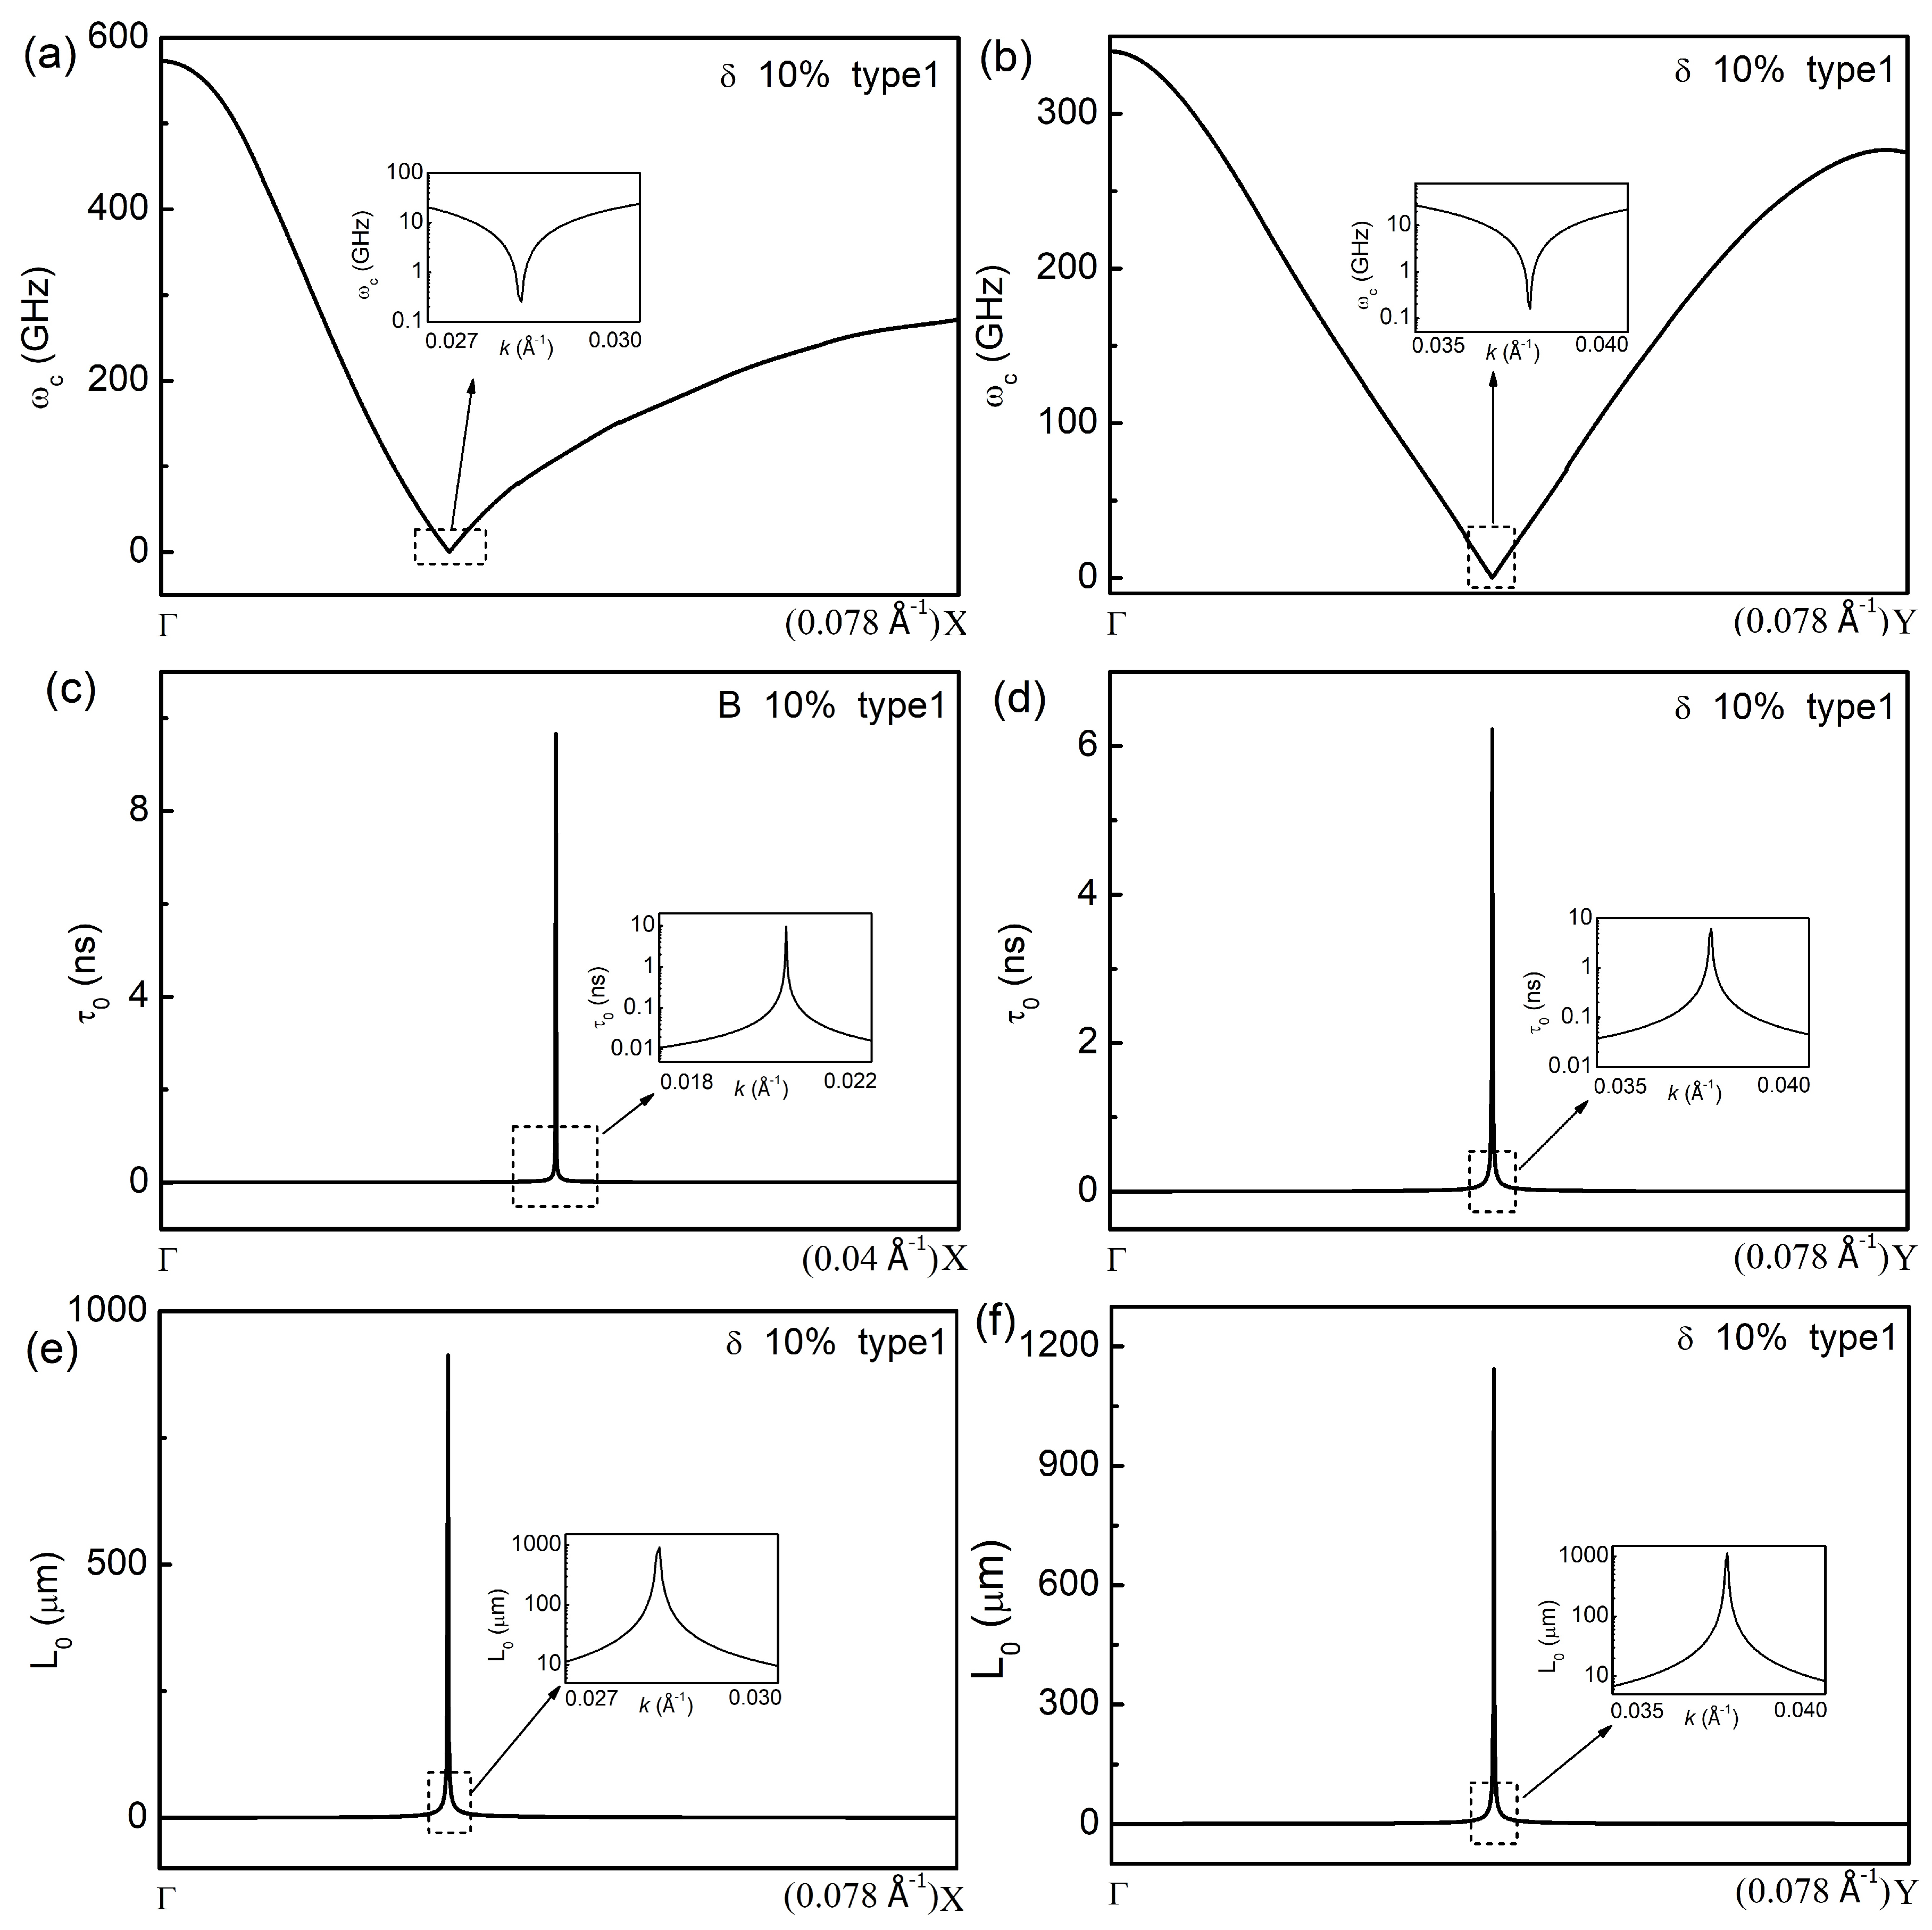
For the B and δ phases, the calculated ωc(k), τ0(k), and L0(k) are presented in Figure 11 and Figure 12, respectively. In both phases, the flat-band regions along the Γ–X and Γ–Y directions exhibit behavior qualitatively similar to that of the γ1 phase. As shown in Figure 11 for the B phase, ωc(k) drops to values on the order of 10−1 to 101 GHz in the regions where |m*| ≥ 102|m0|, while τ0(k) increases correspondingly to approximately 0.01–10 ns, and L0(k) reaches peak values on the order of 102–103 μm. The δ phase, shown in Figure 12, displays comparable magnitudes for all three quantities. The insets in both figures provide magnified views of the flat-band regions, revealing rapid variations over narrow k intervals. In both phases, L0 along the Γ–Y direction is generally smaller than along the Γ–X direction, suggesting that experimental detection can be more favorable along this orientation. These results, together with the results for the γ1 phase, (Figure 9 and Figure 10) indicate that oxygen-deficient Ta2O5 serves as a promising candidate for observing heavy-fermion-like behavior via cyclotron resonance measurements.
Figure 11.
Calculated cyclotron resonance frequency ωc(k) (a,b), critical scattering time τ0(k) (c,d), and critical length L0(k) (e,f) for the B phase of Ta2O5 with 10% oxygen vacancy (type 1), obtained using the GGA method for Γ–X (a,c,e) and Γ–Y (b,d,f) directions. The magnetic field is set to B = 10 T. The insets show magnified views of the dashed-box regions, with the vertical axis plotted on a logarithmic scale (base 10).
Figure 12.
Calculated cyclotron resonance frequency ωc(k) (a,b), critical scattering time τ0(k) (c,d), and critical length L0(k) (e,f) for the δ phase of Ta2O5 with 10% oxygen vacancy (type 1), obtained using the GGA method for Γ–X (a,c,e) and Γ–Y (b,d,f) directions. The magnetic field is set to B = 10. The insets show magnified views of the dashed-box regions, with the vertical axis plotted on a logarithmic scale (base 10).
4. Conclusions
The electronic properties of the wide-bandgap semiconductor Ta2O5 with oxygen vacancies are investigated through first-principles calculations. The introduction of oxygen vacancies leads to the formation of flat bands in the γ1, B, and δ phases. Notably, certain regions within these flat bands exhibit a significantly enhanced effective mass for electrons, reaching values the order of about 103–105 times that of free electrons, thereby demonstrating possible heavy-fermion-like behavior. To verify the theoretical predictions, experimental proposals based on cyclotron resonance of electrons in the presence of strong magnetic fields are suggested. We also note that electron-phonon coupling and polaron formation may further renormalize the electron effective masses in Ta2O5. The flat-band regions, with their enhanced density of states, could be particularly favorable for such effects, which would be worth exploring in future studies. Despite the critical requirements of experimental conditions, we expect the results can be tested by future experiments.
Author Contributions
Conceptualization, Y.Y.; methodology, H.-M.T. and Y.Y.; software, H.-M.T. and Y.Y.; validation, Y.Y.; formal analysis, H.-M.T. and Y.Y.; investigation, H.-M.T. and Y.Y.; Resources, H.-M.T., Y.Y. and Y.K.; data curation, H.-M.T. and Y.Y.; writing—original draft, H.-M.T. and Y.Y.; writing—review & editing, Y.Y. and Y.K.; visualization, Y.Y.; supervision, Y.Y.; project administration, Y.Y.; funding acquisition, H.-M.T., Y.Y. and Y.K. All authors have read and agreed to the published version of the manuscript.
Funding
This work is financially supported by the National Natural Science Foundation of China (No. 12074382, 12464012, 11804062, 11474285).
Data Availability Statement
The original contributions presented in this study are included in the article. Further inquiries can be directed to the corresponding author.
Acknowledgments
We are grateful to the staff of the Hefei Branch of the Supercomputing Center of the Chinese Academy of Sciences and the Hefei Advanced Computing Center for the support from their supercomputing facilities. We also thank the crew of the Center for Computational Materials Science, the Institute for Materials Research of Tohoku University, and the supercomputer resources used through the HPCI System Research Project (hp200246).
Conflicts of Interest
The authors declare no conflicts of interest.
Abbreviations
The following abbreviations are used in this manuscript:
| AIMD | ab initio molecular dynamics |
| DFT | Density Functional Theory |
| DOS | density of states |
| GGA | Generalized Gradient Approximation |
| HSE | Heyd–Scuseria–Ernzerhof |
| LSR | the low-temperature phase of Ta2O5 of the Stephenson–Roth model |
| NVT | canonical ensemble (constant Number of particles, Volume, and Temperature) |
| PAW | projector augmented wave |
| PBE | Perdew–Burke–Ernzerhof |
| RRAM | resistive random-access memory |
| SHMMF | Steady High Magnetic Field Facility |
| VASP | Vienna ab initio simulation package |
| Vo | oxygen vacancy |
| XRD | X-ray diffraction |
Appendix A
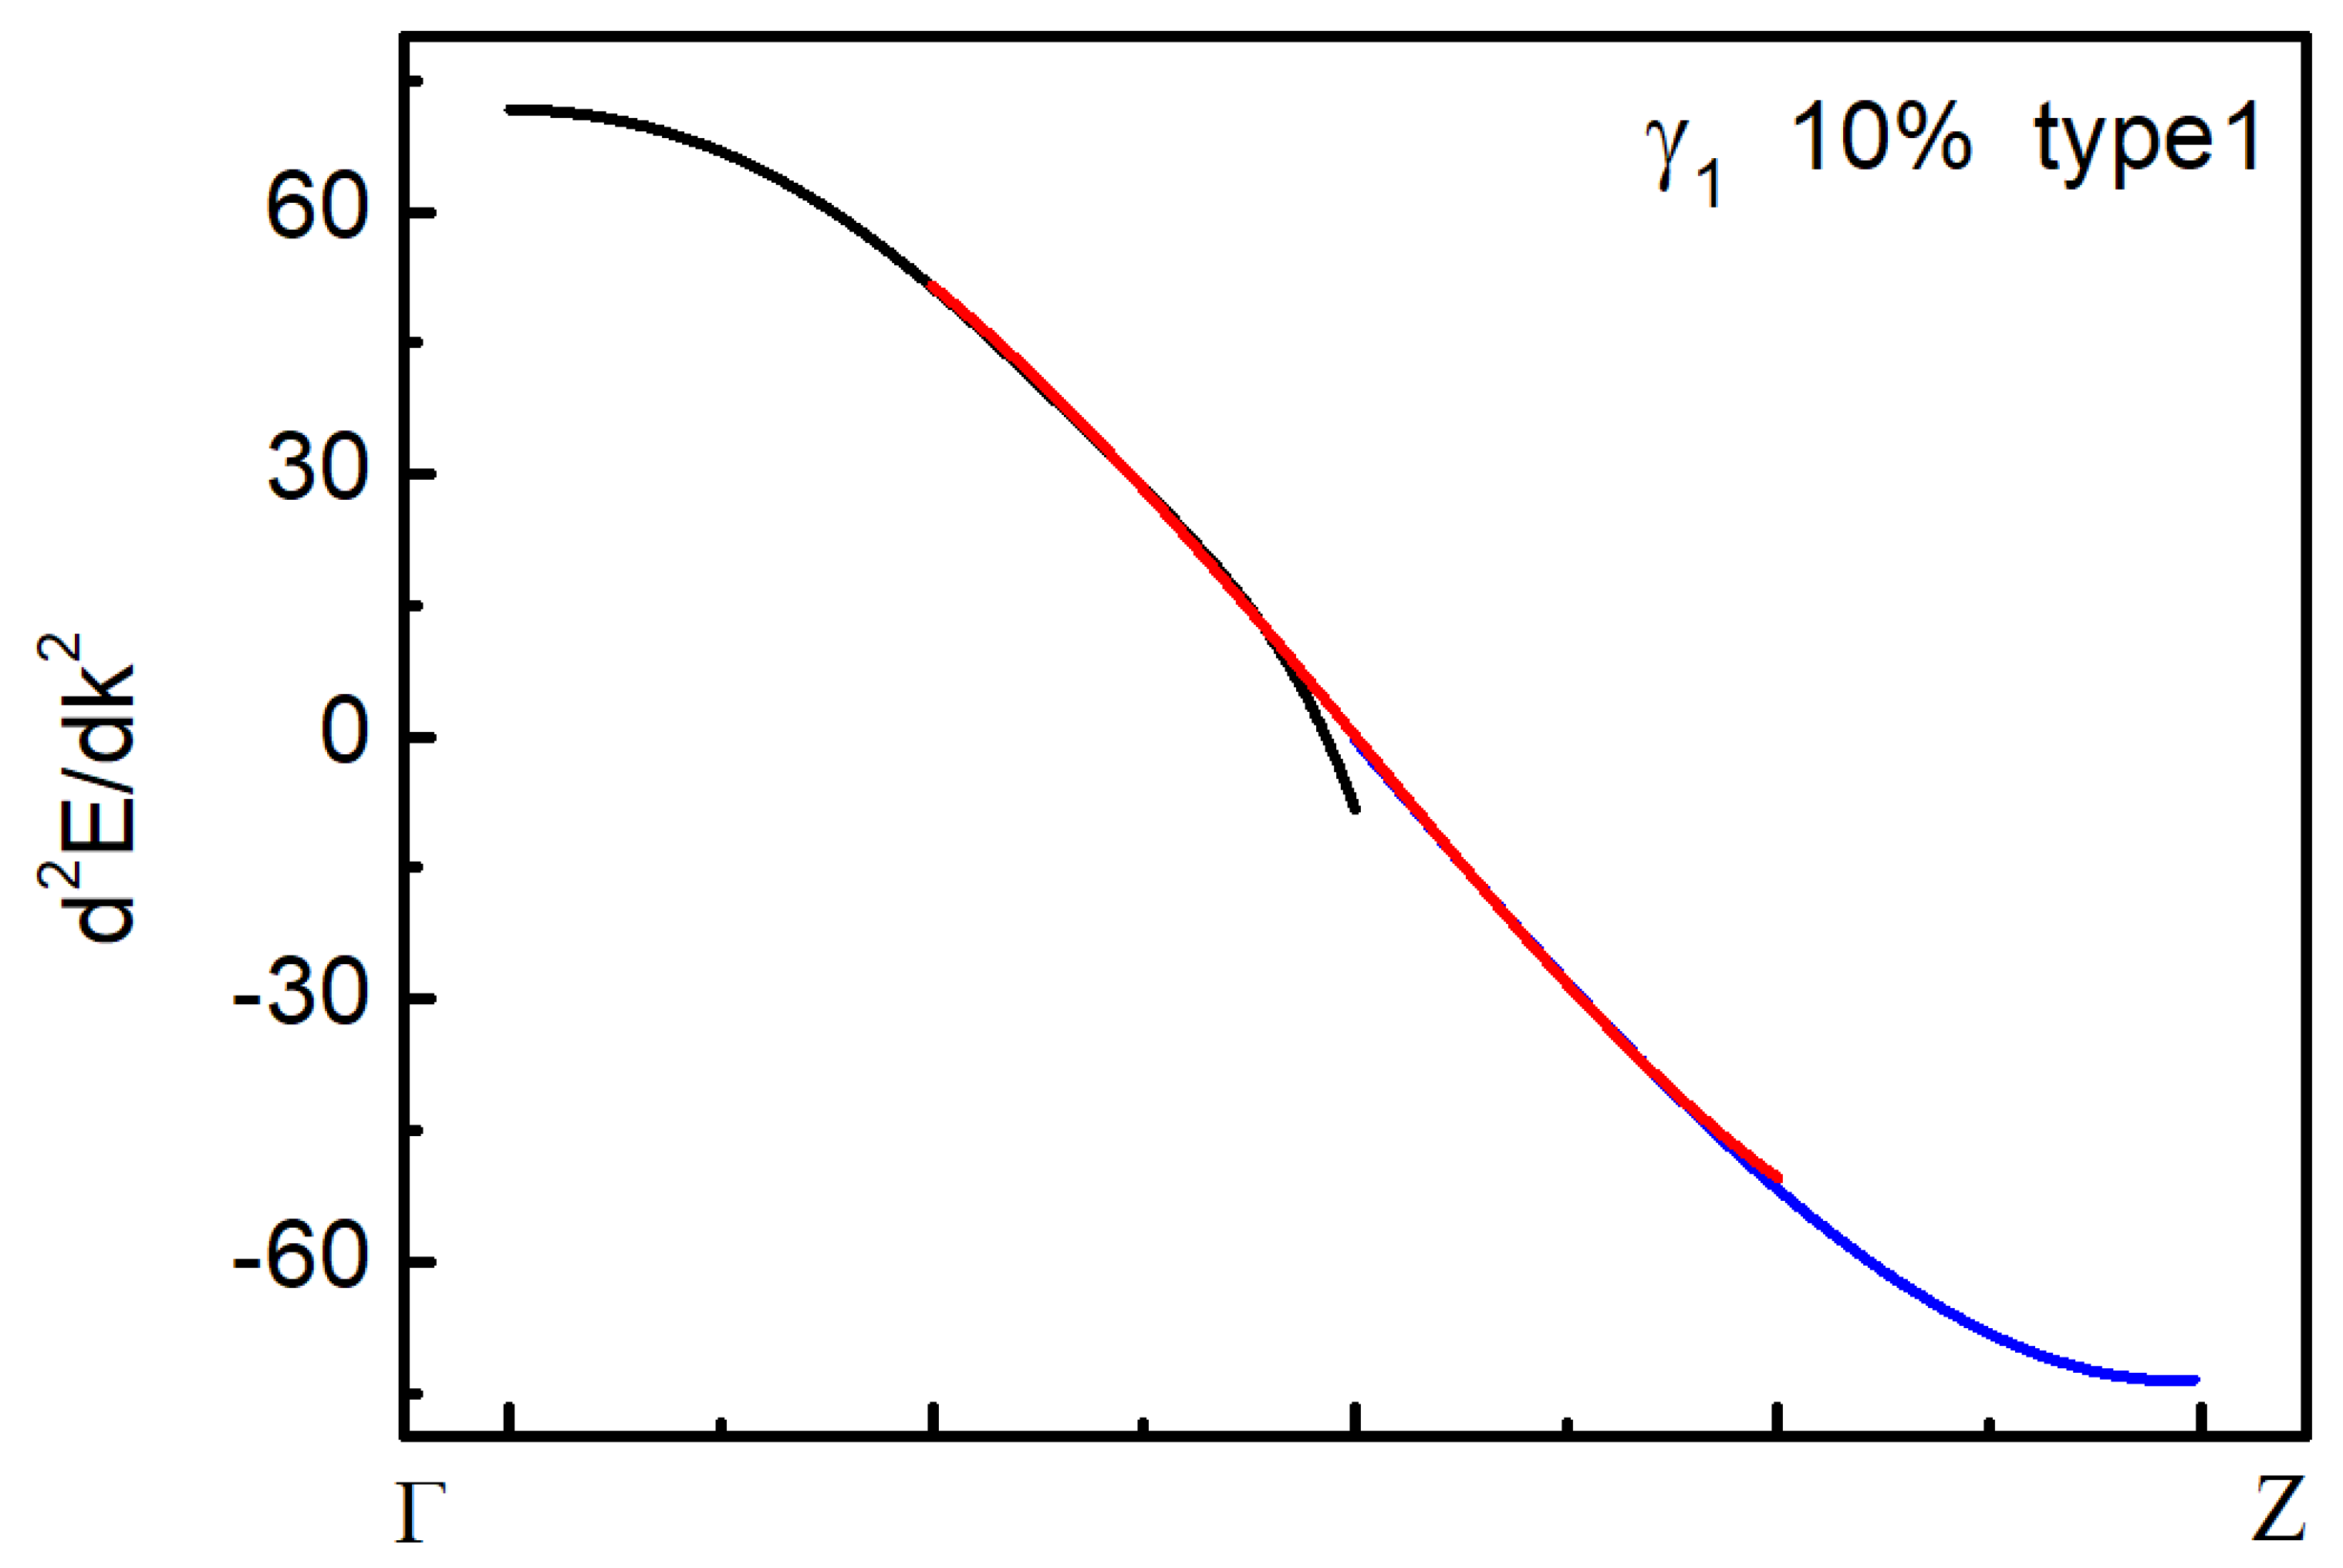
The method of piecewise fitting for the E(k) function relation is adopted in this paper. The data of k is segmented during the process of data fitting, and local fitting is performed in each segment to minimize the fitting error between them. For example, the E(k) curve in the Γ–Z direction of the γ1 phase, calculated using the GGA method, is depicted in Figure A1. The value of point k ranges from 0 to 0.03, and the data of k is divided into three segments: 0–0.02, 0.01–0.03, and 0.02–0.04, respectively. The polynomial equation E = ak10+ bk8+ ck6+ dk4+ ek2 + f is utilized to fit the data within each segment. To achieve a smoother curve, we equate the function values of the curve at segment points and ensure continuity between adjacent segments, thereby attaining a refined result for curve fitting.
Figure A1.
The dE2/dk2 curve in the Γ–Z direction of the γ1 phase was calculated using the GGA method. The different colors indicate different segments of the k data used for piecewise fitting.
Appendix B
To further assess the dynamical stability of the γ1 phase with 10% oxygen vacancies (type 2), we performed AIMD simulations at 30 K for 5 ps under the NVT ensemble. Figure A2 shows the time evolution of the total energy E0 during the simulation. The energy fluctuates around a constant mean value of −504.98576 eV throughout the entire trajectory with no discernible drift, confirming that the system has reached thermal equilibrium and remains dynamically stable at 30 K.
Figure A2.
Time evolution of the total energy E0 during the 5 ps AIMD simulation of the γ1 phase with 10% oxygen vacancies (type 2) at 30 K. The red dashed line marks the time-averaged energy of –504.98576 eV, compared to the 0 K ground-state energy of the final AIMD configuration (–505.00368 eV).
Appendix C
The oxygen vacancy formation energy of the γ1 phase with 10% vacancies was calculated using the formula
where Edefect is the total energy of the supercell with one oxygen atom removed (10% vacancy concentration), Eperfect is the total energy of the pristine supercell, and is the total energy of an isolated O2 molecule. All these energies were obtained from static DFT calculations using VASP. The calculated values are Edefect = −126.31649376 eV, Eperfect = −136.63040186 eV, and = −4.93232 eV; the formation energy at 0 K is 7.85 eV. Including the entropy term at 300 K and ambient pressure (TΔS = 0.6376 eV with ΔS the entropy change), the formation energy is 7.21 eV.
References
- Andres, K.; Graebner, J.E.; Ott, H.R. 4f-virtual-bound-state formation in CeAl3 at low temperatures. Phys. Rev. Lett. 1975, 35, 1779–1782. [Google Scholar] [CrossRef] [Scilit]
- Steglich, F.; Aarts, J.; Bredl, C.D.; Lieke, W.; Meschede, D.; Franz, W.; Schäfer, H. Superconductivity in the presence of strong pauli paramagnetism: CeCu2Si2. Phys. Rev. Lett. 1979, 43, 1892–1896. [Google Scholar] [CrossRef] [Scilit]
- Trovarelli, O.; Weiden, M.; Müller-Reisener, R.; Gómez-Berisso, M.; Gegenwart, P.; Deppe, M.; Geibel, C.; Sereni, J.G.; Steglich, F. Evolution of magnetism and superconductivity in CeCu2 (Si1−xGex)2. Phys. Rev. B 1997, 56, 678–685. [Google Scholar] [CrossRef] [Scilit]
- Bruls, G.; Wolf, B.; Finsterbusch, D.; Thalmeier, P.; Kouroudis, I.; Sun, W.; Assmus, W.; Lüthi, B. Unusual B-T phase diagram of the heavy-fermion superconductor CeCu2Si2. Phys. Rev. Lett. 1994, 72, 1754–1757. [Google Scholar] [PubMed]
- Li, Y.; Liu, M.; Fu, Z.; Chen, X.; Yang, F.; Yang, Y.F. Gap symmetry of the heavy fermion superconductor CeCu2Si2 at ambient pressure. Phys. Rev. Lett. 2018, 120, 217001. [Google Scholar] [CrossRef] [Scilit] [PubMed]
- Grosche, F.M.; Julian, S.R.; Mathur, N.D.; Lonzarich, G.G. Magnetic and superconducting phases of CePd2Si2. Phys. B 1996, 223, 50–52. [Google Scholar] [CrossRef] [Scilit]
- Mathur, N.D.; Grosche, F.M.; Julian, S.R.; Walker, I.R.; Freye, D.M.; Haselwimmer, R.K.W.; Lonzarich, G.G. Magnetically mediated superconductivity in heavy fermion compounds. Nature 1998, 394, 39–43. [Google Scholar] [CrossRef] [Scilit]
- Movshovich, R.; Graf, T.; Mandrus, D.; Thompson, J.D.; Smith, J.L.; Fisk, Z. Superconductivity in heavy-fermion CeRh2Si2. Phys. Rev. B 1996, 53, 8241–8244. [Google Scholar] [CrossRef] [Scilit] [PubMed]
- Ren, Z.; Pourovskii, L.V.; Giriat, G.; Lapertot, G.; Georges, A.; Jaccard, D. Giant overlap between the magnetic and superconducting phases of CeAu2Si2 under pressure. Phys. Rev. X 2014, 4, 031055. [Google Scholar] [CrossRef] [Scilit]
- Knebel, G.; Braithwaite, D.; Canfield, P.C.; Lapertot, G.; Flouquet, J. Electronic properties of CeIn 3 under high pressure near the quantum critical point. Phys. Rev. B 2001, 65, 024425. [Google Scholar] [CrossRef] [Scilit]
- Sarrao, J.L.; Thompson, J.D. Superconductivity in cerium-and plutonium-based ‘115’materials. J. Phys. Soc. Jpn. 2007, 76, 051013. [Google Scholar]
- Gegenwart, P.; Custers, J.; Geibel, C.; Neumaier, K.; Tayama, T.; Tenya, K.; Trovarelli, O.; Steglich, F. Magnetic-field induced quantum critical point in YbRh2Si2. Phys. Rev. Lett. 2002, 89, 056402. [Google Scholar] [CrossRef] [Scilit] [PubMed]
- Trovarelli, O.; Geibel, C.; Mederle, S.; Langhammer, C.; Grosche, F.M.; Gegenwart, P.; Lang, M.; Sparn, G.; Steglich, F. YbRh2Si2: Pronounced non-Fermi-liquid effects above a low-lying magnetic phase transition. Phys. Rev. Lett. 2000, 85, 626–629. [Google Scholar] [CrossRef] [Scilit] [PubMed]
- Schuberth, E.; Tippmann, M.; Steinke, L.; Lausberg, S.; Brando, S.; Krellner, C.; Geibel, C.; Yu, R.; Si, Q.; Steglich, F. Emergence of superconductivity in the canonical heavy-electron metal YbRh2Si2. Science 2016, 351, 485–488. [Google Scholar] [CrossRef] [Scilit] [PubMed]
- Ott, H.R.; Rudigier, H.; Fisk, Z.; Smith, J.L. UBe13: An unconventional actinide superconductor. Phys. Rev. Lett. 1983, 50, 1595–1598. [Google Scholar] [CrossRef] [Scilit]
- Shimizu, Y.; Kittaka, S.; Sakakibara, T.; Haga, Y.; Yamamoto, E.; Amitsuka, H.; Tsutsumi, Y.; Machida, K. Field-orientation dependence of low-energy quasiparticle excitations in the heavy-electron superconductor UBe13. Phys. Rev. Lett. 2015, 114, 147002. [Google Scholar] [CrossRef] [Scilit] [PubMed]
- Zhao, W.; Shen, B.; Tao, Z.; Han, Z.; Kang, K.; Watanabe, K.; Taniguchi, T.; Mak, K.F.; Shan, J. Gate-tunable heavy fermions in a moiré Kondo lattice. Nature 2023, 616, 61–65. [Google Scholar] [CrossRef] [Scilit] [PubMed]
- Poduval, P.P.; Laubscher, K.; Das Sarma, S. Apparent Kondo effect in Moiré transition metal dichalcogenide bilayers: Heavy fermions versus disorder. Phys. Rev. B. 2023, 108, 085405. [Google Scholar] [CrossRef] [Scilit]
- Chen, G.; Jiang, L.; Wu, S.; Lyu, B.; Li, H.; Chittari, B.L.; Watanabe, K.; Taniguchi, T.; Shi, Z.; Jung, J.; et al. Evidence of a gate-tunable Mott insulator in a trilayer graphene moiré superlattice. Nat. Phys. 2019, 15, 237–241. [Google Scholar] [CrossRef] [Scilit]
- Mao, J.; Milovanović, S.P.; Anđelković, M.; Lai, X.; Cao, Y.; Watanabe, K.; Taniguchi, T.; Covaci, L.; Peeters, F.M.; Geim, A.K.; et al. Evidence of flat bands and correlated states in buckled graphene superlattices. Nature 2020, 584, 215–220. [Google Scholar] [CrossRef] [Scilit] [PubMed]
- Ramires, A.; Lado, J.L. Emulating heavy fermions in twisted trilayer graphene. Phys. Rev. Lett. 2021, 127, 026401. [Google Scholar] [CrossRef] [Scilit] [PubMed]
- Shi, H.; Dai, X. Heavy-fermion representation for twisted bilayer graphene systems. Phys. Rev. B 2022, 106, 245129. [Google Scholar] [CrossRef] [Scilit]
- Song, Z.D.; Bernevig, B.A. Magic-angle twisted bilayer graphene as a topological heavy fermion problem. Phys. Rev. Lett. 2022, 129, 047601. [Google Scholar] [CrossRef] [Scilit] [PubMed]
- Yu, J.; Xie, M.; Bernevig, B.A.; Das Sarma, S. Magic-angle twisted symmetric trilayer graphene as a topological heavy-fermion problem. Phys. Rev. B 2023, 108, 035129. [Google Scholar] [CrossRef] [Scilit]
- Cao, Y.; Fatemi, V.; Fang, S.; Watanabe, K.; Taniguchi, T.; Kaxiras, E.; Jarillo-Herrero, P. Unconventional superconductivity in magic-angle graphene superlattices. Nature 2018, 556, 43–50. [Google Scholar] [CrossRef] [Scilit] [PubMed]
- Lu, X.; Stepanov, P.; Yang, W.; Xie, M.; Aamir, M.A.; Das, I.; Urgell, C.; Watanabe, K.; Taniguchi, T.; Zhang, G.; et al. Superconductors, orbital magnets and correlated states in magic-angle bilayer graphene. Nature 2019, 574, 653–657. [Google Scholar] [CrossRef] [Scilit] [PubMed]
- Checkelsky, J.G.; Bernevig, B.A.; Coleman, P.; Si, Q.; Paschen, S. Flat bands, strange metals and the Kondo effect. Nat. Rev. Mater. 2024, 9, 509–526. [Google Scholar] [CrossRef] [Scilit]
- Lamee, K.F.; Carlson, D.R.; Newman, Z.L.; Yu, S.P.; Papp, S.B. Nanophotonic tantala waveguides for supercontinuum generation pumped at 1560 nm. Opt. Lett. 2020, 45, 4192–4195. [Google Scholar] [CrossRef] [Scilit] [PubMed]
- Liu, L.F.; Pan, L.Y.; Zhang, Z.G.; Xu, J. Impact of band-engineering to performance of high-K multilayer based charge trapping memory. Chin. Phys. Lett. 2015, 32, 088501. [Google Scholar] [CrossRef] [Scilit]
- Sun, S.; Gao, L.; Han, P.; Zhu, L.; Li, W.M.; Li, A.D. Atomic layer-deposited Ta2O5−x nano-islands for charge trapping memory devices. J. Mater. Chem. C 2024, 12, 18676. [Google Scholar] [CrossRef] [Scilit]
- Wedig, A.; Luebben, M.; Cho, D.-Y.; Moors, M.; Skaja, K.; Rana, V.; Hasegawa, T.; Adepalli, K.K.; Yildiz, B.; Waser, R.; et al. Nanoscale cation motion in TaOx, HfOx and TiOx memristive systems. Nat. Nanotechnol. 2016, 11, 67–74. [Google Scholar] [CrossRef] [Scilit] [PubMed]
- Kingon, A.I.; Maria, J.-P.; Streiffer, S.K. Alternative dielectrics to silicon dioxide for memory and logic devices. Nature 2000, 406, 1032–1038. [Google Scholar] [CrossRef] [Scilit] [PubMed]
- Huerta-Flores, A.M.; Ruiz-Zepeda, F.; Eyovge, C.; Winczewski, J.P.; Vandichel, M.; Gaberscek, M.; Boscher, N.D.; Gardeniers, H.; Torres-Martinez, L.M.; Susarrey-Arce, A. Enhanced photocatalytic hydrogen evolution from water splitting on Ta2O5/SrZrO3 heterostructures decorated with CuxO/RuO2 cocatalysts. ACS Appl. Mater. Interfaces 2022, 14, 31767–31781. [Google Scholar] [CrossRef] [Scilit] [PubMed]
- Li, R.Y.; Zhang, Q.Q.; Li, X.S.; Li, N.N.; Liu, X.H.; Li, Z.J. Strongly coordinated synthesis of high-loading Ta2O5-supported Ru-Fe-Ni single-atom electrocatalyst with enhanced catalytic performance for urea synthesis via multifunctional graphene quantum dot integration. J. Electroanal. Chem. 2025, 990, 119163. [Google Scholar] [CrossRef] [Scilit]
- Osuagwu, B.; Raza, W.; Tesler, A.B.; Schmuki, P. A drastic improvement in photocatalytic H2 production by TiO2 nanosheets grown directly on Ta2O5 substrates. Nanoscale 2021, 13, 12750. [Google Scholar] [PubMed]
- Tong, Y.; Tang, H.; Yang, Y. Structural and electronic properties of Ta2O5 with one formula unit. Comput. Mater. Sci. 2023, 230, 112482. [Google Scholar] [CrossRef] [Scilit]
- Zibrov, I.P.; Filonenko, V.P.; Sundberg, M.; Werner, P.E. Structures and phase transitions of B-Ta2O5 and Z-Ta2O5: Two high-pressure forms of Ta2O5. Acta Cryst. 2000, B56, 659–665. [Google Scholar] [CrossRef] [Scilit] [PubMed]
- Fukumoto, A.; Miwa, K. Prediction of hexagonal Ta2O5 structure by first-principles calculations. Phys. Rev. B 1997, 55, 11155–11160. [Google Scholar] [CrossRef] [Scilit]
- Kresse, G.; Furthmüller, J. Efficient iterative schemes for ab initio total-energy calculations using a plane-wave basis set. Phys. Rev. B 1996, 54, 11169–11186. [Google Scholar] [CrossRef] [Scilit] [PubMed]
- Kresse, G.; Hafner, J. Ab initio molecular dynamics for liquid metals. Phys. Rev. B 1993, 47, 558–561. [Google Scholar] [CrossRef] [Scilit]
- Kresse, G.; Joubert, D. From ultrasoft pseudopotentials to the projector augmented-wave method. Phys. Rev. B 1999, 59, 1758–1775. [Google Scholar] [CrossRef] [Scilit]
- Blochl, P.E. Projector augmented-wave method. Phys. Rev. B 1994, 50, 17953–17979. [Google Scholar] [CrossRef] [Scilit] [PubMed]
- Perdew, J.P.; Burke, K.; Ernzerhof, M. Generalized gradient approximation made simple. Phys. Rev. Lett. 1996, 77, 3865–3868, Erratum in Phys. Rev. Lett. 1997, 78, 1396. [Google Scholar] [CrossRef] [Scilit] [PubMed]
- Monkhorst, H.J.; Pack, J.D. Special points for Brillouin-zone integrations. Phys. Rev. B 1976, 13, 5188–5192. [Google Scholar] [CrossRef] [Scilit]
- Paier, J.; Marsman, M.; Hummer, K.; Kresse, G.; Gerber, I.C.; Angyan, J.G. Screened hybrid density functionals applied to solids. J. Chem. Phys. 2006, 124, 154709, Erratum in J. Chem. Phys. 2006, 125, 249901. [Google Scholar] [CrossRef] [Scilit] [PubMed]
- Heyd, J.; Scuseria, G.E.; Ernzerhof, M. Hybrid functionals based on a screened Coulomb potential. J. Chem. Phys. 2003, 118, 8207, Erratum in J. Chem. Phys. 2006, 124, 219906. [Google Scholar] [CrossRef] [Scilit]
- Tang, H.M.; Yang, Y. Electronic structure of Ta2O5 polymorphs: Variation trend of band gap and the role of oxygen vacancies. Chin. J. Phys. 2024, 89, 1678–1692. [Google Scholar] [CrossRef] [Scilit]
- Yang, Y.; Nahm, H.-H.; Sugino, O.; Ohno, T. Electronic structures of oxygen-deficient Ta2O5. AIP Adv. 2013, 3, 042101. [Google Scholar] [CrossRef] [Scilit]
- Fang, Z.; Chen, W.G.; Huang, P.C.; Chen, Z.Y.; Ding, H.W.; Zhao, H.; Qian, X.X.; Jiang, S.L.; Zhang, Y.; Kuang, G.L. Test operations of the upgraded hybrid magnet at CHMFL. IEEE Trans. Appl. Supercond. 2024, 34, 4300705. [Google Scholar] [CrossRef] [Scilit]
- Wang, C.; Fei, W.; Chen, X.; Song, M.; Xu, Y.; Zhang, H.; Wang, B.; Chen, Q. Design and Operation of a 42-MW Highly Stabilized Power Supply at the CHMFL. IEEE Trans. Appl. Supercond. 2026, 36, 5000805. [Google Scholar] [CrossRef] [Scilit]

Disclaimer/Publisher’s Note: The statements, opinions and data contained in all publications are solely those of the individual author(s) and contributor(s) and not of MDPI and/or the editor(s). MDPI and/or the editor(s) disclaim responsibility for any injury to people or property resulting from any ideas, methods, instructions or products referred to in the content. |
© 2026 by the authors. Licensee MDPI, Basel, Switzerland. This article is an open access article distributed under the terms and conditions of the Creative Commons Attribution (CC BY) license.