


Abstract
The shear behavior of loess is closely linked to its microstructural evolution, and understanding this relationship is essential for deciphering the mechanisms of loess hazards. In this study, consolidated-drained (CD) triaxial tests were conducted on intact Q3 Malan loess from the Dongzhi tableland, China, under varying water contents and confining pressures. Scanning electron microscopy (SEM) and mercury intrusion porosimetry (MIP) analyses were performed on specimens before and after shearing to quantitatively and qualitatively characterize the changes in pore and particle properties and their connection to shear deformation. The results reveal three failure modes, including shear, homogeneous, and plastic failure. They are governed by the combined effects of microstructural variation and microcrack development, depending on confining pressure and water content. Quantitatively, as water content increases from 9% to 20%, cohesion decreases by 86.8% and peak shear strength reduces by 68.4%, while the internal friction angle decreases only slightly. Water-induced strength deterioration is governed primarily by cohesion loss rather than friction angle reduction. Thus, 20% water content was identified as the critical threshold marking the transition from cohesion-dominated to friction-dominated strength degradation. A critical threshold at approximately 27% water content is identified, beyond which about 70% of mesopore and macropore volumes undergo collapse, after which the strength is almost entirely sustained by interparticle friction. Based on these findings, the water-induced strength decay mechanism is categorized into three stages: rapid cement degradation, friction-dominated transition, and slow attenuation. These macroscopic phenomena are closely linked to the continuous adjustment of the microstructure, manifested by the softening, dispersion, and disintegration of cementations, particle movement and rearrangement, and the reduction and mutual transformation of inter-aggregate pores under loading and wetting. The three-stage mechanism and threshold characteristics of loess strength degradation upon wetting revealed in this study can provide theoretical support for early slope-instability warning in loess irrigation and heavy rainfall regions, as well as engineering reinforcement prioritizing the recovery of cohesion.
1. Introduction
Since the Quaternary period, loess has accumulated as a regionally extensive aeolian deposit in arid and semi-arid regions [1,2]. China hosts the largest and most concentrated loess accumulations on Earth, with the Loess Plateau in Northwest China standing out as the area of the highest loess density and the most complete stratigraphic sequence [3,4,5]. However, serious geological disasters, especially collapses and landslides, frequently occur on the Loess Plateau, severely restricting construction development [6,7,8]. Shear strength is a fundamental mechanical property of loess and is essential for analyzing failure mechanisms and slope stability. In addition to the external environmental conditions (wetting, loading, heating, freezing, and thawing), the key internal factor controlling the shear deformation of loess is the unique metastable structure, characterized by weak cementation and the collapse of overhead pores [9,10,11]. Therefore, investigation of the microstructure during shearing contributes to both revealing the physical deformation of loess and providing valuable insights for practical engineering projects.
Since the 1870s, advanced techniques such as scanning electron microscopy (SEM), mercury intrusion porosimetry (MIP), and computed tomography (CT) have enabled quantitative characterization of loess microstructure [12,13]. Early studies focused primarily on linking static microstructural features to macroscopic mechanical behavior. For example, Hu et al. (2001) found that particle size distribution, particle orientation, and the degree of microstructural damage were the main factors controlling the shear strength of compacted loess [14]. Subsequently, comparative studies on natural and compacted loess revealed that differences in pore distribution and interparticle contact characteristics significantly affect mechanical response, with the fracture of interparticle contacts along the shear band identified as the dominant mechanism [15]. Further investigations distinguished the roles of interparticle and intraparticle pores. Loading was found to primarily alter interparticle pores, whereas intraparticle pores remained largely unchanged. In addition, cementation, matric suction, and void ratio were recognized as key factors contributing to loess deformation [16]. More recently, attention has shifted to the localized deformation within shear zones. Yuan et al. (2019) conducted ring shear and microstructural tests on loess and palaeosol [17]. There was no obvious change observed in particle orientation outside the shear zone, while particles inside the shear zone were rearranged. Particles within the loess shear zone were abraded, whereas those within the palaeosol shear zone ruptured and showed stronger preferred orientation.
In addition, the combined use of scanning electron microscopy (SEM) and mercury intrusion porosimetry (MIP) is an effective means to characterize particle shape, pore size, and pore connectivity, thereby overcoming the resolution and statistical representativeness limitations of the single technique [18,19]. For example, Wang et al. (2021) used SEM and MIP to analyze loess microstructure and pore size distribution at a fixed water content, finding that structural parameters can predict shear behavior despite regional variability [20]. Xu et al. (2023) applied the same techniques to compacted loess and observed that pore-size transition intervals from MIP and SEM were mutually consistent, demonstrating the consistency between the two methods [21].
Previous studies have combined microstructural evolution with various mechanical properties of loess to elucidate the role of microstructure in deformation and failure. However, most of these investigations were conducted under limited or fixed test conditions, and a unified mechanistic understanding of how loading conditions affect microstructural changes and how these changes in turn control the shear deformation and strength of loess as a process system is still lacking. The present study adopts rigorous moisture control in specimen preparation and employs both scanning electron microscopy (SEM) and mercury intrusion porosimetry (MIP) to qualitatively and quantitatively characterize microstructural alterations under different loading stages. By correlating these microscopic observations with mechanical test data, we systematically investigate the intrinsic interconnections among strength, deformation, microstructure, and cracking. This integrated approach not only advances beyond previous single-method analyses based on SEM or MIP alone but also provides a microscopic foundation for the stability evaluation of loess engineering.
This study focuses on the shear deformation of natural Q3 Malan loess from the Dongzhi tableland, China, through consolidated-drained triaxial tests under varying water content and confining pressure conditions. The microstructure evolution before and after the triaxial tests was qualitatively analyzed. Additionally, quantitative analyses of pore and particle properties, particularly the changes in their morphological distributions, were conducted using SEM and MIP techniques. Therefore, the findings are anticipated to contribute to a comprehensive understanding of the bond between the failure mechanism and the shear deformation of loess from a micro point of view.
2. Test Materials and Methods
2.1. Preparation of Loess Sample
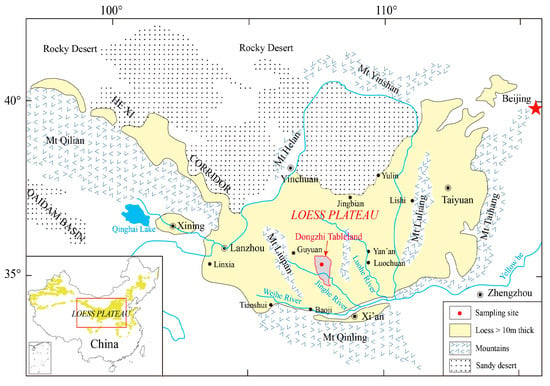
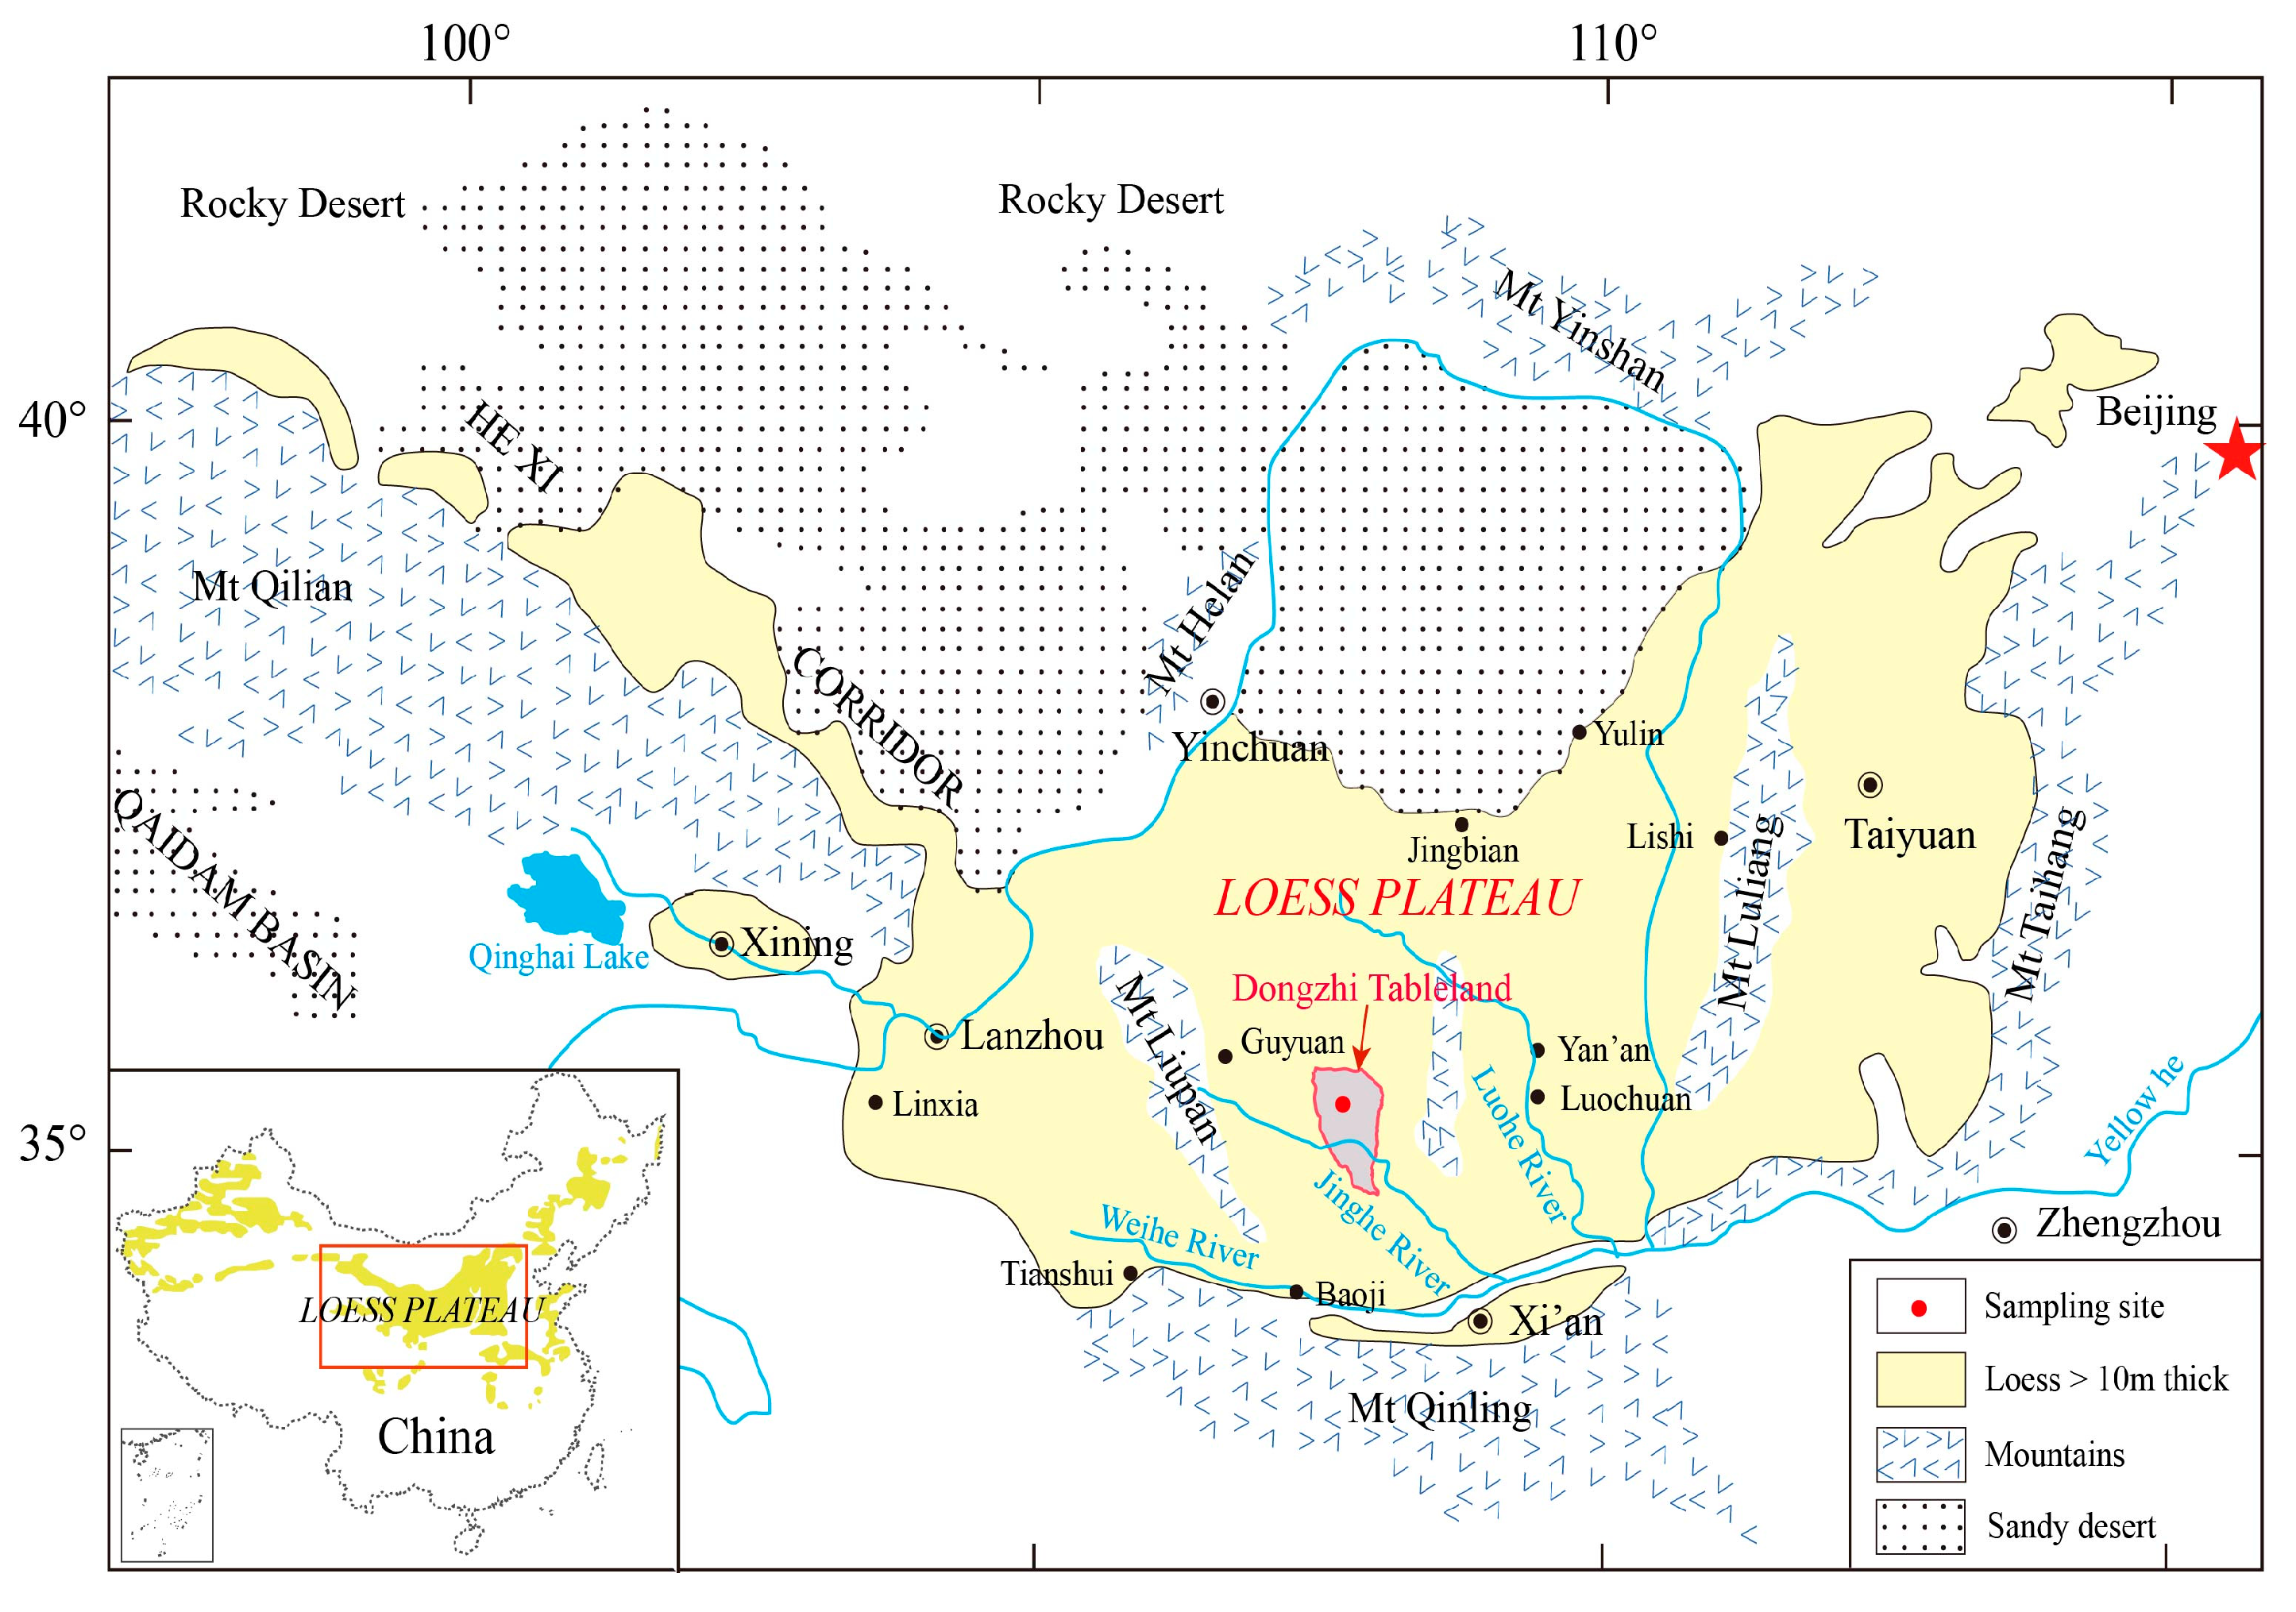
The Dongzhi tableland, situated in Qingyang city in eastern Gansu Province, China, is the largest and best-preserved loess tableland on the Loess Plateau [22] (Figure 1). The tableland is flat and dips gently towards the southeast. It extends approximately 110 km from north to south, while its east–west width ranges from 50 m to 50 km [23]. The intact samples were recovered at a depth of 4.5 m, which belonged to the Q3 Malan loess [24]. The cubes, measuring 20 cm on each side, were extracted from the intact loess samples by the cutting method [25] and then securely wrapped with several layers of cling film. Subsequently, these cubes were nestled in foam boxes to minimize the disturbance and evaporation of water during transport. Table 1 lists several basic physical properties of the loess soil, including the natural density (1.59 g/cm3), specific density (2.71 g/cm3), natural water content (9%), liquid limit (29%), and plastic limit (19%). According to the liquid limit and the plastic limit, the Q3 loess in Dongzhi tableland is low-plasticity clay [24,26].
Figure 1.
Location of the Dongzhi tableland and sampling site in the Loess Plateau.
Table 1.
Physical properties of the loess soil.
2.2. Triaxial Shear Test
To explore the shear deformation of loess, a triaxial testing apparatus was utilized to carry out consolidated-drained triaxial shear tests (i.e., CD) [27]. Cylindrical standard triaxial samples of 39.1 mm in diameter and 80 mm in height were shaped with a soil chipper and a cutter. The natural water content of Q3 loess generally ranges from 8% to 12% but can rise to 20–30% after rainfall or irrigation [28,29]. In this study, a water content of 9%, which falls within this natural range, was adopted as the baseline. To replicate the wetting conditions observed in the field, other samples were wetted to water contents of 20%, 27%, and 30%, respectively, by the spraying method [30]. Subsequently, the samples with target water contents were enclosed in several cling films and housed within a humidifier at a relative humidity of approximately 95% for 48 h to ensure uniform moisture distribution [31,32]. Additional specimens were prepared, and samples were taken from different positions of the specimens for water content measurement, in order to verify that the water content meets the specified requirements and is uniformly distributed.
Tests were conducted under a consolidation ratio of KC = 1.0. The confining pressures (σ3) for the samples were 50 kPa, 100 kPa, and 200 kPa, spanning the typical stress regimes encountered in Q3 loess from shallow to intermediate depths [33]. All samples were sheared under strain-controlled conditions at a constant axial strain rate of 0.02% per minute until reaching an axial strain of 20%. The peak deviator stress is regarded as the shear strength. If distinct peak deviator stress is not observed, the deviator shear at 15% axial strain is regarded as shear strength. Under each condition, three parallel CD tests were conducted. The specimen yielding the intermediate stress–strain response was chosen for both the representative curve and the post-test SEM/MIP analyses, thereby ensuring a direct correspondence between the macroscopic mechanical data and the microstructural observations.
2.3. Microstructure Observation
SEM and MIP tests were carried out on loess samples under different conditions. Each sample was trimmed into 2–4 cm3 cubes and subjected to liquid nitrogen at a temperature of −196 °C for a duration of 4 h. Frozen samples were placed in a vacuum freeze-dryer, where the vacuum pressure and temperature were maintained at 5 Pa and –50 °C, respectively. At a freeze-drying rate of 0.08 L per hour, samples dried after 8 h [34,35]. This methodology can prevent the disturbance of volume shrinkage in the soil structure, which is associated with moisture reduction. Subsequently, a thin-edged tool was utilized to excise 1–2 cm3 cubic sticks from the core of the freeze-dried loess samples.
SEM tests were performed to qualitatively characterize the microstructure and to quantitatively analyze the variation in particle properties. The freeze-dried blocks were fractured at mid-height, and one of the freshly broken surfaces was coated with gold for microstructural observation. It should be noted that the test materials exhibit anisotropic microstructural properties [30]. Therefore, both the vertical plane (YZ section) and the horizontal plane (XY section) were examined to obtain a thorough understanding of the loess microstructure. The image was taken at a magnification of 500 [36].
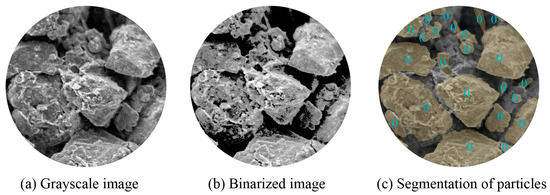
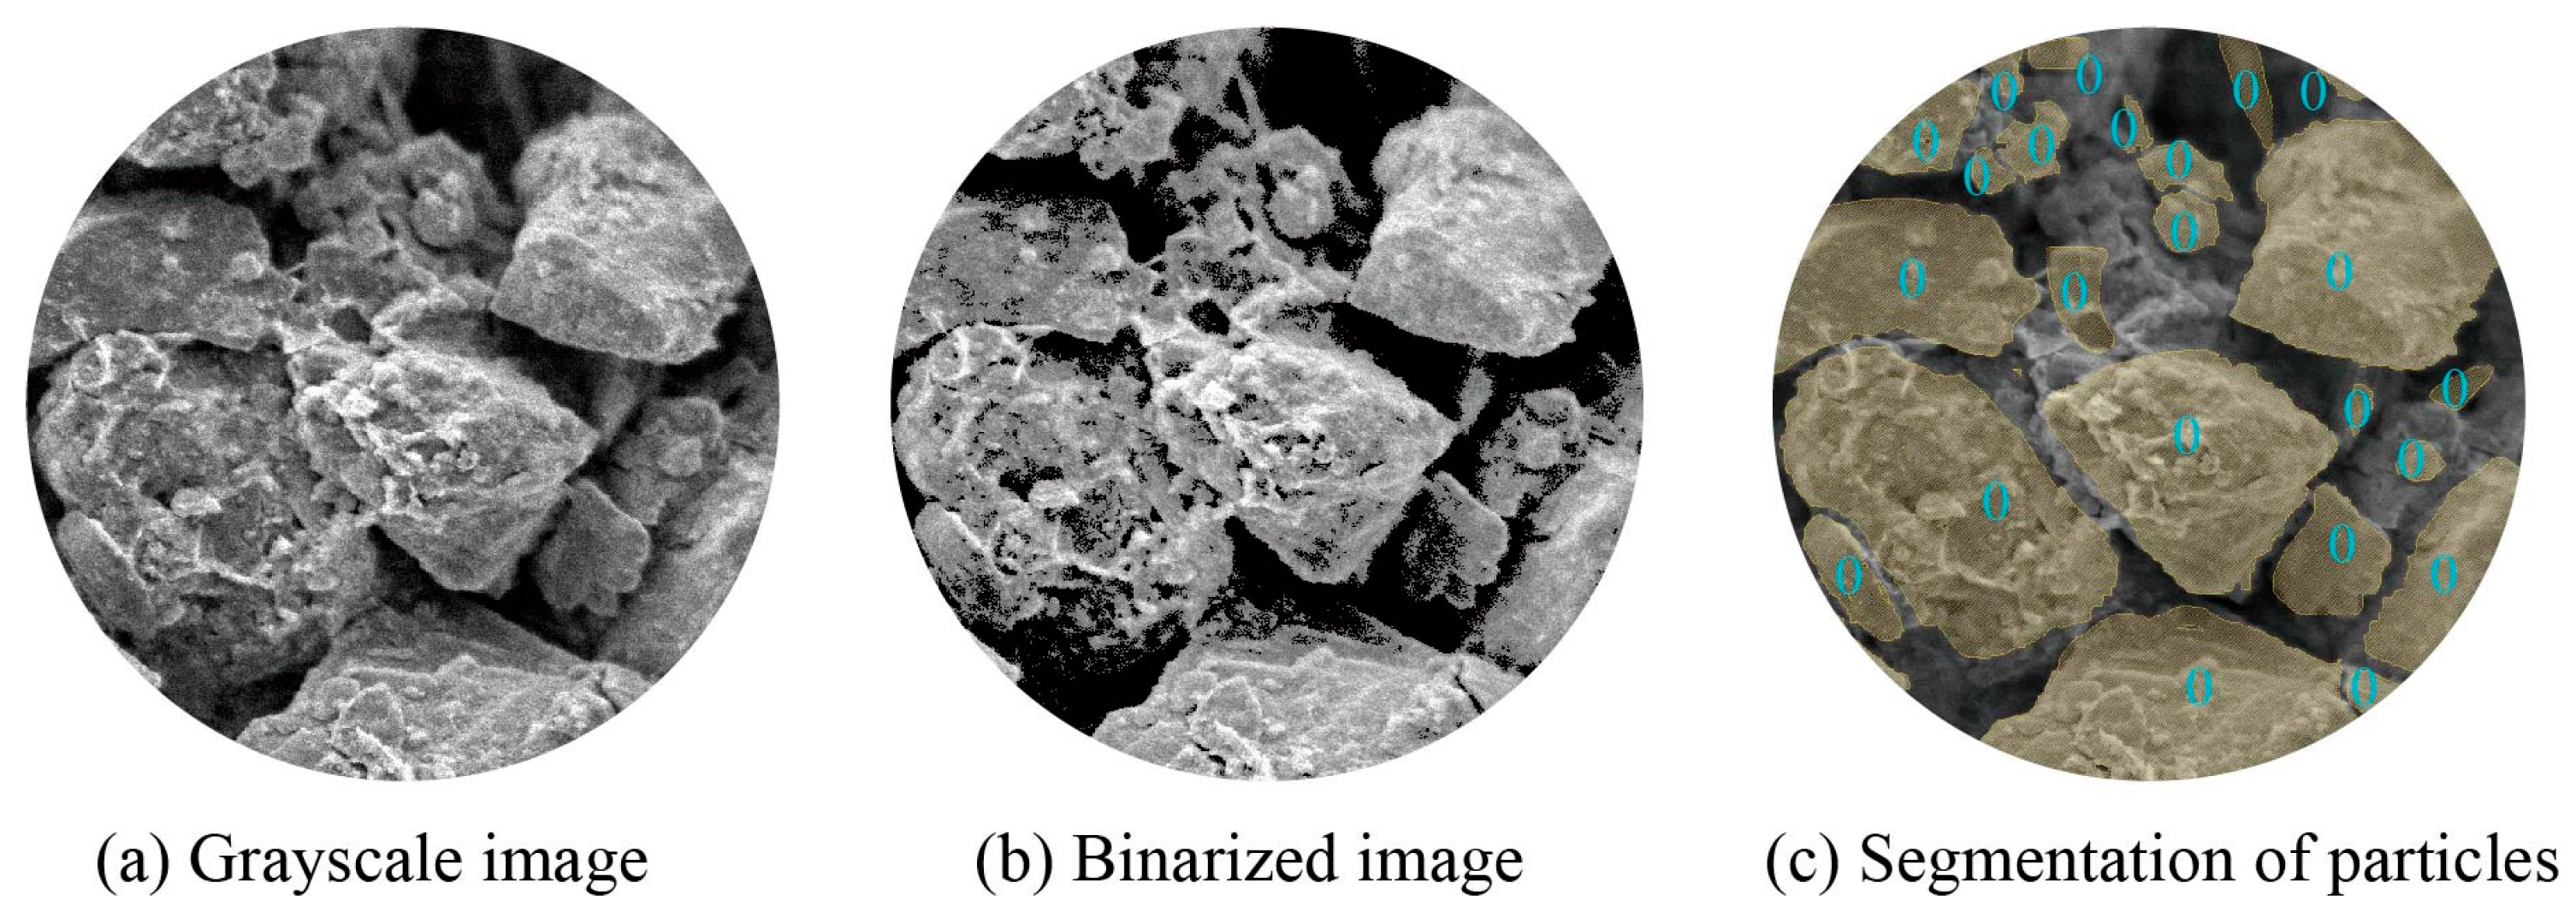
To get an in-depth analysis of loess particles, several characteristics of loess particles (such as roundness, equivalent radius, and orientation) were statistically characterized in the chosen micrographs, utilizing the Image-Pro-Plus program (i.e., IPP). The roundness is a morphological property concerning the particle shape and is quantified on a scale from 0 to 1. For instance, circles are valued at 1, and ellipses fall somewhere in between. In addition, orientation is the angle between the major axis length of the particle and the vertical axis (in the YZ section). Thus, the particle orientation was calculated from the YZ section images. Quantitative particle analysis was performed using the image processing workflow illustrated in Figure 2. The raw SEM images were first subjected to noise reduction (Figure 2a). These pre-processed images were then converted into binary format, wherein particles appear in white and pores in black (Figure 2b). Finally, individual particles were segmented and labeled, with each distinct particle assigned a unique numeric identifier (as shown by the “0” labels in Figure 2c), enabling subsequent morphological quantification.
Figure 2.
Image post-processing for quantitative analysis of particles.
MIP tests were conducted to quantify the evolution in pore structure during shearing. According to the Washburn equation, because mercury is a non-wetting liquid, it cannot intrude into the pores of loess samples without applied pressure [31]. Mercury pressure was progressively increased from low to high levels. The maximum pressure reached 60,000 psi, corresponding to a minimum detectable pore size of 3 nm. Consequently, the pore size can be inferred from the pressure applied.
3. Results
3.1. Stress–Strain Characterization
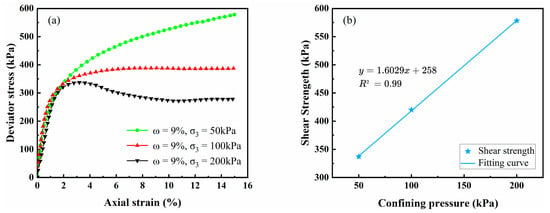
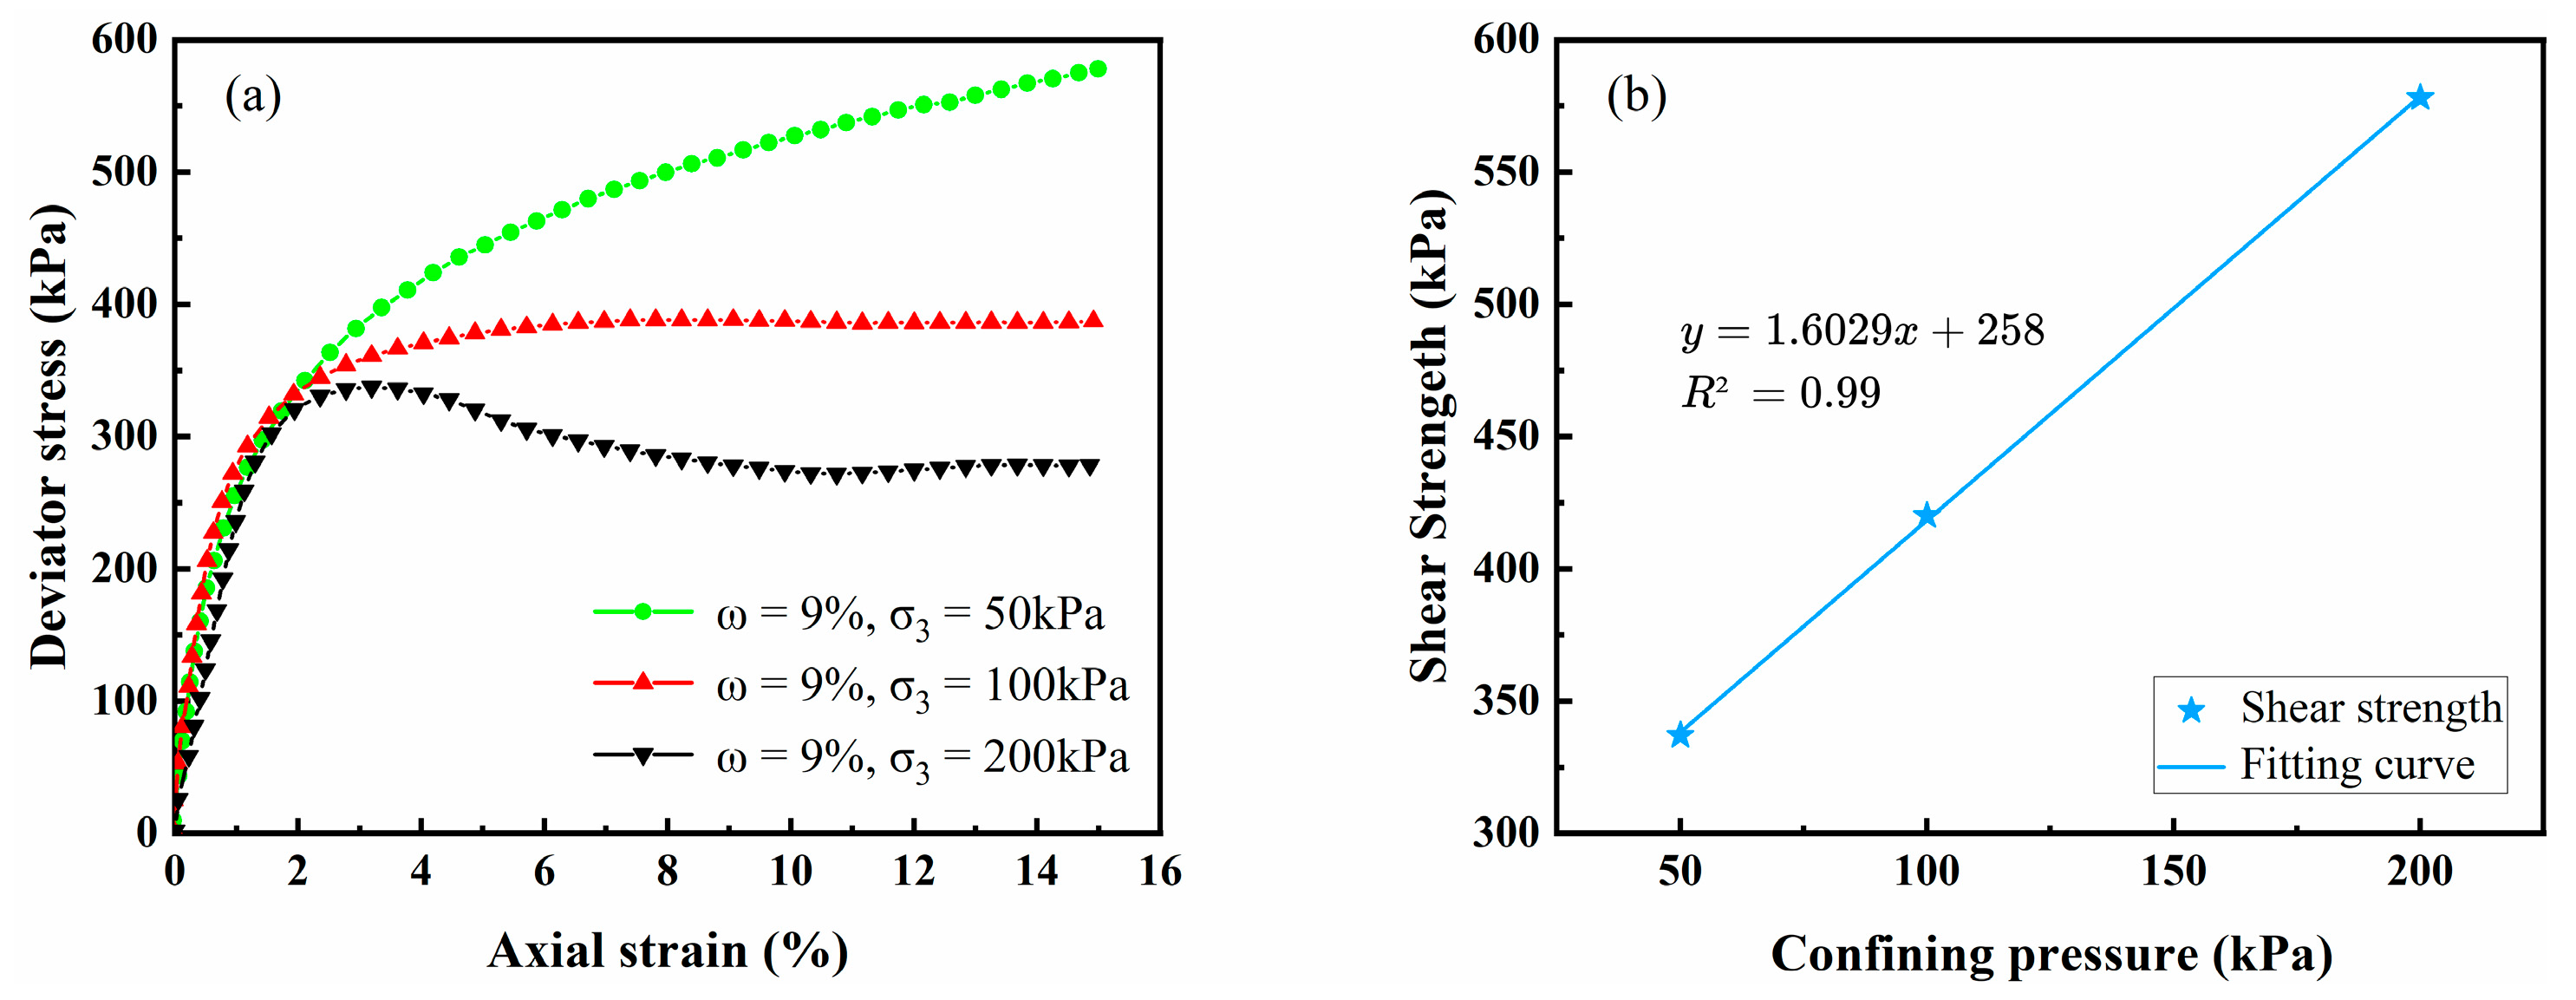
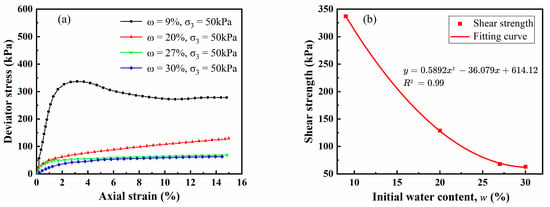
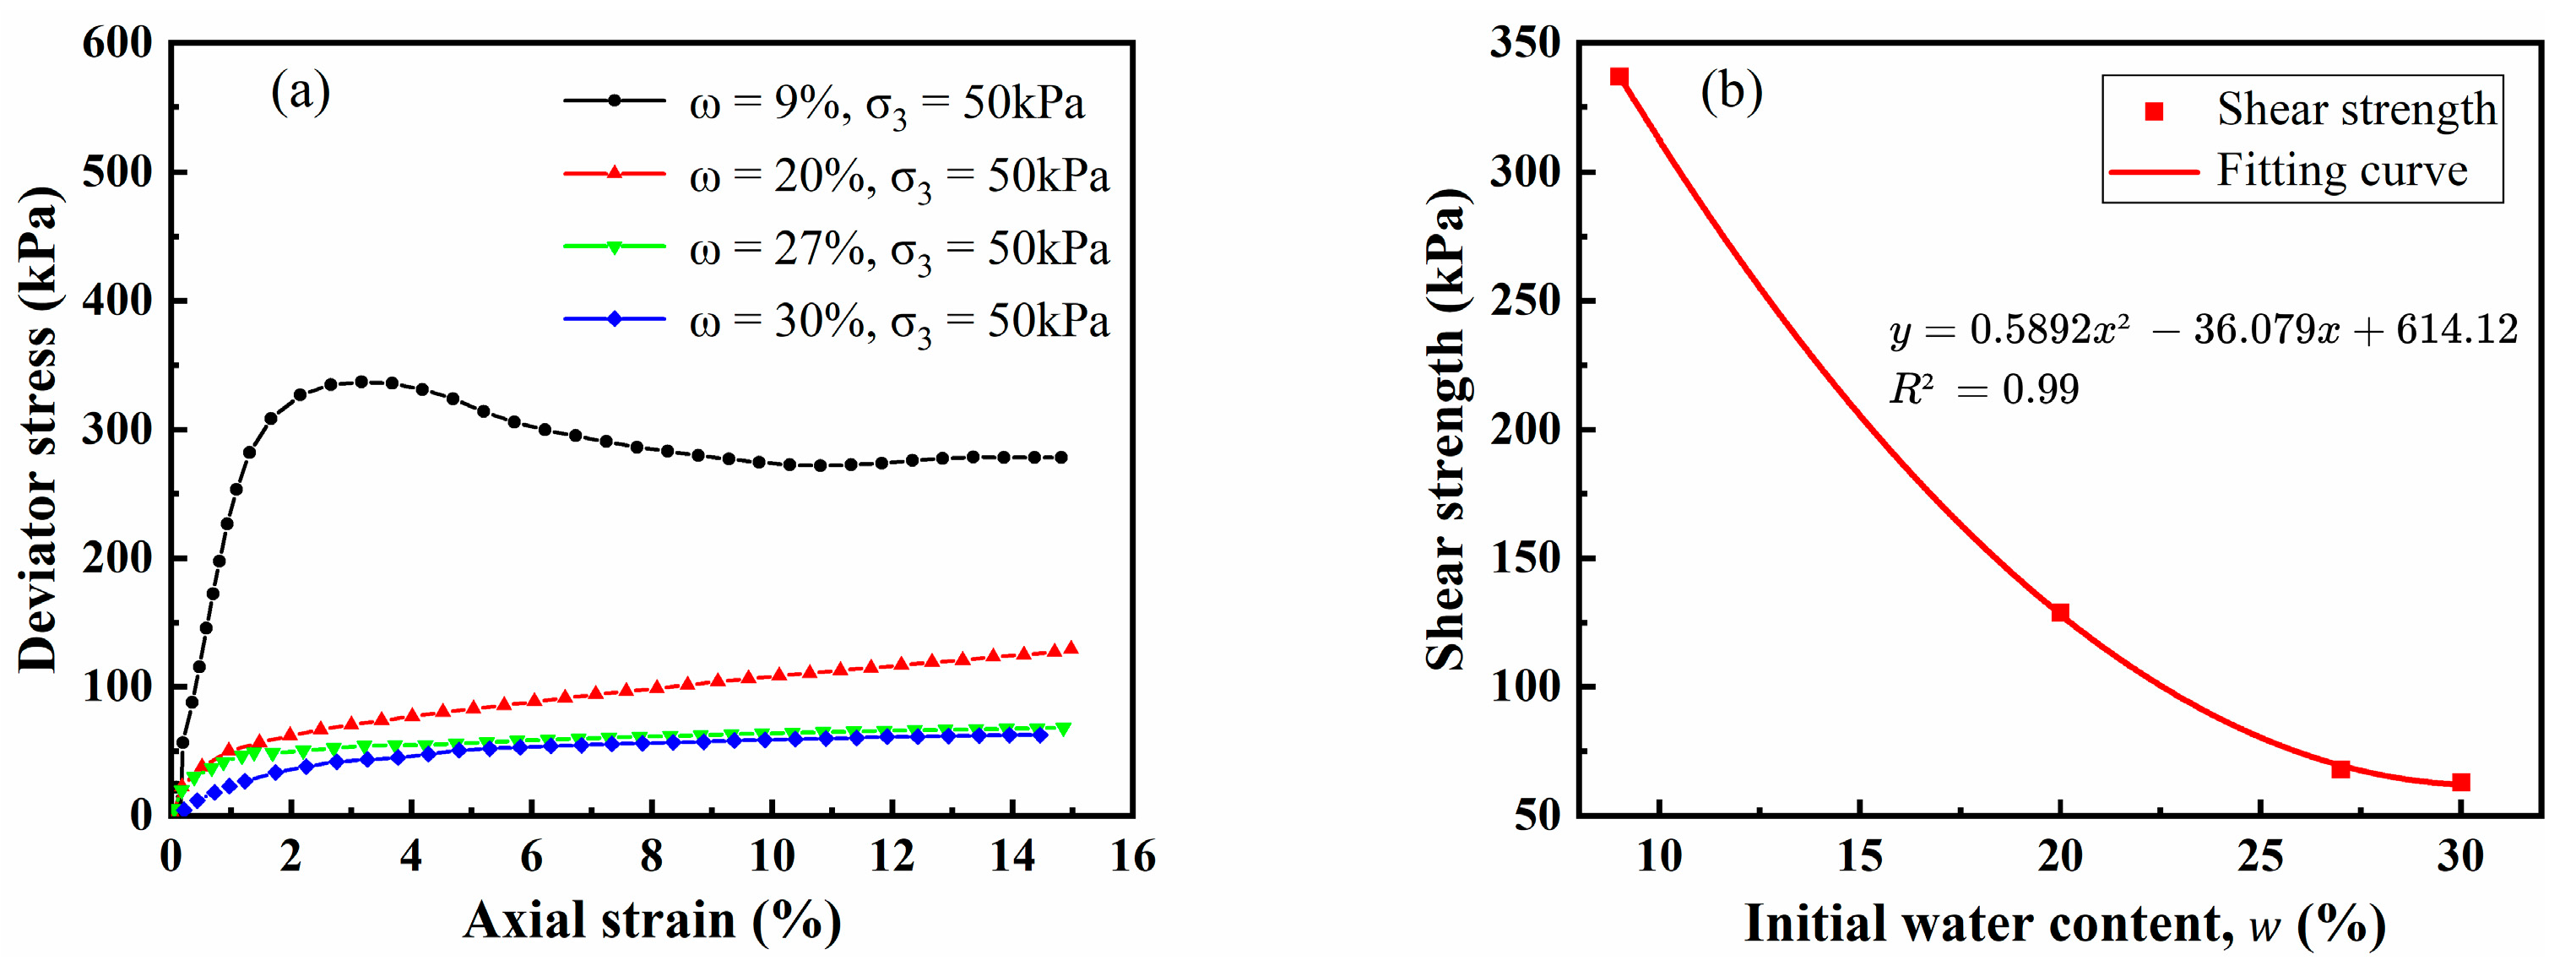
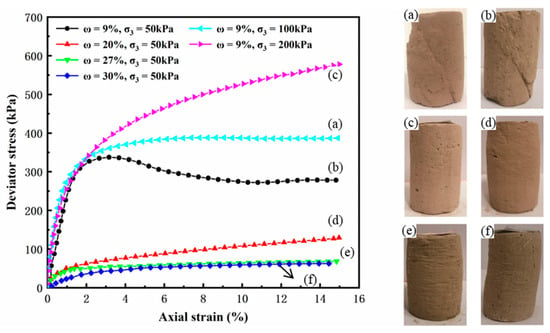
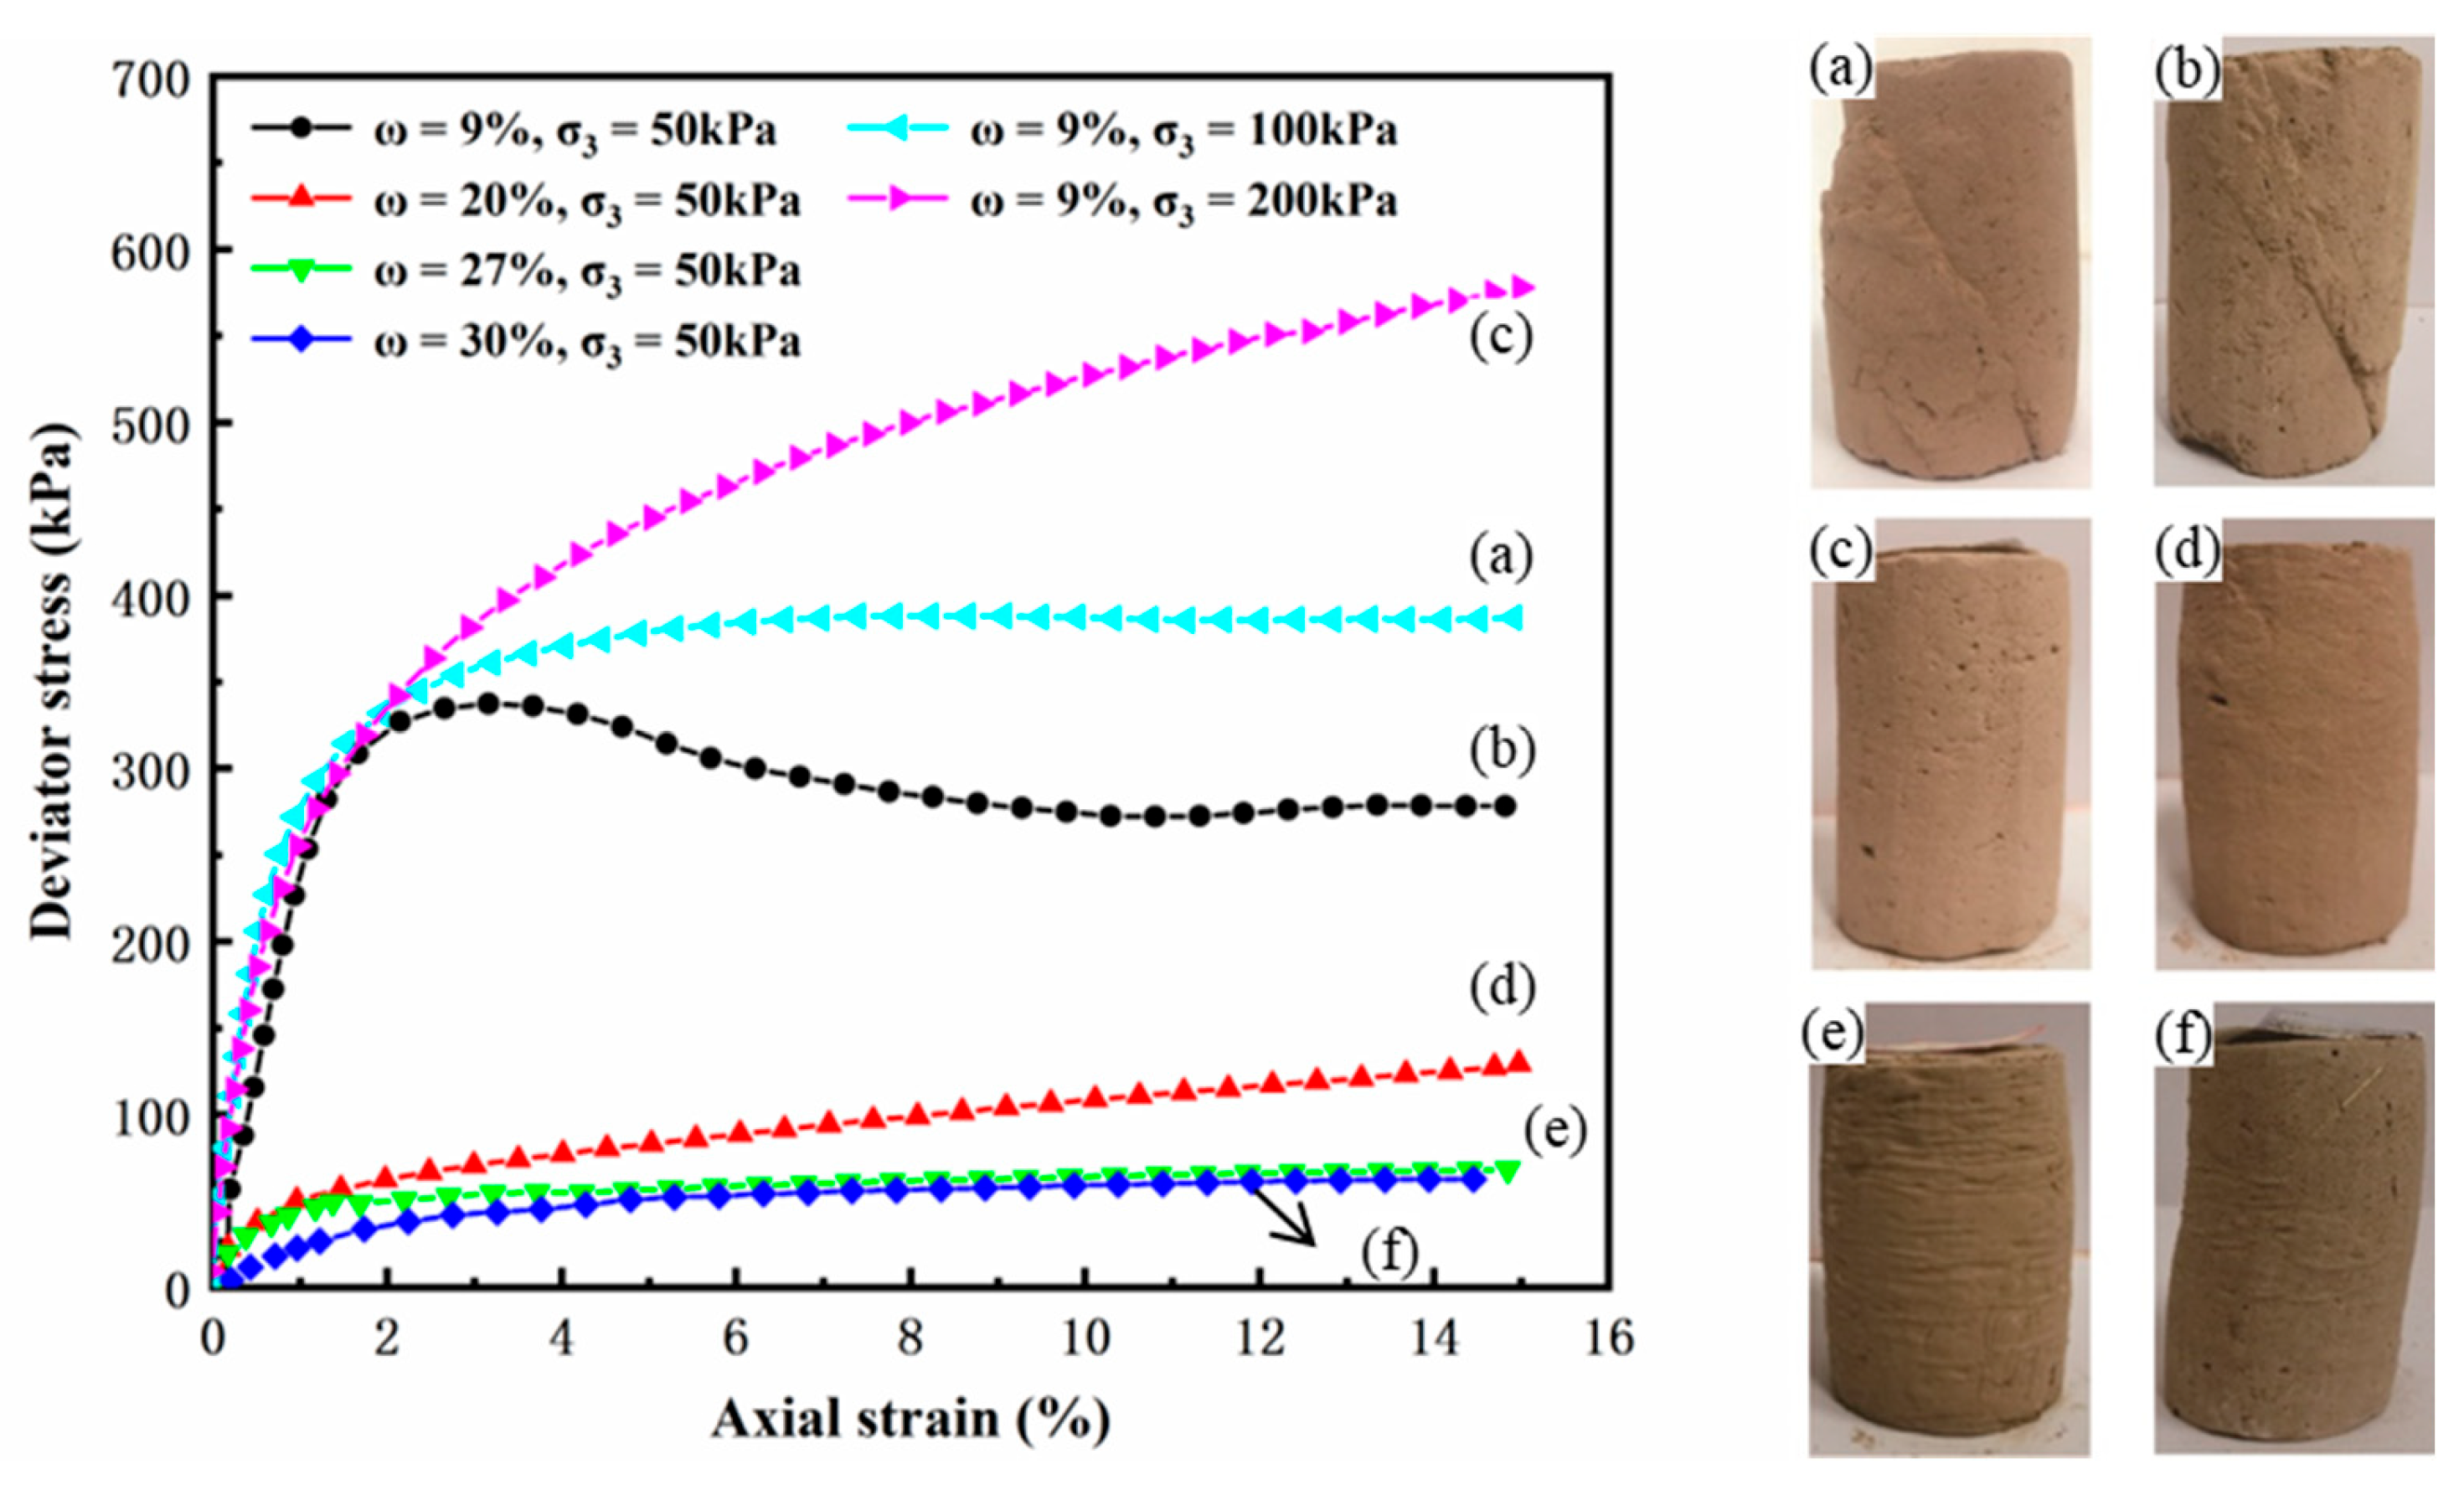
Figure 3 shows the effect of confining pressure on loess samples at a water content of 9%. As shown in Figure 3a, when the confining pressure increases, the deviatoric stress–strain response of the loess samples transitions from strain-softening to strain-hardening. At a low confining pressure of 50 kPa, the peak deviatoric stress is attained at an axial strain of less than 3.0%. Beyond this point, the deviatoric stress decreases to a residual value, characterizing strain-softening behavior. In contrast, at higher confining pressures, the deviatoric stress exhibits a rapid increase, followed by a constant plateau or a gradual rise with higher axial strain. This phenomenon without a distinct peak is referred to as weak-hardening or strain-hardening. Moreover, as the confining stress rises, the strain hardening becomes more distinct. Figure 3b reflects that the shear strength of loess samples rises significantly and increases linearly with increasing confining pressure. Figure 4a presents the transition of the deviator stress–strain relationship from strain-softening to weak-hardening at a confining pressure of 50 kPa as the water content rises. Correspondingly, Figure 4b shows that the shear strength decreases with increasing water content in a quadratic polynomial manner. This reduction becomes particularly pronounced when the water content drops below 20%.
Figure 3.
Variation in (a) deviatoric stress–strain curves and (b) shear strength of loess samples under different confining pressures.
Figure 4.
Variation in (a) deviatoric stress–strain curves and (b) shear strength of loess samples with different water contents.
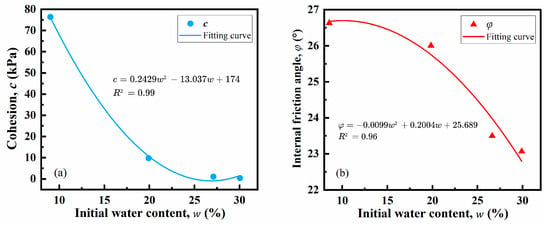
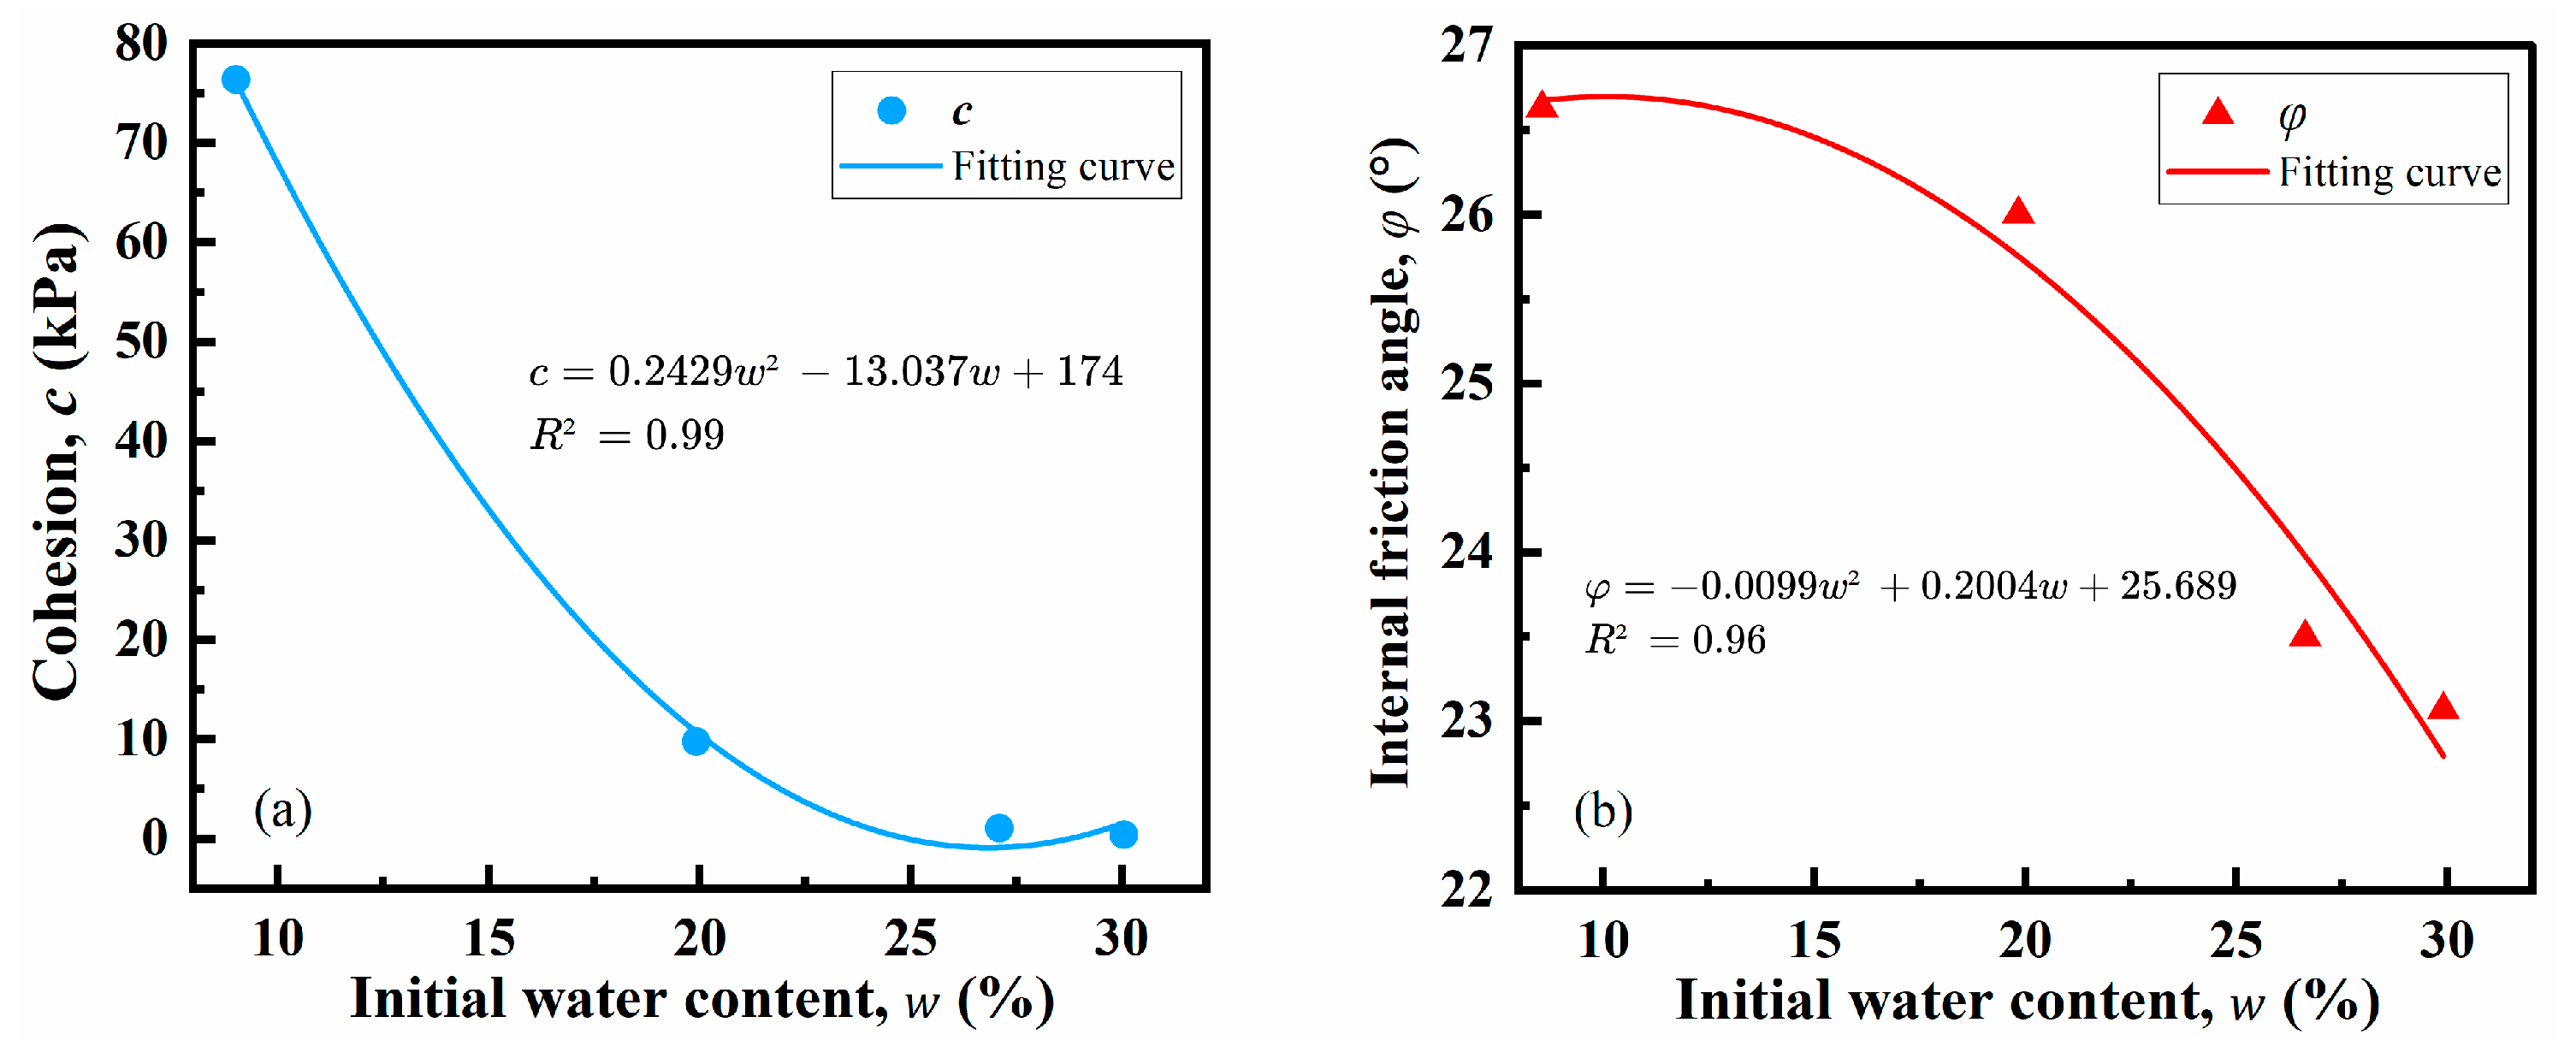
Figure 5 shows that loess samples with different water contents have different shear strength parameters, including cohesion (c) and the internal friction angle (φ), which were obtained based on the Mohr–Coulomb failure criterion. Since no excess pore water pressure is generated in the specimen during the consolidated-drained test, the measured strength can be taken as an effective stress shear strength parameter [37,38]. As the water content rises, the internal friction angle (φ) experiences a slight, near-linear decrease, whereas the cohesion (c) decreases markedly in a quadratic manner. Overall, cohesion exhibits a greater sensitivity to water compared to the internal friction angle, which is consistent with the findings of previous research [39,40,41].
Figure 5.
Variation in shear strength parameters with initial water content: (a) cohesion, c; (b) internal friction angle, φ. (R2 = 0.99 and 0.96, respectively).
3.2. Deformation Characterization of the Loess Samples
The shear strength development and failure modes of loess samples are highly dependent on external conditions. Figure 6 illustrates three typical failure modes of loess samples, classified based on the deviatoric stress–strain relationship and the deformation of loess samples after CD triaxial tests [42]. Loess specimens with low water content under low confining pressure mainly exhibit shear failure. During loading, microcracks initiate at particle contacts and gradually propagate and coalesce with the increase in axial stress, eventually forming obvious shear bands (Figure 6a,b). The corresponding deviatoric stress–strain curve presents weak-hardening and strain-softening characteristics. Loess specimens under high confining pressure or intermediate water content mainly undergo homogeneousfailure with a relatively fragile initial structure. No distinct shear bands or penetrating surface fractures are observed after shearing. The specimens present uniform compression or slight radial bulging (Figure 6c,d). The corresponding deviatoric stress–strain curves show weak-hardening or strong-hardening responses. Loess specimens with high water content under low confining pressure are in a soft plastic state and predominantly exhibit plastic failure. No obvious shear bands or fractures develop during shearing. The specimens produce significant lateral bending and large radial bulging deformation (Figure 6e,f), and the corresponding deviatoric stress–strain curves only show weak-hardening characteristics.
Figure 6.
Different failure modes of loess samples in the CD triaxial tests: (a,b) shear failure; (c,d) homogeneous failure; (e,f) plastic failure.
3.3. Microstructural Characteristics of Loess Before the CD Tests
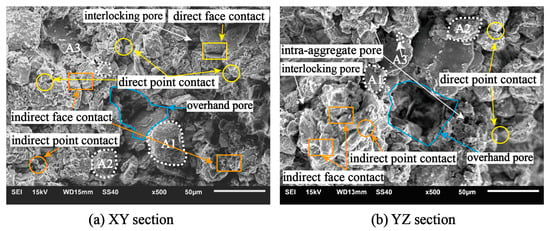
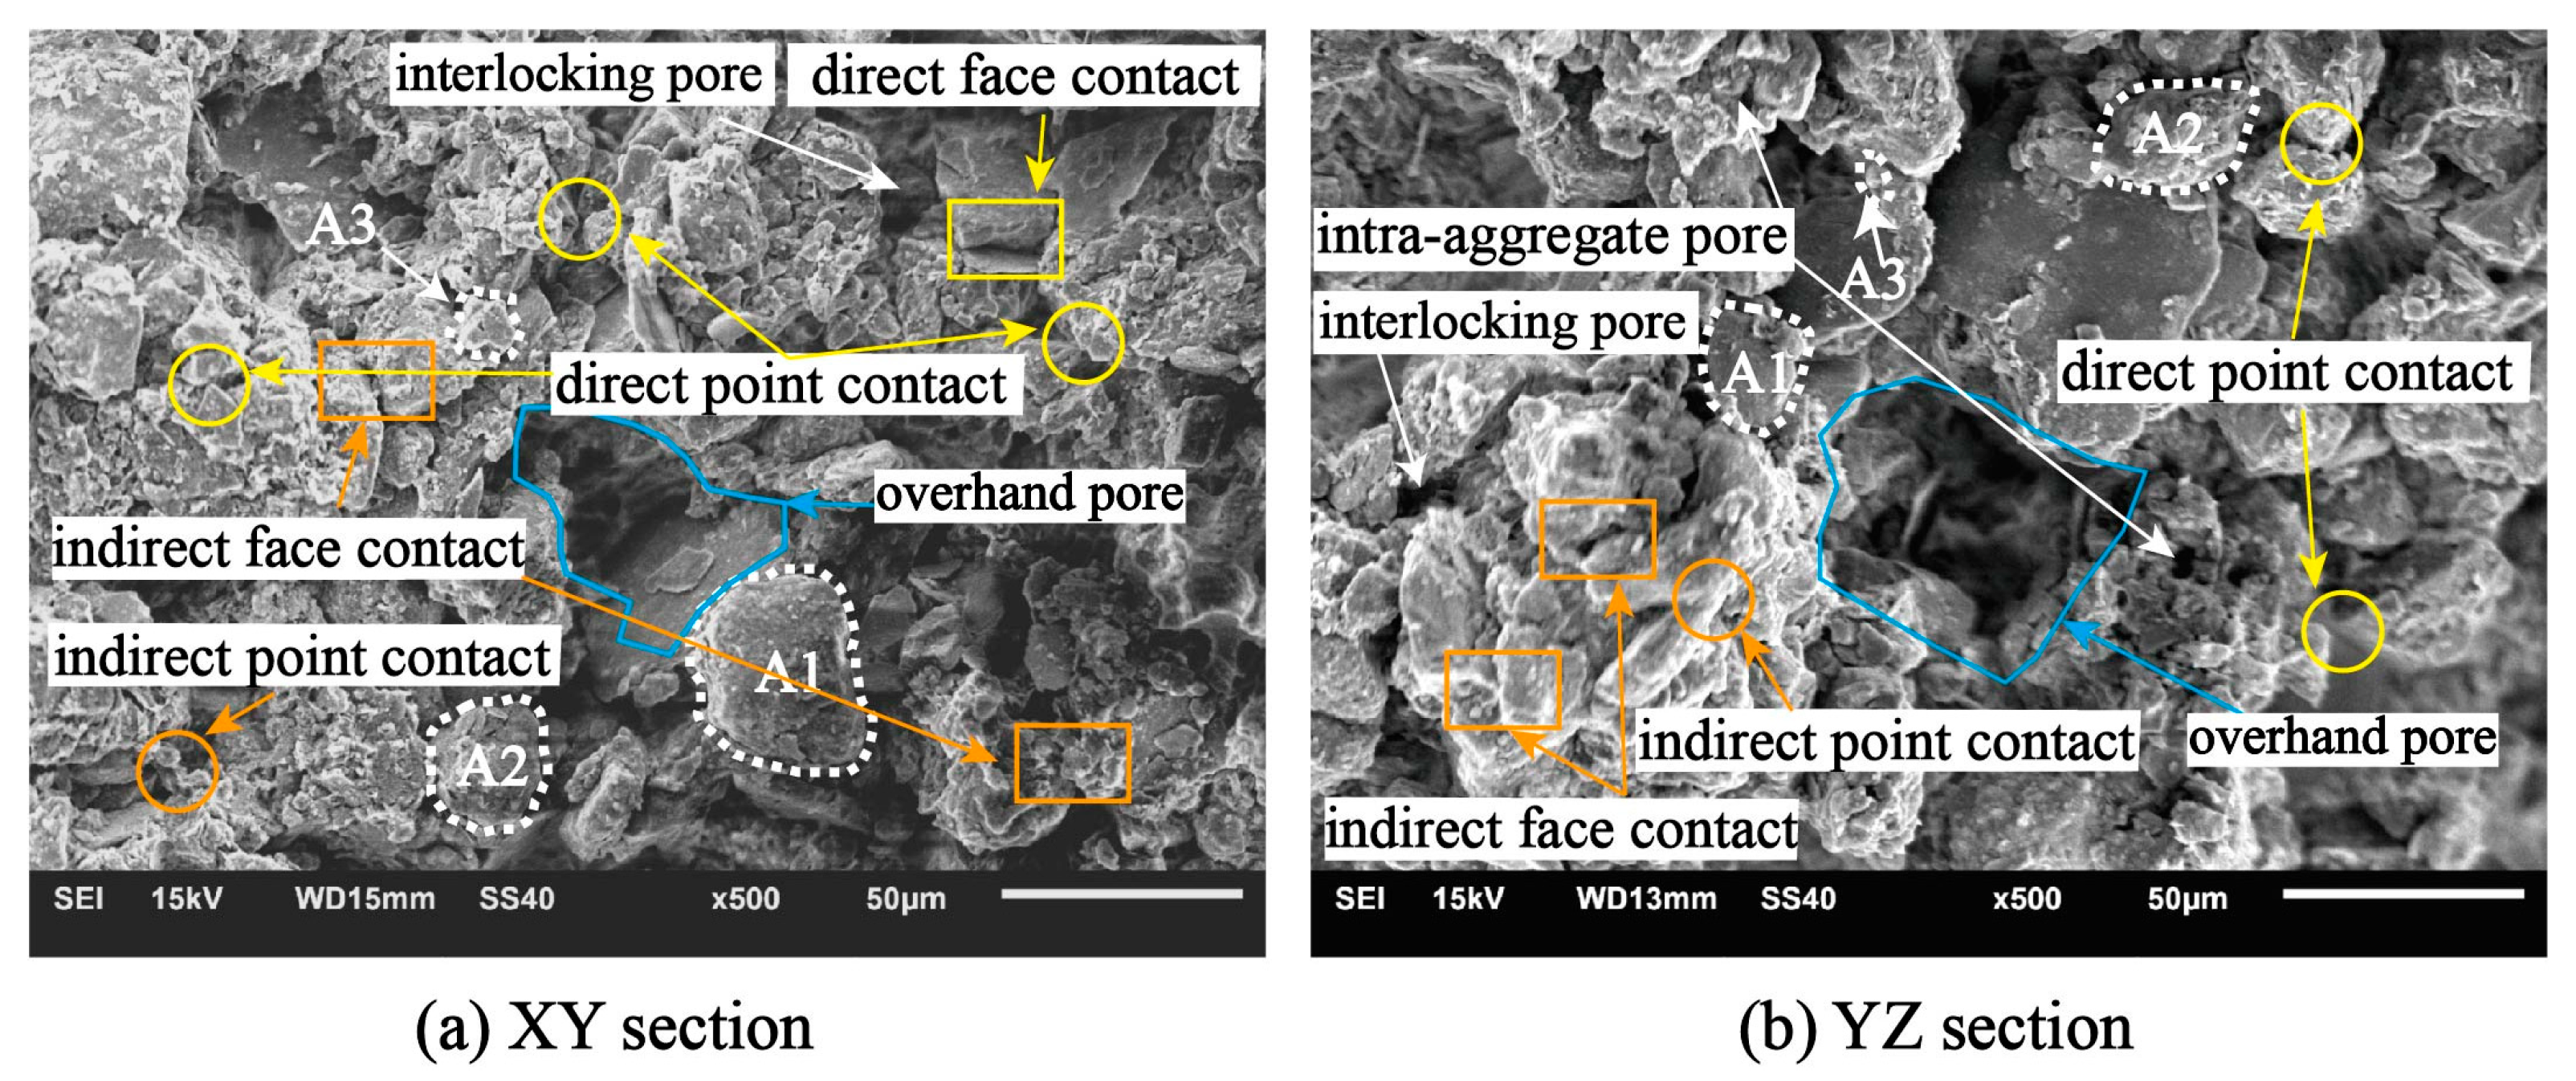
The microstructural images of the XY section and YZ section of natural loess before the triaxial tests are illustrated in Figure 7. Loess particles can be summarized into skeletal particles and non-skeletal particles based on their structural role. Skeletal particles are mainly summarized into single mineral grains (as identified by the position of A1 in Figure 7) and aggregate grains. Skeletal particles have greater mechanical strength and can withstand greater external forces. However, the non-skeletal particles are mainly small aggregates, such as floc and clay particles [37]. Small aggregates usually coat or wrap coarse grains to form aggregate grains (as identified by the position of A2 in Figure 7) and connect particles as clay aggregates (such as clay bridges and buttresses) rather than functioning independently (as identified by the position of A3 in Figure 7).
Figure 7.
SEM images of natural loess samples.
The loess particles are randomly arranged and interconnected, forming two types of connection relationships. The first is direct contact, which can be subdivided into direct point contact (as identified by the yellow circles in Figure 7) and direct face contact (as identified by the yellow rectangles in Figure 7). The second is indirect contact, in which particles are typically coated with clay and flocs (as identified by the orange circles and rectangles in Figure 7) [38]. Notably, direct contact is more mechanically sensitive: under low-magnitude external forces, it is prone to rupture, leading to particle slippage. Consequently, direct contact predominates during the early stage of loess microstructure formation. In contrast, indirect contact exhibits greater structural stability but is highly sensitive to water. Pores in the natural loess contain intra-aggregate, interlocking pores and overhead pores (Figure 7).
Cementation materials between particles exert a significant influence on the stability and shear strength of loess. Clay and carbonate cements act as the primary bonding materials, providing critical inter-aggregate bonding strength [22]. Pores in loess can be classified into inter-aggregate pores and intra-aggregate pores. Inter-aggregate pores can be further subdivided into overhead pores and inter-locking pores (Figure 7), which are considerably larger than intra-aggregate pores [16]. Overall, the porous structure, weak cementation, overhead pore distribution, and unstable particle contacts of natural loess collectively contribute to its typical metastable microstructure.
3.4. Microstructural Characteristics of Loess After the CD Tests
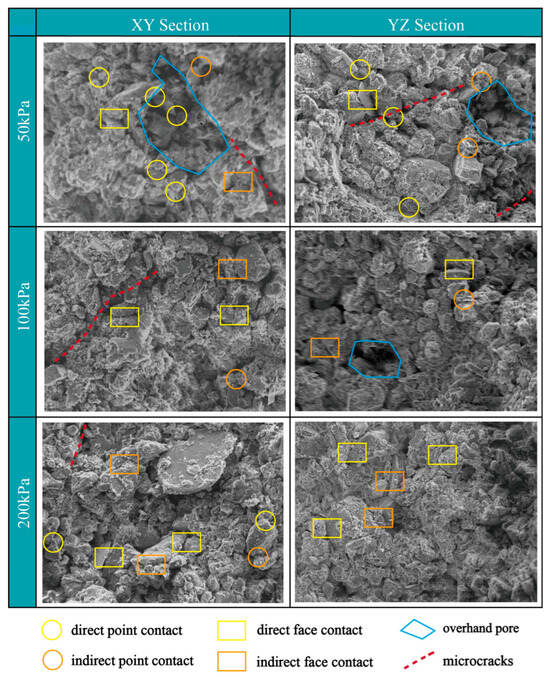
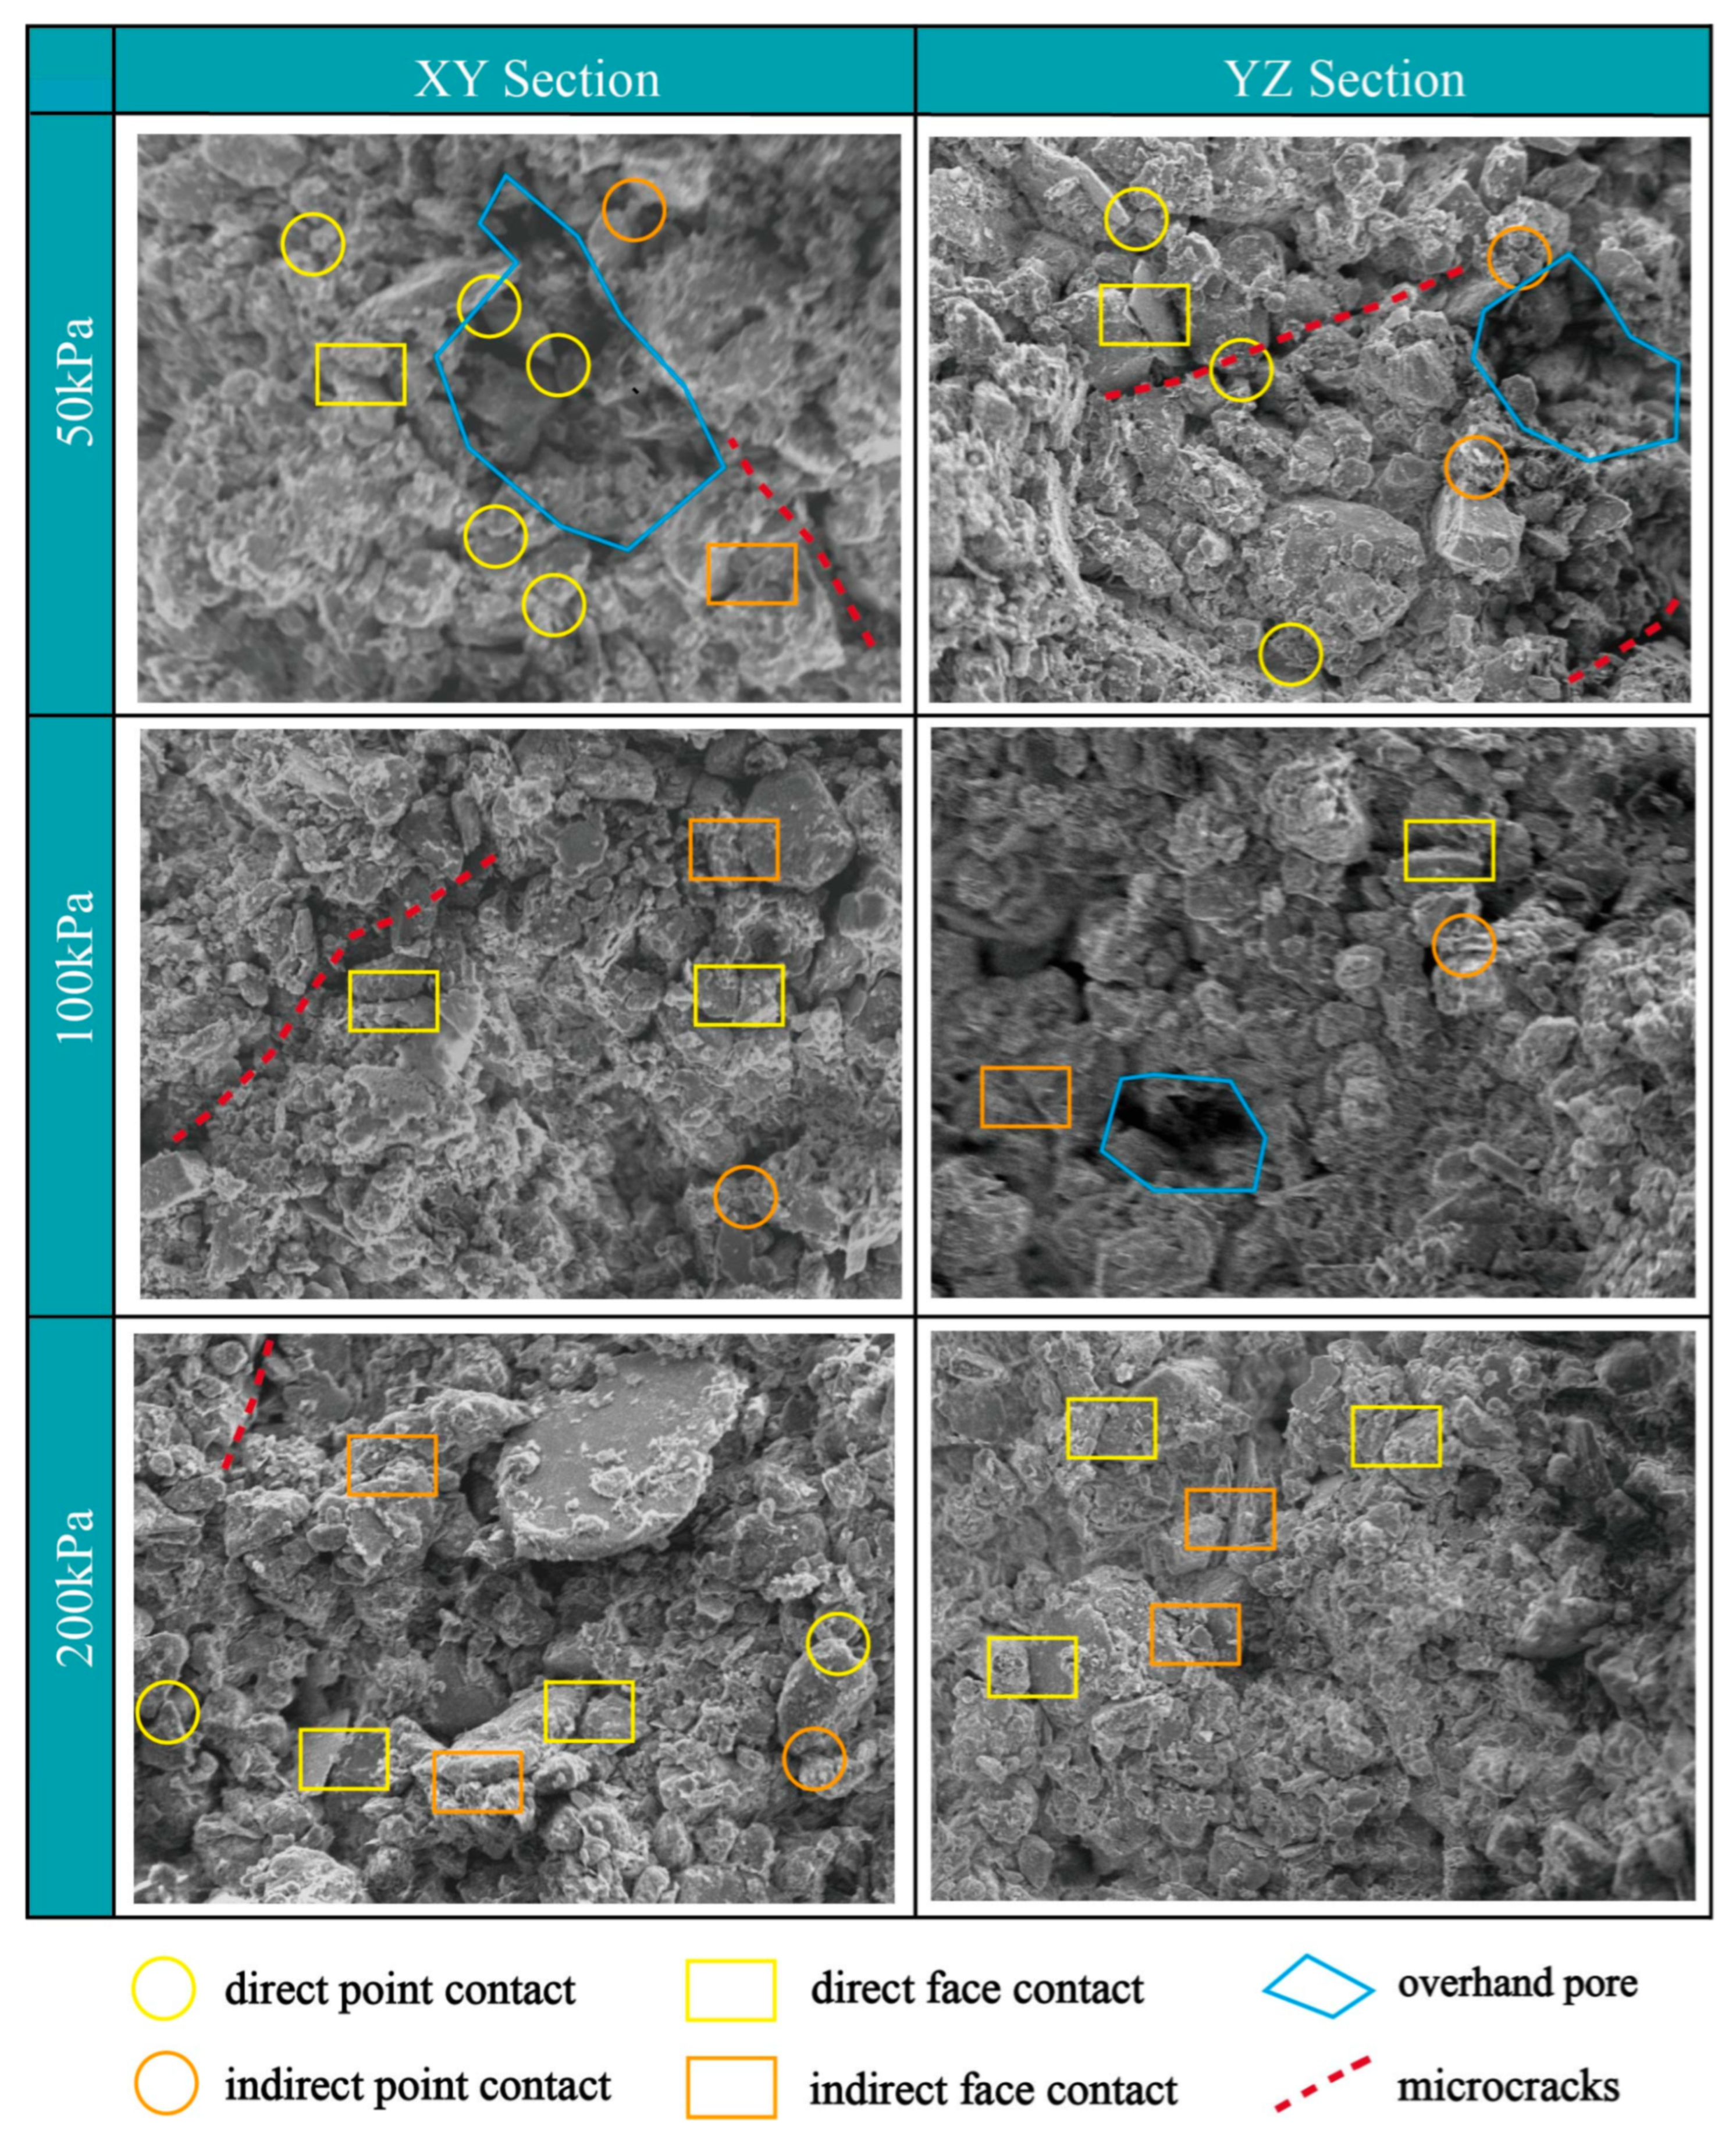
The microstructures of samples at a 9% water content under varying confining pressures are presented in Figure 8. With increasing confining pressure, point contacts gradually transform into surface contacts. Meanwhile, cementation bonds between particles rupture during shearing, leading to the dispersion of aggregates composed of fine particles and clay, which accounts for the reduction in direct contacts. Concurrently, the number and size of overhead pores both decrease progressively with rising confining pressure. This drives the progressive transformation from an overhead structure to an interlocking structure, and ultimately into a densified structure. Under the action of axial loading, loess particles in the YZ section are more densely compacted than those in the XY section.
Figure 8.
SEM images of the 9% water content specimens after triaxial tests under different confining pressures.
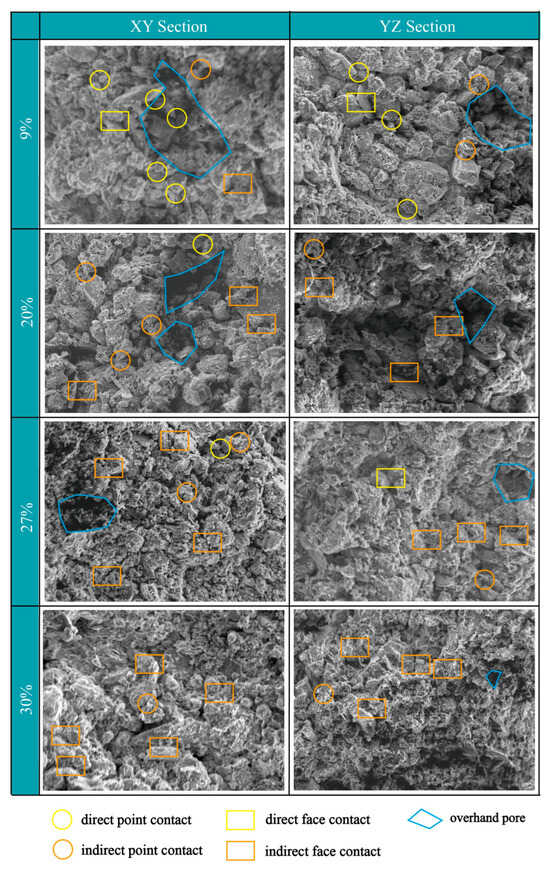
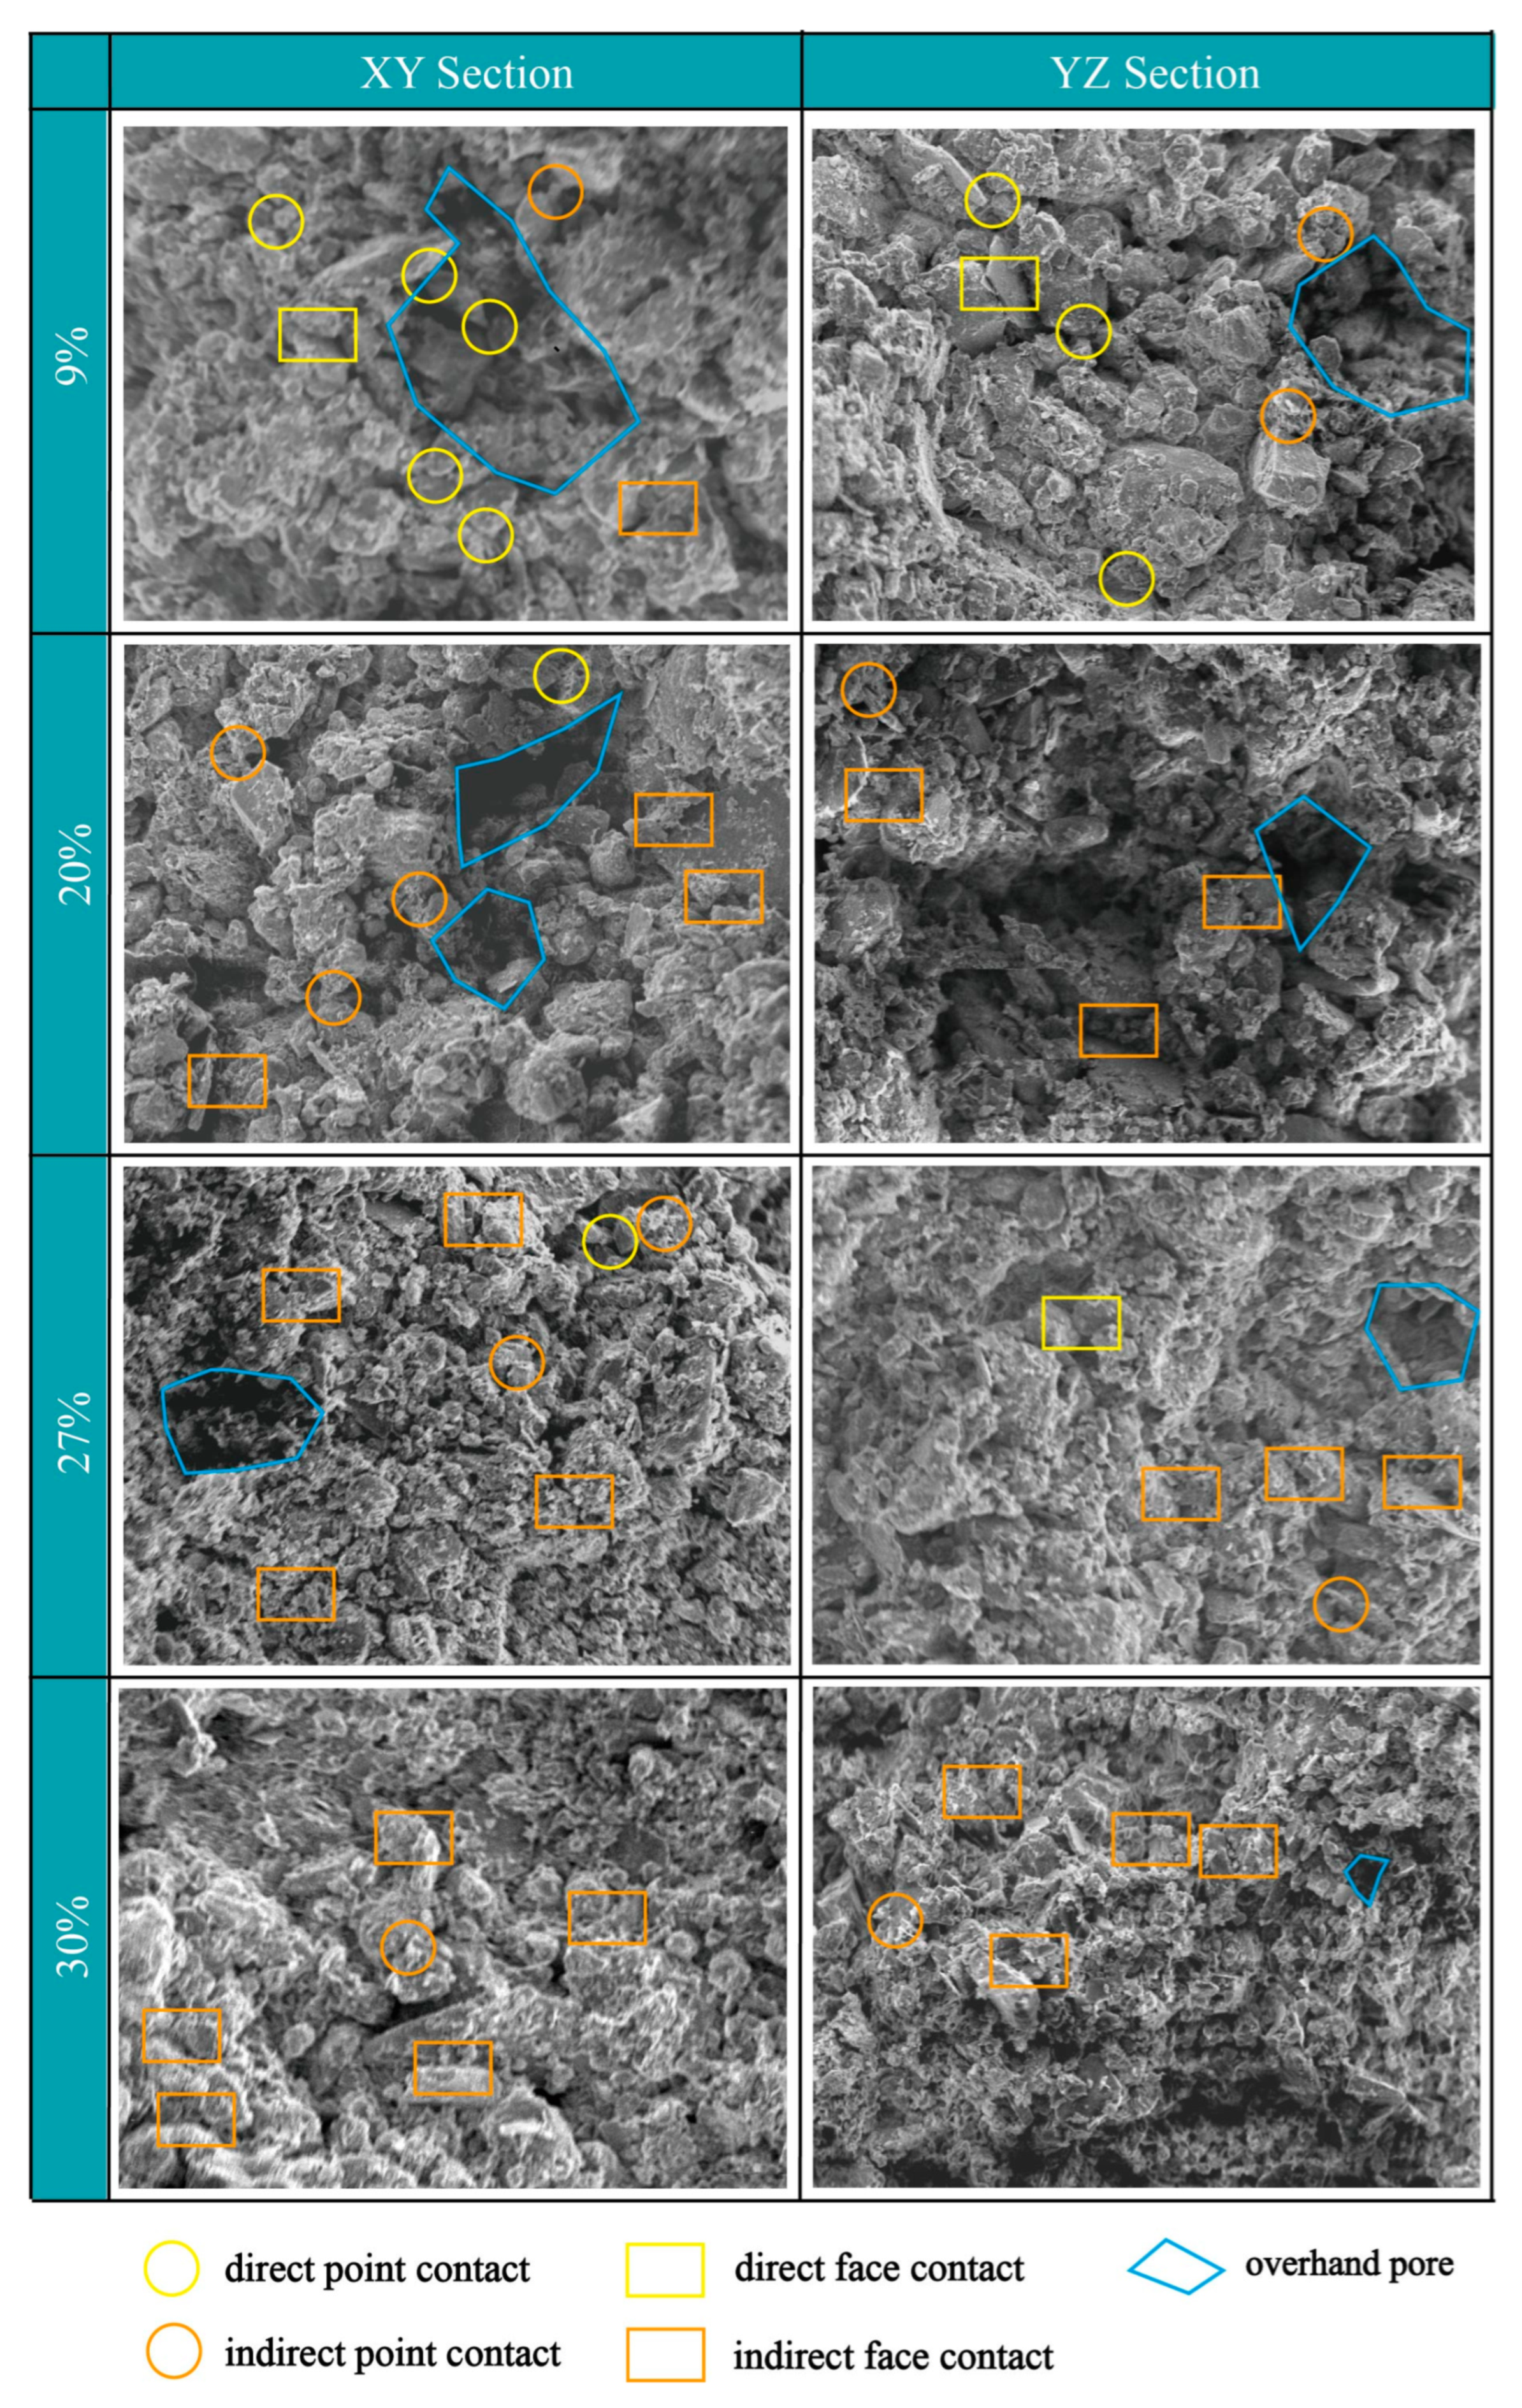
Figure 9 shows the microstructures of loess samples at different water contents under σ3 = 50 kPa following the CD tests. Overall, with the water content increasing, the skeletal particles of the specimens appear less distinct and more fragmented. Particles are also significantly compacted and connected primarily via indirect contacts, leading to the transformation from an overhead–interlocked structure to a compact cemented structure. With increasing initial water content, partial overhead pores collapse due to structural softening and external loading, accompanied by a marked increase in the proportion of silt particles and aggregates coated by clay. Moreover, microstructural evolution becomes increasingly pronounced with rising initial water content. These observations indicate that the microstructure of loess is jointly governed by both confining pressure and initial water content.
Figure 9.
SEM images of the samples with different initial water contents.
3.5. Quantitative Analysis of the Loess Particle Morphology and Arrangement Characteristics
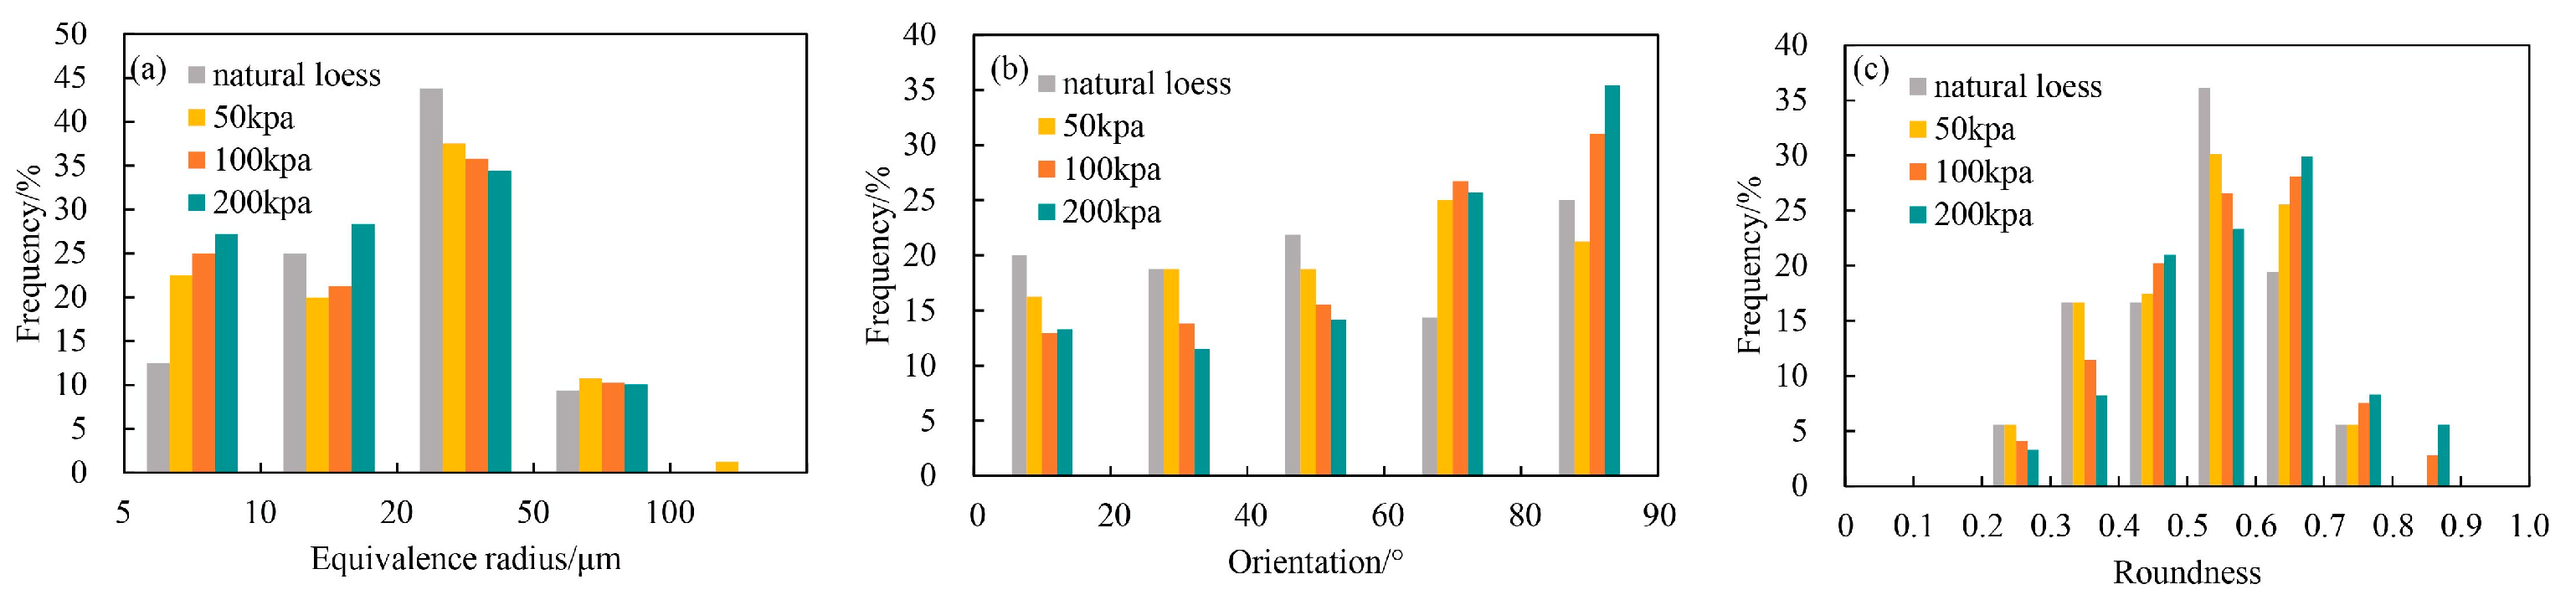
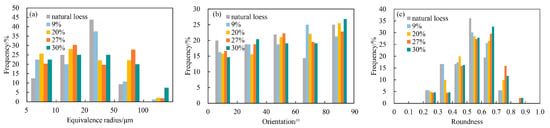
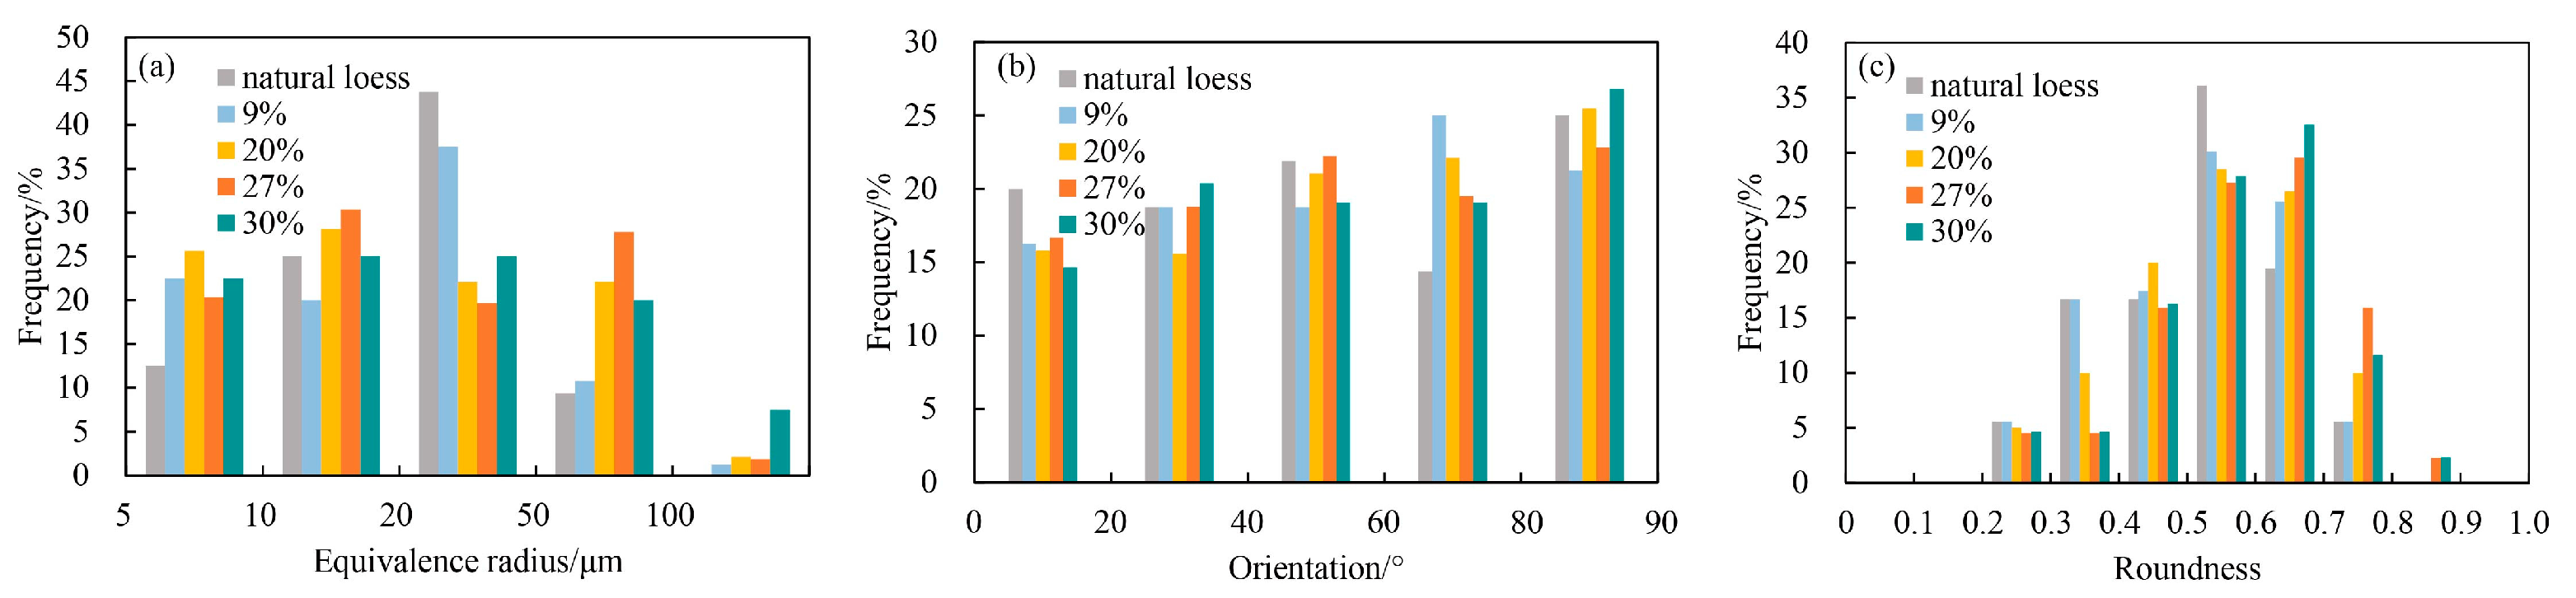
Figure 10a and Figure 11a present the distribution of particle equivalent radius under different confining pressures and water contents, respectively. Some of the particles smaller than 5 μm mainly occur in association with clay or embedded in aggregates, which makes it impossible to accurately identify their boundaries [6,22]. Thus, the particles smaller than 5 μm are not observed (Figure 10a and Figure 11a). The frequency of particles in the 5–10 μm range increases significantly after shearing as confining pressure increases. As is evident from the SEM images (Figure 8), shear stress combined with confining pressure promotes the fragmentation of larger aggregates, resulting in a marked rise in the proportion of identifiable fine particles within this size bracket. The increase in water content intensifies the agglomeration of particles, resulting in an elevated proportion of particles larger than 50 μm (Figure 11a). This result is consistent with the observations from the aforementioned images (Figure 9).
Figure 10.
Distributions of particle properties in loess samples sheared under different confining pressures: (a) equivalent radius; (b) orientation; (c) roundness.
Figure 11.
Distributions of particle properties in loess samples sheared with different water contents: (a) equivalent radius; (b) orientation; (c) roundness.
Figure 10b and Figure 11b present the distribution of particle orientation under different confining pressures and water contents, respectively. Particle orientation reflects the directional alignment of loess particles. As shown in Figure 10b, the proportion of particles oriented within 0–40° gradually decreases with increasing confining pressure, while the proportion of particles oriented above 60° increases correspondingly. Specifically, the fraction of particles oriented at <40° accounts for 38.75% in the natural loess sample, which is recognized as one of the key microstructural factors contributing to the metastable structure of loess [30]. As confining pressure increases, this proportion gradually decreases to 35.00% at 50 kPa, 26.73% at 100 kPa, and further declines to 24.78% at 200 kPa, indicating a progressive reorientation of particle alignment toward horizontal directions. As shown in Figure 11b, the proportion of particles oriented within 0–10° decreases in all specimens after shearing, and the reduction extent exhibits little variation among samples with water contents ranging from 9% to 30%. The directional alignment of particles gradually weakens as the water content increases to 20%. At this water content, the loess behaves in a soft-plastic state, and particle movement occurs by overcoming only low sliding friction [43]. Consequently, with increasing axial stress, particles undergo undirected displacement, resulting in a more disordered and less oriented fabric. These findings demonstrate that water weakens the interparticle bonding and initial structural stability of loess, causing numerous initially steep, small-angle particles to rotate and tilt toward the horizontal direction.
Figure 10c and Figure 11c present the distribution of particle roundness under different confining pressures and water contents, respectively. The fraction of particles with roundness smaller than 0.6 accounts for 75% in the natural loess sample. With increasing confining pressure and water content, the proportion of particles with roundness less than 0.6 decreases gradually, while the proportion of particles with roundness greater than 0.6 increases correspondingly. As confining pressure rises, the proportion of particles with roundness greater than 0.6 increases progressively: it is 25% in the natural loess, 31.11% at 50 kPa, 38.45% at 100 kPa, and further rises to 43.78% at 200 kPa. As water content increases, the proportion of particles with roundness greater than 0.6 increases progressively: 31.11% at 9% water content, 36.50% at 20%, 47.73% at 27%, and slightly decreasing to 46.51% at 30%. These results indicate that particle morphology gradually becomes rounded under the combined effects of confining pressure and water.
3.6. Quantitative Analysis of the Loess Pores
3.6.1. Pore Classification of Natural Loess
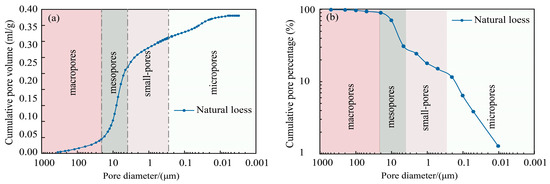
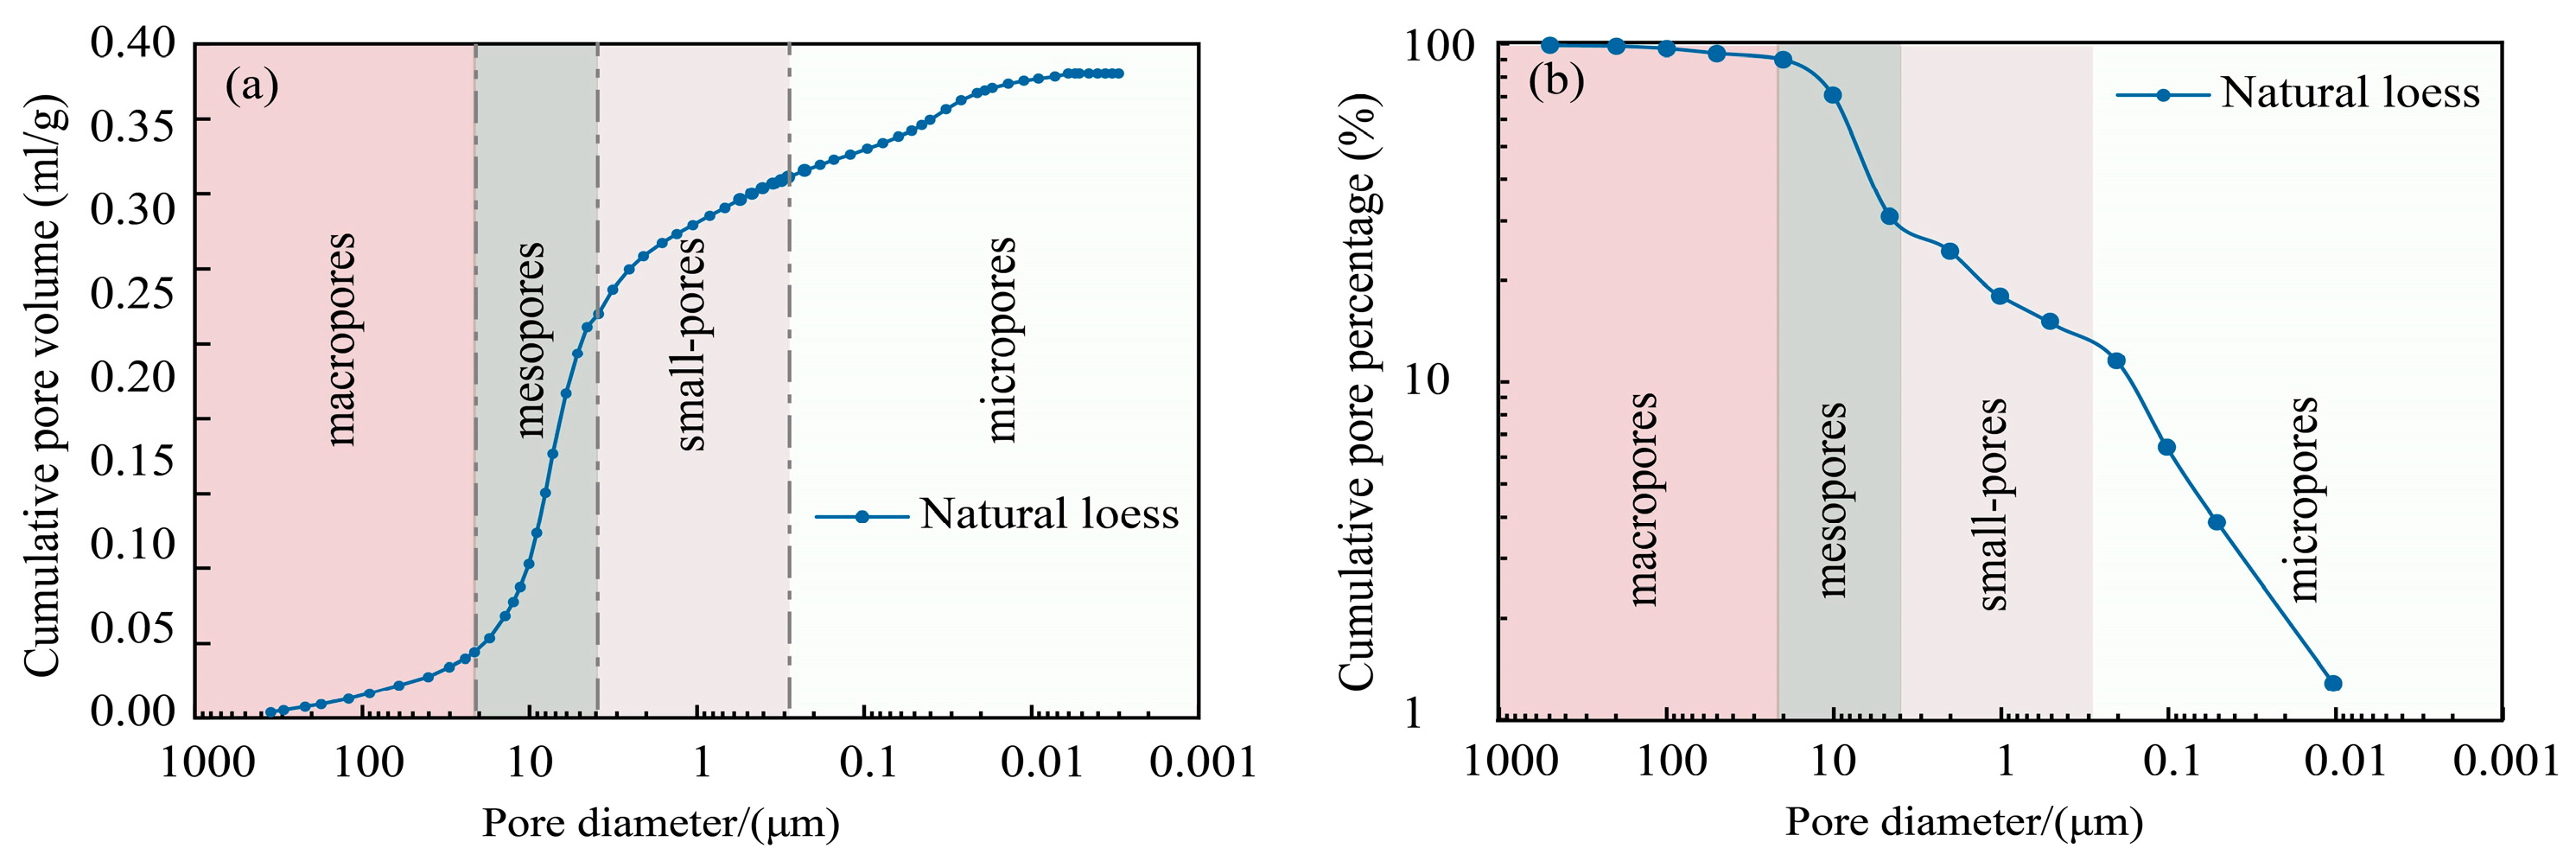
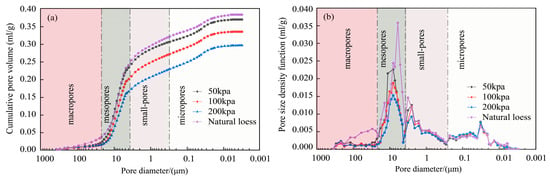
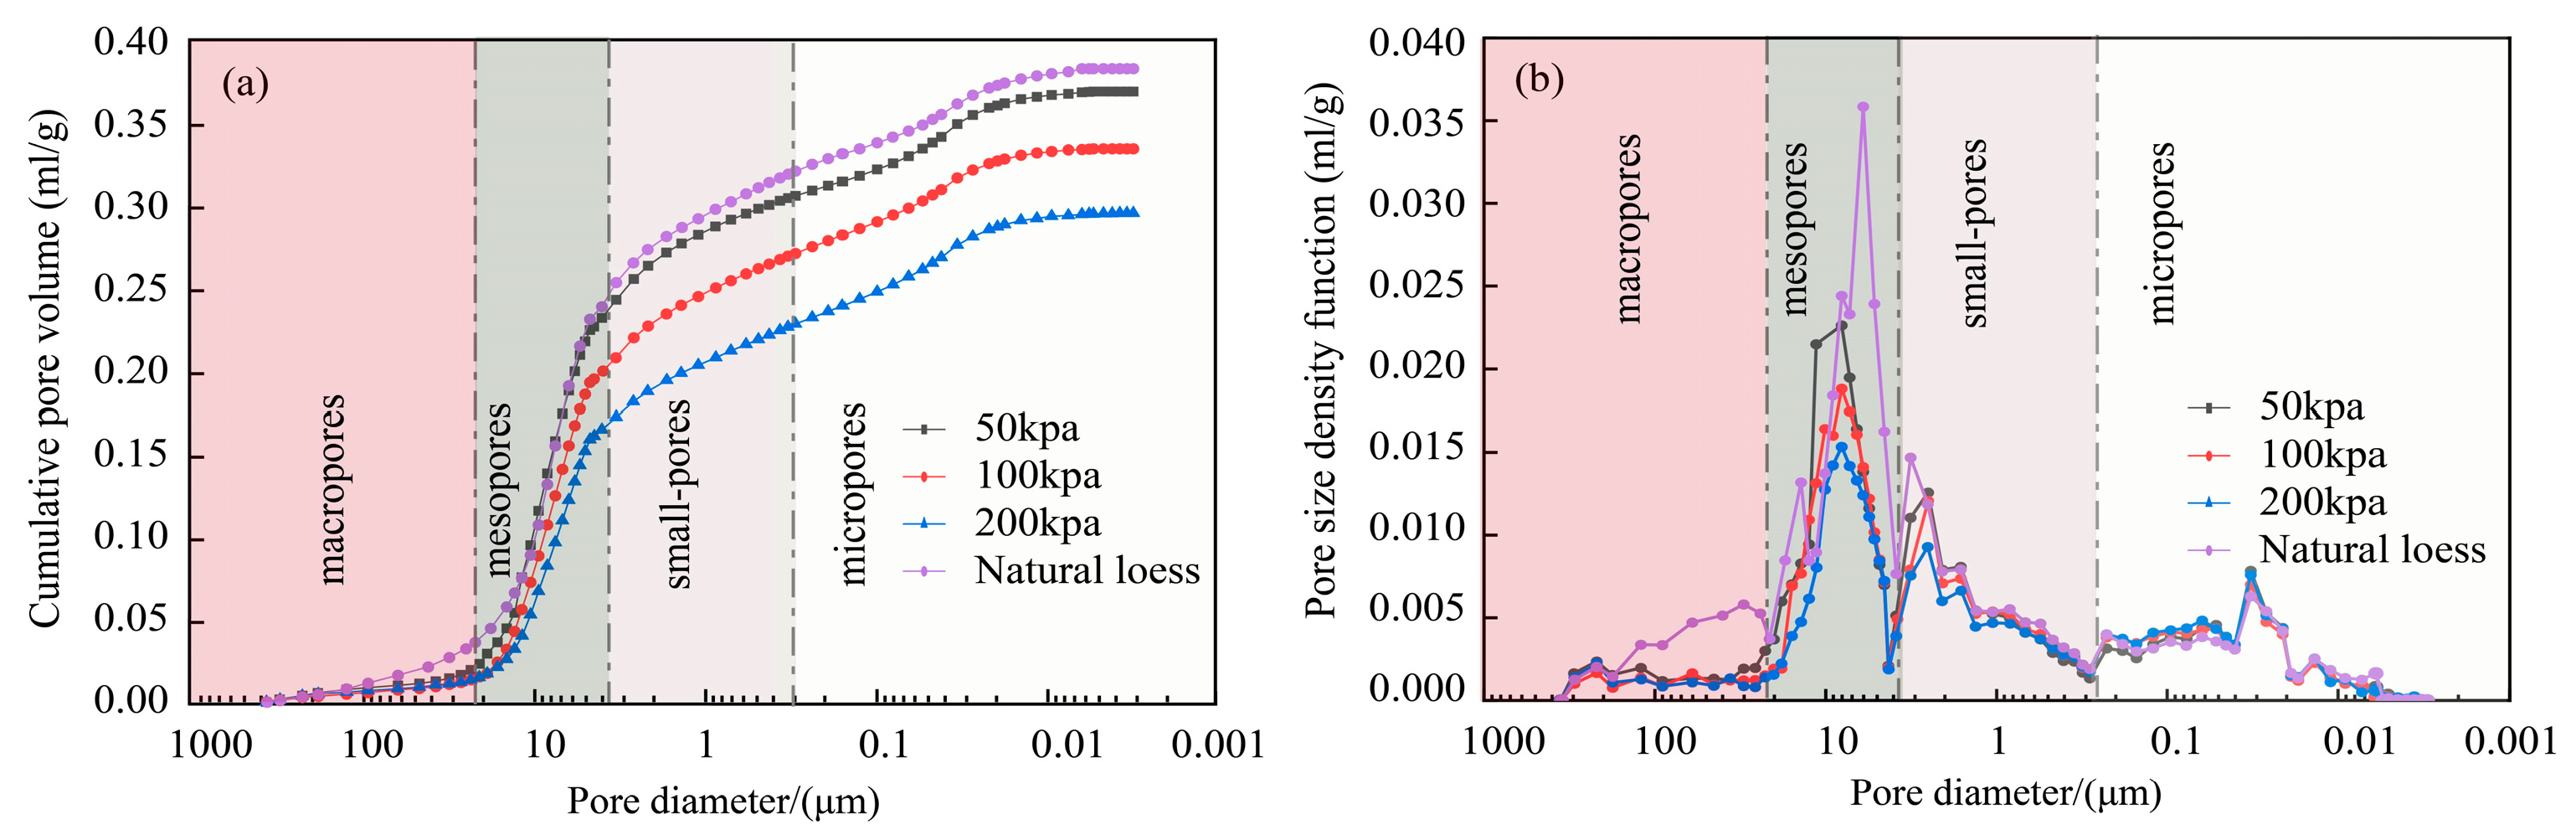
The cumulative pore volume curve for natural loess is presented in Figure 12a. In line with fractal theory and the self-similarity hypothesis [44,45], this curve is re-plotted on a double-logarithmic scale in Figure 12b. The cumulative pore volume curve exhibits varying slopes, yet it demonstrates a consistent slope at different stages. Based on the three inflection points (located at 21.28, 3.85, and 0.28 μm, respectively), the curve is segmented into four stages. The pore sizes associated with the three inflection points could help differentiate similar pores within every stage. Based on these related pore sizes, relevant stages are designated micropores (<0.28 μm), small pores (3.85–0.28 μm), mesopores (21.28–3.85 μm), and macropores (>21.28 μm), respectively [39]. Combined with direct observations of pore characteristics from SEM images (Figure 7), it can be concluded that micropores correspond to intra-aggregate pores, small pores to interlocking pores, mesopores to overhead pores, and macropores to large overhead pores. In natural loess, the proportion of macropores reaches 9.44%, followed by 53.06% for mesopores, 21.44% for small pores, and 16.06% for micropores (Figure 12a). The distribution density curve of natural loess has a bimodal feature, and its peaks are located in the range of micropores and mesopores, with corresponding peaks of 0.03 μm and 6.03 μm, respectively (Figure 13b).
Figure 12.
Cumulative pore volume curve of natural loess: (a) in a semi-logarithmic plot and (b) in a double logarithmic plot.
Figure 13.
Pore characteristics of 9% samples under different confining pressures in (a) cumulative pore volume curve and (b) distribution density curve.
3.6.2. Variations in the Pore Size Distributions
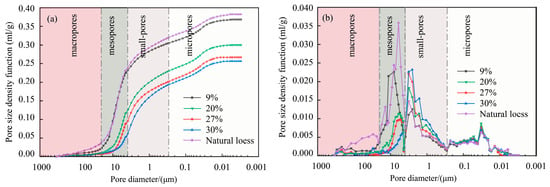
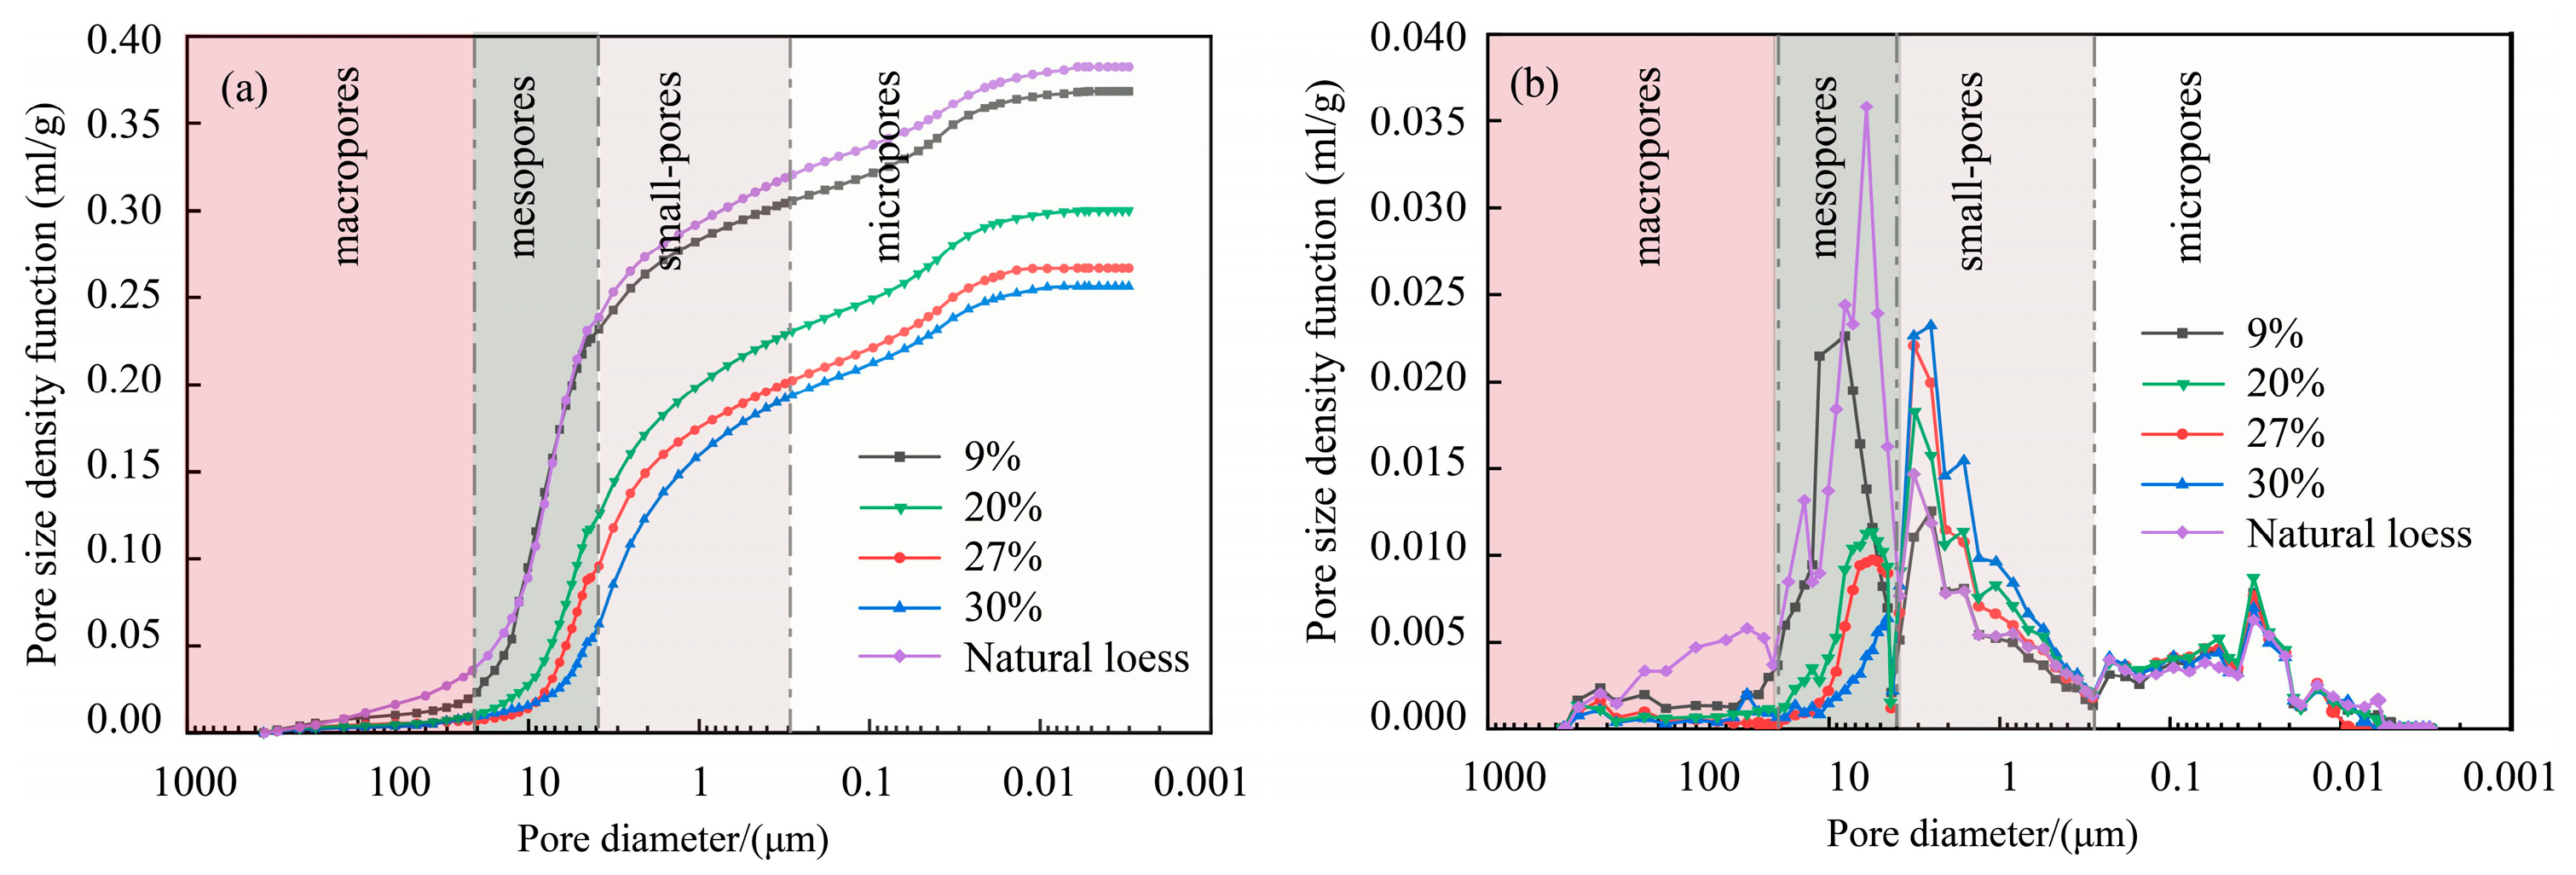
Figure 13 and Figure 14 present the changes in the pore distribution of loess after CD tests. It can be seen from Figure 13b and Figure 14b that all samples exhibit a bimodal feature, with the exception of a few isolated anomalous minimum points observed. Overall, the total mercury intrusion volume of the sheared specimens decreased, and it generally showed a declining trend with increasing confining pressure and water content (Figure 13a and Figure 14a). Macropores in the intact loess occupy a far greater pore volume than those in the specimens after shearing, whereas the peak curves of micropore size distribution are relatively flat and largely coincide with each other, with the peak for the intact loess being slightly lower. This indicates that intra-aggregate pores remained almost unchanged during the CD triaxial tests and are barely affected by variations in confining pressure or water content. In contrast, overhead pores larger than 21.28 μm (i.e., macropores) collapsed almost completely after shearing.
Figure 14.
Pore characteristics of soil samples at different initial water content under σ3 = 50 kPa in (a) cumulative pore volume curve and (b) distribution density curve.
Table 2 shows the respective pore diameters of the samples before and after CD triaxial tests. The peak pore diameter, denoted as Dp, corresponds to the pore size at which the volume fraction reaches its maximum on the distribution curve (Figure 13b and Figure 14b), reflecting the overall shift in the pore-size distribution. The median pore diameter, D50, is defined as the pore size at which the cumulative pore volume attains 50% of the total, serving as an indicator of the dominant pore size. For the natural loess sample (0 kPa confining pressure), Dp is 6.05 μm. Under confining pressures of 50 kPa, 100 kPa, and 200 kPa, Dp is approximately 7.95 μm in all cases. The increase in Dp may be associated with the formation of microcracks during shearing. Meanwhile, D50 decreases from 6.30 μm to 5.30 μm with a reduction of 15.87%. This indicates that higher confining pressure intensifies interparticle compression, with overhead pores being preferentially compacted. As the initial water content increases from 9% to 20%, 27%, and 30%, Dp takes values of 3.08, 3.08, and 2.70 μm, and D50 concurrently decreases to 2.96, 2.60, and 1.80 μm, respectively. Compared with the natural sample, Dp and D50 decrease by over 55% and 70 at 30% water content. In summary, the compaction effect on the pore structure after shearing is enhanced by both higher confining pressure and higher water content, with the latter playing a more pronounced role.
Table 2.
Respective pore diameters of the specimens before and after CD triaxial tests.
3.6.3. Variations in the Classified Pore Volume
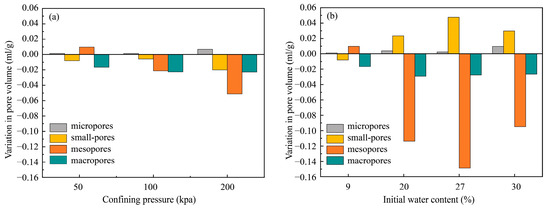
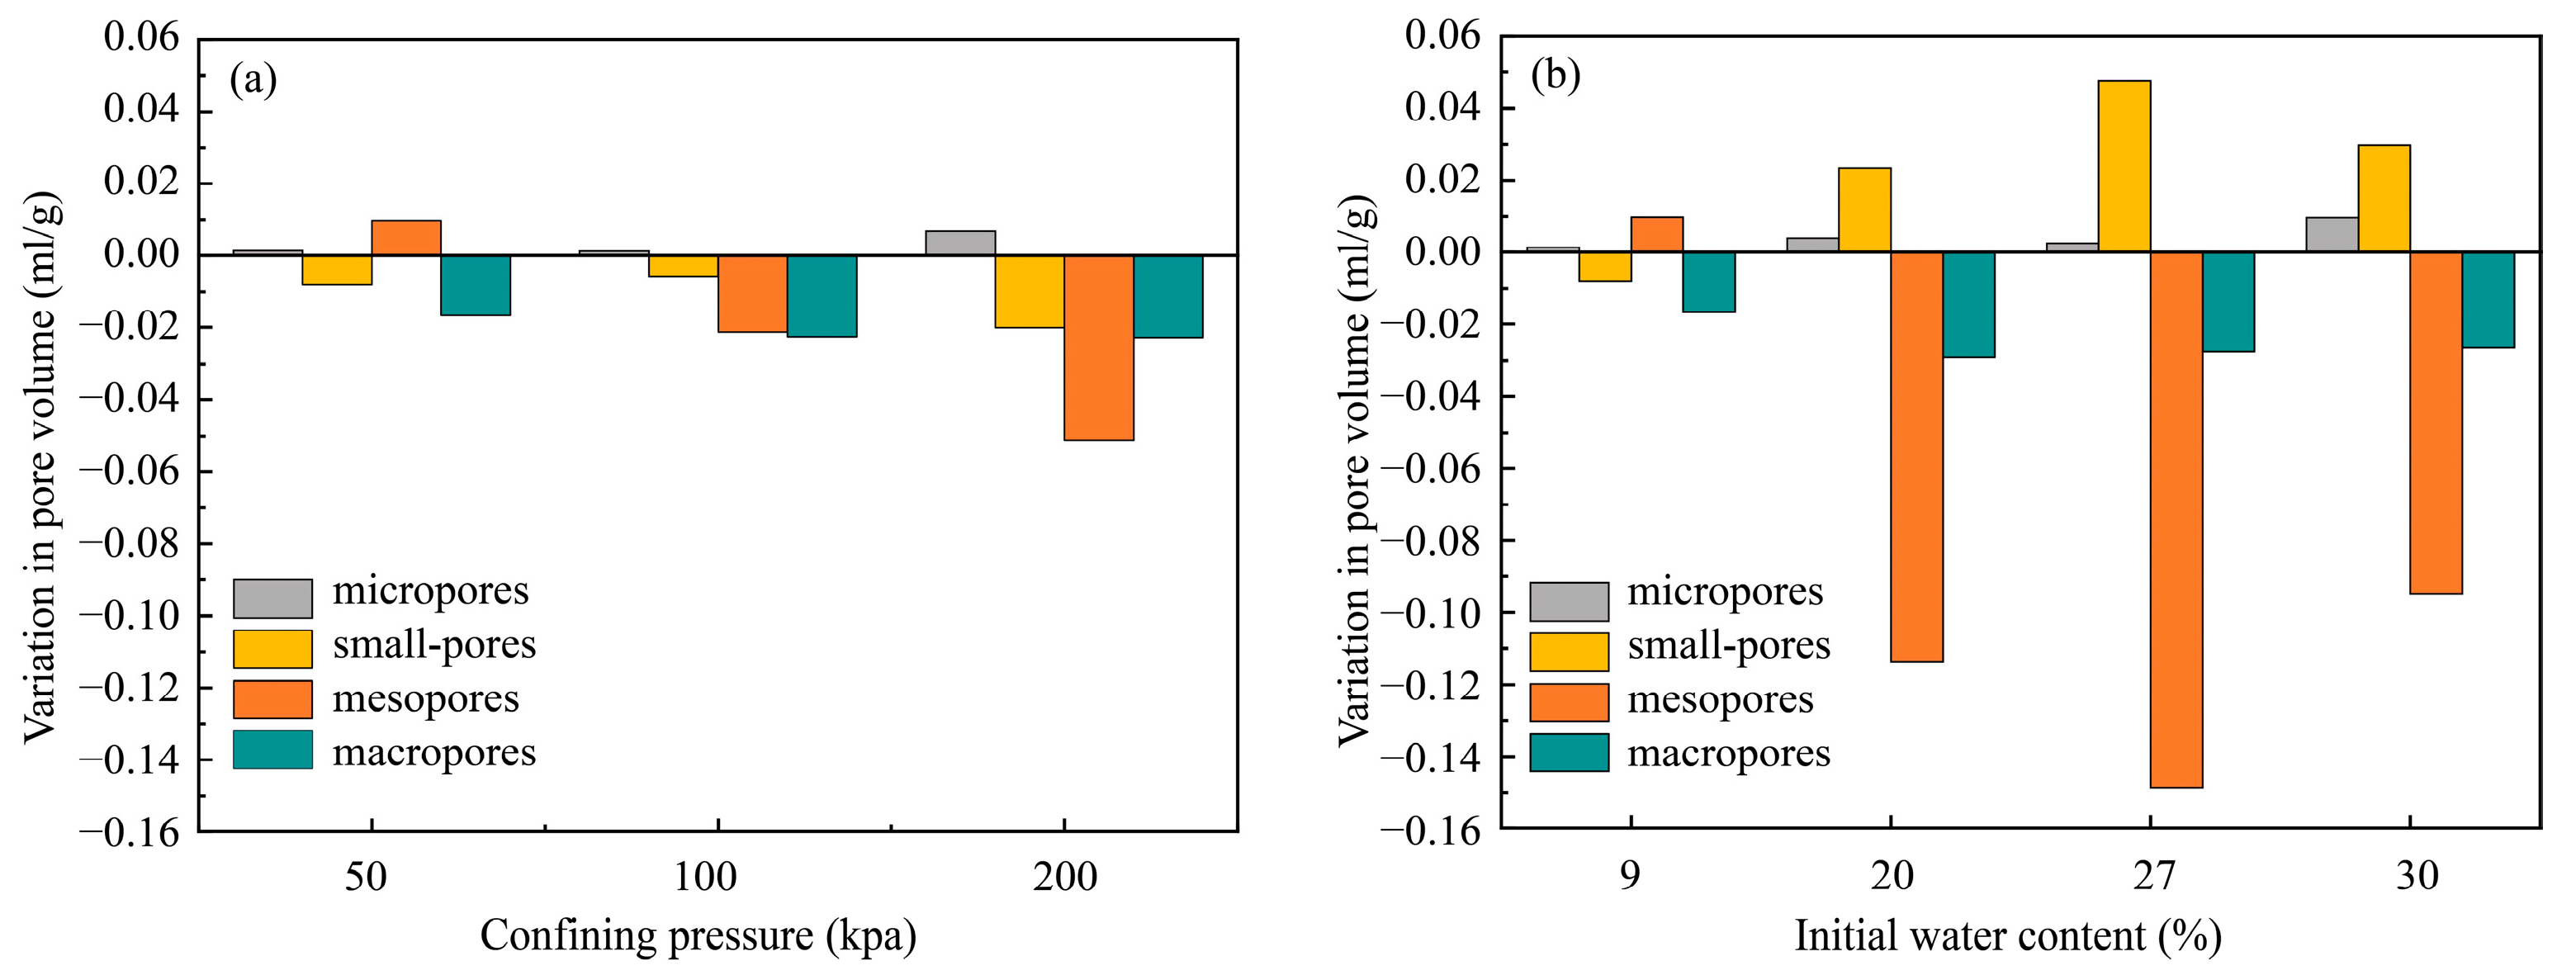
To analyze the variation in pore distribution more specifically, Figure 15 shows the changes in the volume of the four classified pores. Positive values of the variation in pore volume on the vertical axis represent an increase in pore volume, while negative values indicate a decrease. Overall, the volumes of small pores, mesopores, and macropores exhibit significant changes. In contrast, there is a slight increase in the volume of micropores. In Figure 15a, at a confining pressure of 50 kPa, the macropore volume decreases significantly, and the mesopore volume increases, indicating that macropores collapse under compression and transform into mesopores. When the confining pressure rises to 200 kPa, the change in macropore volume tends to stabilize, while the volumes of mesopores and small pores continuously decline, and pores further transform into smaller voids. The micropore volume only fluctuates slightly under all confining pressures and is weakly affected by confining compression, which demonstrates that confining pressure has little influence on internal micropores. It can be observed from Figure 15b that under constant confining pressure, the initial water content significantly regulates the pore transformation pathway. At the water content of 9%, the volume variation in all types of pores is limited. When the water content increases to the range of 20–27%, the mesopore volume decreases sharply, and the small-pore volume rises considerably, implying that a large quantity of mesopores transform into small pores. As the water content further increases to 30%, the volume of macropores and mesopores decreases as they evolve into small pores and micropores.
Figure 15.
Results of classified pore volume showing variations in (a) confining pressure and (b) water content.
4. Discussion
The coexistence of overhead pores, point contacts, and weak interparticle cementation constitutes the fundamental microstructural origin of the metastable behavior of loess. Such a structure can sustain external loads yet exhibit high susceptibility to external disturbances.
4.1. Micro-Mechanisms of Water-Induced Shear Strength Attenuation in Loess
The influence of water content on shear strength is primarily manifested in two aspects: a substantial decrease in cohesion and a modest reduction in the internal friction angle. The shear strength contributed by cohesion in loess originates from three distinct mechanisms. The first is original cohesion, which arises from electrostatic attraction and van der Waals forces between particles and remains relatively stable owing to its formation under long-term geological consolidation. The second is solidified cohesion, derived from crystallization and cementation at interparticle contacts. The third is apparent cohesion, which results from physicochemical effects associated with water films [46,47,48]. Both solidified cohesion and apparent cohesion are highly susceptible to changes in water content.
With increasing water content, the water films on cement surfaces thicken, apparent cohesion decreases, interparticle distance increases, cementing materials soften, and clay particles expand and disperse [49], leading to a reduction in solidified cohesion and ultimately resulting in substantial attenuation of cohesion [35,50]. For example, as water content increases from 9% to 30%, cohesion decreases from 77 kPa to 2 kPa (Figure 5a). MIP and SEM results confirm this mechanism: the bridging between particles almost disappears and particles rearrange, corresponding to the collapse of overhead pores and the transformation of large pores into smaller ones.
The internal friction angle is mainly controlled by internal factors such as soil density, particle grading, and particle shape, reflecting the interlocking friction between particles [43,51]. During shearing, aggregates break and disperse, allowing fine particles such as clay to fill voids. With increasing water content, pore sizes decrease substantially, the structure becomes densified, and particle orientation becomes increasingly randomized (Figure 10b), which enhances interlocking friction between particles. Meanwhile, clay particles tend to preferentially fill the concave or flat regions of larger grains, promoting a more rounded particle morphology—a phenomenon termed the “rounding effect” in previous studies [32]. This effect smooths particle surfaces and reduces overall particle angularity, thereby decreasing interparticle friction. These two competing effects counteract each other, resulting in only a modest reduction in the internal friction angle.
4.2. Correspondence Between Strength Attenuation Rate and Microstructure During Wetting of Loess
Under constant confining pressure, the mechanisms of loess shear strength evolution can be divided into three stages as the initial water content increases. There are significant differences among each stage in terms of the strength deterioration mechanism.
Stage I: rapid cement degradation stage (water content 9% to 20%). As water content increases, the shear strength of the soil decreases sharply from 335 kPa to 125 kPa (Figure 4b) with a reduction of 68.4%. Cohesion decreases rapidly from 76 kPa to 10 kPa (Figure 5b) with a reduction of 86.8%, while the internal friction angle decreases slightly. A large number of water-unstable cements (soluble salts, clay cementation bridges) within the loess undergo hydration, softening, and even dissolution, resulting in rapid loss of apparent cohesion and solidified cohesion between particles. Strength deterioration is dominated by cohesion loss. Stage II: cement nearly depleted, friction gradually dominates (water content 20% to 27%). The shear strength decreases from 125 kPa to 65 kPa, with a reduction of 48%. The strength attenuation rate is only 23.5% of that in Stage I. Cohesion drops to less than 10 kPa, and the main cementing components within the soil are largely depleted. Mesopores continue to transform into small pores, and pore collapse continues to develop, but the extent of pore modification is weaker than in Stage I. Water content of 20% serves as a critical threshold; below this water content, the mechanical behavior of the soil is controlled by interparticle cementation; above this water content, the shear strength transitions to being provided by particle friction. Stage III: friction slowly attenuates (water content above 27%). As water content continues to increase to 30%, the shear strength decreases modestly from 65 kPa to 60 kPa (Figure 4b), with the strength attenuation tending to plateau. At this time, cohesion remains at an extremely low level (Figure 5b), and the strength is almost entirely provided by interparticle friction. Excess water continues to thicken the water films on particle surfaces, and the lubrication effect gradually increases, causing the internal friction angle to decrease slowly. When water content reaches 30%, the mesopore peak almost completely disappears (Figure 14b), and the pore size distribution shifts overall toward smaller diameters, with deformation capacity significantly enhanced.
4.3. Micro-Mechanisms of Confining Pressure-Induced Strength Enhancement in Loess
Taking loess with 9% water content as an example, as confining pressure increases from 50 to 200 kPa, the shear strength increases from 339 to 580 kPa (Figure 3b). Confining pressure enhances strength through two microstructural pathways: (1) reduction in macropore and mesopore volumes (Figure 13 and Figure 15), transforming the overhead structure into an interlocked structure; and (2) transformation of particle contacts from point contact to face contact (Figure 8), which enhances interparticle interlocking. However, with increasing water content, the strengthening effect of confining pressure is substantially overshadowed by the weakening effect of water (Figure 6).
4.4. Microstructural Mechanisms of Deformation and Failure Modes
Shear failure occurs under low confining pressure and low water content conditions (e.g., σ3 = 50 kPa, w = 9%). The loess possesses a relatively high initial structural strength, with point contacts and direct contacts widely distributed. Under stress, point contacts are prone to rupture, generating stress concentrations at the contact points. As shearing proceeds, point contacts gradually transform into face contacts, particles undergo sliding and rearrangement (Figure 10b), and overhead pores undergo initial compression (Table 2, Figure 13). Microcracks preferentially propagate along the shear direction, eventually coalescing to form a shear band, accompanied by a sudden drop in strength (Figure 6). Within the shear band, the strength loss caused by cementation failure exceeds the strength gain from compaction outside the shear band, resulting in strain softening [52].
Homogeneous failure occurs in loess specimens under high confining pressure or intermediate water content (e.g., σ3 = 200 kPa, w = 9%). Weak connections in the soil are destroyed, while high confining pressure suppresses concentrated propagation of microcracks. With increasing confining pressure, extensive overhead pores collapse and aggregates are fragmented, releasing fine particles that fill pores, as reflected by the significant decrease in characteristic pore diameters Dp and D50 (Table 2). This enhances interparticle contact area and increases frictional resistance [22], and the overall structure becomes uniformly densified (Figure 7). The strength gain from compaction exceeds the strength loss caused by cementation destruction and crack development, resulting in macroscopic strain hardening.
Plastic failure occurs in loess specimens under high water content and low confining pressure (e.g., σ3 = 50 kPa, w = 30%). With increasing water content, water films on particles thicken and cementing materials dissolve, promoting particle agglomeration (Figure 11c) and weakening interparticle bonding forces, making particles more prone to sliding. As water content increases, the preferred orientation of particles gradually weakens (Figure 9 and Figure 11b), and a large number of macropores and mesopores transform into small pores and micropores. Although significant compaction occurs, the low confining pressure is insufficient to constrain lateral deformation, resulting in radial bulging (Figure 6e,f). Under these conditions, the strength of the soil is primarily maintained by interparticle friction, and the macroscopic mechanical response exhibits weak hardening characteristics.
4.5. Novelty, Engineering Implications, and Limitations
In comparison with previous studies, the present research has uncovered several important previously unidentified phenomena and findings, which extend the current understanding of loess microstructure evolution and mechanical behavior. First, the finding that confining pressure had a negligible impact on the peak pore diameter implies that overall pore compression governed the pore structure evolution. This conclusion differs from previous studies [20,53,54], which may be attributed to the inherent soil properties such as particle size distribution and dry density. Second, a three-stage model is proposed to characterize the attenuation of shear strength as a function of increasing water content. The three stages are governed by fundamentally different microstructural mechanisms, and water contents of 20% and 27% are identified as the critical threshold that distinguishes cementation-controlled mechanical behavior from friction-dominated response. In summary, these findings encompass pore-scale structural response, strength attenuation characteristics, and critical failure thresholds, providing a more comprehensive and quantitative understanding of the micro-mechanisms that govern loess deformation and failure under varying water content and confining pressure conditions.
In engineering practice, engineering measures aimed at preserving or restoring cohesion are likely to be more effective than those focusing solely on friction angle enhancement [55,56,57]. Furthermore, based on the three-stage mechanisms and threshold analysis established in this study, practical and quantifiable criteria can be provided for early-warning systems in loess regions, particularly in areas where irrigation activities or high-intensity rainfall may trigger rapid wetting-induced deformation.
Limitations of this study should be acknowledged, and further research is needed to address them. First, the thresholds identified in this study are derived from loess of the Dongzhi tableland, and their generalizability to loess deposits in other regions (including Yan’an, Lanzhou, and Heifangtai) with varying clay content, carbonate cement content, and pore structure remains to be validated through regional comparative investigations. Second, the quantitative particle analysis relies on 2D SEM images, which inherently limit the characterization of three-dimensional particle morphology and spatial arrangement. Future research should therefore employ micro-computed tomography (μ-CT) to confirm and extend the observations presented in this study.
5. Conclusions
This study systematically investigated the macroscopic deformation characteristics and microstructural evolution of intact Q3 Malan loess from the Dongzhi tableland under varying water contents (9%, 20%, 27%, and 30%) and confining pressures (50, 100, and 200 kPa) through integrated CD triaxial testing, SEM, and MIP analyses. The following conclusions are drawn:
- (1)
- The shear strength of loess increases with increasing confining pressure and decreases with increasing water content. As water content increases, cohesion decreases in a quadratic manner, and the internal friction angle decreases nearly linearly. MIP and SEM results reveal that confining pressure enhances shear strength primarily by increasing interparticle friction. With increasing confining pressure, macropores and mesopores collapse (mainly > 3.85 μm), particle contact area increases, and the compaction effect enhances interparticle friction and interlocking, though it has limited influence on intra-aggregate pores. Water content weakens shear strength primarily through cohesion loss. As water content increases, pores gradually shift toward smaller sizes. When water content exceeds 27%, approximately 70% of the macropores and mesopores disappear, and the rounding effect simultaneously reduces interparticle friction.
- (2)
- The attenuation of shear strength with increasing water content follows an exponential trend. Based on the microstructural evolution and the attenuation rate of shear strength under different water content, the mechanism of water content influence on shear strength can be categorized into three stages: stage I (water content 9–20%, rapid cement degradation), stage II (water content 20–27%, cement nearly depleted with friction gradually dominating), and stage III (water content > 27%, slow friction attenuation). A water content of 20% is identified as the critical threshold distinguishing cementation-controlled from friction-dominated behavior. Beyond 27% water content, the strength is almost entirely provided by friction.
- (3)
- The failure modes of loess samples are jointly governed by microstructural evolution, crack development, confining pressure, and water content conditions, and can be classified into three types: shear failure, homogeneous failure, and plastic failure. Shear failure occurs under low confining pressure and low water content, characterized by point contact rupture, microcrack propagation, and coalescence into shear bands, with strain softening resulting from cementation loss exceeding compaction gain. Homogeneous failure occurs under high confining pressure or intermediate water content, characterized by dispersed microcracking, extensive overhead pore collapse, and particle densification, with strain hardening resulting from compaction gain exceeding cracking loss. Plastic failure occurs under high water content and low confining pressure, characterized by cement dissolution, particle agglomeration, and radial bulging, with weak hardening behavior.
- (4)
- The macroscopic shear behavior of loess essentially represents the continuous microstructural transition from an open metastable overhead structure to a densified interlocked-cementation structure under loading and wetting. This evolution follows a progressive sequence: cementation degradation and particle movement trigger inter-aggregate pore collapse, accompanied by microcrack initiation and propagation. These changes collectively govern the attenuation of cohesion and friction angle, ultimately determining the failure mode and post-peak deformation characteristics.
Author Contributions
Conceptualization, T.W. and X.C.; methodology, T.W. and X.C.; writing—original draft preparation, T.W. and P.L.; funding acquisition, T.W.; data curation, X.C. and J.Y. All authors have read and agreed to the published version of the manuscript.
Funding
This work has been supported by the National Natural Science Foundation of China (No. 42330704, 42102305).
Data Availability Statement
The original contributions presented in this study are included in the article. Further inquiries can be directed to the corresponding author.
Acknowledgments
The authors would like to thank the reviewers and the editors for their valuable comments, which improved the quality of this paper.
Conflicts of Interest
The authors declare no conflicts of interest.
Abbreviations
The following abbreviations are used in this manuscript:
| SEM | Scanning Electron Microscopy |
| MIP | Mercury Intrusion Porosimetry |
| CT | Computed Tomography |
| CD | Consolidated-drained |
| IPP | Image-Pro-Plus |
References
- Deng, L.S.; Fan, W.; Yin, Y.P.; Cao, Y.B. Case Study of a Collapse Investigation of Loess Sites Covered by Very Thick Loess-Paleosol Interbedded Strata. Int. J. Geomech. 2018, 18, 05018009. [Google Scholar] [CrossRef] [Scilit]
- Hu, A.; Peng, Y.; Liu, W.; Zhang, H. Gully stabilization and loess-platform protection against headward erosion. Environ. Earth Sci. 2024, 83, 65. [Google Scholar] [CrossRef] [Scilit]
- Wang, G.L.; Li, T.L.; Xing, X.L.; Zou, Y. Research on loess flow-slides induced by rainfall in July 2013 in Yan’an, NW China. Environ. Earth Sci. 2015, 73, 7933–7944. [Google Scholar] [CrossRef] [Scilit]
- Zhang, F.Y.; Wang, G.H. Effect of irrigation-induced densification on the post-failure behavior of loess flowslides occurring on the Heifangtai area, Gansu, China. Eng. Geol. 2018, 236, 111–118. [Google Scholar] [CrossRef] [Scilit]
- Zhang, X.Z.; Lu, Y.D.; Li, X.; Lu, Y.C.; Pan, W.S. Microscopic structure changes of Malan loess after humidification in South Jingyang Plateau, China. Environ. Earth Sci. 2019, 78, 287. [Google Scholar] [CrossRef] [Scilit]
- Li, X.A.; Li, L.C.; Song, Y.X.; Hong, B.; Wang, L.; Sun, J.Q. Characterization of the mechanisms underlying loess collapsibility for land-creation project in Shaanxi Province, China—A study from a micro perspective. Eng. Geol. 2019, 249, 77–88. [Google Scholar] [CrossRef] [Scilit]
- Li, Y.R.; Shi, W.H.; Aydin, A.; Beroya-Eitner, M.A.; Gao, G.H. Loess genesis and worldwide distribution. Earth Sci. Rev. 2020, 201, 102947. [Google Scholar] [CrossRef] [Scilit]
- Zhu, Y.F.; Fan, W.; Liang, J.Y. Effects of realistic particle morphology on mechanical behaviors of loess with discrete element analyses. Environ. Earth Sci. 2024, 83, 544. [Google Scholar] [CrossRef] [Scilit]
- Li, Y.R.; He, S.D.; Deng, X.H.; Xu, Y.X. Characterization of macropore structure of Malan loess in NW China based on 3D pipe models constructed by using computed tomography technology. J. Asian Earth Sci. 2018, 154, 271–279. [Google Scholar] [CrossRef] [Scilit]
- Li, P.; Xie, W.L.; Pak, R.Y.S.; Vanapalli, S.K. Microstructural evolution of loess soils from the Loess Plateau of China. Catena 2019, 173, 276–288. [Google Scholar] [CrossRef] [Scilit]
- Zhou, G.P.; Xu, L.; Huang, X.L.; Li, Y.; Zhang, H.F.; Dong, Y. Synergistic effect of rainfall and pipe leakage erosion on the formation and development of loess caves in Weinan city, Loess Plateau, Northwest China. Environ. Earth Sci. 2023, 82, 435. [Google Scholar] [CrossRef] [Scilit]
- Fan, W.; Deng, L.S.; Yuan, W.N. Double parameter binary-medium model of fissured loess. Eng. Geol. 2018, 236, 22–28. [Google Scholar] [CrossRef] [Scilit]
- Yates, K.; Fenton, C.H.; Bell, D.H. A review of the geotechnical characteristics of loess and loess-derived soils from Canterbury, South Island, New Zealand. Eng. Geol. 2018, 236, 11–21. [Google Scholar] [CrossRef] [Scilit]
- Hu, R.L.; Yeung, M.R.; Lee, C.F.; Wang, S.J. Mechanical behavior and microstructural variation of loess under dynamic compaction. Eng. Geol. 2001, 59, 203–217. [Google Scholar] [CrossRef] [Scilit]
- Wen, B.P.; Yan, Y.J. Influence of structure on shear characteristics of the unsaturated loess in Lanzhou, China. Eng. Geol. 2014, 168, 46–58. [Google Scholar] [CrossRef] [Scilit]
- Jiang, M.J.; Zhang, F.G.; Hu, H.J.; Cui, Y.J.; Peng, J.B. Structural characterization of natural loess and remolded loess under triaxial tests. Eng. Geol. 2014, 181, 249–260. [Google Scholar] [CrossRef] [Scilit]
- Yuan, W.N.; Fan, W.; Jiang, C.C.; Peng, X.L. Experimental study on the shear behavior of loess and paleosol based on ring shear tests. Eng. Geol. 2019, 250, 11–20. [Google Scholar] [CrossRef] [Scilit]
- Ge, M.M.; Pineda, J.A.; Sheng, D.C.; Burton, G.J.; Li, N. Collapse behaviour of compacted loess: Role of the stress level on soil microstructure. Jpn. Geotech. Soc. Spec. Publ. 2019, 7, 209–214. [Google Scholar] [CrossRef] [Scilit]
- Xie, Q.Y.; Huang, Q.B.; Liu, Y.; Wang, Z.Z.; Yu, D.J.; Peng, J.B. Strength behaviors of undisturbed Malan loess under rainfall leaching in Yan’an area, China. Bull. Eng. Geol. Environ. 2023, 82, 53. [Google Scholar] [CrossRef] [Scilit]
- Wang, Y.; Yang, H.; Jing, X. Structural Characteristics of Natural Loess in Northwest China and its Effect on Shear Behavior. Geotech. Geol. Eng. 2021, 39, 65–78. [Google Scholar] [CrossRef] [Scilit]
- Xu, P.P.; Qian, H.; Chen, J.; Wang, L.B.; Abliz, X.; He, X.Q.; Ma, G.X.; Liu, Y. New insights into microstructure evolution mechanism of compacted loess and its engineering implications. Bull. Eng. Geol. Environ. 2023, 82, 36. [Google Scholar] [CrossRef] [Scilit]
- Wei, T.T.; Wu, Z.J.; Chen, Y.P.; Luo, L. Three-dimensional characterization and quantitative research of Malan loess microstructure under seismic loading. Front. Earth Sci. 2023, 10, 1106168. [Google Scholar] [CrossRef] [Scilit]
- Huo, A.D.; Peng, J.B.; Cheng, Y.X.; Luo, P.P.; Zhao, Z.X.; Zheng, C.L. Hydrological Analysis of Loess Plateau Highland Control Schemes in Dongzhi Plateau. Front. Earth Sci. 2020, 8, 528632. [Google Scholar] [CrossRef] [Scilit]
- Zhao, J.B.; Luo, X.Q.; Ma, Y.D.; Shao, T.J.; Yue, Y.L. Soil characteristics and new formation model of loess on the Chinese Loess Plateau. Geosci. J. 2017, 21, 607–616. [Google Scholar] [CrossRef] [Scilit]
- Zuo, L.; Xu, L.; Baudet, B.A.; Gao, C.Y.; Huang, C. Small-strain shear stiffness anisotropy of a saturated clayey loess. Géotechnique 2022, 74, 325–336. [Google Scholar] [CrossRef] [Scilit]
- Zhao, J.B.; Ma, Y.D.; Cao, J.J.; Wei, J.P.; Shao, T.J. Effect of Quaternary climatic change on modern hydrological systems in the southern Chinese Loess Plateau. Environ. Earth Sci. 2015, 73, 1161–1167. [Google Scholar] [CrossRef] [Scilit]
- Jiang, M.J.; Li, T.; Thornton, C.; Hu, H.J. Wetting-induced collapse behavior of unsaturated and structural loess under biaxial tests using distinct element method. Int. J. Geomech. 2017, 17, 06016010. [Google Scholar] [CrossRef] [Scilit]
- Leng, Y.Q.; Peng, J.B.; Wang, S.; Lu, F. Development of water sensitivity index of loess from its mechanical properties. Eng. Geol. 2021, 280, 105918. [Google Scholar] [CrossRef] [Scilit]
- Zhu, J.H.; Zhang, H.Y.; Yang, S.Q.; Wang, T.T.; Zhou, G.P. Physico-mechanical properties of loess-paleosol sequence from Q4 to Q1 strata in the Chinese Loess Plateau. Bull. Eng. Geol. Environ. 2022, 81, 416. [Google Scholar] [CrossRef] [Scilit]
- He, R.X.; Hao, Y.Z.; Zhou, Z.W. Experimental study on the dynamic properties of undisturbed loess under moistening conditions in Zhengzhou, China. Bull. Eng. Geol. Environ. 2024, 83, 186. [Google Scholar] [CrossRef] [Scilit]
- Fu, W.Y.; Liu, D.R.; Wang, X.; Li, J.D.; Ma, Y. Water vapor adsorption characteristics of unsaturated loess. J. Civ. Environ. Eng. 2025, 47, 80–88. [Google Scholar] [CrossRef]
- Zhang, Y.; Zhou, C.H.; Bian, M.S.; Li, Z.F.; Fan, X.Y. A new method for predicting the shear strength of loess based on moisture content and large and medium pore volume. Sci. Rep. 2026, 16, 6602. [Google Scholar] [CrossRef] [Scilit]
- Wang, L.Q.; Li, K.Y.; Wang, Z.; Li, L. Description and prediction of stress-strain curve of loess. Eng. Geol. 2022, 308, 106827. [Google Scholar] [CrossRef] [Scilit]
- Li, J.G.; Chen, Z.H.; Huang, X.F.; Zhang, L.M.; Yao, Z.H. CT-triaxial shear tests on the meso-structure evolution and strength of unsaturated loess Q3 during unloading confining pressure. Rock Soil Mech. 2010, 31, 1084–1091. [Google Scholar] [CrossRef]
- Wei, T.T.; Fan, W.; Yuan, W.N.; Wei, Y.N.; Yu, B. Three-dimensional pore network characterization of loess and paleosol stratigraphy from South Jingyang Plateau, China. Environ. Earth Sci. 2019, 78, 333. [Google Scholar] [CrossRef] [Scilit]
- Xu, P.P.; Zhang, Q.Y.; Qian, H.; Yang, Q.Y.; Li, W.Q.; Li, Y.B. SEM-based multi-level pore characteristics a case study of remolded loess. J. Eng. Geol. 2023, 31, 1799–1810. [Google Scholar] [CrossRef]
- Liu, X.; Miao, X.Q.; Qin, Z.H.; Huang, G.J.; Lan, H.X. Shear behavior of loess: The role of drainage condition. Eng. Geol. 2022, 309, 106835. [Google Scholar] [CrossRef] [Scilit]
- Koutsoftas, D.C. A Study of the Drained Strength Characteristics of Overconsolidated Clays at Low Effective Stresses. J. Geotech. Geoenviron. Eng. 2024, 150, 04024004. [Google Scholar] [CrossRef] [Scilit]
- Lian, B.Q.; Peng, J.B.; Zhan, H.B.; Wang, X.G. Mechanical response of root-reinforced loess with various water contents. Soil Tillage Res. 2019, 193, 85–94. [Google Scholar] [CrossRef] [Scilit]
- Luo, H.; Wu, F.Q.; Chang, J.Y.; Xu, J.B. Microstructural constraints on geotechnical properties of Malan Loess: A case study from Zhaojiaan landslide in Shaanxi province, China. Eng. Geol. 2018, 236, 60–69. [Google Scholar] [CrossRef] [Scilit]
- Xing, X.L.; Li, T.L.; Fu, Y.K. Determination of the related strength parameters of unsaturated loess with conventional triaxial test. Environ. Earth Sci. 2016, 75, 82. [Google Scholar] [CrossRef] [Scilit]
- Nie, Y.P.; Ni, W.K.; Lü, X.F.; Tuo, W.X.; Yuan, K.Z. Macroscopic mechanical behavior and microstructural evolution of compacted loess in the Chinese Loess Plateau. Soil Tillage Res. 2023, 232, 105767. [Google Scholar] [CrossRef] [Scilit]
- Bao, L.L.; Wei, F. Macroscopic and microscopic analysis of the effects of moisture content and dry density on the strength of loess. Sci. Prog. 2024, 107, 368504241261592. [Google Scholar] [CrossRef] [Scilit]
- Mandelbrot, B.B. Self-affine fractals and fractal dimension. Phys. Scr. 1985, 32, 257–260. [Google Scholar] [CrossRef] [Scilit]
- Nan, J.J.; Peng, J.B.; Zhu, F.J.; Ma, P.H.; Liu, R.; Leng, Y.Q.; Meng, Z.J. Shear behavior and microstructural variation in loess from the Yan’an area, China. Eng. Geol. 2021, 280, 105964. [Google Scholar] [CrossRef] [Scilit]
- Rao, S.M. Role of apparent cohesion in the stability of Dominician allophane soil slopes. Eng. Geol. 1996, 43, 265–279. [Google Scholar] [CrossRef] [Scilit]
- Zhong, Z.L.; Liu, Y.X.; Liu, X.R.; Li, X.Y.; Wang, S. Influence of moisture content on shearing strength of unsaturated undisturbed quaternary system middle pleistocene. J. Cent. South Univ. 2015, 22, 2776–2782. [Google Scholar] [CrossRef] [Scilit]
- Guo, L.X.; Chen, G.Q.; Gao, J.Y.; Li, C.Z. Micro-scale analysis on shear characteristics of unsaturated soil by considering capillary suction and adsorption suction based on DDA. Eng. Anal. Bound. Elem. 2021, 132, 321–334. [Google Scholar] [CrossRef] [Scilit]
- Wei, Y.N.; Fan, W.; Yu, B.; Deng, L.S.; Wei, T.T. Characterization and evolution of three-dimensional microstructure of Malan loess. Catena 2020, 192, 104585. [Google Scholar] [CrossRef] [Scilit]
- Xing, X.L.; Li, T.L.; Li, P.; Fu, Y.K.; Xi, Y. Variation regularities of loess shear strength with the moisture content. Hydrogeol. Eng. Geol. 2014, 41, 53–59+97. [Google Scholar] [CrossRef]
- Chen, H.E.; Jiang, Y.L.; Gao, Y.; Yuan, X.Q. Structural characteristics and its influencing factors of typical loess. Bull. Eng. Geol. Environ. 2018, 78, 4893–4905. [Google Scholar] [CrossRef] [Scilit]
- Wei, T.T.; Zhou, Y.Y.; Fang, J.N.; Fan, W. Loess shear failure micro-mechanisms: Insights from pre- and post-shear microstructural changes and sensitivity analysis. Eng. Geol. 2010, 357, 108345. [Google Scholar] [CrossRef] [Scilit]
- Li, P.; Shao, S.J.; Xiao, T.; Zhu, D.D. Pore-Size Distribution Evolution of Intact, Compacted, and Saturated Loess from China during Consolidation and Shearing. Adv. Civ. Eng. 2021, 2021, 644471. [Google Scholar] [CrossRef] [Scilit]
- Qin, P.J.; Guo, H.R.; Li, Y.R.; Zhang, J.; Lu, Y.; Sun, Y.F. Shear behavior and microstructural evolution of Malan loess under climate-induced wetting and drying cycles. J. Rock Mech. Geotech. Eng. 2025, 18, 2122–2141. [Google Scholar] [CrossRef] [Scilit]
- Meng, S.Y.; Zhao, G.Q.; Yang, Y.Y. Impact of Plant Root Morphology on Rooted-Soil Shear Resistance Using Triaxial Testing. Adv. Civ. Eng. 2020, 2020, 8825828. [Google Scholar] [CrossRef] [Scilit]
- Li, X.; Tang, S.Y.Q.; Zheng, Y.; Liu, J.; Wang, L.J.; He, K.Y.; Jiang, T. Influence of the matrix of the soil-rock mixture on deformation and failure behaviors of the slope based on material point method. Front. Earth Sci. 2022, 10, 997928. [Google Scholar] [CrossRef] [Scilit]
- Zhou, M.X.; Li, Y.B.; Zhang, K.; Jia, C.; Sun, Y.; Wang, N.; Liu, C. Species-specific contributions of root length and weight density to soil cohesion and stability in forest ecosystems. Appl. Ecol. Environ. Res. 2025, 23, 1687–1702. [Google Scholar] [CrossRef] [Scilit]

Disclaimer/Publisher’s Note: The statements, opinions and data contained in all publications are solely those of the individual author(s) and contributor(s) and not of MDPI and/or the editor(s). MDPI and/or the editor(s) disclaim responsibility for any injury to people or property resulting from any ideas, methods, instructions or products referred to in the content. |
© 2026 by the authors. Licensee MDPI, Basel, Switzerland. This article is an open access article distributed under the terms and conditions of the Creative Commons Attribution (CC BY) license.