Article

Locally Assembled, Cost-Effective Creepmeters for Monitoring Aseismic Creep Displacement Along the West Valley Fault (Philippines)


by
Rolly E. Rimando
*,
Deo Carlo E. Llamas
and
Bryan J. Marfito
Department of Science and Technology-Philippine Institute of Volcanology and Seismology (DOST-PHIVOLCS), Diliman, Quezon City 1101, Philippines
*
Author to whom correspondence should be addressed.
GeoHazards 2026, 7(3), 96; https://doi.org/10.3390/geohazards7030096
Submission received: 18 June 2026 / Revised: 28 July 2026 / Accepted: 3 August 2026 / Published: 6 August 2026

Abstract

Arduino-based creepmeters utilizing a Linear Variable Differential Transformer (LVDT) and ultrasonic sensors were fabricated to monitor displacement changes along the creeping segment of the West Valley Fault (WVF) in southeastern Metro Manila, Philippines. Along with a custom-assembled, Arduino-based rain gauge, these instruments were initially intended to prevent data gaps during the COVID-19 pandemic when commercial data recorders experienced operational downtime. However, they have since proven to be cost-effective alternatives for determining short-term slip rates and monitoring displacement variations driven by episodic and seasonal precipitation changes. The LVDT creepmeter provides higher accuracy for displacement and slip rate determination. Conversely, the ultrasonic creepmeter is better suited for tracking abrupt displacement changes and, to some extent, longer-term displacement trends as it is more sensitive to environmental conditions. Deploying low-cost monitoring instruments in active fault regions bridges critical data gaps and improves the understanding of creep triggers and mechanisms. Although vertical creep occurs along pre-existing tectonic features of the WVF creeping segment, our creepmeter monitoring reveals sustained, accelerated creep within its southern portion. This localized movement is driven primarily by nontectonic forces—chiefly groundwater extraction, with episodic and seasonal precipitation influences. Consequently, this implies a continued ground rupture hazard and the potential for induced seismicity.

1. Introduction

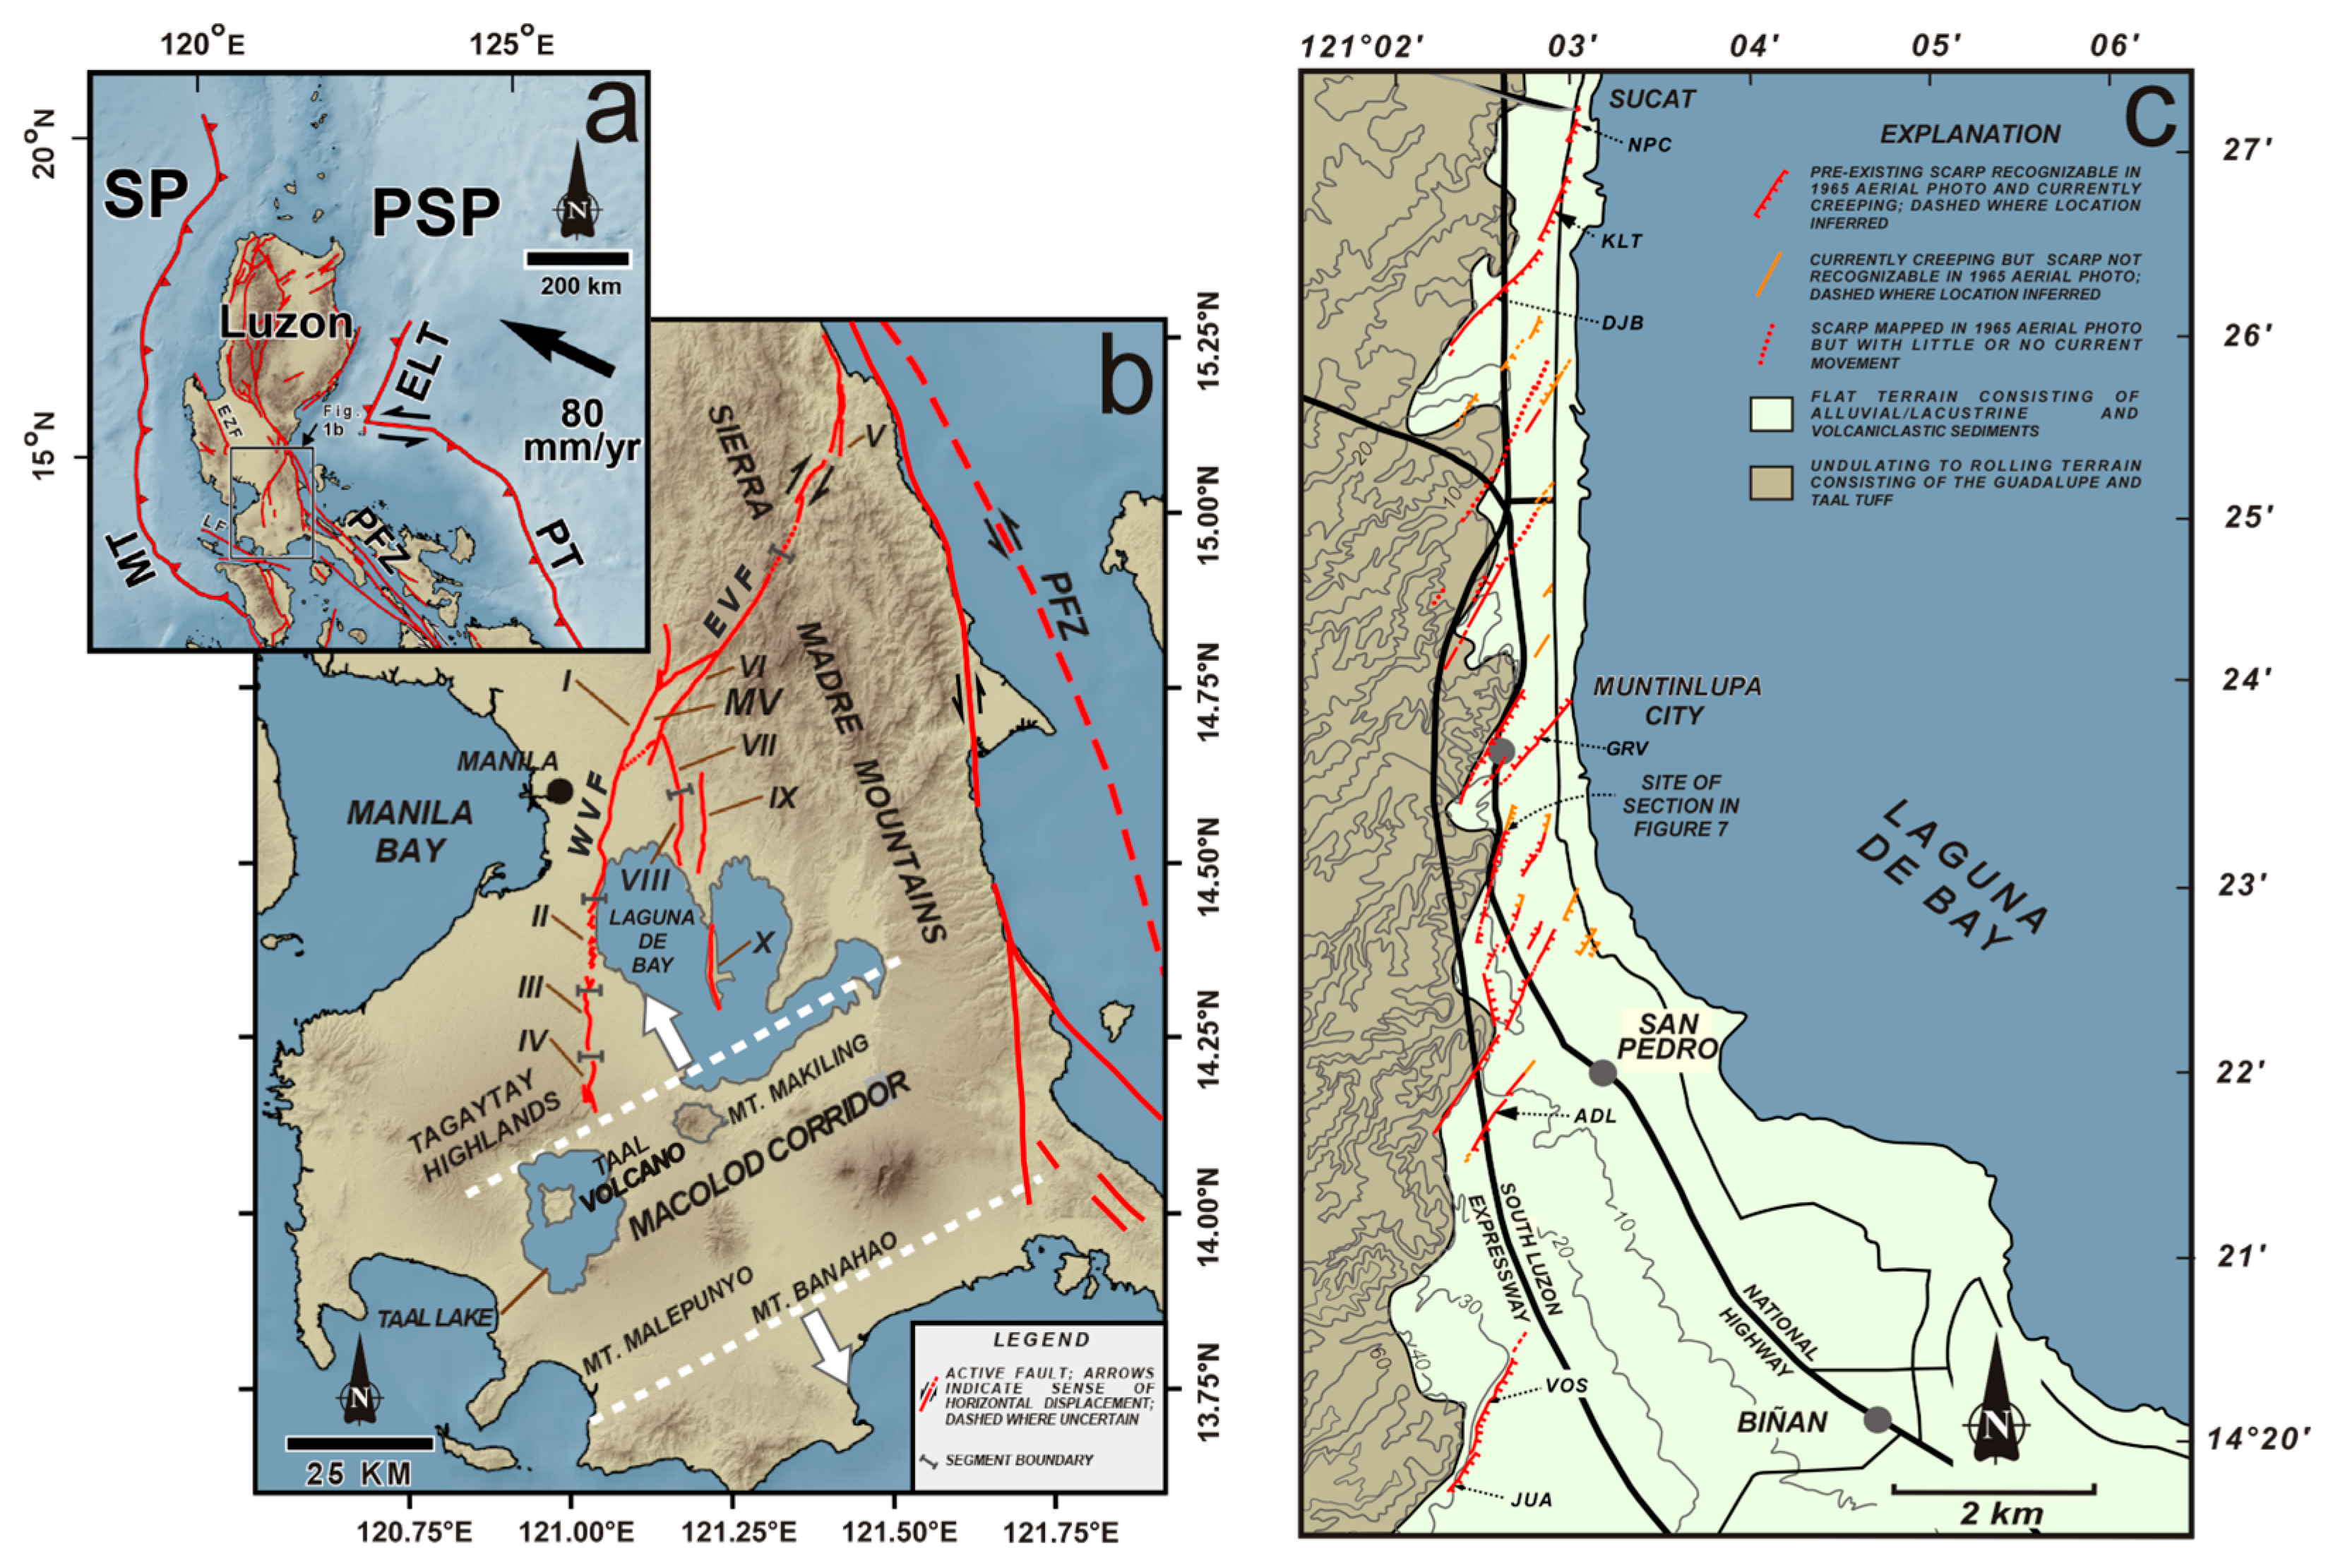
Since the 1990s, groundwater extraction has triggered vertical creep along segment II of the West Valley Fault (WVF; Figure 1a), which overlaps with southern Metro Manila [1,2,3,4,5,6]. This creeping zone comprises 15 northeast-oriented segments arranged en echelon, the majority of which align with pre-existing scarps (Figure 1b). Structural control of creep along segment II is also supported by paleoseismic mapping, which reveals that creep followed pre-existing tectonic structures, and by the occurrence of creep within the extensional gap between the right-stepping segments (I and III) of the oblique right-lateral strike-slip WVF [1,2,3,4,5]. The WVF creeping ruptures represent a surface-fault type of aseismic ground failure, clearly differing from tensile failure features. Though aseismic creep along segment II of the WVF is structurally controlled, its current creep behavior is believed to have been triggered by overextraction of groundwater. This theory was borne out by the high rates of slip [1,2,3] and by the spatial and temporal correlation of groundwater extraction with displacement obtained from precise leveling surveys that have been conducted since 1999 [3]. However, precise leveling alone is insufficient to isolate the contributions of other possible triggers (i.e., rainfall or seasonal precipitation variations) to total displacement.
Since creep was first reported in the 1990s, vertical slip rates along the creeping zone have reached up to 200 mm/yr (20 cm/yr)—significantly higher than known tectonic creep rates [1,2,3,4]. For comparison, tectonic creep along the central segment of the San Andreas Fault averages 22–26 mm/yr with a maximum rate of 35 mm/yr [7], while the Hayward and Calaveras faults move at rates up to 17 mm/yr [8,9,10,11]. Other examples of tectonic creep include the central segment of the Longitudinal Valley Fault in Taiwan (10–20 mm/yr) [12] and the North Anatolian Fault in Turkey (20 mm/yr) [13]. Although aseismic creep was first observed and measured with creepmeters on the San Andreas fault in the late 70s, the triggers and mechanisms that produce creep events are still not well understood.
By combining creepmeter and rain gauge data, researchers can reveal slip–precipitation correlations, quantify rainfall’s impact on slip, and clarify creep failure mechanisms. Additionally, deploying creepmeters tracks near-field displacements in the southern creeping zone for better hazard assessment. If creepmeters show continued accelerated creep, hazard plans must consider potential induced seismicity. This concern is backed by established theory and historical earthquakes caused by fluid extraction. According to the Mohr–Coulomb failure criterion, fault failure results when shear stress on the fault exceeds the frictional strength and normal (or clamping) stresses. Groundwater extraction reduces pore fluid pressure and increases effective normal stress, which initially inhibits fault failure [14,15]. However, aquifer compaction and the subsequent reduction in vertical water weight decrease normal stress, thereby promoting failure [16,17]. Even minor stress changes can deliver the critical increment needed to alter the timing and location of seismicity [18]. Consequently, the minuscule stress drops associated with anthropogenically induced earthquakes [18,19,20,21,22,23] are sufficient to modulate regional seismic activity [18,21,22,24].
Whether fault failure results in aseismic slip or seismicity depends on its frictional properties [25]. Pennington et al.’s [26] model of induced seismicity postulated the possibility of seismicity occurring along a creeping fault. According to the model, continued depressurization strengthens the fault by developing “barriers” and “asperities”. Barriers are high-strength, low-stress fault segments that resist slip, while asperities are highly stressed barriers that further oppose movement. Once effective stress overcomes this collective resistance, sudden failure triggers an earthquake. Consequently, ongoing extraction can foster larger barriers and asperities, increasing the magnitude of subsequent earthquakes [26]. Ultimately, seismicity driven by continued depressurization—via aseismic slip above the locking depth—depends heavily on local stress conditions and the evolution of these barriers and asperities. Both the time required for initial failure and the duration of each seismic cycle remain unknown.
Corresponding to the dilational jog of the WVF [4], the WVF creeping zone represents the surface expression of a large-scale barrier. Continued depressurization may cause this barrier to fail. This failure could induce static stress changes that increase stress in adjoining areas, hastening the failure of adjacent segments I and III.
Since 2008, creepmeters utilizing the Campbell Scientific CR510 data loggers and Linear Variable Differential Transformer (LVDT) sensors have been installed across selected segments of the creeping zone to monitor short-term displacement and near-field displacement changes and to determine the correlation (if any) with episodic rainfall and seasonal precipitation [27,28,29,30]. However, the COVID-19 pandemic in the early 2020s disrupted operations; travel restrictions led to maintenance issues and prevented foreign collaborators from providing necessary technical support. To bridge the resulting data gap, low-cost Arduino-based creepmeters—utilizing both LVDT and ultrasonic sensors—were fabricated using readily available components. Arduino provides a cost-effective alternative to expensive industrial monitoring gear, bringing disaster prevention within reach for developing regions. Because the code is open-source, users can easily customize it to meet their specific local needs.
Arduino-based systems integrated with sensors for temperature, soil drift, soil pressure, structural changes, tilt, rainfall, and other parameters have been crucial for data collection and alarm systems in agriculture and disaster preparedness [31,32,33,34,35,36,37]. Arduino boards also serve as the central processing unit for sensor networks that detect environmental and physical changes associated with earthquakes. For example, Arduino-based systems use high-sensitivity seismometers or accelerometers to detect ground vibrations [31]. These systems centrally process environmental data to provide early liquefaction warnings [35]. Monitoring prototypes utilizing Arduino also integrate sensors to measure soil moisture, rainfall, and slope stability to identify early signs of landslides [38,39,40,41].
While non-Arduino LVDT creepmeters are established tools for monitoring fault activity—with documented use in the U.S. [42], Taiwan [43,44], Italy [45], and Chile [46]—Arduino-based systems have remained virtually unexplored in this field. A notable exception is the work of Rimando et al. [6], who utilized both an Arduino-based LVDT and ultrasonic creepmeters to monitor the West Valley Fault. Furthermore, while LVDT-based systems are relatively common, the use of ultrasonic creepmeters remains exceptionally rare, regardless of the controller platform used.
Although Rimando et al. [6] presented preliminary monitoring data utilizing Arduino-based LVDT and ultrasonic creepmeters, the instrumentation aspects were not discussed in detail. In this paper, we present more recent results of monitoring using these creepmeters and the details of fabrication, programming, calibration and testing, and field deployment.
For performance assessment, these devices were deployed along the southern section of the WVF creeping zone in southeastern Metro Manila (Figure 1c). The creepmeters were installed in two sites in the southernmost segment of this creeping zone: Juana Subdivision (JUA) and Villa Olympia Subdivision (VOS; Figure 1c). These locations are characterized by ongoing high rates of both groundwater extraction and fault creep. We then evaluate the capability of each creepmeter, based on the data that they generated, in the estimation of displacement and the slip rate. The study correlates creep displacement data with precipitation measurements from an independent Zhafira rain gauge—an Arduino-based device assembled in tandem with the creepmeters. Rain gauges integrated with Arduino controllers have been utilized in agriculture, meteorology, hydrology, and disaster mitigation [34]. The Zhafira rain gauge system serves as a robust, high-performance alternative to expensive industry standards (e.g., Onset or Campbell Scientific) without requiring a detailed technical breakdown in this text. It is highly reliable, offering accuracy and resolution (0.1–0.2 mm) that surpass those of standard tipping-bucket rain gauges. The relevant schematics and programming code are provided herein for the sake of completeness.
Monitoring data from the new creepmeter systems enhance our understanding of fault behavior by isolating the contributions of seasonal and episodic slip from groundwater extraction and natural tectonic stress. Distinguishing the underlying causes of continuous creep displacement and their relative contributions to total slip will enable more informed decision-making regarding hazards associated with aseismic creep.
The use of indigenous creepmeters should reduce reliance on costly monitoring equipment and boost the monitoring not only of anthropogenic creep occurring elsewhere in the Philippines but also of tectonic creep and other phenomena requiring displacement monitoring.

2. Materials and Methods

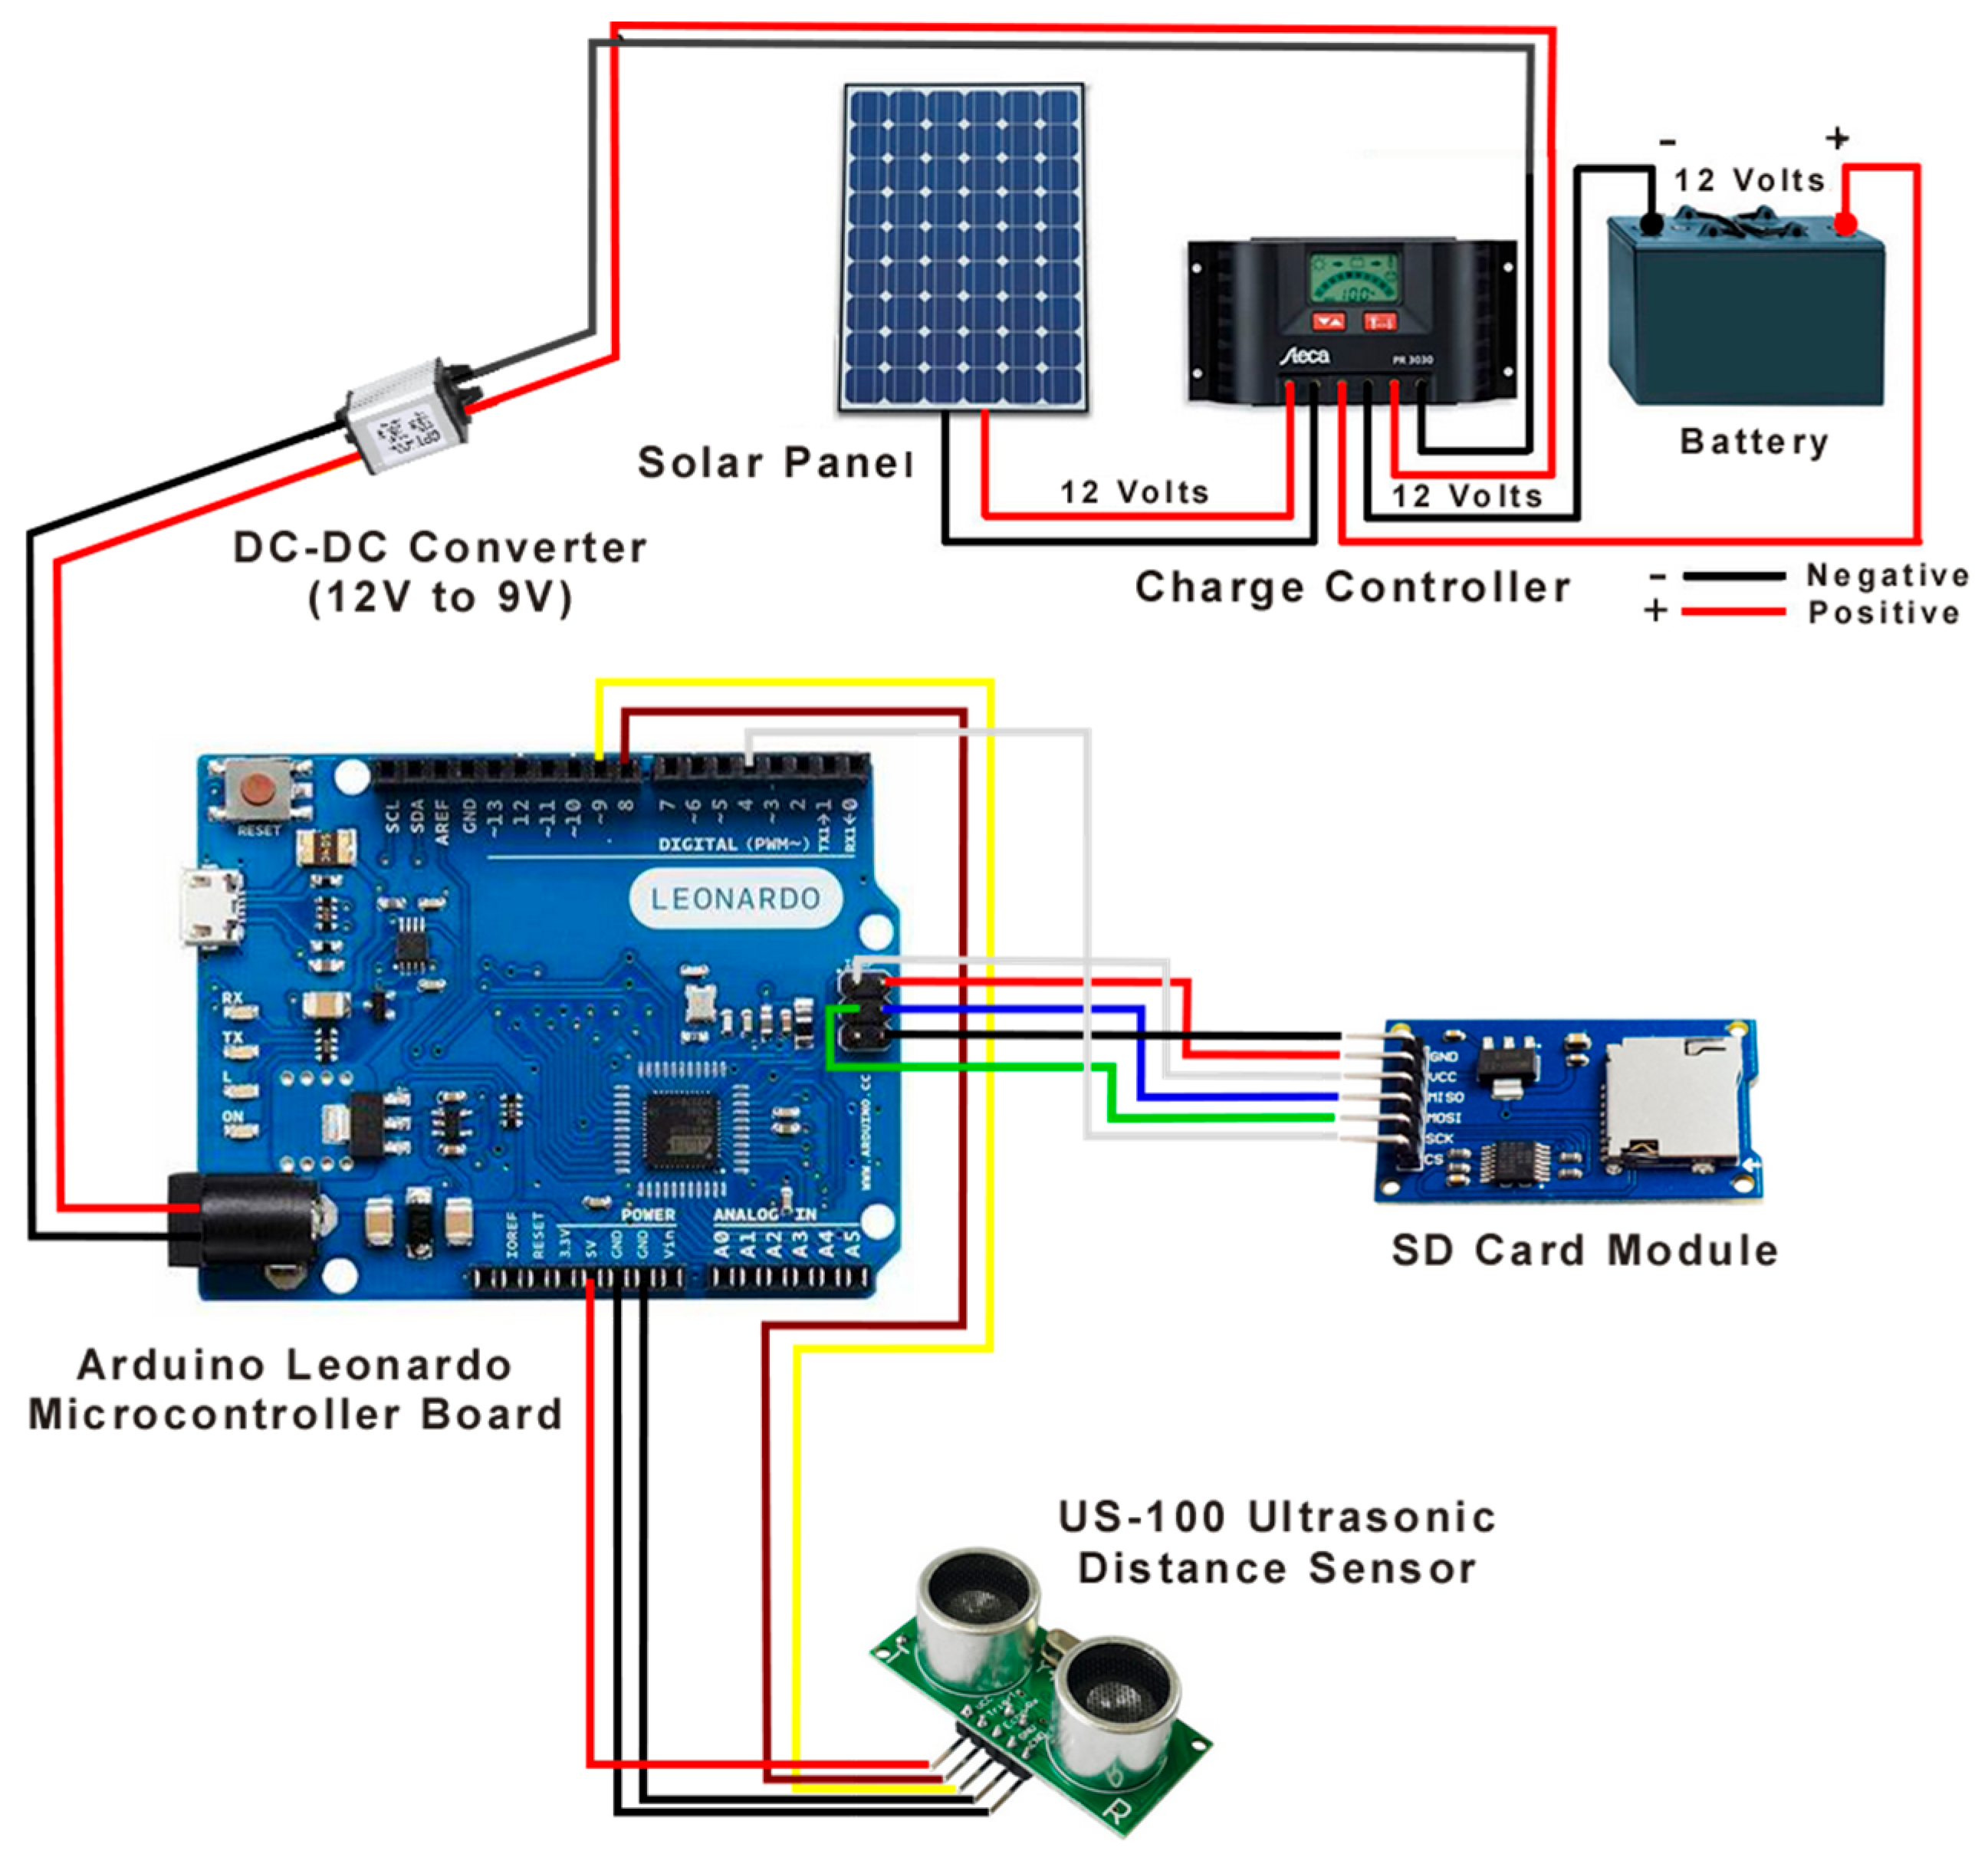
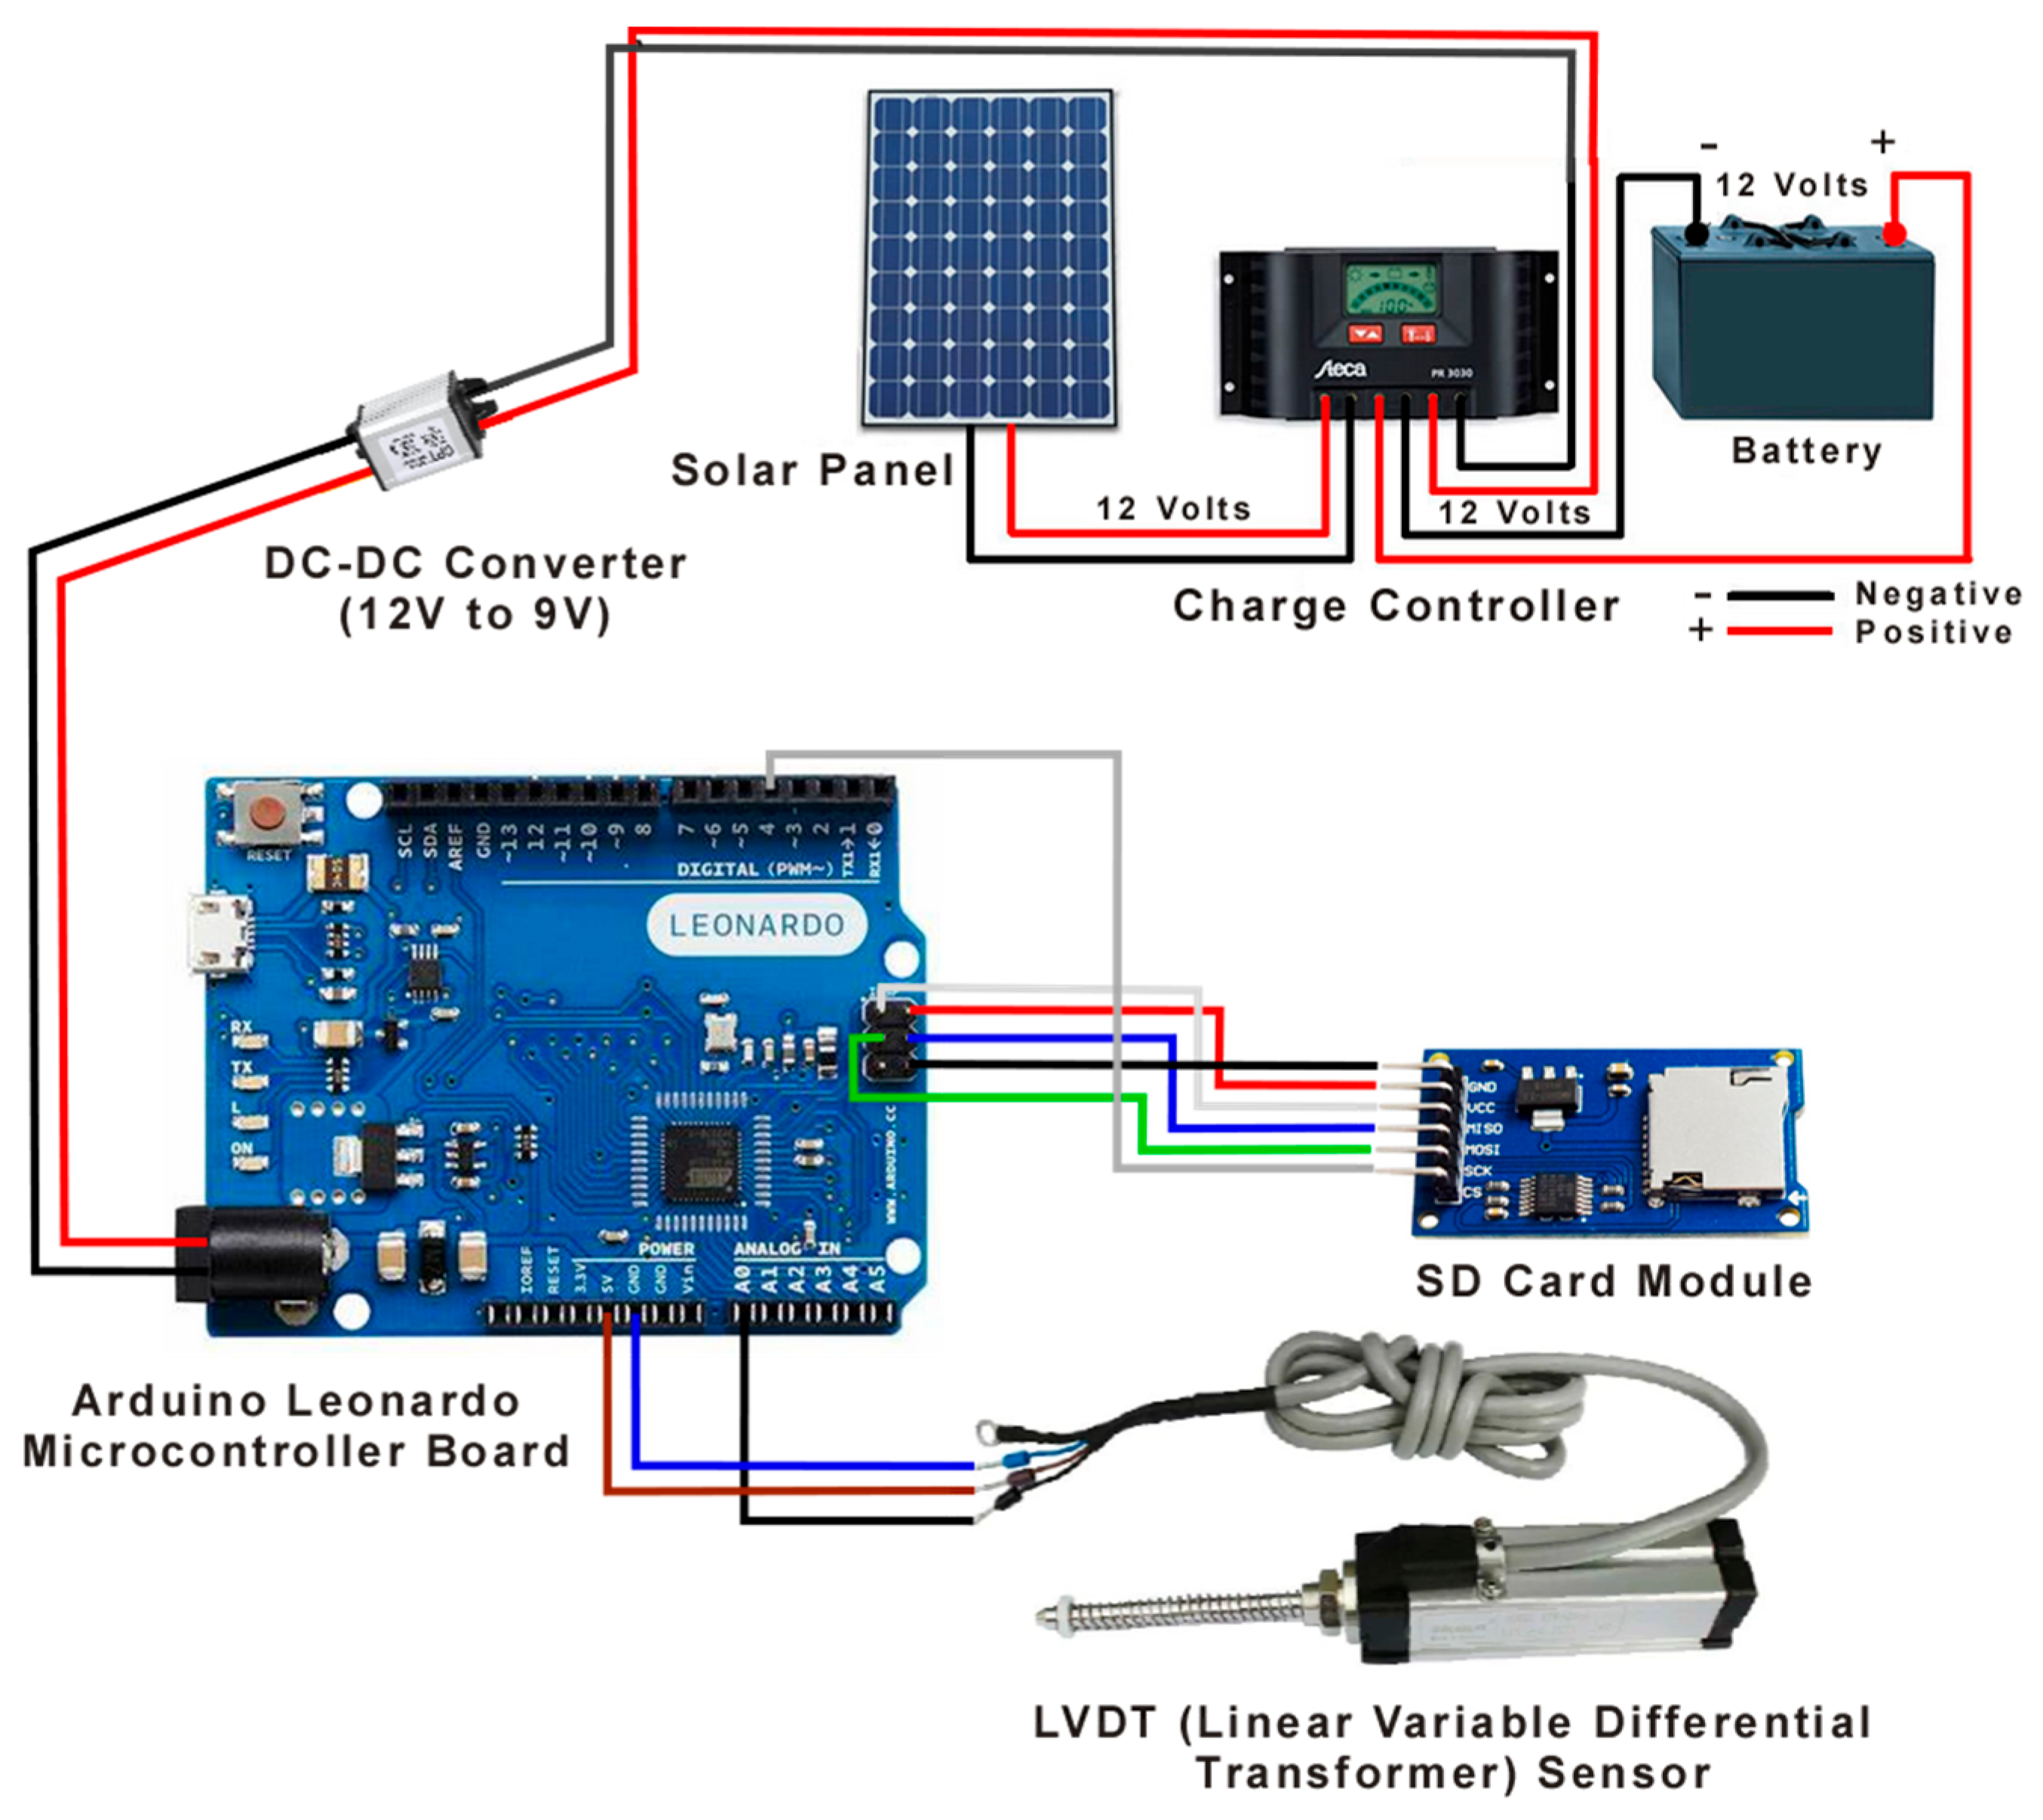
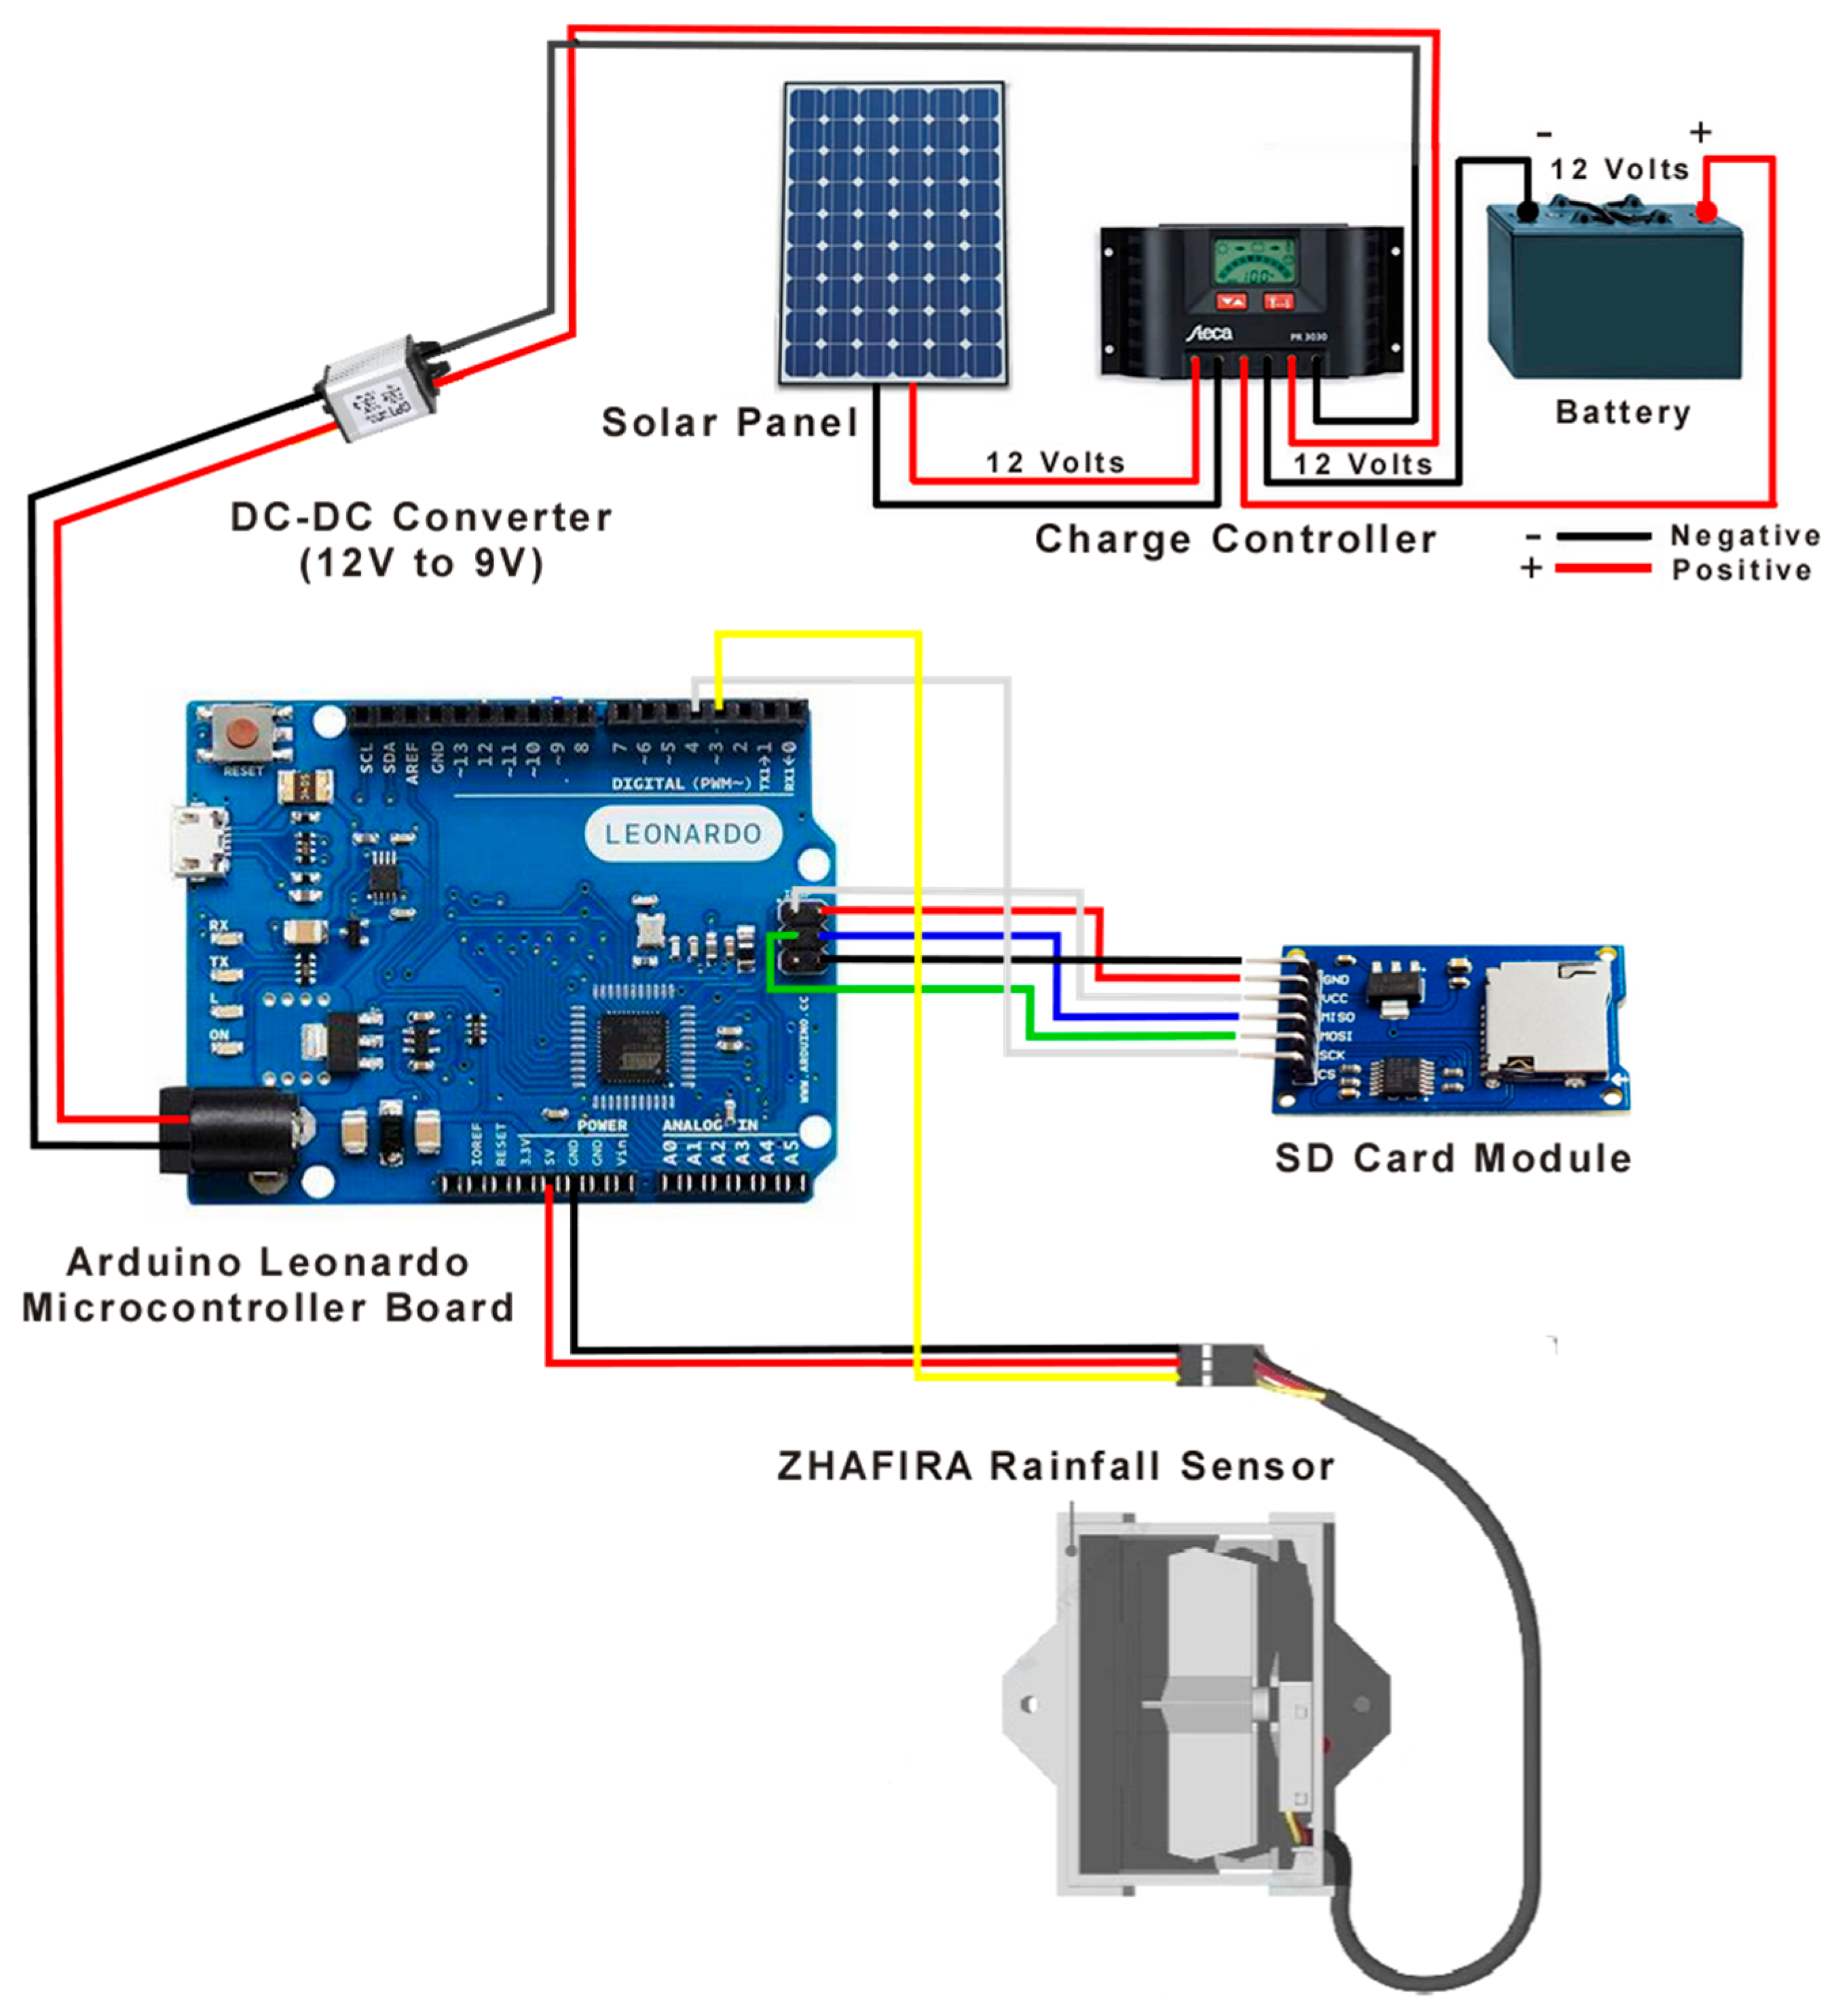
Ultrasonic and LVDT creepmeters were fabricated (Figure 2 and Figure 3) to monitor near-field creep displacement along the creeping zone. A rain gauge system (Figure 4) was also fabricated to record rainfall. These systems were chosen mainly for their cost-effectiveness and the readily available components needed for assembly. An LVDT sensor converts linear displacement into an electrical output signal. An ultrasonic creepmeter measures displacement using sound waves; it calculates distance based on the travel time of an ultrasonic signal sent and received by a US-100 sensor. These creepmeters are relatively easy to assemble, install, and operate.
Before field deployment, the creepmeters were calibrated and tested to determine distance-to-target equivalents and evaluate accuracy and reliability. While the maximum distance-to-target range of an LVDT creepmeter depends primarily on its sensor rod length, this step determines the optimum operating range for an ultrasonic creepmeter. Mechanically, the platforms for both the ultrasonic and LVDT creepmeters are aligned subparallel to the leveling survey lines. The next section provides comprehensive details on the setup configurations for both the creepmeters and the rain gauge.

2.1. Common Creepmeter and Rain Gauge Components

Except for their sensors and programming, the creepmeters and rain gauges share similar components.
  • Arduino Leonardo controller
The Arduino Leonardo is a microcontroller board based on the ATmega32u4, operating at 5 V with a 16 MHz crystal oscillator. It features 20 digital I/O pins, including 7 PWM outputs and 12 analog inputs. Built-in hardware includes a micro-USB port, a power jack, an ICSP header, and a reset button. While the board supports power via USB, an AC-to-DC adapter, or a battery within a recommended 7–12 V input range, this specific project uses a solar power system to charge a lead-acid battery. A DC-DC converter then steps down the 12 V battery output to a stable 9 V to power the board.
  • Micro SD storage board for storing displacement data
This Micro SD card reader module offers seamless integration, communicating via a standard 4-pin SPI interface (MOSI, SCK, MISO, and CS). Known for its simplicity and reliability, this user-friendly module is an ideal solution for efficient data logging and storage. It supports both 3.3 V and 5 V input voltages and features a push-pop socket for effortless SD card insertion and removal. Additionally, it can be securely mounted to a breadboard or prototyping frame using its 4 integrated mounting holes.
  • Solar power system
In addition, the creepmeter and rain gauge systems are equipped with solar power systems consisting of a 25/30-watt solar panel, a 12 V lead-acid battery, a solar charge controller, and a DC-DC converter (12 volts to 9 volts).

2.2. Creepmeter with Ultrasonic Sensor (US-100)

The ultrasonic creepmeter (Figure 2) uses an ultrasonic range finder (US-100), which measures distances up to 4.5 m by emitting sound waves and timing their echo. Unlike IR sensors, it is not affected by light or reflections, though sound-absorbing materials can impact its accuracy. To ensure precision, the module features built-in temperature compensation, adjusting its distance calculations based on how air temperature affects the speed of sound.
Among the key features of the US-100 Ultrasonic Range Finder Module is an easy-to-use serial interface and a pulse-width (Ping) interface. It has a 2–450 cm (15 feet) detection range and a 1 mm measurement resolution. It also has a built-in temperature sensor, equipped with a 15-degree field of view, and operates at 5 V.

2.3. Creepmeter with LVDT Sensor (KTR-100 Displacement Transducer)

The LVDT creepmeter sensor (Figure 3) is engineered for harsh environments. Featuring industrial-grade insulation and an IP65 rating, this dust-tight, water-resistant sensor operates reliably from −40 °C to +80 °C. Its durable design minimizes mechanical wear to ensure high accuracy, low maintenance, and a long operational lifespan. Furthermore, a spring-loaded, self-recovery mechanism automatically returns the core rod to its baseline position. While available with various probe options—including wheel and knife-edge heads—the model used in this study features a ball tip. It provides a 100 mm measurement range with ±0.1% accuracy, and requires an input voltage of 5 to 24 V DC.

2.4. Rain Gauge with 3D-Printed Tipping-Bucket Rainfall Sensor (Zhafira)

The rain gauge system (Figure 4) features a 3D-printed tipping-bucket sensor (Zhafira, Kreasi Elektra, Surabaya, East Java, Indonesia) designed for seamless integration with microcontrollers, such as the Arduino and ESP32, via I2C or UART interfaces. The Zhafira measures both volume and intensity using a calibrated ombrometer mechanism. Featuring a 0.7 mm resolution, this pulse-based design provides precise data across all conditions, from light drizzles to heavy storms. It is built from UV-resistant materials and features a hollow bottom for automatic drainage and long-term durability.

2.5. Programming

We used C++-based Arduino programming to operate the creepmeters. Arduino programs or sketches are written in the Arduino Integrated Development Environment—or Arduino Software (IDE, version 1.8.9)—which can be downloaded from the official Arduino website [47]. Information on the Arduino programming language can also be accessed from the Arduino website [48]. The Arduino IDE is a powerful tool for writing, uploading, and debugging code for Arduino boards, and instructions on its use are available on the Arduino documentation site [49]. The software can be used with any Arduino board to write and upload sketches. Supplementary Figure S1 shows the sketches for the LVDT creepmeter, ultrasonic creepmeter, and rain gauge.

3. Results and Discussion

3.1. Creepmeter Calibration, Testing and Deployment

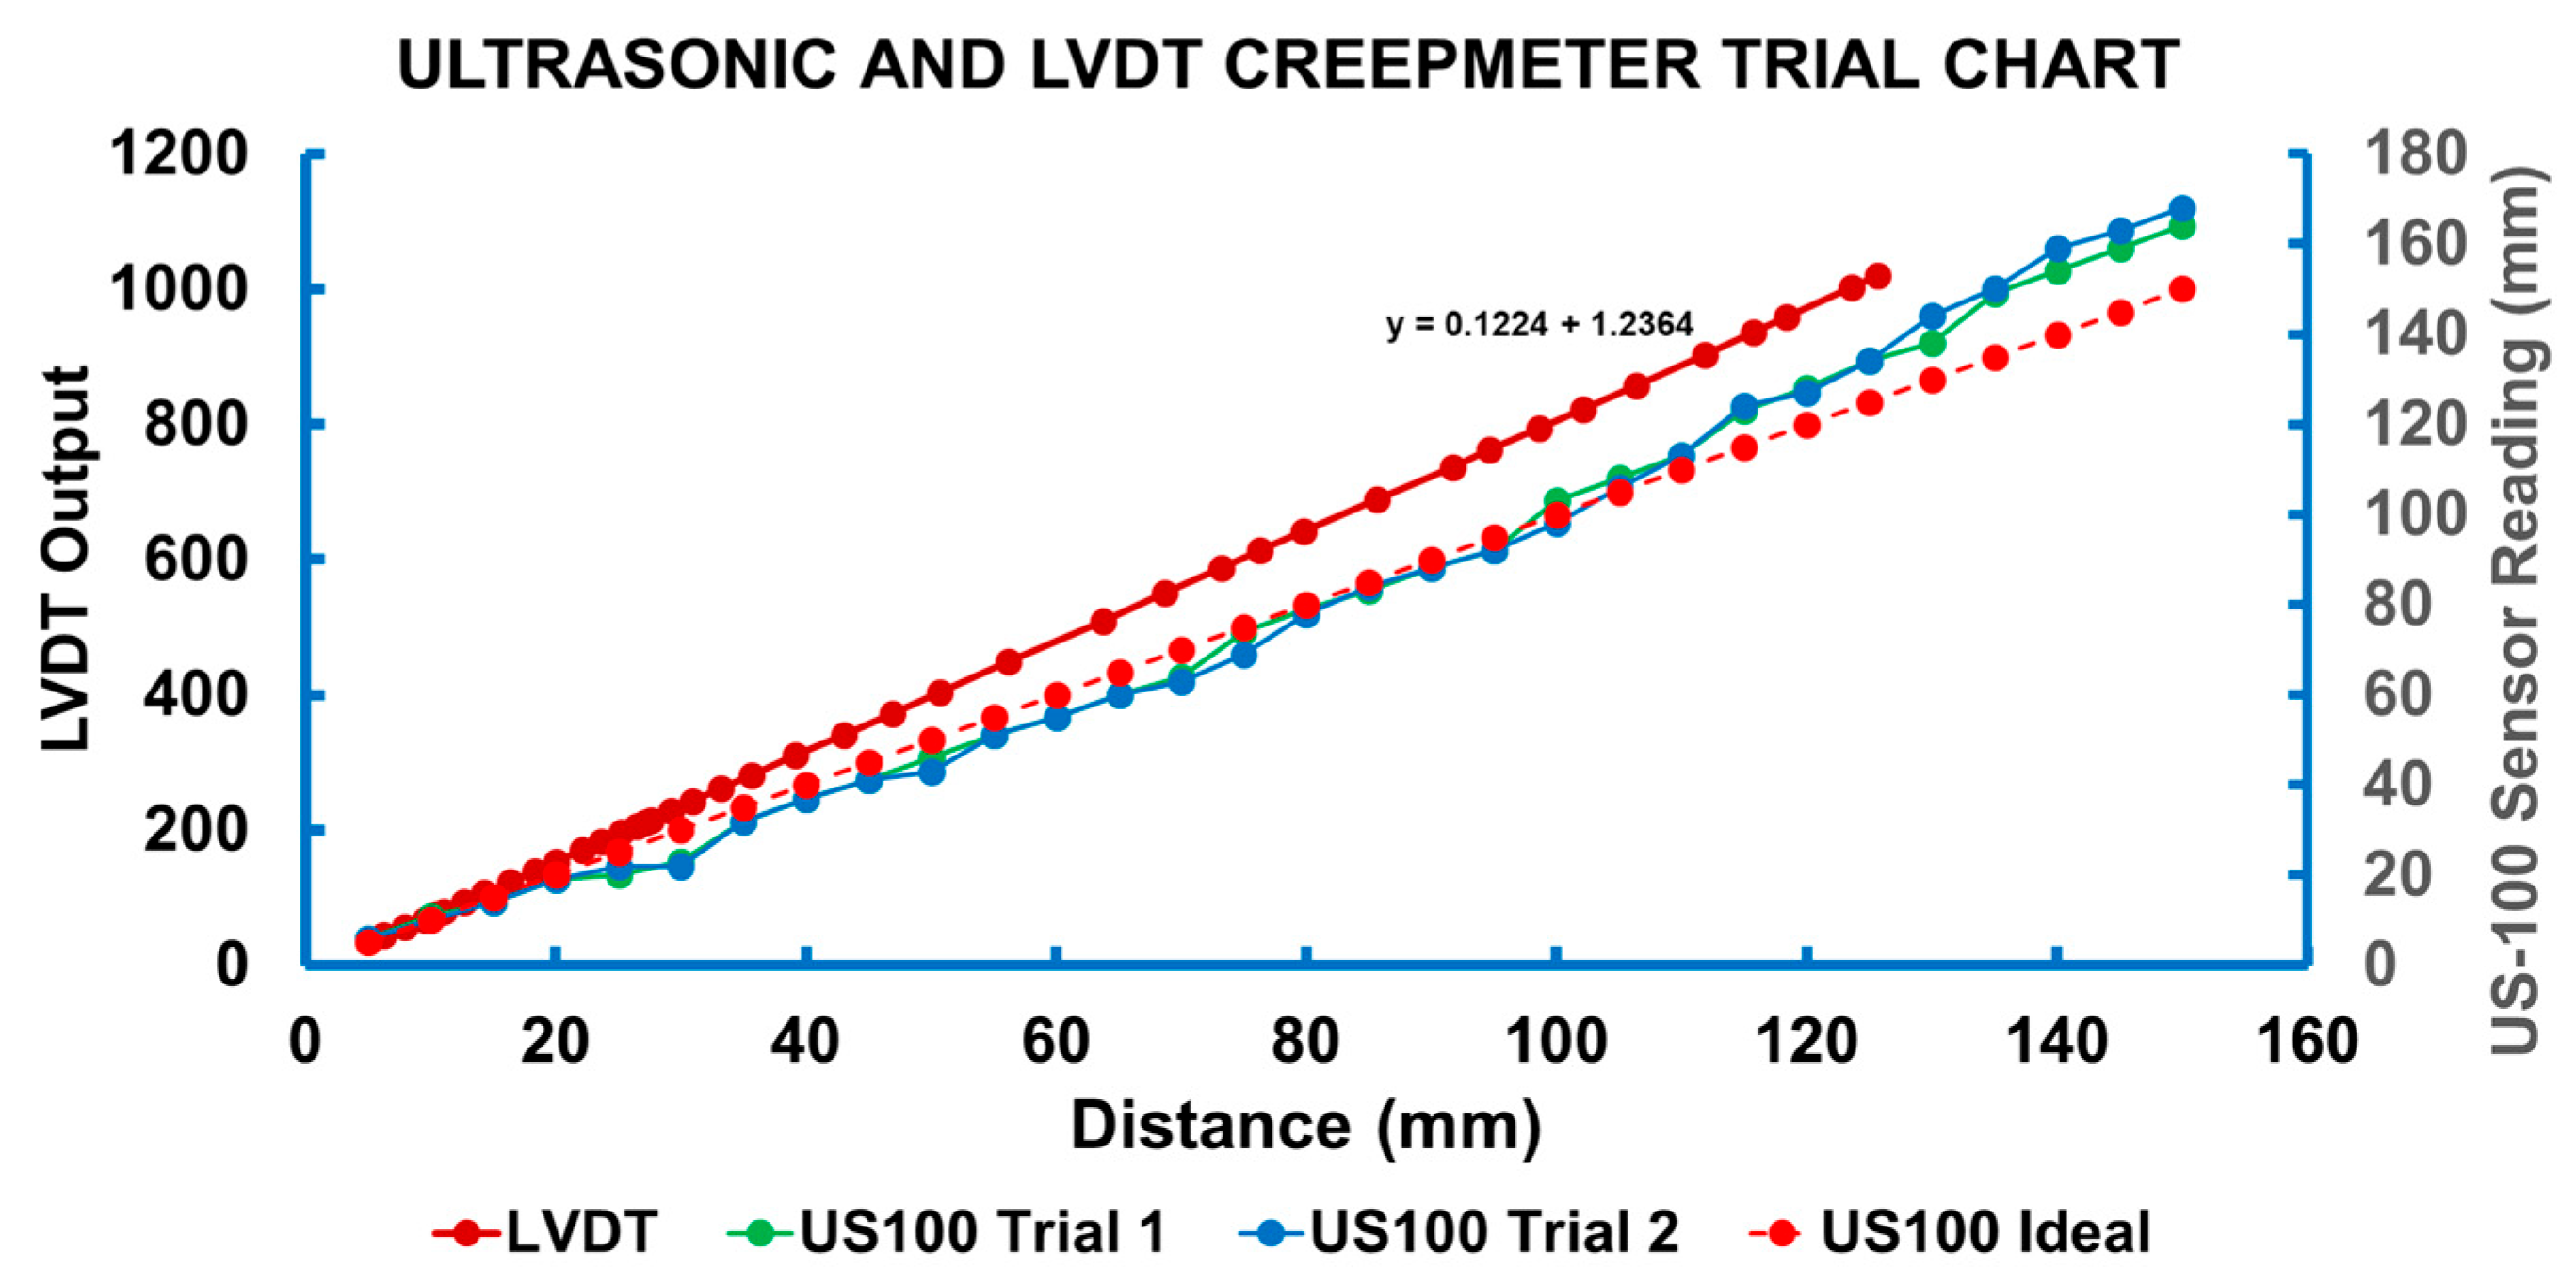
The results of calibration and testing demonstrate that the LVDT creepmeter is a highly precise tool for measuring displacement, as evidenced by the perfect positive linear relationship (R = 1) between actual distance and electrical output (Figure 5). However, measurements deviate substantially from the ideal linear plot beyond 110 mm. Average absolute deviations range from 5.23 to 6.03 mm for the 5–150 mm span and from 3.09 to 3.27 mm for the 5–110 mm span. In contrast, the ultrasonic creepmeter showed significant deviations beyond 110 mm (Figure 5), and its field displacement plots exhibit severe fluctuations, as discussed in the next section. Conversely, the LVDT creepmeter’s field monitoring data from the JUA and VOS sites are more stable, confirming that it is more reliable for measuring near-field displacement.
Environmental factors hinder the performance of ultrasonic creepmeters. Specifically, the speed of sound fluctuates with changes in temperature, humidity, atmospheric pressure, and carbon dioxide (CO2) concentration [50]. Among these variables, temperature and relative humidity exert the most significant impact [51]. These variations in sound wave propagation distort distance readings, causing reported values to deviate from actual distances. While the integrated US-100 sensor provides temperature compensation, it fails to account for humidity-driven alterations in the molecular weight of air [52]. As humidity rises, air becomes lighter and less dense, causing sound to travel faster [52]. Furthermore, extreme weather conditions—such as high winds and turbulent air currents—can induce signal attenuation or severe measurement fluctuations.
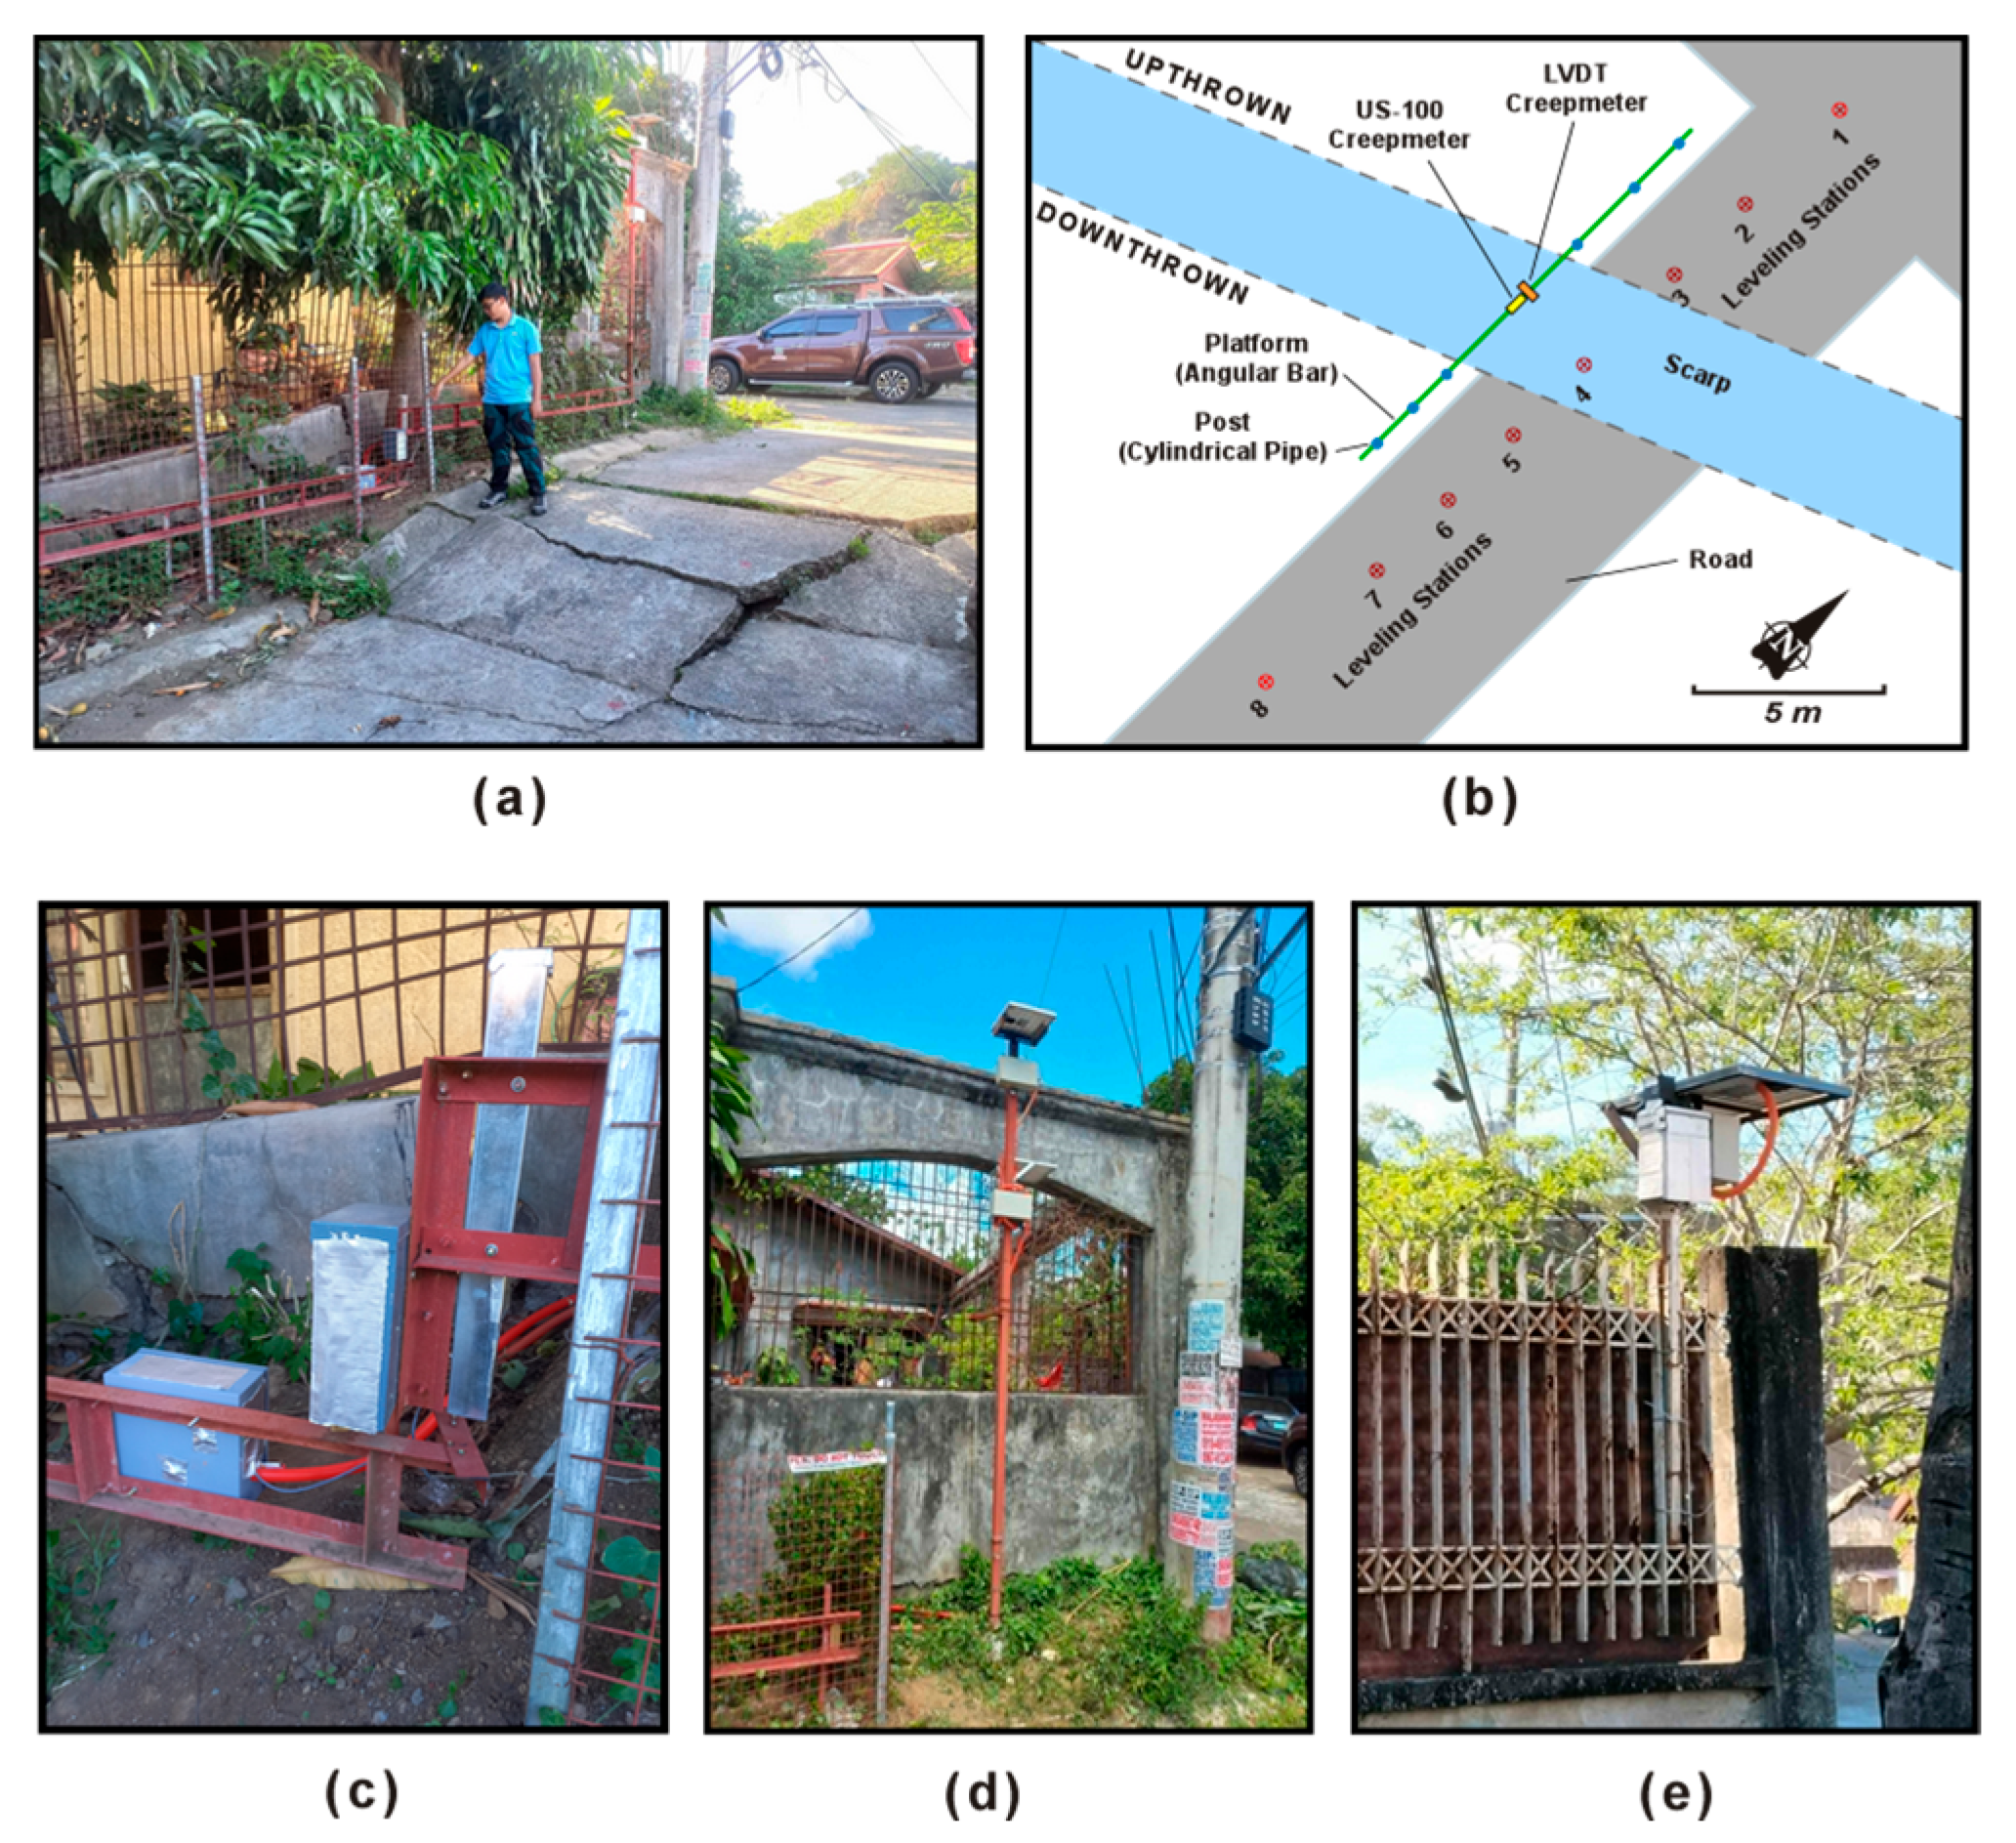
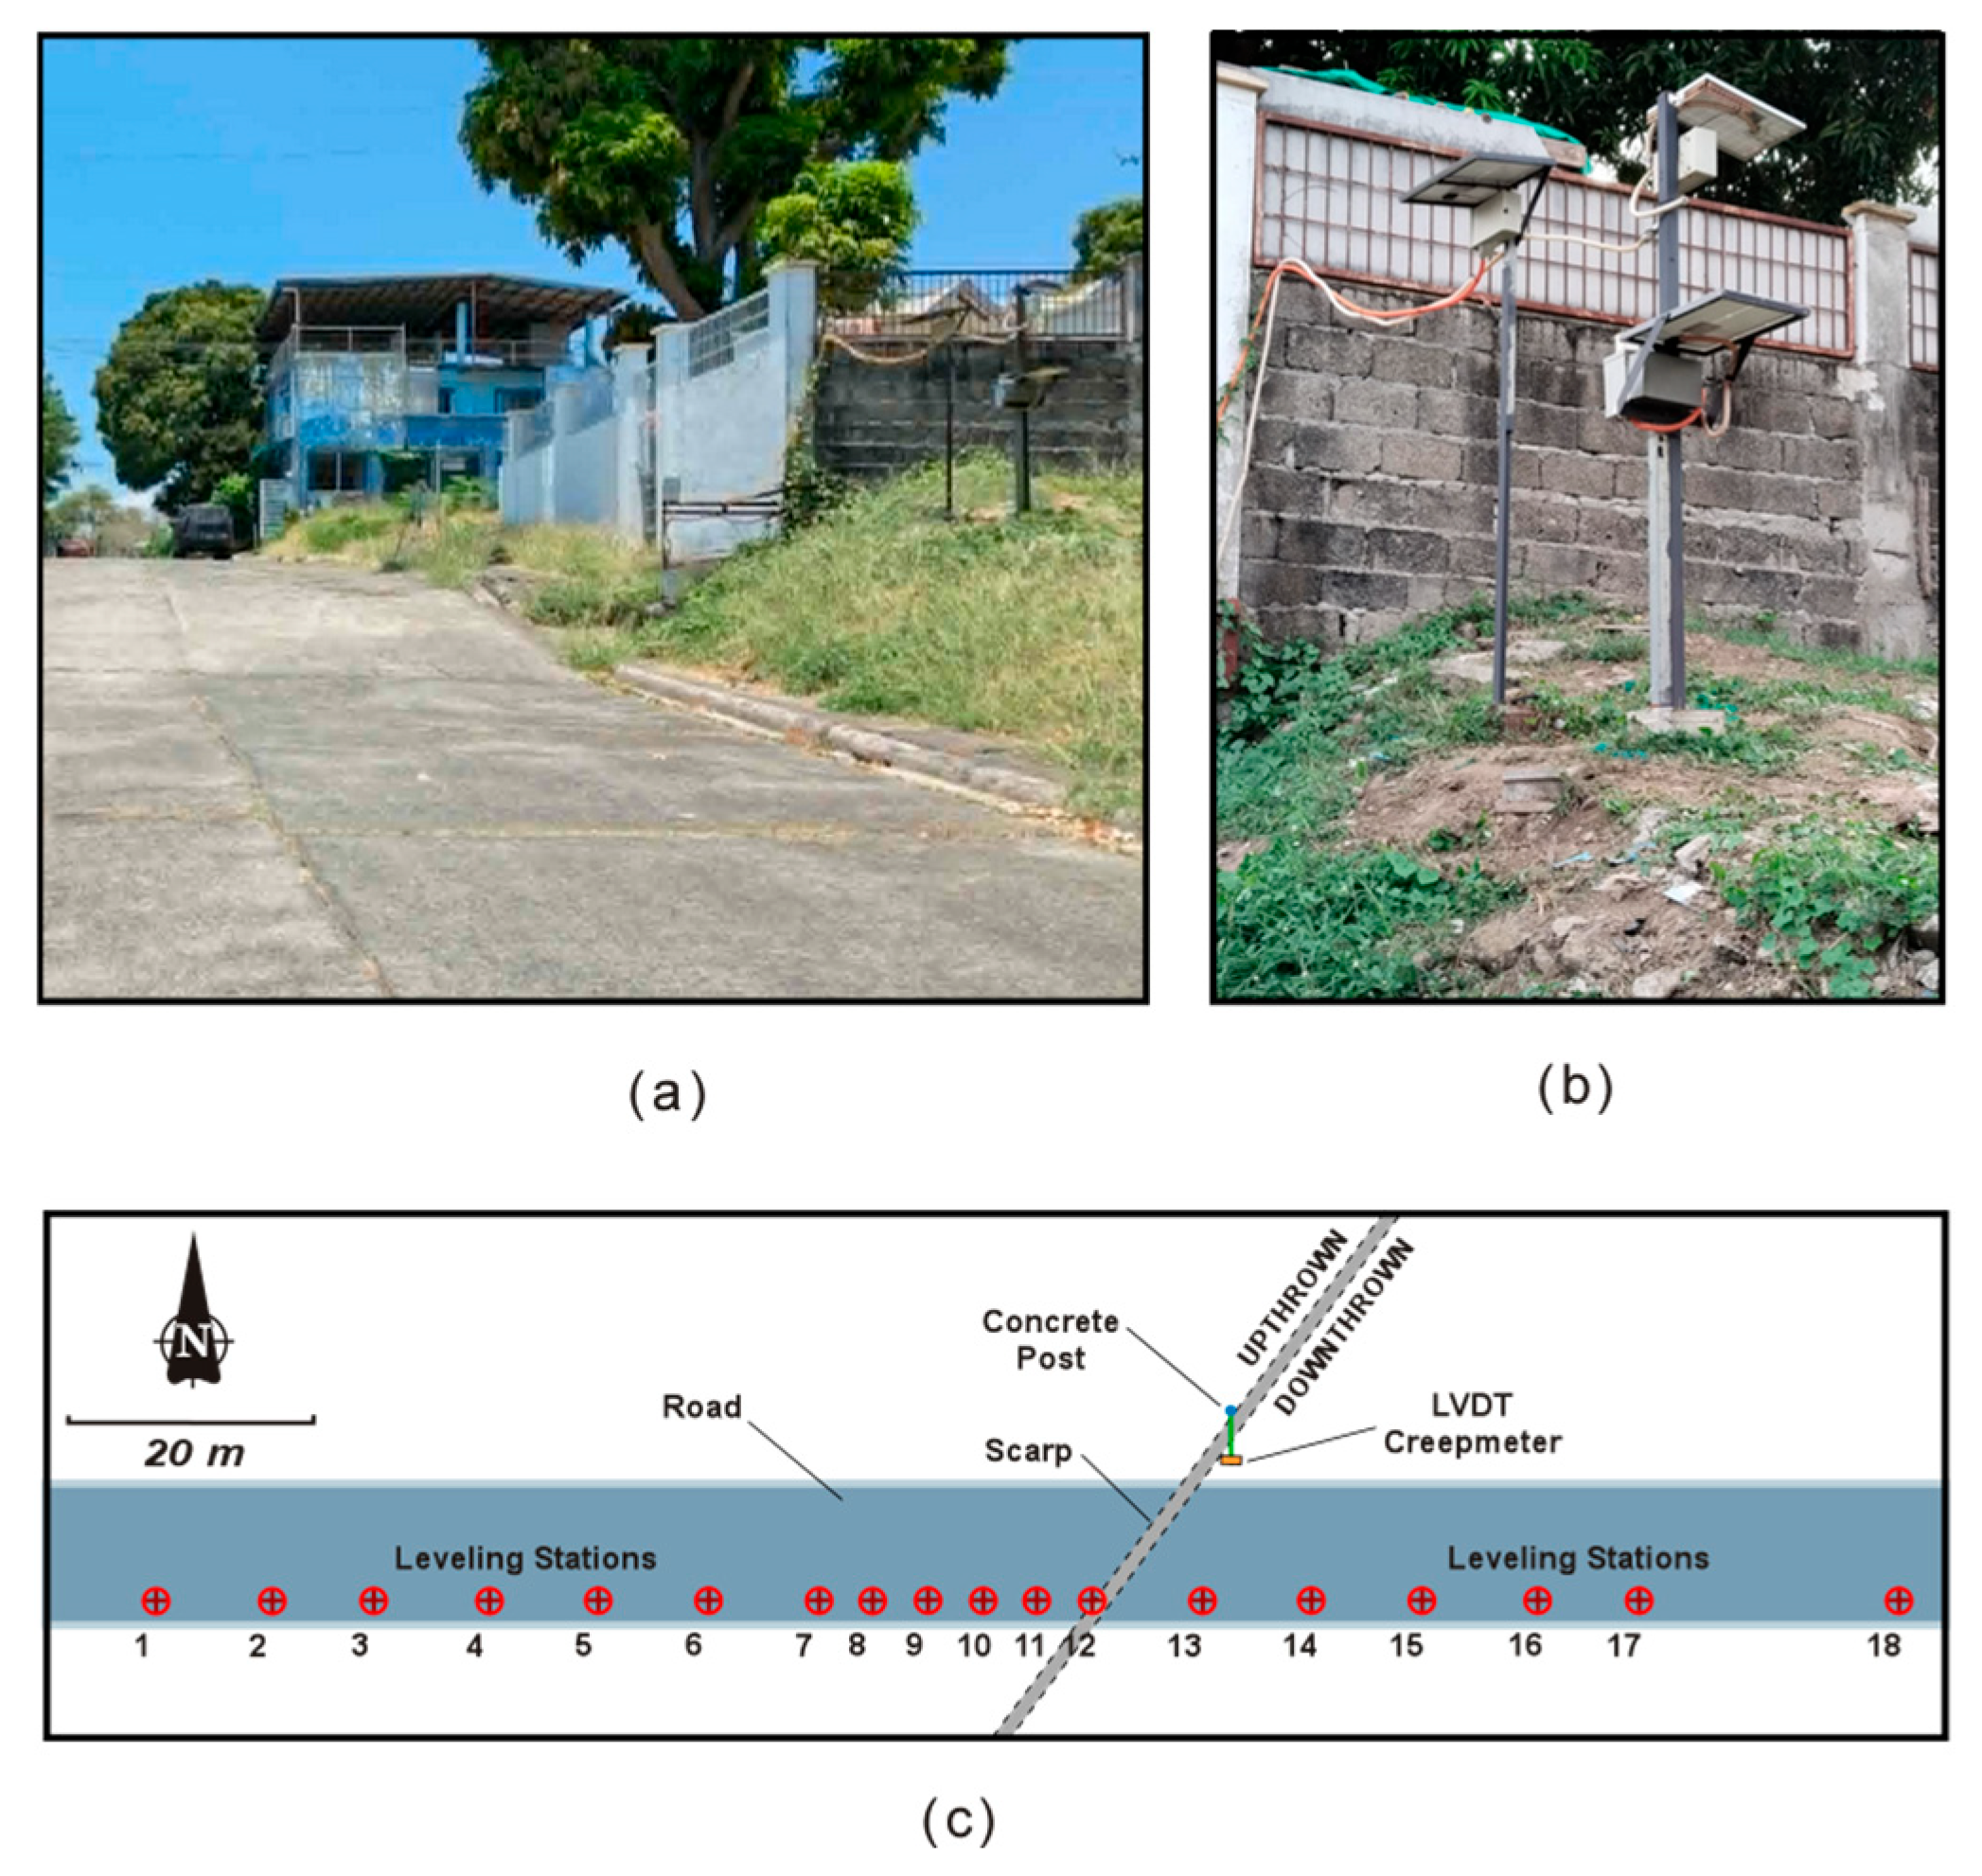
The LVDT creepmeters, ultrasonic creepmeters, and rain gauges were deployed across two sites: the Villa Olympia Subdivision III (VOS) and the Juana Subdivision (JUA). Both sites are located at the southernmost segment of the West Valley Fault (WVF) creeping zone (Figure 1c). At JUA, the platform hosting the ultrasonic and LVDT creepmeters (Figure 6a–e) runs subparallel to, and features a length comparable to, the leveling benchmark line. Conversely, the creepmeter setup at VOS is significantly simpler (Figure 7a–c) and is positioned adjacent to the line of leveling stations.

3.2. Correlation of Creep Displacement with Precipitation

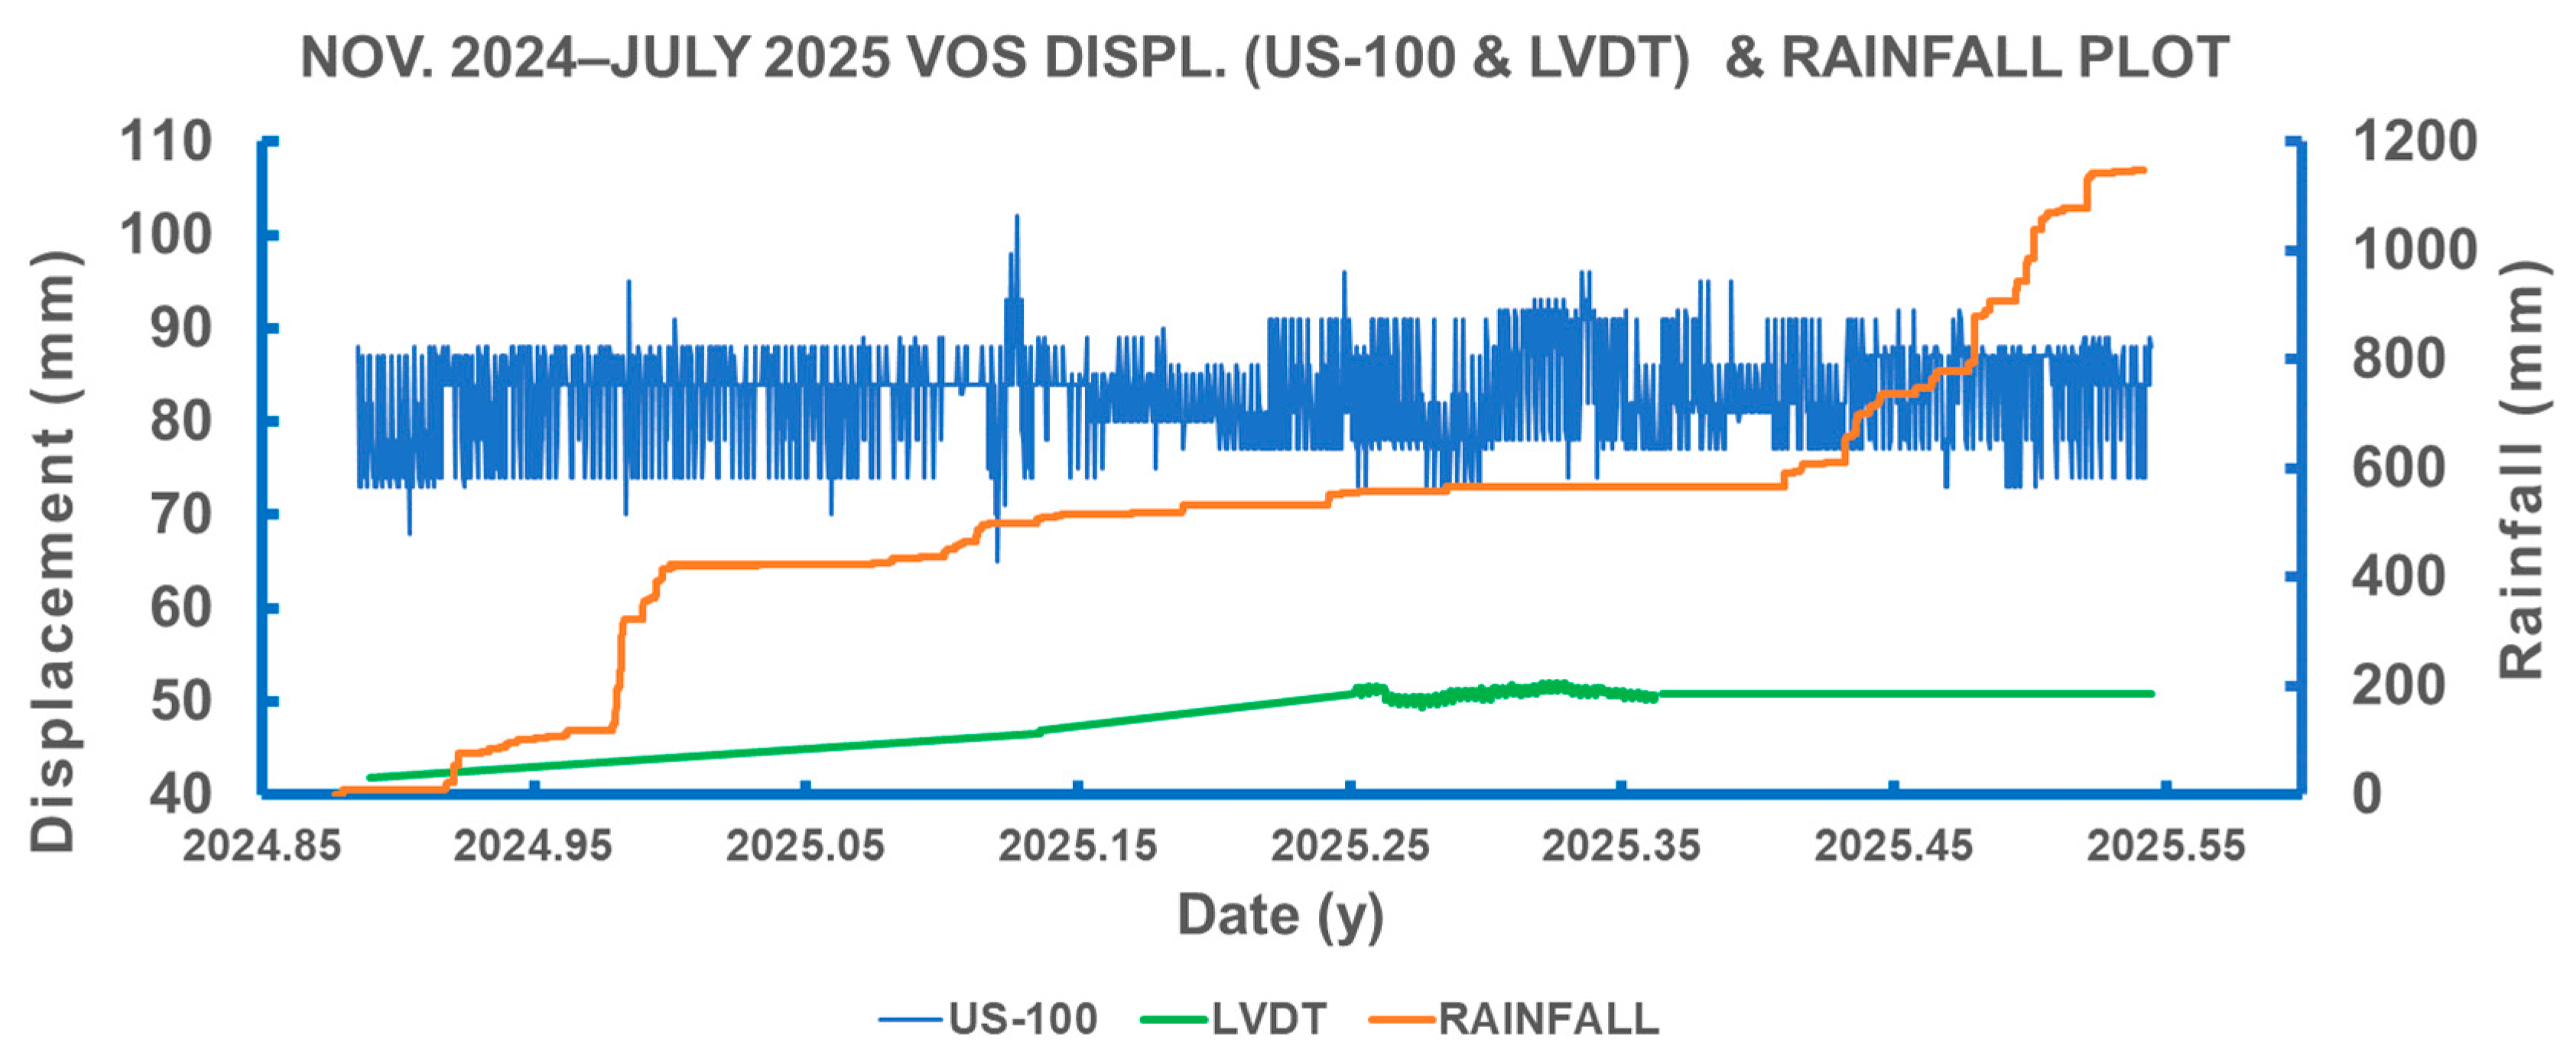
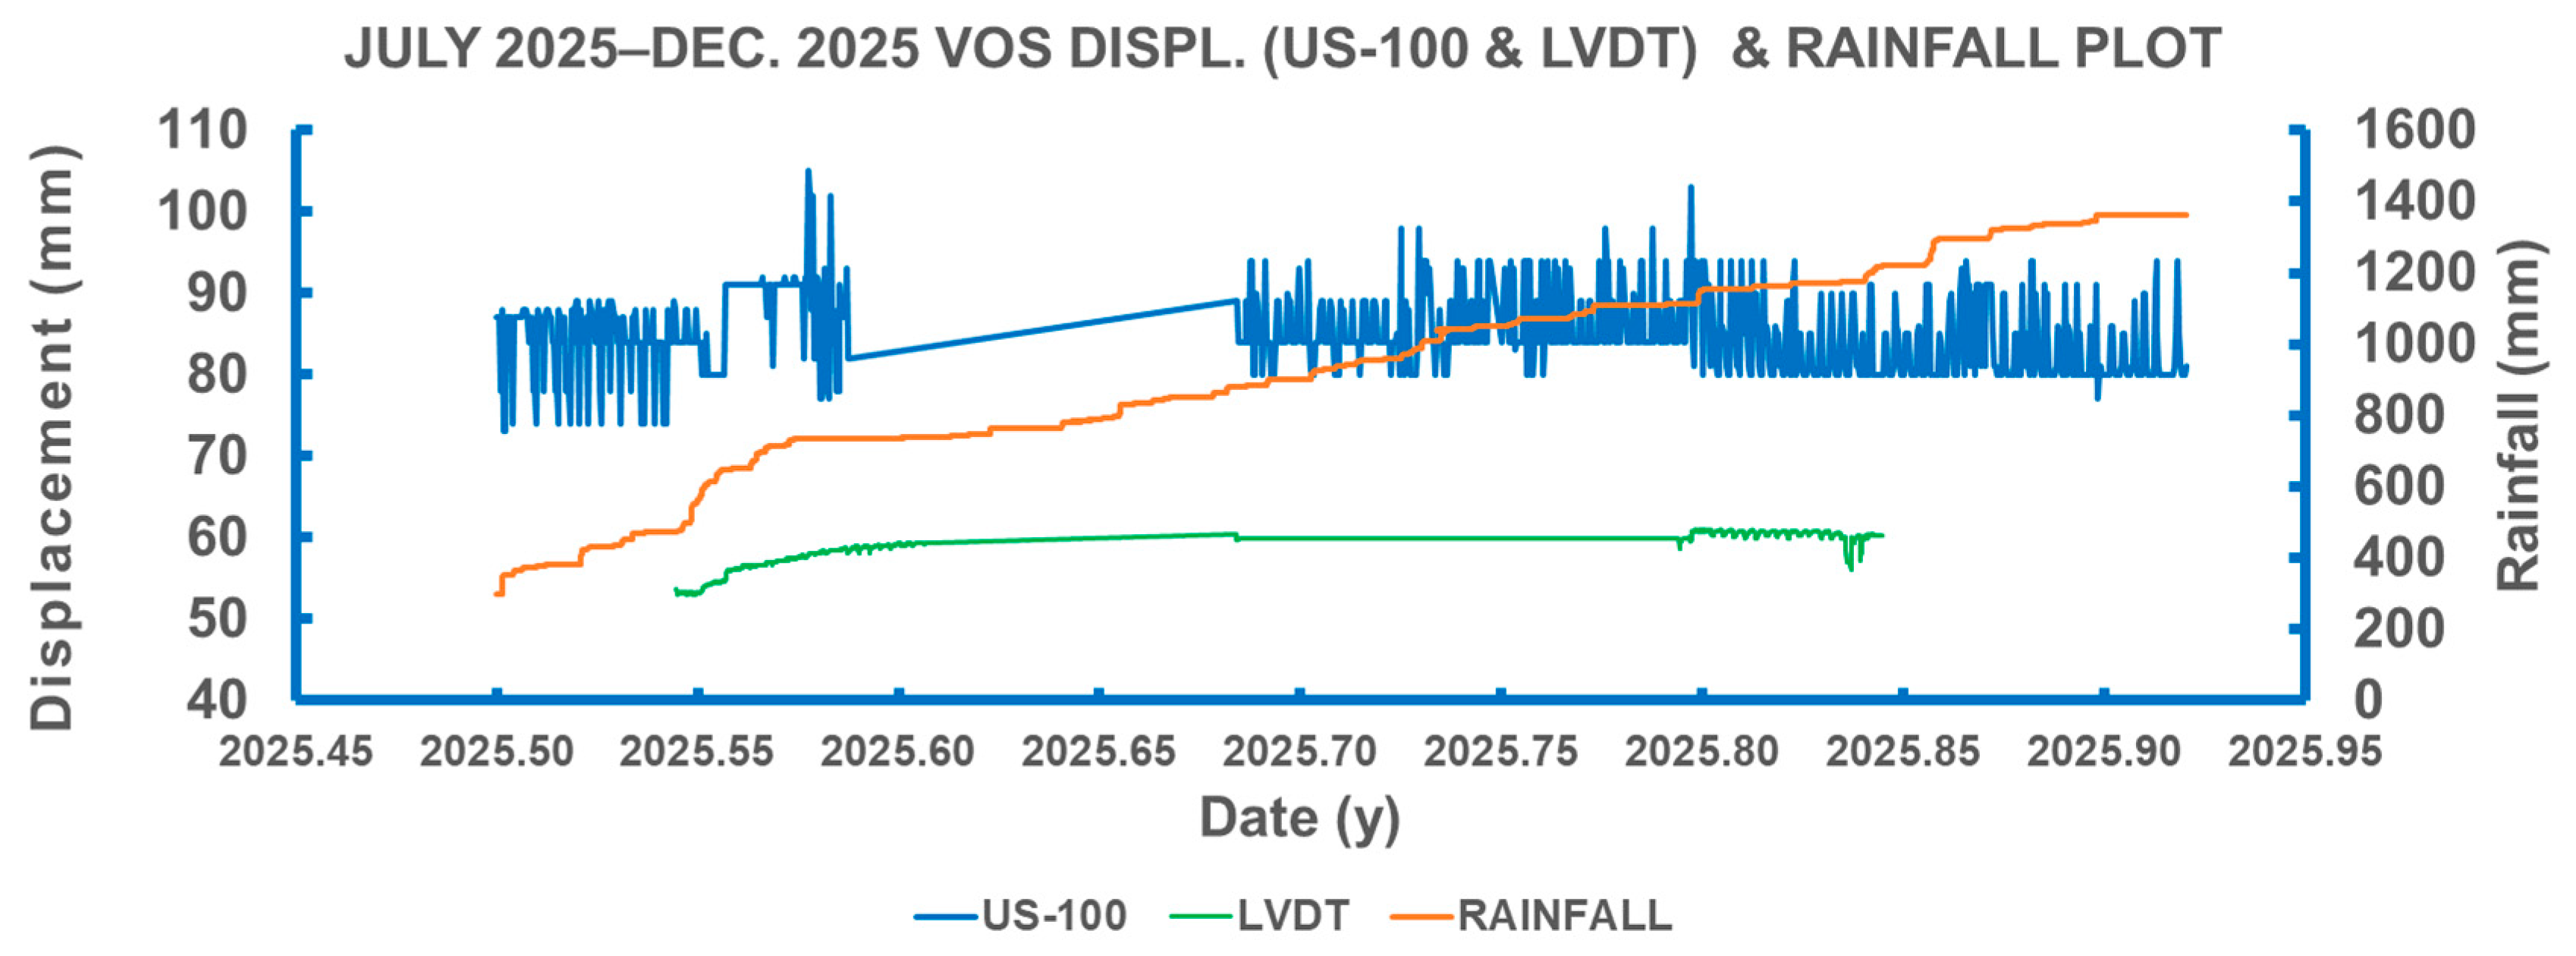
Figure 8 shows the displacement and cumulative rainfall data at VOS from 19 November 2024 (2024.88 y) to 17 July 2025 (2025.54 y). The plot compares ultrasonic data (3 h intervals) and LVDT data (1 h intervals) against cumulative rainfall recorded at 30 min intervals. Figure 9 shows the LVDT displacement and rainfall data at VOS from 1 July 2025 (2025.5 y) to 2 December 2025 (2025.92 y). Due to downtime in the LVDT’s operation, LVDT displacement measurements are shown only for the period from 2025.54 y to 2025.84. Abrupt increases in precipitation occurred from 2024.97 y to 2024.99 y (119 mm to 424 mm) and from 2025.4 y to 2025.52 y (567 mm to 1143 mm). There were no corresponding displacement increases recorded by the LVDT and ultrasonic creepmeters. However, from 2025.54 y to 2025.57 y, precipitation, which increased abruptly from 478 mm to 732 mm, was accompanied by an increase in displacement from 53 mm to 58 mm, as recorded by the LVDT creepmeter. A similar jump in displacement was recorded by the ultrasonic creepmeter, but the amount of increase in displacement is quite difficult to ascertain. Figure 8 and Figure 9 demonstrate that episodic precipitation along the southernmost creeping zone does not always cause displacement changes. From November 2024 to late 2025, there is no clear relation between the transition from the dry to wet season and any displacement change.
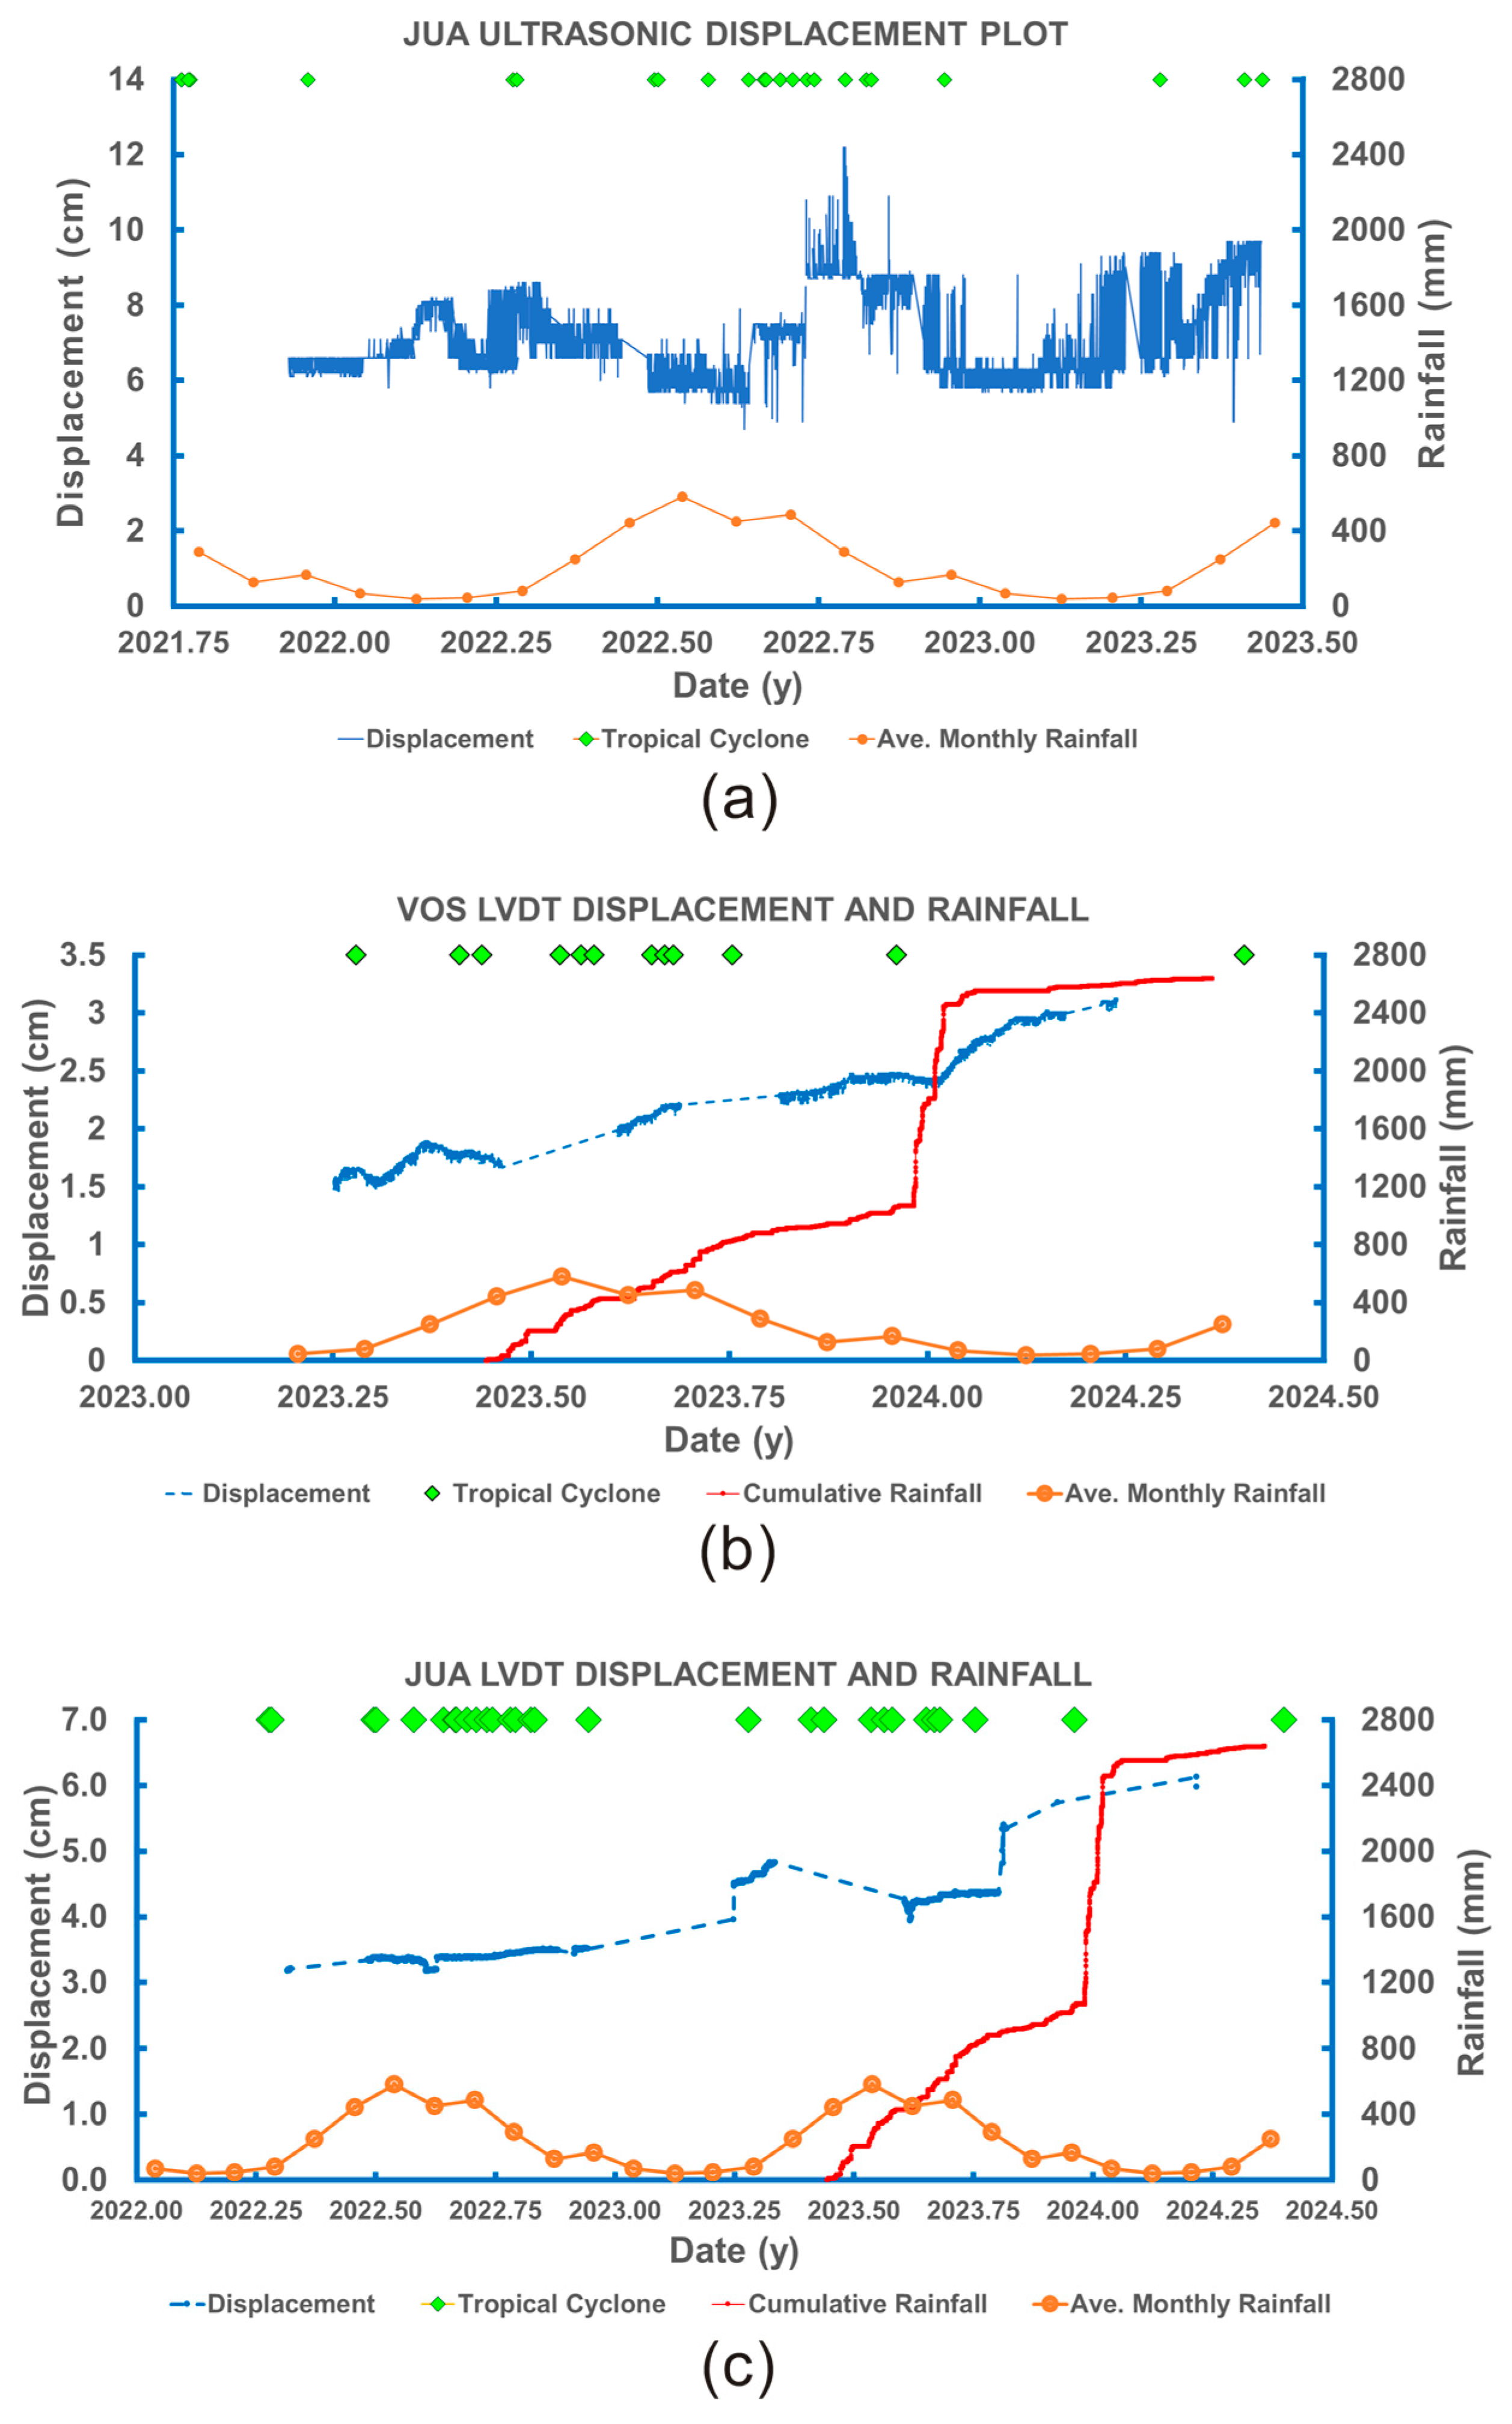
The JUA ultrasonic creepmeter displacement plot tells a different story about the effect of seasonal changes in precipitation. Figure 10a displays ultrasonic creepmeter displacement at JUA over a ~1.5-year period, from 5 December 2021 (2021.93 y) to 8 June 2023 (2023.44 y). The plot also incorporates weather disturbances and average monthly rainfall for the October 2021–June 2023 period. The wet season, spanning May to October, accounts for most of the area’s annual precipitation [53]. This period also marks the onset of heavy rains associated with tropical cyclones [54]. A tropical cyclone is a rotating weather system—ranging from a tropical depression to a super typhoon—characterized by strong winds and heavy, prolonged rainfall. Because rain gauge recording at VOS began only near the end of the JUA ultrasonic displacement record, Figure 10a omits a rainfall plot. Despite large daily and short-term fluctuations, the JUA ultrasonic creepmeter data still enable long-term displacement trend estimation and clear correlation with seasonal precipitation. Long-term trends in the ultrasonic record correlate with seasonal precipitation. While the 2022 dry season showed no significant relationship with displacement at JUA, the subsequent rainy season (2022.4–22.8) was followed by displacement peaks. Similarly, the onset of the 2023 rainy season aligns with the beginning of a rise in recorded displacements.
Rimando et al. [6] identified seasonal and episodic variations in displacement at VOS by correlating LVDT data with precipitation during the 2023–2024 monitoring period (Figure 10b). An abrupt rise in displacement began in late April 2023 (~2023.31 y), coinciding with increased rainfall. This upward trend was sustained through the rainy season until October (2023.80 y), mirroring the local rain gauge patterns. Similarly, a sharp displacement event in early January 2024 followed a heavy precipitation increase of over 1400 mm that started in late December. This was succeeded by a period of very slow creep from January to May, corresponding with the dry season. Kurita et al. [29] reported a similar increase in displacement (~2 mm) at VOS in January 2014. Despite using a different creepmeter system, this shift was also attributed to intense rainfall that occurred for several days.
The 2022–2024 displacement plot for the JUA LVDT creepmeter (Figure 10c) reveals a different relationship. Total displacement reached 2.81 cm or ~1.4 cm/year of slip, which compares closely to VOS. However, JUA did not mirror the abrupt displacement surge seen at VOS between 2023.5 and 2023.75, which coincided with peak cumulative rainfall. While JUA’s overall displacement rise aligns with the 2023 rainy season, its movement during the 2022 wet season remained slow and steady, interrupted only by a minor decline at 22.62 y during a brief dry spell (22.54–22.7 y). Notably, the heavy rainfall from late December to early January failed to trigger a substantial displacement spike at JUA, contrasting sharply with the response at VOS.
Continuous monitoring by Kurita et al. [30,56] using a different creepmeter system revealed that displacement in the VFS creeping zone does not always correlate with seasonal precipitation and rainfall. Similarly, Roeloffs [57] observed an inconsistent relationship between creep acceleration and seasonal and episodic changes in precipitation along the Parkfield section of the San Andreas Fault. The Chihshang Fault in Taiwan also exhibited creep behavior variations [43]. Rainfall reduces near-surface frictional resistance, triggering the release of stored tectonic strain [57]. Inconsistencies in site response to precipitation stem not only from frictional properties but also from rainfall patterns (amount, intensity, and timing) and local ground conditions [58]. Ground conditions that influence creepmeter response include local soil reaction to rainfall, water table height, recharge time, and proximity to bodies of water [58]. Variations in moisture content and soil hydraulic conductivity at the depths of creepmeter piers potentially impact displacement measurements [57].

3.3. Slip Rates

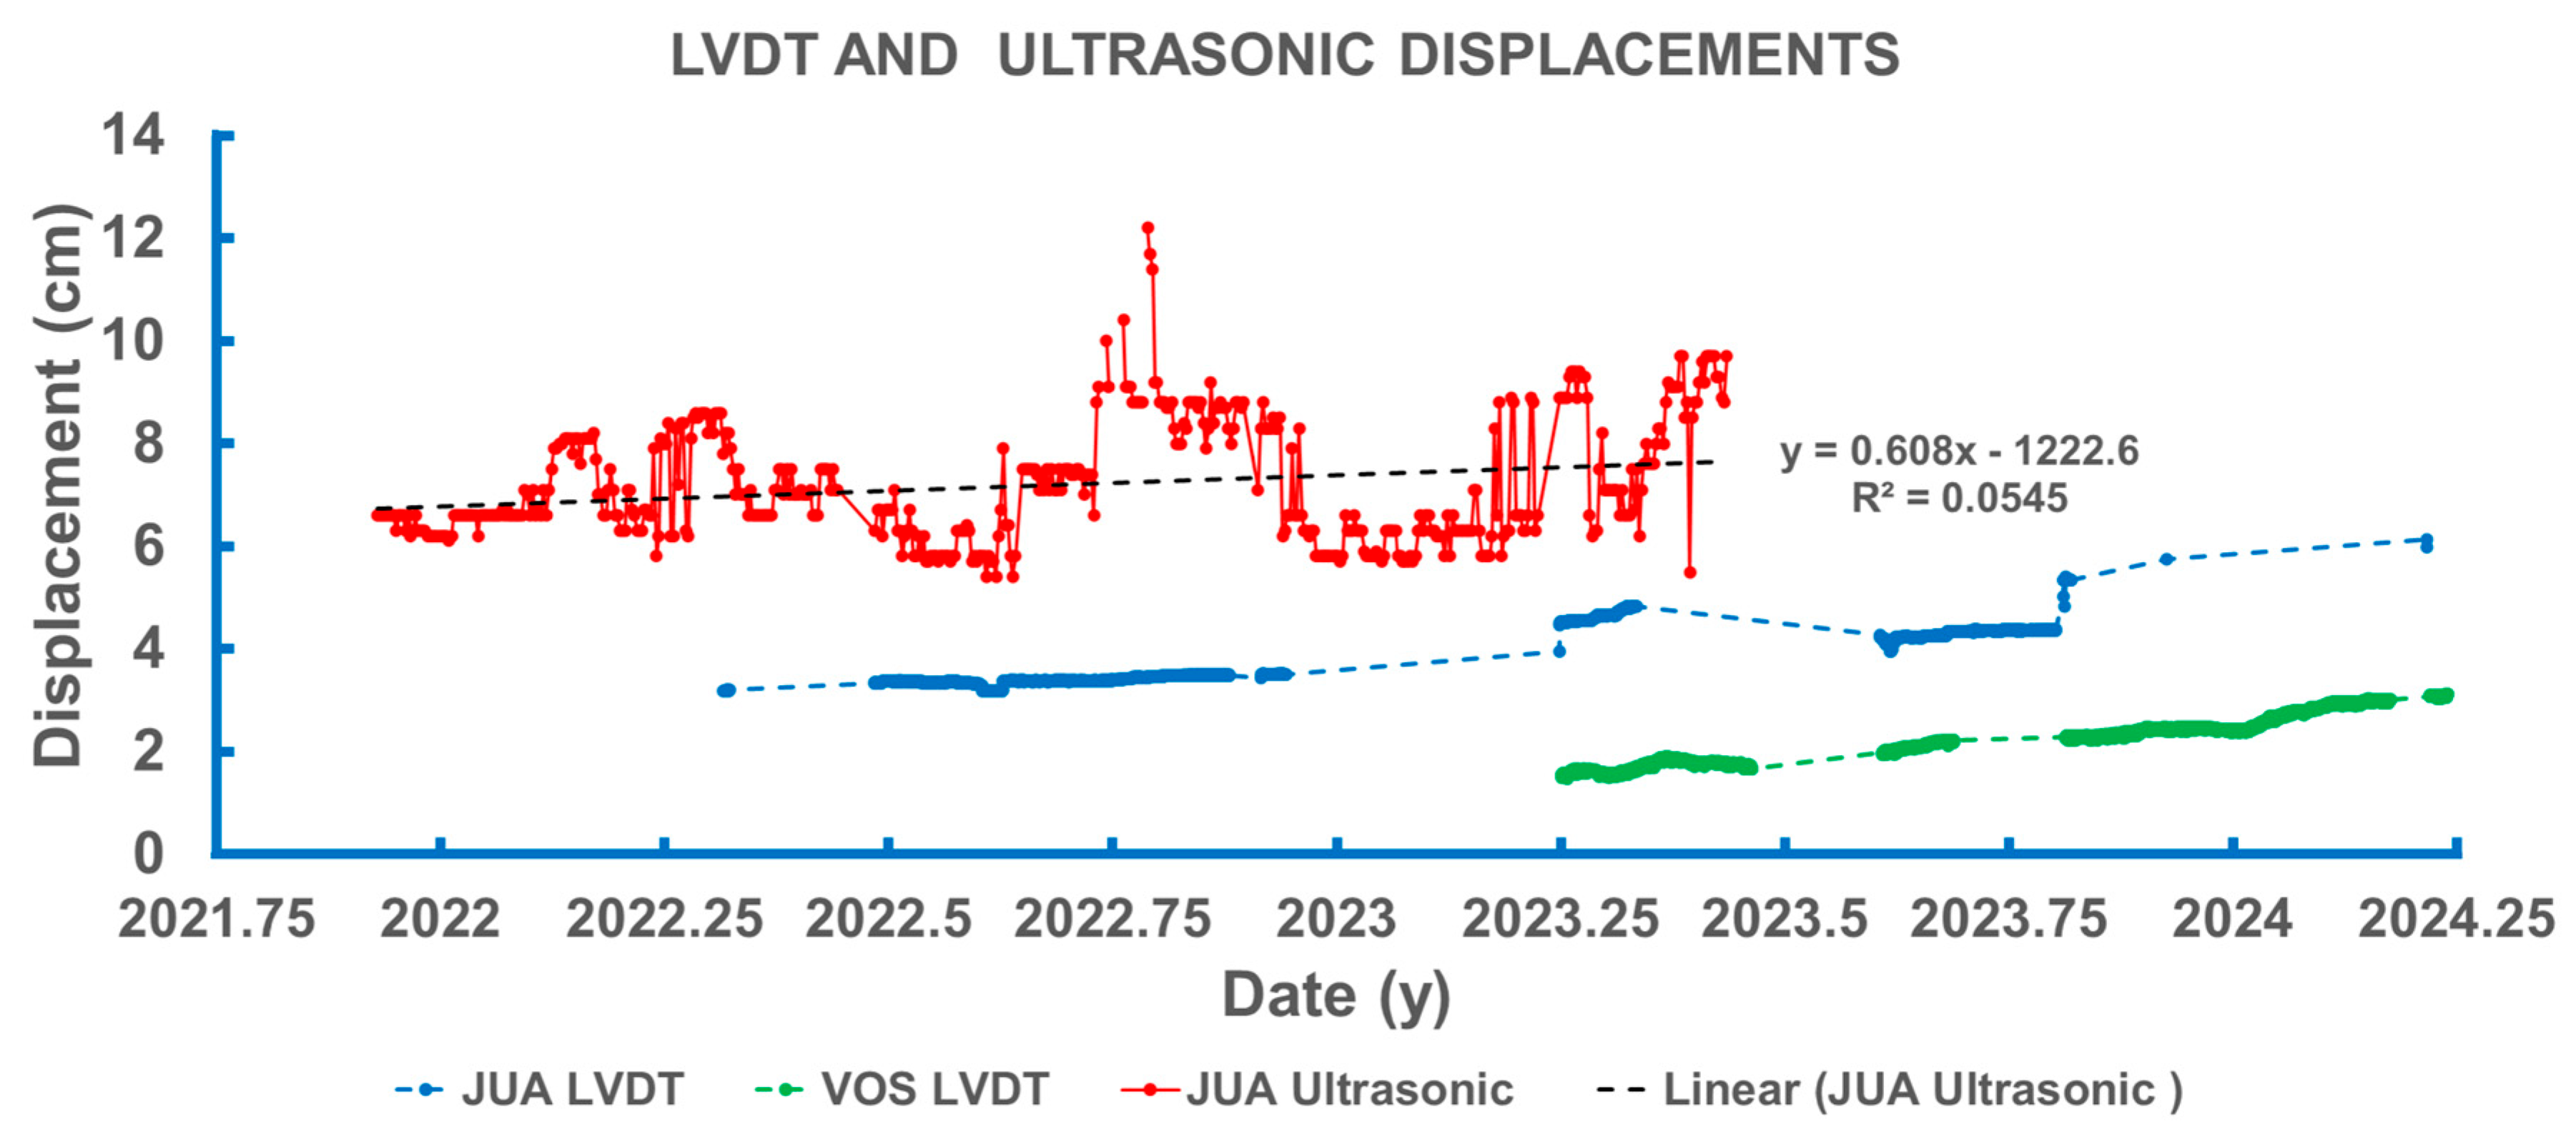
Slip rates are estimated from composite LVDT and ultrasonic displacement time-series (Figure 11). While the daily ultrasonic record exhibits prolonged highs and lows alongside frequent short-term fluctuations, these variations make direct displacement estimates challenging. Consequently, a trendline was applied to the variable ultrasonic data to determine the overall movement. Based on these plots, the slip rates for the creepmeters’ period of operation are as follows:
  • VOS LVDT = 1.57 cm/yr for the 2023.25 y–2024.24 y period;
  • JUA Ultrasonic = 0.61 cm/yr for the 2021.93 y–2023.44 y period;
  • JUA LVDT = 1.4 cm/yr for the 2022.32 y–2024.22 y period.
The total displacement measured by the JUA LVDT creepmeter during the 2-year monitoring period is approximately 2.81 cm or ~1.4 cm/yr of slip. This slip rate is almost identical to the VOS estimates. Both the ultrasonic and LVDT creepmeters recorded an identical slip rate of 0.8 cm/yr while operating simultaneously between 2022.32 y and 2023.25 y.

3.4. Comparison of Short-Term Slip Rates with Long-Term Slip Rates from Leveling Surveys

Overall, slip rates derived from creepmeter data are significantly lower than the long-term rates established through precise leveling. Specifically, leveling at VOS revealed slip rates of 2.27 cm/yr between 1999 and 2022, increasing to 3.4 cm/yr for the 2014–2022 period [3,6]. When deformation is distributed across a broad fault zone—as observed at VOS—the significant length discrepancy between the creepmeter platform (~2 m) and the leveling survey line (~180 m) may explain the difference between the short-term slip rates derived from creepmeter monitoring and long-term slip rates derived from leveling. A portion of the long-term slip rate is likely attributable to groundwater extraction. At JUA, where the creepmeter platform length is comparable to the leveling survey line, long-term displacement and slip rates derived from leveling significantly exceed short-term LVDT rates. The slip rate at JUA, derived from precise leveling between 2012 and 2023, was 2.31 cm/yr [3,6]. In this case, groundwater extraction contributes more substantially to the long-term displacement and slip rate.
Slip rates from creepmeters and leveling surveys show continuing accelerated creep in the southern West Valley Fault. While seasonal rainfall plays a role, the primary driver is excessive groundwater extraction. According to the Mohr–Coulomb failure criterion, faulting occurs when shear stress exceeds frictional strength and normal stress. Extraction reduces normal stress by compacting aquifers and lowering the water load [16,17]. Consequently, continued overextraction poses a persistent risk of vertical creep damage and induced seismicity. On the other hand, a reduction in the near-surface frictional resistance along faults may be induced by rainwater. Extended periods of intense rainfall may trigger the release of stored tectonic stress that results in high creep rates [57].

3.5. Adoption and Use of the Creepmeters for Monitoring Other Active Faults

The Arduino-based LVDT creepmeter has been accurate and reliable in monitoring short-term displacement along the WVF’s creeping segment. Although less accurate in determining short-term displacement, the ultrasonic creepmeter is highly valuable in the determination of longer-term displacement and slip rates. Like the LVDT creepmeter, the Arduino-based Zhafira rain gauge is equally dependable in recording the amount of rainfall. The rainfall record has been indispensable in determining the correlation between creep displacement and precipitation, both episodic and seasonal. The creepmeters are not only easy to assemble and operate but also cost only a small fraction of commercially available creepmeter systems. From a cost perspective, the primary basis of comparison is the type of controller utilized, namely Arduino-based creepmeters versus commercial data loggers. Campbell Scientific data loggers, which were previously used to monitor creep along the West Valley Fault (WVF), range in cost from $1200 to $3800 for new units, while used and pre-owned units range from $300 to $1500. In contrast, official Arduino Leonardo boards cost between $17 and $24, and their generic counterparts cost even less ($5 to $10). When factoring in additional production and overhead costs, commercial creepmeters become financially unaffordable for many projects. The Arduino Leonardo controller does not suffer from accuracy issues and is not inferior to commercial data loggers. Furthermore, the LVDT sensors used in our creepmeters are just as accurate and reliable as commercial alternatives, since they utilize similar sensor technology. Ultimately, the total price depends heavily on the specific model selected. Beyond cost-effectiveness, locally fabricated creepmeters offer distinct advantages for fault monitoring over other methods. Precise leveling is a highly accurate method for measuring near-field deformation. While it offers distinct advantages for tracking vertical displacement, its periodic nature fails to provide continuous data. Consequently, it cannot resolve episodic or seasonal environmental changes that may trigger short-term creep. While GPS stations exist nationwide, the current network lacks the density required to map the far-field velocity of many active faults. Previous studies in the VFS region [59,60] utilized GPS, yet the sparse distribution of stations limits the confidence of these inferences. This leads to kinematic models that may appear unreliable or even contradict the late Quaternary sense of motion [1,2]. While high-quality data from dense GPS networks are valid, their interpretations do not necessarily have to align with Holocene morphotectonic evidence. For instance, specific fault sections may currently be locked, causing short-term geodetic data to differ from long-term geologic deformation patterns. While InSAR offers broader spatial coverage for monitoring deformation, it faces limitations in the near-field. It often struggles with large displacements and “noisy” textures like dense vegetation, making it less reliable close to a fault. Furthermore, because free Sentinel-1 data only dates back about a decade, InSAR cannot capture the long-term trends identified in our higher-precision field measurements. Our approach also avoids common InSAR complications, such as coherence loss and atmospheric corrections, which can introduce uncertainty into creep rate estimates.
Many active faults have been identified in the Philippines, yet most lack detailed mapping regarding their traces, segments, kinematics, and paleoseismicity. Detailed neotectonic mapping has primarily focused on the Valley Fault System (VFS)—which cuts through the country’s political and commercial hub in Metro Manila—and a few other faults in Luzon and the Visayas. While ground ruptures from recent earthquakes have undergone post-event mapping, active monitoring of displacement remains sparse. Monitoring near-field deformation along Philippine active faults is currently limited to a few segments—specifically the creeping sections of the VFS and the PFZ—due to a lack of specialized expertise and equipment. Deploying locally fabricated, cost-effective creepmeters can significantly bridge this monitoring gap. The creepmeter setup used in this study, which is primarily designed for vertical creep, can be configured according to the nature of creep activity of each fault being monitored. Monitoring fault creep is vital for seismic hazard assessment. Measuring these displacements helps determine if creep is continuous or episodic, identifies locked fault sections prone to failure, estimates potential earthquake magnitudes, and pinpoints critically stressed regions.

4. Conclusions

The use of inexpensive, locally sourced parts for the custom-fabricated LVDT and ultrasonic creepmeters and rain gauges simplified maintenance and saved significant time and resources. Laboratory testing and field data demonstrate that the LVDT creepmeter is a highly reliable instrument for accurately monitoring both short- and long-term displacements. Unquantified environmental factors affecting the accuracy of the ultrasonic creepmeter prevented us from making necessary corrections. Consequently, it is less reliable than the LVDT creepmeter for short-term monitoring. However, the ultrasonic creepmeter is useful for determining long-term displacement and slip rates. The Arduino-based rain gauge is an accurate and reliable tool for monitoring rainfall.
The use of the creepmeters complemented the periodic displacement monitoring of deformation along the WVF through precise leveling. Our creepmeter monitoring reveals sustained, accelerated creep within the southern portion of the WVF creeping zone. This discrepancy between the slip rates from leveling surveys and creepmeters suggests that localized groundwater withdrawal drives a component of the observed displacement. This mechanism is supported by previous research establishing a clear spatio-temporal correlation between creep velocity and groundwater extraction rates. As our results suggest, periodic and episodic precipitation drives part of the displacement. When rainwater infiltrates faults, it lowers near-surface frictional resistance and triggers short-term slip. This rainfall can cause episodic, seasonal creep, but effects are highly variable. In the case of the WVF creeping zone, displacement does not always correlate with seasonal precipitation and rainfall. Responses differ not only between locations but also at the same site across different seasons and storm events. Ground deformation responses to episodic and seasonal precipitation may stem from varying frictional properties, fluctuations in rainfall intensity and timing, and localized ground conditions. Given that groundwater extraction constitutes the primary trigger and control mechanism for the creep, water regulations in the southern creeping zone must be tightened to prevent further damage and avert potential induced seismicity.
Given the hundreds of unmonitored active faults spanning the Philippines, equipping universities and research institutes with locally fabricated creepmeters can cost-effectively bridge critical monitoring gaps. Future iterations could integrate an Arduino Leonardo controller with a cellular SIM module to enable real-time data transmission, SMS notifications, and GPS tracking at sites with stable cellular coverage. Additionally, researchers should explore alternative low-cost, Arduino-compatible displacement sensors, such as laser-based modules.

Supplementary Materials

The following supporting information can be downloaded at: https://www.mdpi.com/article/10.3390/geohazards7030096/s1. Figure S1: Creepmeter and rain gauge sketches.

Author Contributions

Conceptualization, R.E.R.; methodology, R.E.R., D.C.E.L. and B.J.M.; software, R.E.R., D.C.E.L. and B.J.M.; validation, R.E.R., D.C.E.L. and B.J.M.; formal analysis, R.E.R., D.C.E.L. and B.J.M.; investigation, R.E.R., D.C.E.L. and B.J.M.; resources, R.E.R., D.C.E.L. and B.J.M.; data curation, R.E.R.; writing—original draft preparation, R.E.R. and D.C.E.L.; writing—review and editing, R.E.R., D.C.E.L. and B.J.M.; visualization, R.E.R.; supervision, R.E.R.; project administration, R.E.R.; funding acquisition, R.E.R., D.C.E.L. and B.J.M. All authors have read and agreed to the published version of the manuscript.

Funding

This research was funded by the Department of Science and Technology—Philippine Institute of Volcanology and Seismology (DOST-PHIVOLCS), in accordance with the General Appropriations Act of the Republic of the Philippines.

Data Availability Statement

The original contributions presented in this study are included in the open-access Zenodo repository at https://doi.org/10.5281/zenodo.21809952. Further inquiries can be directed to the corresponding author.

Acknowledgments

This work was accomplished with the help of personnel from the Department of Science and Technology—Philippine Institute of Volcanology and Seismology (DOST-PHIVOLCS).

Conflicts of Interest

The authors declare no conflicts of interest.

References

  1. Rimando, R.E. Neotectonic and Paleoseismic Study of the Marikina Valley Fault System, Philippines. Ph.D. Thesis, State University of New York at Binghamton, Binghamton, NY, USA, 2002; 232p. [Google Scholar]
  2. Rimando, R.E.; Knuepfer, P.L. Neotectonics of the Marikina Valley fault system (MVFS) and tectonic framework of structures in northern and central Luzon, Philippines. Tectonophysics 2006, 415, 17–38. [Google Scholar] [CrossRef] [Scilit]
  3. Rimando, R.E.; Kurita, K.; Kinugasa, Y. Spatial and temporal variation of aseismic creep along the dilational jog of the West Valley Fault, Philippines: Hazard implications. Front. Earth Sci. 2022, 10, 935161. [Google Scholar] [CrossRef] [Scilit]
  4. Rimando, R.E.; Knuepfer, P.L.K. Tectonic control of aseismic creep and potential for induced seismicity along the West Valley Fault in southeastern Metro Manila, Philippines. GeoHazards 2024, 5, 1172–1189. [Google Scholar] [CrossRef] [Scilit]
  5. Rimando, R.E.; Knuepfer, P.L.K. Earthquake history and rupture extents from morphology of fault scarps along the Valley Fault System (Philippines). GeoHazards 2025, 6, 23. [Google Scholar] [CrossRef] [Scilit]
  6. Rimando, R.E.; Llamas, D.C.E.; Marfito, B.J.; Garduque, R.J. Seasonal and episodic variation of aseismic creep displacementaAlong the West Valley Fault, Philippines. GeoHazards 2025, 6, 55. [Google Scholar] [CrossRef] [Scilit]
  7. Burford, R.O.; Harsh, P.W. Slip on the San Andreas fault in central California from alinement array surveys. Bull. Seismol. Soc. Am. 1980, 70, 1233–1261. [Google Scholar]
  8. Savage, J.C.; Prescott, W.H.; Lisowski, M.; King, N. Geodolite measurements of deformation near Hollister, California, 1971–1978. J. Geophys. Res. 1979, 84, 7599–7615. [Google Scholar] [CrossRef] [Scilit]
  9. Lienkaemper, J.J.; Borchardt, G.; Lisowski, M. Historic creep rate and potential for seismic slip along the Hayward fault, California. J. Geophys. Res. 1991, 96, 18261–18283. [Google Scholar] [CrossRef] [Scilit]
  10. Kelson, K.I.; Simpson, G.D.; Lettis, W.R.; Haraden, C.C. Holocene slip rate and earthquake recurrence of the northern Calaveras fault at Leyden Creek, northern California. J. Geophys. Res. 1996, 101, 5961–5975. [Google Scholar] [CrossRef] [Scilit]
  11. Stenner, H.D.; Ueta, K. Looking for evidence of large surface rupturing events on the rapidly creeping Southern Calaveras fault, California. In Proceedings of the Hokudan International Symposium and School on Active Faulting, Hokudan-cho, Japan, 13–17 January 2000; pp. 479–486. [Google Scholar]
  12. Yu, S.B.; Liu, C.C. Fault creep on the central segment of the Longitudinal Valley fault, eastern Taiwan. Proc. Geol. Soc. China 1989, 32, 209–231. [Google Scholar] [CrossRef] [Scilit]
  13. Ambraseys, N.N. Some characteristic features of the Anatolian fault zone. Tectonophysics 1970, 9, 143–165. [Google Scholar] [CrossRef] [Scilit]
  14. Segall, P. Stress and subsidence resulting from subsurface fluid withdrawal in the epicentral region of the 1983 Coalinga earthquake. J. Geophys. Res. 1985, 90, 6801–6816. [Google Scholar] [CrossRef] [Scilit]
  15. Segall, P. Induced stresses due to fluid extraction from axisymmetric reservoirs. Pure Appl. Geophys. 1992, 139, 535–560. [Google Scholar] [CrossRef] [Scilit]
  16. Holzer, T.L.; Davis, S.N.; Lofgren, B.E. Faulting caused by groundwater extraction in southcentral Arizona. J. Geophys. Res. 1979, 84, 603–612. [Google Scholar] [CrossRef] [Scilit]
  17. Segall, P. Earthquakes triggered by fluid extraction. Geology 1989, 17, 942–946. [Google Scholar] [CrossRef] [Scilit]
  18. Foulger, G.R.; Wilson, M.P.; Gluyas, J.G.; Julian, B.R.; Davies, R.J. Global review of human-induced earthquakes. Earth. Sci. Rev. 2018, 178, 438–514. [Google Scholar] [CrossRef] [Scilit]
  19. Gonzalez, P.J.; Tiampo, K.F.; Palano, M.; Cannavo, F.; Frenandez, J. The 2011 Lorca earthquake slip distribution controlled by groundwater crustal unloading. Nat. Geosci. 2012, 5, 821–825. [Google Scholar] [CrossRef] [Scilit]
  20. Amos, C.B.; Audet, P.; Hammond, W.C.; Bürgmann, R.; Johanson, I.A.; Blewitt, G. Uplift and seismicity driven by groundwater depletion in central California. Nature 2014, 509, 483–486. [Google Scholar] [CrossRef] [Scilit] [PubMed]
  21. Kundu, B.; Vissa, N.K.; Gahalaut, V.K. Influence of anthropogenic groundwater unloading in Indo-Gangetic plains on the 25 April 2015 Mw7.8 Gorkha, Nepal earthquake. Geophys. Res. Lett. 2015, 42, 10607–10613. [Google Scholar] [CrossRef] [Scilit]
  22. Kundu, B.; Vissa, N.K.; Gahalaut, K.; Gahalaut, V.K.; Panda, D.; Malik, K. Influence of anthropogenic groundwater pumping on the 2017 November 12 M7.3 Iran-Iraq border earthquake. Geophys. J. Int. 2019, 218, 833–839. [Google Scholar] [CrossRef] [Scilit]
  23. Wu, W. A review of unloading-induced fault instability. Undergr. Space 2021, 6, 528–538. [Google Scholar] [CrossRef] [Scilit]
  24. Tiwari, D.K.; Jha, B.; Kundu, B.; Gahalaut, V.K.; Vissa, N.K. Groundwater extraction-induced seismicity around Delhi region, India. Sci. Rep. 2021, 11, 10097. [Google Scholar] [CrossRef] [Scilit] [PubMed]
  25. Guglielmi, Y.; Cappa, F.; Avouac, J.P.; Henry, P.; Elsworth, D. Seismicity triggered by fluid injection-induced aseismic slip. Science 2015, 348, 1224–1226. [Google Scholar] [CrossRef] [Scilit] [PubMed]
  26. Pennington, W.D.; Davis, S.D.; Carlson, S.M.; Dupree, J.; Ewing, T.E. The evolution of seismic barriers and asperities caused by the depressuring of fault planes in oil and gas fields of South Texas. Bull. Seismol. Soc. Am. 1986, 76, 939–948. [Google Scholar]
  27. Kurita, K.; Kinugasa, Y.; Rimando, R.E.; Papiona, K. Continuous monitoring of the fault creeping on Marikina Valley fault system (MVFS), Metro Manila, Philippines. Res. Rep. Tokyo Metrop. Coll. Ind. Technol. 2011, 5, 6–9. [Google Scholar]
  28. Kurita, K.; Kinugasa, Y.; Deguchi, T.; Rimando, R.E. Monitoring of ground deformation in southern part of Metro Manila, Philippines. In Advances in Civil Engineering and Building Materials; Chang, S., Al Bahar, S., Zhao, J., Eds.; Taylor & Francis Group: London, UK, 2012; pp. 437–440. [Google Scholar] [CrossRef] [Scilit]
  29. Kurita, K.; Kinugasa, Y.; Deguchi, T.; Rimando, R. Monitoring of active fault in south-east part of Metro Manila, Philippines. Res. Rep. Tokyo Metrop. Coll. Ind. Technol. 2015, 9, 41–45. [Google Scholar]
  30. Kurita, K.; Kinugasa, Y.; Rimando, R.E.; Garduque, J.R. Monitoring of ground deformation along the Marikina Valley fault system, Manila, Philippines. In Proceedings of the 12th International Workshop on Seismic Microzoning and Risk Reduction, Lima, Peru, 5–8 September 2018; Kanagawa University: Yokohama, Japan, 2018; pp. 1–7. [Google Scholar]
  31. Sneineh, A.A.; Shabaneh, A.A.; Salah, W.A. Development of a monitoring system for natural hazard resistant building using Arduino microcontroller. SSRG Int. J. Electr. Electron. Eng. 2025, 12, 112–122. [Google Scholar] [CrossRef] [Scilit]
  32. Variacion, H.J.S.; Bugahod, M.A.M.; Tubio, K.F.A.; Tillor, N.D.; Rangas, J.F.; Salapang, V.E.; Casiño, K.R.N.; Roa, N.S., III. Development of automated rain gauge monitoring system. Int. J. Eng. Res. Tech. 2025, 14, IJERTV14IS120470. [Google Scholar] [CrossRef]
  33. Kennedy, G.C.; Luckyn, B.J.; Jaja, T.T.; Idahtonye, T. Design of an internet of things rain detector device with GSM notification. Iconic Res. Eng. J. 2022, 6, 133–134. [Google Scholar]
  34. Beltran, A.A., Jr.; Dizon, K.J.T.; Nones, K.C.; Salanguit, R.L.M.; Santos, J.B.D.; Santos, J.R.G. Arduino-based disaster management alarm system with SMS. J. Robot. Control 2021, 2, 24–28. [Google Scholar] [CrossRef] [Scilit]
  35. Saehana, S.; Lala, A. Liquefaction alarm prototype using arduino uno microcontroller. J. Phys. Conf. Ser. 2021, 2126, 012002. [Google Scholar] [CrossRef] [Scilit]
  36. Abella, A.P.N.; Enriquez, M.D. Community-based flood alert system using long-range technology for Brgy. San Agustin, San Jose, Occidental Mindoro. Mindoro J. Soc. Sci. Dev. Stud. 2024, 1, 27–34. [Google Scholar]
  37. Magableh, M.; Marie, Z.; Mohamed, R.R.; Ibrahim, M.H.B.; Jusoh, J.A.; Kumar, R. Using Arduino Iot modules as a low cost environmental research monitoring system. In Proceedings of the International Conference on Computer Science and Emerging Technologies (CSET), Bangalore, India, 10–12 October 2023; pp. 1–6. [Google Scholar] [CrossRef] [Scilit]
  38. Yadav, A.; Yadav, N.; Srivastava, S.; Pandey, S.; Chauhan, M.S. Landslide detection system using Arduino: A review. J. Eng. Technol. Manag. 2025, 75, 136–142. [Google Scholar]
  39. Varun Menon, O.; Narasimha, D.S. Landslide warning system based on Arduino. In Proceedings of the Symposium on Landslides in Kerala, Munnar, India, 23 February 2019; pp. 37–40. [Google Scholar]
  40. Sruthy, M.R.; Anjana, R.; Archana, R.; Dhanya, V.; Hridya, A.H. IoT based landslide detection and monitoring system. Int. J. Res. Eng. Sci. Manag. 2020, 3, 2581–5792. [Google Scholar]
  41. Gowda, B.V.; Sindhu, B.N.; Tanuja, S.; More, T. Early landslide detection using IOT. Int. J. Adv. Res. Comput. Commun. Eng. 2024, 13, 95–103. [Google Scholar]
  42. Langbein, J.; Bilham, R.G.; Snyder, H.A.; Ericksen, T. Summary of Creepmeter Data from 1980 to 2020—Measurements Spanning the Hayward, Calaveras, and San Andreas Faults in Northern and Central California; Open-File Report 2024-1011; U.S. Geological Survey: Reston, VA, USA, 2024; pp. 1–110. [CrossRef] [Scilit]
  43. Lee, J.-C.; Angelier, J.; Chu, H.-T.; Hu, J.-C.; Jeng, F.-S.; Rau, R.-J. Active fault creep variations at Chihshang, Taiwan, revealed by creep meter monitoring, 1998–2001. J. Geophys. Res. 2003, 108, 2528. [Google Scholar] [CrossRef] [Scilit]
  44. Lee, J.-C.; Angelier, J.; Chu, H.-T.; Hue, J.-C.; Jeng, F.-S. Monitoring active fault creep as a tool in seismic hazard mitigation. Insights from creepmeter study at Chihshang, Taiwan. C. R. Geosci. 2005, 337, 1200–1207. [Google Scholar] [CrossRef] [Scilit]
  45. Trigali, G.; Victor, P.; Azzaro, R.; Bella, D.; Bonforte, A.; Crosetto, S.; Gropelli, G.; Michetti, M.; Pettinato, R.; Urlaub, M. Site selection for Creepmeter fault monitoring in a complex volcano-tectonic framework: The Mt. Etna Eastern flank as an example. In Proceedings of the 11th International INQUA Workshop on Paleoseismology, Active Tectonics and Archaeoseismology, Aix-En-Provence, France, 25–30 September 2022; pp. 205–208. [Google Scholar]
  46. Victor, P.; Oncken, O.; Sobiesiak, M.; Kemter, M.; Gonzalez, G.; Ziegenhagen, T. Dynamic triggering of shallow slip on forearc faults constrained by monitoring surface displacement with the IPOC Creepmeter Array. Earth Planet. Sci. Lett. 2018, 502, 57–73. [Google Scholar] [CrossRef] [Scilit]
  47. Bring Your Projects to Life with Arduino Software. Available online: https://www.arduino.cc/en/software/ (accessed on 20 April 2026).
  48. Programming (Arduino Programming Language). Available online: https://docs.arduino.cc/programming/ (accessed on 20 April 2026).
  49. Using the Arduino Software (IDE). Available online: https://docs.arduino.cc/learn/starting-guide/the-arduino-software-ide/ (accessed on 20 April 2026).
  50. Nicolau, V.; Miholca, C.; Andrei, M. Fuzzy rules of sound speed influence on ultrasonic sensing in outdoor environments. In Proceedings of the 3rd International Workshop on Soft Computing Applications, Szeged-Arad, Romania, 29 July–1 August 2009; Institute of Electrical and Electronics Engineers: Piscataway, NJ, USA, 2009; pp. 145–150. [Google Scholar]
  51. Panda, G.; Agrawal, D.; Nshimiyimana, A.; Hossain, A. Effects of environment on accuracy of ultrasonic sensor operates in millimetre range. Perspect. Sci. 2016, 8, 574–576. [Google Scholar] [CrossRef] [Scilit]
  52. Bohn, D.A. Environmental effects on the speed of sound. J. Audio Eng. Soc. 1988, 36, 223–231. [Google Scholar]
  53. Philippine Atmospheric, Geophysical and Astronomical Services Administration. Available online: https://www.pagasa.dost.gov.ph/climate/tropical-cyclone-associated-rainfall (accessed on 15 August 2024).
  54. Gonzalez, E.B. Tropical cyclones and storm surges. In Proceedings of the National Conference on Natural Disaster Mitigation in the Philippines, Quezon City, Philippines, 19–20 October 1994; Punongbayan, R.S., Ed.; Philippine Institute of Volcanology and Seismology: Quezon City, Philippines, 1994; pp. 11–18. [Google Scholar]
  55. World Weather Online. Available online: https://www.worldweatheronline.com/binan-weather-averages/laguna/ph.aspx (accessed on 15 August 2024).
  56. Kurita, K.; Kinugasa, Y.; Deguchi, T.; Rimando, R.E.; Watanabe, M. Monitoring aseismic surface creep along the Western Valley (Marikina) Fault. In Proceedings of the 11th International Workshop on Seismic Microzoning and Risk Reduction, Granada, Spain, 22–24 October 2016; pp. 1–5. Available online: https://www.researchgate.net/publication/333891626_Monitoring_Aseismic_Surface_Creep_along_the_Western_Valley_Marikina_Fault (accessed on 15 February 2025).
  57. Roeloffs, E. Creep rate changes at Parkfield, California 1966–1999: Seasonal, precipitation induced, and tectonic. J. Geophys. Res. 2001, 106, 16525–16547. [Google Scholar] [CrossRef] [Scilit]
  58. Schulz, S.; Burford, R.O.; Mavko, B. Influence of Seismicity and Rainfall on Episodic Creep on the San Andreas Fault System in Central California. J. Geophys. Res. 1983, 88, 7475–7484. [Google Scholar] [CrossRef] [Scilit]
  59. Hsu, Y.-J.; Yu, S.-B.; Loveless, J.P.; Bacolcol, T.; Solidum, R.; Luis, A.; Pelicano, A.; Woessner, J. Interseismic deformation and moment deficit along the Manila subduction zone and the Philippine Fault system. J. Geophys. Res. Solid Earth 2016, 121, 7639–7665. [Google Scholar] [CrossRef] [Scilit]
  60. Galgana, G.; Hamburger, M.; McCaffrey, R.; Corpuz, E.; Chen, Q.Z. Analysis of crustal deformation in Luzon, Philippines using geodetic observations and earthquake focal mechanisms. Tectonophysics 2007, 432, 63–87. [Google Scholar] [CrossRef] [Scilit]
Figure 1. (a) Location of the West Valley Fault (WVF) in the island of Luzon, northern Philippines. PSP—Philippine Sea Plate, SP—Sunda Plate, PT—Philippine Trench, ELT—East Luzon Trough, and MT—Manila Trench. (b) The VFS segments are denoted by Numbers I to X. The creeping segment (segment II) occurs along the WVF, which is one of the two major segments of the Valley Fault System (VFS). The Philippine Fault Zone (PFZ), Sierra Madre Range, Tagaytay Highlands, and the Macolod Corridor—a zone of volcanism and faulting—to the south are also shown. White dashed lines indicate approximate location of Macolod Corridor’s boundaries. White arrows indicate direction of extension of the Macolod Corridor. MV—Marikina Valley. (c) Detailed map of the creeping zone area. Creepmeters installation sites are at Villa Olympia Subdivision (VOS) and Juana Subdivision (JUA) in the southern part of the creeping zone. VOS and JUA are also precise leveling sites. Also shown are the other precise leveling sites (NPC, KLT, DJB, GRV, and ADL).
Geohazards 07 00096 g001
Figure 2. Ultrasonic creepmeter schematic.
Geohazards 07 00096 g002
Figure 3. Linear Variable Differential Transformer (LVDT) creepmeter schematic.
Geohazards 07 00096 g003
Figure 4. Rain gauge schematic.
Geohazards 07 00096 g004
Figure 5. Plot of the electric output of the LVDT creepmeter vs. distance measured and the output of the ultrasonic creepmeter vs. distance measured.
Geohazards 07 00096 g005
Figure 6. (a) Ultrasonic and LVDT creepmeter–rain gauge system setup at Juana Subdivision (JUA), located at the southern end of the creeping zone in Binan, Laguna. (b) The ultrasonic and LVDT creepmeter platform at JUA is subparallel and of comparable length to the line of precise leveling benchmarks. (c) The sensor–controller systems for the LVDT and ultrasonic creepmeters installed at JUA. (d) The solar power systems for the LVDT and ultrasonic creepmeters at JUA. (e) The rain gauge system deployed at JUA is located several meters northwest of the creepmeters.
Geohazards 07 00096 g006
Figure 7. (a) Ultrasonic and LVDT creepmeter–rain gauge system setup at Villa Olympia Subd. (VOS), San Pedro, Laguna. (b) The solar power systems for the LVDT and ultrasonic creepmeters at VOS. The rain gauge system and the solar power system for the ultrasonic creepmeter share a single mounting post. (c) The simple creepmeter platform at VOS is also beside the line of precise leveling benchmarks.
Geohazards 07 00096 g007
Figure 8. The plot of ultrasonic and LVDT displacement measurements at VOS from 19 November 2024 (2024.88 y) to 17 July 2025 (2025.54 y). Cumulative rainfall during the same period was measured by the rain gauge deployed at VOS.
Geohazards 07 00096 g008
Figure 9. The plot of ultrasonic displacement measurements and rainfall at VOS from 1 July 2025 (2025.5 y) to 2 December 2025 (2025.92 y). LVDT displacement measurements are also shown for the period from 2025.54 y to 2025.84.
Geohazards 07 00096 g009
Figure 10. (a) The plot of JUA ultrasonic displacements for the 5 December 2021 (2021.93 y) to 8 June 2023 (2023.44 y) monitoring period. Average monthly rainfall and tropical cyclone occurrences during the monitoring period are also shown. Sources: [6,53,55]. (b) The displacement-versus-time plot displays vertical creep slip recorded by the VOS LVDT creepmeter from 2023 to 2024. It also tracks rainfall data from the VOS rain gauge, logged at 30 min intervals, starting from 10 June 2023. Sources: [6,53,55]. (c) Vertical creep slip at JUA (2022–2024) via LVDT creepmeter. Rainfall data are from the VOS rain gauge, installed on 10 June 2023. Tropical cyclones during the monitoring period are also plotted. Sources: [6,53,55].
Geohazards 07 00096 g010
Figure 11. Composite time-series of displacements recorded by the LVDT and ultrasonic creepmeters. The JUA ultrasonic displacement data were reduced to a daily displacement plot for simplicity. Displacement and slip rate were estimated from the ultrasonic data using a trendline which was drawn through the highly variable ultrasonic displacement plot. Estimated slip rates are: VOS LVDT = 1.57 cm/yr from 2023.25 y to 2024.24 y; JUA Ultrasonic = 0.61 cm/yr from 2021.93 y to 2023.44 y; JUA LVDT = 1.4 cm/yr from 2022.32 y to 2024.22 y. The JUA LVDT and ultrasonic creepmeters yielded identical slip rates (0.8 cm/yr) when both were operating from 2022.32 y to 2023.25 y. Source: [6].
Geohazards 07 00096 g011
Disclaimer/Publisher’s Note: The statements, opinions and data contained in all publications are solely those of the individual author(s) and contributor(s) and not of MDPI and/or the editor(s). MDPI and/or the editor(s) disclaim responsibility for any injury to people or property resulting from any ideas, methods, instructions or products referred to in the content.