1. Introduction
Landslides are among the most widely distributed and frequently destructive geological hazards in the mountainous and hilly regions of China. Under intense or prolonged rainfall, they often form cascading hazards together with collapses and debris flows, posing serious threats to human life, property, and regional sustainable development. Scientific and reliable landslide susceptibility assessment, which delineates high-risk spatial units, provides a scientific basis for disaster-risk management, prevention and mitigation decisions and territorial spatial planning. Over the past two decades, the methodology of landslide susceptibility assessment has shifted from expert-weighted approaches, bivariate statistics, and multivariate statistical regression to data-driven machine learning and even deep learning, with steadily improving discrimination accuracy. Yet as model complexity increases, the tension between high-accuracy black boxes and transparent explanation has become increasingly acute. Disaster management requires traceable and accountable factor attribution, whereas it is often difficult to make the decision mechanisms of high-accuracy models transparent. Post hoc explainability methods such as SHAP, which have rapidly developed in the past three years, have partly bridged the gap between accuracy and explanation. Existing studies, however, usually validate explanatory effectiveness with a single algorithm and a single study area. Key issues, including whether factor importance drifts across algorithms and whether explanatory conclusions are physically consistent, remain insufficiently tested. As a result, explainability often becomes an accessory to accuracy rather than independent evidence of reliability.
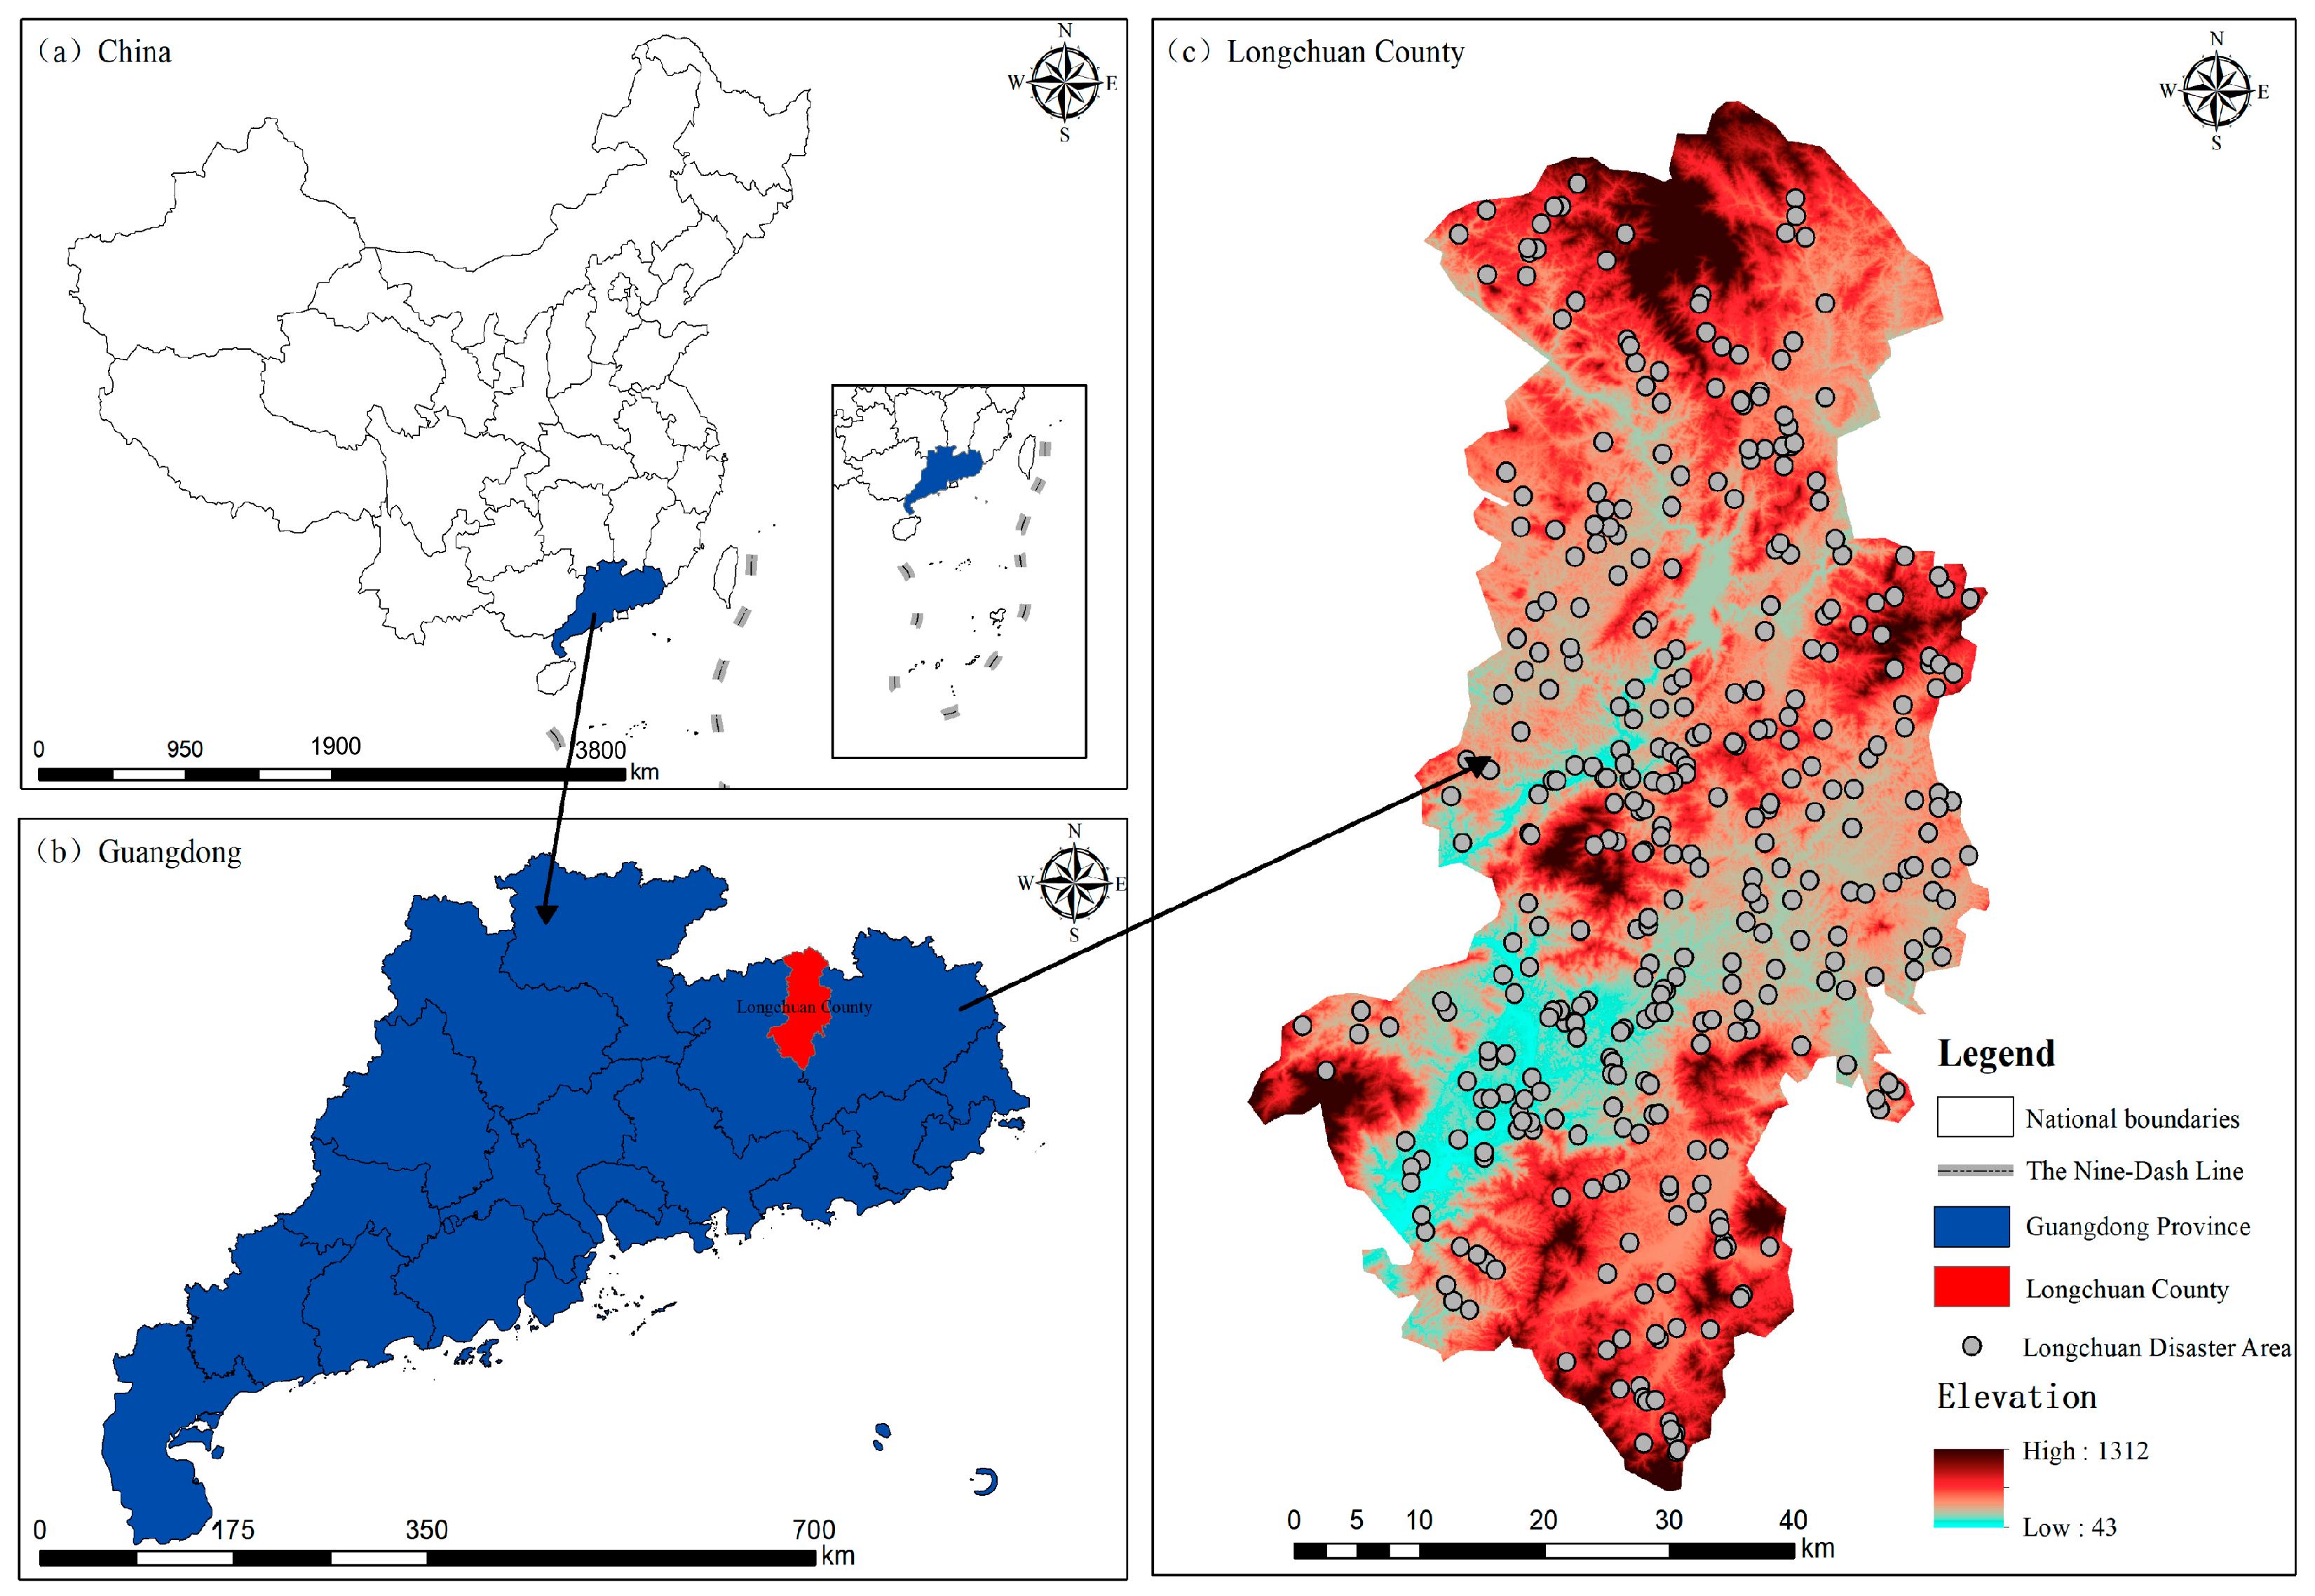
At the same time, substantial local geological-mechanism knowledge and disaster inventories have accumulated in China’s loess regions, reservoir-bank regions, and earthquake-damaged regions. Yet these studies have mostly remained at the level of statistical modeling or disaster identification. Few systematic efforts have integrated local geological priors, horizontal multi-model comparison, and explainable attribution within a single framework. Longchuan County, located in northeastern Guangdong Province, in the upper reaches of the Dongjiang and Hanjiang rivers, contains interlaced mountains and hills, reservoir-bank slopes, and Danxia and granite-weathering landforms. Shallow landslides occur frequently under heavy rainfall, but the area has long lacked a targeted high-quality landslide inventory and a multi-model comparative assessment constrained by explainability.
Against this background, this study takes the Longchuan basin as the research object and constructs a multi-model comparative framework for explainable machine learning. On the one hand, a horizontal comparison of eight mainstream machine learning models is used to test the stability of SHAP-based factor attribution across models, responding to blind spots in the international literature concerning explanatory credibility. On the other hand, local terrain, geological, hydrological, and human-activity factors in Longchuan are incorporated into explainable modeling, bridging the gap between local empirical research and frontier methods. The goal is to provide an accurate, transparent, and accountable scientific basis for regional landslide prevention and mitigation.
The mainstream approach to landslide susceptibility modeling couples historical landslide inventories with topographic, geological, hydrological, vegetation, and human-activity factors and then trains classifiers to output spatial probabilities. In algorithm selection, international research has long compared random forest (RF), support vector machine (SVM), logistic regression (LR), and gradient-boosting models. Saha et al. systematically compared single and ensemble models in the Rudraprayag district of the Garhwal Himalayas and found that the ANN-RF-LR ensemble outperformed any single algorithm in both goodness of fit and predictive ability, establishing an empirical consensus that ensembles outperform individual models [
1]. Dou et al. built bagging, boosting, and stacking frameworks using SVM as the base learner in northern Kyushu, Japan, verified the best performance of SVM-Boosting, and identified rainfall as the dominant triggering factor [
2]. Such studies established the basic paradigm of multi-model comparison: using AUC/ROC as a common metric to judge algorithmic performance on the same dataset.
After adopting this paradigm, research quickly turned toward more complex heterogeneous ensembles and stacking strategies closely linked to practical data from typical hazard areas in China. Hu et al. used Luxi County in western Yunnan as an example and adopted a stacking ensemble with SVM, ANN, NB, and LR models as base learners; the maximum AUC reached 0.94, proving that stacking models are superior to single algorithms for accurately delineating susceptible areas [
3]. Because reservoir-bank landslides induced by impoundment and drawdown are dense in the Three Gorges Reservoir area, this region has become an important testing ground for ensemble learning in China. Gong et al. proposed three ensemble schemes in Fengjie County by integrating statistical models and machine learning [
4]. Zhou et al. combined non-landslide sample optimization with heterogeneous stacking in Fengjie County. Guo et al. systematically compared the generalization ability of homogeneous and heterogeneous ensembles in Wanzhou District [
5]. Wu and Wang further introduced EasyEnsemble to handle class imbalance and verified the superiority of gcForest [
6]. Liu et al., in Anhua County in Hunan; Liu et al., in Enshi City in Hubei; and Tian et al., in mountainous Chongqing, promoted the hierarchical and multi-source development of stacking ensembles through three-layer stacking and spectral-feature fusion [
7,
8,
9]. Together, these studies show that Chinese scholars have not been satisfied with simply replicating international algorithm comparisons; instead, they have continuously deepened and broadened ensemble strategies to respond to China’s complex geological structures and diverse hazard types.
International research has also deepened its reflection on the internal structure of ensembles in recent years. Matougui et al. systematically compared homogeneous and heterogeneous ensembles in the Djebahia region of Algeria and showed that homogeneous ensembles performed better in AUC and threshold-based metrics but were less robust than heterogeneous schemes such as dynamic ensemble selection (DES) [
10]. This finding offers a methodological reminder to the stacking frameworks commonly favored in China. Meanwhile, for small samples and class imbalance, Hussain et al. introduced generative adversarial networks (GANs) to synthesize balanced samples and used PS-InSAR for cross-validation [
11]. Lucchese et al. proposed an RF-ANN hybrid bagging ensemble [
12]. Zhang et al. compared optimization strategies such as PSO-SVM on the Qinghai–Tibet Plateau [
13]. Kumar et al. constructed a stacking ensemble using multivariate index overlay in the Darjeeling Himalayas [
14]. Li et al. combined information-value constrained sampling with stacking learning in Yiling District [
15]. The core debate is whether ensemble gains come from algorithmic diversity itself or from hidden optimization in sample and feature engineering. International studies tend to treat ensembles as algorithmic contributions that can be independently tested, whereas Chinese studies more often evaluate ensembles together with localized sample and factor processing. The two traditions therefore differ in their understanding of comparability.
With the success of convolutional neural networks (CNNs) in remote-sensing image analysis, landslide susceptibility assessment has entered a deep learning stage. Wu et al. were among the first to combine SMOTE oversampling with CNNs in Wanzhou District in the Three Gorges Reservoir area, significantly improving assessment accuracy [
16]. Youssef et al. compared SVM, CNN-1D, and CNN-2D models in the Asir region of Saudi Arabia and found that two-dimensional convolution achieved the highest accuracy because it could capture spatial neighborhood structure. This established the judgment that spatial structural information can be effectively used by deep models. Deep models have since evolved along two paths. The first is structural coupling: Zhao et al. proposed a shared-parameter multidimensional CNN to balance computational efficiency and overfitting control, and Wang Shouhua et al. coupled a certainty factor, CNN, and LSTM to achieve an AUC of 0.953 in Wuzhou, Guangxi [
17]. The second is the introduction of attention and Transformer mechanisms: Zhao et al. built CTLGNet, integrating a CNN and Transformer to extract local and global features simultaneously [
18]; Li et al. designed a lightweight CNN–Transformer multi-attention model that balances accuracy and deployability [
19]; Qu et al. combined dynamic buffer-based sample expansion with a Transformer–CNN coupling in Baoji [
20]; and Yuan and Chen proposed a three-stage ST–Transformer framework for national-scale assessment [
21]. In China, Kong et al. coupled the information-value method with a CNN (IV-CNN) on the Loess Plateau, showing the localized grafting of statistical priors [
22], while Liang et al. enhanced CNNs with bivariate methods in the Himalayas while considering interpretability [
23].
The accuracy advantage of deep learning is accompanied by a collapse of interpretability, giving rise to a repeatedly discussed paradox: the deeper and more complex the model representation becomes, the less transparent its decision mechanism is, while disaster management requires traceable and accountable factor attribution. International research has responded by embedding XAI directly into deep learning frameworks. Alqadhi et al. combined CNN-LSTM with explainability methods in the Nainital region and identified terrain and human activities as key factors [
24]. This path has also been adopted in China, but Chinese studies place greater emphasis on coupling deep models with InSAR deformation monitoring to improve dynamic performance and physical credibility. For example, Li et al. integrated SBAS-InSAR, YOLOv5n, and SHAP for detecting landslide hazards in open-pit mines [
25]. The divergence lies in the source of trust. International studies regard deep learning interpretability mainly as a post hoc algorithmic attribution problem, whereas Chinese studies tend to provide external physical constraints for deep models through multi-source observations, especially deformation data, thereby using data credibility to compensate for model opacity.
The reliability of susceptibility assessment depends not only on models but also on the selection and representation of conditioning factors, the sampling strategy for positive and negative samples, and uncertainty in the results. At the factor level, international studies focus on statistical independence and information redundancy. Bravo-Lopez et al. compared multiple feature-selection algorithms in Cuenca, Ecuador, and achieved the best results with XGBoost [
26]. Mind’je et al. analyzed the spatial correlations of ten factor categories in Rwanda using frequency ratios [
27]. Kaynak systematically integrated multiple feature-selection methods and artificial neural networks, verifying the dual improvement that dimensionality reduction brings to accuracy and interpretability [
28]. Chinese studies have questioned the representation of factors themselves more deeply. Huang et al. showed that replacing conventional linear factors with continuous spatial-density factors can significantly reduce prediction uncertainty [
29]. Liu et al. compared five models and six feature-selection methods and confirmed that recursive feature elimination optimized RF performed best [
30]. Liao et al. examined the interaction between raster resolution and dominant factors in Wushan-Wuxi [
31]. Chang et al. used slope units as assessment units to handle spatial heterogeneity [
32]. The central debate is whether factor contribution is an intrinsic property or a relative quantity that drifts with representation, spatial unit, and resolution. Extensive Chinese empirical research reveals the ubiquity of such drift and substantively challenges the implicit assumption, common in international studies, that factor importance can be transferred across regions.
Sample strategy, especially the selection of non-landslide negative samples, is another long-underestimated source of error. Chinese research has formed a relatively dense set of methods on this issue. Liu et al. revealed the influence of sampling strategy on model stability in Taojiang County and warned that AUC is not the only reliable criterion [
33]. Ning and Tie proposed negative-sample reliability sampling based on fuzzy membership [
34]. Yang et al. used frequency ratios to guide negative-sample selection and sample-ratio stratification [
35]. Liu et al. innovatively used SHAP factor importance to guide Bayesian negative-sample optimization, improving the AUC by 8.2–9.0% in three counties [
36]. Guo et al. verified the interaction between environmental-factor combinations and negative-sample strategies in granite collapse–gully areas [
37]. This line of research shows that Chinese studies have elevated sample reliability from an empirical operation to a quantifiable and optimizable modeling component. By contrast, international studies treat negative samples more sporadically, usually embedding them in preprocessing rather than testing them independently.
At the levels of uncertainty and validation, international and Chinese studies also differ in orientation. International studies place more emphasis on statistical quantification of uncertainty. Le et al. compared uncertainty and interpretability across five model types using Bayesian optimization and evaluated stability through Monte Carlo simulation [
38]. Chinese studies focus more on the geological sources and engineering implications of uncertainty. Xiao et al. characterized the spatial uncertainty of areal landslide susceptibility through weak-interlayer controlled sliding mechanisms [
39]. Meng and Xing, and Wang et al., provided dynamic checks on susceptibility results using InSAR deformation [
40,
41]. Xiao et al. proposed uncertainty-aware ensembles and dynamic threshold optimization [
42]. Huang et al. developed an ArcGIS V10.8-integrated SVM-LSM toolbox to improve mapping efficiency and reproducibility [
43]. Comparative studies of rockfall susceptibility by Gull et al. and Pokharel et al. further suggest that statistical and physical models have different applicability boundaries across hazard types [
44,
45].
In the past three years, post hoc explainability methods represented by SHAP (Shapley Additive Explanations) have rapidly become a frontier in landslide susceptibility research. This directly challenges the naive assumption that factor importance is model-independent and highlights the necessity of explainability analysis in multi-model comparison. Since then, the combination of XAI and machine learning has spread rapidly worldwide. Khan et al. and Utthasini et al. used XGBoost with SHAP and variable selection in the Himalayas to reveal distance to roads, elevation, and rainfall as controlling factors [
46]. Achu et al. combined multi-depth soil profiles with RF and SHAP and verified that slope units outperform grid units [
47]. Shao et al. used SHAP in Italy to analyze the spatial heterogeneity of rainfall thresholds [
48]. This represents another technical route, moving from post hoc explanation toward intrinsically interpretable models.
Chinese AI applications show two clear characteristics. First, SHAP is deeply embedded in ensemble and optimization frameworks. Huang et al. proposed a stacking–SHAP enhanced model that improves accuracy and interpretability simultaneously [
49]. Yan et al. built a heterogeneous hybrid model to strengthen explanatory robustness [
50]. Qiu et al. jointly used PDP, LIME, and SHAP to systematically improve model transparency [
51].
Although AI has partly bridged the gap between accuracy and explanation, both Chinese and international studies still reveal a deeper tension. International studies tend to treat SHAP as a unified explanatory language transferable across models and regions, often validating the superiority of an algorithm–explanation combination in a single study area. Chinese studies, however, are strongly anchored in the local empirical realities of specific Chinese hazard regions, such as loess, reservoir-bank, and earthquake-damaged areas, and repeatedly find that factor importance, optimal spatial units, and even optimal models drift by study area. The warning raised by Abdelkader, Csamer, and others that a high ROC-AUC does not necessarily mean practical reliability has not been fully internalized by most AI studies. Many studies still use discrimination accuracy as an implicit proof of explanatory validity, while lacking systematic tests of the stability and physical consistency of explanatory conclusions themselves.
Another important line of Chinese landslide research is localized exploration oriented toward specific geological units, especially the Loess Plateau and the Three Gorges Reservoir area. In the loess region, Sun et al. systematically reviewed progress in geological-hazard investigation and prevention in western loess areas and proposed strengthening risk investigation and monitoring under new conditions of climate variability and human activity [
52]. Zhang et al. revealed that hydrogeological conditions and saturated shear liquefaction of loess are key controls on persistent landslides in Heifangtai terraces and established liquefaction-susceptibility criteria [
53]. Tang et al. used PCA coupled with statistical models on the Shanxi Loess Plateau to compare the causal factors of loess landslides and rockfalls [
54]. These studies have accumulated substantial local geological knowledge, but their methods mostly remain at the level of statistical modeling or disaster identification and have not been fully integrated with the frontier framework of explainable machine learning multi-model comparison.
In summary, two nested gaps remain in current research. First, frontier international frameworks for explainable machine learning are not fully adapted to local conditions in terms of the stability and physical consistency of explanatory conclusions. Most studies validate explanatory effectiveness with a single algorithm and a single study area. As a result, explainability becomes an accessory to accuracy rather than independent evidence of reliability. Second, China’s rich local empirical research remains theoretically underdeveloped. Loess, reservoir-bank, and earthquake-damaged regions have accumulated abundant geological-mechanism knowledge and disaster inventories, but these are mostly tied to statistical modeling or disaster identification. Few systematic studies integrate local geological priors, multi-model comparison, and explainable attribution into one assessment framework. For specific basins such as Longchuan, there is still no targeted high-quality landslide inventory or factor system, nor has any multi-model comparative assessment under explainability constraints been carried out.
Therefore, this study constructs an explainable machine learning multi-model comparative framework for the Longchuan basin. It tests the cross-model stability of SHAP factor attribution through horizontal multi-model comparison, incorporates local geological conditions and factor systems into explainable modeling, and provides an accurate, transparent, and accountable scientific basis for regional landslide prevention and mitigation.
4. Explainability Analysis Based on the SHAP Model
To deeply analyze the internal mechanism by which machine learning models identify landslide susceptibility and to reveal the specific patterns of the contribution of environmental factors to landslide occurrence, this study uses SHAP (SHapley Additive exPlanations), based on Shapley cooperative game theory, to interpret the GBDT model, which showed the best comprehensive performance. SHAP assigns a contribution value to each feature and decomposes the model output, namely, landslide occurrence probability, into the cumulative contribution of each feature. It can reveal the relative importance of factors at the global level and explain specific prediction results at the individual-sample level, effectively compensating for the black-box characteristics of traditional machine learning models. This section analyzes the decision mechanism of GBDT from four perspectives: global feature importance and impact direction, nonlinear response of key factors, two-factor interaction effects, and the systematic interaction network. The twelve environmental factors used are NDWI, relief, DTR, ProfileCur, LULC, DTW, DTF, PlanCur, TWI, rainfall, aspect, and lithology.
(1) Global feature importance and impact direction
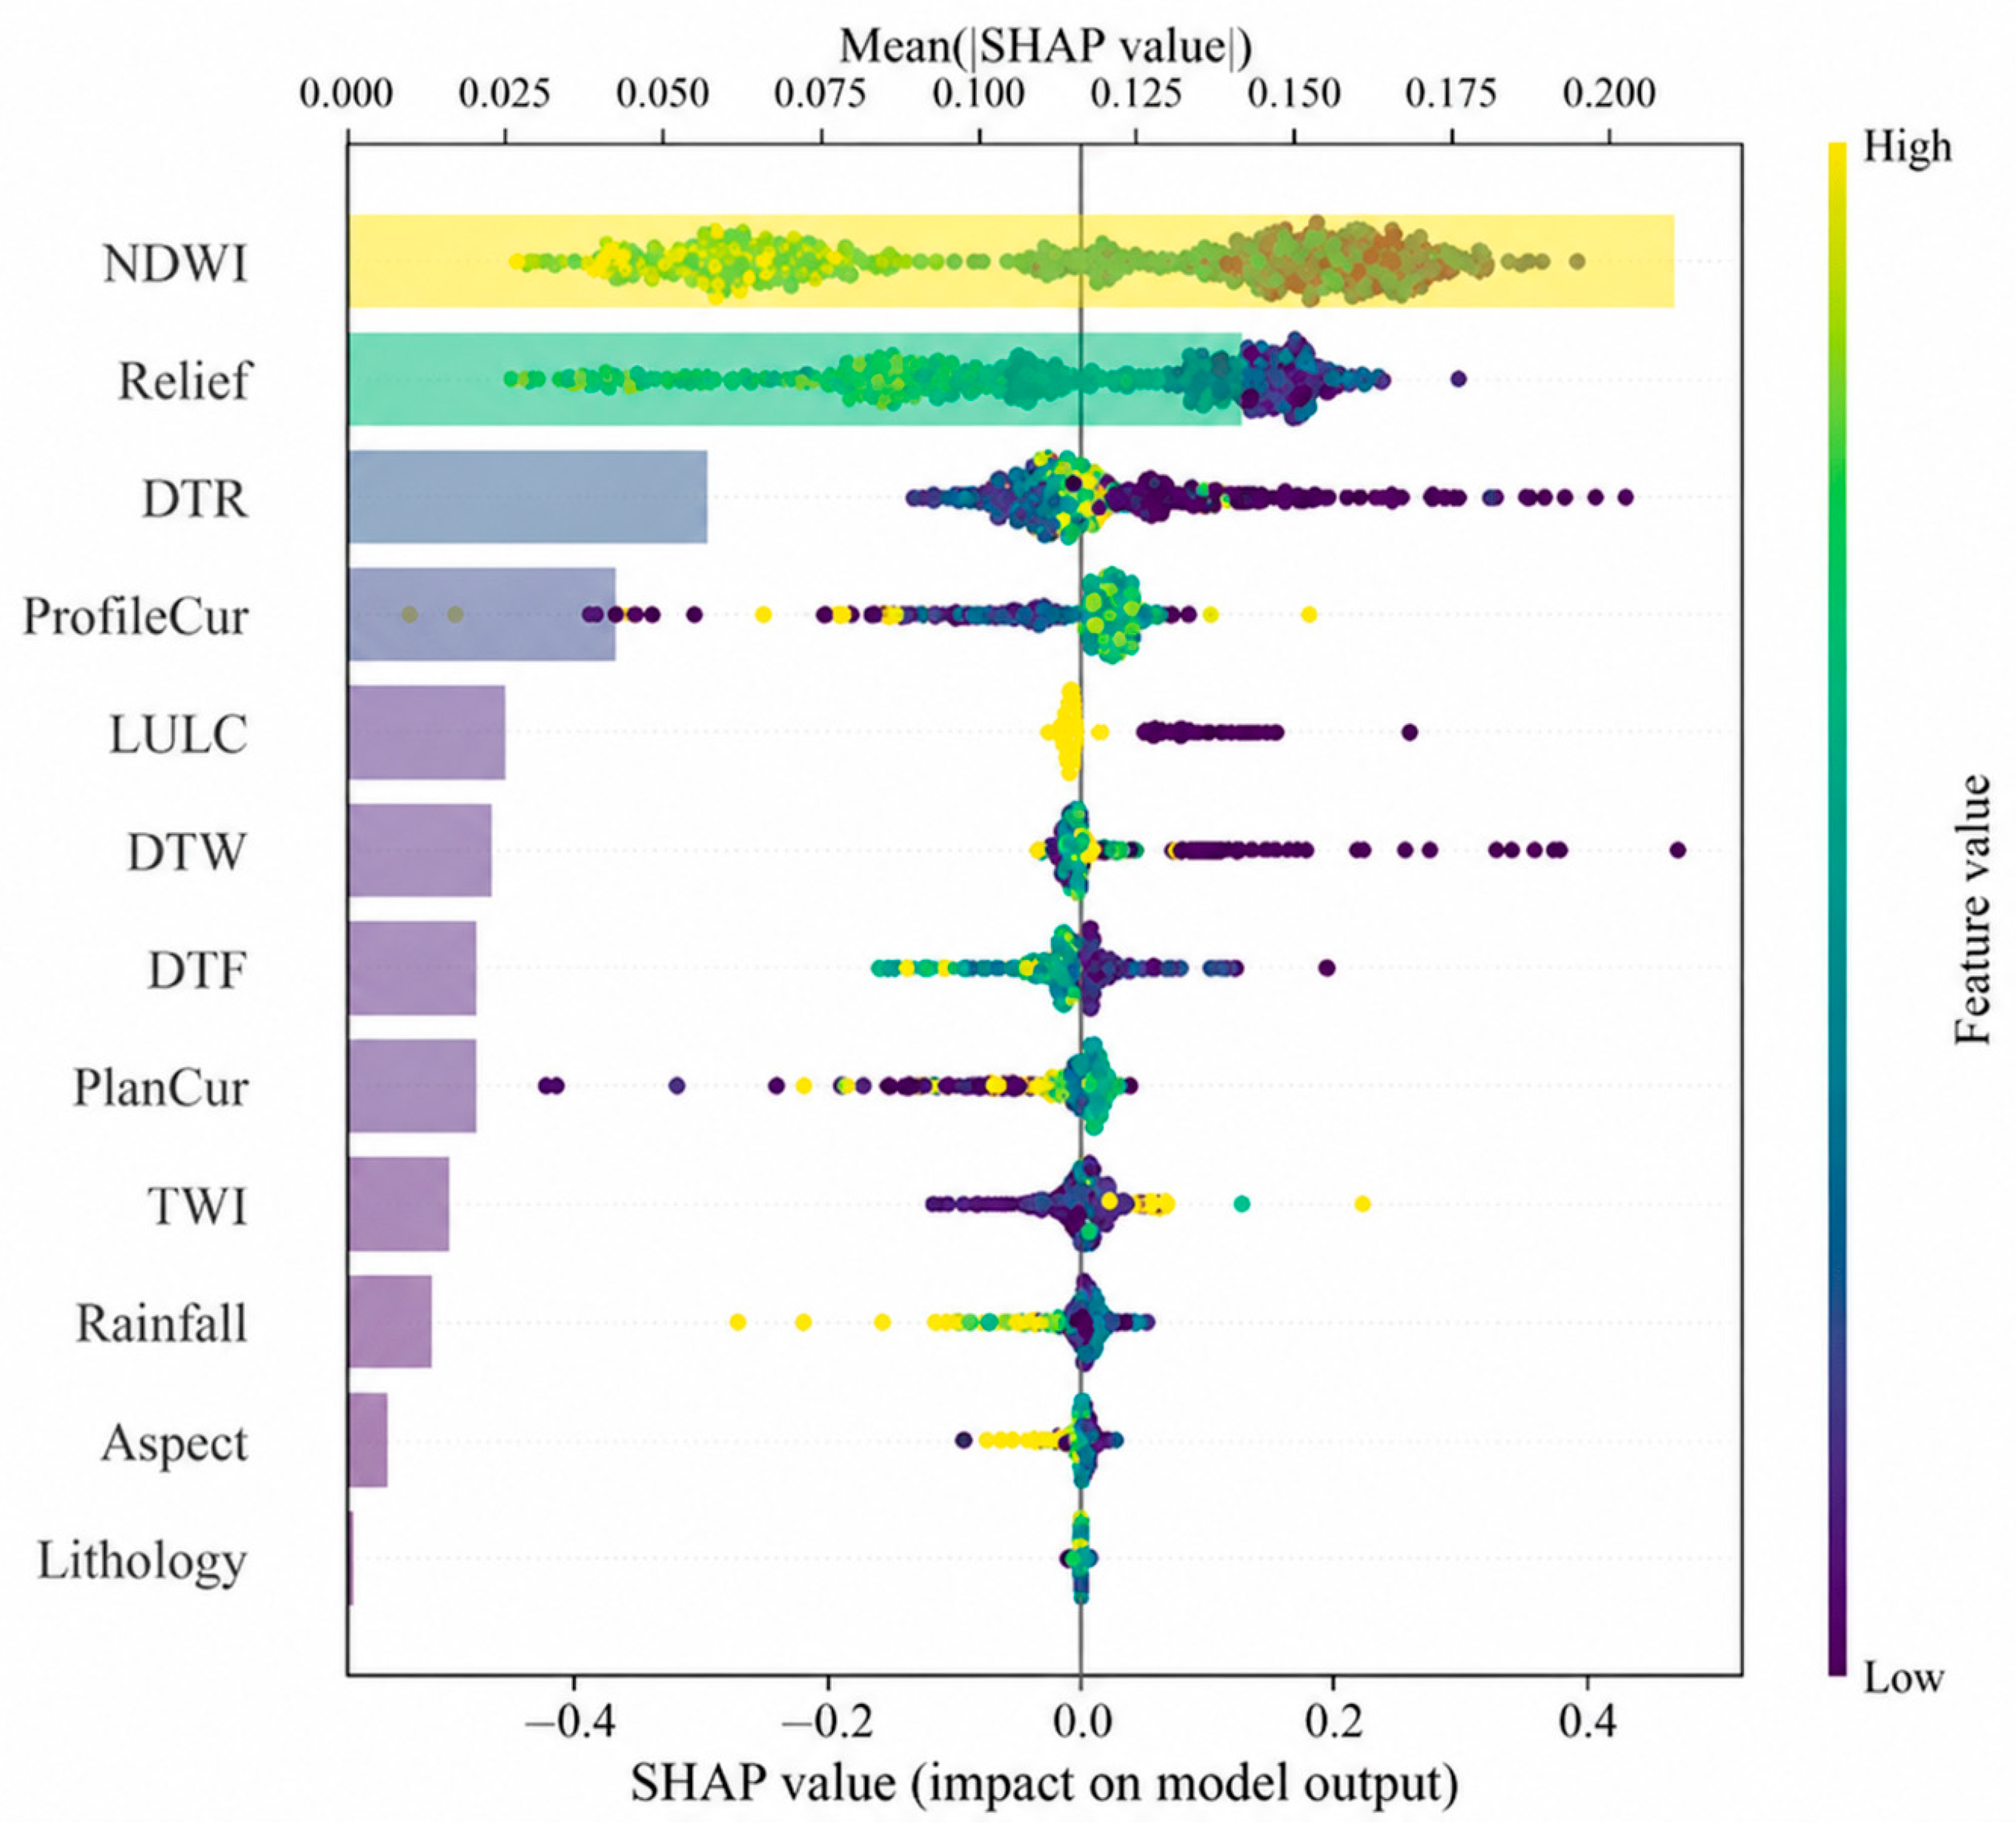
Figure 5 and
Table 5 integrates a SHAP-based global feature-importance bar chart and a beeswarm plot, jointly characterizing the global action patterns of factors from the perspectives of importance ranking and impact direction. The horizontal bar chart on the left side of
Figure 5, corresponding to the upper mean |SHAP value| axis, shows that the twelve environmental factors are ranked by mean absolute SHAP value as follows: NDWI > relief > DTR > ProfileCur > LULC > DTW > DTF > PlanCur > TWI > rainfall > aspect > lithology. NDWI has the highest mean absolute SHAP value (about 0.20), followed by relief (about 0.14) and DTR (about 0.06). These three factors are clearly higher than the remaining factors and constitute the three dominant factors in landslide susceptibility prediction for Longchuan. The contributions of intermediate factors such as ProfileCur, LULC, DTW, DTF, and PlanCur decrease in sequence. Aspect and lithology have the lowest contributions, and the mean absolute SHAP value of lithology approaches zero. This distribution indicates that landslide occurrence in Longchuan is mainly controlled by the coupling of water-body characteristics, terrain relief, and water-system activity, while the direct effects of lithology and aspect are relatively limited.
The right side of
Figure 5, including the beeswarm plot, further reveals the impact direction of each factor on model prediction. In this plot, the horizontal axis is the SHAP value, with positive values increasing landslide probability and negative values decreasing it, while point color indicates the feature value of each sample, with yellow representing high values and dark purple representing low values. The beeswarm distribution of NDWI shows a very wide two-direction spread. The positive SHAP region on the right is mainly occupied by dark-purple or brown low-value points, whereas high-value yellow-green points tend toward the negative SHAP region. This means that a lower NDWI, or weaker water-body characteristics, significantly increases landslide probability, whereas a high NDWI, representing water bodies themselves or stable low-lying floodplain areas, corresponds to lower risk. This is consistent with its physical meaning. Relief also shows strong two-direction influence. Low-value dark-purple points tend toward the positive SHAP region, while high values tend toward the negative region, suggesting that the effect of relief on landslides is clearly nonlinear and requires further analysis with dependence plots. In the beeswarm distribution for DTR, low-value points spread toward the positive SHAP region, indicating that proximity to roads increases landslide probability and reflecting the close link between road-cut disturbance and slope-drainage modification. DTW shows a pattern consistent with DTR, further confirming the key inducing role of water-system activity. Although rainfall has relatively low overall importance, its high-value yellow points tend toward the positive SHAP region, reflecting the positive triggering effect of high rainfall on landslides and matching the classical physical mechanism of rainfall-induced landslides.
(2) Nonlinear responses of key factors
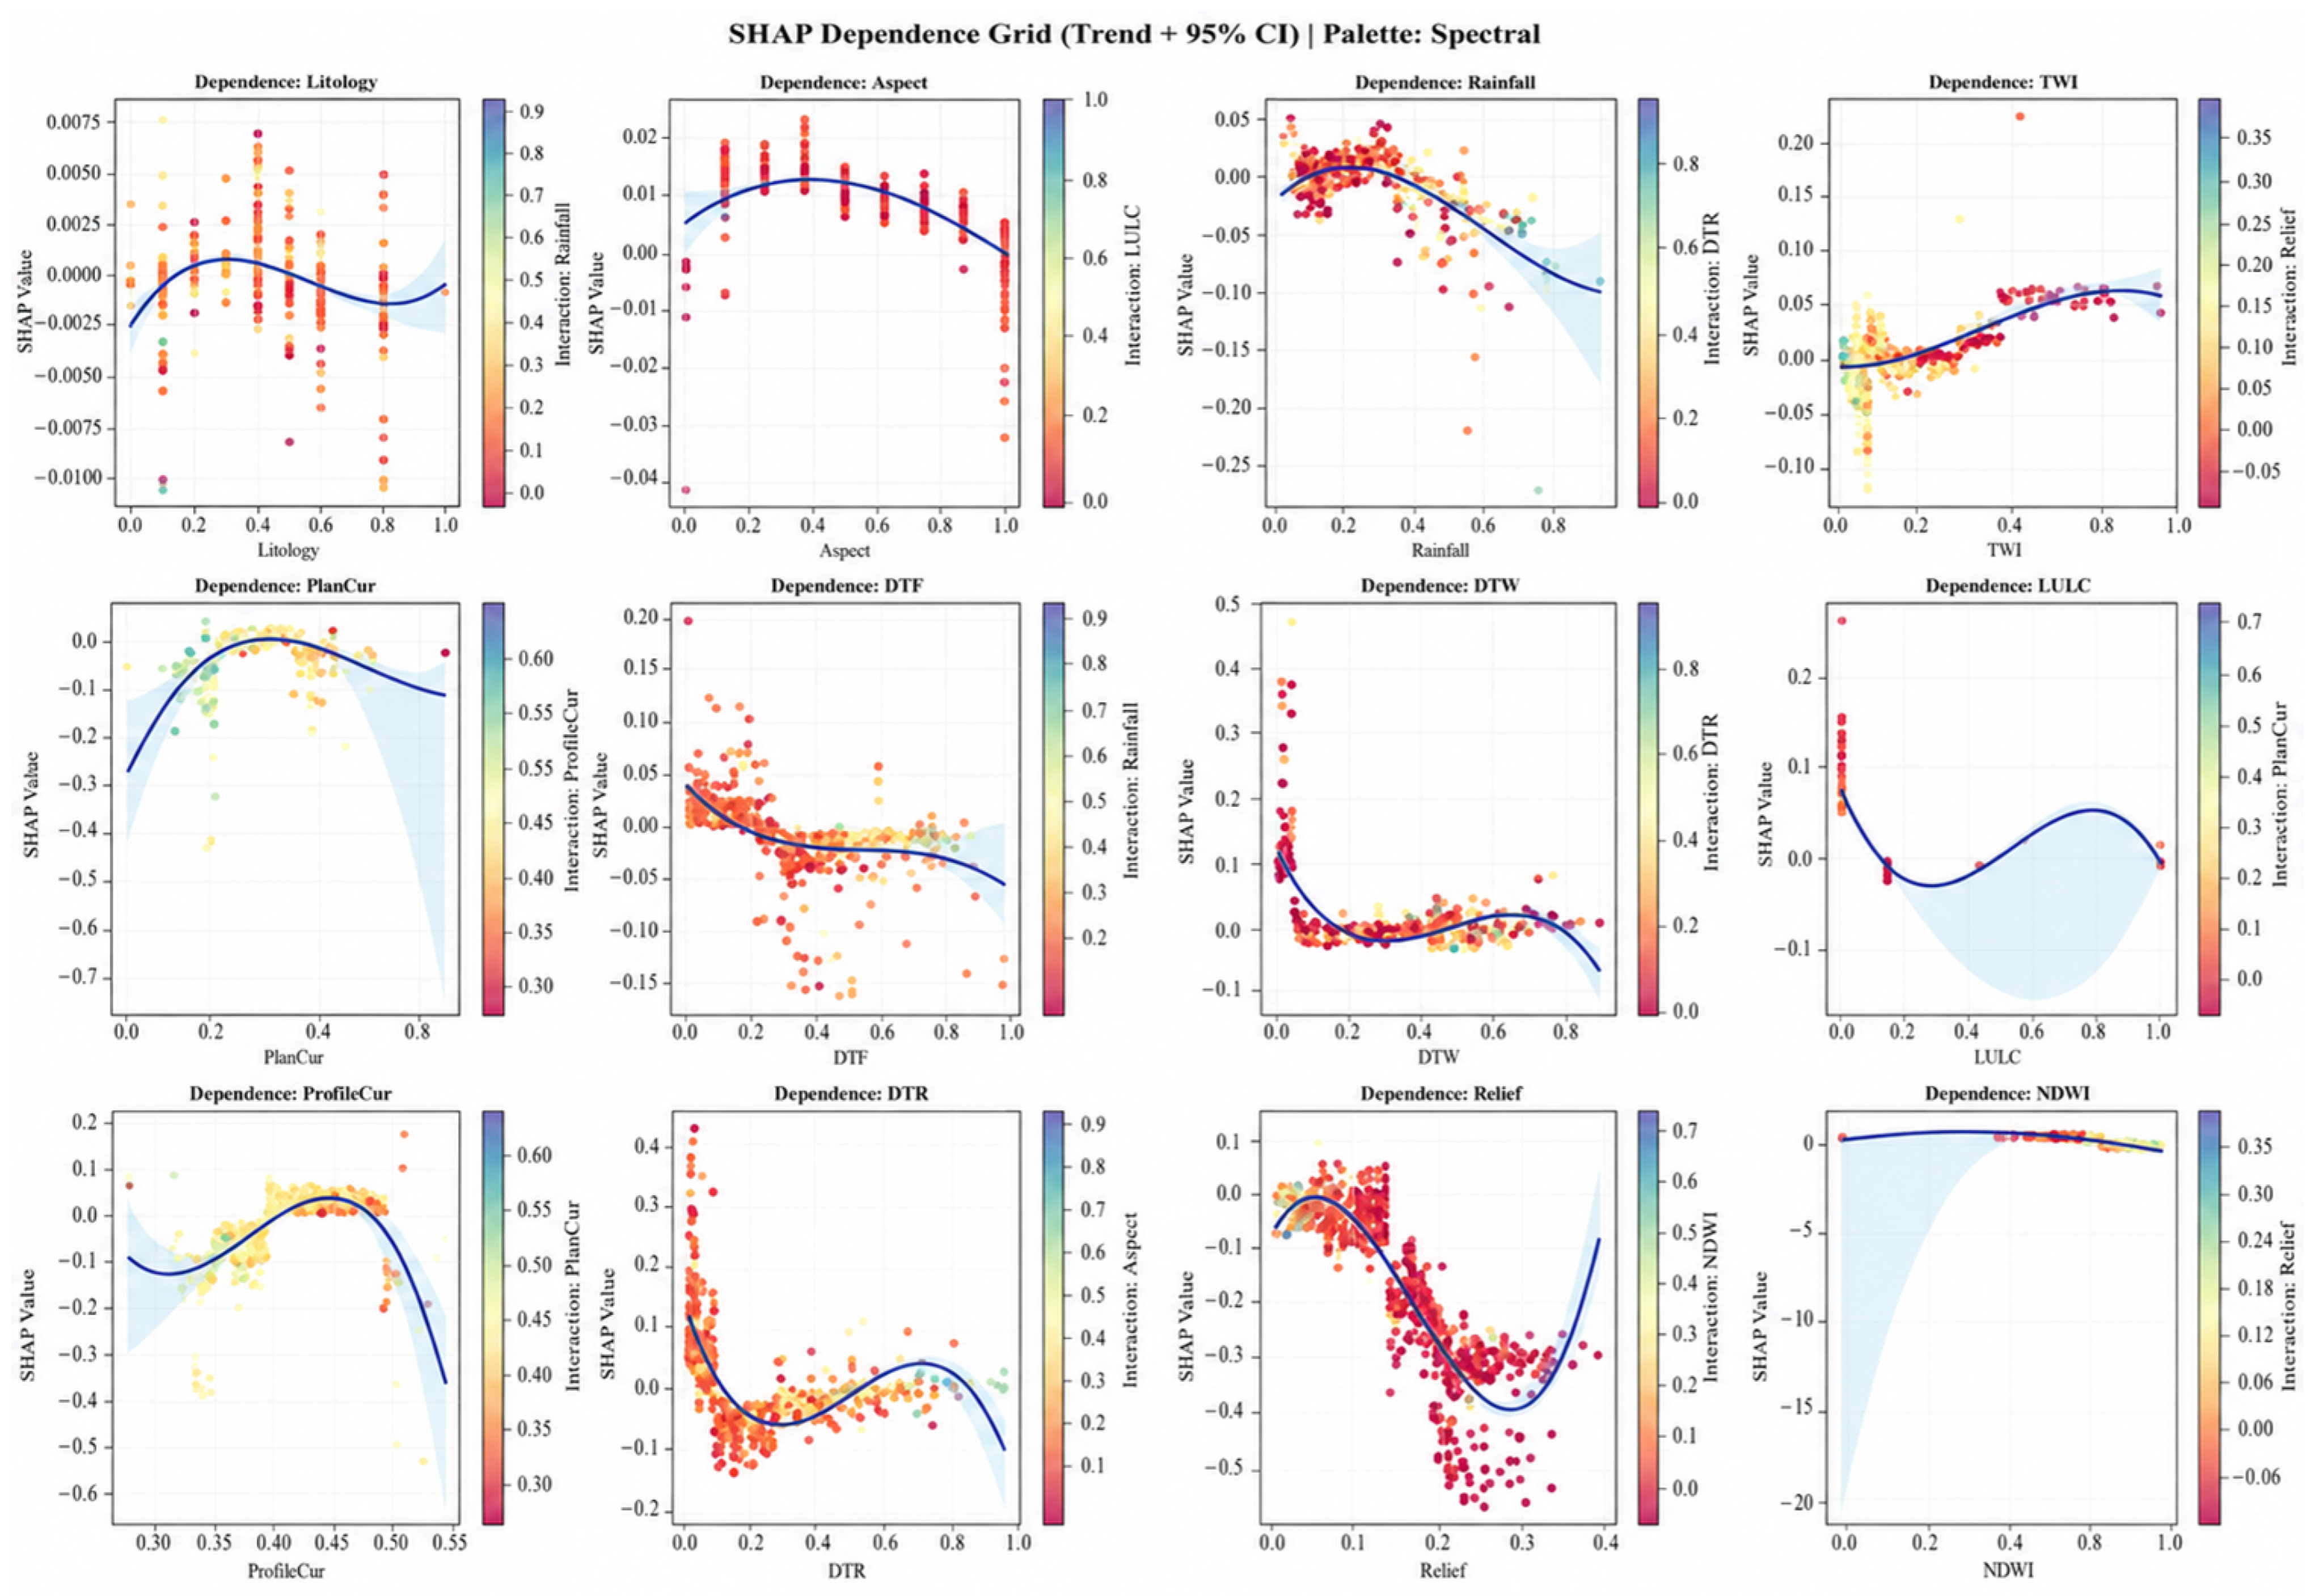
Figure 6 presents SHAP dependence plots for the twelve environmental factors. Through scatter points and fitted curves, these plots show the nonlinear relationship between factor values on the horizontal axis and SHAP contributions on the vertical axis. The light-blue shading represents the 95% confidence interval. Point colors encode each panel’s automatically selected dominant, i.e., most strongly interacting, factor; this coloring variable is selected separately for each focal factor and therefore varies across panels rather than always representing NDWI.
As the most important factor, NDWI has a dependence curve that is already near zero with a slightly positive level in the lower NDWI interval. As NDWI increases, the curve remains generally flat and declines slightly at the high-value end. However, its confidence interval widens sharply in the low-NDWI zone, extending downward into clearly negative values. This indicates large prediction uncertainty for samples with weak water-body characteristics, whereas the high-NDWI zone, representing strong water-body characteristics, stably corresponds to low landslide risk and is a stable zone.
The dependence curve of relief shows a clear pattern of first high, then low, and then rising again. In the low-relief zone (standardized value < 0.1), SHAP values exceed 0.15 and strongly increase landslide probability. As relief increases, SHAP values continue to decline and reach a trough of about −0.2 to −0.25 in the 0.25–0.30 interval. When relief continues to increase (>0.35), SHAP values rise again. This pattern reflects differentiated landslide mechanisms in different geomorphic positions in Longchuan. Low-relief hilly piedmont areas are frequently affected by human engineering disturbances and are prone to shallow instability; medium-relief areas are relatively stable; and high-relief steep mountains again become landslide-prone under gravity and weathering.
The dependence curve of DTR shows a typical sharp decline followed by a rebound. In near-road areas with standardized DTR values below 0.1, SHAP values reach 0.2–0.4 and strongly increase landslide probability. As the distance from roads increases, SHAP values rapidly fall to near zero and remain low in the 0.2–0.4 interval, then rise slightly near 0.6–0.7 before declining again. This curve indicates that the immediate road-disturbance zone is a critical threshold for abrupt landslide-risk change. The dependence curve of DTW is highly similar and shows a monotonic abrupt decline: when DTW < 0.05, SHAP values reach 0.3–0.4, then drop rapidly and stabilize as the distance from water increases. This confirms that water-system activity is another core driver of landslides in Longchuan.
The dependence curve of ProfileCur shows an inverted-U single peak. In the middle interval (standardized values of 0.40–0.45), SHAP values reach a peak of about 0.03, whereas values at both ends turn negative and drop sharply. This indicates that both strongly concave and strongly convex profile forms are unfavorable for slope stability. PlanCur shows a similar single-peak pattern, with the peak near 0.65 and negative values at both ends. The dependence curve of aspect shows an obvious bell-shaped single peak: SHAP values are positive in the middle aspect interval (0.2–0.5) and become negative at both ends, reflecting the promoting effect of certain aspects on landslides. The dependence curve of TWI shows a monotonic upward trend, with high-TWI areas, where water is prone to accumulate, corresponding to higher positive SHAP contributions. Rainfall shows a weak peak pattern of first increasing and then decreasing, while the SHAP magnitudes of LULC and lithology are generally small and have relatively limited influence on final prediction.
It is worth noting that the point-color coding in the dependence plots further reveals second-order interaction effects. For example, colors in the DTR dependence plot vary with rainfall, colors in the DTW dependence plot vary with DTR, and colors in the TWI dependence plot vary with relief. These patterns suggest interactions among these factor pairs, which are quantified in the following subsection.
(3) Systematic interaction network
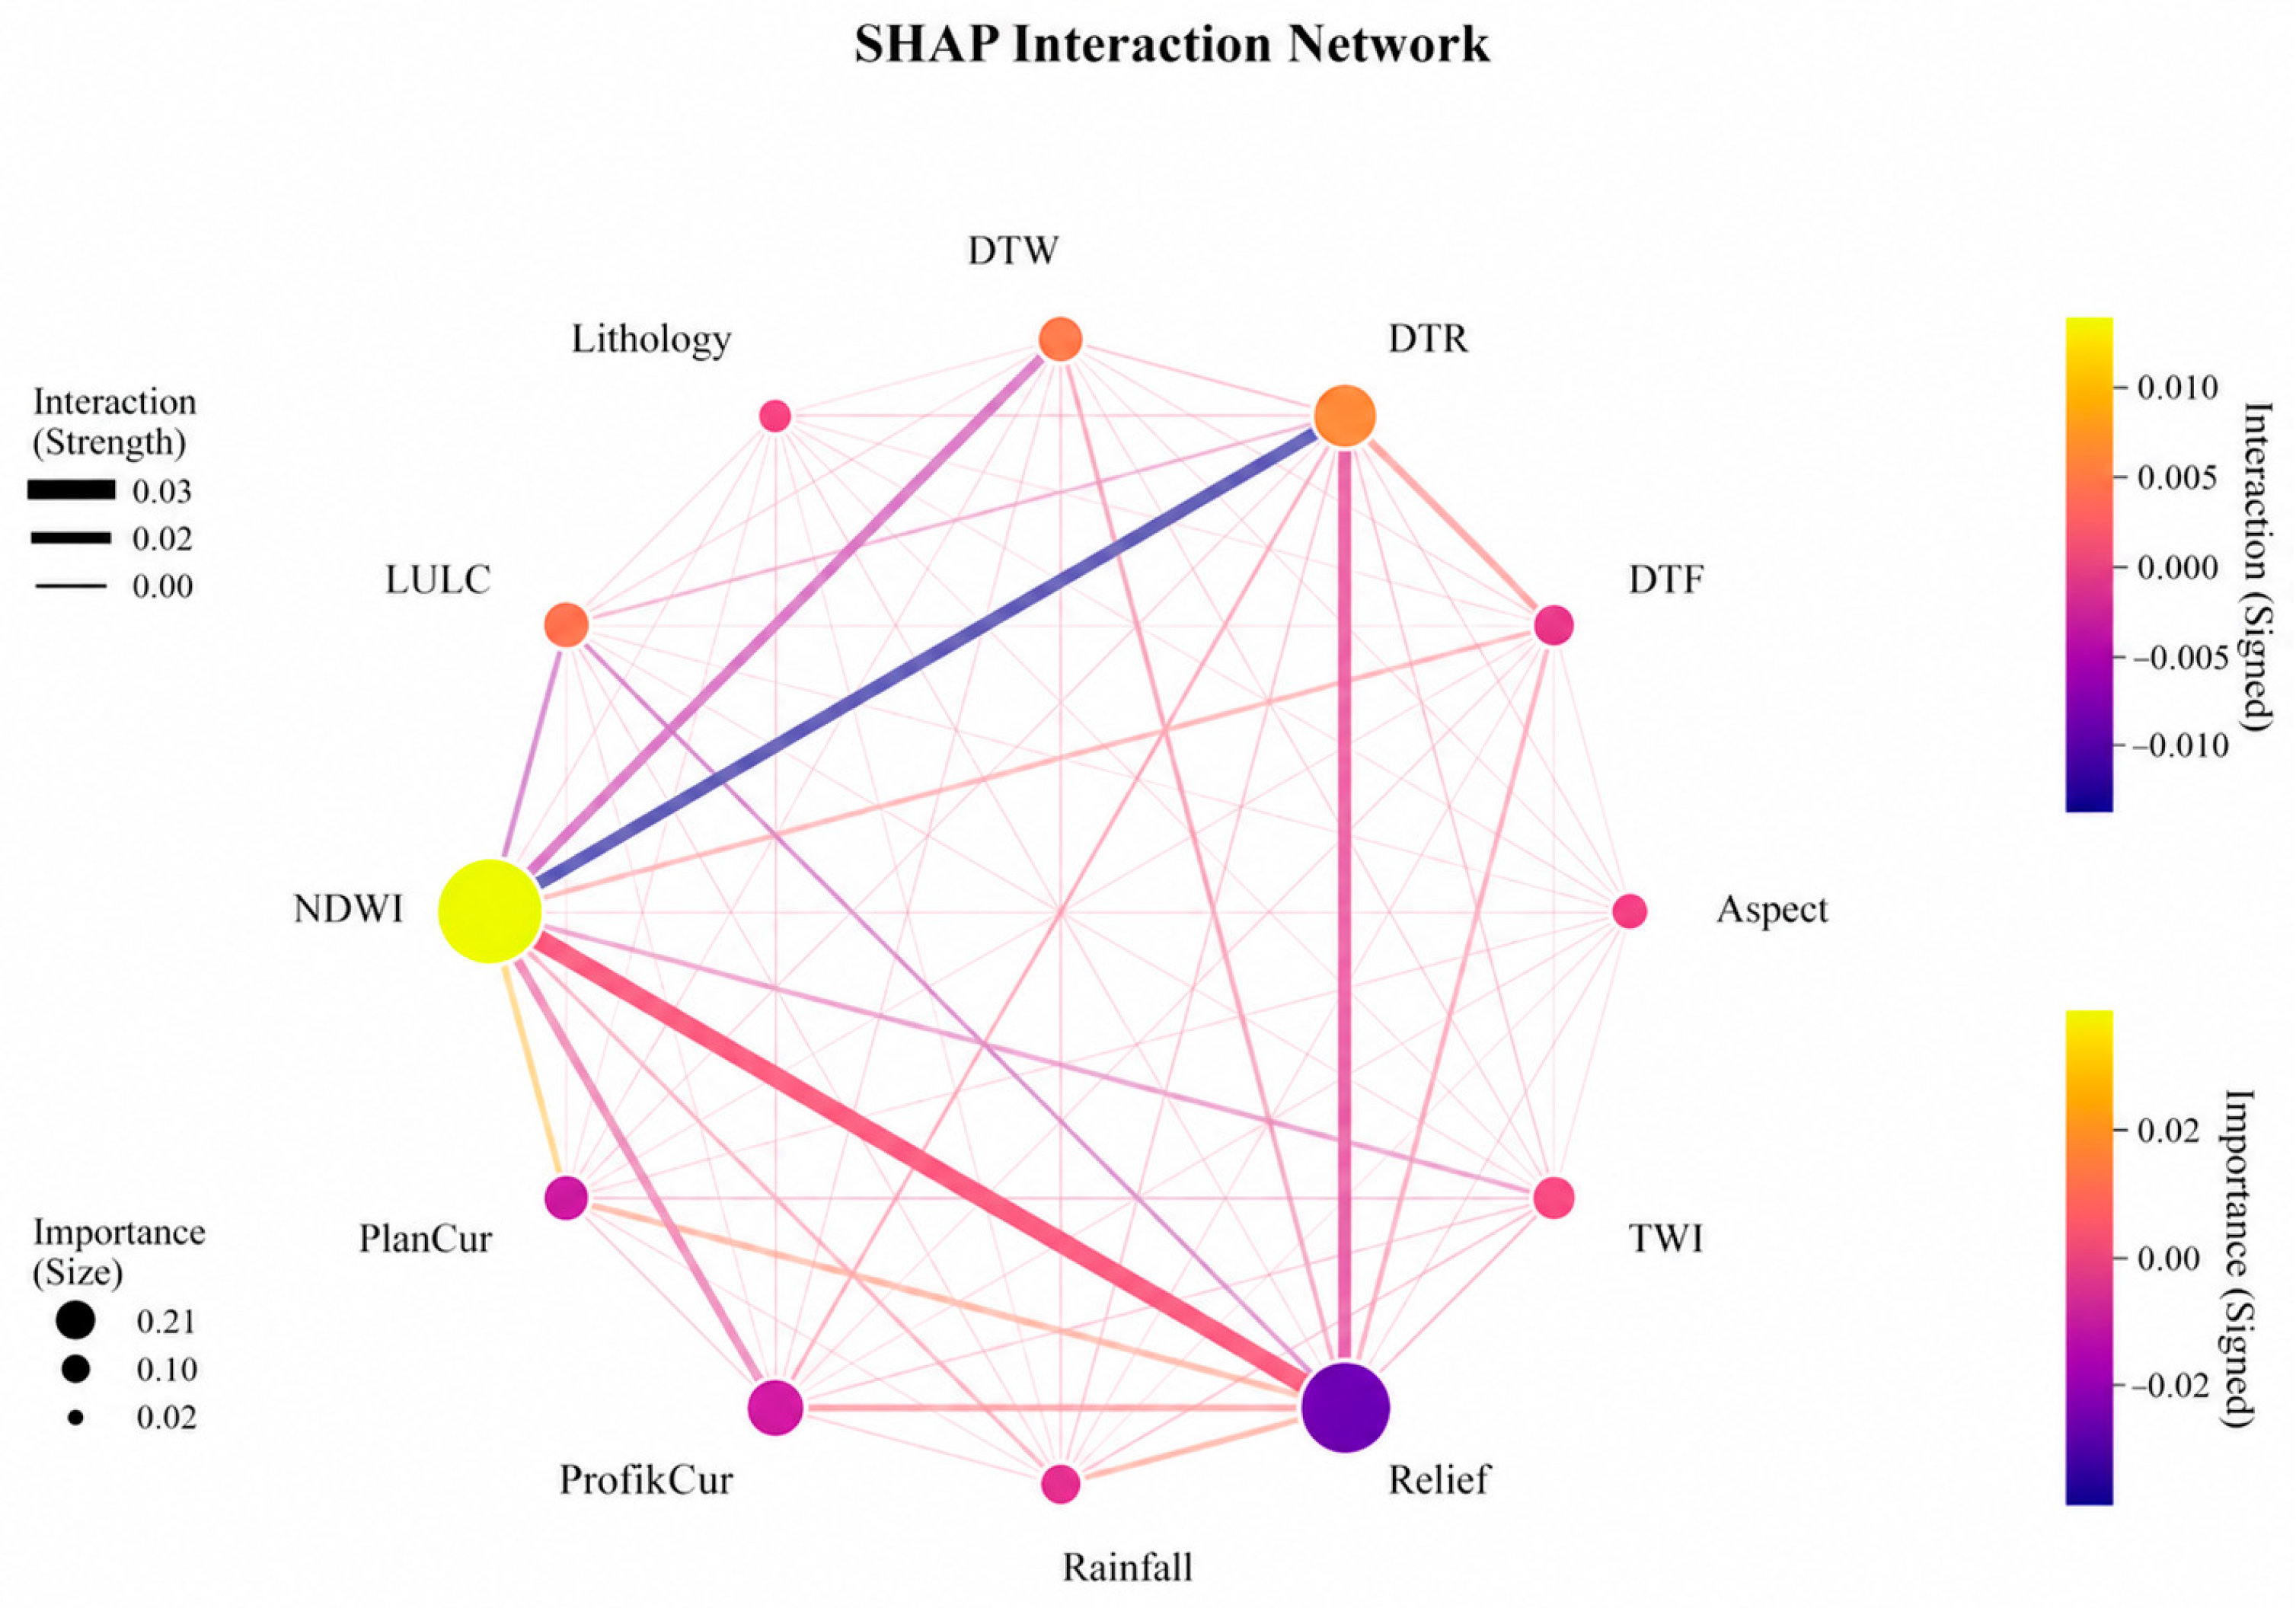
To more intuitively show the systematic relationships among factors in landslide susceptibility prediction,
Figure 7 presents the twelve factor nodes and their interaction edges in a circular network diagram. Node size corresponds to feature importance, with a scale of 0.02–0.21, and node color corresponds to the signed overall impact direction, with yellow indicating positive effects and dark purple indicating negative effects. Edge thickness corresponds to interaction strength, and edge color corresponds to signed interaction direction.
Figure 8 clearly reveals a core–periphery structure in the network. The NDWI node on the left side of the network has the largest size and brightest yellow color, making it the hub node with the strongest importance and positive effect. The relief node in the lower right is relatively large and dark purple, indicating that it mainly contributes negatively, meaning that increasing relief generally lowers landslide probability. This is highly consistent with the preceding beeswarm and dependence-plot analyses. DTR, DTW, and LULC nodes are orange and occupy positions with moderate positive influence, whereas curvature factors such as ProfileCur and PlanCur are purple and mainly negative. In the edge topology, NDWI–relief forms one of the thickest connections in the figure, corresponding to the strongest interaction identified above, and its color indicates a signed strong interaction. Several relatively thick edges, including NDWI-DTR, NDWI-ProfileCur, NDWI-PlanCur, and NDWI-LULC, all originate from the NDWI node and connect the hydrology–terrain–curvature–cover system. DTR–relief forms another prominent connection across the network. The remaining edges are thin and pale, indicating weak interaction contributions for most factor pairs. This network topology further confirms that the landslide mechanism in Longchuan is a systematic process dominated by the three core nodes NDWI, relief, and DTR, with NDWI acting as the key hub node.
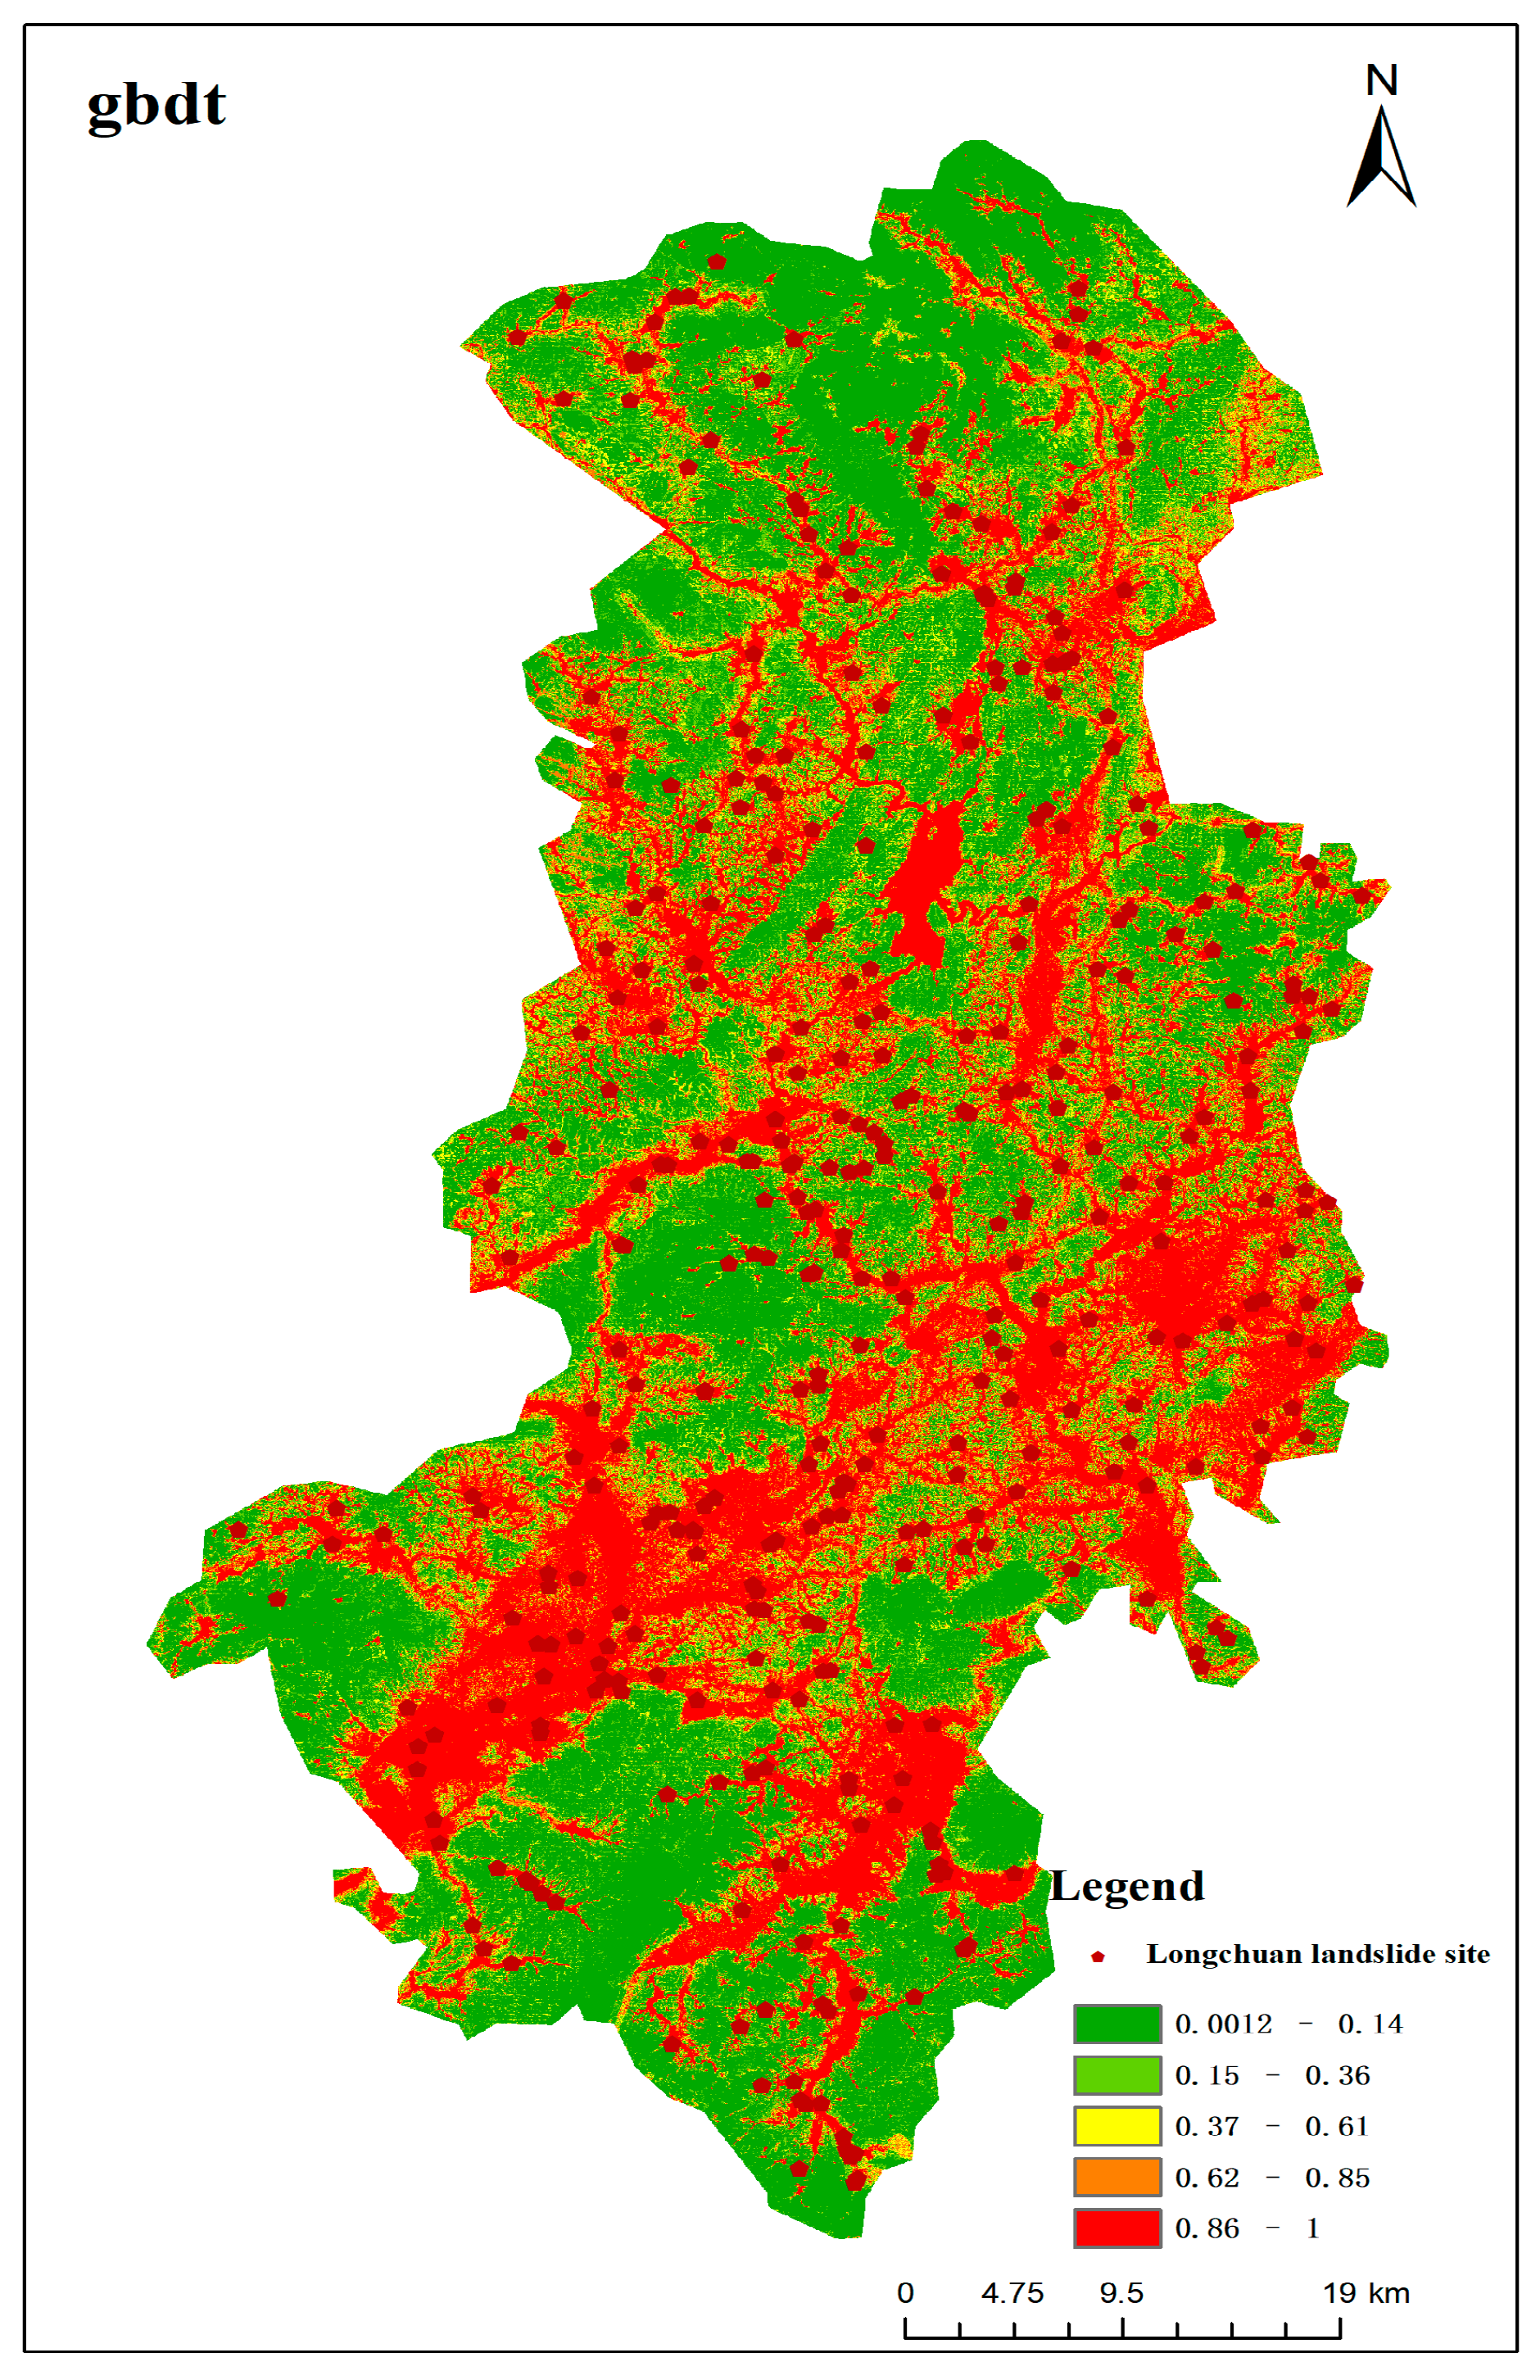
Based on the optimal GBDT machine learning model, landslide susceptibility was predicted, and the study area was divided into five susceptibility levels according to predicted susceptibility probability: very low, low, moderate, high, and very high.
To systematically evaluate the performance differences in GBDT-based landslide susceptibility zoning in Longchuan, in
Figure 8. The predicted susceptibility probability was divided into five interpretable probability intervals (
Table 6): very low (<0.2), low (0.2–0.4), moderate (0.4–0.6), high (0.6–0.8), and very high (>0.8). The frequency ratio (FR) was used as the core evaluation indicator. FR is defined as the ratio of the proportion of landslides in each class to the proportion of area in that class. It reflects the relative efficiency with which the model identifies historical landslide points. The closer the FR value is to 0, the closer the area is to a no-risk state; the more it exceeds 1, the higher the likelihood of landslide occurrence per unit area in that class.
Although the very-high-susceptibility class occupies 34.06% of the study area, the classification is not arbitrary: FR values increase monotonically from the very low to very high classes and reach 2.5642 in the very high class, which contains 87.33% of historical landslide points within only about one-third of the study area. The probability-threshold classification therefore remains strongly discriminative. Future work should compare these thresholds with quantile or natural-breaks alternatives using the full probability raster to evaluate the sensitivity of area proportions and FR values to the classification scheme.
5. Discussion
Physical credibility and potential representation effects of the NDWI-dominated pattern. The most notable finding of this study is that NDWI ranks first among the twelve factors with a mean absolute SHAP value of about 0.20 and becomes the hub factor in landslide discrimination through its synergy with relief, distance to rivers, and curvature factors. From the perspective of physical mechanisms, this result is reasonable. The SHAP beeswarm plot shows that a lower NDWI, or weaker water-body characteristics, significantly increases landslide probability, whereas high-NDWI areas, such as water bodies themselves and low-lying stable floodplains, correspond to lower risk. This is consistent with the physical understanding that low-lying near-water stable areas are less prone to instability, whereas slope sections with poor drainage conditions and strong fluctuations in water content are prone to instability. At the same time, NDWI, DTR, and DTW are highly synergistic and jointly point to the core driving chain of water-system activity, valley runoff convergence, and slope-toe erosion in Longchuan. However, NDWI is a remote-sensing spectral index, and its high importance for landslides should be treated cautiously. This may partly arise from its integrated representation of moisture background, valley terrain, and even land cover; in other words, it may statistically proxy several physical processes that are not explicitly included or have been removed by correlation screening. This phenomenon echoes Huang et al.’s argument in the introduction that factor representation itself affects prediction uncertainty, as well as the general drift of factor importance with representation, spatial unit, and resolution repeatedly revealed in Chinese research. In other words, the Longchuan case again suggests that SHAP importance ranking reflects the internal decision logic of a model under a specific factor system and study area, rather than a physical essence of factors that can be transferred across regions without verification.
The dominance of NDWI, relief, and DTR identified here is not universal across the explainable-ML landslide literature. For example, Himalayan XGBoost-SHAP studies cited in the Introduction identified distance to roads, elevation, and rainfall as leading factors [
46], whereas frequency-ratio work in Rwanda emphasized different terrain and land-cover associations [
27]. Such differences support the broader argument that SHAP-based factor importance reflects the joint effect of local geo-environmental setting, factor representation, spatial resolution, and model structure rather than a transferable physical ranking [
29]. The strong role of water-related variables in Longchuan is plausibly linked to the county’s dense river-valley settlement pattern, reservoir-bank geomorphology, and rainfall-controlled shallow-slope processes.
A narrow absolute NDWI range does not imply limited discriminative power. SHAP importance reflects how strongly variation in a feature shifts the model’s predicted probability, not the size of the feature’s numerical range. A tree-based model such as GBDT can learn sharp nonlinear thresholds within a narrow value interval, as shown by the low-value transition in the NDWI dependence curve (
Figure 6). In addition, NDWI integrates several correlated physical signals, including surface wetness, water-body proximity, and partly land-cover state; small index differences can therefore correspond to meaningfully different slope-hydrology conditions.
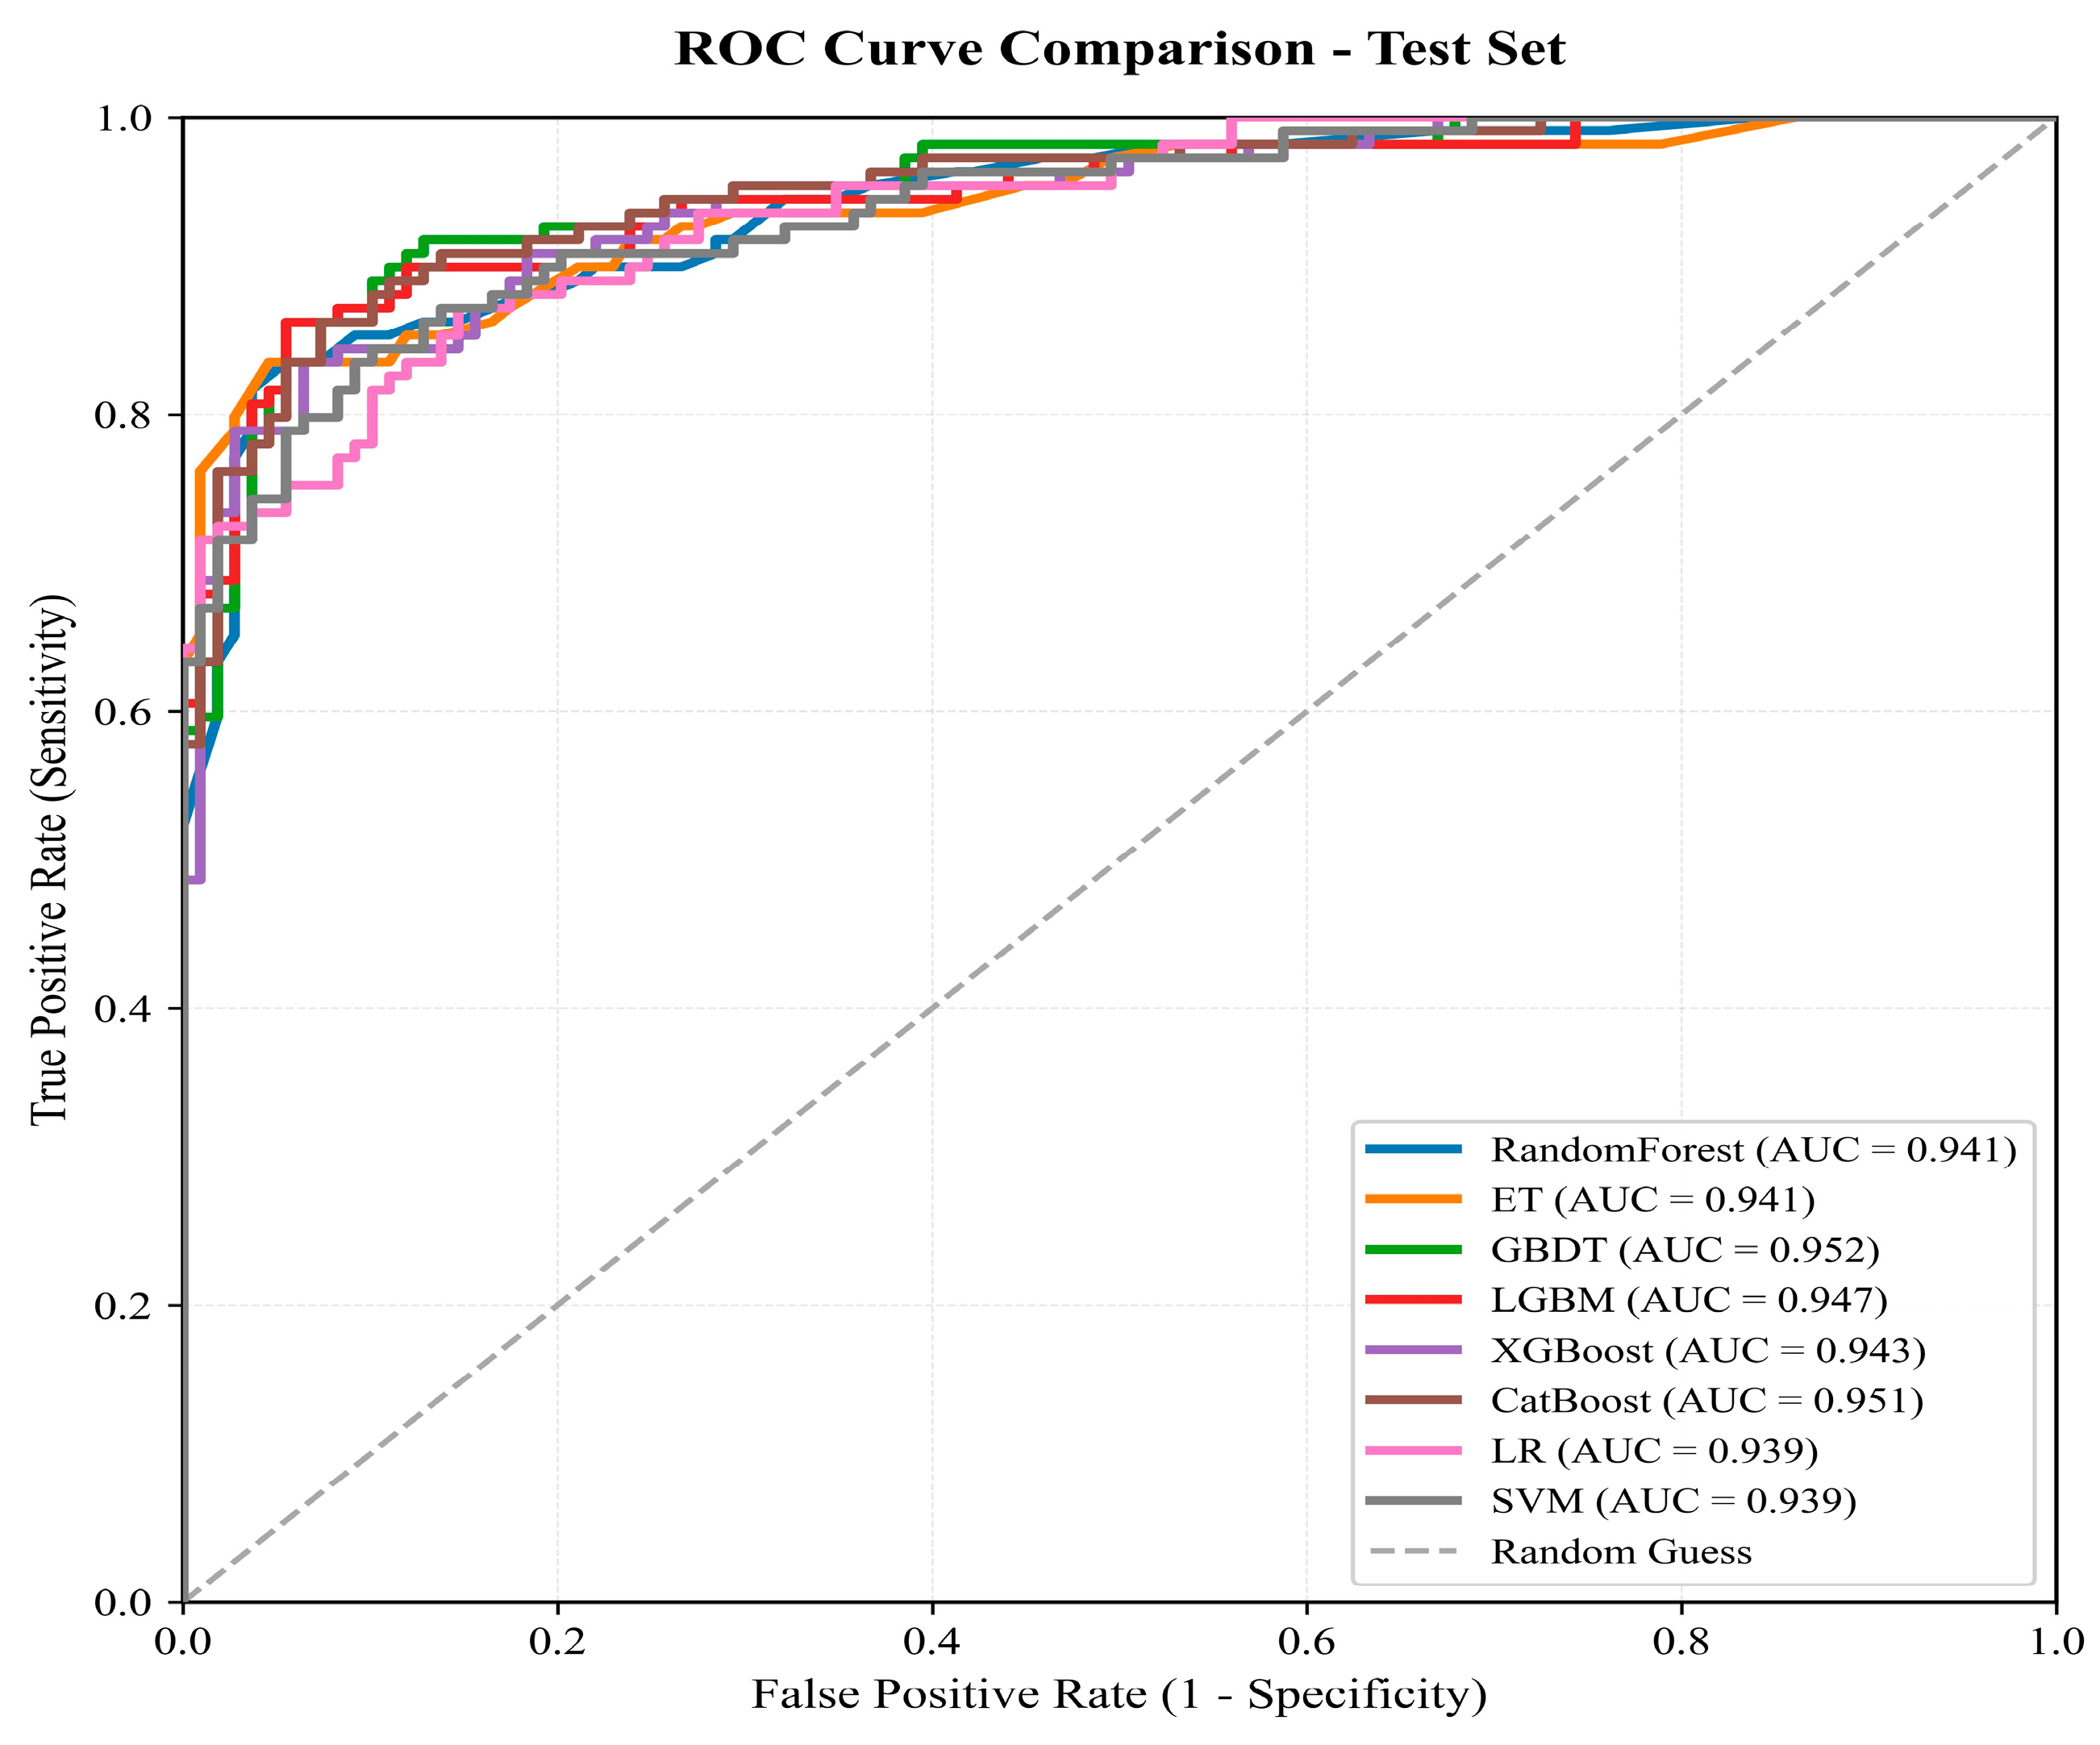
Regarding the significance of multi-model comparison for testing explanatory stability, the literature review in the Introduction points out that international studies tend to regard SHAP as a unified explanatory language transferable across models, while Al-Najjar et al. had already revealed the problem that explanatory direction drifts with algorithms. This study provides a partial response to this issue through a horizontal comparison of eight models. Although tree ensemble models such as GBDT, CatBoost, LightGBM, and XGBoost differ in AUC by only 0.001–0.01, their training–fitting behaviors differ significantly. GBDT had only two misclassified training samples, and CatBoost had a training accuracy of only 0.9528; these two models were the most restrained in balancing fit and generalization. By contrast, RandomForest, ExtraTrees, LightGBM, and XGBoost all achieved completely correct classification on the training set (training accuracy: 1.0000), showing an obvious tendency to memorize training samples. This comparison shows that simply using test-set AUC to judge model superiority is limited. Overfitting-control ability and training–test consistency should be included in a comprehensive evaluation. This is consistent with Liu et al.’s warning that AUC is not the only reliable criterion and Abdelkader et al.’s warning that a high ROC-AUC does not equal practical reliability. Accordingly, this study recommends GBDT, which has the best overfitting control, as the preferred model and uses CatBoost and LightGBM for parallel verification, thereby attempting to enhance the credibility of explanatory conclusions through mutual confirmation among models.
Regarding the nonlinear mechanism of relief and coupling with local geomorphology, the SHAP dependence curve for relief shows a complex pattern of first high, then low, and then rising again, revealing differentiated landslide mechanisms in Longchuan. Low-relief hilly piedmont areas are frequently disturbed by human engineering activities and are prone to shallow instability. Medium-relief areas are relatively stable. High-relief steep mountains again become landslide-prone under gravity and weathering. This nonlinearity is precisely where black-box models have advantages over linear models such as logistic regression, and it explains why LR had the lowest discrimination accuracy in this study. At the same time, the color coding of points in the dependence plots reveals second-order interactions such as DTR × rainfall, DTW × DTR, and TWI × relief, while the interaction-value matrix further quantifies NDWI × relief (0.036) as the strongest interaction. This indicates that landslides in Longchuan are not linearly driven by a single factor but are instead systematic processes involving hydrology, terrain, and land cover. Single-factor importance rankings therefore need to be interpreted together with the interaction network.
Several limitations of this study should be acknowledged. First, the sample size is relatively limited, with 363 landslide points and an equal number of non-landslide points. Non-landslide samples were generated using a fixed step size, and more refined strategies such as SHAP-guided or frequency-ratio-guided negative-sample optimization remain to be tested. Second, the train–test split was stratified by class label but was not explicitly spatially blocked. Because landslide-conditioning factors are spatially autocorrelated, conventional random or stratified-random splitting can place spatially proximate, environmentally similar samples on both sides of the split, which may inflate apparent test-set performance relative to fully spatially independent evaluation. The AUC values reported in
Table 4 should therefore be interpreted as the held-out random-test performance rather than as a strict estimate of spatial-transfer performance. Third, the proportion of flat or low-slope terrain and model performance after excluding such terrain should be quantified using the slope raster and sample coordinates in future work because easy discrimination of flat areas may influence overall accuracy. Fourth, the factor system is dominated by static geo-environmental factors and lacks physical corroboration from dynamic observations such as InSAR deformation. Finally, the results are based on the single Longchuan basin, and the cross-regional transferability of SHAP attribution requires verification in additional study areas.
6. Conclusions
This study takes Longchuan County, Guangdong Province, as the study area and constructs a multi-model comparative framework for explainable machine learning. Based on twelve core factors retained from fifteen initially selected factors after correlation screening and 363 historical landslide samples, eight machine learning models were systematically compared. The optimal model was then used for SHAP explainability analysis and susceptibility zoning. The main conclusions are as follows:
In terms of model performance, all eight models showed good landslide discrimination ability under the complex geological environment of Longchuan. Test-set AUC values were all at least 0.938, and all classification metrics were stable above 0.84. GBDT ranked first with an AUC of 0.9520, showing balanced and excellent classification metrics and the best overfitting-control ability among tree ensemble models. CatBoost (0.9512) followed closely, and together they formed the first performance tier. RandomForest, ExtraTrees, LightGBM, and XGBoost had similar accuracy, but they completely memorized the training samples and showed obvious overfitting tendencies. SVM and LR showed stable generalization and can serve as baseline comparisons. Considering both accuracy and generalization ability, this study recommends GBDT as the preferred model for landslide susceptibility modeling in Longchuan, with CatBoost and LightGBM used for parallel verification.
In terms of factor mechanisms, SHAP analysis reveals that NDWI, relief, and DTR constitute the three dominant factors of landslide development in Longchuan, while the direct effects of lithology and aspect are relatively limited. NDWI not only has the highest importance but also becomes the hub factor in the systematic interaction network through strong synergy with relief, DTR, and curvature factors. The NDWI × relief interaction reaches 0.036, making it the strongest interaction. Key factors generally show significant nonlinear responses. Relief follows a pattern of first high, then low, and then rising again, while DTR and DTW show a pattern of sharp increase near water and rapid decline away from water. These results indicate that landslides in Longchuan are a systematic process driven by the synergy of water-system activity, relief, and human engineering disturbance.
In terms of susceptibility zoning, the GBDT-based assessment divides the study area into five levels: very low, low, moderate, high, and very high. The frequency ratio of the very high susceptibility zone reaches 2.5642 and includes approximately 87% of historical landslide points. The zoning results are highly consistent with the distribution of historical hazards, verifying the practical reliability of the model.
In terms of methodological significance, this study tests the cross-model stability of SHAP factor attribution through horizontal multi-model comparison and incorporates local terrain, geological, hydrological, and human-activity factors into explainable modeling. It responds to some blind spots in international research concerning explanatory credibility, bridges the gap between local empirical research and frontier explainable methods, and provides a precise, transparent, and accountable scientific basis for landslide prevention, risk management, and territorial spatial planning in the Longchuan basin and comparable mountainous and hilly regions.