


Abstract
This study develops a framework to capture spatiotemporal population dynamics and assess future earthquake exposure risk, using Hubei Province as a case study. Future population changes at the county level were projected under different shared socioeconomic pathways (SSPs). These projections were then integrated with NPP-VIIRS nighttime light data and the normalized difference vegetation index (NDVI) to simulate the spatiotemporal dynamics of the population from 2020 to 2070 at a 500 m grid resolution. Combined with seismic hazard zoning, the evolution of population exposure risk under different pathways was assessed. The results indicate the following: 1. Different SSPs profoundly influence future population exposure patterns. Under the SSP3 (regional rivalry) pathway, population growth is the fastest with the strongest agglomeration effect and significantly elevated exposure levels. 2. The refined spatiotemporal population model can more realistically reveal the heterogeneity and evolutionary trajectory of population distribution, providing a high-precision data foundation for exposure analysis and effectively enhancing the scientific rigor of risk assessment. 3. Population exposure risk under various pathways exhibits distinct spatiotemporal dynamics, and monitoring its evolution under different scenarios helps identify high-risk counties that require priority attention. This study is expected to provide precise scientific evidence for implementing differentiated disaster prevention and mitigation strategies and territorial spatial resilience planning in Hubei Province, while it demonstrates the forward-looking value of combining long-term scenario simulations with refined exposure assessments.
1. Introduction
Earthquakes rank among the deadliest natural disasters in terms of casualties [1] and the risks of the earthquake intensifying because of the high concentration of populations and assets during urbanization. Disaster risk science posits that risk arises from the combined effects of hazard potential, exposure, and vulnerability [2]. Current research has shifted from an early focus on hazard factor analysis toward a deeper exploration of exposure and vulnerability [3]. Among these, population exposure—the number and spatial distribution of people potentially affected by disasters—is critical for assessing disaster losses and has become a key concern in earthquake prevention and mitigation efforts [4,5].
Accurately assessing population exposure risk from earthquake disasters faces several challenges. For example, the accuracy of the data is insufficient. Numerous studies directly employ data such as total administrative area populations or aggregated disaster-affected populations [6,7,8], which lack sufficient spatial resolution to reflect the actual, nonuniform distribution of populations within administrative regions, let alone capture their spatiotemporal dynamics. While some studies have attempted to use affected areas [9,10] or affected rates [11,12] to refine these metrics, such approaches analyze only exposure for directly affected populations. This approach limits both spatial and temporal resolutions, preventing accurate representation of actual spatiotemporal distributions and resulting in imprecision. Furthermore, China’s population growth and agglomeration patterns exhibit pronounced regional characteristics that are significantly influenced by policy frameworks, creating limitations in analyzing regional spatiotemporal variations. On the other hand, assessments of future risks fail to account for the dynamic evolution of exposure indicators under varying development trajectories. Population is a time-varying variable whose size and distribution are shaped by socioeconomic development paths. However, existing exposure assessments predominantly rely on current or static population data and fail to integrate the changes in the population under different development pathways in the future. This results in assessments that lack foresight, rendering them inadequate for guiding long-term disaster prevention strategies.
To address the aforementioned issues, this study proposes that high-precision population spatialization and future scenario simulation methods can enhance the scientific rigor and foresight of seismic exposure analysis [13,14]. Existing gridded population models often directly use nighttime light (NTL) intensity as the weight, or employ multivariate regression combining NTL with land cover types. However, NTL suffers from saturation in urban areas and weak signals in rural areas, while the normalized difference vegetation index (NDVI) effectively captures vegetation cover and rural settlement patterns. The NTL/NDVI ratio can highlight the population density differences between urban and rural areas and, at the same time, can alleviate the saturation and background noise problems caused by using NTL alone, as well as the heterogeneity problems of the ground layer caused by using NDVI alone [15,16,17]. Simultaneously, the shared socioeconomic pathways (SSPs) framework provides standardized scenarios for systematically quantifying population and economic evolution under different development assumptions, laying the foundation for conducting forward-looking risk assessments. We integrate SSPs with gridded spatialization to achieve spatially explicit simulations of future population dynamics.
Therefore, based on data from China’s Seventh National Population Census in 2020, this study comprehensively considers recent fertility trends and policy contexts such as the “universal three-child policy” and “childbearing incentives”. Using Hubei Province as a case study, multiple remote-sensing data sources are employed to analyze future population dynamics under different SSP scenarios. In addition, this study systematically evaluates the evolution of population exposure risk to earthquake disasters across various socioeconomic development pathways with the aims of (1) revealing how different SSPs influence future regional population size and spatial patterns; (2) characterizing the spatiotemporal differentiation and dynamic evolution of earthquake population exposure risk, identifying key risk hotspots and transition points; and (3) providing a quantitative scientific basis for formulating differentiated, forward-looking earthquake disaster prevention and mitigation strategies in conjunction with territorial spatial planning for Hubei Province.
2. Data and Methods
2.1. Different Scenario Models and Parameter Calibrations
This study employs the scenarios for the SSP framework established by the Intergovernmental Panel on Climate Change (IPCC) [18,19]. The framework depicts five distinct future socioeconomic development pathways (SSP1 to SSP5), encompassing multiple dimensions, including population, economy, technology, and inequality levels [20,21]. Specifically, SSP1 (development scenario), SSP2 (business-as-usual scenario), SSP3 (global regional rivalry scenario), SSP4 (inequality scenario), and SSP5 (fossil-fueled development scenario) represent diverse possibilities ranging from global cooperation to regional competition and from balanced development to highly differentiated trajectories. These pathways are directly linked to varying assumptions about future population-driving parameters (e.g., fertility, mortality, migration rates, and education levels), providing structured scenario inputs for demographic assumptions.
Additionally, this study employs a population-development-environment (PDE) model [22] to forecast population trends at the county level (which covers 103 counties/districts). This recursive multidimensional model is used to project the population with details on age, sex and education level [23,24].
where Pt represents the population in year t; Pn(t−1) is the population at age n in year t − 1; dt represents the mortality rate; Rn(t−1) indicates the proportion of females aged n in the total population in year t − 1; Bnt signifies the fertility rate of women aged n in year t; and Mn represents the migration population aged n in that year.
In this study, data from the Seventh National Population Census were used as initial values. Birth rates, mortality rates, and migration rates are also calibrated on the basis of the original 2020 data of this county/district. The scenario settings for life expectancy, population migration rates, and education levels refer to the research findings of Jiang et al. (2017) [25], with parameters adjusted according to China’s demographic realities and policies. The specific details are as follows:
1. Fertility Rate: Considering the sustained decline in recent years and the potential impacts of policies such as the universal three-child policy, three scenarios were established: low (not effective and continuing the downward trend), medium (policy partially effective and recovering moderately), and high (policy effective and maintaining current levels).
2. Mortality Rate: In reference to UN projections for China’s average life expectancy growth, three change rates were established: low (rapid improvement), medium (moderate improvement), and high (slow improvement).
3. Migration Rate: Using migration rates approximately 2020 as a baseline, three patterns were defined: low (gradual decrease to zero), medium (maintaining current levels), and high (gradual increase).
4. Educational Attainment: Based on SSP scenarios, three assumptions were established: rapid development, the global trend, and a constant enrollment rate.
Combining the above parameters with the five SSP pathways drove the PDE model to generate annual population projections for each county from 2020 to 2070.
2.2. Night-Light Data
Monthly nighttime light data from the 2020 NPP-VIIRS satellite (National Oceanic and Atmospheric Administration: https://www.ngdc.noaa.gov/eog (accessed on 5 December 2025)) were used in this work. Due to distorted light data in mid-to-high latitudes of China during summer (primarily May–July) [26,27], annual light data were synthesized using light data from the remaining nine months. The annual composite results were compared with the official annual “vcmsl” (stray light-corrected) product from NOAA. The correlation coefficient (R2) was 0.975, which demonstrates a high degree of consistency between the two products.
Regarding quality control for data from other months, we applied the following procedures: (1) Denoising: negative pixel values in the imagery were set to zero; (2) Outlier detection and removal: some anomalous bright areas may represent surfaces with high emissivity rather than nighttime lights from populated regions. Therefore, the nighttime light imagery was overlaid with developed areas derived from MODIS land cover data (MCD12Q1; https://lpdaac.usgs.gov/products/mcd12q1v006 (accessed on 20 December 2025)) to obtain the maximum and minimum light intensity values within the study area, which were then used to remove outliers.
2.3. NDVI Data
The NDVI data accurately reflect the status of land surface vegetation cover. In this study, we used the 250 m resolution annual composite NDVI from the MOD13Q1 product provided by the Resource, Environment and Science Data Center of the Chinese Academy of Sciences for the year 2020. The data were resampled to 500 m to match the spatial resolution of the nighttime light data.
2.4. Spatialized Model
The spatiotemporal population spatialization model developed in this study first takes the county-level population projections under SSP scenarios as the total quantity constraint. On this basis, the ratio index M of NTL to NDVI is used as the weighting index [15].
where NTLi represents the data obtained from the NPP-VIIRS NTL value for the corresponding county or district, and NDVIi represents the data obtained from the NDVI statistics for the corresponding district or county. In this formulation, NTL reflects the intensity of human activities, while NDVI represents vegetation coverage. Their ratio can effectively improve the ability of the population spatialization weight to distinguish between urban and rural areas.
Using M as the weighting index, the total population of each county-level administrative unit was allocated to its internal 500 m grids according to the following formula:
where Pi is the spatialized raster cell value of the population, P is the population statistic (predicted value) of the county-level administrative unit where the raster cell is located, Mi is the M-value weight of the raster cell, and MA is the total M-value weight of the county-level administrative unit where the raster cell is located.
2.5. Exposure Assessment Methodology
In this study, the peak ground acceleration (PGA) with a 10% exceedance probability over 50 years from the seismic ground motion parameter zonation map of China (GB18306-2015) was employed as the seismic hazard indicator. This probabilistic seismic hazard level is a widely used probabilistic seismic hazard measure in engineering design and risk assessment. Hubei Province is divided into regions with different PGA levels (0.05 g, 0.10 g, 0.15 g, and 0.20 g). Based on the characteristics of China’s population density distribution, the grid population density was categorized into five levels: extremely sparse (<10 people/km2), relatively sparse (10–100 people/km2), moderately dense (100–300 people/km2), relatively dense (300–400 people/km2), and extremely dense (>400 people/km2).
Drawing on the risk matrix method (RMM) [28], a two-dimensional risk matrix was constructed with PGA as rows and population density as columns. Each cell in the matrix corresponds to a specific “hazard-exposure” combination and is assigned an exposure risk level from 1 to 5 (with level 1 being the lowest and level 5 being the highest). The fundamental principle is that combinations with higher PGA values and greater population densities receive higher risk ratings. Furthermore, the 500 m grid population density distribution maps for future years under various SSP scenarios were overlaid with the PGA zoning map to count the number or area of counties falling into each cell of the risk matrix, thereby analyzing the spatiotemporal evolution of exposure risk.
3. Analysis and Verification of Population Changes
3.1. Population Changes in the Province
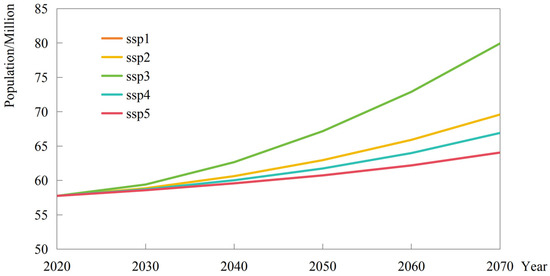
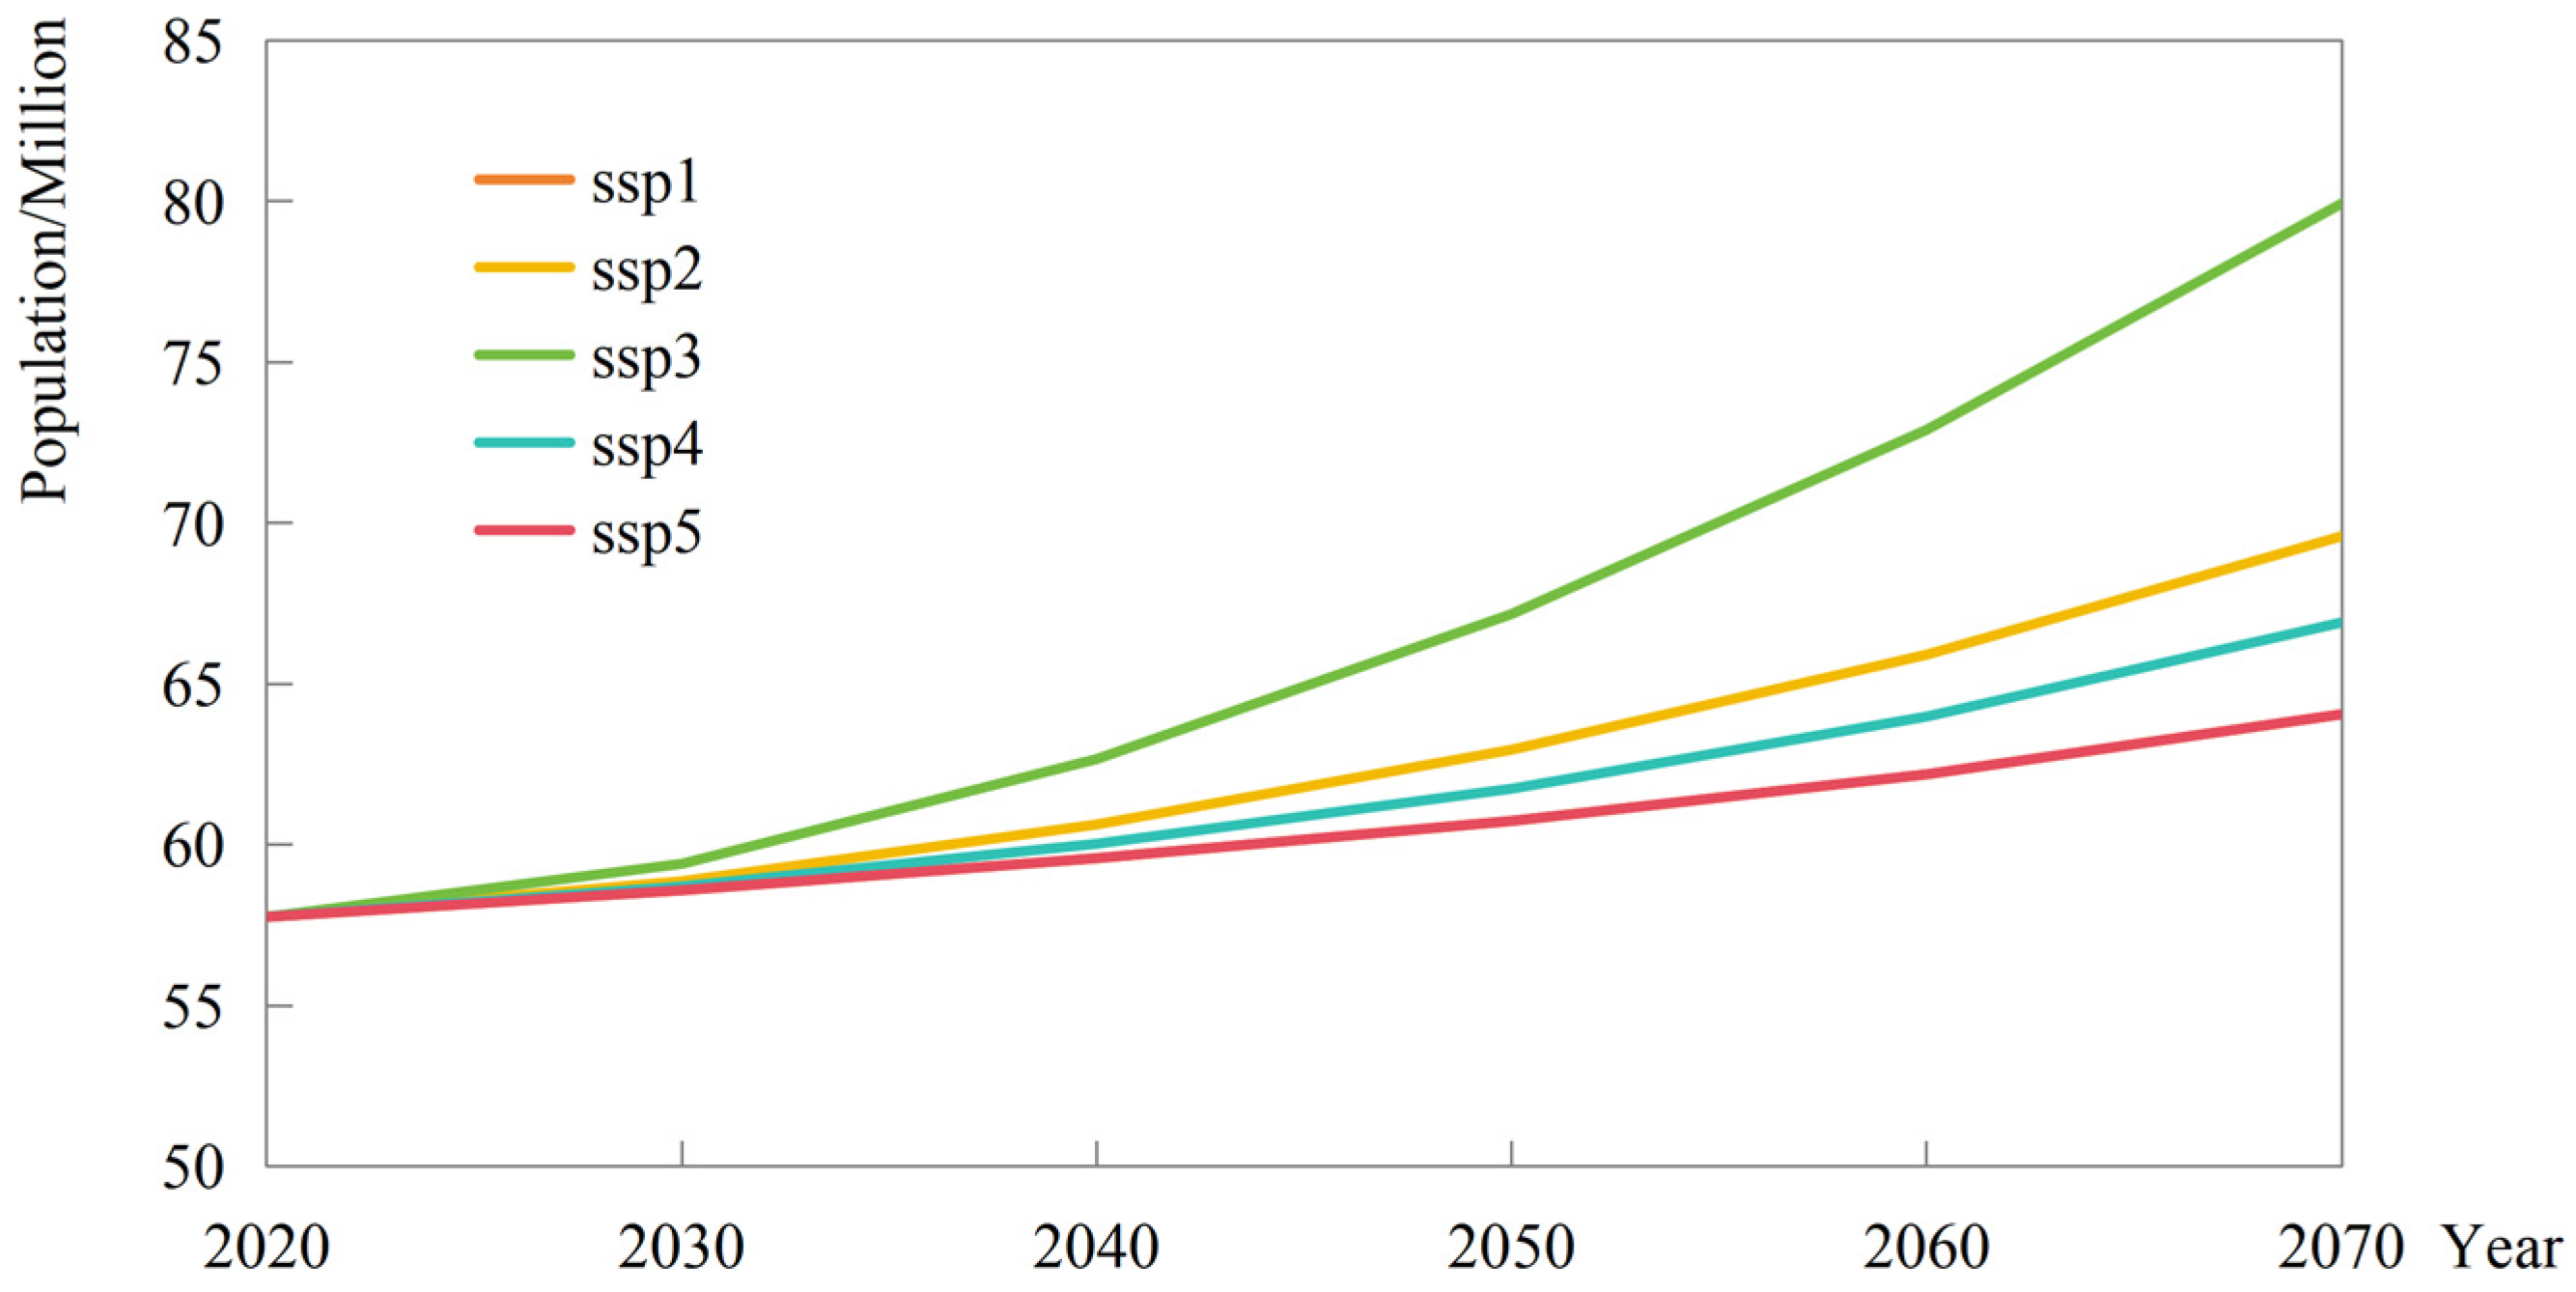
Population projections for the province indicate that, under all five SSP pathways, Hubei’s population will exhibit growth trends from 2020 to 2070, although the rates vary significantly (Figure 1). SSP3 shows the fastest growth, with the population projected to reach nearly 80 million by 2070—an increase of approximately 38% compared with that in 2020. SSP2 and SSP4 exhibit intermediate growth rates, whereas SSP1 and SSP5 show the most moderate growth, with a projected population of approximately 64 million by 2070. The small difference between these two pathways is likely because the difference between the SSP1 and SSP5 pathways lies only in migration rates; except for large cities such as Wuhan, the migration rates across cities are relatively similar.
Figure 1.
Population changes in Hubei Province under different SSPs from 2010 to 2070.
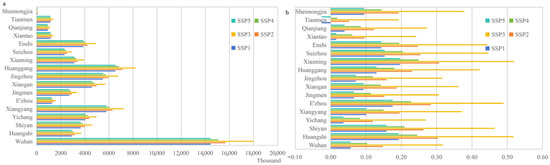
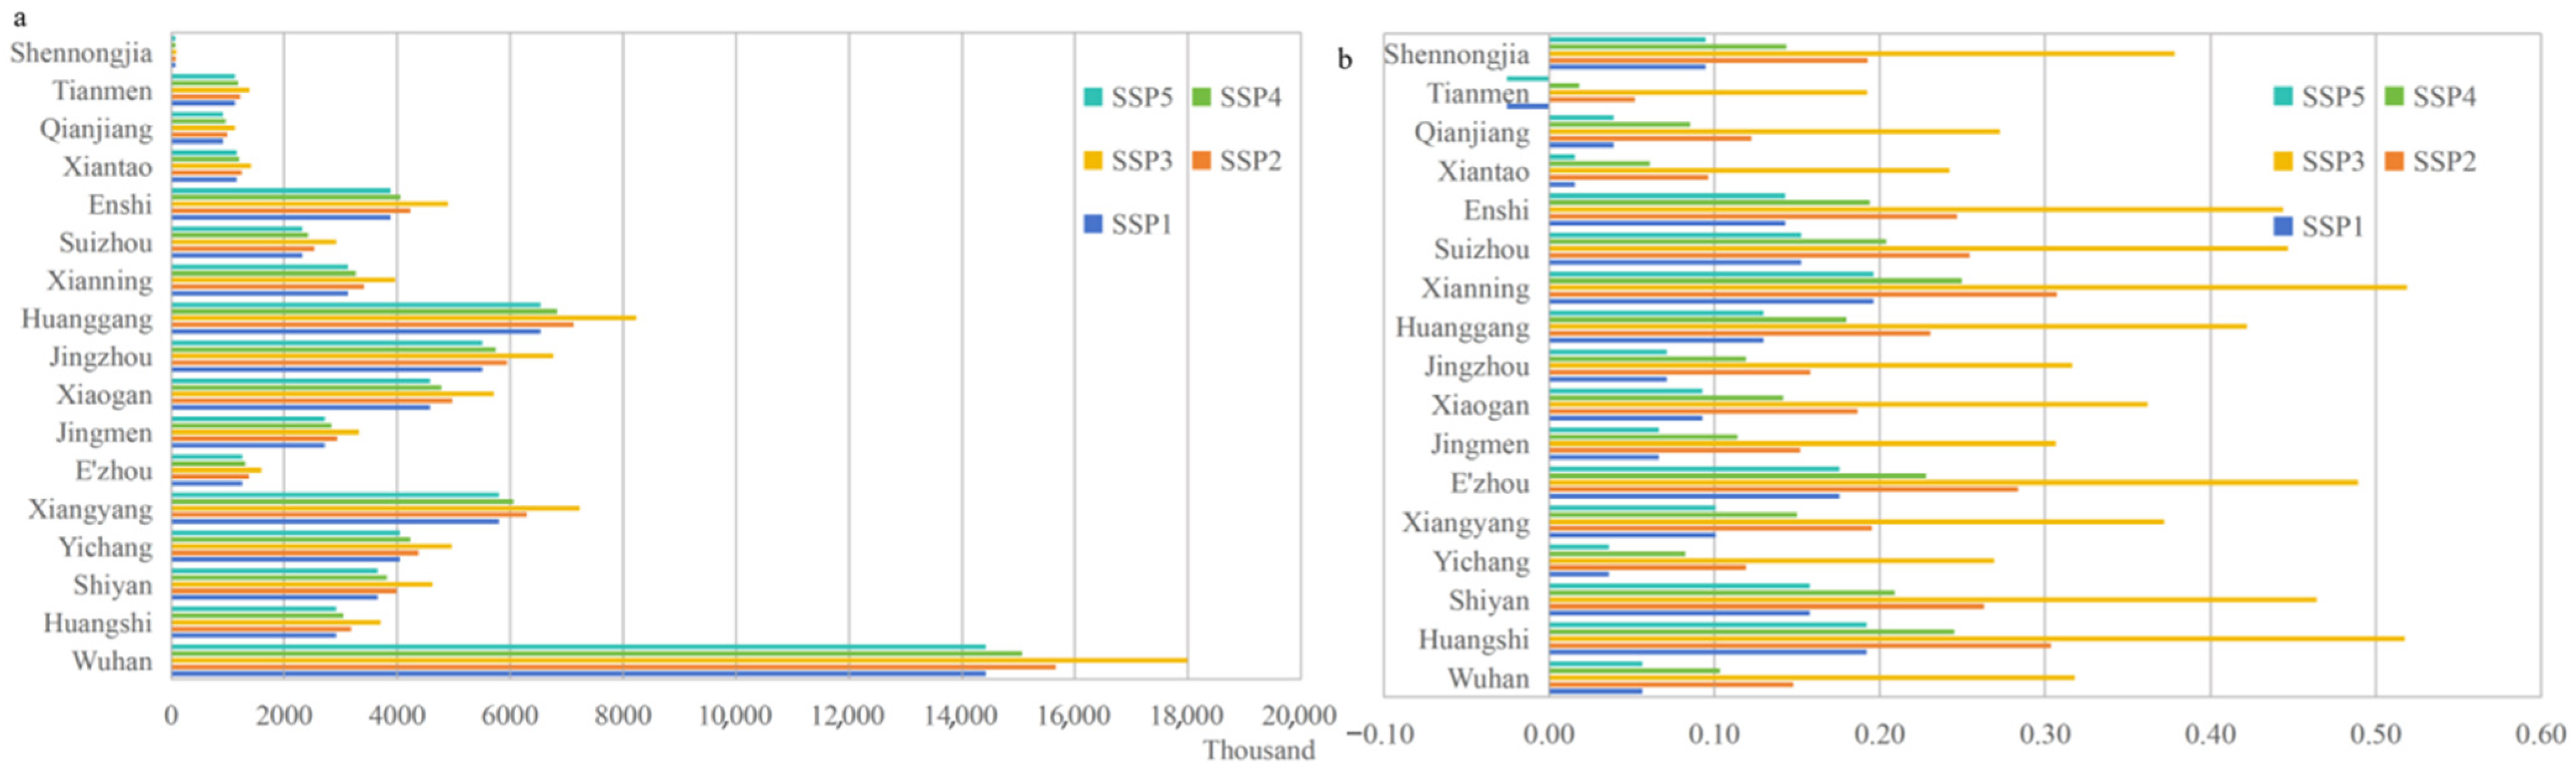
As shown in Figure 2a, Wuhan consistently has the highest population in the province in 2070, far exceeding that of the other cities, with a population increment of more than 18 million under SSP3. Data from Figure 2b indicate rapid population growth in cities such as Huangshi, Xianning, E’zhou, Shiyan, Enshi, Suizhou, and Wuhan, with increases surpassing 40% under SSP3. Among these, the average fertility rates of Huangshi, Xianning, E’zhou, Shiyan, and Enshi exceed 4% (in 2020), whereas that of Suizhou stands at 3.8% (in 2020), ranking among the top six regions in the province. Their relatively high initial fertility levels are the primary drivers of rapid population growth. Under SSP3—which is characterized by high emissions and low living standards—these regions amplify their already elevated fertility rates, leading to an increase in newborns. Concurrently, this pathway exacerbates regional disparities and reduces migration flows, and more people lose opportunities for out-migration for employment purposes, leading to increased local populations. As the province’s largest migration destination with a substantial population base, Wuhan exhibits strong population concentration in its metropolitan areas due to the population siphon effect. As shown in Figure 2b, Tianmen city experiences negative growth under both the SSP1 pathway and the SSP5 pathway, which may be related to factors such as population aging and population outflow.
Figure 2.
Projected populations and growth rates of cities in Hubei Province by 2070 compared with those in 2020 under five different SSPs. (a) Projected population of cities; (b) growth rate compared with that in 2020.
3.2. Error Analysis
SSP2 refers to a future world scenario aligned with current societal development trends, making it the closest approximation to actual circumstances. Scholars typically compare simulation results under SSP2 with actual demographic data [14]. A comparison of existing 2021–2023 data from cities with the predicted values (Table 1) reveals that the simulated results generally agree well with the actual values. The average error is approximately 2%, and the error does not significantly increase over time. The error results are lower than those of other similar studies [29], indicating that the model parameter calibration is reasonable and that the prediction results are credible.
Table 1.
Comparison of actual and projected population values for various cities from 2021 to 2023.
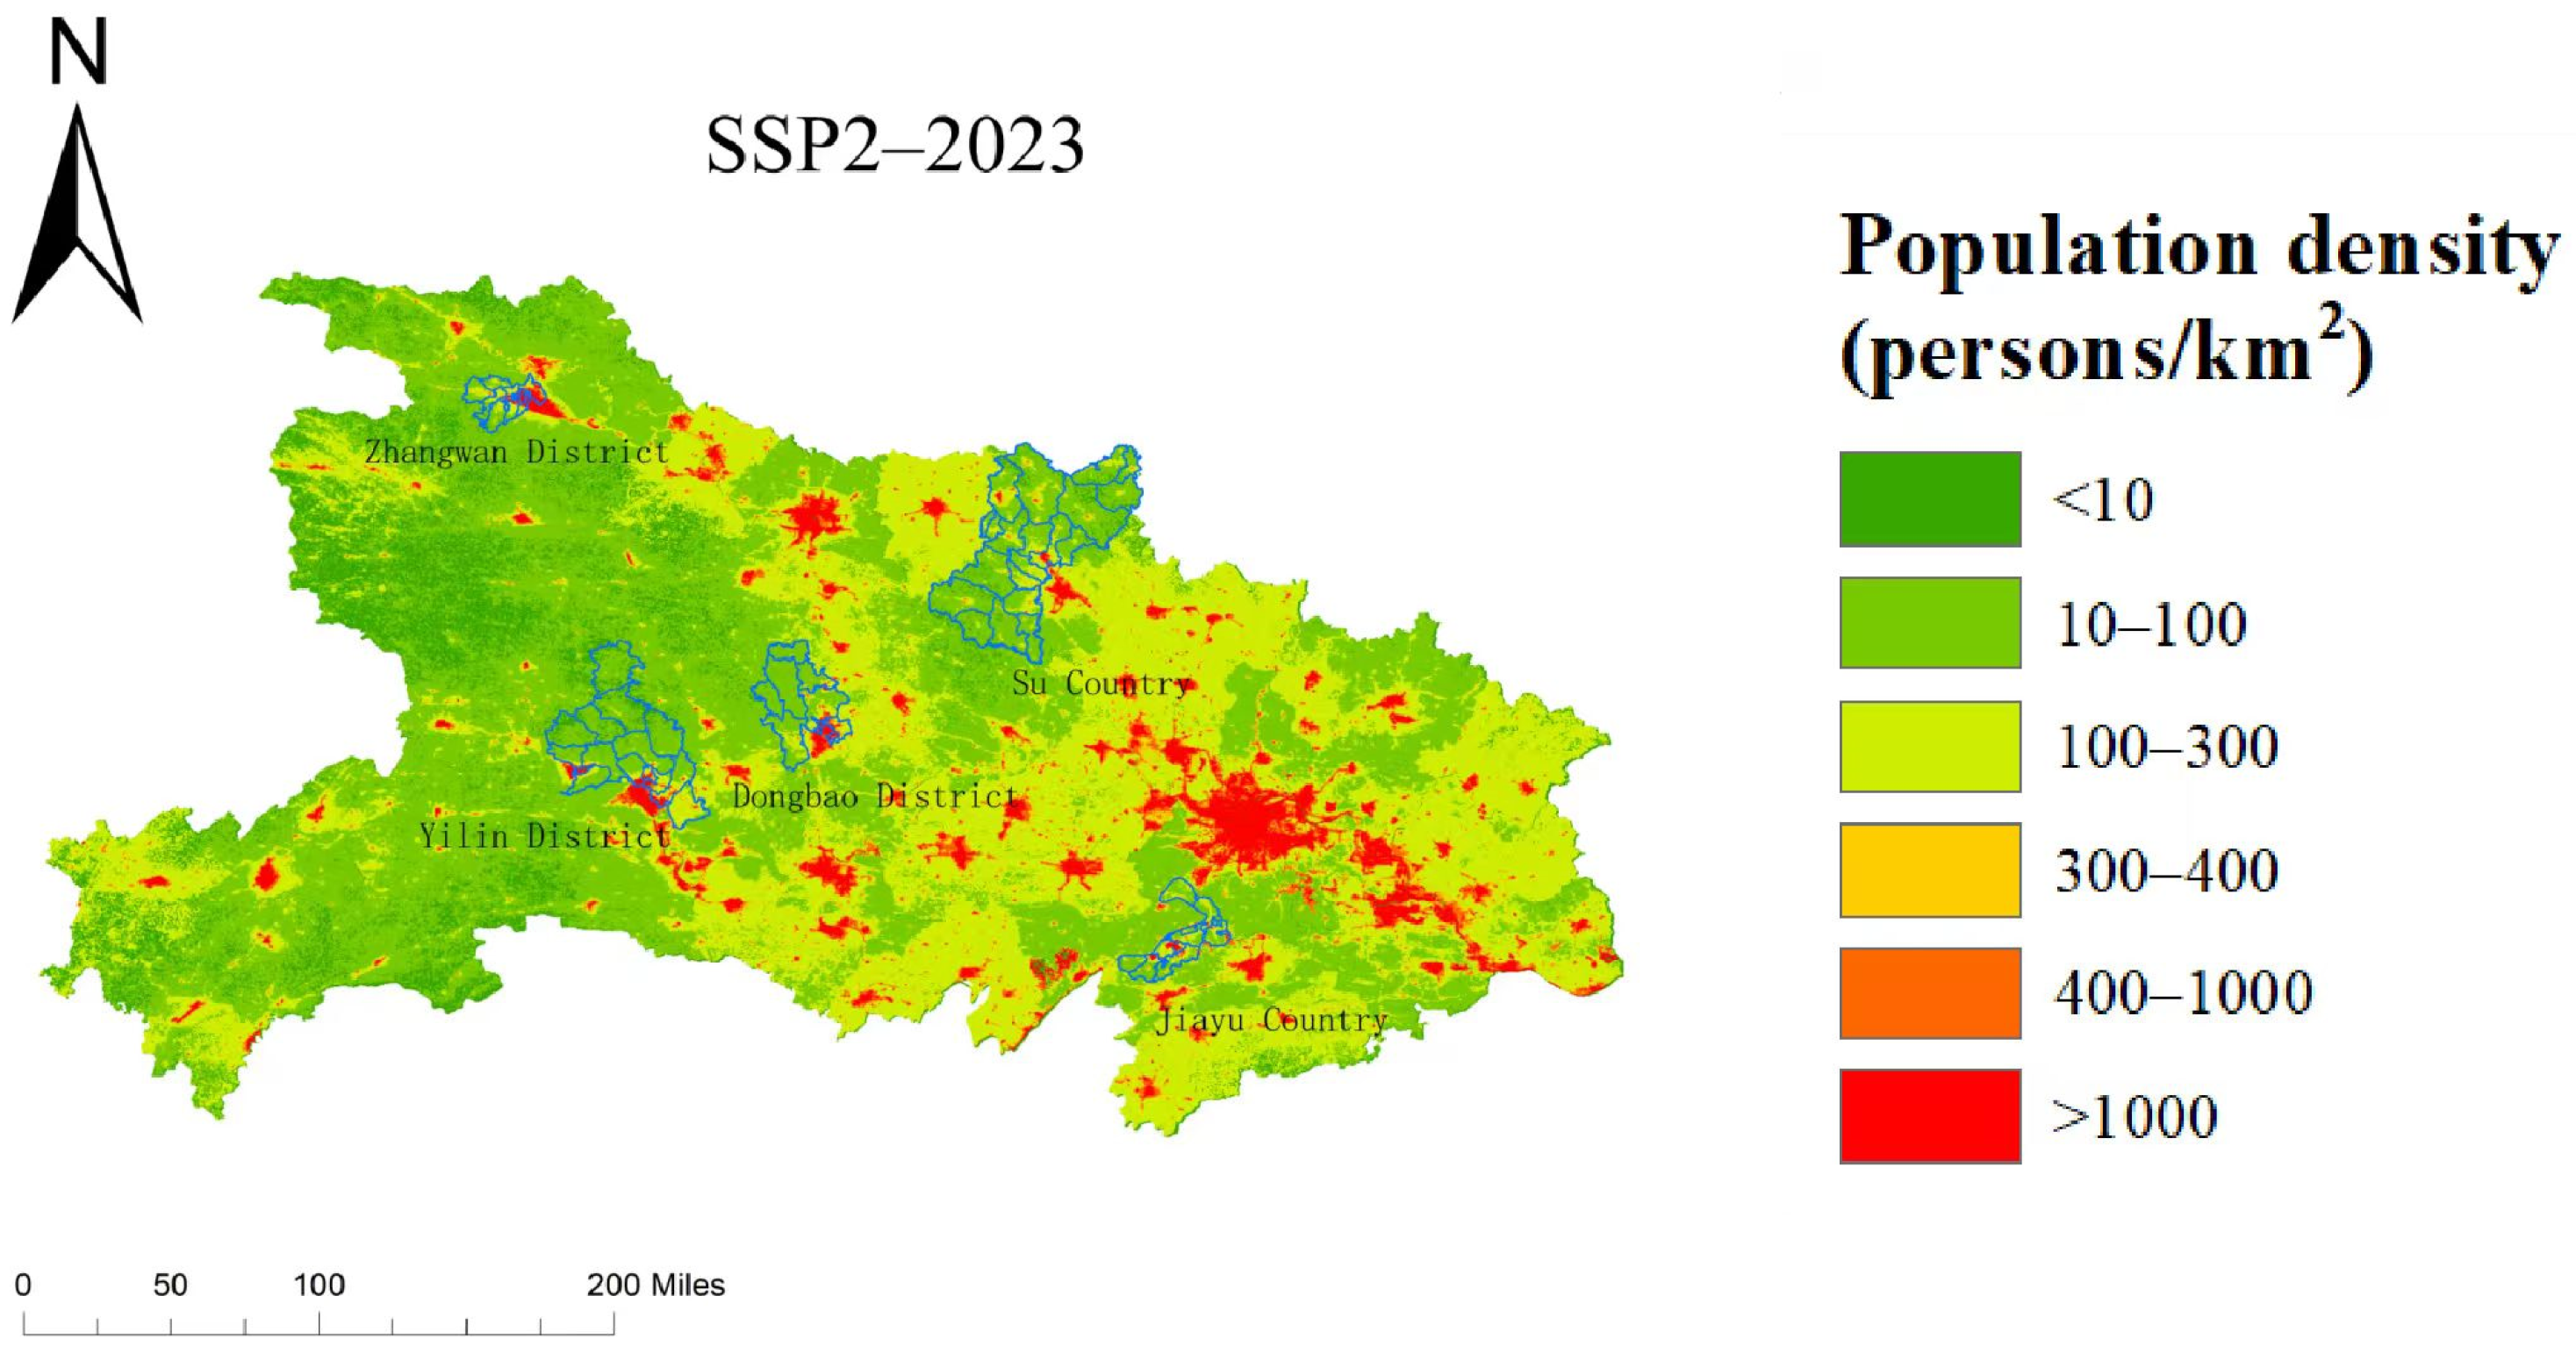
Five counties (Zhangwan District, Sui County, Yiling District, Jiayu County, and Dongbao County) were randomly selected for detailed verification (Figure 3). Town/township boundaries were digitized into vector maps, and the population for each of the 65 towns/townships was extracted by overlaying the population grid data using GIS spatial analysis functions. The extracted values were then compared with the 2023 statistical population data. The validation results show that, using the statistical data as ground truth, the relative errors of the spatialized population data range from 4.7% to 13.8%, with the majority of samples having a relative error below 8%, indicating good model accuracy.
Figure 3.
Locations of the five selected counties and the population distribution predicted by the spatialization model under the SSP2 scenario for the year 2023.
4. Spatiotemporal Variations and Risk Analysis of Population Exposure
4.1. Dynamic Characteristics of the Spatiotemporal Distribution of the Populations
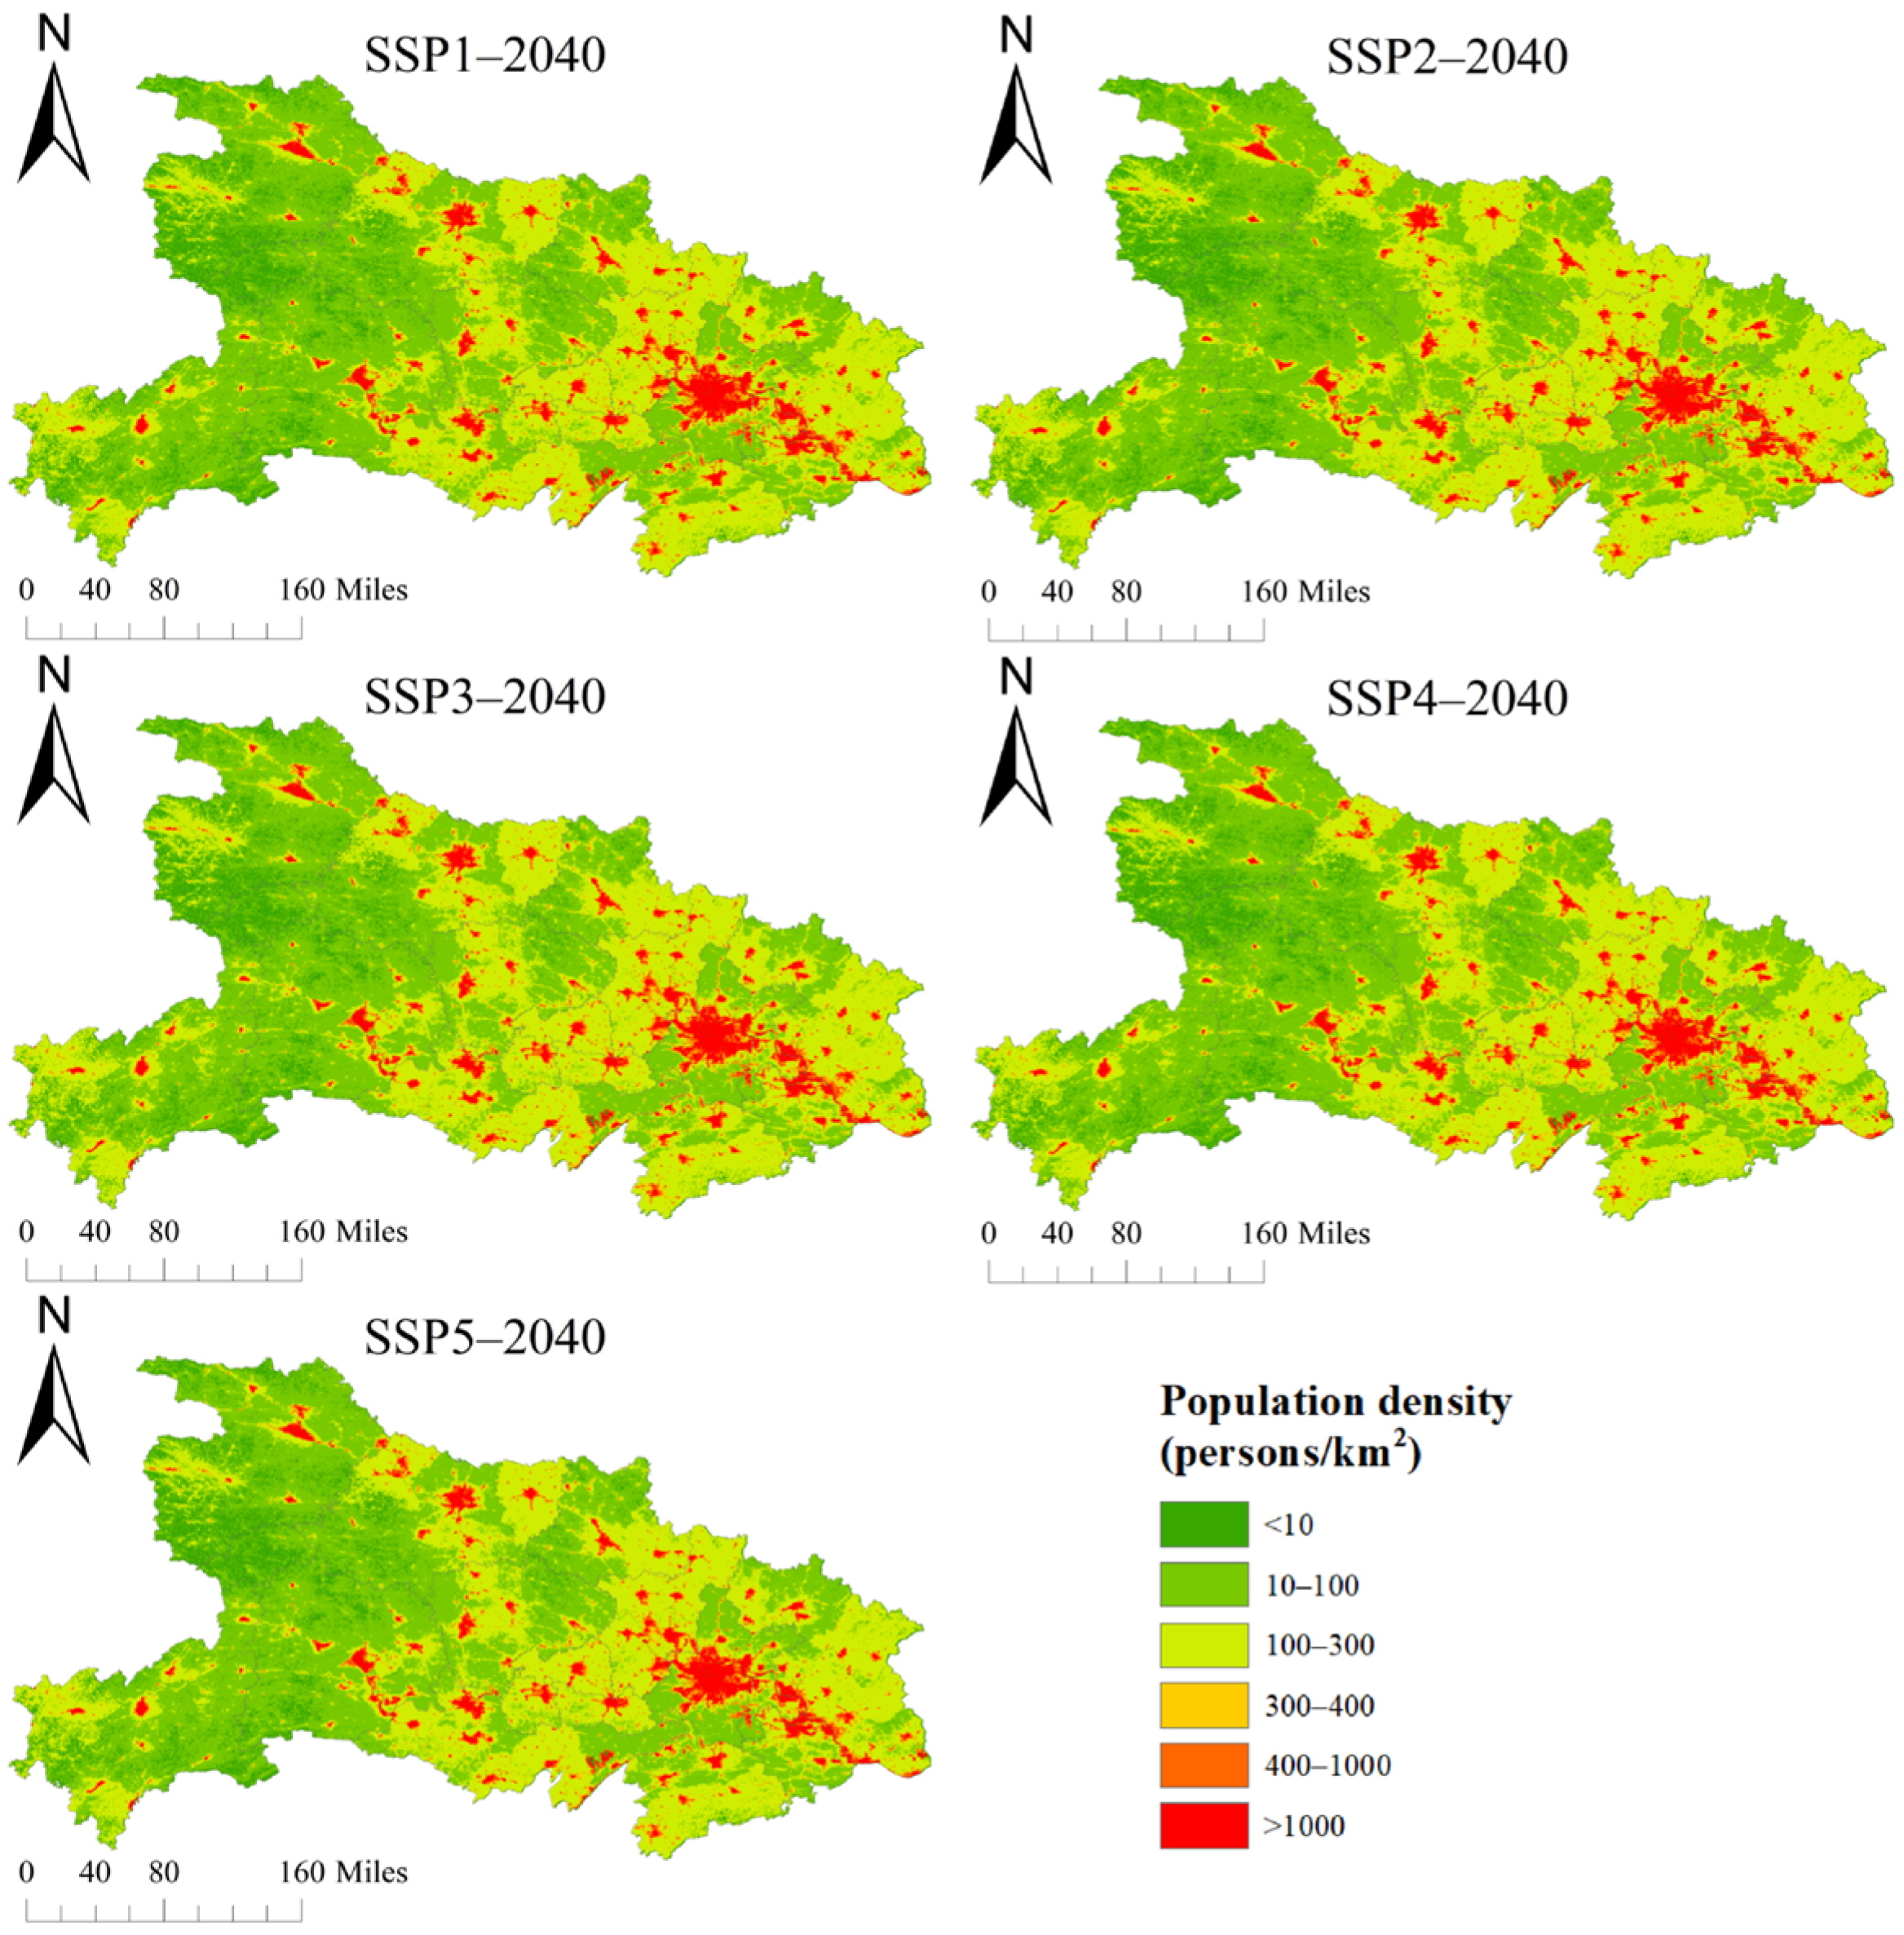
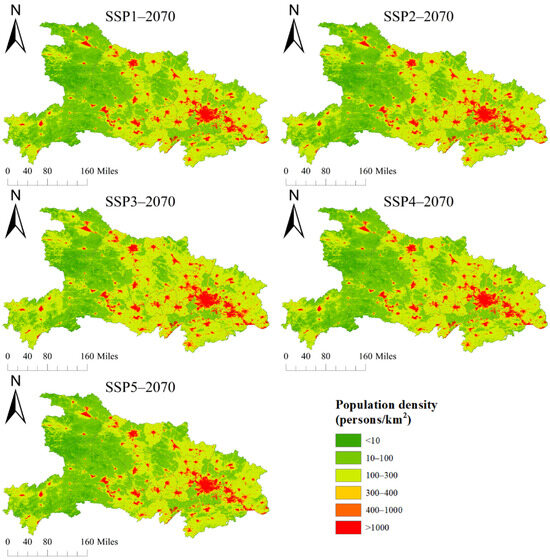
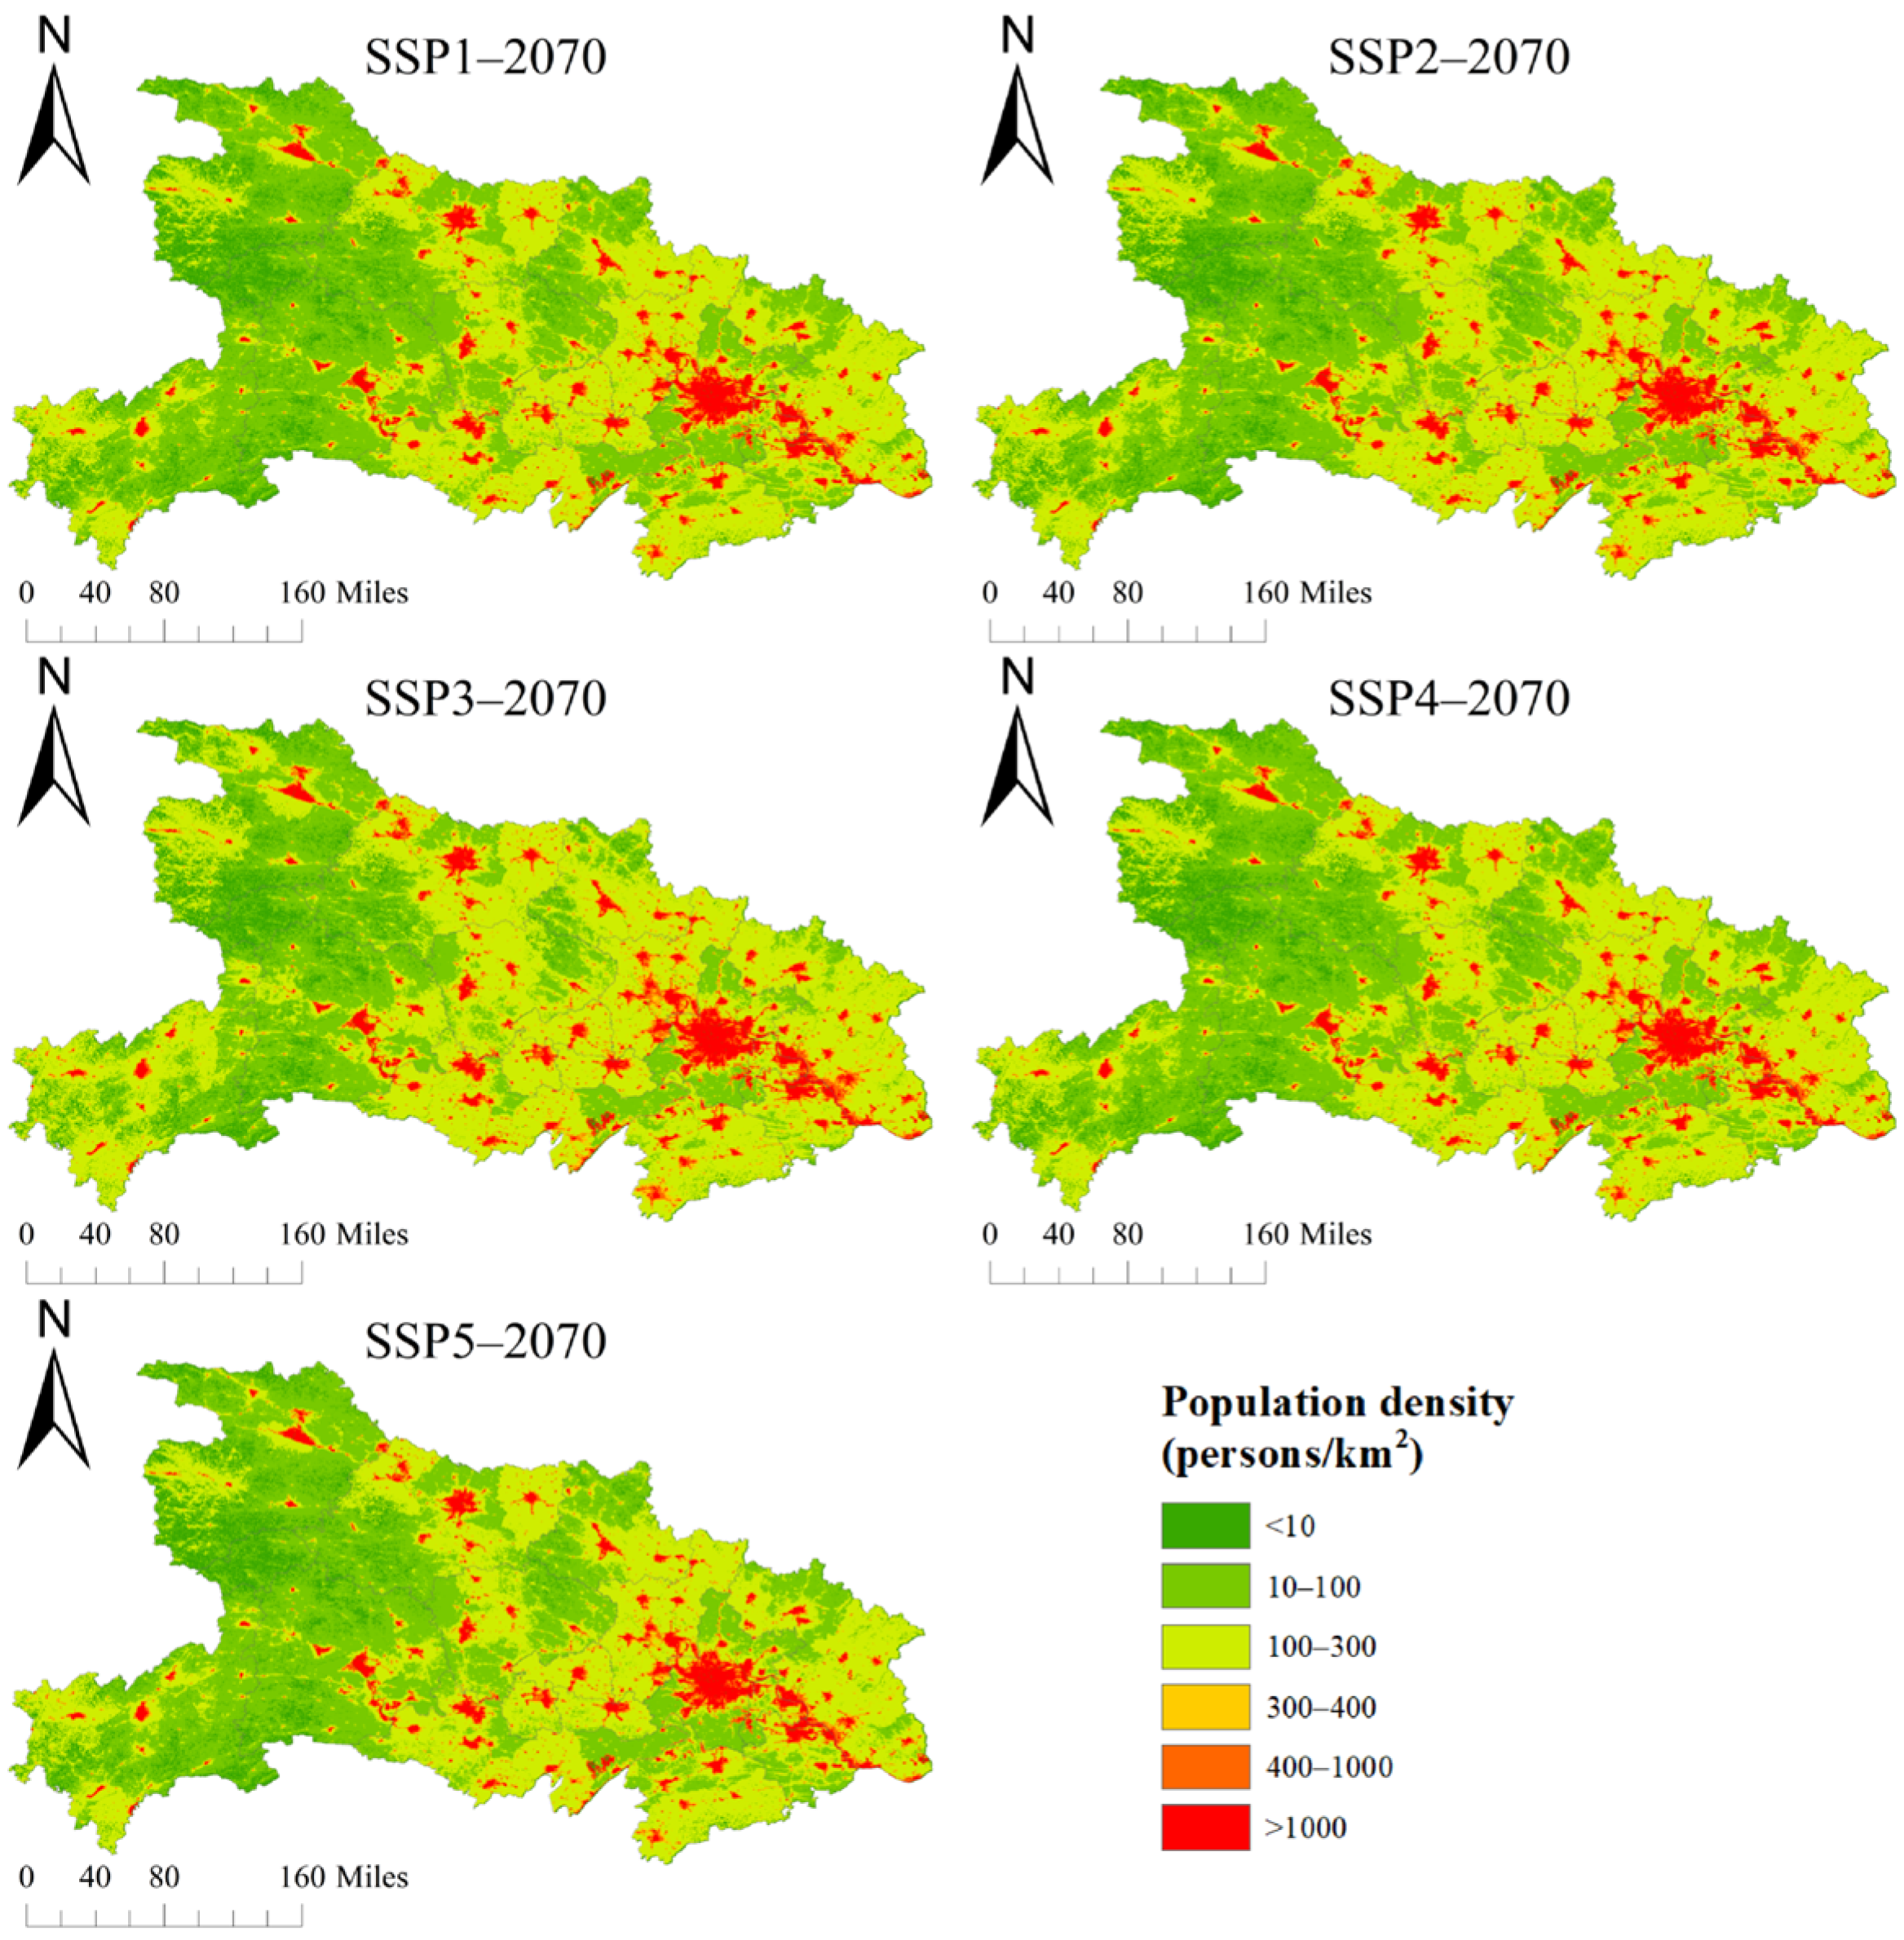
Based on spatialized models, future population density distribution maps at a 500 m grid scale were generated (Figure 4 and Figure 5 show the results for 2040 and 2070, respectively). The figures reveal that the province exhibits an overall pattern of denser populations in the east and sparser populations in the west, which is likely related to the topography characterized by predominantly plains in the east and mountainous terrain in the west. The urban agglomeration of Wuhan and its surrounding areas have relatively high population densities, with most areas having medium to high population density areas. The population concentration in some central urban areas of Wuhan is very high (>1000 people/km2).
Figure 4.
Spatial distribution map of the population in Hubei Province in 2040 under 5 different SSPs.
Figure 5.
Spatial distribution map of the population in Hubei Province in 2070 under 5 different SSPs.
From a temporal perspective, urbanization leads to increasing population density. This scenario manifests as a year-over-year decrease in the number of counties classified as sparsely populated areas (<300 people/km2) and a corresponding increase in counties categorized as moderately or extremely densely populated areas (>300 people/km2) (Table 2). This agglomeration trend is most pronounced under SSP3.
Table 2.
Changes in the number of counties with different population density levels under different scenarios.
Across scenarios, the population distribution patterns under SSP1 and SSP5 are highly similar. SSP3 has the strongest spatial concentration effect, with extremely dense population zones (>400 people/km2) covering 9.53% of the total area by 2070—which is greater than the 7.84% observed under SSP1/SSP5 (Table 3). This finding indicates that under SSP3, the total population is larger, and the population concentration in a smaller number of high-density areas is more pronounced, significantly altering the spatial characteristics of exposure. The analysis shows that different economic pathways substantially influence both the magnitude and the pace of population density increases at the county level.
Table 3.
Area proportion of different population density levels in the province under different scenarios.
4.2. Spatiotemporal Evolution of Population Exposure Risk to Earthquakes
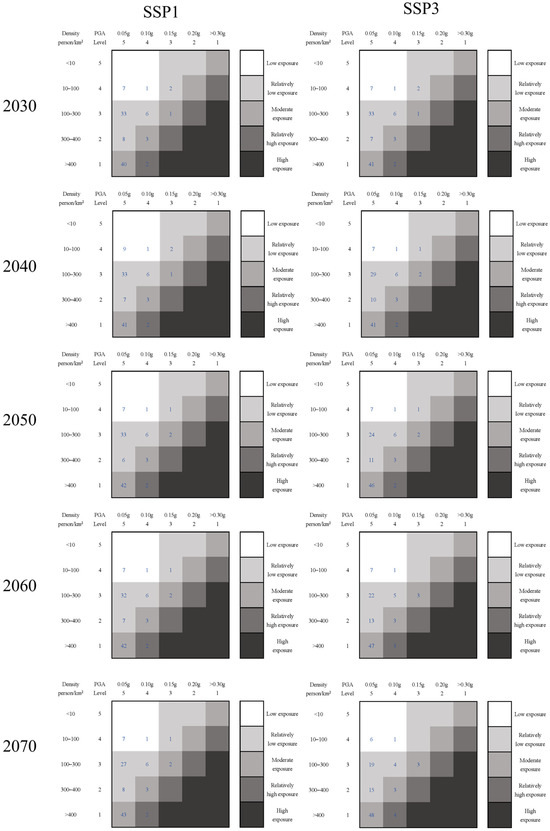
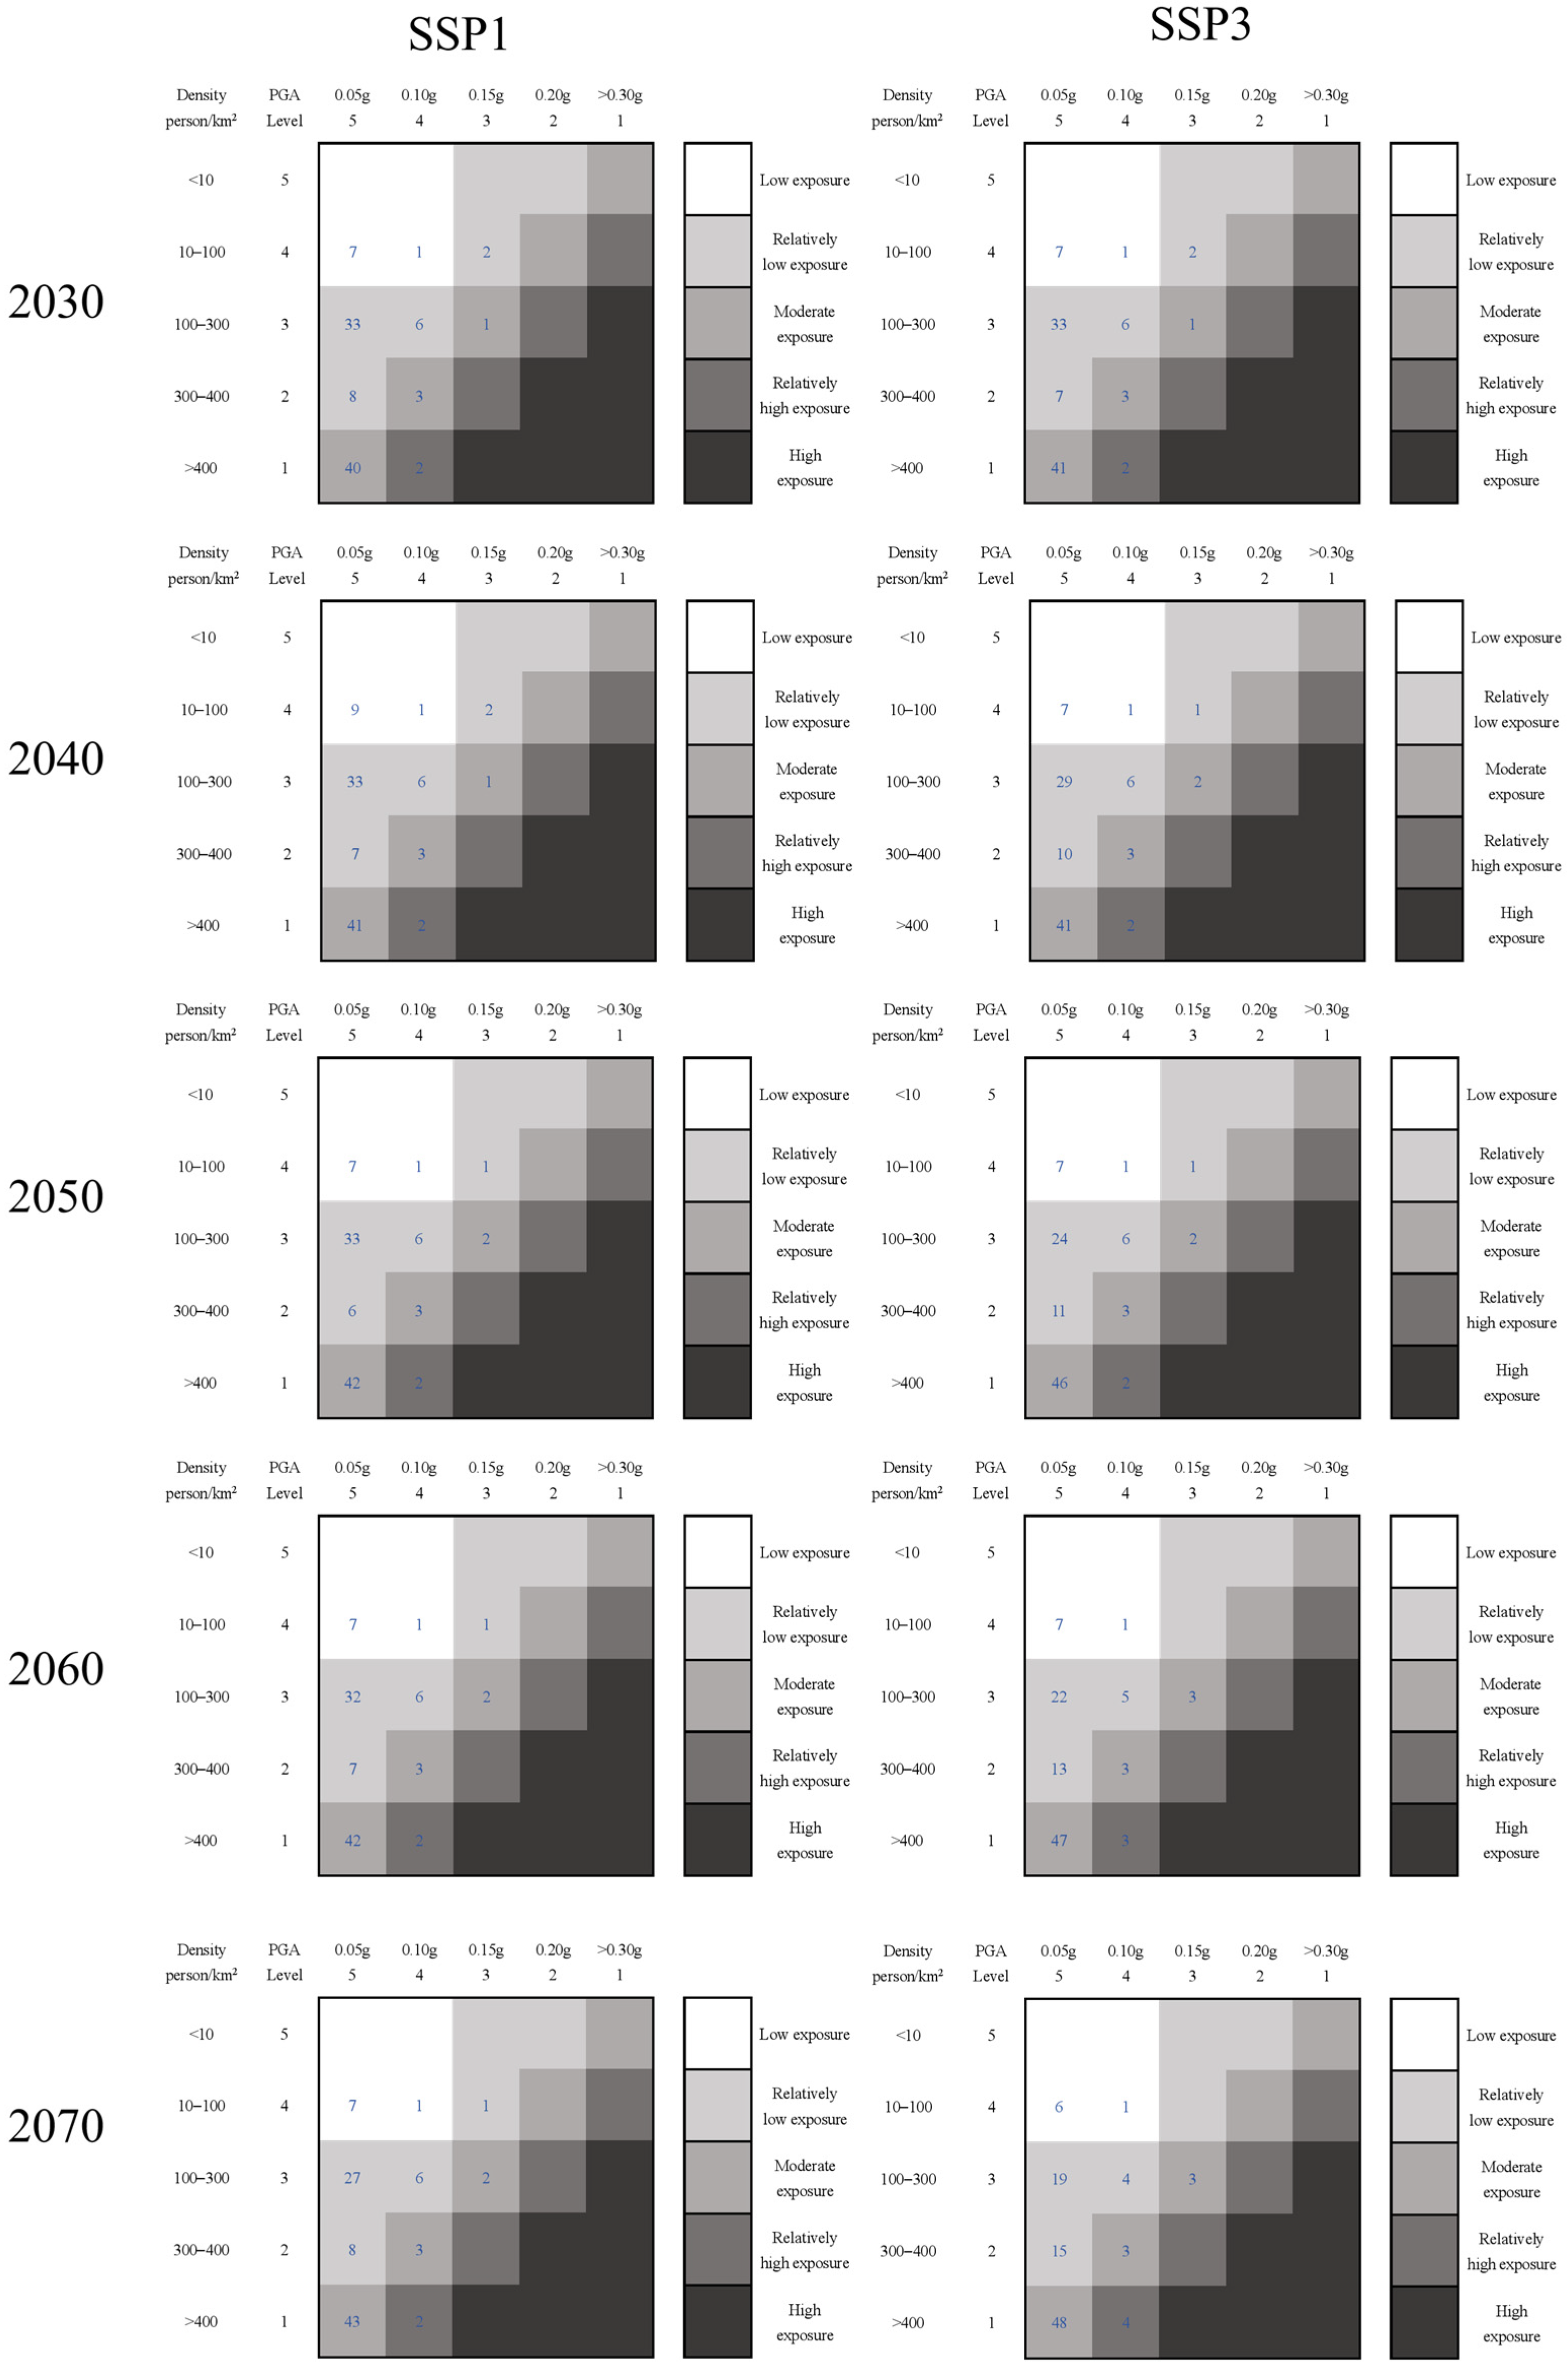
Based on seismic hazards and future population distributions, this study uses an exposure risk matrix analysis to reveal the dynamic changes in seismic risk under different pathways (Figure 6).
Figure 6.
Changes in the number of counties with different population exposure risk zones in Hubei Province under the SSP1 and SSP5 scenarios.
In the broad low-hazard zone, with a PGA of 0.05 g, although the regional hazard level is not high, the extensive coverage area supports a large population. Under SSP3, the number of counties experiencing moderate exposure levels will increase from 40 to 48 by 2070. This finding indicates, even in areas with low seismic hazard, sustained population growth can significantly expand the overall size of the population exposed to potential earthquake hazards.
In the 12 counties/districts with a PGA of 0.1 g, the risk pattern remains relatively stable under SSP1. However, under SSP3, population exposure risks continue to increase rapidly; by 2070, 58% of these counties/districts will face medium or higher exposure levels, with Xinzhou District, Xiangyang District, Laohekou city, and Gong’an County evolving into areas with higher exposure risks. These counties/districts, characterized by moderate seismic hazards and projected rapid population concentrations, represent key areas that require heightened attention in future earthquake disaster risk prevention and mitigation efforts.
In the three counties with a PGA of 0.15 g (Zhushang County, Zhuxi County, and Yingshan County), the current population sparseness level indicates relatively low risk. However, compared with the SSP1 pathway, the SSP3 pathway significantly shortens the risk latency period. For instance, Zhushan County’s risk level will increase 10 years earlier. By 2060, all three counties will enter the medium exposure risk category. This finding indicates that, for regions currently characterized by “high hazard–low exposure,” the choice of socioeconomic pathway determines the duration of the risk latency period, and a low current risk should not lead to future dynamic evolution being ignored.
The analysis indicates that SSP3 corresponds to both the fastest population growth and the most severe increase in earthquake exposure risk. By simultaneously amplifying both population-scale effects and spatial clustering effects, the risk levels significantly increase in areas with moderate to high seismic hazards and accelerate the transition to higher risk categories.
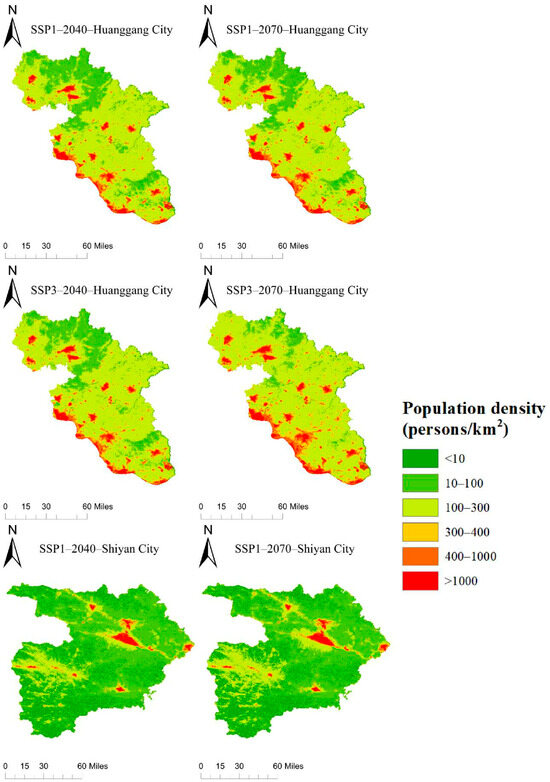
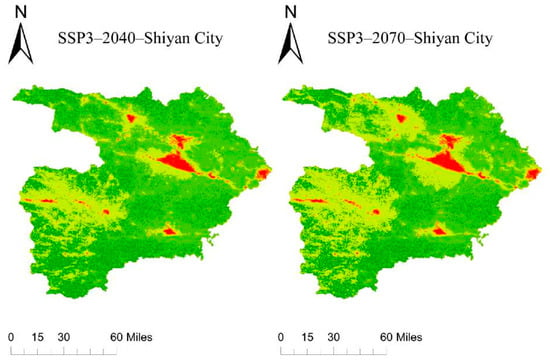
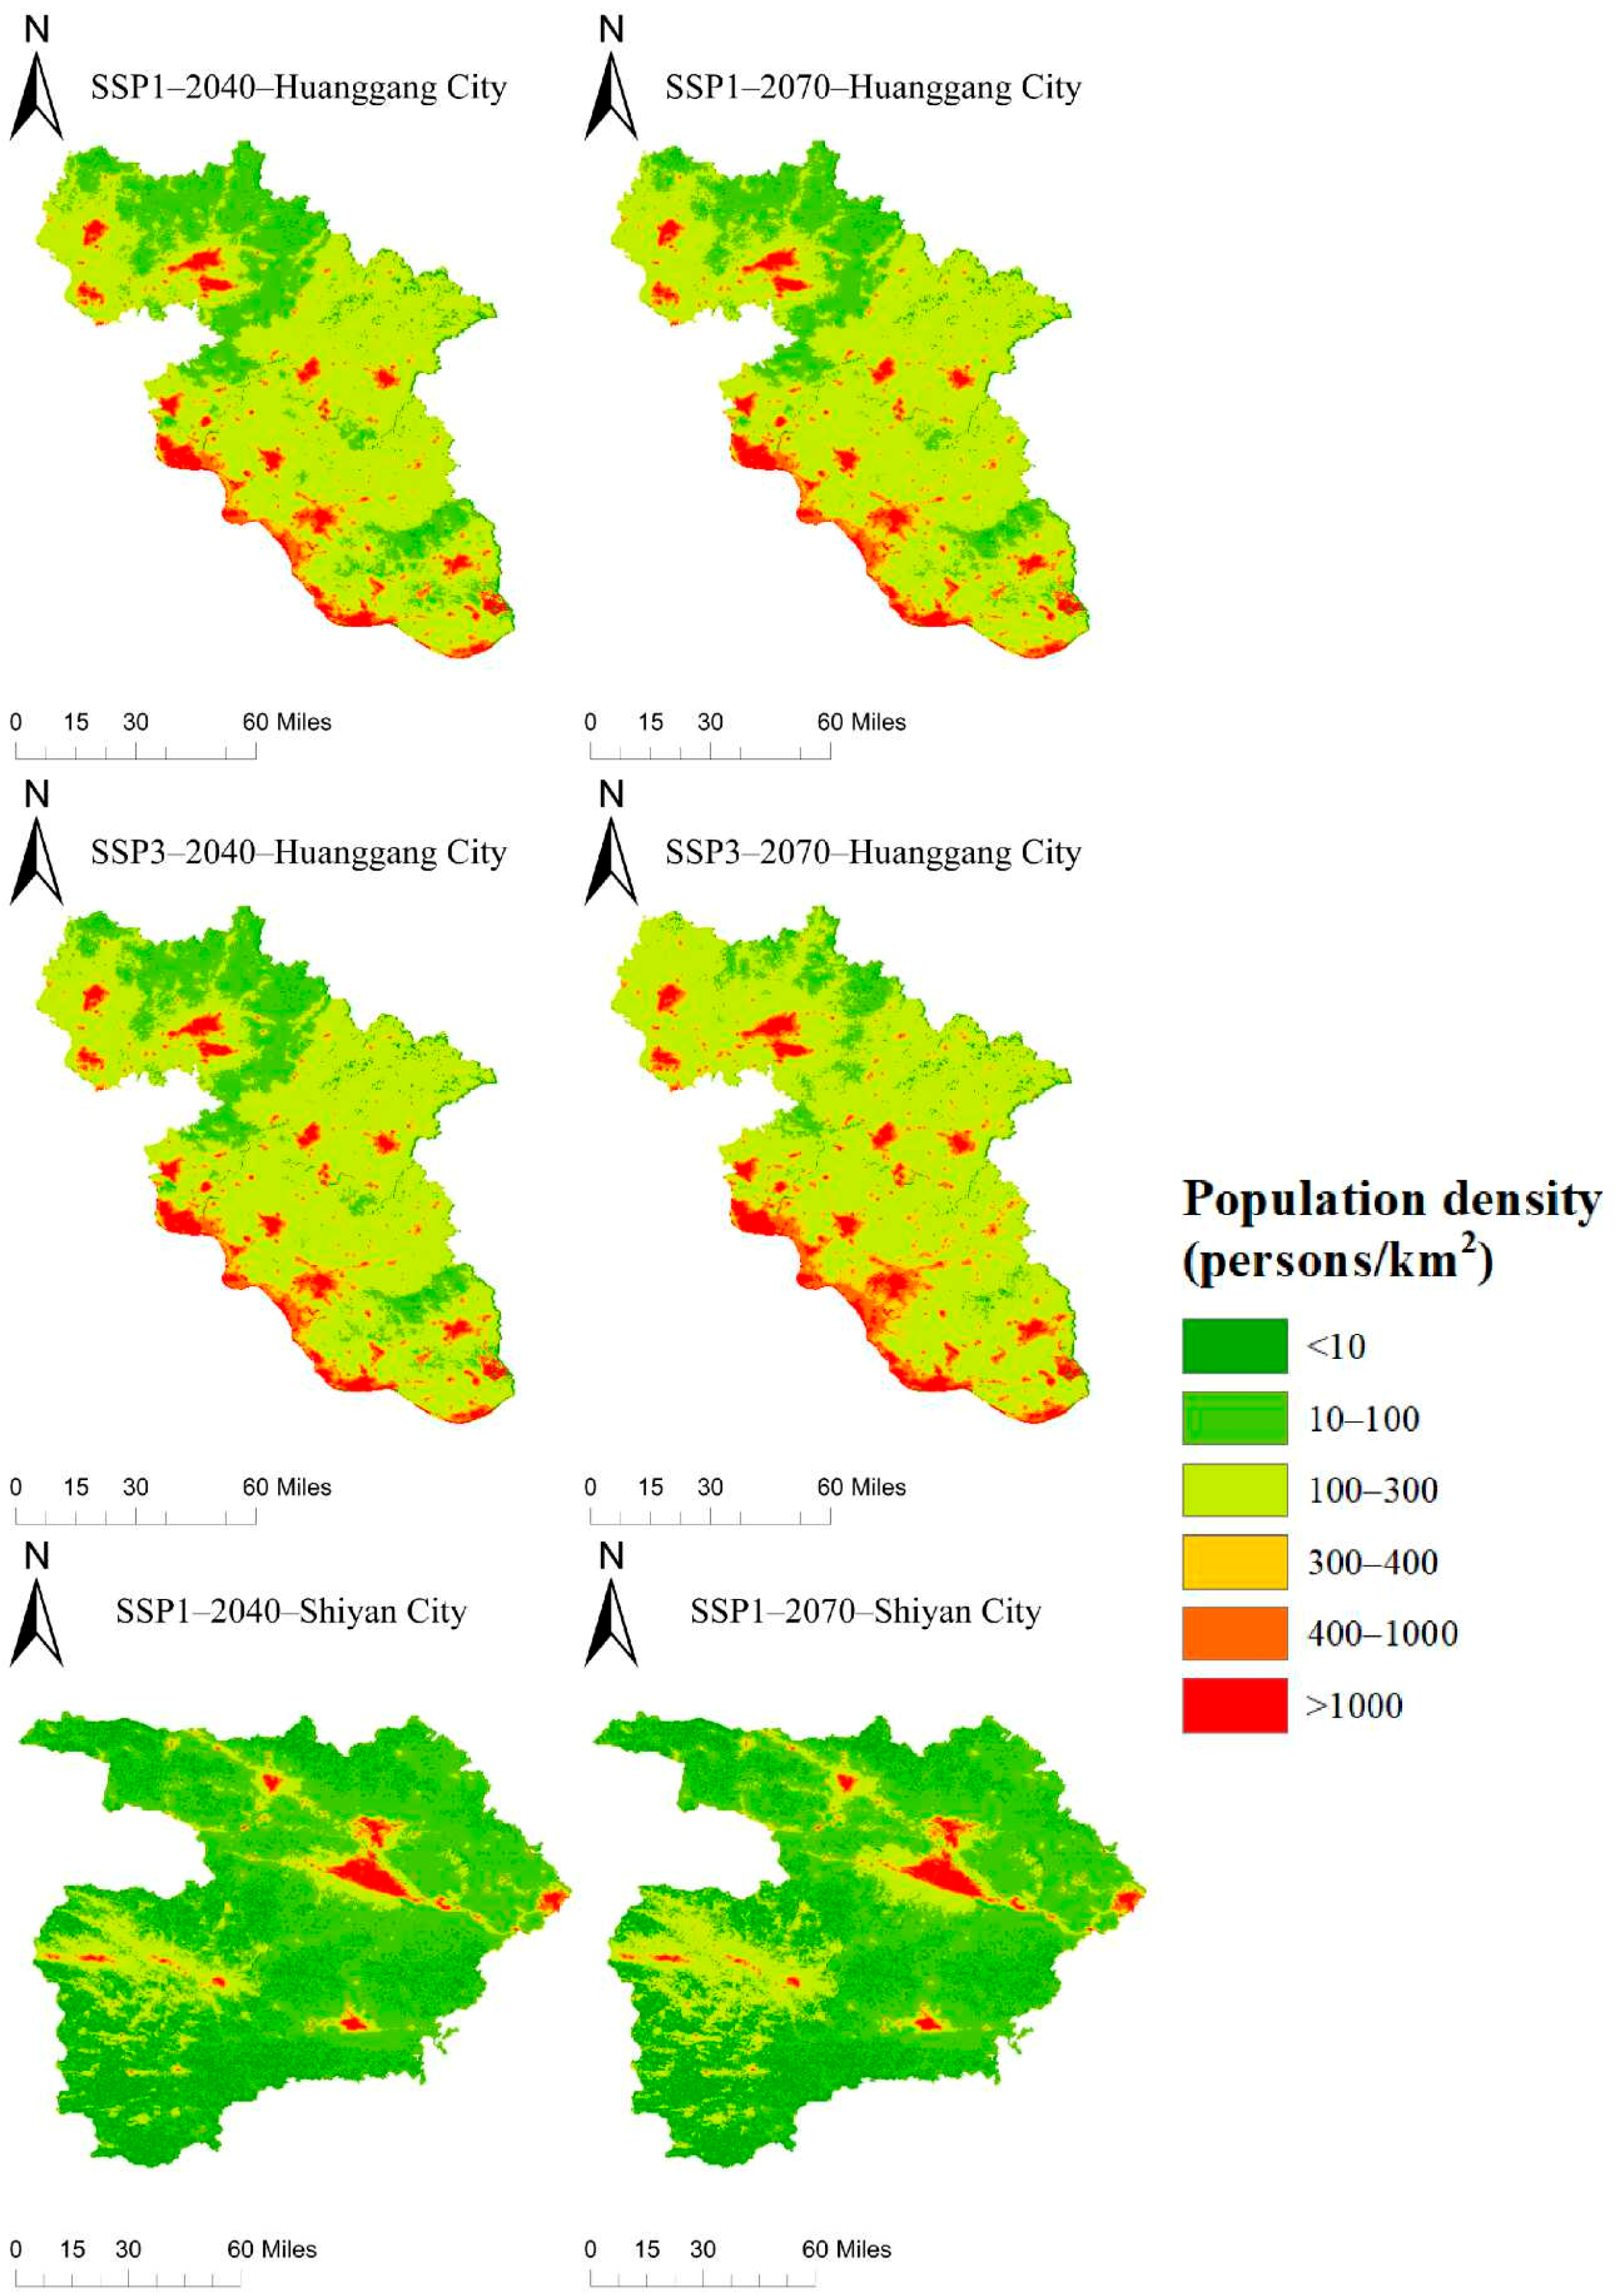
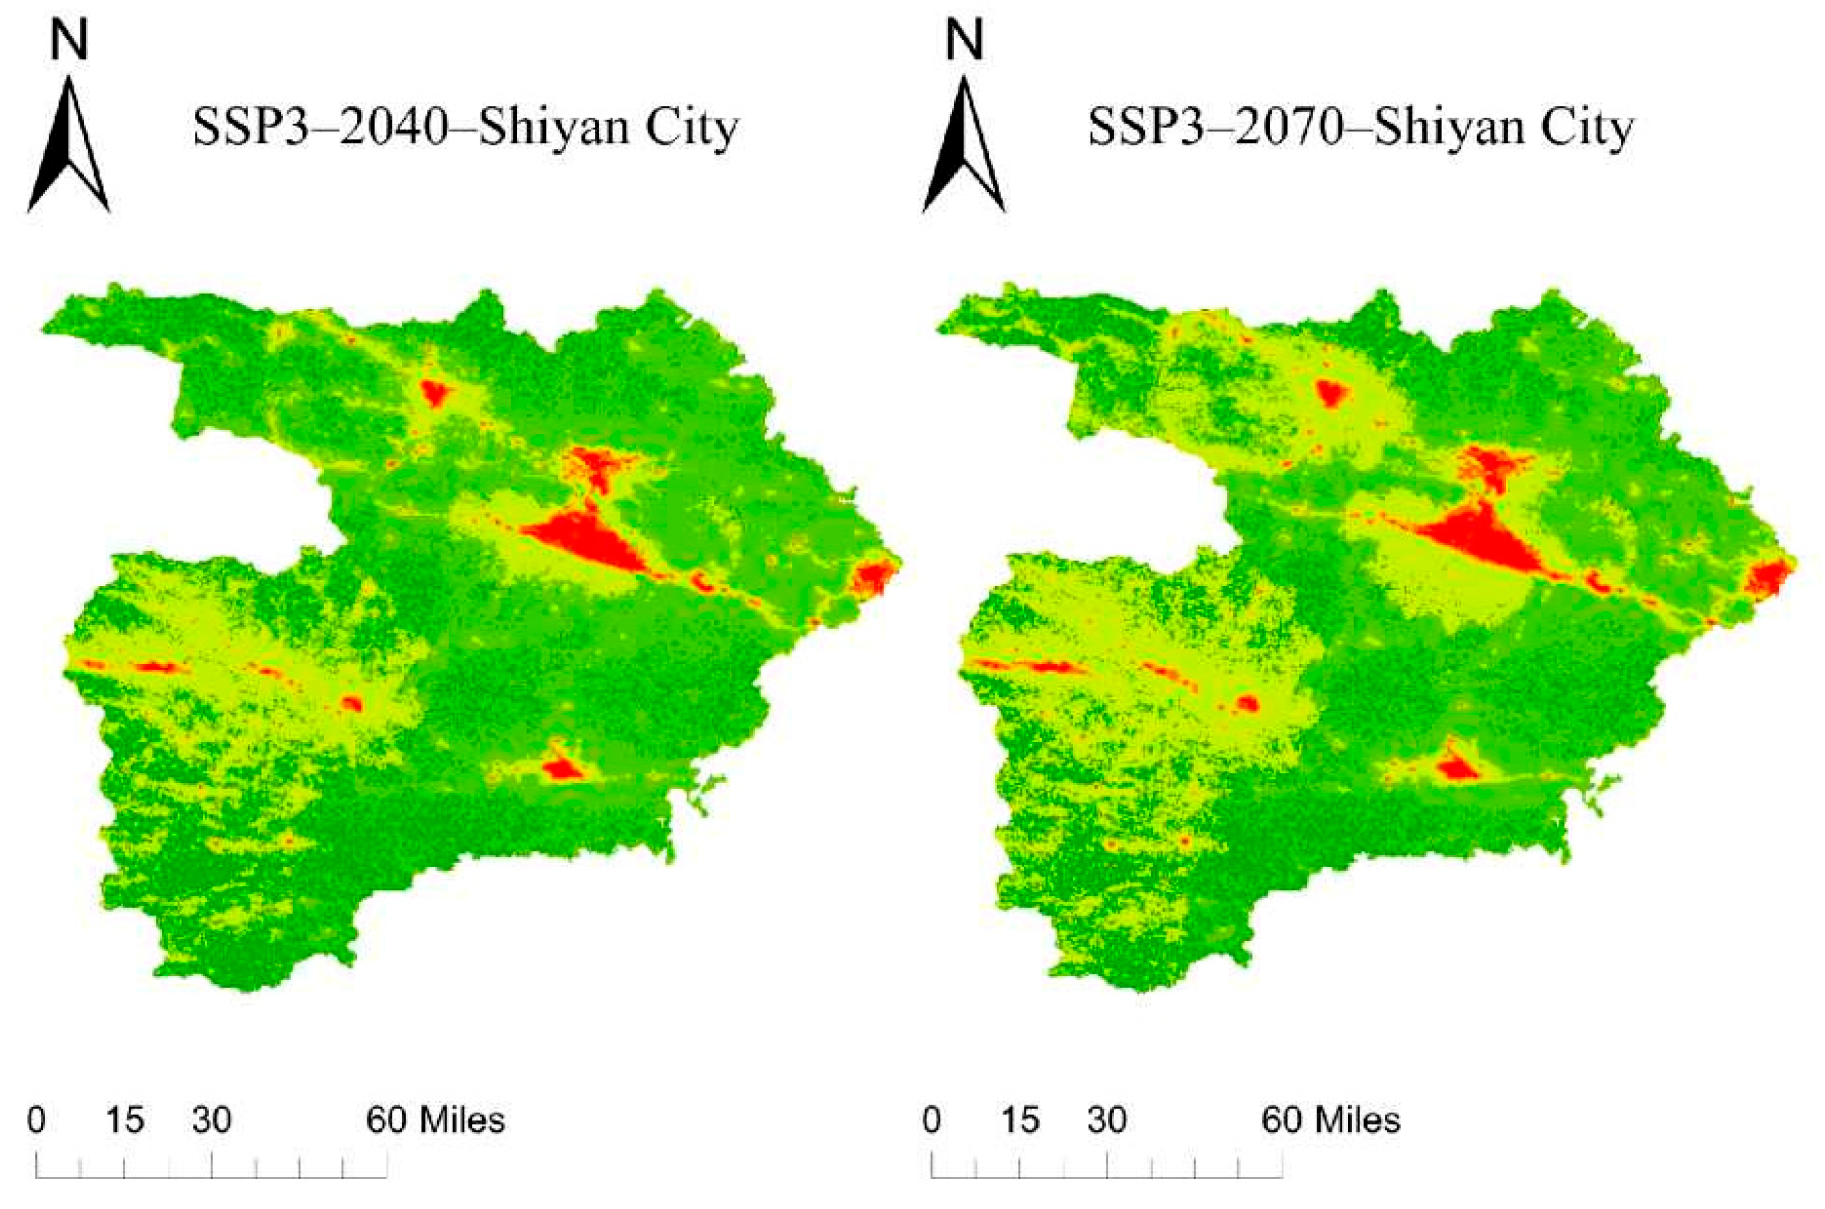
Figure 7 presents the spatial distribution of population in Shiyan City and Huanggang City (which together include three counties with PGA of 0.15 and eight counties with PGA of 0.1) under the SSP1 and SSP3 scenarios for 2040 and 2070. The comparison shows that, under the SSP3 scenario, population agglomeration is more pronounced—particularly reflected in a notable increase in the areas of moderately dense and relatively dense zones, which are mainly distributed around urban peripheries. This indicates that, under SSP3, the population in these key counties gradually expands, thereby increasing their seismic population exposure risk. Therefore, when long-term disaster prevention and mitigation plans are formulated, it is imperative to consider the profound risk implications that different development pathways may entail.
Figure 7.
Spatial distribution map of the population Shiyan City and Huanggang City under the SSP1 and SSP3 for 2040 and 2070.
5. Conclusions and Outlook
5.1. Conclusions
In this study, Hubei Province is used as a case example to conduct a detailed and dynamic assessment of future earthquake disaster exposure to populations through SSP population projections and spatial analysis. The main conclusions are as follows:
1. Different socioeconomic pathways significantly alter future population exposure patterns. Diverse SSP trajectories result in substantial variations in future populations. Under the SSP3 pathway, there may be dual pressures from a large total population and strong spatial agglomeration, significantly increasing population exposure risk. This finding underscores the importance of coordinating the formulation of long-term disaster prevention strategies with macroeconomic development strategies.
2. High-resolution population dynamic modeling enhances the scientific rigor and accuracy of population exposure risk assessments. This study derives annual dynamic population distribution data for Hubei at a 500 m grid resolution, overcoming the limitations of traditional administrative unit data. This approach revealed the nonuniformity of population distribution and its evolving risk patterns, enabling more dynamic and refined exposure assessments. Methodologically, this framework integrates socioeconomic scenarios into disaster risk management, offering new approaches and insights for developing more forward-looking and resilient development policies.
3. Earthquake population exposure risk exhibits distinct spatiotemporal variations and dynamic evolution characteristics. Risk is not static but undergoes dynamic transformation driven by different pathways. In this study, areas such as the rapid risk escalation zones for PGA 0.10 g regions under the SSP3 and the early risk transition zone for PGA 0.15 g regions are identified. This information facilitates scientific assessment of future disaster-prone areas that require heightened attention and critical time points for risk transformation.
5.2. Recommendations and Discussion
Based on the results, the following recommendations are proposed for earthquake prevention and mitigation efforts in Hubei Province: For these counties/districts identified as rapid risk-escalation zones under SSP3 (Xinzhou and Xiangyang Districts; Laohekou, Gong’an, Zhushan, Zhuxi, and Yingshan Counties), we recommend designating high-risk zones as priority restricted areas in land-use planning, limiting new high-density development in industrial layouts, and applying stricter seismic fortification standards for major infrastructure. For continuously growing megacity clusters (e.g., Wuhan City), efforts should focus on seismically reinforcing critical lifeline systems (such as water supply, power grids, and transportation networks) and ensuring that emergency shelter capacity meets standards, thereby enhancing urban seismic resilience. For high-hazard areas (e.g., western Hubei), where current exposure is low but may increase in the future, strict development controls should be implemented—particularly limiting large-scale residential and commercial projects within high-risk zones—to prevent risk accumulation.
Potential sources of uncertainty: Specifically, this study involves three types of inputs: population projections, remote sensing data, and seismic hazard data. Sources of uncertainty include scenario uncertainty in SSP population projections, radiometric saturation and background noise in nighttime light data, and interannual NDVI fluctuations affecting weighting indices. Although these uncertainties cannot be completely eliminated, the use of consistent annual data, rigorous preprocessing (outlier removal and negative value replacement), and a total-population-constrained spatialization method effectively reduces their impact on the final population grids. However, because this study focuses on comparing exposure risks under different scenarios and given the differences in scale and uncertainty propagation mechanisms among the three data types, a formal quantitative uncertainty propagation analysis has not yet been conducted. Future work could incorporate methods such as Monte Carlo simulation to further quantify uncertainty propagation.
Analysis of population agglomeration under the SSP3: This study finds that, under the SSP3 scenario—characterized by slow economic growth and lagging urbanization—population agglomeration is higher and earthquake exposure risk is greatest. This may occur because, in key counties with existing urban foundations, infrastructure investment tends to concentrate in established town centers, while peripheral areas face development constraints. This can lead to further population clustering in a few core towns, creating a phenomenon of “local agglomeration amid low growth.” This pattern is consistent with observations in some developing countries. Furthermore, as shown in Figure 7, under SSP3, population expansion toward urban peripheries is evident, whereas rural population changes remain mild, confirming a spatial signature of local agglomeration rather than widespread growth. This also indicates that the increased exposure risk under SSP3 arises not from overall population expansion but from the redistribution of population within hazard-prone areas.
Limitations and future prospects: First, the PGA used in seismic hazard assessment represents the peak ground acceleration with a 10% exceedance probability over a 50-year period. While these data encompass century-scale variations, seismic activity itself is uncertain and periodic. Probabilistic methods or specific fault rupture scenarios could be further employed to more comprehensively reflect this uncertainty. Second, population projection parameters are sensitive to policy responses. Future work should continuously monitor the effects of new population policies and update parameters accordingly. Third, spatial population models can integrate additional socioeconomic drivers (e.g., transportation and employment) to improve explanatory power. Fourth, future exposure studies should incorporate more information—such as information on vulnerability and population age structure—to move toward “social vulnerability” and “integrated risk” assessments with stronger loss estimation capabilities, thereby providing more comprehensive decision support for disaster prevention and mitigation. Finally, the core approaches of this study—spatialization based on nighttime light and NDVI data and probabilistic seismic hazard zonation—all rely on openly available global or regional data products. Therefore, the framework can be extended to areas with similar data conditions. The method can also be used for actual exposure risk prediction; population grid products (e.g., WorldPop) could be considered as substitutes for the spatialized results of projected populations, although trade-offs between spatial accuracy and temporal continuity among different data sources need to be considered. In future research, higher spatial resolutions (e.g., 100 m) or advanced downscaling methods (e.g., machine learning) can be used for finer-scale risk analysis. This would require multi-scale sensitivity analyses to explicitly quantify effects such as the modifiable areal unit problem (MAUP) and impacts of interannual data fluctuations.
Author Contributions
Conceptualization, X.L. and X.H.; methodology, X.H. and Y.H.; software, J.Y.; validation, H.L. and M.Z.; formal analysis, Y.H.; investigation, X.H. and J.Y.; data curation, X.L.; writing—original draft preparation, X.H. All authors have read and agreed to the published version of the manuscript.
Funding
This research was funded by the Scientific Research Fund from Institute of Seismology, China Earthquake Administration, grant number IS202436358; the Youth Project from the Hubei Research Center for Basic Disciplines of Earth Sciences, grant number HRCES-202508; the National Natural Science Foundation of China, grant number 42477504; the Research grants from National Institute of Natural Hazards, Ministry of Emergency Management of China, grant number ZDJ2024-31.
Data Availability Statement
The original contributions presented in this study are included in the article. Further inquiries can be directed to the corresponding author.
Conflicts of Interest
Author Jian Ye is employed by Three Gorges Geotechnical Consultants Co., Ltd. The remaining authors declare no conflicts of interest.
References
- Chen, Y.T. Earthquake prediction: Retrospect and prospect. Sci. China Ser. D-Earth Sci. 2009, 39, 1633–1658. (In Chinese) [Google Scholar]
- Birkmann, J.; Welle, T.; Solecki, W.; Lwasa, S.; Garschagen, M. Boost resilience of small and mid-sized cities. Nature 2016, 537, 605–608. [Google Scholar] [CrossRef] [Scilit]
- Jongman, B.; Koks, E.E.; Husby, T.G.; Ward, P.J. Increasing flood exposure in the Netherlands: Implications for risk financing. Nat. Hazards Earth Syst. Sci. 2014, 14, 1245–1255. [Google Scholar] [CrossRef] [Scilit]
- Wen, J.H.; Yan, J.P.; Yin, Z.E.; Meng, Q.; Yie, X. Mainstreaming Disaster Risk Management in China. Prog. Geogr. 2010, 29, 771–777. (In Chinese) [Google Scholar]
- Kurnio, H.; Fekete, A.; Naz, F.; Norf, C.; Jüpner, R. Resilience learning and indigenous knowledge of earthquake risk in Indonesia. Int. J. Disaster Risk Reduct. 2021, 62, 102423. [Google Scholar] [CrossRef] [Scilit]
- Du, P.; Zhai, Z.W.; Chen, W. The Elderly Population of China: A Century—Long Projection. Popul. Res. 2005, 29, 90–93. (In Chinese) [Google Scholar] [CrossRef]
- Men, K.P.; Guan, L.L.; Ying, X.Z. Prediction of China’s Population Based on Two New Grey Models. Econ. Geogr. 2007, 27, 942–945. (In Chinese) [Google Scholar] [CrossRef]
- Wang, Y.Y.; Wang, Y.J.; Jiang, T. Spatial-temporal Characteristics of Exposure and Vulnerability to Flood Disaster in Jiangsu Province. J. Yangtze River Sci. Res. Inst. 2016, 33, 27–32+45. (In Chinese) [Google Scholar] [CrossRef]
- Li, R.K.; Li, Y.H.; Xu, Y. Projection of Rainstorm and Flooding Disaster Risk in China in the 21st Century. J. Arid. Meteorol. 2018, 36, 341–352. (In Chinese) [Google Scholar]
- Liao, X.L.; Xu, W.; Zhang, J.L.; Li, Y.; Tian, Y.G. Global exposure to rainstorms and the contribution rates of climate change and population change. Sci. Total Environ. 2019, 663, 644–653. [Google Scholar] [CrossRef] [Scilit] [PubMed]
- Yang, P.G.; Jing, J.; Zhao, D.S.; Li, J. An Urban Vulnerability Study Based on Historical Flood Data: A Case Study of Beijing. Sci. Geogr. Sin. 2016, 36, 733–741. (In Chinese) [Google Scholar] [CrossRef]
- Han, Q.M.; Li, J.J.; Shi, P.J. Spatial temporal characteristics and contribution rate of rainstorm population exposure in Hubei. J. Catastropholog 2018, 33, 191–196. [Google Scholar] [CrossRef]
- Li, M.M.; Song, J.; Wang, Y.; Li, S.L.; Yan, J. Evolution of Population Distribution in Taiyuan Metropolitan Area. Technol. Ind. 2020, 20, 142–148. (In Chinese) [Google Scholar] [CrossRef]
- Zhang, Y.J.; Wang, X.X. A Study on Population Spatial Distribution in China from the Perspective of Urban Agglomeration. Popul. Econ. 2020, 3, 1–13. (In Chinese) [Google Scholar] [CrossRef]
- Huang, J.; Yan, Q.W.; Liu, Y.W. Modeling the population density of Jiangsu province based onDMSP/OLS satellite imagery and land use data. Resour. Environ. Yangtze Basin 2015, 24, 735–741. (In Chinese) [Google Scholar] [CrossRef]
- Luo, P.; Zhang, X.H. Modeling Population Density Using a New Index Derived from Multi-Sensor Image Data. Remote Sens. 2019, 11, 2620. [Google Scholar] [CrossRef] [Scilit]
- Zhou, L.; Chen, J.; Shi, P.J.; Gu, Z.; Fan, Y.; Ichinose, T. Modeling Population Density of China in 1998 Based on DMSP/OLS Nighttime Light Image. Acta Geogr. Sin. 2005, 60, 266–276. (In Chinese) [Google Scholar] [CrossRef]
- Fujimori, S.; Hanasaki, N.; Masui, T. Projections of industrial water withdrawal under shared socioeconomic pathways and climate mitigation scenarios. Sustain. Sci. 2017, 12, 275–292. [Google Scholar] [CrossRef] [Scilit]
- Hegre, H.; Halvard, B.; Katherine, V.C.; Nordkvelle, J.; Waldhoff, S.T.; Gilmore, E. Forecasting civil conflict along the shared socioeconomic pathways. Environ. Res. Lett. 2016, 11, 054002. [Google Scholar] [CrossRef] [Scilit]
- Dellink, R.; Chateau, J.; Lanzi, E.; Magné, B. Long-term economic growth projections in the shared socioeconomic pathways. Glob. Environ. Change 2015, 6, 200–214. [Google Scholar] [CrossRef] [Scilit]
- Samir, K.C.; Lutz, W. The human core of the shared socioeconomic pathways: Population scenarios by age, sex and level of education for all countries to 2100. Glob. Environ. Change 2014, 28, 15–18. [Google Scholar] [CrossRef] [Scilit]
- Lutz, W. Population-Development-Environment: Understanding Their Interactions in Mauritius; Springer: Heidelberg, Germany, 1994. [Google Scholar]
- Goujon, A.; Samir, K.C. The past and future of human capital in South-east Asia. Asian Popul. Stud. 2018, 4, 31–56. [Google Scholar] [CrossRef] [Scilit]
- Meng, L.G.; Li, C.L.; Hu, G. Predictions of China’s Population Structure Based on the PDF Model. China Popul. Resour. Environ. 2014, 24, 132–141. (In Chinese) [Google Scholar] [CrossRef]
- Jiang, T.; Zhao, J.; Jing, C.; Cao, L.; Wang, Y.; Sun, H.; Wang, A.; Huang, J.; Su, B.; Wang, R. National and Provincial Population Projected to 2100 Under the Shared Socioeconomic Pathways in China. Clim. Change Res. 2017, 13, 128–137. (In Chinese) [Google Scholar] [CrossRef]
- Hu, W.A.; Liu, C.L.; Zhang, Q.W. Synthetic method and comparison verification of NPP-VIIRS annual nighttime lighting data in China. J. Guilin Univ. Technol. 2021, 41, 141–148. (In Chinese) [Google Scholar] [CrossRef]
- Chen, M.L.; Cai, H.Y. VIIRS/DNB Monthly and Yearly Nighttime Light Dataset in Beijing-Tianjin-Hebei Region (2013–2018). J. Glob. Change Data Discov. 2019, 3, 376–381. [Google Scholar] [CrossRef] [Scilit]
- Ni, H.H.; Chen, N.; Chen, N. Some extensions on risk matrix approach. Saf. Sci. 2010, 48, 1269–1278. [Google Scholar] [CrossRef] [Scilit]
- Chen, Y.; Gou, F.; Wang, J.C.; Cai, W.; Wang, C.; Wang, K. Provincial and gridded population projection for China under shared socioeconomic pathways from 2010 to 2100. Sci. Data 2020, 7, 255–262. [Google Scholar] [CrossRef] [Scilit]

Disclaimer/Publisher’s Note: The statements, opinions and data contained in all publications are solely those of the individual author(s) and contributor(s) and not of MDPI and/or the editor(s). MDPI and/or the editor(s) disclaim responsibility for any injury to people or property resulting from any ideas, methods, instructions or products referred to in the content. |
© 2026 by the authors. Licensee MDPI, Basel, Switzerland. This article is an open access article distributed under the terms and conditions of the Creative Commons Attribution (CC BY) license.