


Abstract
The photocatalytic conversion of carbon dioxide (CO2) into methanol represents a promising strategy for both greenhouse gas mitigation and renewable fuel production. In this study, a niobium-based metal–organic gel (Nb-MOG) was employed as a photocatalyst for the reduction of CO2 to methanol under UV irradiation in a batch photoreactor. A two-factor experimental design was conducted to evaluate the effects of sodium carbonate concentration and catalyst loading on methanol production. The Nb-MOG catalyst was dispersed in the reaction medium and irradiated with UV light for four hours. During the photocatalytic experiments, samples were periodically collected and analyzed by headspace gas chromatography coupled with flame ionization detection (HS-GC-FID) to quantify methanol production. The results showed that both the Na2CO3 concentration and catalyst loading exerted significant positive effects on methanol formation. The highest methanol yield was achieved at a Na2CO3 concentration of 0.10 mol·L−1 and a catalyst loading of 0.50 g·L−1. The experimental design results demonstrated a good fit of the statistical model to the experimental data, highlighting its predictive capability and confirming the reliability of the obtained results. Furthermore, Nb-MOG exhibited enhanced light-harvesting and charge-transfer properties, leading to measurable methanol production under the investigated conditions. These findings contribute to a better understanding of Nb-MOG’s photocatalytic behavior and demonstrate its potential for application in a sustainable CO2 reduction system.
1. Introduction
The rising levels of atmospheric carbon dioxide (CO2) represent one of the most significant environmental challenges, directly linked to global warming and climate change [1]. The development of sustainable fuels capable of mitigating this problem is a central strategy in the energy transition. For example, converting CO2 into value-added compounds, such as methanol, not only reduces emissions but also enables the production of renewable fuels or chemical intermediates [1,2]. Recent overviews detail multiple pathways, photocatalytic, electrochemical, and thermocatalytic, for converting CO2 into methanol, showing their potential for carbon mitigation with energy production [2].
It is important to note that CO2 reduction can be carried out in both the liquid and gas phases [3]. In the liquid-phase reaction, CO2 reduction is performed in an aqueous solution saturated with CO2. However, the limited solubility of CO2 in water represents a critical challenge for achieving efficient photocatalytic CO2 reduction. Nevertheless, the solubility of CO2 in water can be enhanced by the use of additives such as NaOH, NaHCO3, or Na2CO3. These additives increase CO2 solubility; however, reducing bicarbonate and carbonate species is more difficult [4].
CO2 is thermodynamically stable and kinetically inert, but side reactions often reduce selectivity. In addition, achieving efficient light absorption, charge separation, and catalyst stability under reaction conditions is difficult [5,6].
Several parameters influence the photocatalytic reduction of CO2, including the composition and structure of the photocatalyst, its morphology, the exposed crystal facets, particle size, surface vacancies, and the operating conditions (pH, pressure, temperature, and reducing agent) [4]. An increase in pH enhances the reaction rate.
Metal–Organic Frameworks (MOFs) are promising materials for CO2 capture and catalytic conversion. MOFs are porous materials, built from metal centers and organic linkers, offering high surface areas and modular functionalization options [7,8]. Their structure allows a good link between adsorbed CO2 molecules and catalytic sites, and the framework can be built to provide the desired electronic properties and light absorption [9,10]. Some recent reviews have specifically highlighted progress in functionalized MOFs for photocatalytic CO2 reduction and strategies to overcome stability and recombination challenges [7,11]. Recent studies have reported interesting results on the application of MOFs and MOF-derived materials in CO2 reduction. Wu et al. [12] reported the use of a MOF@COF hybrid material in CO2 reduction, where COF means Covalent Organic Framework. The authors achieved a CH4 yield rate of 21.27 μmol g−1 h−1. Zhang et al. [13], in turn, achieved a CO production rate of 263.63 µmol g−1 h−1 using a 2D MOF/COF heterojunction. Liu et al. [14] prepared a MOF-on-MOF-derived CuO@In2O3 material, reaching 190.32 μmol g−1 h−1 and 500.46 μmol g−1 h−1 production rates for CH4 and CO, respectively. Another MOF-on-MOF-derived material (Co3O4/In2O3) was reported by Han [15] and applied to CO2 reduction, resulting in a CO yield of 4828 ± 570 µmol h−1 g−1.
Despite the use of MOFs, a significant challenge lies in overcoming their poor macroformability and low hydrostability, which hinder their application as industrial adsorbents and catalysts. In this context, metal–organic gels (MOGs) have been reported as a promising alternative to MOFs. The morphology and chemical characteristics of an amorphous framework have been demonstrated to be advantageous for electrocatalytic carbon dioxide (CO2) reduction [16]. These characteristics include larger pores that accommodate most of the confined fluid phase, with porous networks interconnected with semi-fluid or flexible structures that facilitate faster analyte diffusion, easier functionalization, and better processability in films, coatings, and monoliths [17]. These characteristics are particularly advantageous for gas separation processes, where efficient adsorption and desorption are essential. Furthermore, another application within the same context, already reported in the literature, is the synthesis and characterization of metal–organic gels for CO2 capture applications [18].
Moreover, amorphous materials are metastable, and the structural disorder in their framework results in a higher density of active sites during electrochemical testing, such as in supercapacitor applications [19].
Despite its promising characteristics, reports of MOG’s applications remain scarce. A Co/Fe-Metal–Organic Xerogel was described by Yang et al. [20], achieving a CO yield of 67 μmol g−1 h−1. Verma et al. [21] prepared a Metal–Organic “Soft” Coordination Polymer Gel. They applied it to the photoreduction of CO2 to CO, yielding 3.5 mmol g−1 h−1, and to the conversion of CO2 to CH4, yielding 6.7 mmol g−1 h−1, under the studied conditions. Furthermore, promising results were reported for visible-light-driven processes. For example, a Ti(VI)-based Metal–Organic Aerogel (MOA) described by Angulo-Ibáñez et al. [22] achieved a 221–786 μmol·g−1·h−1 yield of methanol from CO2 under visible-light irradiation. An MOA modified with copper (II)-metalated porphyrin was synthesized and applied by Perfecto-Irigaray et al. [23] in visible-light-driven conversion of CO2 to alcohols (methanol and ethanol), up to a production rate of 356–642 μmol·g−1·h−1.
In this study, niobium is employed as the metal center in the synthesis of metal–organic gels (MOGs) and applied to CO2 reduction, representing an unprecedented strategy according to the literature surveyed. Niobium pentoxide has emerged as a transition-metal oxide of significant scientific and technological interest due to its physicochemical properties, including chemical and thermal stability, corrosion resistance, and low toxicity [24]. A niobium-based metal–organic gel (MOG) derived from the MIL-125 (Ti-based) framework was investigated for the photocatalytic reduction of CO2 to methanol.
2. Materials and Methods
2.1. Chemicals
All reagents used were of analytical grade, including sodium carbonate (Na2CO3, Synth, São Paulo, Brazil), dimethylformamide (DMF, Synth), methanol for GC (Sigma-Aldrich, Taufkirchen, Germany), 2-aminoterephthalic acid (Sigma-Aldrich, Germany), isopropyl alcohol P.A. A.C.S. 99.5% (Synth, Brazil), and niobium pentachloride (NbCl5, Companhia Brasileira de Metalurgia e Mineração—CBMM, Araxá, Brazil). CO2 gas with 99.9% purity was supplied by White Martins (Araucária, Brazil). Deionized water was used in all solution preparations.
2.2. Catalyst Synthesis
The Nb-MOG was synthesized by adapting the procedure originally proposed for MIL-125-NH2 [25]. Niobium isopropoxide was prepared in situ through a reaction between NbCl5 and isopropyl alcohol under an inert atmosphere. The procedure was carried out at a molar ratio of 1:5 (NbCl5–isopropanol) under constant stirring for 60 min to ensure complete dissolution of the salt, as described by Castro et al. [26]. Subsequently, 0.35 mmol of niobium isopropoxide and 0.98 mmol of 2-aminoterephthalic acid were mixed in a solvent system composed of 8 mL of DMF and 2 mL of methanol. The resulting mixture was transferred to a Schlenk flask immersed in a glycerin bath and maintained at 373 K for 72 h. The obtained solid was washed sequentially with DMF and methanol and then dried at 70 °C for 12 h.
2.3. Catalyst Characterization
The catalyst used in this work was previously characterized by [27], using the following techniques: Scanning Electron Microscopy–Energy Dispersive X-ray Spectroscopy (SEM–EDS): Analysis was performed using VEGA3 TESCAN equipment (SEM/EDS, TESCAN, microscope model VEGA3, Brno, Czech Republic). Point zero charge (PZC) determination: The determination of the point of zero charge was performed using the method known as the “11-point experiment”. The procedure consists of mixing 50 mg of the catalyst in 50 mL of aqueous solution under 11 different initial pH conditions (2, 3, 4, 5, 6, 7, 8, 9, 10, 11, and 12), adjusted with solutions of HCl or NaOH 0.1 mol·L−1, and measuring the pH after 24 h [28]. Fourier Transform Infrared Spectroscopy (FTIR): The spectra were obtained using a Perkin Elmer Frontier instrument (Beaconsfield, Buckinghamshire, UK) in the wavenumber range of 4000 to 400 cm−1, with a resolution of 1 cm−1 and 32 accumulations. X-ray diffraction (XRD): Analysis of the samples was performed using a Rigaku MiniFlex 600 diffractometer (Rigaku Corporation, Tokyo, Japan), 40 kV and 15 mA, with Cu Kα radiation (λ = 1.5406 Å), at a scan interval of 2θ = 3–90°, in step scan mode, with a step of 0.02° and a time per step of 2 s. Thermogravimetric analysis (TG): Curves were obtained using a simultaneous thermal analysis system, model SDT 2960, from TA Instruments (SDT 2960, TA Instruments, New Castle, DE, USA). The analysis was performed under a flow of dry air or nitrogen at 100 mL min−1 and a heating rate of 10 °C min−1. Diffuse Reflectance Spectroscopy (DRS): The band gap was obtained on a Varian Cary 500 Scan spectrophotometer (UV-VIS-NIR Spectrophotometer, Palo Alto, CA, USA).
2.4. CO2 Reduction Tests
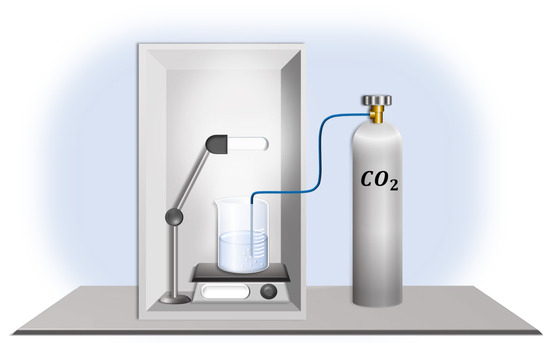
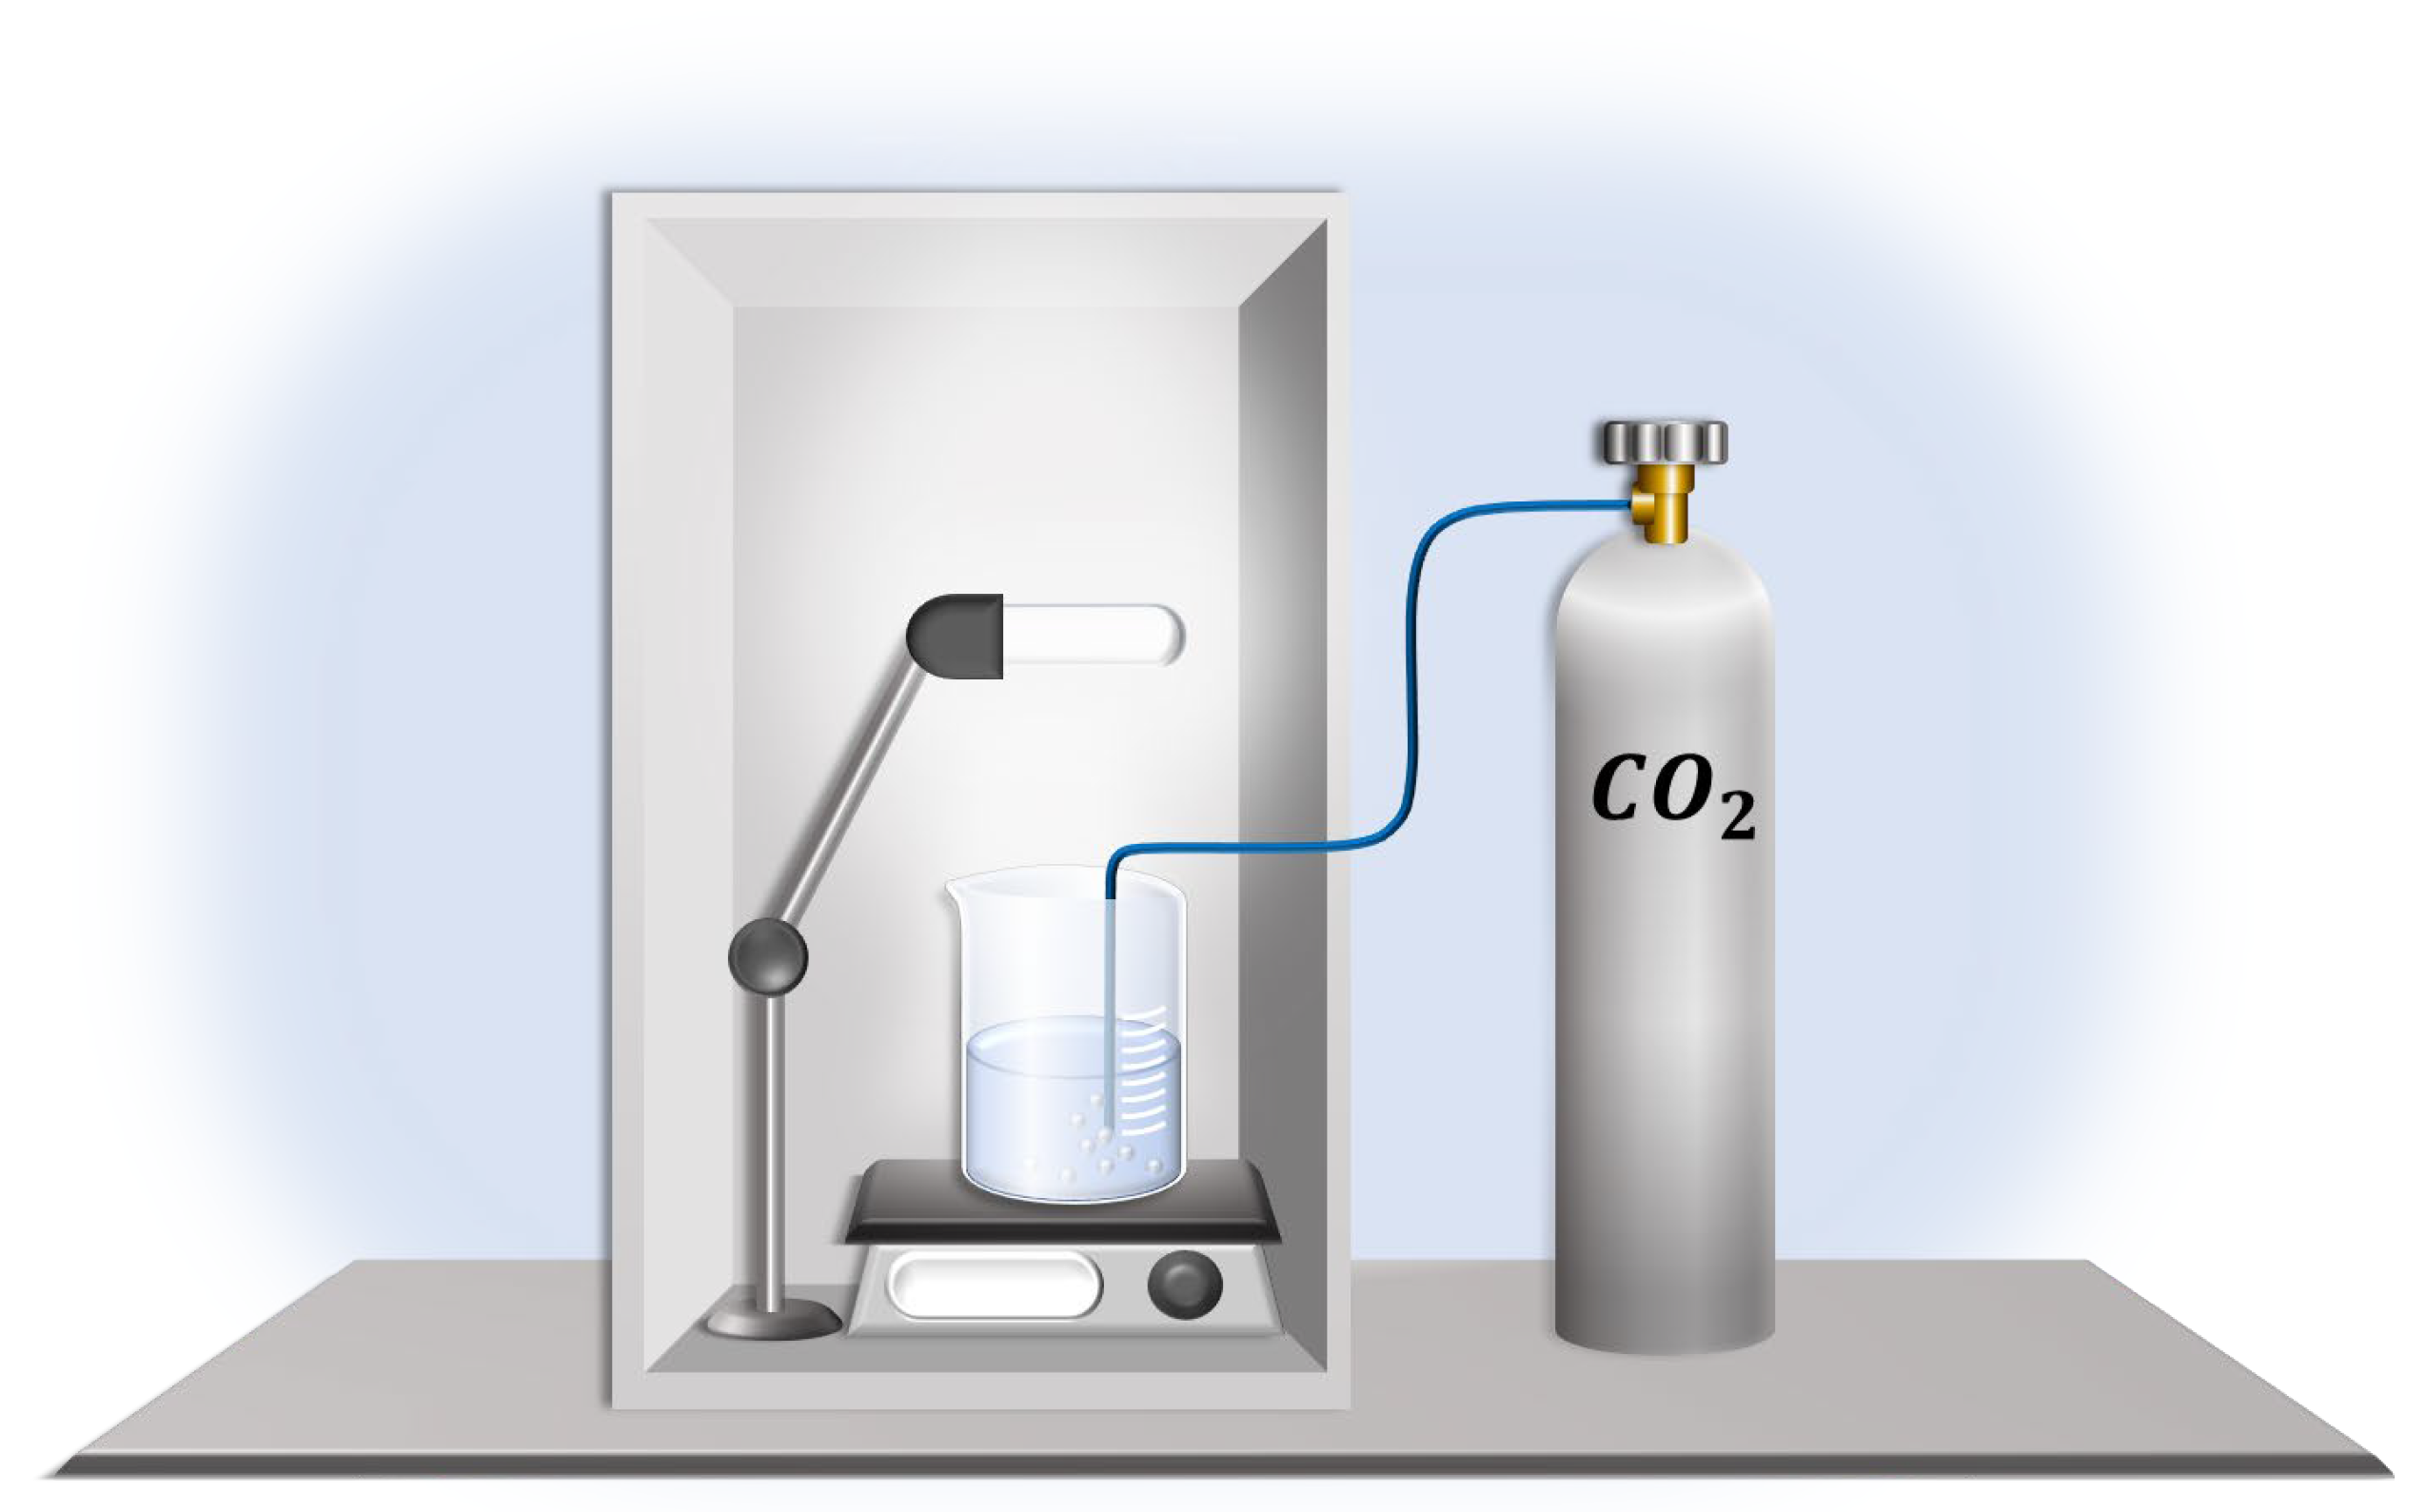
The tests were performed in a batch borosilicate glass photoreactor with a capacity of 1000 mL, equipped with a water-cooled jacket to maintain the reaction temperature near 290 K, in a photocatalytic chamber. A 250 W Hg vapor lamp was used as the radiation source (light intensity 13.55 mW·cm−2). Initially, an aqueous solution of sodium carbonate was prepared at a known concentration. CO2 was continuously bubbled through the solution for 1 h at constant flow to ensure complete saturation (Figure 1). After this period, a known mass of the Nb-MOG catalyst (indicated in Table 1) was added, and the system was stirred under irradiation. During the experiments, variations in the catalyst and sodium carbonate concentrations were studied to determine the optimal conditions for converting CO2 to methanol. The reaction proceeded for four hours, and 8 mL aliquots were collected every hour. For analysis, 3 mL of each withdrawn aliquot was first filtered through a 0.22 µm syringe filter to remove suspended catalyst particles. Then, 5 mL of the filtered sample was transferred into 20 mL headspace vials and sealed with aluminum/silicone septa.
Figure 1.
Schematic illustration of the CO2 photoreduction reaction system.
Table 1.
Results of the experimental design.
2.5. Methanol Quantification
The method was based on the work of Ndikumana et al. [29]. Before injection, the vials were equilibrated at 100 °C for 10 min. The samples were analyzed using a gas chromatograph (YL Clarity, Anyang-si, Gyeonggi-do, Republic of Korea) equipped with a headspace autosampler and a flame ionization detector (FID). Headspace sampling was performed using an HTA HT200H autosampler configured with a 2 mL sample volume and a 1 s equilibration delay before injection. One injection was performed per vial. The autosampler oven, syringe, and transfer line were maintained at 100 °C. Electrovalve flushing was carried out for 2 min to prevent carryover. GC analysis was performed on a YL 6000 Series GC (GC, Yongin-si, Gyeonggi-do, Republic of Korea) equipped with a capillary column of 30 m × 0.25 mm × 0.25 µm. The injector operated in split mode at a 1:10 split ratio, with a split flow of 18 mL·min−1 and a total flow of 23 mL·min−1. The injector temperature was set to 250 °C. The oven program was as follows: initial temperature of 30 °C with 2.5 min hold, followed by a ramp of 60 °C·min−1 to 380 °C with a final 2.0 min hold, resulting in a total run time of approximately 6.7 min. The FID operated at 250 °C, with airflow at 400 mL·min−1, hydrogen at 40 mL·min−1, and makeup gas (N2) at 10 mL·min−1. The detector range was set to 10,000 mV with a sampling rate of 10 Hz. Chromatographic peaks were integrated according to standard FID integration parameters, and methanol concentrations were determined from calibration curves (see Appendix A Calibration Curve) constructed from external standards treated under the same headspace conditions.
3. Results
3.1. Nb-MOG Catalyst
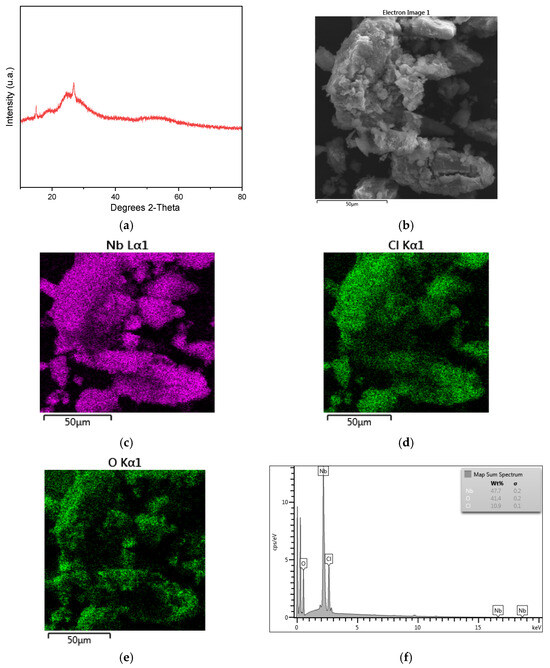
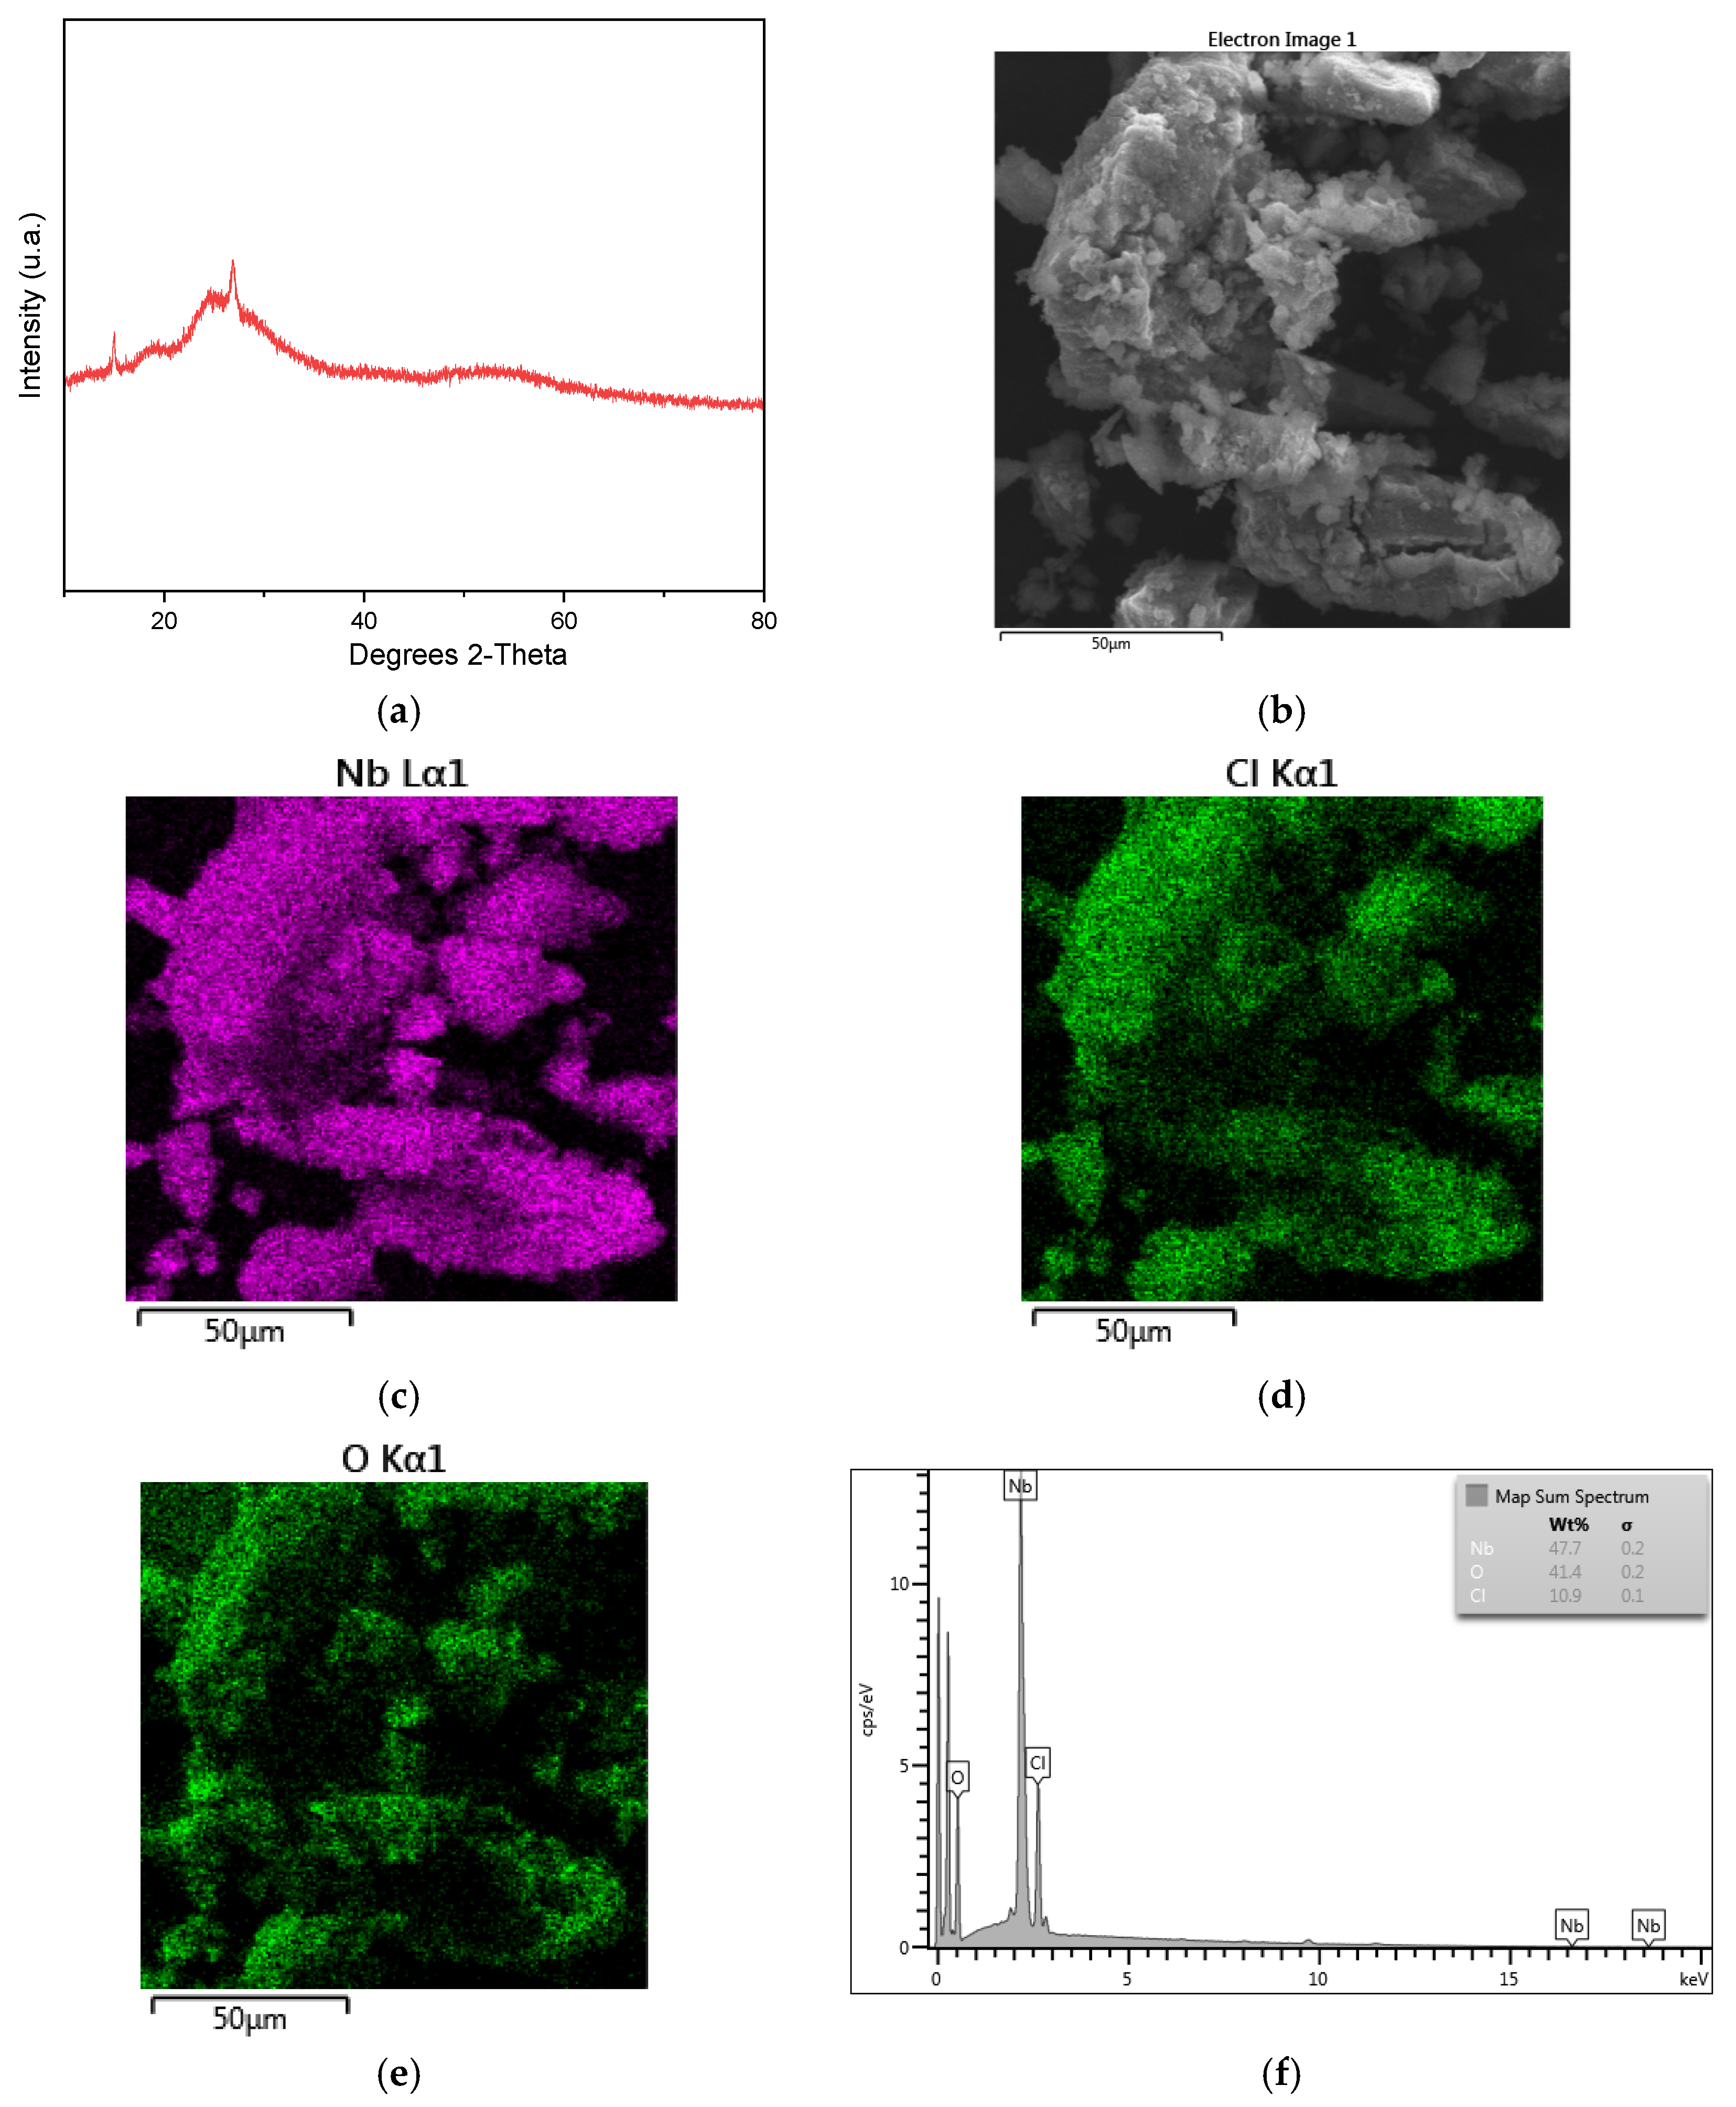
The Nb-MOG catalyst was characterized in detail by Abreu et al. (2026) [27]. The X-ray diffractogram indicates that the synthesized Nb-MOG exhibited a broad diffraction band centered between 20° and 35° (2θ), indicating its predominantly amorphous nature (Figure 2a). The absence of sharp diffraction peaks suggests a low degree of crystallinity, which is commonly observed in non-calcined materials. A weak diffraction feature around 27° (2θ) may indicate the presence of small crystalline domains embedded within the amorphous matrix. The morphology is characterized by a wrinkled, non-porous surface, similar to that observed in catalysts prepared by the chemical mixing method (sol–gel), a characteristic commonly reported in the literature for sol–gel-derived materials (Figure 2b). MOGs are described as an additional class of larger pores that accommodate most of the solvent phase [3]. Energy Dispersive X-ray Spectroscopy (EDS) revealed a significant amount of niobium (Figure 2c), chlorine (Figure 2d), and oxygen (Figure 2e) on the surface. At the same time, the EDS spectrum indicated Nb, Cl, and O contents of 47.7%, 41.4%, and 10.9%, respectively (Figure 2e).
Figure 2.
(a) X-ray diffraction; (b) SEM micrograph; (c) EDS elemental mapping of Nb (Nb Lα1); (d) EDS elemental mapping of Cl (Cl Kα1); (e) EDS elemental mapping of O (O Kα1); and (f) EDS spectrum showing the elemental composition of the sample.
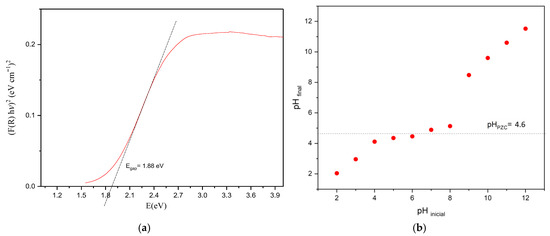
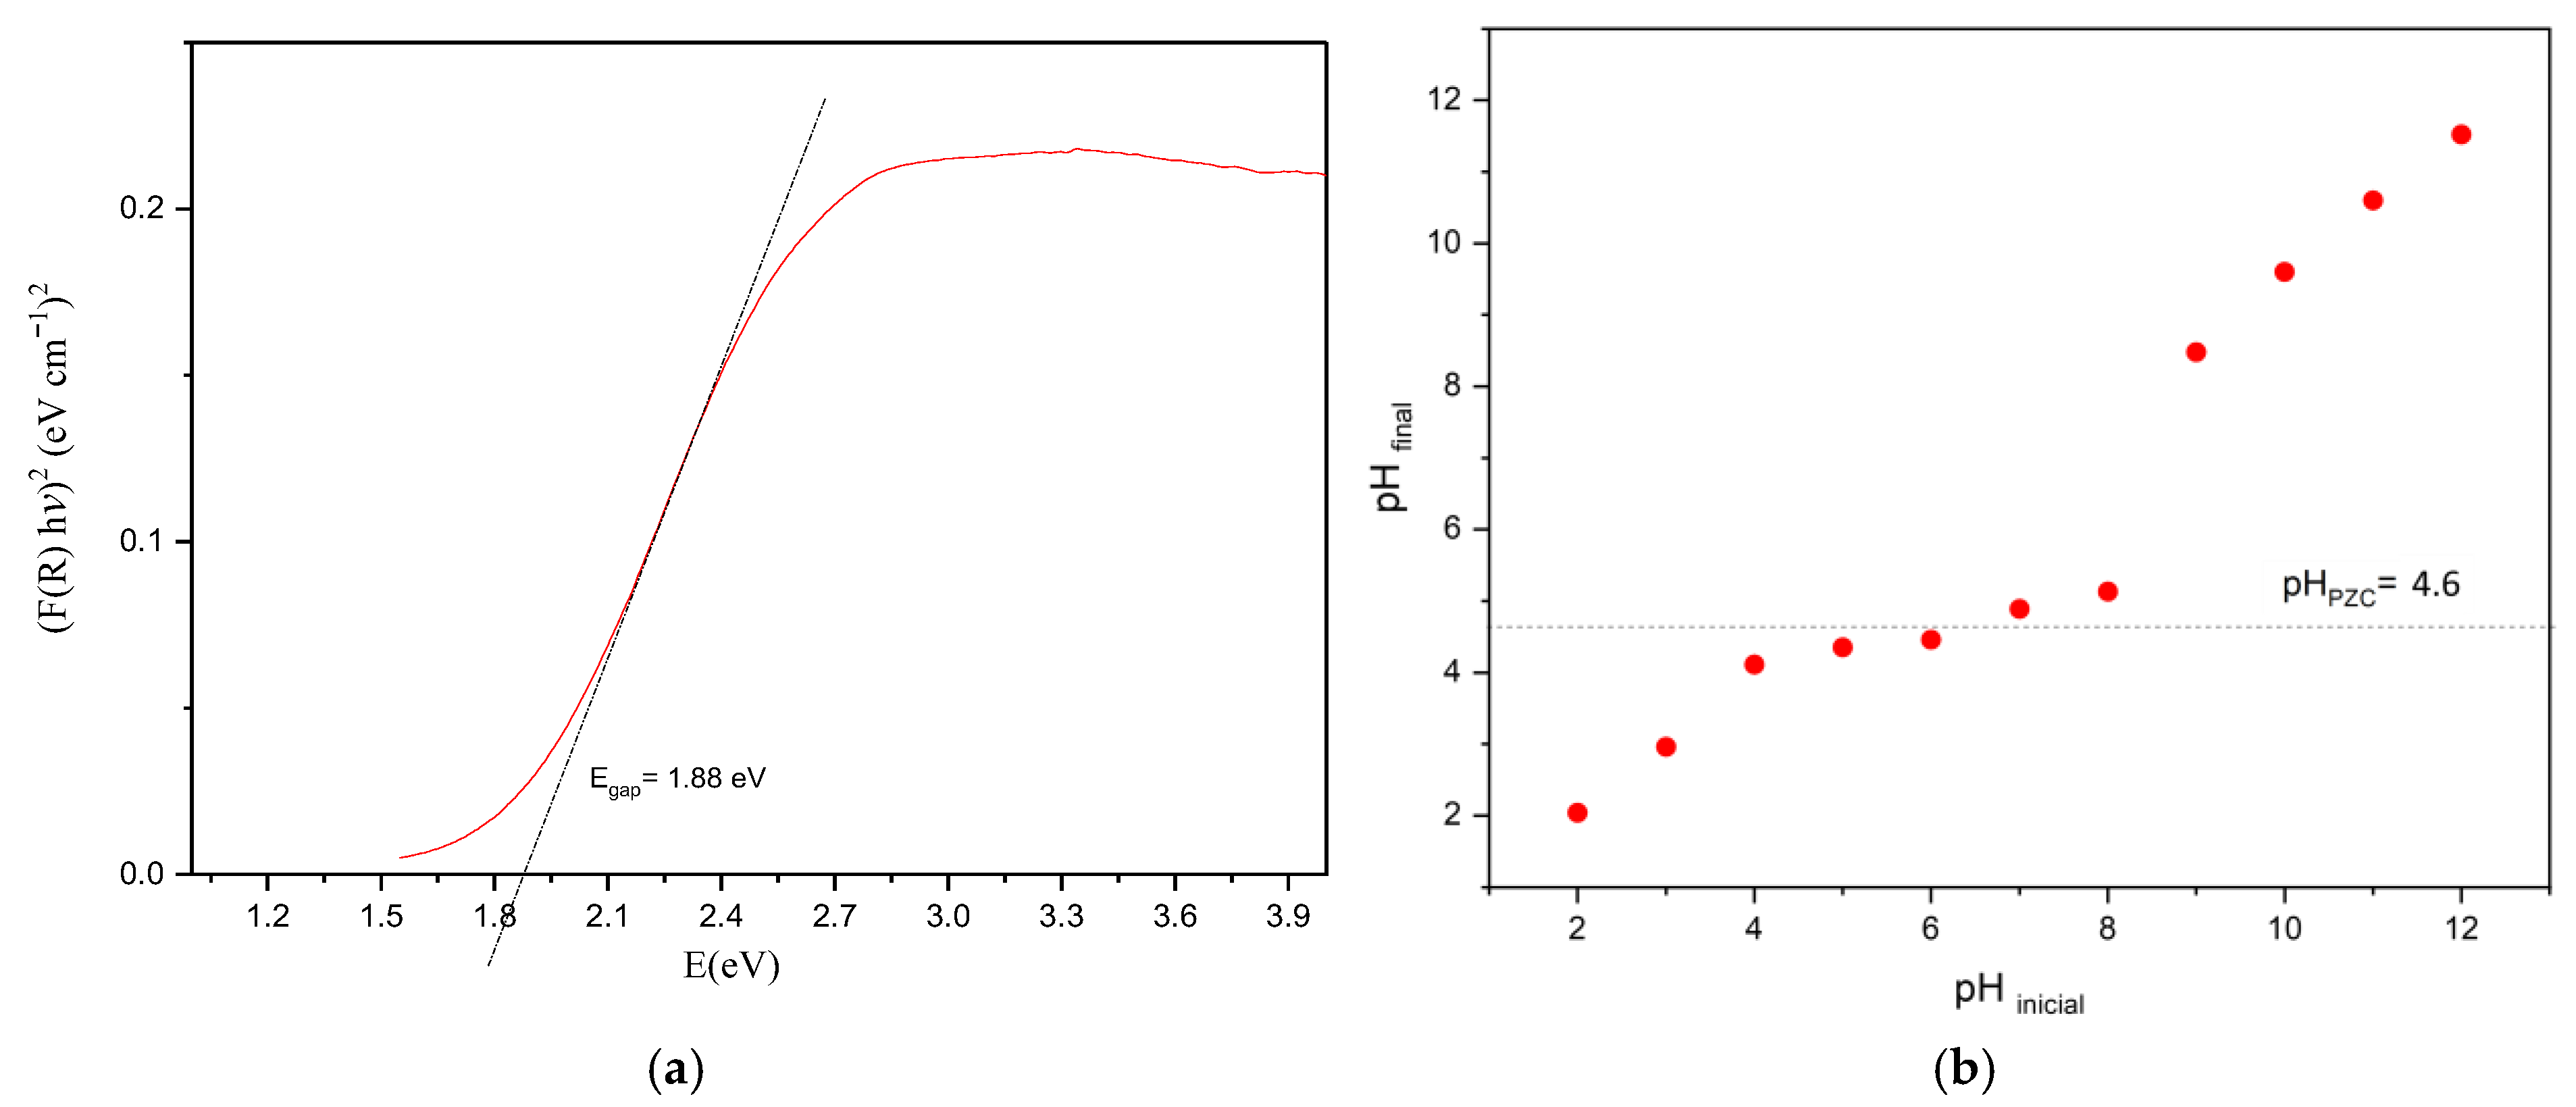
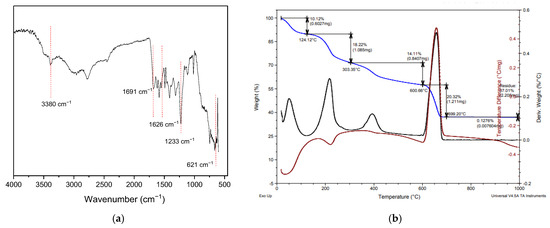
The band gap energy of Nb-MOG was estimated to be 1.88 eV using photoacoustic spectroscopy (Figure 3a). The point of zero charge (PZC) was determined to be 4.6 (Figure 3b). The infrared spectrum shows characteristic bands of amorphous niobium oxide (Figure 4a).
Figure 3.
Characterization results: (a) band gap and (b) PCZ.
Figure 4.
Characterization results: (a) Infrared spectra and (b) TGA/DTGA profile.
Figure 4a shows the FTIR spectrum of the Nb-MOG sample, which exhibits absorption bands characteristic of amorphous niobium oxide. Other studies have reported that a band near 621 cm−1 is indicative of amorphous niobium oxide materials. The absorption observed around 850 cm−1 can be attributed to the symmetric stretching vibration of the Nb–O bonds. The bands at approximately 1626 and 3380 cm−1 are attributed to bending and stretching vibrations of hydroxyl groups and water molecules adsorbed on the material’s surface, respectively [30]. The band detected at 1233 cm−1 corresponds to the stretching vibration of the C–NH2 group. This attribution is consistent with the theoretical and experimental FTIR analyses reported by Karabacak et al. (2010), who associated this absorption with amino group vibrations coupled to aromatic ring modes [31].
The thermogravimetric analysis (TG) (Figure 4b) reveals a multi-stage mass-loss profile, typical of metal–organic gels (Figure 4b). In the first stage, a mass loss of 10.12% was observed below 124 °C, attributed to the removal of adsorbed water and solvent molecules from the gel. In the second stage, the most significant mass loss of 18.22% occurred between 124 and 303 °C, resulting from the release of strongly retained solvent and the partial decomposition of organic components. Subsequently, a gradual mass loss of 14.11% occurred from 303 to 600 °C, resulting from the progressive decomposition of organic binders and the disruption of metal–ligand interactions. Finally, a major mass loss of 20.32% occurred between 600 and 700 °C, associated with the combustion of residual carbonaceous species and the formation of the metal oxide.
3.2. Experimental Design Results
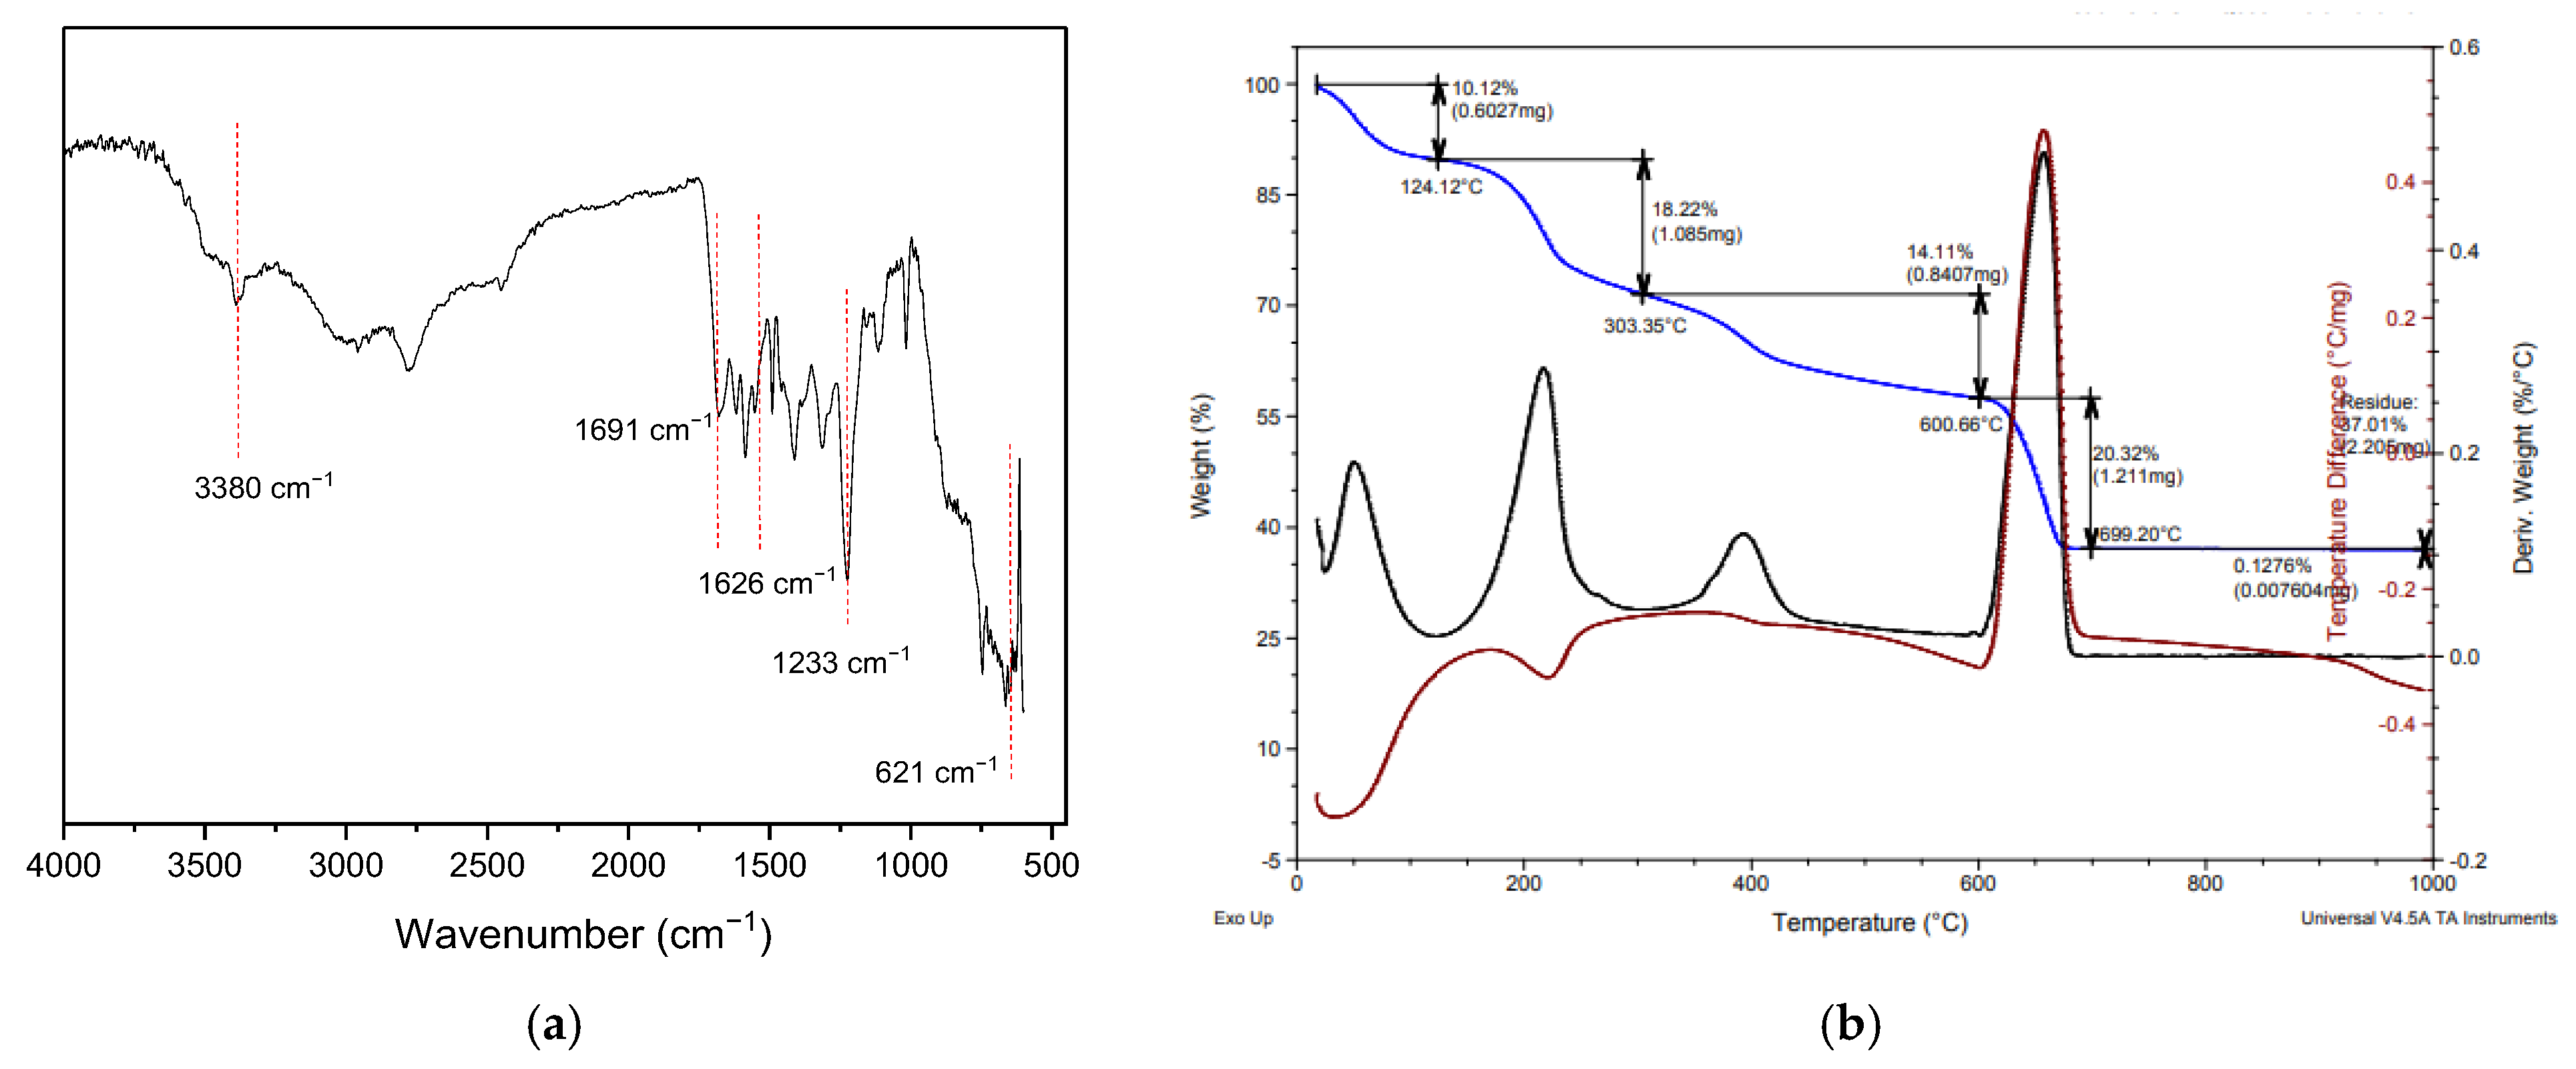
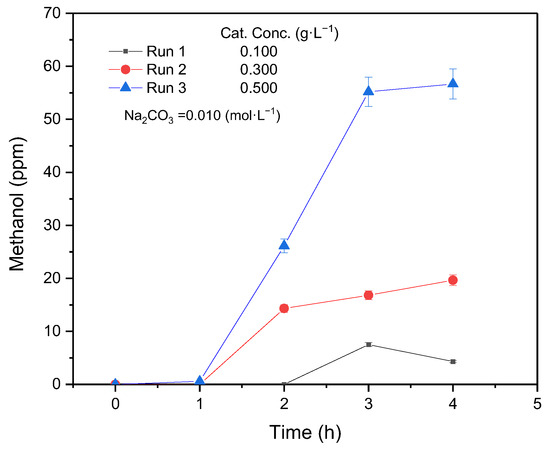
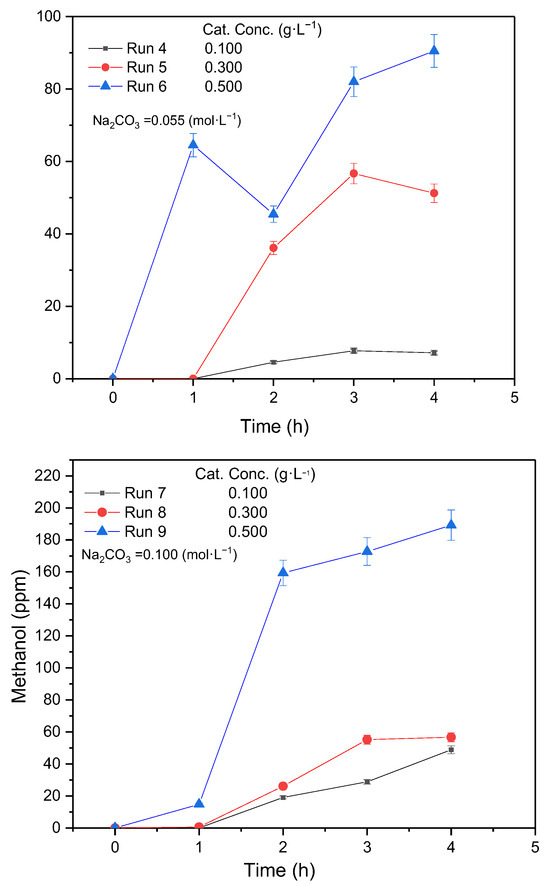
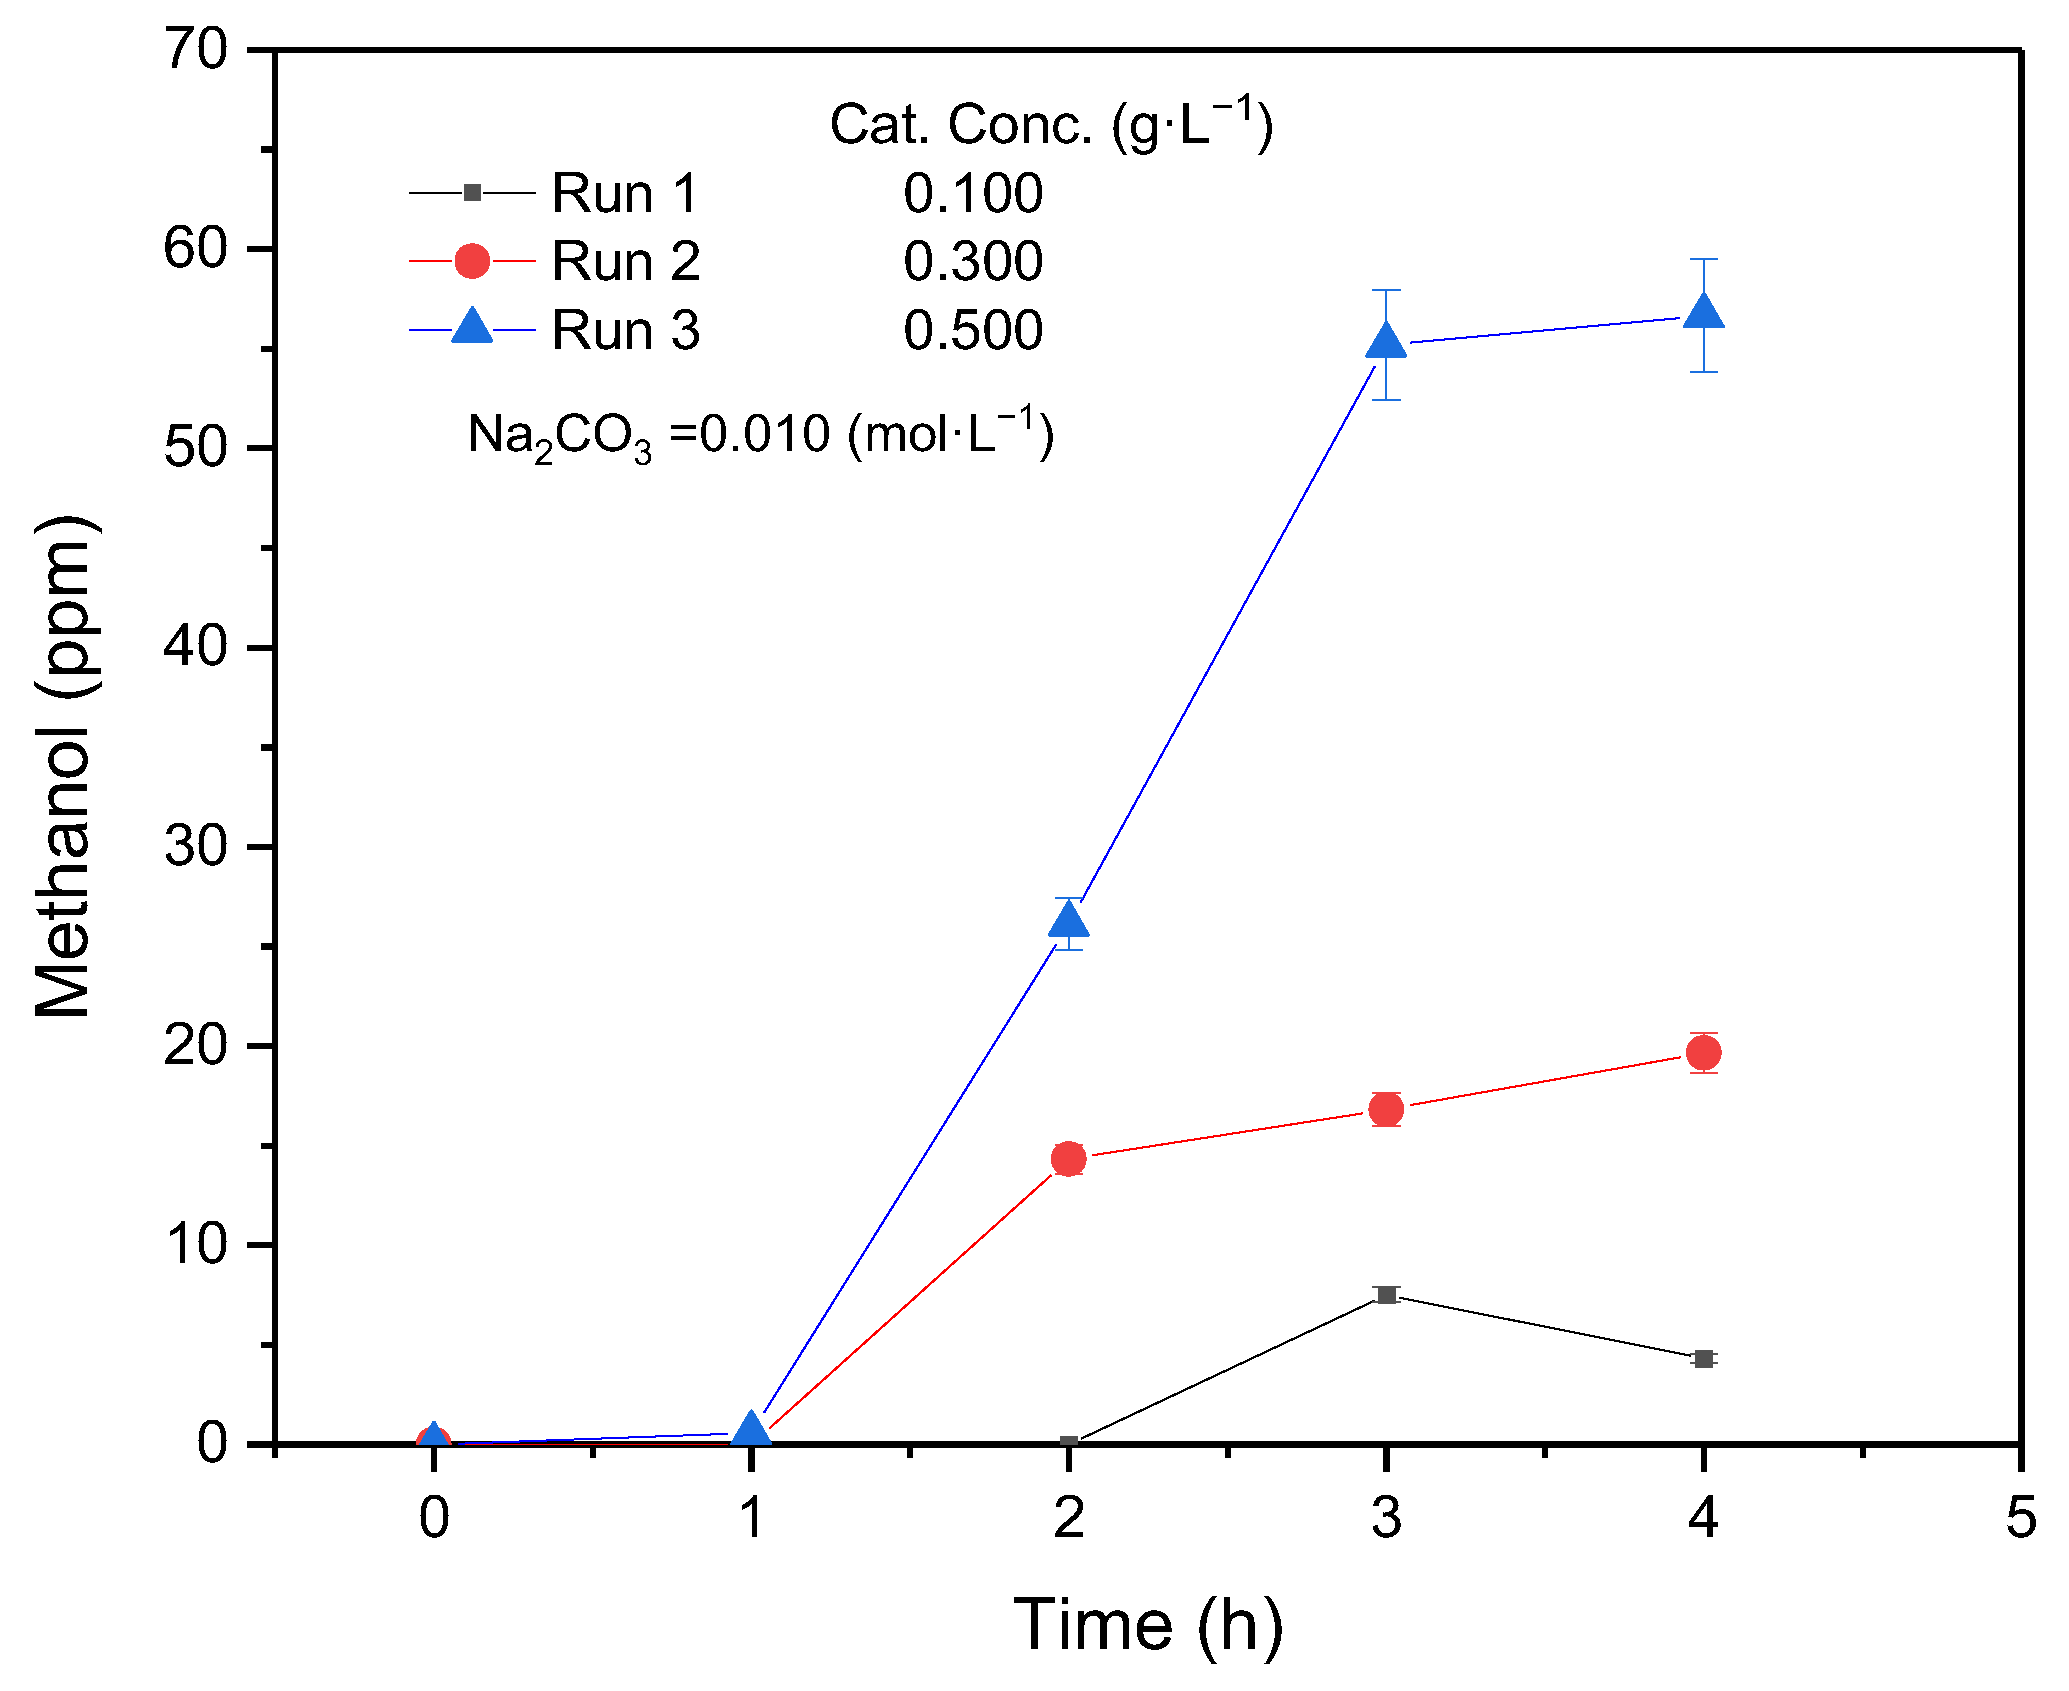
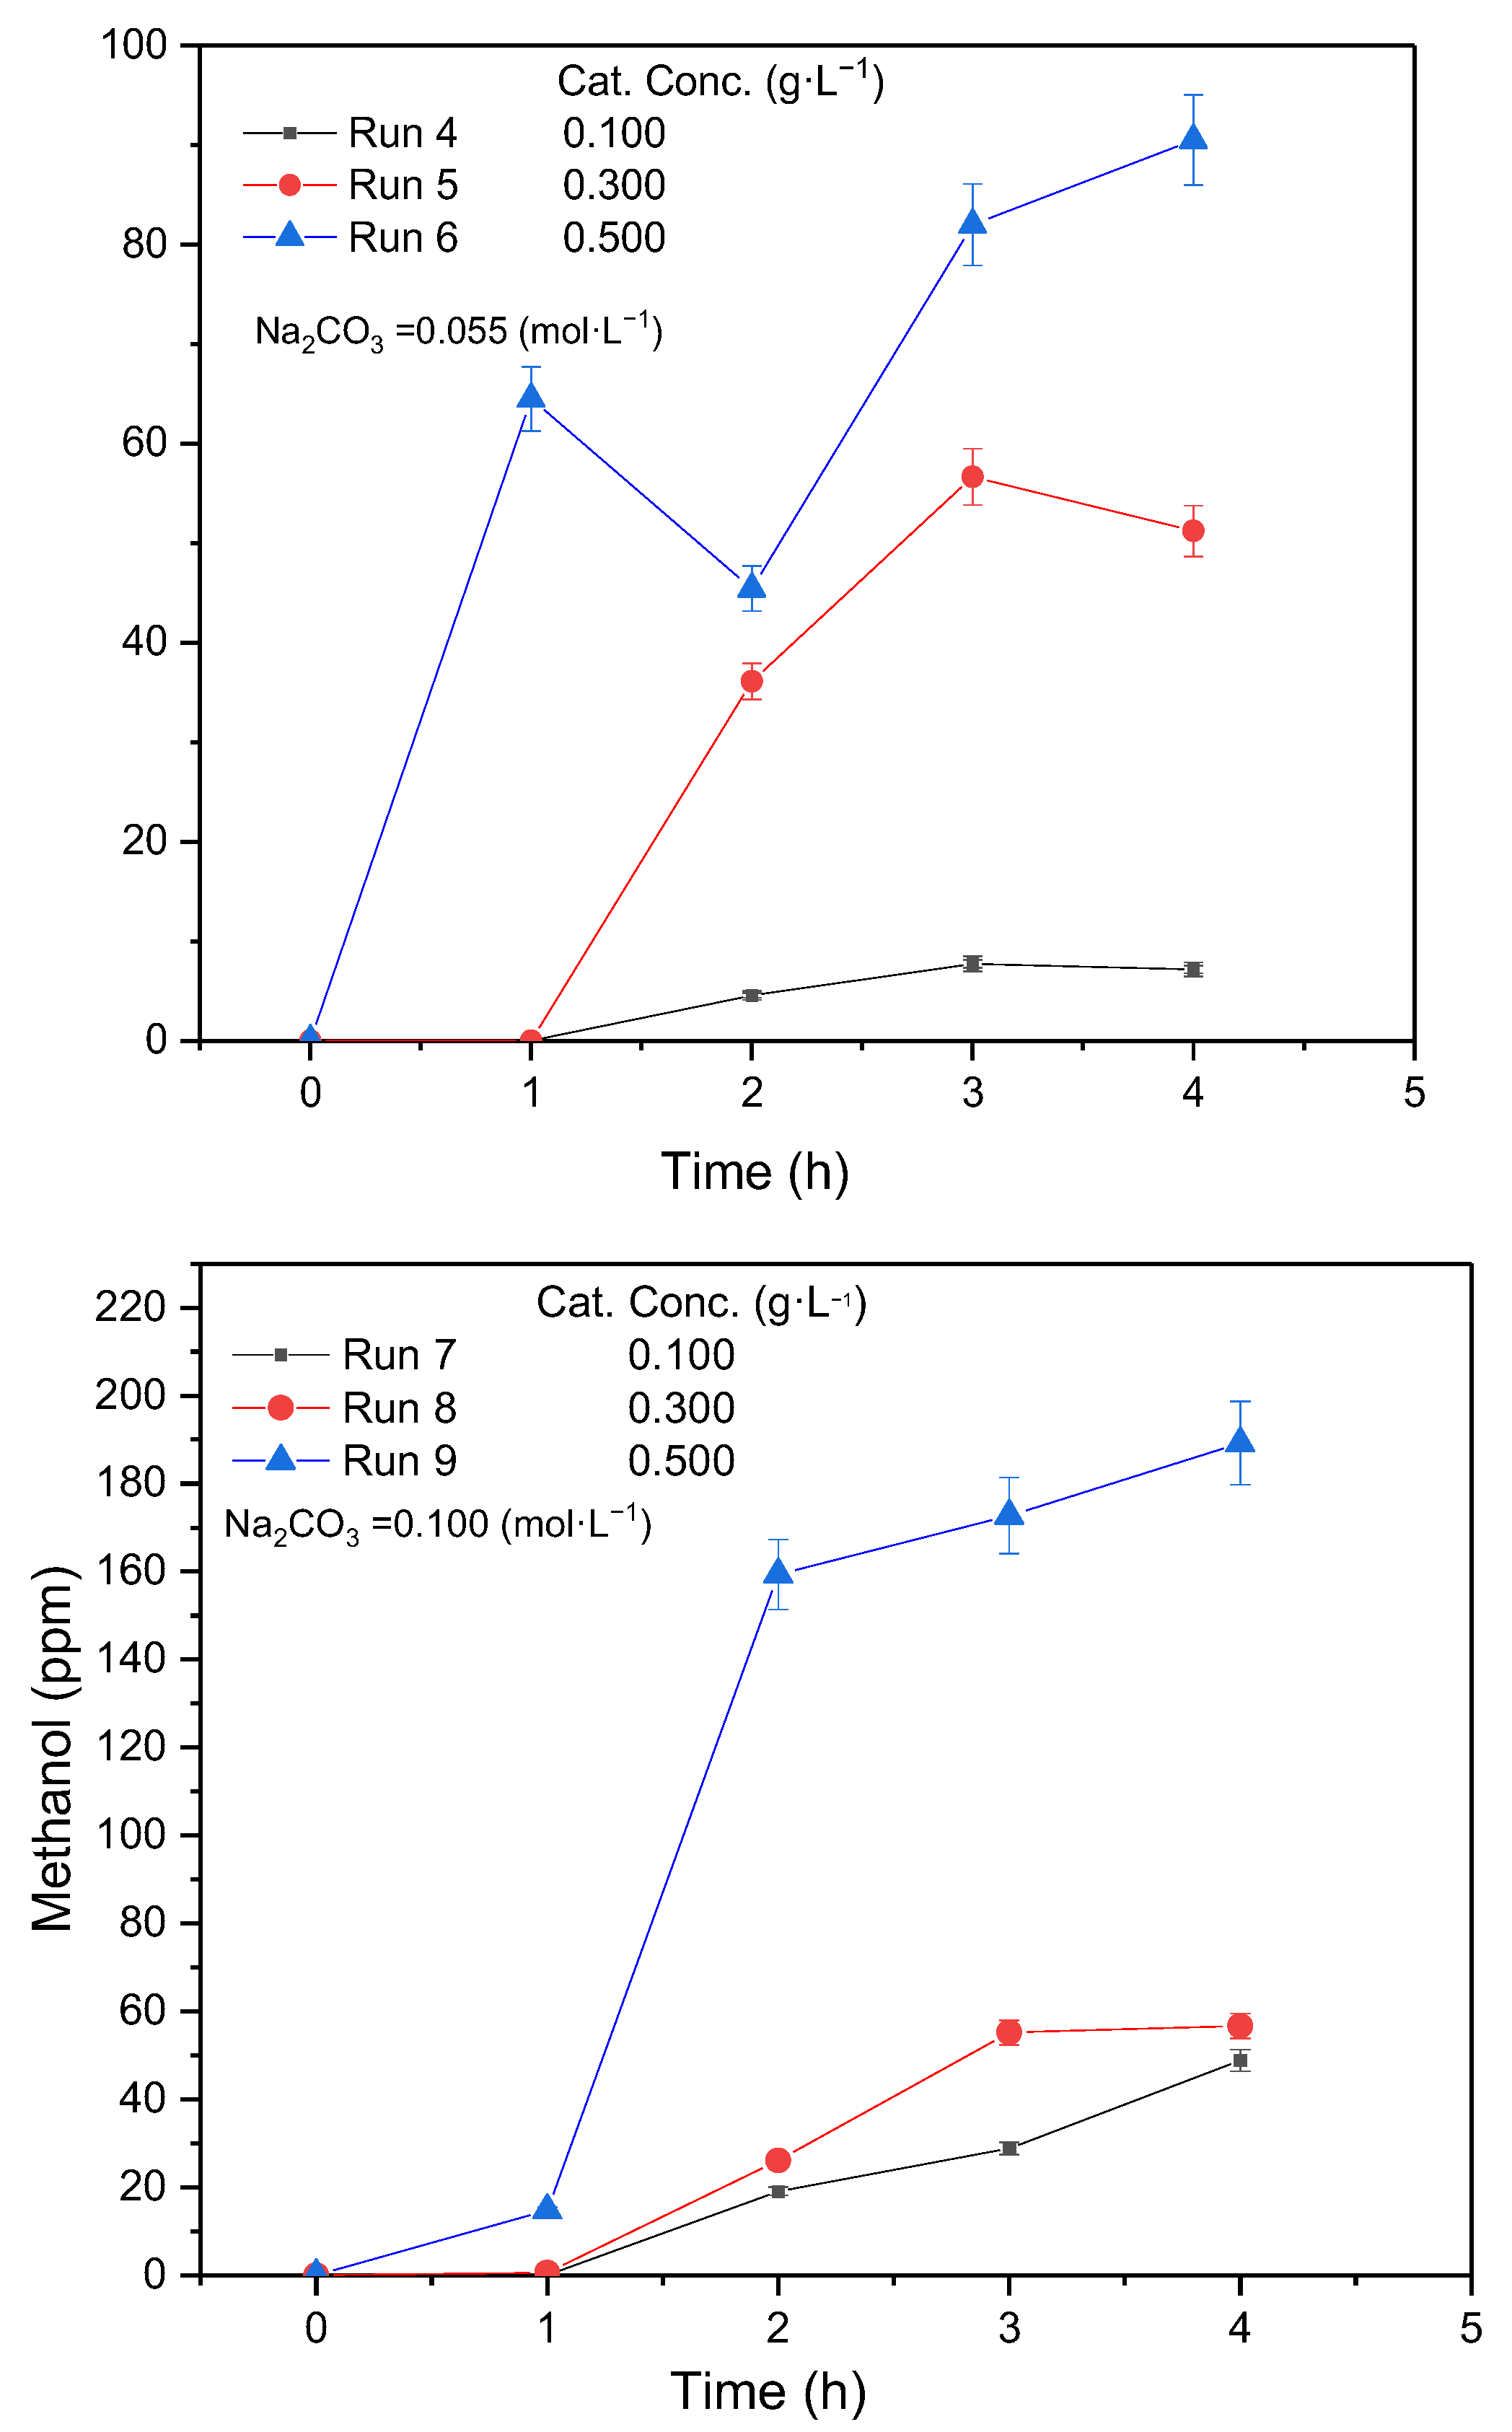
A two-factor experimental design was established to evaluate the influence of the sodium carbonate concentration and catalyst loading on the photocatalytic conversion of CO2 to methanol. The factors and their respective levels were defined as follows: Na2CO3 concentration at 0.010, 0.055, and 0.100 mol·L−1, and catalyst concentration at 0.1, 0.3, and 0.5 g·L−1. A full factorial arrangement (32) was employed, resulting in nine experimental runs, each corresponding to a unique combination of the two variables. This design allowed the systematic assessment of both the individual effects of each factor and their potential interaction on methanol production. Table 1 summarizes all experiments conducted during the final 4 h of methanol production, and Figure 5 presents the kinetic curves for CO2 photoreduction (MeOH (ppm) vs. time (h)). The amount of methanol formed, under the experimental conditions studied, is directly influenced by the amounts of catalyst and Na2CO3. All experiments indicated that the greater the catalyst amount, the greater the methanol production. The same trend occurred for Na2CO3. This behavior can be explained by the number of available active sites and the solubility of CO2 in water. The literature describes CO2 as having limited solubility in water, which is a problem for the effectiveness of the reduction process using a saturated aqueous solution of CO2. However, the solubility of CO2 in aqueous medium can be improved with the use of additives such as NaOH, NaHCO2, or Na2CO2 [4]. These additives increase the solubility of CO2, although reducing bicarbonate and carbonate species is more difficult. In this sense, Tseng et al. observed that an alkaline medium was beneficial in the photoreduction of CO2. They observed a substantial increase in the rate of methanol formation with the addition of NaOH, which they attributed to two factors: (1) the strong hole-capturing capacity of OH− ions in aqueous solution, which helps to reduce the electron–hole recombination rate and maximizes the lifetime of free electrons, and (2) the greater solubility of CO2 in aqueous NaOH solution than in pure water [32].
Figure 5.
Methanol amount vs. time.
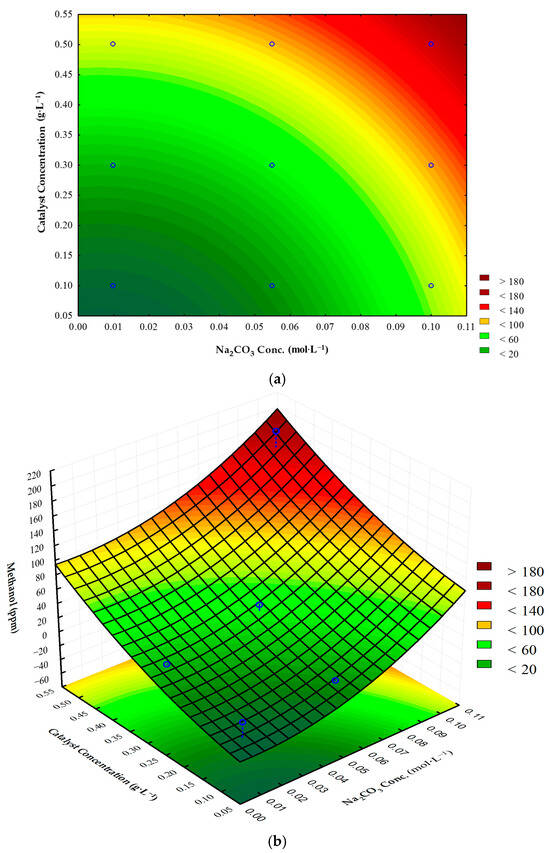
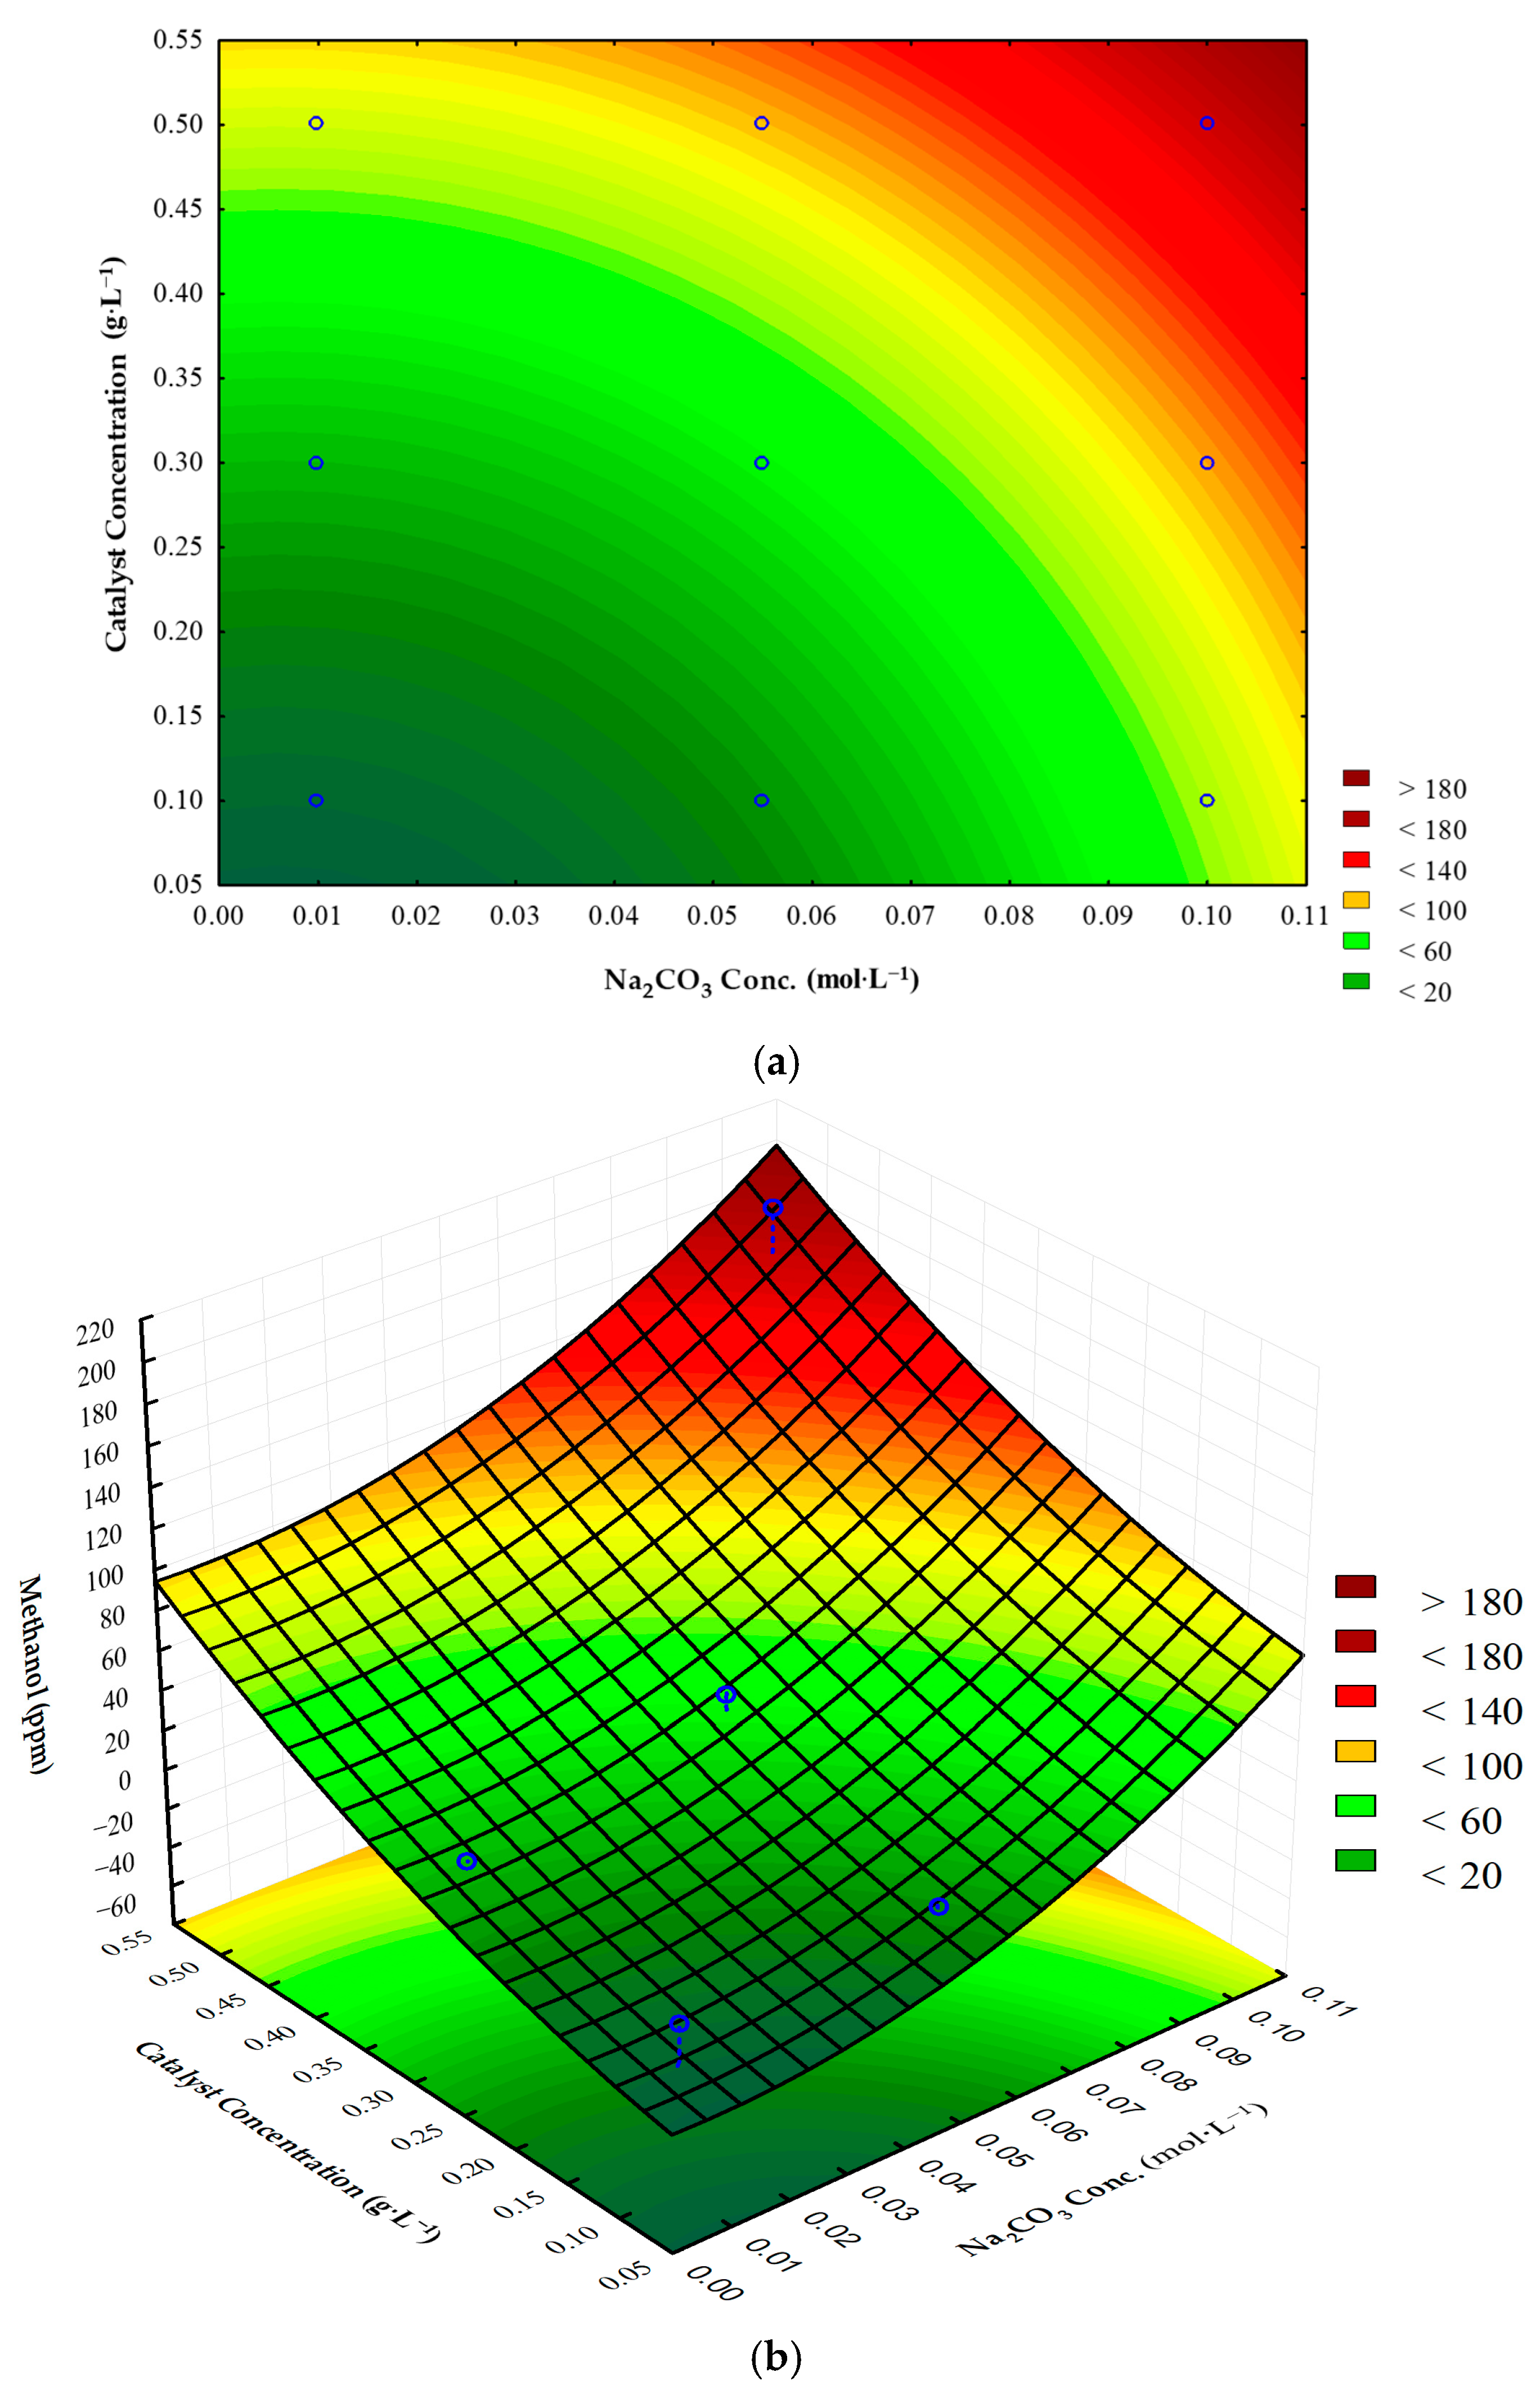
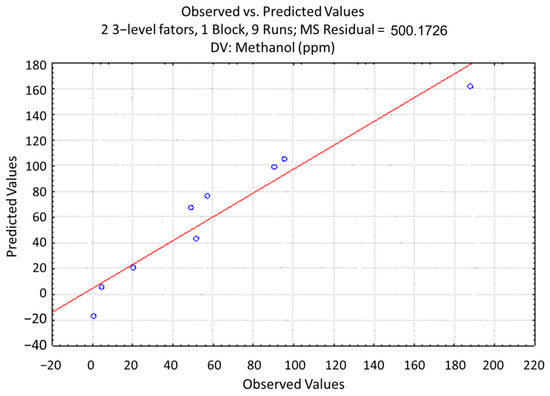
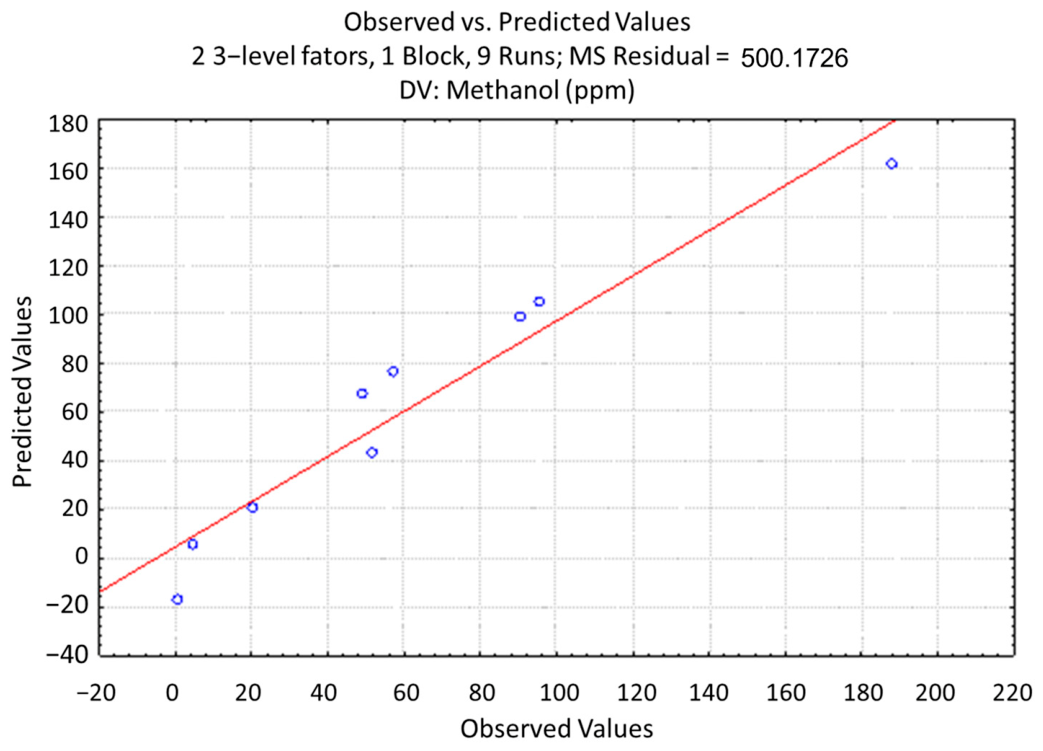
Figure 6 a and b show the fitted surface plots and response surface, respectively, for the experimental design, and Figure 7 shows the observed vs. predicted values.
Figure 6.
(a) Contour plots and (b) response surface for the experimental design. Blue points represent the experimental data.
Figure 7.
Observed vs. predicted values.
The ANOVA shows that the model adequately describes the experimental data (Table 2), with R2 = 0.9257 and an adjusted R2 of 0.8513, indicating that most of the variability in methanol production is explained by the fitted quadratic model. Among the evaluated factors, the linear effect of sodium carbonate concentration was statistically significant (p = 0.0097), confirming that increasing the Na2CO3 concentration positively influenced methanol formation. The linear effect of catalyst concentration was also significant (p = 0.0373), indicating that the catalyst loading contributed to the enhancement of the photocatalytic conversion.
Table 2.
ANOVA results from the experimental design.
Quadratic terms for both variables were included in the model to account for curvature in the response surface. However, neither the quadratic effect of Na2CO3 (p = 0.2843) nor that of catalyst concentration (p = 0.5900) reached statistical significance at the 95% confidence level. This suggests that, within the studied range, the primary contribution to methanol production arises predominantly from the linear increase in both factors rather than strong curvature in their individual effects.
Overall, the ANOVA confirms that both sodium carbonate concentration and catalyst loading exert significant linear effects on methanol production, and the response surface indicates that higher levels of both factors favor greater methanol production.
The agreement between the experimental and model-predicted methanol concentrations was evaluated using an observed-versus-predicted plot (Figure 3). The data points were distributed closely around the diagonal reference line, indicating that the quadratic model adequately represented the experimental system. No systematic deviations were observed, such as curvature, clustering, or bias toward over- or under-prediction, confirming the fit within the studied domain.
The results obtained in the present work reveal a clear and consistent positive effect of both Na2CO3 concentration and catalyst loading on the photocatalytic production of methanol. Under the most favorable conditions tested (0.10 mol·L−1 Na2CO3 and 0.50 g·L−1 of the Nb-MOG catalyst), the system produced 189.20 ppm of methanol (≈14.01 µmol·gcat−1·h−1 over four hours). These values demonstrate that, even in a simple aqueous carbonate medium and without the use of sacrificial agents or noble-metal cocatalysts, the system is capable of generating quantifiable amounts of methanol, a relevant result considering that many photocatalytic CO2 reduction studies report only trace or negligible methanol under comparable conditions.
When placed in the context of the recent literature, the performance achieved here is modest in terms of rate per mass of catalyst. Still, it remains notable given the simplicity of the catalytic system. For instance, metal-decorated MOF systems frequently exhibit higher methanol productivities: Cu SAs/UiO-66-NH2 has been reported to reach 5.33 µmol·g−1·h−1 [33], and Zn2GeO4/ZIF-67 produces 5.18 µmol·g−1·h−1 [34]. More sophisticated catalysts, such as Ni/Zr-CU-BDC, can reach even higher values, such as 41.05 µmol·g−1·h [35]. The study by Elsafi et al. [36], which describes MOF-based photocatalysts (ZIF-8 decorated with metal nanoparticles such as Au or Cu), reported methanol production rates that are significantly higher (up to 2650 µmol·gcat−1·h−1 for Au/ZIF-8 under UV–visible irradiation).
Nevertheless, these literature examples typically rely on noble metals, advanced engineered structures, sacrificial electron donors, or non-aqueous media, which strongly enhance charge separation and CO2 activation. In contrast, the present study demonstrates that significant methanol accumulation can be achieved in a purely aqueous carbonate environment using a single Nb-MOG photocatalyst. These results highlight the system’s potential as a simpler, more sustainable alternative, even if its productivity per gram of catalyst remains lower than that of highly engineered materials.
The experimental and model-predicted methanol concentrations exhibit minimal dispersion, indicating that the model closely tracks the experimental data. This behavior reinforces the regression model’s reliability in describing the effects of sodium carbonate and catalyst concentrations on methanol formation.
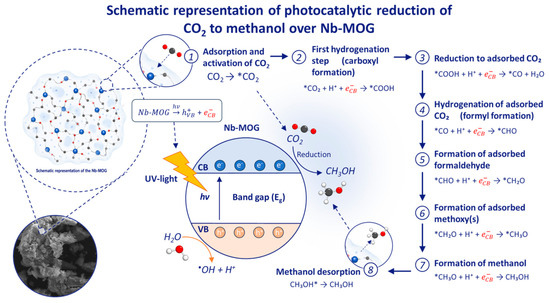
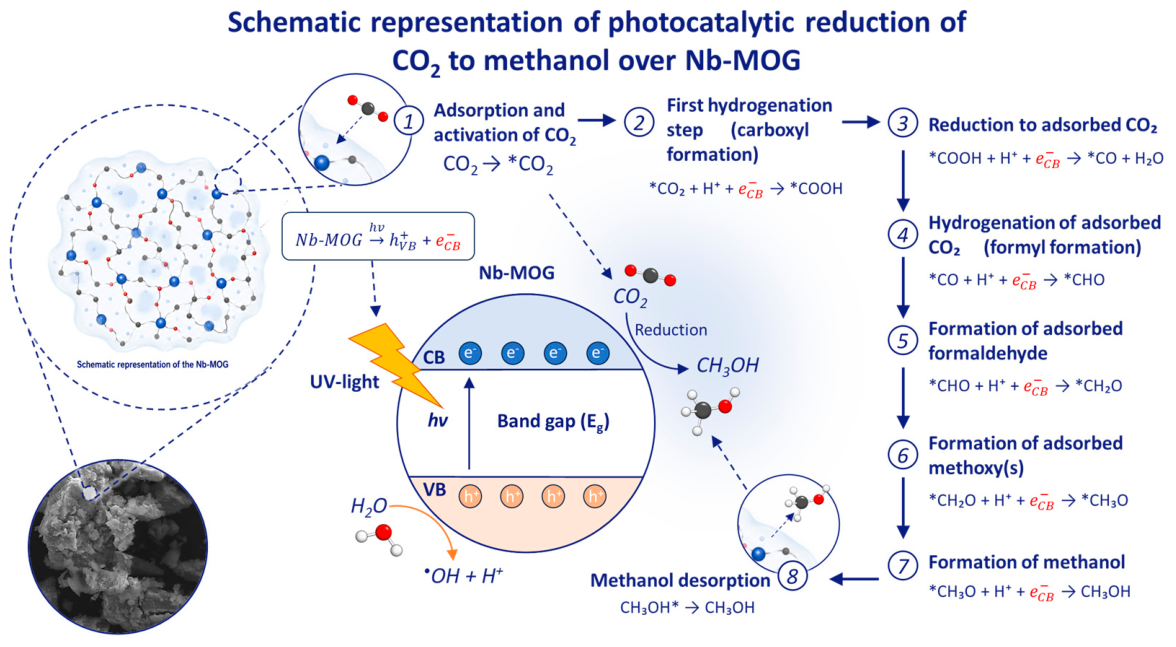
Regarding the pathway for CO2 reduction to methanol, a plausible literature-based reaction mechanism is proposed in Figure 8, based on the works [37,38,39], to provide a conceptual interpretation of the photocatalytic process. Although control experiments such as dark, catalyst-free, and CO2-free tests were not performed in this study, the photocatalytic mechanism proposed herein is consistent with the current understanding of CO2 photoreduction, which requires light-induced charge carriers for CO2 activation and conversion.
Figure 8.
Suggested reaction mechanism for the photoreduction of CO2 to generate methanol.
Chen et al. [3] conducted control and isotope experiments using 13CO2. They confirmed that the CO originated from the photocatalytic reduction of CO2. The same study found that the apparent quantum yield (AQY) of the TiO2/BiVO4-4 catalyst decreased with increasing irradiation wavelength, suggesting that photogenerated carriers were primarily responsible for CO production. A possible explanation is that slower electron transport met the two-electron requirement, yielding a single product: CO.
4. Conclusions
This study demonstrates that an Nb-MOG-based photocatalyst can promote the reduction and recycling of CO2 into methanol in a simple aqueous carbonate medium. Both sodium carbonate concentration and catalyst loading showed significant positive linear effects on methanol production, with the highest yield obtained at 0.10 mol·L−1 Na2CO3 and 0.50 g·L−1 catalyst loading. It was observed that adding Na2CO3 increased the solubility of CO2 in water, thereby influencing process performance. Furthermore, a higher concentration of the Nb-MOG catalyst led to a greater number of active sites, thereby increasing the amount of methanol. The statistical model adequately described the system, confirming the reliability of the experimental results.
Although the methanol production rate of the proposed photocatalyst is lower than that reported for advanced MOF-based photocatalysts using noble metals or sacrificial agents, its performance is notable given the system’s simplicity and the absence of cocatalysts or sacrificial donors. These findings highlight the potential of Nb-MOG as a sustainable and low-complexity material for photocatalytic CO2 valorization and provide a basis for further optimization.
Author Contributions
Conceptualization, E.A., G.G.L. and M.E.K.F.; methodology, A.C., E.A., M.Z.F. and O.A.A.d.S.; validation, A.M.T. and M.Z.F.; formal analysis, G.G.L. and M.E.K.F.; investigation, O.A.A.d.S. and M.V.Z.; writing—original draft preparation, E.A., A.C.; writing—review and editing, A.C., G.G.L., O.A.A.d.S., M.Z.F., A.M.T. and M.E.K.F.; supervision, O.A.A.d.S. All authors have read and agreed to the published version of the manuscript.
Funding
This research was funded by the Conselho Nacional de Desenvolvimento Científico e Tecnológico (CNPq), grant PQ Process No. 304068/2022-5, and by the Programa Ibero-Americano de Ciencia y Tecnología para el Desarrollo (CYTED) through the project CATPROH2.
Data Availability Statement
The data used to support the findings of this study are included within the article.
Acknowledgments
The authors thank the Capes, Fundação Araucaria, and CNPq, as well as LabMult C2MMa-UTFPR-Ponta Grossa for providing access to their laboratories to perform the analyses.
Conflicts of Interest
The authors declare no conflicts of interest.
Appendix A
Calibration Curve
The calibration curve for methanol quantification was prepared using GC-grade methanol. Six standard solutions were prepared by transferring 5 mL of aqueous solutions containing 167, 333, 667, 1000, 1333, and 1667 ppm of methanol into 20 mL headspace vials, which were then sealed with aluminum/silicone septa. All standards were analyzed under the same headspace and chromatographic conditions used for the samples, ensuring full methodological equivalence between calibration and analytical runs. The results can be found in Table A1, and the curve in Figure A1.
Figure A1.
Calibration curve for methanol.
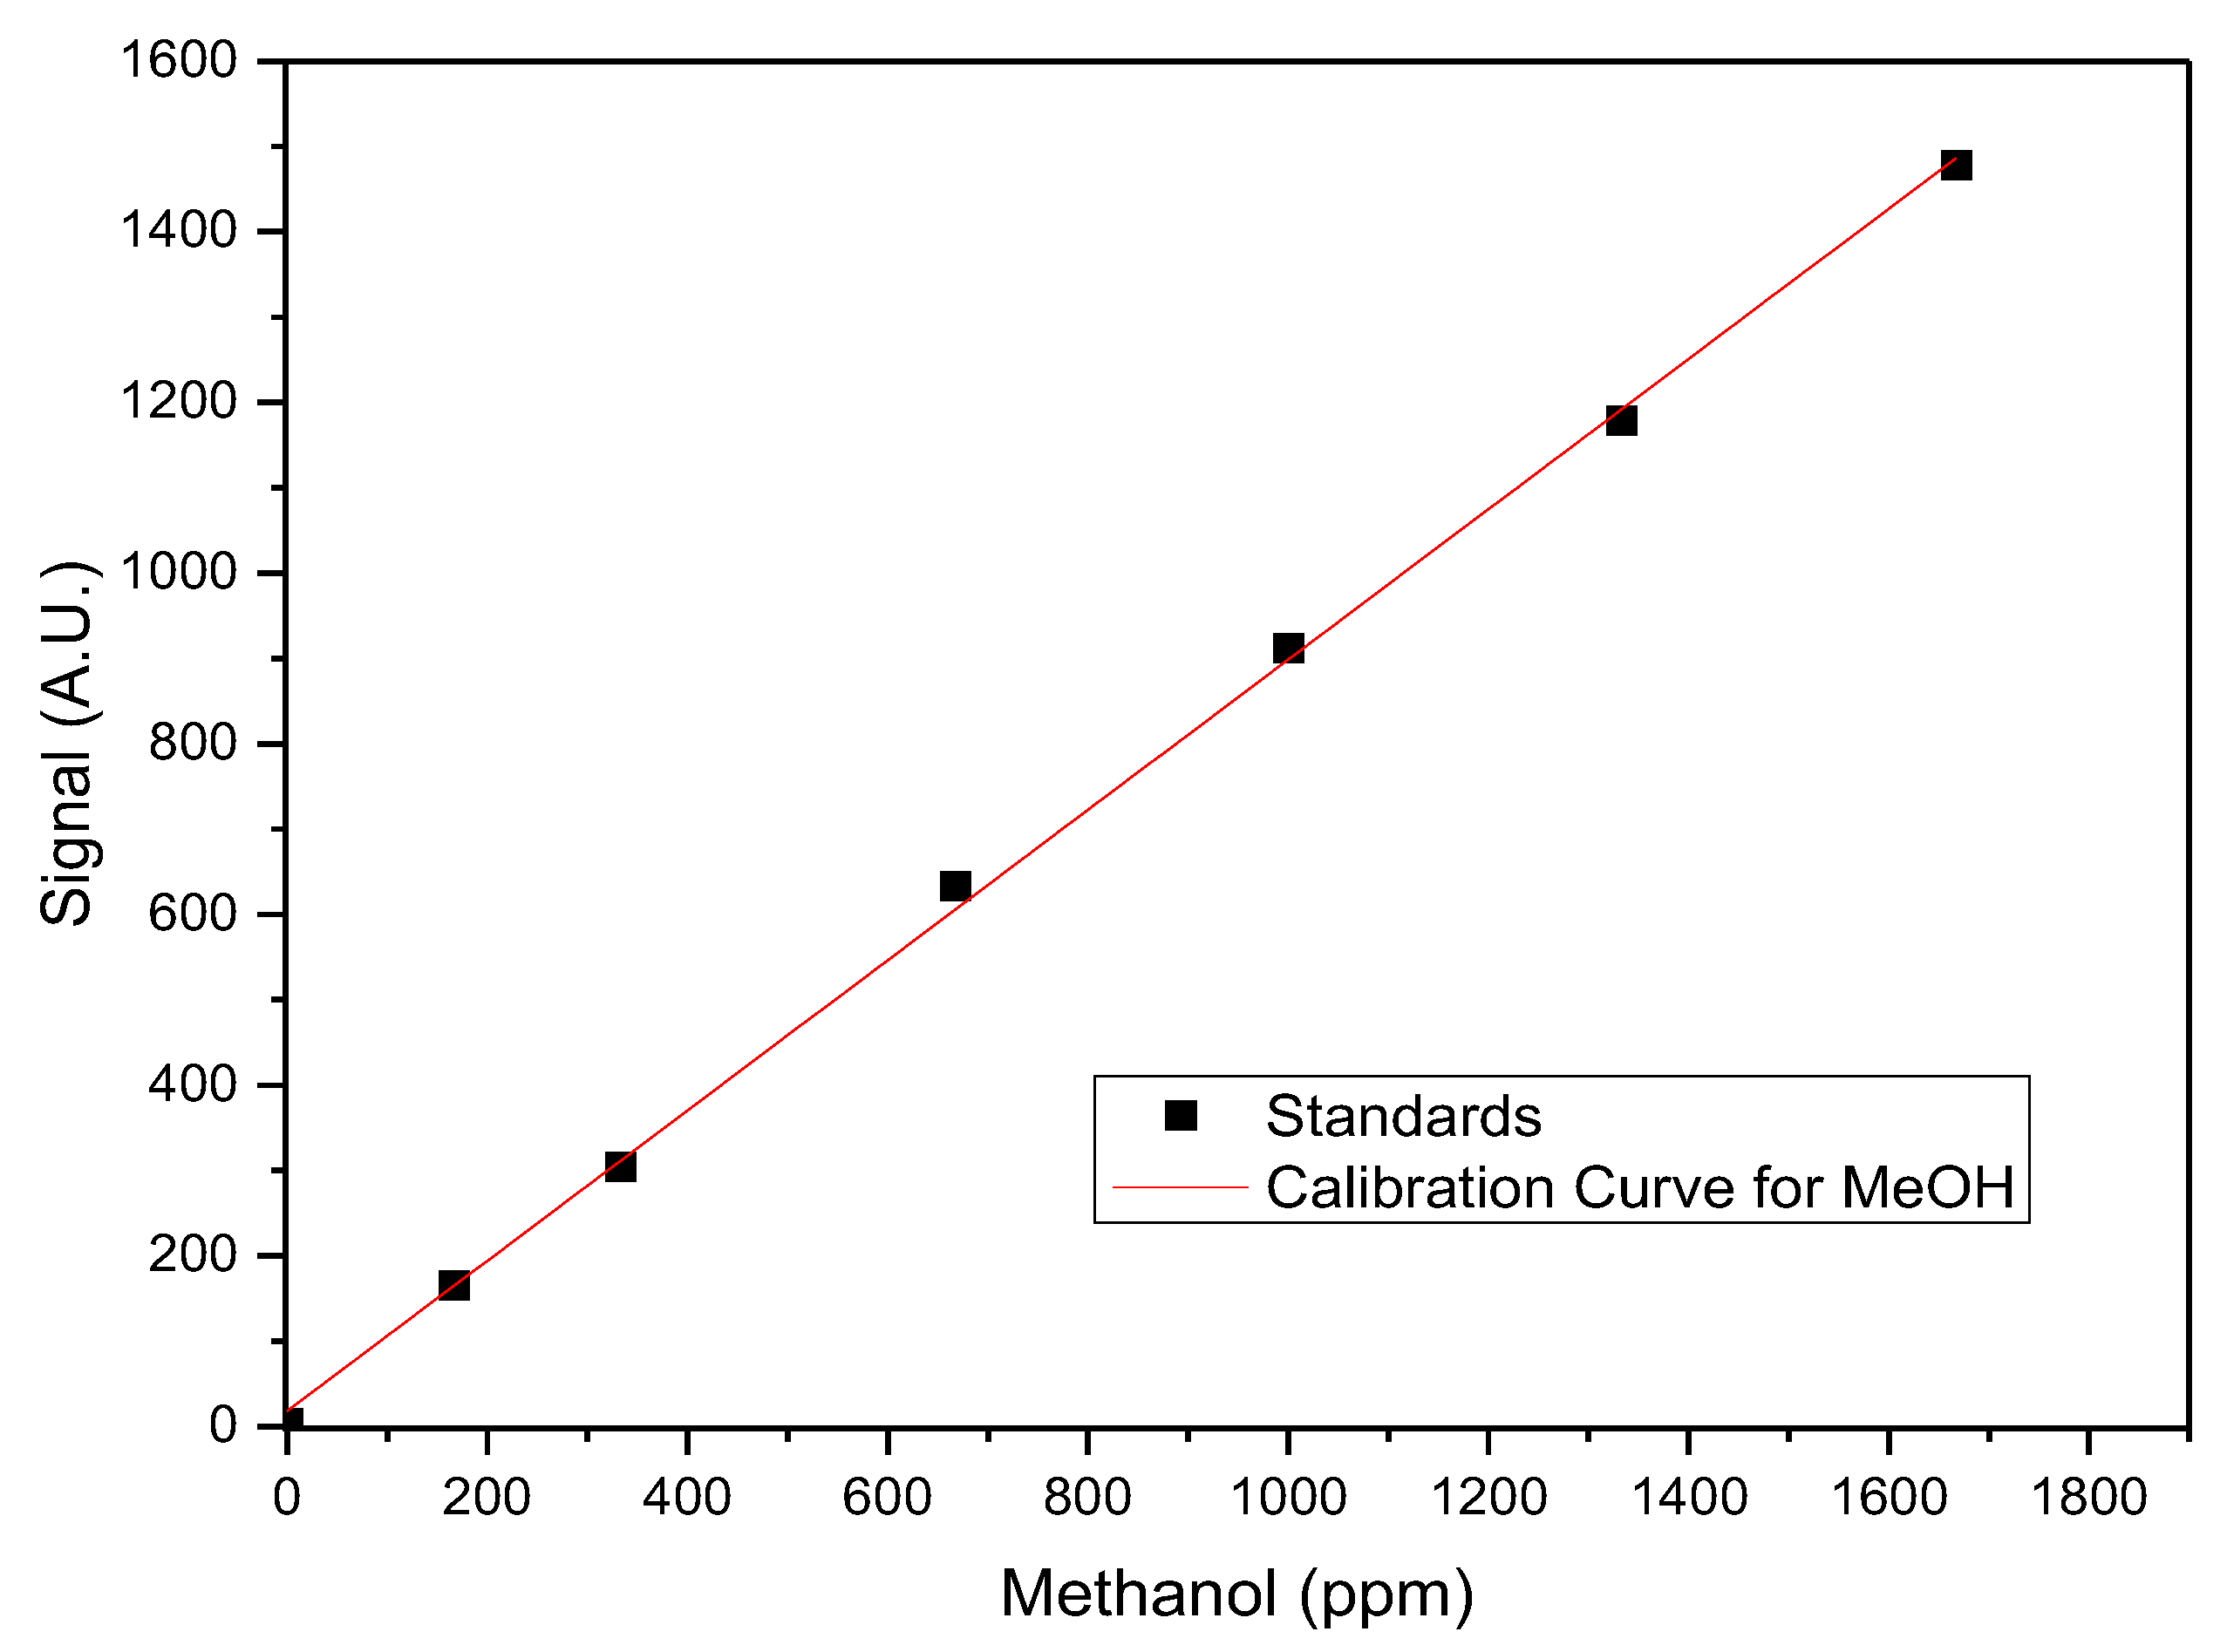
Table A1.
Results from the calibration curve.
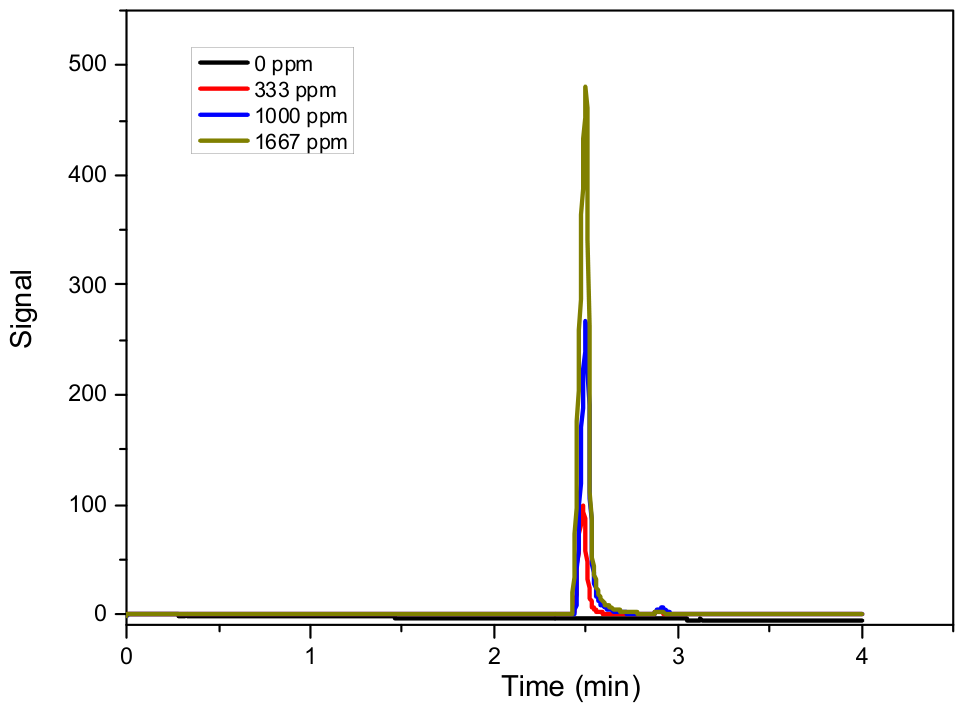
The calibration curve for methanol showed excellent linearity over the evaluated concentration range, with a linear regression equation of y = 0.88058x + 18.29363 and a correlation coefficient (R2) of 0.99905. The method showed adequate sensitivity, yielding a limit of detection (LOD) of 12.6 ppm and a limit of quantification (LOQ) of 38.3 ppm, calculated from the standard deviation of the response and the slope of the calibration curve. Precision was evaluated in triplicate, yielding coefficients of variation (CVs) of 1.24% at 167 ppm, 0.97% at 667 ppm, and 1.19% at 1667 ppm, demonstrating good repeatability across the analytical range. The chromatograms are shown in Figure A2.
Figure A2.
Chromatograms from the calibration curve.
References
- Jiang, X.; Nie, X.; Guo, X.; Song, C.; Chen, J.G. Recent Advances in Carbon Dioxide Hydrogenation to Methanol via Heterogeneous Catalysis. Chem. Rev. 2020, 120, 7984–8034. [Google Scholar] [CrossRef] [Scilit] [PubMed]
- Sajnani, S.; Memon, M.A.; Memon, S.A.; Kumar, A.; Mehvish, D.; Ameen, S.; Mukarama; Zhou, W.; Liu, Y. CO2 to Methanol Conversion: A Bibliometric Analysis with Insights into Reaction Mechanisms, and Recent Advances in Catalytic Conversion. Processes 2025, 13, 314. [Google Scholar] [CrossRef] [Scilit]
- Chen, C.; Wu, M.; Xu, Y.; Ma, C.; Song, M.; Jiang, G. Efficient Photoreduction of CO2 to CO with 100% Selectivity by Slowing Down Electron Transport. J. Am. Chem. Soc. 2024, 146, 9163–9171. [Google Scholar] [CrossRef] [Scilit] [PubMed]
- Lingampalli, S.R.; Ayyub, M.M.; Rao, C.N.R. Recent Progress in the Photocatalytic Reduction of Carbon Dioxide. ACS Omega 2017, 2, 2740–2748. [Google Scholar] [CrossRef] [Scilit] [PubMed]
- Khalil, M.T.; Wu, X.; Liu, S.; Liu, Y.; Ashraf, S.; Shen, R.; Zhang, H.; Peng, Z.; Jiang, J.; Li, B. Recent advancements in catalytic CO2 conversion to methanol: Strategies, innovations, and future directions. Green Chem. 2025, 27, 9016–9054. [Google Scholar] [CrossRef] [Scilit]
- Ye, J.; Dimitratos, N.; Rossi, L.M.; Thonemann, N.; Beale, A.M.; Wojcieszak, R. Hydrogenation of CO2 for sustainable fuel and chemical production. Science 2025, 387, eadn9388. [Google Scholar] [CrossRef] [Scilit] [PubMed]
- Li, T.; Wang, P.; He, M.; Zhang, T.; Yang, C.; Li, Z. Metal-organic frameworks for photocatalytical carbon dioxide reduction reaction. Coord. Chem. Rev. 2024, 521, 216179. [Google Scholar] [CrossRef] [Scilit]
- Zheng, J.; Yan, X.; Guo, X.; Wang, X.; Tang, S.; Liu, M. Advancements in Metal–Organic Framework Materials for Photocatalytic CO2 Reduction. Catalysts 2025, 15, 208. [Google Scholar] [CrossRef] [Scilit]
- Khan, M.; Akmal, Z.; Tayyab, M.; Mansoor, S.; Zeb, A.; Ye, Z.; Zhang, J.; Wu, S.; Wang, L. MOFs materials as photocatalysts for CO2 reduction: Progress, challenges and perspectives. Carbon Capture Sci. Technol. 2024, 11, 100191. [Google Scholar] [CrossRef] [Scilit]
- Huang, T.; Yang, H.; Xu, W.; Sun, Y.; Pang, H. Research progress of MOF-based materials in photocatalytic reduction of CO2 and N2. Chem. Catal. 2024, 4, 100929. [Google Scholar] [CrossRef] [Scilit]
- Mori, R. CO2 photocatalytic reduction with robust and stable metal–organic framework: A review. Mater. Renew. Sustain. Energy 2024, 13, 109–132. [Google Scholar] [CrossRef] [Scilit]
- Wu, Z.; Li, W.; Hou, L.; Wei, Q.; Yang, H.; Jiang, Y.; Tang, D. A novel Sunflower-like MOF@COF for improved photocatalytic CO2 reduction. Sep. Purif. Technol. 2023, 311, 123322. [Google Scholar] [CrossRef] [Scilit]
- Zhang, N.; Sun, Y.; Liu, X.; Yin, R.; Wang, Y.; Wang, S.; Wei, J.; Zhang, G.; Dong, H.; Zhang, F. 2D MOF/COF Heterojunction for Efficient Photothermal Synergistic Catalysis of CO2 Reduction. Adv. Funct. Mater. 2026, 36, e23743. [Google Scholar] [CrossRef] [Scilit]
- Liu, X.; Wu, Y.; Li, Y.; Yang, X.; Ma, Q.; Luo, J. MOF-on-MOF-derived CuO@In2O3 s-scheme heterojunction with core–shell structure for efficient photocatalytic CO2 reduction. Chem. Eng. J. 2024, 485, 149855. [Google Scholar] [CrossRef] [Scilit]
- Han, C.; Zhang, X.; Huang, S.; Hu, Y.; Yang, Z.; Li, T.; Li, Q.; Qian, J. MOF-on-MOF-Derived Hollow Co3O4/In2O3 Nanostructure for Efficient Photocatalytic CO2 Reduction. Adv. Sci. 2023, 10, e2300797. [Google Scholar] [CrossRef] [Scilit] [PubMed]
- Santos-Lorenzo, J.; San José-Velado, R.; Albo, J.; Beobide, G.; Castaño, P.; Castillo, O.; Luque, A.; Pérez-Yáñez, S. A straightforward route to obtain zirconium based metal-organic gels. Microporous Mesoporous Mater. 2019, 284, 128–132. [Google Scholar] [CrossRef] [Scilit]
- Bedair, A.; Algethami, F.K.; Alqarni, L.S.; Hamed, M.; Locatelli, M.; Mansour, F.R. Application of metal organic gels (MOGs) in analytical chemistry. TrAC Trends Anal. Chem. 2026, 202, 118939. [Google Scholar] [CrossRef] [Scilit]
- Nune, S.K.; Thallapally, P.K.; McGrail, B.P. Metal organic gels (MOGs): A new class of sorbents for CO2 separation applications. J. Mater. Chem. 2010, 20, 7623–7625. [Google Scholar] [CrossRef] [Scilit]
- Yang, F.; Li, W.; Tang, B. Facile synthesis of amorphous UiO-66 (Zr-MOF) for supercapacitor application. J. Alloys Compd. 2018, 733, 8–14. [Google Scholar] [CrossRef] [Scilit]
- Yang, K.; Chen, L.; Duan, X.; Song, G.; Sun, J.; Chen, A.; Xie, X. Ligand-controlled bimetallic Co/Fe MOF xerogels for CO2 photocatalytic reduction. Ceram. Int. 2023, 49, 16061–16069. [Google Scholar] [CrossRef] [Scilit]
- Verma, P.; Rahimi, F.A.; Samanta, D.; Kundu, A.; Dasgupta, J.; Maji, T.K. Visible-Light-Driven Photocatalytic CO2 Reduction to CO/CH4 Using a Metal–Organic “Soft” Coordination Polymer Gel. Angew. Chem. Int. Ed. 2022, 61, e202116094. [Google Scholar] [CrossRef] [Scilit] [PubMed]
- Angulo-Ibáñez, A.; Perfecto-Irigaray, M.; Merino-Garcia, I.; Luengo, N.; Goitandia, A.M.; Albo, J.; Aranzabe, E.; Beobide, G.; Castillo, O.; Pérez-Yáñez, S. Metal-organic aerogels based on titanium(IV) for visible-light conducted CO2 photoreduction to alcohols. Mater. Today Energy 2022, 30, 101178. [Google Scholar] [CrossRef] [Scilit]
- Perfecto-Irigaray, M.; Merino-Garcia, I.; Albo, J.; Beobide, G.; Castillo, O.; Luque, A.; Pérez-Yáñez, S. Copper(II)-porphyrin functionalized titanium(IV) metal-organic aerogels for the visible-light driven conversion of CO2 to alcohols. Mater. Today Energy 2023, 36, 101346. [Google Scholar] [CrossRef] [Scilit]
- Khalid, M.U.; Rudokaite, A.; da Silva, A.M.H.; Kirsnyte-Snioke, M.; Stirke, A.; Melo, W.C.M.A. A Comprehensive Review of Niobium Nanoparticles: Synthesis, Characterization, Applications in Health Sciences, and Future Challenges. Nanomaterials 2025, 15, 106. [Google Scholar] [CrossRef] [Scilit] [PubMed]
- Hendon, C.H.; Tiana, D.; Fontecave, M.; Sanchez, C.; D’arras, L.; Sassoye, C.; Rozes, L.; Mellot-Draznieks, C.; Walsh, A. Engineering the Optical Response of the Titanium-MIL-125 Metal–Organic Framework through Ligand Functionalization. J. Am. Chem. Soc. 2013, 135, 10942–10945. [Google Scholar] [CrossRef] [Scilit] [PubMed]
- Castro, D.C.; Cavalcante, R.P.; Jorge, J.; Martines, M.A.U.; Oliveira, L.C.S.; Casagrande, G.A.; Machulek, A., Jr. Synthesis and Characterization of Mesoporous Nb2O5 and Its Application for Photocatalytic Degradation of the Herbicide Methylviologen. J. Braz. Chem. Soc. 2015, 27, 303–313. [Google Scholar] [CrossRef] [Scilit]
- Abreu, E.; dos Santos, O.A.A.; Fuziki, M.E.K.; Tusset, A.M.; Fidelis, M.Z.; Motheo, A.J.; Lenzi, G.G. Nb-MOG as a High-Performance Photocatalyst for Cr(VI) Remediation: Optimization and Reuse Cycles. Catalysts 2026, 16, 60. [Google Scholar] [CrossRef] [Scilit]
- Robles, J.; Regalbuto, J.R. The Engineering of Pt/Carbon Catalyst Preparation for Application on Proton Exchange Fuel Cell Membrane (PEFCM). 2004. Available online: https://api.semanticscholar.org/CorpusID:46982313 (accessed on 11 May 2026).
- Ndikumana, E.; Niyonizera, E.; Kabera, J.; Pandey, A. Analysis of Methanol and Ethanol Content in Illegal Alcoholic Beverages using Headspace Gas Chromatography: Case Studies at Rwanda Forensic Institute. Braz. J. Anal. Chem. 2024, 11, 18–33. [Google Scholar] [CrossRef] [Scilit]
- Cantão, F.d.O.; Melo, W.d.C.; Oliveira, L.C.A.; Passos, A.R.; da Silva, A.C. Utilization of Sn/Nb2O5 composite for the removal of methylene blue. Quim. Nova 2010, 33, 528–531. [Google Scholar] [CrossRef] [Scilit]
- Karabacak, M.; Cinar, M.; Unal, Z.; Kurt, M. FT-IR, UV spectroscopic and DFT quantum chemical study on the molecular conformation, vibrational and electronic transitions of 2-aminoterephthalic acid. J. Mol. Struct. 2010, 982, 22–27. [Google Scholar] [CrossRef] [Scilit]
- Tseng, I.H.; Chang, W.C.; Wu, J.C.S. Photoreduction of CO2 using sol–gel derived titania and titania-supported copper catalysts. Appl. Catal. B 2002, 37, 37–48. [Google Scholar] [CrossRef] [Scilit]
- Becerra, J.; Nguyen, D.T.; Gopalakrishnan, V.N.; Do, T.O. Plasmonic Au Nanoparticles Incorporated in the Zeolitic Imidazolate Framework (ZIF-67) for the Efficient Sunlight-Driven Photoreduction of CO2. ACS Appl. Energy Mater. 2020, 3, 7659–7665. [Google Scholar] [CrossRef] [Scilit]
- Wu, K.; Liu, C.; Chen, Y.; Jiang, H.; Peng, Q.; Chen, Y.; Fang, D.; Shen, B.; Wu, Q.; Zhan, L.; et al. Constructing asymmetric unsaturated copper coordination in Zinc(II)/Copper(I, II)-based metal-organic framework toward productive CO2-to-methanol photocatalytic conversion from CO2-capturing solution. Appl. Catal. A Gen. 2023, 650, 118970. [Google Scholar] [CrossRef] [Scilit]
- Hu, M.; Liu, J.; Song, S.; Wang, W.; Yao, J.; Gong, Y.; Li, C.; Li, H.; Li, Y.; Yuan, X.; et al. Ultra-thin Two-Dimensional Trimetallic Metal–Organic Framework for Photocatalytic Reduction of CO2. ACS Catal. 2022, 12, 3238–3248. [Google Scholar] [CrossRef] [Scilit]
- Elsafi, A.; Theihmed, Z.; Al-Yafei, A.; Alkhateeb, A.; Abotaleb, A.; Anwar, M.; Mroue, K.; Aissa, B.; Sinopoli, A. Plasmon-Enhanced CO2 Reduction to Liquid Fuel via Modified UiO-66 Photocatalysts. Catalysts 2025, 15, 70. [Google Scholar] [CrossRef] [Scilit]
- Zhu, Z.; Xing, X.; Qi, Q.; Li, H.; Han, D.; Song, X.; Tang, X.; Ng, Y.H.; Huo, P. Regulation CN reduction of CO2 products selectivity by adjusting the number of V sites and mechanism exploration. Fuel 2025, 388, 134509. [Google Scholar] [CrossRef] [Scilit]
- Qi, Q.; Shen, W.; Yan, Y.; Fang, Y.; Zhang, Y.; Tang, X.; Huo, P. Construction of In-modified CN-based photocatalyst with In–N chemical bond for efficient photoreduction of CO2. J. Mater. Sci. Technol. 2026, 261, 161–170. [Google Scholar] [CrossRef] [Scilit]
- Shen, W.; Qi, Q.; Hu, B.; Zhu, Z.; Huo, P.; Jiang, J.; Tang, X. Studying bimetals copper-indium for enhancing PCN photocatalytic CO2 reduction activity and selectivity mechanism. J. Ind. Eng. Chem. 2025, 145, 384–394. [Google Scholar] [CrossRef] [Scilit]

Disclaimer/Publisher’s Note: The statements, opinions and data contained in all publications are solely those of the individual author(s) and contributor(s) and not of MDPI and/or the editor(s). MDPI and/or the editor(s) disclaim responsibility for any injury to people or property resulting from any ideas, methods, instructions or products referred to in the content. |
© 2026 by the authors. Licensee MDPI, Basel, Switzerland. This article is an open access article distributed under the terms and conditions of the Creative Commons Attribution (CC BY) license.