


Abstract
Achieving uniform agrochemical deposition in coffee is challenging because canopy structure, terrain, and wind conditions influence spray movement and retention. This study compared an unmanned aerial spray system (UASS), backpack sprayer, and tractor-mounted sprayers across three commercial coffee farms on Hawai‘i Island. Spray coverage, droplet density, droplet size metrics, and operational efficiency were evaluated using water-sensitive cards positioned throughout the canopy and analyzed using mixed-effects models. UASS produced significantly lower spray coverage and droplet density than the ground-based application systems, whereas backpack and tractor sprayers did not differ. Deposition patterns varied with canopy position, with application method effects depending on canopy height, depth, and aspect. Volume median diameter decreased in the upper canopy and with increasing wind speed, while relative span varied modestly among methods and was greater within the canopy interior. Canopy position and wind strongly shaped agrochemical deposition across spray platforms. Although UASS required less field labor and improved accessibility in terrain-limited systems, these operational advantages were accompanied by reduced deposition relative to ground-based sprayers. These findings demonstrate that canopy position and environmental conditions strongly influence agrochemical deposition and support UASS as a complementary application platform rather than a direct replacement for conventional sprayers under the conditions evaluated.
1. Introduction
Efficient agrochemical application is essential for managing pests, diseases, and foliar nutrient inputs in coffee production, but achieving consistent spray deposition can be difficult in perennial crop systems with complex canopy structure and variable terrain. Coffee canopies often contain dense exterior foliage, protected interior branches, and vertically stratified leaf layers that can restrict droplet movement and create uneven deposition. These challenges are especially important for products that depend on adequate contact with target tissues, including pesticides, fungicides, foliar fertilizers, and biological control products. Inadequate deposition in protected canopy zones may reduce product performance, whereas excessive deposition may increase input costs, off-target losses, and the risk of over-application.
Conventional spray systems remain the dominant application method in many coffee-producing regions because they are familiar, adaptable, and capable of delivering relatively high spray volumes. Backpack sprayers provide flexibility in steep or irregular terrain but are labor-intensive and increase operator exposure. Tractor-mounted sprayers can improve application speed and reduce labor demands, but their use is often limited by slope, row spacing, field accessibility, and canopy structure [1,2]. These constraints are particularly relevant in tropical coffee systems, where steep terrain and heterogeneous production environments can restrict the use of tractor-mounted sprayers and increase reliance on labor-intensive backpack applications. In regions such as Hawai‘i, where coffee production systems are highly variable and labor costs are consistently 30–50% higher than national averages [3,4], these limitations can restrict timely application and reduce the economic feasibility of management for many producers. These factors create strong incentives for technologies that improve operational flexibility while supporting site-specific management.
Even when ground-based systems are feasible, uniform deposition throughout the canopy is not guaranteed [5,6]. Studies in perennial crops have shown that exterior foliage can intercept droplets before they reach inner canopy zones, creating vertical and horizontal gradients in deposition [7,8,9]. Coffee-specific ground-spraying studies similarly indicate that external leaves can act as a barrier to droplet penetration, reducing deposition within the inner canopy and emphasizing the need to adjust spray rate, nozzle type, and airflow according to canopy architecture and growth stage [10].
Unmanned aerial spray systems (UASS) have emerged as a potential alternative or complementary platform for agrochemical application in specialty crops. UASS may reduce labor demands and operator exposure, improve accessibility in steep or fragmented terrain, and increase operational efficiency relative to ground-based approaches [1,11,12]. Recent reviews highlight rapid growth in UASS applications and emphasize that deposition outcomes depend on flight height, flight speed, nozzle type, spray volume, droplet spectrum, and environmental conditions [13,14]. However, UASS performance can vary substantially among crops and canopy types, and lower spray volumes or smaller droplets may not always translate into adequate deposition in protected canopy zones.
Coffee-specific studies have begun to evaluate UASS performance, but important gaps remain. Cunha et al. [15] reported that UASS application parameters, including flight height, nozzle type, spray volume, and adjuvant use, influenced spray deposition. Silva et al. [16] showed that spray volume, flight speed, and plant age affected UASS spray deposition and droplet spectrum. Similarly, Marques Filho et al. [17] found that canopy position strongly influenced measured application quality, with external canopy layers receiving more droplets than internal positions. These studies demonstrate that UASS can deposit spray within coffee canopies, but they also suggest that canopy position and operational conditions strongly mediate deposition outcomes. Few studies, however, have directly compared UASS with backpack and tractor-mounted systems under commercial coffee production conditions while simultaneously evaluating spray coverage, droplet density, droplet size distribution, and operational efficiency. Rather, earlier studies have focused on a single platform, simplified application conditions, or specific operational settings, limiting their applicability to farms with variable terrain, canopy structure, and access constraints.
Droplet size characteristics are also important for interpreting spray application performance. Volume median diameter (VMD) affects canopy penetration, drift potential, and droplet retention, while relative span (RS) describes the breadth of droplet size distributions. Smaller droplets may improve coverage and movement into protected canopy zones but can increase susceptibility to drift and evaporation. Larger droplets may reduce drift risk but can be more readily intercepted by exterior foliage, limiting penetration into the canopy interior. Because droplet size classifications are commonly used to guide drift management and product-label recommendations, understanding how application platform and canopy position influence droplet metrics is important for optimizing agrochemical delivery and aligning application strategies with specific management objectives and product types [18,19].
Despite growing interest in UASS for coffee and other specialty crops, there remains limited field-based information on how aerial and ground-based spray systems compare across spatially variable commercial farms. In particular, the combined effects of spray platform, canopy height, canopy depth, aspect, and wind conditions on deposition patterns remain poorly quantified. Addressing these interactions is important for determining when UASS can provide advantages and when conventional ground-based systems may remain preferable. Rather than evaluating overall deposition alone, this study quantifies how spray platform effects vary across canopy height, canopy depth, and aspect, revealing vertical and internal–external deposition gradients that are directly relevant to agrochemical targeting in perennial crop systems.
The objective of this study was to compare spray deposition characteristics and operational efficiency among unmanned aerial, backpack, and tractor-mounted spray systems in commercial coffee farms on Hawai‘i Island. Specifically, we evaluated spray coverage, droplet density, VMD, and RS across canopy height, depth, and aspect under field conditions. We also assessed the influence of wind speed and hierarchical sources of variability, including site, run, and tree-level effects, using mixed-effects models. By quantifying deposition and operational trade-offs among spray platforms, this study provides applied information for improving agrochemical application strategies in coffee production systems.
2. Materials and Methods
2.1. Study Sites
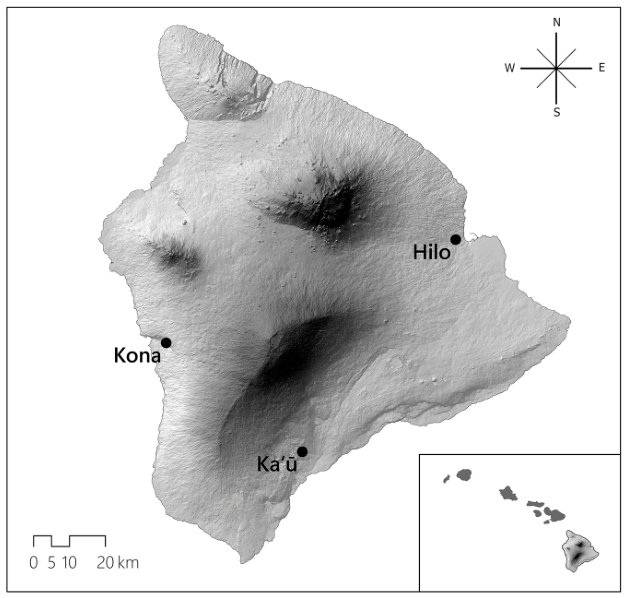
Field evaluations were conducted at three commercial coffee farms in the Kona, Ka‘ū, and Hilo districts of Hawai‘i Island. Farms represented contrasting terrain, canopy structure, and operational constraints typical of spatially variable specialty crop systems (Figure 1). The Kona site (Hōnaunau-Nāpō‘opo‘o; 474 m elevation) was characterized by steep slopes, irregular row spacing, and variable canopy height, with coffee rows oriented perpendicular to slope. The Ka‘ū site (Pāhala; 485 m elevation) exhibited moderate slopes with relatively uniform row spacing and rows aligned parallel to a gentle decline. The Hilo site (Pi‘ihonua; 158 m elevation) consisted of predominantly level terrain with regularly spaced rows and uniform canopy structure. Together, these sites captured a range of spatial conditions that influence spray accessibility, application consistency, and operational feasibility in coffee production systems on Hawai‘i Island.
Figure 1.
Locations of the three study sites on Hawai‘i Island representing contrasting terrain and canopy structure: Kona (steep, irregular), Ka’ū (moderate slope), and Hilo (level terrain). Sites were selected to capture spatial heterogeneity relevant to spray accessibility, canopy interception, and operational performance of application systems. Inset map shows the location of Hawai‘i Island within the Hawaiian archipelago.
2.2. Spray Application Systems
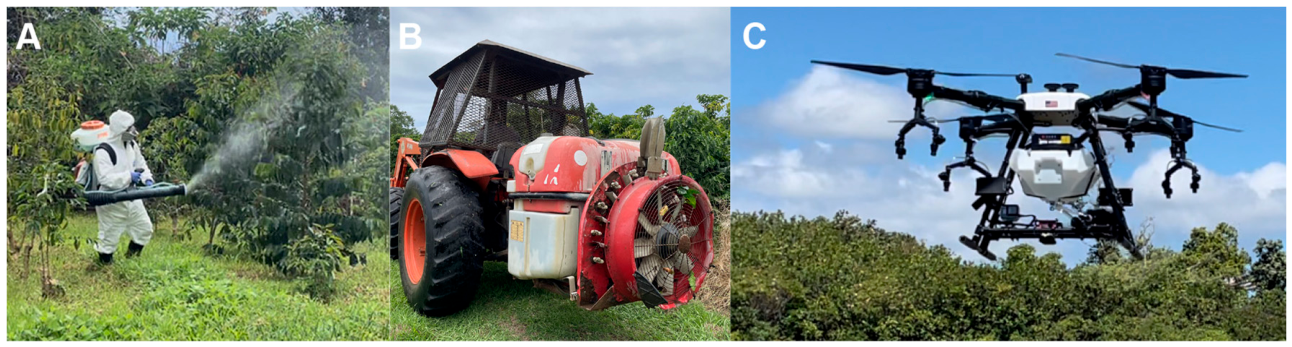
Backpack applications were conducted using a STIHL SR430 gas-powered sprayer (STIHL Inc., Virginia Beach, VA, USA) with a 14 L tank (Figure 2A). A 45° deflector screen was attached to the nozzle opening angled upwards to maximize coverage. The sprayer was calibrated to deliver 1.5 L min−1. Applications were performed by walking through rows and spraying both sides of each tree using a zigzag motion from the lower to upper canopy to achieve full coverage. The tank was filled to its maximum capacity prior to each run and refilled when necessary.
Figure 2.
Spray application systems evaluated in this study: (A) backpack sprayer, (B) tractor-mounted sprayer, and (C) Hylio AG-110 unmanned aerial spray system (UASS). Systems were operated under field conditions representative of commercial coffee production.
Tractor applications were conducted at the Hilo and Ka‘ū sites only, where terrain permitted ground equipment access. All tractor operations were performed by farm workers using their standard equipment and operating practices to reflect real-world conditions. At the Hilo site, a Kubota M6060 tractor (Kubota, Gainesville, GA, USA) equipped with a Gearmore APL400 sprayer (Gearmore, Chino, CA, USA) was operated at two travel speeds (approximately 1.1 and 2.5 m s−1). Eight nozzles positioned at about 30–40° were used with an estimated 2 GPM (gallons per minute) flow rate (Figure 2B). At the Ka‘ū site, a Kubota L3301 (Kubota, Gainesville, GA, USA) with a Gearmore APL400 sprayer was operated at approximately 1.3–1.8 m s−1 with 10 nozzles positioned at 30° and an estimated 2–3 GPM flow rate. Due to the grower-specific nature of tractor setups, nozzle configurations and flow rates varied among sites and were not standardized. As a result, comparisons among methods represent complete operational systems, including equipment configuration, operator practice, spray volume, and field accessibility, rather than isolated effects of platform type alone.
All aerial applications were conducted using a Hylio AG-110 unmanned aerial spray system (Hylio, Fort Bend, TX, USA) equipped with a 10 L tank and eight TeeJet TT11001-VP nozzles (TeeJet Technologies, Wheaton, IL, USA) (Figure 2C). Missions were planned and executed using AgroSol ground control software v. 2.105.0 (Hylio, Richmond, TX, USA) in autonomous mode, with manual override capability available throughout operations. The UASS was programmed to fly a path spraying between each row. The tank was filled to its maximum capacity of 10 L before each run and refilled as needed during operations. Key platform specifications are summarized in Table S1.
UASS operational parameters were selected to balance deposition performance, canopy clearance, and safe navigation under variable coffee field conditions. Flight speed was set at 1 m s−1 across all sites because rows were narrow, canopy height was variable, and terrain-following operation required conservative flight settings. Spray rate was standardized at 150 L ha−1 to provide sufficient deposition for comparative evaluation while remaining feasible with the 10 L UASS tank capacity. Therefore, results should be interpreted as representing a low-speed, moderate-volume UASS configuration under commercial coffee conditions rather than the full operational range of UASS platforms.
Before the commercial farm comparison, an exploratory flight-height assessment was conducted to identify a practicable operating height for the UASS under the specific equipment, canopy, and environmental conditions of the trial. This assessment was descriptive and was not designed as a replicated optimization experiment. Flight height was adjusted by site to accommodate terrain variability, canopy structure, and safe aircraft operation. At the Kona and Ka‘ū sites, where canopy height and terrain varied substantially within rows, a flight height of approximately 5 m above ground level was used in conjunction with terrain-following adjustments to maintain consistent canopy clearance. At the Hilo site, where terrain and canopy structure were more uniform, a fixed flight height of 6 m was used. These operational heights corresponded to an approximate distance of 2–3 m above the canopy surface. Although lower flight heights are generally associated with improved deposition efficiency in aerial applications, preliminary trials evaluating UASS application at multiple heights above the canopy (2–5 m) under consistent speed (1 m s−1) and spray rate (150 L ha−1) indicated minimal differences in coverage across the tested height range (Table S2). Consequently, flight height was selected based on operational stability and canopy clearance rather than treated as a primary experimental factor.
2.3. Experimental Design
At each site, a subset of adjacent rows was designated for evaluation: approximately 0.17 ha at Kona (five rows), 0.11 ha at Ka‘ū (five rows), and 0.08 ha at Hilo (six rows). A single buffer row was maintained on either side of each experimental area. The experimental unit for spray application was the independent spray run within each site method combination. Each site method combination included three independent spray runs, except for tractor applications, which were conducted only at sites where terrain permitted access. Within each run, deposition was measured on 10 flagged coffee trees that were distributed throughout the experimental rows, with 12 card positions per tree representing subsamples across canopy height, depth, and aspect. Across all site method combinations, 3000 water-sensitive cards were analyzed, with card-level measurements treated as subsamples nested within trees and independent spray runs. Random intercepts for run and tree were included to account for non-independence among card measurements collected within the same spray run and on the same tree. These repeated applications were intended to capture operational variability rather than optimize spray performance under controlled conditions.
2.4. Spray Deposition Sampling
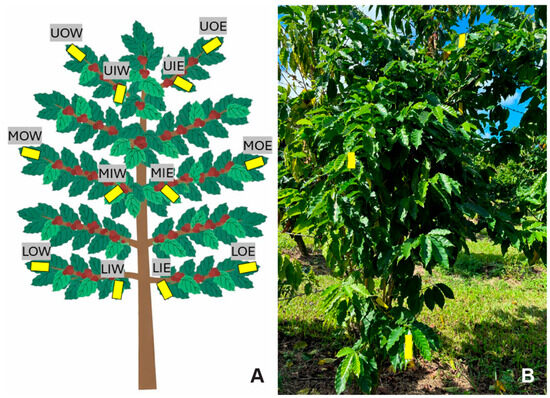
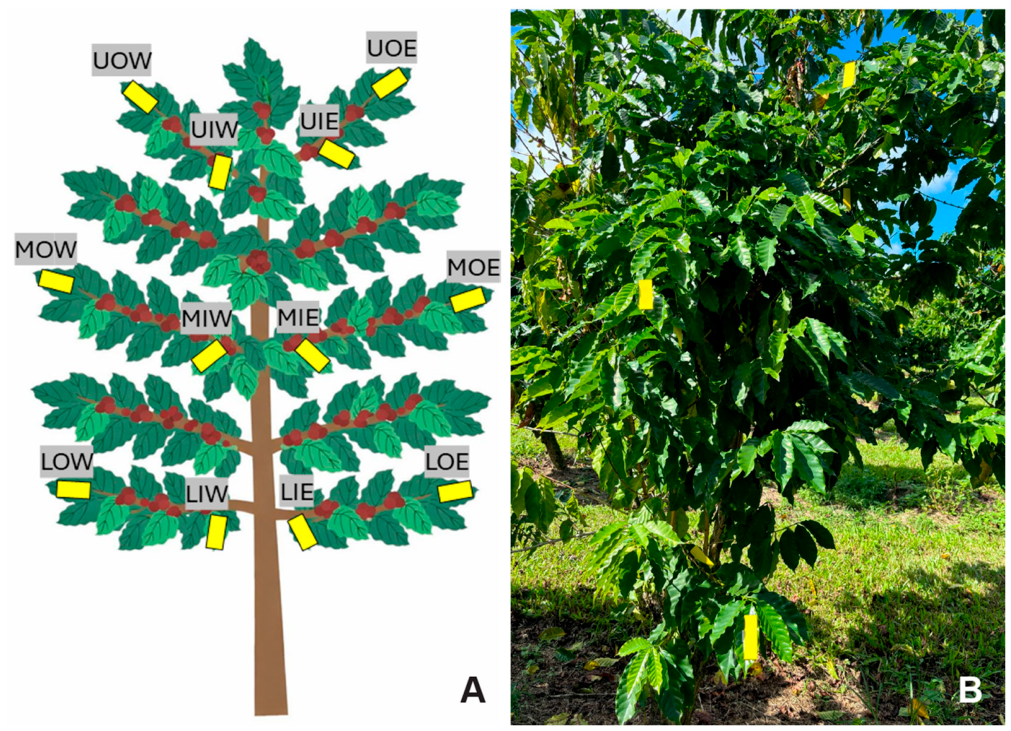
Water-only applications were used to standardize droplet formation and isolate the effects of spray method, canopy structure, and environmental conditions on deposition patterns. This approach avoids confounding effects of formulation-specific adjuvants, which can alter droplet size, spread, retention, and evaporation. Spray deposition was quantified using water-sensitive cards (76 × 51 mm2; SpotOn®, Innoquest Inc., Woodstock, IL, USA). At each site, cards were attached to coffee leaves on the 10 flagged trees to represent deposition on leaf surfaces under field conditions. Cards were placed at three canopy positions (upper, middle, lower) on both east- and west-facing sides to capture potential directional effects associated with prevailing winds (Figure 3). At each canopy position, one card was placed on an exterior leaf and one on an interior leaf, resulting in multiple sampling points per tree. Cards were affixed to the adaxial leaf surface using double-sided tape immediately prior to each spray application. Following spraying, cards were allowed to dry for a minimum of five minutes before collection.
Figure 3.
Spray card placement design used to quantify deposition across canopy structure. (A) Water-sensitive cards were positioned at three canopy heights (low, mid, high), two canopy depths (exterior and interior), and two aspects (east and west) on each sampled tree. U: Upper leaf; M: Middle leaf; L: Lower leaf; O: Outside leaf; I: Inside leaf; W: West-facing leaf; E: East-facing leaf. (B) Example of spray cards attached to coffee leaves in the field.
2.5. Environmental Monitoring
Meteorological conditions were monitored during each spray application using a Kestrel® 5500 weather meter (Kestrel Instruments, Boothwyn, PA, USA). Air temperature, relative humidity, wind speed, and wind direction were recorded throughout each run. Environmental data were summarized by site and spray method to contextualize observed deposition patterns.
2.6. Operational and Labor Metrics
For each spray run, we recorded total elapsed application time (min), including pauses for battery changes and tank refills, and the total water volume applied (L). Because backpack and tractor systems were operated under grower-standard conditions, application rates were estimated from recorded spray volume, treated area, flow rate, travel speed, and elapsed application time. These values were used to support comparison among platforms while preserving the operational realism of commercial field applications. Operational efficiency was assessed as within-plot application time per treated area (min ha−1), spray volume per treated area (L ha−1), and labor-hours per treated area (h ha−1), calculated as: (elapsed time × number of personnel)/60 and standardized by treated area. Recorded time included active spraying and on-site interruptions such as tank refills and battery changes that occurred during the trial. It did not include pre-spray mixing, equipment transport between fields, post-spray cleaning, equipment maintenance, or off-site battery charging; therefore, these values should be interpreted as relative field application metrics rather than full enterprise-level cost estimates. To support relative comparisons in labor costs among application methods, we calculated the average labor-hours required per hectare (h ha−1) and multiplied this by typical Hawai‘i-based (US$) hourly wage rates (backpack = $20–40/h, tractor = $40–80/h, UASS = $150–250/h). Labor cost estimates were based on regional grower and consultant input (L.F. Aristizábal and S. Shriner, personal communication, 2026).
2.7. Data Processing
Collected water-sensitive cards were stored in protective sleeves until processing. Cards were subsequently scanned (Epson ES-300W, Epson America Inc., Los Alamitos, CA, USA) at 1200 dpi and uploaded into AccuPatt v2.1.1 software (Spray Analytics LLC, Urbana, IL, USA). For each card, total spray coverage (% area covered), droplet density (droplets per unit area), and droplet size distribution metrics (Dv0.1, Dv0.5, Dv0.9) were quantified. The Dv0.1 value shows that 10% of the spray volume consists of droplets smaller than this size. The Dv0.9 value shows that 10% of the spray volume consists of droplets larger than this size. The Dv0.5, volume median diameter (VMD), value shows that half the total spray volume consists of larger droplets and half consists of smaller droplets. The VMD value is important in determining the droplet size category. Droplet size classifications were interpreted relative to the American Society of Agricultural and Biological Engineers classification system (ASABE S-572.1) [19], which is commonly referenced in pesticide label recommendations for drift management and application suitability. A relative span (RS) value was calculated, and it indicates the variation in the spray droplet spectrum; the smaller the number the less variation in droplet size and potentially greater precision.
2.8. Statistical Analysis
All statistical analyses were conducted in R v. 4.4.1 [20]. Spray coverage was analyzed using generalized linear mixed models (GLMMs) with a beta distribution and logit link, whereas droplet density was analyzed using a Gamma distribution with a log link because droplet density was recorded as a positive continuous response (droplets cm−2). VMD and RS were analyzed using linear mixed-effects models assuming Gaussian error distribution. All models were fitted using the glmmTMB package v. 1.1.13 [21].
Fixed effects included spray method (backpack, tractor, UASS), canopy height (low, mid, high), canopy depth (exterior, interior), aspect (east, west), average wind speed per run, and interaction terms among method and positional factors. Spray coverage values were converted to proportions and inspected prior to analysis. All observations fell strictly between 0 and 1; therefore, no boundary adjustment was required. All models included random intercepts for site, method nested within site, tree identity, and run identity to account for repeated measurements on individual trees and shared environmental conditions within runs. This hierarchical structure explicitly accommodated spatial heterogeneity across farms and temporal variability during field operations. Candidate random effects structures were compared using Akaike’s Information Criterion (AIC), and negligible random effects were removed to obtain the most parsimonious model. Because only three farms were included, the final models were also evaluated in a sensitivity analysis with site treated as a fixed effect while retaining random intercepts for spray run and tree. For this sensitivity analysis, linear mixed effects models were fitted to logit-transformed coverage and log-transformed droplet density, whereas VMD and RS were analyzed on their original scales. The principal conclusions concerning application method, canopy position, wind, and the retained interactions were unchanged.
Because Dv0.1, Dv0.5, and Dv0.9 represent percentile-based descriptors of the same droplet size spectrum and are inherently correlated, statistical analyses focused on Dv0.5 (VMD) and RS only. VMD was selected as the primary indicator of droplet size class, given its relevance to ASABE spray classification standards, and RS was retained as a measure of droplet size variability within each application method. Dv0.1 and Dv0.9 were summarized descriptively but were not modeled separately to avoid redundancy and inflation of multiple statistical tests.
Fixed effects structures were simplified using backward model selection based on AIC. Candidate models within ΔAIC < 2 were considered to have similar support. When multiple models were similarly supported, the more parsimonious model was selected unless a more complex model improved biological interpretability. Main effects involved in retained interaction terms were maintained regardless of statistical significance.
Model assumptions and fit were evaluated using simulated residual diagnostics implemented in the DHARMa package v. 0.4.7 [22], including assessment of dispersion, zero inflation where relevant, residual patterns, and model convergence. No final models showed unresolved convergence or dispersion problems. Estimated marginal means (EMMs) and Tukey-adjusted pairwise contrasts were calculated for significant main effects and interactions using the package emmeans v. 1.10.6 [23], with confidence intervals reported on the response scale where appropriate. Statistical significance was determined at α = 0.05.
ChatGPT 5.0 was used solely to assist in the creation of the graphical abstract based on author-provided study information. It was not used for study design, data collection, statistical analysis, interpretation of results, or preparation of the manuscript text. The authors have reviewed and edited the output and take full responsibility for the content of this publication.
3. Results
3.1. Environmental Conditions During Application
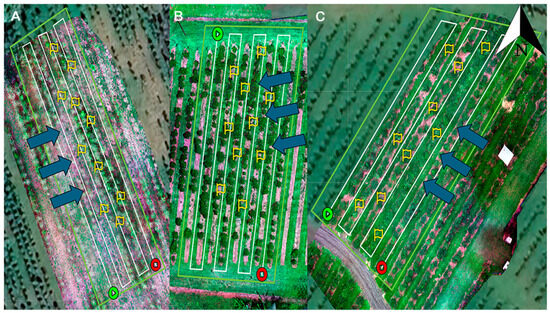
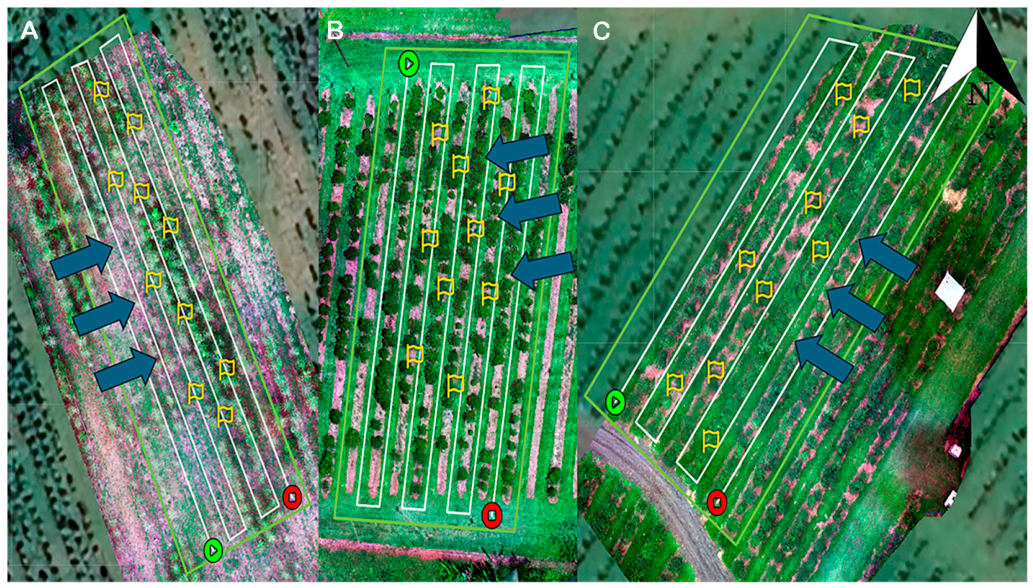
Spray applications were conducted under a range of environmental conditions reflective of typical coffee farm operations on Hawai‘i Island (Table 1). Mean air temperatures ranged from approximately 23 to 29 °C across sites, with relative humidity between 55 and 72% (Table 1). Average wind speeds were generally low to moderate (1–3 m s−1), though intermittent gusts occurred during some applications. At all three sites, prevailing wind directions were oriented largely perpendicular to coffee row orientation, allowing evaluation of deposition on both windward and leeward canopy faces (Figure 4). While short-term fluctuations in wind speed and direction were observed, overall conditions remained within ranges suitable for spray application.
Table 1.
Environmental conditions recorded during each spray application, including air temperature (°C), relative humidity (%), wind speed (m s−1), and wind direction (°). Values represent mean conditions for each application run.
Figure 4.
Site layouts and experimental sampling locations. Yellow flags indicate trees selected for deposition measurements. White lines represent application paths through rows for each spray method. Green symbols show the starting point of each run and red symbols show the end point of each run. Blue arrows denote prevailing wind direction during application runs. Differences in terrain, row orientation, and wind direction illustrate environmental variability influencing spray deposition patterns. (A) Kona (Southwesterly winds); (B) Hilo (Northeasterly winds); (C) Ka‘ū (Southeasterly winds).
3.2. Spray Coverage Across Application Methods
Model comparisons indicated that the reduced model without the method × wind interaction provided the best fit and was, therefore retained (Table S3). Random effects variance was dominated by run-to-run variability, followed by persistent differences among trees, with negligible residual site-level variance after accounting for run and tree identity (Table S4). Descriptive statistics are presented in Table 2. Statistical inference is based on mixed-effects models, with estimated marginal means and pairwise comparisons in the Supplementary Information.
Table 2.
Descriptive summary of spray coverage (%), droplet density (droplets per unit area), and deposited droplet-size metrics (Dv0.1, Dv0.5, Dv0.9, relative span (RS)) across study sites and application methods. Values represent mean deposition across canopy positions.
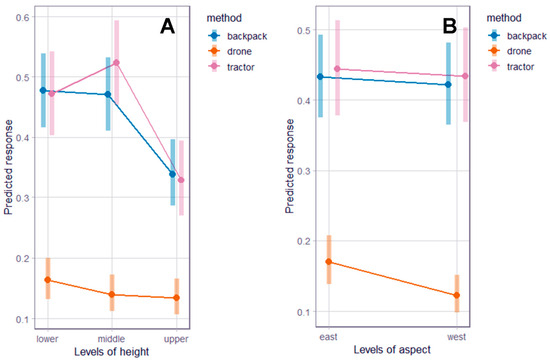
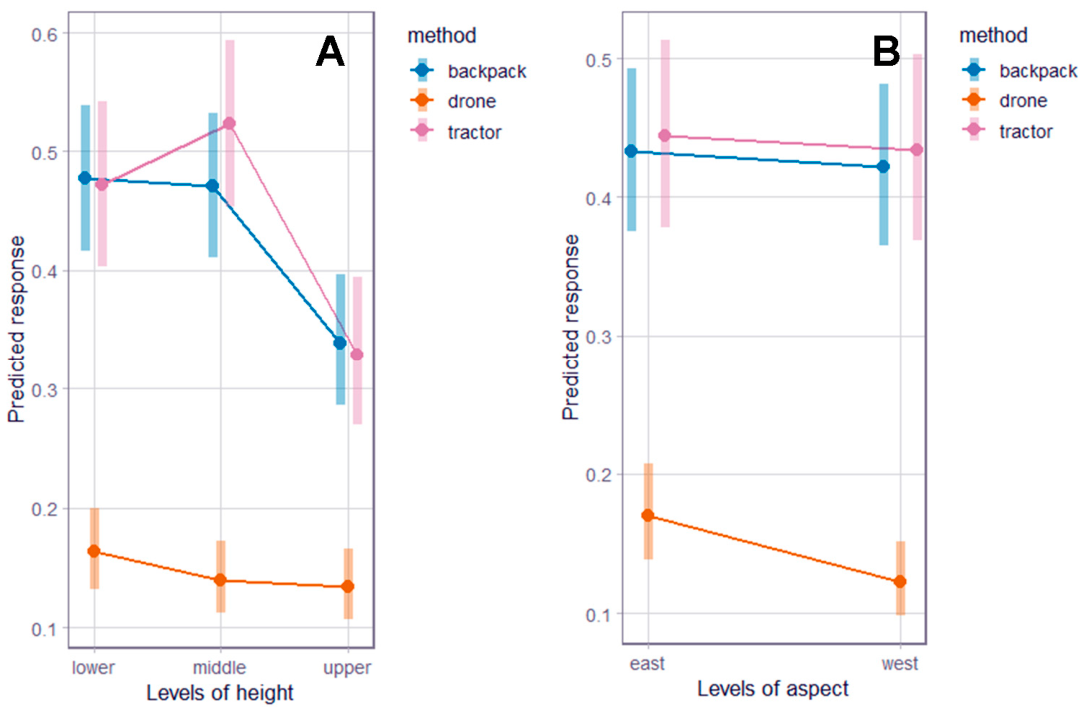
Mixed-model analyses indicated that spray coverage varied significantly among application methods, canopy positions, and wind conditions (Table 3). Estimated marginal means indicated that backpack and tractor applications achieved similar spray coverage across all canopy heights (p ≥ 0.50), whereas UASS resulted in significantly lower coverage than both ground-based systems at each canopy height (p < 0.001; Table 3, Figure 5A). Mean coverage for backpack and tractor applications ranged from 47 to 52% in the lower and middle canopy but declined to approximately 33–34% in the upper canopy (Table S5). In contrast, UASS coverage remained consistently low (13–16%) across canopy heights (Table S5). Within application methods, coverage declined significantly in the upper canopy for backpack and tractor applications (p < 0.001), whereas no significant decline occurred between the mid and upper canopy for UASS (p = 0.77).
Table 3.
Results of the best-fit beta GLMM evaluating factors influencing spray coverage. All main effects are shown; only statistically significant interaction terms (p < 0.05) are included for clarity.
Figure 5.
Estimated marginal means (±95% confidence intervals) for spray coverage predicted by the final beta GLMM. (A) Predicted spray coverage by application method across canopy heights. (B) Predicted spray coverage by application method and canopy aspect. Values are model-adjusted estimates accounting for the effects of canopy position, wind speed, and random effects of site, spray run, and tree. Pairwise comparisons are presented in Table S6.
Backpack and tractor applications did not differ between east- and west-facing foliage (p > 0.41), whereas UASS deposited significantly greater coverage on east-facing foliage than west-facing foliage (17.1% vs. 12.3%; p < 0.001) (Figure 5B). EMMs indicated that spray coverage was significantly greater on exterior foliage than interior foliage (33.8% vs. 29.5%; p < 0.001), averaging across spray methods, canopy heights, and aspects (Table S5). Spray coverage declined significantly as wind speed increased, independent of spray method and canopy position (p = 0.006; Table S6).
3.3. Droplet Density
Descriptive summaries show that UASS generally produced lower mean droplet densities than backpack or tractor applications across sites, while ground-based systems produced higher droplet counts and larger deposited droplet-size metrics (Table 2). Model selection identified the model excluding wind speed as the most parsimonious representation of droplet density (Table S7). Removing wind slightly improved the model fit (ΔAIC = 1.99), whereas the removal of any method canopy interaction substantially reduced model support (ΔAIC ≥ 33), indicating that canopy-position effects on droplet density differed among spray systems. Random effects variance was dominated by run-level variability, which accounted for approximately 63% of random effect variance, followed by site-level effects (22%) and tree-level effects (15%), while site × method variance was negligible (Table S8).
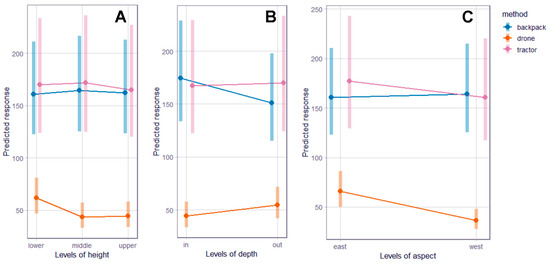
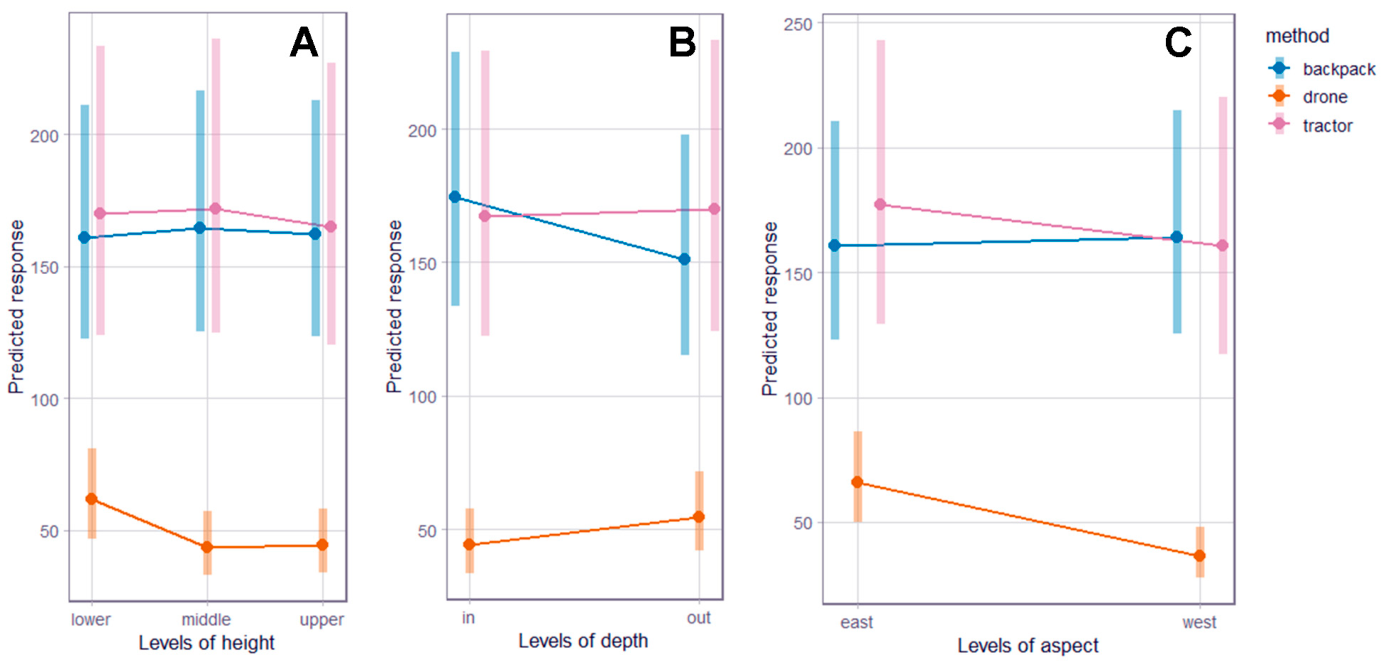
Droplet density varied among spray systems and canopy positions (Table 4). Estimated marginal means showed that backpack and tractor sprayers produced similar droplet densities throughout the canopy, whereas UASS consistently deposited fewer droplets (Table S9). Backpack applications deposited approximately 161–165 droplets cm−2 across canopy heights, tractor applications deposited 165–172 cm−2, and UASS deposited only 43–62 droplets cm−2. Backpack applications deposited 2.6-fold more droplets than UASS in the lower canopy and 3.7–3.8-fold more droplets in the middle and upper canopy (p < 0.001), while tractor applications similarly exceeded UASS and did not differ significantly from backpack applications (Figure 6A).
Table 4.
Results of the best-fit linear mixed-effects model evaluating factors influencing droplet density. All main effects are shown; only statistically significant interaction terms (p < 0.05) are included for clarity.
Figure 6.
Estimated marginal means (±95% confidence intervals) for droplet density predicted by the final gamma GLMM. Predicted droplet density is shown by application method across (A) canopy height, (B) canopy depth, and (C) canopy aspect. Values are model-adjusted estimates accounting for fixed effects and random effects of site, spray run, and tree. Pairwise comparisons are presented in Table S10.
Canopy depth effects also differed among application methods. Backpack applications deposited significantly more droplets on interior foliage than exterior foliage (175 vs. 151 droplets cm−2; p < 0.001), whereas UASS deposited significantly more droplets on exterior foliage than interior foliage (55 vs. 44 droplets cm−2; p < 0.001) (Figure 6B). Tractor applications showed no significant difference between canopy depths (p = 0.74). East- and west-facing foliage did not differ for backpack applications (p = 0.65). However, UASS deposited nearly 80% more droplets on east-facing foliage than west-facing foliage (66 vs. 37 droplets cm−2; p < 0.001), whereas tractor applications showed a modest but significant increase on east-facing foliage (177 vs. 161 droplets cm−2; p = 0.039) (Figure 6C).
3.4. Relative Span (RS)
Relative span values ranged from 0.90 to 1.15 across site × method combinations, with UASS generally showing lower RS values than backpack applications and tractor applications showing values similar to or slightly higher than backpack applications (Table 2). Model selection indicated that the reduced model without wind provided the best fit (Table S11). Random effects variance for RS was dominated by the residual term, with comparatively small contributions from tree-, run-, and site-level effects, indicating that most unexplained variation occurred at the card level rather than among sites or spray runs (Table S12).
Model results indicated that RS varied modestly among application methods and canopy positions (Table 5). EMMs indicated that RS differed among canopy positions but varied little among application methods (Table S13). RS averaged 0.87 for backpack applications, 0.90 for UASS, and 0.91 for tractor applications. Although the tractor coefficient differed from the backpack reference level in the model output, no pairwise differences among methods remained significant after Tukey adjustment (p ≥ 0.07). RS was significantly lower in the mid-canopy than the lower-canopy (p < 0.009). Interior foliage also exhibited significantly greater RS than exterior foliage (0.91 vs. 0.88; p < 0.001) (Tables S13 and S14).
Table 5.
Results of the best-fit linear mixed effects model evaluating factors influencing relative span (RS). All main effects are shown.
3.5. Volume Median Diameter (VMD)
Volume median diameter values ranged from 358 and 408 µm for backpack applications, 308–361 µm for UASS applications, and 393–422 µm for tractor applications (Table 2). Based on ASABE S-572.1 classifications, backpack and tractor systems generally produced deposited droplet-size metrics in the coarse to very coarse range, whereas UASS values were in the medium to coarse range, and tractors ranged from fine to ultra-coarse droplets. Model selection indicated that the reduced model without the depth × aspect interaction provided the best fit (Table S15). Random effects variance was dominated by run-level and tree-level variability, with negligible site-level variance after accounting for hierarchical structure (Table S16), indicating that droplet size responses were more strongly influenced by within-site environmental variability and local canopy architecture than by farm-level differences.
VMD differed significantly among spray methods, canopy positions, and wind conditions (Table 6). Estimated marginal means indicated that backpack and tractor sprayers generally produced larger deposited droplet-size metrics than UASS (Table S17). In the lower canopy, VMD averaged 377 µm for backpack applications, 394 µm for tractor applications, and 296 µm for UASS, with backpack and tractor applications exceeding UASS by approximately 81 and 98 µm, respectively (p < 0.001; Tables S17 and S18). Similar differences were observed in the mid-canopy. In the upper canopy, however, VMD did not differ significantly among application methods (p ≥ 0.08). Backpack applications deposited significantly larger droplets on exterior than interior foliage (372 vs. 336 µm; p < 0.001), whereas UASS showed no significant difference between canopy depths (p = 0.18). Tractor applications also deposited larger droplets on exterior foliage (393 vs. 375 µm; p = 0.011). EMM trend analysis indicated that wind significantly reduced VMD for backpack applications (−48.5 µm per unit increase in centered wind speed; p < 0.001), whereas wind had no detectable effect on UASS or tractor applications. The wind response differed significantly between backpack and UASS applications (p = 0.012) (Tables S17 and S18).
Table 6.
Results of the best-fit linear mixed-effects model evaluating factors influencing volume median diameter (VMD). All main effects are shown; only statistically significant interaction terms (p < 0.05) are included for clarity.
3.6. Operational Efficiency and Site-Specific Applicability
Field application time and spray volume varied substantially among spray methods and sites (Table 7). At all sites, UASS applications required less total application time than backpack spraying, even when accounting for battery changes and tank refills. Time savings were most pronounced at the Kona and Ka‘ū sites, where terrain and row configuration limited ground-based efficiency. Tractor applications, where feasible, were the fastest method in terms of time per area treated, particularly at higher travel speeds. However, tractor use was restricted to sites with sufficient access and relatively uniform terrain. Spray volumes applied per area were highest for tractor and backpack methods and lowest for UASS applications. Reduced spray volume associated with UASS reflected both smaller tank capacity and programmed application rates, highlighting a trade-off between deposition intensity and operational adaptability. Across all sites, application method performance was strongly influenced by spatial context. Ground-based sprayers produced higher droplet densities and larger droplets, while UASS applications provided consistent coverage with lower droplet density and reduced spray volume. Operational efficiency favored UASS in terrain-limited or irregular fields, whereas tractor spraying was most efficient in uniform, accessible areas.
Table 7.
Operational efficiency metrics for each spray method across study sites, including total within-plot application time in minutes (spray + refill time), time per hectare (min ha−1), spray volume per hectare (L ha−1), and estimated labor cost per hectare (USD ha−1). Values represent means across n = 3 runs per site and include operational pauses such as refilling and battery replacement.
4. Discussion
This study provides one of the first integrated, field-based comparisons of spray coverage, droplet density, droplet size distribution, and operational efficiency across multiple application platforms in coffee systems characterized by heterogeneous terrain and canopy structure. A key contribution of this work is the canopy-resolved comparison of deposition patterns, which showed that platform performance differed across vertical and internal–external canopy positions rather than only in overall spray output. By explicitly accounting for canopy position and environmental variability within a hierarchical modeling framework, we provide a field-based assessment of deposition performance under variable commercial coffee production conditions. Across response variables, canopy structure and short-term wind conditions had strong effects on realized deposition, while application platform influenced the intensity and droplet characteristics of spray reaching the canopy. These findings highlight that UASS performance should be evaluated not simply by whether aerial systems produce equivalent deposition to ground-based sprayers, but by how well each platform matches the management objective, product type, target canopy zone, terrain, and operational constraints.
4.1. Deposition Intensity and Application Platform Trade-Offs
UASS applications produced lower overall spray coverage and droplet density than backpack and tractor systems, indicating lower deposition intensity per unit leaf area under the tested configuration. This pattern is consistent with the lower spray volumes and smaller droplet sizes typically associated with aerial application platforms. However, measurable deposition occurred across canopy strata, including upper and interior canopy positions, demonstrating that UASS can deliver spray into spatially complex coffee canopies despite reduced deposition intensity. This distinction is important because higher deposition is not universally desirable. The optimal level of deposition depends on product label requirements, mode of action, target pest or disease location, and risk of off-target movement or over-application. UASS also showed greater sensitivity of deposition intensity to canopy position and wind conditions compared to ground-based systems, consistent with previous findings that droplet size, flight parameters, and environmental conditions strongly influence UASS performance [13,24]. This pattern suggests a fundamental trade-off: ground-based systems deliver greater droplet mass per unit area, whereas UASS provide greater terrain adaptability and canopy access flexibility (Table 8).
Table 8.
Comparative summary of key attributes among spray platforms, including deposition intensity, operational efficiency, terrain accessibility, and spray volume requirements. This table synthesizes trade-offs among application systems relevant to precision agriculture decision-making.
From a management perspective, these results suggest that UASS are best viewed as a complementary application platform rather than a direct replacement for ground-based sprayers. Ground-based systems may be preferable when high-volume coverage is needed, particularly for contact products targeting protected interior canopy tissues (Table 8). In contrast, UASS may be useful where access, speed, operator exposure, or terrain limitations constrain backpack or tractor applications [25]. Similar trade-offs have been reported in coffee and other perennial crops, where aerial systems can improve operational flexibility but may produce lower or more variable canopy deposition depending on crop structure, nozzle configuration, spray volume, and operating conditions [1,15,17].
4.2. Canopy Structure as a Driver of Deposition
Across application systems, canopy height and depth exerted strong effects on deposition metrics. Coverage and VMD were greater on exterior foliage, while RS was higher on interior foliage. This pattern suggests that exterior canopy positions received larger and more consistent droplets, whereas interior canopy positions received a more variable droplet spectrum. These patterns are consistent with interception filtering, where exposed outer foliage intercepts a larger proportion of droplets and receives larger deposited droplets, while penetration into protected inner canopy zones is reduced [7,8,26]. Coffee-specific studies have similarly shown that external canopy layers can receive greater deposition than internal positions and that leaf position strongly influences application quality during aerial spraying [17]. Ground-based studies in coffee also indicate that exterior foliage can restrict droplet movement into the inner canopy, emphasizing that canopy architecture affects deposition regardless of spray platform [10].
Coverage and VMD both declined in the upper canopy, indicating reduced droplet interception and increased drift or evaporation at higher canopy positions. This result is consistent with prior work in tree crops showing that dense perennial canopies limit spray penetration and create vertical and horizontal gradients in deposition [7,8,9]. For coffee management, these findings suggest that products targeting upper or interior canopy zones may require adjusted spray volume, nozzle configuration, spray angle, flight path, or supplemental ground-based applications. This may be particularly important for contact fungicides and insecticides, where physical coverage of target tissue is central to performance.
4.3. Wind Sensitivity and Operational Timing
Wind speed significantly reduced both coverage and VMD, indicating that even relatively modest changes in field conditions can alter realized deposition. UASS applications showed greater sensitivity of deposition to canopy position and wind conditions than ground-based systems. This likely reflects the greater exposure of aerially released droplets to ambient wind, turbulence, and rotor-generated airflow before reaching a target [27,28,29]. Similar sensitivity of UASS deposition has been emphasized in reviews of UASS, where flight height, flight speed, droplet spectrum, wind speed, and downwash dynamics all influence deposition and drift risk [14,22]. Importantly, wind-driven variability was primarily captured at the run level rather than the site level, indicating that short-term environmental conditions exert stronger influence on deposition outcomes than broader farm-level characteristics.
These findings have direct operational implications, as they suggest that spray timing may be as important as platform selection. Applications conducted under lower and more stable wind conditions may improve canopy deposition and reduce off-target movement, particularly when smaller droplets are used. Adaptive flight parameters, wind-aware scheduling, and field-specific calibration may therefore improve the consistency of aerial applications. For growers, this means that UASS should not be deployed using a fixed default configuration across all fields or weather conditions. Instead, operational settings should be adjusted according to canopy structure, wind conditions, product requirements, and target location within the plant.
4.4. Droplet Size Distribution and Product-Specific Suitability
UASS applications produced smaller VMD than backpack applications, while tractor applications did not differ significantly from backpack sprayers. Smaller droplets may improve coverage and movement into some canopy spaces, but they are also more susceptible to drift and evaporation [12,13,18]. Larger droplets may reduce drift risk but can be more readily intercepted by exterior foliage, limiting movement into protected canopy zones. The lower RS observed on exterior foliage suggests that outer canopy positions received a narrower and more uniform droplet spectrum, while higher RS in interior positions indicates greater droplet-size variability after canopy filtering.
These droplet size patterns should be interpreted in relation to product type and management objective. For contact pesticides or fungicides, uniform coverage of target tissues may be critical. For systemic products, foliar fertilizers, or some biological materials, the required deposition pattern may differ depending on uptake, mobility, target site, and label directions. Coffee-specific research supports this need for product- and platform-specific calibration. Cunha et al. [15] showed that UASS deposition in coffee can be influenced by nozzle type, spray volume, and spray mixture, while Crause et al. [30] demonstrated that UASS-applied foliar fertilizer in Coffea canephora depends on operational height and nozzle configuration. Together with the present results, these studies indicate that droplet spectrum should not be optimized in isolation, but matched to the product, canopy target, and acceptable drift risk. Because droplet size classifications are commonly used in drift management and product-label guidance, nozzle and platform selection should be evaluated relative to label requirement as well as field deposition outcomes [18,19].
4.5. Implications for Coffee Agrochemical Programs
The practical value of UASS will depend on where and why the application is being made. In steep, fragmented, or irregular fields, UASS may provide clear advantages by reducing time, improving access, and limiting operator exposure. These advantages are especially relevant in coffee systems where backpack spraying can be labor-intensive and tractor access is often constrained by slope, row spacing, or field layout. However, lower coverage and droplet density under UASS may require careful calibration when the goal is high deposition in dense or protected canopy zones. A platform-specific management approach is therefore warranted. Backpack sprayers may remain useful for small blocks, steep terrain where detailed manual targeting is needed, or applications requiring thorough canopy coverage. Tractor-mounted sprayers may be most efficient in accessible, uniform fields where high-volume applications are feasible. UASS may be best suited for rapid applications in difficult terrain, targeted treatments, lower-volume programs, or situations where reducing labor and operator exposure is a priority. Rather than identifying a single “best” spray system, the results support matching application platform to field conditions, canopy architecture, product mode of action, and management objective.
These results also suggest that deposition metrics should be interpreted alongside efficacy data in future work. Lower deposition does not necessarily imply poor performance if the product is effective at lower coverage, is systemic, or targets exposed tissues. Conversely, high deposition may not improve management outcomes if droplets fail to reach the target zone or exceed label needs. Future studies that pair deposition measurements with pest, disease, or nutrient-response outcomes would help define practical thresholds for different product classes and target organisms in coffee.
4.6. Operational Efficiency and Management Considerations
Operational efficiency differed substantially among application platforms and was strongly influenced by terrain and accessibility. Across sites, UASS reduced within-plot application time per treated area relative to backpack applications and required fewer personnel for operation. In terrain-limited fields such as the Kona and Ka‘ū sites, where slope and irregular row orientation constrained ground-based mobility, aerial applications reduced active application time per hectare by more than 50% relative to backpack spraying. Given that Hawai‘i labor costs typically range from $20 to 40 per hour for backpack operation, these reductions in within-plot application time have the potential to reduce field labor requirements per hectare. However, because this study did not quantify pre-spray preparation, equipment transport, post-application cleaning, maintenance, or battery charging, these results should be interpreted as operational field-efficiency metrics rather than a complete economic assessment.
In contrast, tractor-mounted sprayers provided the shortest within-plot application times and the greatest area covered per unit time, although their use remained constrained by terrain and field accessibility. However, tractor systems required higher fuel consumption, larger spray volumes per hectare, and were not feasible in steeper fields. Lastly, application time was also influenced by tree condition and canopy density. Sparse or defoliated trees (Kona site) reduced backpack spraying time, whereas dense, tall trees (Ka‘ū site) increased the time required to achieve full canopy coverage.
UASS applied lower spray volumes per hectare relative to both backpack and tractor systems. Reduced spray volumes may reduce water transport requirements and refill frequency and could contribute to lower product use where lower application volumes are appropriate. However, these potential operational advantages were not quantified in the present study. Smaller tank capacity and battery charge requirements introduce logistical constraints that must be considered when scaling to larger acreage. The operational suitability of UASS is highly context-dependent. In steep or fragmented fields where tractor access is restricted and backpack applications are labor-intensive, UASS may improve operational flexibility and reduce field application time. Conversely, in large uniform blocks where tractor spraying is feasible, ground-based systems may remain preferable because of greater deposition intensity and higher field capacity.
Beyond direct labor savings, UASS may provide additional operational benefits through reduced operator exposure and improved accessibility in terrain-limited production systems [31]. Integration of UASS with remote sensing and targeted prescription maps could reduce unnecessary blanket applications, lowering input costs and environmental exposure [32]. While such benefits were not quantified in this study, the spatial adaptability of UASS suggests potential for improved input-use efficiency when integrated into site-specific management frameworks. Future research should integrate deposition performance with biological efficacy, off-target drift, and full enterprise-level economic analyses, including equipment transport, amortization, battery charging and replacement, maintenance, labor availability, and product efficacy, to provide a comprehensive economic comparison among application platforms.
4.7. Limitations and Future Research
This study used water-only applications to isolate the effects of spray platform, canopy position, and wind on deposition patterns. This approach allowed standardized comparison among application systems, but deposition may differ when formulated pesticides, fungicides, foliar fertilizers, adjuvants, or biological products are applied. Formulations can alter droplet size, spread, retention, evaporation, and leaf-surface behavior. This limitation is particularly relevant because coffee-specific UASS studies have shown that nozzle configuration, spray volume, adjuvants, and operational height can influence deposition outcomes [15,30].
Water-sensitive cards mounted on leaf surfaces may introduce measurement bias when droplets strike the card at oblique angles. Such impacts can elongate stains and influence estimated VMD, RS, and droplet density. Because card orientation varied naturally with leaf angle and canopy position, droplet-size metrics should be interpreted as relative indicators of deposited spray patterns among canopy positions and applications systems, rather than absolute measurements of nozzle-generated droplet spectra.
Additionally, wind direction variability was limited during trials, constraining evaluation of directional drift dynamics. Measurement of drift would provide additional insight when comparing spray methods as each method has different directions and heights that spray is projected as well as varying levels of pressure. Understanding drift would have important implications for applied use of products, especially in Hawai‘i where many coffee plantations are highly variable in structure and proximity to neighbors.
Treatments represented complete operational application systems rather than a controlled comparison of spray platforms alone. The backpack, tractor-mounted, and UASS treatments differed in nozzle configuration, carrier volume, travel speed, pressure, and application geometry. Consequently, observed differences in deposition reflect the combined effects of the system-level characteristics under the tested commercial conditions. Furthermore, because only one UASS speed and spray volume were evaluated, the results should not be interpreted as representing all commercial UASS operating configurations. Future work should evaluate a broader range of flight speeds, application volumes, nozzle types, and flight heights to determine whether higher-speed or alternative-volume configurations improve deposition while maintaining operational efficiency.
This study was also conducted at only three commercial farms. Site was included as a random effect to account for clustering and heterogeneity among farms; however, variance estimates based on only three site levels should be interpreted cautiously. As a sensitivity analysis, the final models were refitted with site treated as a fixed effect while retaining the run- and tree-level random effects. The principal conclusions concerning application method, canopy position, wind, and the retained interactions were unchanged, indicating that the main findings were not dependent on treating site as a random effect. Nevertheless, broader inference across coffee farms should remain cautious because the sites represented a limited range of commercial production conditions.
Future research should evaluate formulated products under commercial pest and disease pressure, quantify drift and off-target losses, and link deposition patterns to management outcomes such as coffee berry borer control, coffee leaf rust suppression, foliar nutrient uptake, or biological product performance. Such work would help determine when UASS can replace, supplement, or strategically complement conventional spray systems in coffee production.
5. Conclusions
Overall, this study demonstrates that the tested application systems, canopy structure, and wind conditions jointly influenced agrochemical deposition under the commercial coffee conditions evaluated. UASS provided operational advantages in terrain-limited systems but produced lower deposition intensity than backpack and tractor systems under the tested configuration. Exterior canopy positions received greater coverage and larger droplets, while interior positions showed greater droplet-size variability, highlighting the role of canopy filtering in spray delivery. These findings support the use of UASS as a complementary spray application platform in coffee, particularly where terrain, labor availability, or accessibility limit the feasibility of conventional ground-based spraying. However, given that we compared complete operational spray systems these results should not be interpreted as isolating the effect of the application platform independently of nozzle configuration, carrier volume, travel speed, pressure, and other system-specific settings. Continued optimization and integration with spatial decision tools will be critical in optimizing effectiveness in specialty crop management.
Supplementary Materials
The following supporting information can be downloaded at: https://www.mdpi.com/article/10.3390/agriengineering8080336/s1, Table S1: Technical specifications of the Hylio AG-110 unmanned aerial spray system used in field applications; Table S2: Descriptive results from an exploratory UASS flight-height assessment under the reported trial conditions; Table S3: Model selection results for spray coverage; Table S4: Variance components for random effects in the final GLMM of spray coverage; Table S5: Estimated marginal means for spray coverage; Table S6: Pairwise comparisons for spray coverage; Table S7: Model selection results for droplet density; Table S8: Variance components for random effects in the final gamma GLMM of droplet density; Table S9: Estimated marginal means for droplet density; Table S10: Pairwise comparisons for droplet density; Table S11: Model selection results for relative span (RS); Table S12: Variance components for random effects in the final linear mixed-effects model of relative span (RS); Table S13: Estimated marginal means for relative span; Table S14: Pairwise comparisons for relative span; Table S15: Model selection results for volume median diameter (VMD); Table S16: Variance components for random effects in the final linear mixed-effects model of volume median diameter (VMD); Table S17: Estimated marginal means for volume median diameter (VMD); Table S18: Pairwise comparisons for volume median diameter (VMD).
Author Contributions
Conceptualization, M.A.J. and J.N.; methodology, J.N., J.D., R.R. and M.A.J.; software, J.N. and M.A.J.; validation, J.N., J.D., R.R. and M.A.J.; formal analysis, J.N. and M.A.J.; investigation, J.N.; resources, M.A.J.; data curation, J.N.; writing—original draft preparation, M.A.J., J.N. and J.D.; writing—review and editing, J.N., J.D., R.R. and M.A.J.; visualization, J.N. and M.A.J.; supervision, J.D. and M.A.J.; project administration, M.A.J.; funding acquisition, M.A.J. All authors have read and agreed to the published version of the manuscript.
Funding
This research was funded by a USDA-NIFA Specialty Crops Research Initiative grant (2021-07760) and USDA-ARS base funds (2040-22430-027-00D).
Institutional Review Board Statement
Not applicable.
Informed Consent Statement
Not applicable.
Data Availability Statement
The raw data supporting the conclusions of this article will be made available by the authors on request.
Acknowledgments
We thank Jessica George, Karma Kissinger, Franklin Linam, Colby Maeda, and Shannon Wilson for assistance in the field, and Dan Martin (USDA-ARS) for helpful discussions in the early stages of this project. We are also grateful to the coffee growers who allowed us to conduct this study on their farms. During the preparation of this manuscript, the authors used ChatGPT (GPT-5; OpenAI, San Francisco, CA, USA) solely to assist in generating the graphical abstract. The authors have reviewed and edited the output and take full responsibility for the content of this publication.
Conflicts of Interest
The authors declare no conflicts of interest. The funders had no role in the design of the study; in the collection, analyses, or interpretation of data; in the writing of the manuscript; or in the decision to publish the results.
Abbreviations
The following abbreviations are used in this manuscript:
| GLMM | Generalized linear mixed model |
| UASS | Unmanned aerial spray systems |
| VMD | Volume median diameter |
| AIC | Akaike Information Criterion |
| GPM | Gallons per minute |
| RH | Relative humidity |
| RS | Relative span |
| EMM | Estimated marginal mean |
| SE | Standard error |
References
- Morales-Rodríguez, P.A.; Cano Cano, E.; Villena, J.; López-Perales, J.A. A comparison between conventional sprayers and new UAV sprayers: A study case of vineyards and olives in Extremadura (Spain). Agronomy 2022, 12, 1307. [Google Scholar] [CrossRef] [Scilit]
- Hiremath, C.; Khatri, N.; Jagtap, M.P. Comparative studies of knapsack, boom, and drone sprayers for weed management in soybean (Glycine max L.). Environ. Res. 2024, 240, 117480. [Google Scholar] [CrossRef] [Scilit] [PubMed]
- U.S. Department of Agriculture; National Agricultural Statistics Service. 2017 Census of Agriculture: Hawai‘i State and County Data. 2019. Available online: https://www.nass.usda.gov/Publications/AgCensus/2017/Online_Resources/County_Profiles/Hawaii/ (accessed on 10 January 2026).
- U.S. Department of Agriculture; Economic Research Service (USDA-ERS). Farm Labor. 2022. Available online: https://www.ers.usda.gov/topics/farm-economy/farm-labor/ (accessed on 10 January 2026).
- Sankaran, S.; Khot, L.R.; Espinoza, C.Z.; Jarolmasjed, S.; Sathuvalli, V.R.; Vandemark, G.J.; Miklas, P.N.; Carter, A.H.; Pumphrey, M.O.; Knowles, N.R.; et al. Low-altitude, high-resolution aerial imaging systems for row and field crop phenotyping: A review. Eur. J. Agron. 2015, 70, 112–123. [Google Scholar] [CrossRef] [Scilit]
- Torres-Sanchez, J.; Lopez-Granados, F.; Pena, J.M.; Garcia-Torres, L. An automatic object-based method for optimal thresholding in UAV images: Application for vegetation detection in herbaceous crops. Comput. Electron. Agric. 2015, 114, 43–52. [Google Scholar] [CrossRef] [Scilit]
- Cross, J.V.; Walklate, P.J.; Murray, R.A.; Richardson, G.M. Spray deposits and losses in different-sized apple trees from an axial fan orchard sprayer: Effects of spray liquid flow rate. Crop Prot. 2001, 20, 13–30. [Google Scholar] [CrossRef] [Scilit]
- Fox, R.D.; Derksen, R.C.; Zhu, H.; Brazee, R.D.; Svensson, S.A. A history of air-blast sprayer development and future prospects. Trans. ASABE 2008, 51, 405–410. [Google Scholar] [CrossRef] [Scilit]
- Li, X.; Giles, D.K.; Niederholzer, F.J.; Andaloro, J.T.; Lang, E.B.; Watson, L.J. Evaluation of an unmanned aerial vehicle as a new method of pesticide application for almond crop protection. Pest Manag. Sci. 2020, 77, 527–537. [Google Scholar] [CrossRef] [Scilit] [PubMed]
- Faria, L.O.; Alvarenga, C.B.; Ribeiro, G.M.; Zampiroli, R.; Carvalho, F.J.; Barbosa, D.P.L.; Lopes, L.L.; Cunha, J.P.A.R.; Rinaldi, P.C.N. Droplet deposition and transfer in coffee cultivation under different spray rates and nozzle types. AgriEngineering 2025, 7, 337. [Google Scholar] [CrossRef] [Scilit]
- Rahman, M.F.F.; Fan, S.; Zhang, Y.; Chen, L. A comparative study on application of unmanned aerial vehicle systems in agriculture. Agriculture 2021, 11, 22. [Google Scholar] [CrossRef] [Scilit]
- Calderone, G.; Ferro, M.V.; Catania, P. A systematic literature review on recent unmanned aerial spraying systems applications in orchards. Smart Agric. Technol. 2025, 10, 100708. [Google Scholar] [CrossRef] [Scilit]
- Chen, P.; Douzals, J.P.; Lan, Y.; Cotteux, E.; Delpuech, X.; Pouxviel, G.; Zhan, Y. Characteristics of unmanned aerial spraying systems and related spray drift: A review. Front. Plant Sci. 2022, 13, 870956. [Google Scholar] [CrossRef] [Scilit] [PubMed]
- Gatkal, N.R.; Nalawade Sachin, M.; Bhanage Girishkumar, B.; Sahni Ramesh, K.; Walunj Avdhoot, A.; Kadam Pravin, B.; Ali, M. Review of UAVs for efficient agrochemical spray application. Int. J. Agric. Biol. Eng. 2025, 18, 1–9. [Google Scholar] [CrossRef] [Scilit]
- Cunha, J.P.A.R.D.; Lopes, L.D.L.; Alvarenga, C.B.D. Chemical control of coffee berry borer using unmanned aerial vehicle under different operating conditions. AgriEngineering 2024, 6, 1639–1648. [Google Scholar] [CrossRef] [Scilit]
- Silva, J.E.; Batista da Silva, W.H.; Ferraz, M.A.J.; Menezes, E.A.S.; Costa, O.P.; Inacio, F.D.; Barboza, T.O.C.; Melo, C.A.D.; Carvalho, G.R.; Santos, A.F. Impact of spray volume and flight speed on the efficiency of drone applications in coffee plants of different ages. Smart Agric. Technol. 2024, 9, 100694. [Google Scholar] [CrossRef] [Scilit]
- Marques Filho, A.C.; Santana, L.S.; Ferraz, G.A.e.S.; de Oliveria Faria, R.; Saka, A.J.; da Silva, J.M.; Santana, M.S.; Rafael, H.C.; Evaristo, A.B.; Silva, S.M.; et al. Remotely piloted aircraft spraying in coffee cultivation: Effects of two spraying systems on drop deposition. AgriEngineering 2025, 7, 379. [Google Scholar] [CrossRef] [Scilit]
- Hewitt, A.J. Spray drift: Impact of requirements to protect the environment. Crop Prot. 2000, 19, 623–627. [Google Scholar] [CrossRef] [Scilit]
- ASABE Standard S572.1; Spray Nozzle Classification by Droplet Spectra. American Society of Agricultural and Biological Engineers: St. Joseph, MI, USA, 2009.
- R Core Team. R: A Language and Environment for Statistical Computing; R Foundation for Statistical Computing: Vienna, Austria, 2024; Available online: https://www.R-project.org/ (accessed on 20 March 2024).
- Brooks, M.E.; Kristensen, K.; van Benthem, K.J.; Magnusson, A.; Berg, C.W.; Nielsen, A.; Skaug, H.J.; Machler, M.; Bolker, B.M. glmmTMB balances speed and flexibility among packages for zero-inflated generalized linear mixed modeling. R J. 2017, 9, 378–400. [Google Scholar] [CrossRef] [Scilit]
- Hartig, F. DHARMa: Residual Diagnostics for Hierarchical (Multi-Level/Mixed) Regression Models. R Package v. 0.4.7. 2024. Available online: https://CRAN.R-project.org/package=DHARMa (accessed on 15 April 2026).
- Lenth, R.V. Emmeans: Estimated Marginal Means, Aka Least-Squares Means. R. Package v. 1.10.6. 2024. Available online: https://CRAN.R-project.org/package=emmeans (accessed on 15 April 2026).
- Zhang, C.; Kovacs, J.M. The application of small unmanned aerial systems for precision agriculture: A review. Precis. Agric. 2012, 13, 693–712. [Google Scholar] [CrossRef] [Scilit]
- Qin, W.; Qiu, B.; Xue, X.; Chen, C.; Xu, Z.; Zhou, Q. Droplet deposition and control effects of insecticides sprayed with an unmanned aerial vehicle against plant hoppers. Crop Prot. 2016, 85, 79–88. [Google Scholar] [CrossRef] [Scilit]
- Richardson, B.; Newton, M. Spray deposition within plant canopies. N. Z. Plant Prot. 2000, 53, 248–252. [Google Scholar] [CrossRef] [Scilit][Green Version]
- Ahmad, F.; Qiu, B.; Dong, X.; Ma, J.; Huang, X.; Ahmed, S.; Chandio, F.A. Effect of operational parameters of UAV sprayer on spray deposition pattern in target and off-target zones during outer field weed control application. Comput. Electr. Agric. 2020, 172, 105350. [Google Scholar] [CrossRef] [Scilit]
- Safaeinezhad, M.; Ghasemi-Nejad-Raeini, M.; Taki, M. Performance evaluation of spraying drones compared to boom sprayers for spray applications. Sci. Rep. 2025, 15, 41521. [Google Scholar] [CrossRef] [Scilit] [PubMed]
- Crause, D.H.; Vitória, E.L.D.; Ribeiro, L.F.O.; Ferreira, F.D.A.; Lan, Y.; Chen, P. Droplet Deposition of Leaf Fertilizers Applied by an Unmanned Aerial Vehicle in Coffea Canephora Plants. Agronomy 2023, 13, 1506. [Google Scholar] [CrossRef] [Scilit]
- Felkers, E.; Kuster, C.J.; Hamacher, G.; Anft, T.; Kohler, M. Pesticide exposure of operators during mixing and loading a drone: Towards a stratified exposure assessment. Pest Manag. Sci. 2026, 82, 7218–7224. [Google Scholar] [CrossRef] [Scilit] [PubMed]
- Faiçal, B.S.; Costa, F.G.; Pessin, G.; Ueyama, J.; Freitas, H.; Colombo, A.; Villas, L.A.; Osório, F.S.; Vargas, P.A.; Braun, T. The use of unmanned aerial vehicles and wireless sensor networks for spraying pesticides. J. Syst. Archit. 2014, 60, 393–404. [Google Scholar] [CrossRef] [Scilit]
- Huang, Y.; Thomson, S.J.; Hoffmann, W.C.; Lan, Y.; Fritz, B.K. Development and prospect of unmanned aerial vehicle technologies for agricultural production management. Int. J. Agric. Biol. Eng. 2013, 6, 1–10. [Google Scholar]

Disclaimer/Publisher’s Note: The statements, opinions and data contained in all publications are solely those of the individual author(s) and contributor(s) and not of MDPI and/or the editor(s). MDPI and/or the editor(s) disclaim responsibility for any injury to people or property resulting from any ideas, methods, instructions or products referred to in the content. |
© 2026 by the authors. Licensee MDPI, Basel, Switzerland. This article is an open access article distributed under the terms and conditions of the Creative Commons Attribution (CC BY) license.