Article

Scaling Vertically Integrated Agrivoltaic Systems: A GIS-Based Assessment of Energy Production and Power Grid Integration


by
Baltasar Miras-Cabrera
1,
Adela Ramos-Escudero
1,2,
Carlos Toledo
1,3 and
Javier Padilla
1,*
1
Department of Applied Physics, Universidad Politécnica de Cartagena, Member of European University of Technology EUT+, Campus Muralla del Mar, 30202 Cartagena, Spain
2
Water Management Department, Faculty of Civil Engineering and Geosciences, Technical University of Delft, Stevinweg 1, 2600 GA Delft, The Netherlands
3
Instituto Murciano de Investigación y Desarrollo Agrario y Alimentario (IMIDA), C/Mayor s/n, La Alberca, 30150 Murcia, Spain
*
Author to whom correspondence should be addressed.
AgriEngineering 2026, 8(6), 200; https://doi.org/10.3390/agriengineering8060200
Submission received: 6 March 2026 / Revised: 13 May 2026 / Accepted: 18 May 2026 / Published: 22 May 2026
(This article belongs to the Special Issue Solar Energy Integration into Controlled-Environment Agriculture)

Abstract

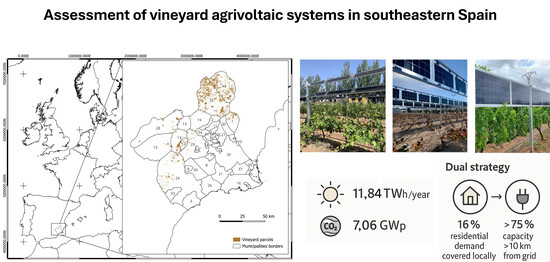
The rapid expansion of solar photovoltaics is intensifying competition for land and highlighting the need for scalable energy solutions that can be integrated into existing power systems without displacing agricultural activity. Once the technical and agronomic viability of agrivoltaic configurations has been demonstrated at field scale, a critical next step toward their market consolidation is the assessment of their deployment potential at regional scales from an energy systems and grid integration perspective. This study presents a GIS-based framework to evaluate the large-scale implementation of vertically integrated agrivoltaic systems, using vineyard landscapes in the Region of Murcia (southeastern Spain) as a representative case study. The analysis combines high-resolution land-use data, crop distribution, regulatory constraints on grid connection distances, and existing electrical infrastructure to quantify installable capacity, energy production, self-consumption potential, and grid accessibility. Results indicate that vertically mounted bifacial PV systems could reach up to 7.06 GWp, generating approximately 11.84 TWh/year, while revealing a pronounced spatial mismatch between optimal agrivoltaic production sites and current grid connection points. This distance-dependent distribution highlights the need for differentiated deployment strategies, balancing local self-consumption, grid reinforcement, and centralized injection. Beyond the specific case examined, the proposed approach provides a transferable framework for energy system planning, supporting grid-aware agrivoltaic deployment in diverse regions and regulatory contexts.

Graphical Abstract

1. Introduction

Solar photovoltaics (PV) is playing a fundamental role in the transition of the energy sector towards renewable energy sources. By the end of 2023, PV accounted for 37% of global renewable installed capacity, reaching the terawatt scale in 2022 [1]. Continued growth in the solar energy sector is expected in the coming decades, driven by policy initiatives aimed at achieving climate targets, creating affordable electricity, and ensuring energy independence. In Europe, the EU solar energy strategy, which is part of the REPowerEU Plan, aims to install more than 400 GW (320 GW-ac) by 2025 and almost 750 GW (600 GW-ac) by 2030 [2]. To meet the EU 2025 target, installed capacity must increase at a rate of 70 GW per year (+22% over 2023).
This context defines a scenario of rapid deployment of PV systems, with the proliferation of large-scale solar power plants (i.e., >50 MWp) due to its economic feasibility, and where energy generation is maximized by land area. While PV systems use significantly less land compared to coal-based fuel cycles for generating electricity [3], the widespread deployment of large centralized projects can lead to trade-offs, such as the displacement of natural ecosystems, competition with land for food production, and alterations to the landscape, which may trigger opposition from local communities [4,5,6].
As a combination of agricultural production and solar energy generation, agrivoltaics (AV) is an interdisciplinary area that helps to mitigate land-use conflicts through innovative designs that match both activities [7]. It optimizes land-use efficiency and enhances agricultural resilience against climate change impacts, particularly in dryland areas threatened by the intensity and frequency of weather extremes such as heatwaves and short, heavy precipitation [8,9]. Recent research also indicates farmers have a positive attitude towards these systems due to their potential economic benefits and yield stability, particularly in the context of weather-related risks [10,11].
In the wine industry, where climate change is significantly affecting both productivity and quality [12], agrivoltaic systems help mitigate these impacts. The shading provided by the PV arrays creates microclimatic conditions that prevent excessive temperatures and reduce soil evapotranspiration, contributing to a more stable environment for grape cultivation [13]. In addition to these potential benefits, other key considerations when implementing these systems include configurations adapted to specific agricultural demands. In this regard, innovative designs that integrate PV into vineyard structures, minimizing land intervention and visual impact while ensuring land-use efficiency, emerge as a viable alternative [14]. The feasibility of this approach can be assessed using geographical information systems (GIS) techniques, which have matured into a powerful tool for guiding decision-making in the spatial deployment of agrivoltaic systems. In this context, the use of GIS is essential, as the feasibility and scalability of agrivoltaic systems are inherently spatial problems. The deployment of vertically integrated PV systems in vineyards depends on the interaction of multiple spatially distributed variables, including parcel geometry, crop distribution, solar potential, and proximity to electrical infrastructure, as demonstrated in recent PV-based territorial planning studies [15]. In addition, GIS enables the integration and analysis of these heterogeneous datasets within a consistent spatial framework, allowing for parcel-level assessments and the identification of realistic deployment pathways at regional scale.

Related Work on GIS-Based Agrivoltaics Assessment

According to the literature, GIS-based agrivoltaics studies generally follow two main approaches: suitability analysis, often integrated with multi-criteria decision-making (MCDM) methods, and the assessment of potential impacts across different domains. Suitability mapping has been conducted in countries such as Italy [16] and Sweden [17], as well as in regions of Turkey [18] and Flanders in northern Belgium [19]. Meanwhile, GIS techniques have been applied to assess the optimal ground cover ratio across Europe [20], financial analyses in Portugal [21], the capacity to meet electricity demand in Canada [22], benefits for small-scale farms in Germany [23], and as a tool for ecosystem recovery in environmentally degraded areas of southeast Spain [15].
Since every crop type and location has a singular requirement, once the technical feasibility of the AV design is assessed, it is crucial to establish a clear reference scenario to quantify its potential impact in the case of widespread adoption. In this sense, a detailed spatial analysis can help to define how scalable the proposed solution is and how it might be applied, beyond the theoretical potential.
This study specifically addresses this question for the vertical integration of AV systems into vineyard trellises [14]. Vertical agrivoltaics refers to configurations in which PV modules are installed in a vertical or near-vertical position (around 90° tilt), aligned with crop rows or support structures rather than deployed as conventional tilted ground-mounted arrays. In the case assessed here, the PV modules are integrated directly into the vineyard trellis structure in the Region of Murcia (southeastern Spain).
The Murcia Region spans approximately 11,300 km2 and is distinguished by its Mediterranean semi-arid climate with average annual rainfall often below 300 mm [24]. These conditions, while contributing to the unique quality of its wines—notably high in phenolic richness and aromatic concentration—also bring significant challenges for viticulture. Higher evapotranspiration rates, the need for supplemental irrigation, and susceptibility to soil erosion are now further exacerbated by climate change. As a result, vineyard management practices are increasingly strained. This, along with multiple other factors, such as limited profitability in the current market context, has contributed to a substantial decline in vineyard area over the last decade. In 2000, the total cultivated area was around 42,000 hectares, whereas today it has decreased to approximately 20,000 hectares, accounting for 1.8% of the region’s total agricultural production [25]. Based on data from the 2023/2024 season, wine production reached approximately 893,000 hl, representing nearly 2.4% of national output [26]. However, these data reflect a 17% decrease compared to the average of the previous five seasons.
The region also faces strong demands to expand renewable energy generation, in line with Spain’s broader decarbonization targets. The availability of high solar irradiation (>1800 kWh/m2 annually [27]) has contributed to the development of utility-scale PV systems, reaching an installed power capacity of 1764 MW in 2024 [28]. At the same time, the agricultural sector remains a pillar of the regional economy, making the Murcia region a well-suited framework for exploring dual-use land strategies.
The aim of this study is to assess the regional deployment potential of vertically integrated agrivoltaic systems in vineyards in the Region of Murcia, considering energy generation, self-consumption potential, and grid connection feasibility through a GIS-based approach. This sector plays an important social and economic role in the region, with more than 20,000 ha [29], including three protected designations of origin (PDO), Jumilla, Yecla, and Bullas, and one protected geographical indication (Vino de la Tierra “Campo de Cartagena”). We provide a comprehensive evaluation of the technical potential, incorporating regional applicability through a GIS-based approach. Our analysis considers key contextual factors, including installation sizes, proximity to the grid, and distribution patterns. This analytical approach contributes to the assessment of AV potentialities by identifying key factors from a practical implementation perspective.
In this context, AV systems represent a promising solution to enhance land-use efficiency and thereby support sustainable agricultural development. However, despite the potential benefits, several challenges must be addressed to enable widespread deployment. Notably, Spain lacks a specific regulatory framework for AV systems, leading to uncertainties in permitting, grid connection procedures, and eligibility for renewable energy incentives. Standardization of design parameters, clearer guidelines for agricultural compatibility, and dedicated support mechanisms could accelerate adoption and de-risk investment for farmers and cooperatives.
In contrast to previous GIS-based agrivoltaic assessments that often remain focused on suitability or aggregated technical potential, the present analysis operates at parcel level and explicitly incorporates grid-related constraints relevant to real deployment pathways.
Beyond estimating theoretical capacity, the analysis is explicitly framed from an energy systems perspective, addressing the conditions required for AV solutions to move toward market-level implementation. In particular, the study examines how grid accessibility, distance to connection points, and existing network capacity shape feasible deployment pathways at regional scale. By identifying spatial mismatches between optimal agrivoltaic production sites and current electrical infrastructure, the proposed approach highlights the need for differentiated strategies combining local self-consumption, grid reinforcement, and centralized injection. Although grounded in a specific crop, configuration, and regulatory context, the methodology is transferable to other regions and agricultural systems, providing a spatially explicit framework to support grid-aware planning, policy design, and future assessments of AV scalability research.
The main contributions of this study can be summarized as follows:
  • A parcel-level GIS-based framework is developed to assess the regional deployment potential of vertically integrated agrivoltaic systems in vineyards.
  • Installable capacity and annual electricity generation are quantified for vineyard parcels in the Region of Murcia under a vertically mounted bifacial PV configuration.
  • Implementation-oriented constraints are explicitly incorporated, including self-consumption potential, proximity to residential demand, grid accessibility, distance to connection points, and available substation capacity.
  • A transferable spatial methodology is proposed to support grid-aware agrivoltaic planning in other agricultural and regional contexts.

2. Materials and Methods

2.1. GIS Data Collection

The main database used for this analysis was the SIGPAC (Geographic Information System for Agricultural Parcels of Spain [30]). SIGPAC allows the geographical identification of parcels declared by farmers and livestock breeders under any aid scheme related to cultivated land or land used for grazing. The analysis was based on the SIGPAC 2025 dataset, which is updated annually and provides parcel-level vector information for agricultural land. The system is supported by high-resolution orthophotography with a ground sampling distance ranging from approximately 0.25 to 0.50 m, ensuring sub-meter spatial accuracy and a cadastral-scale representation of parcel boundaries.
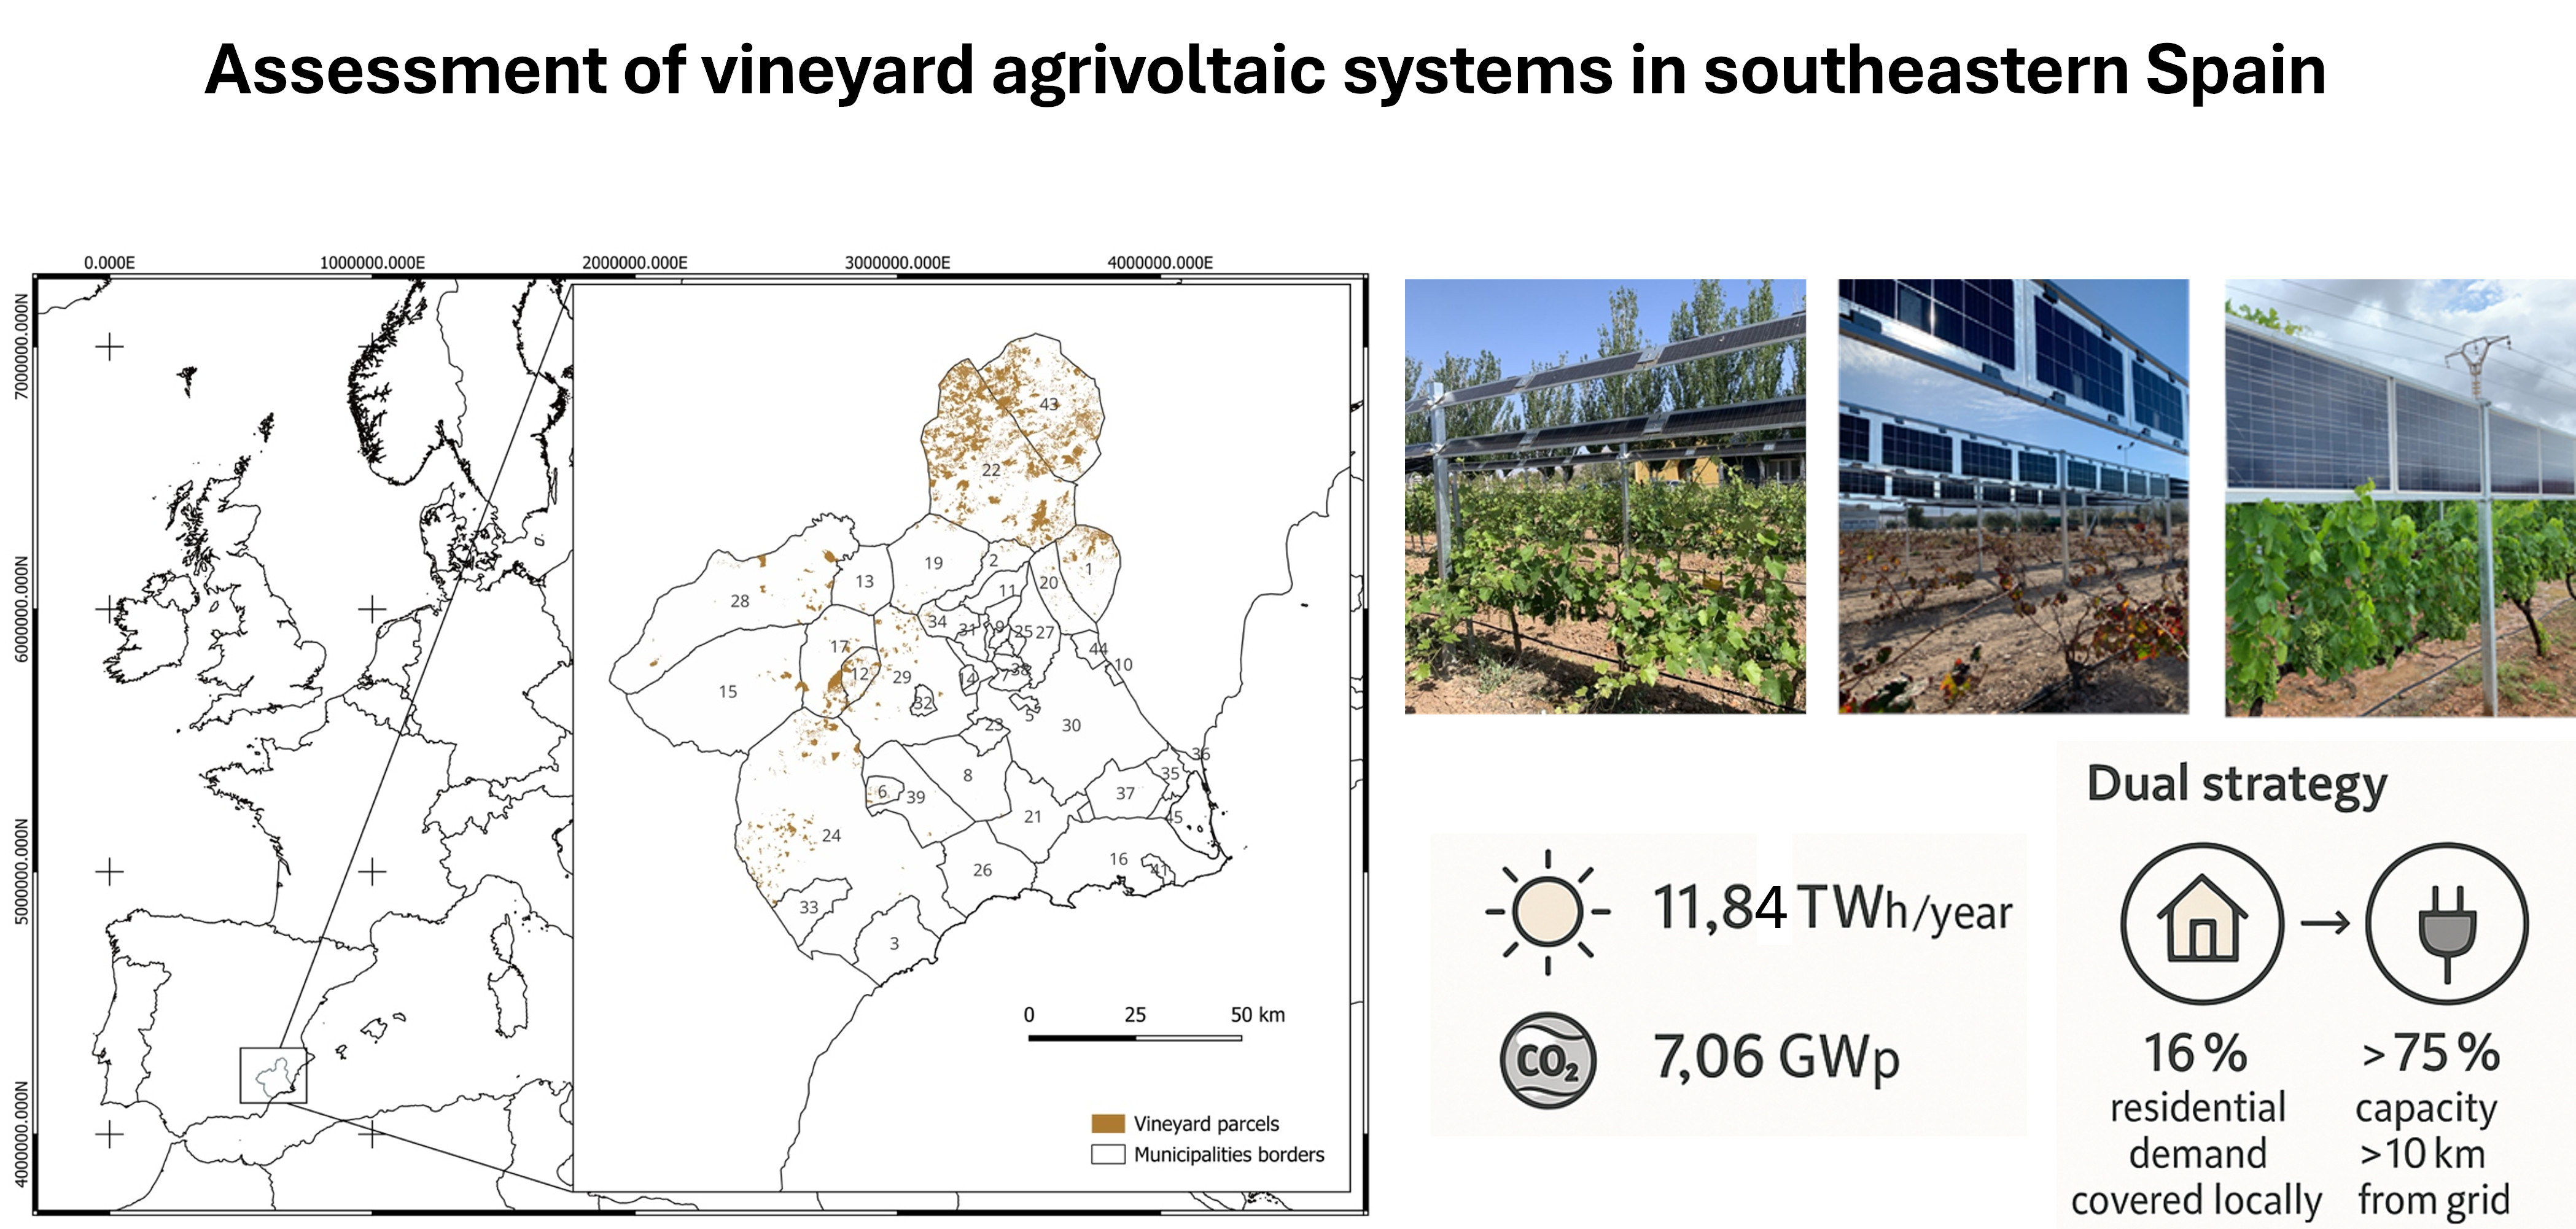
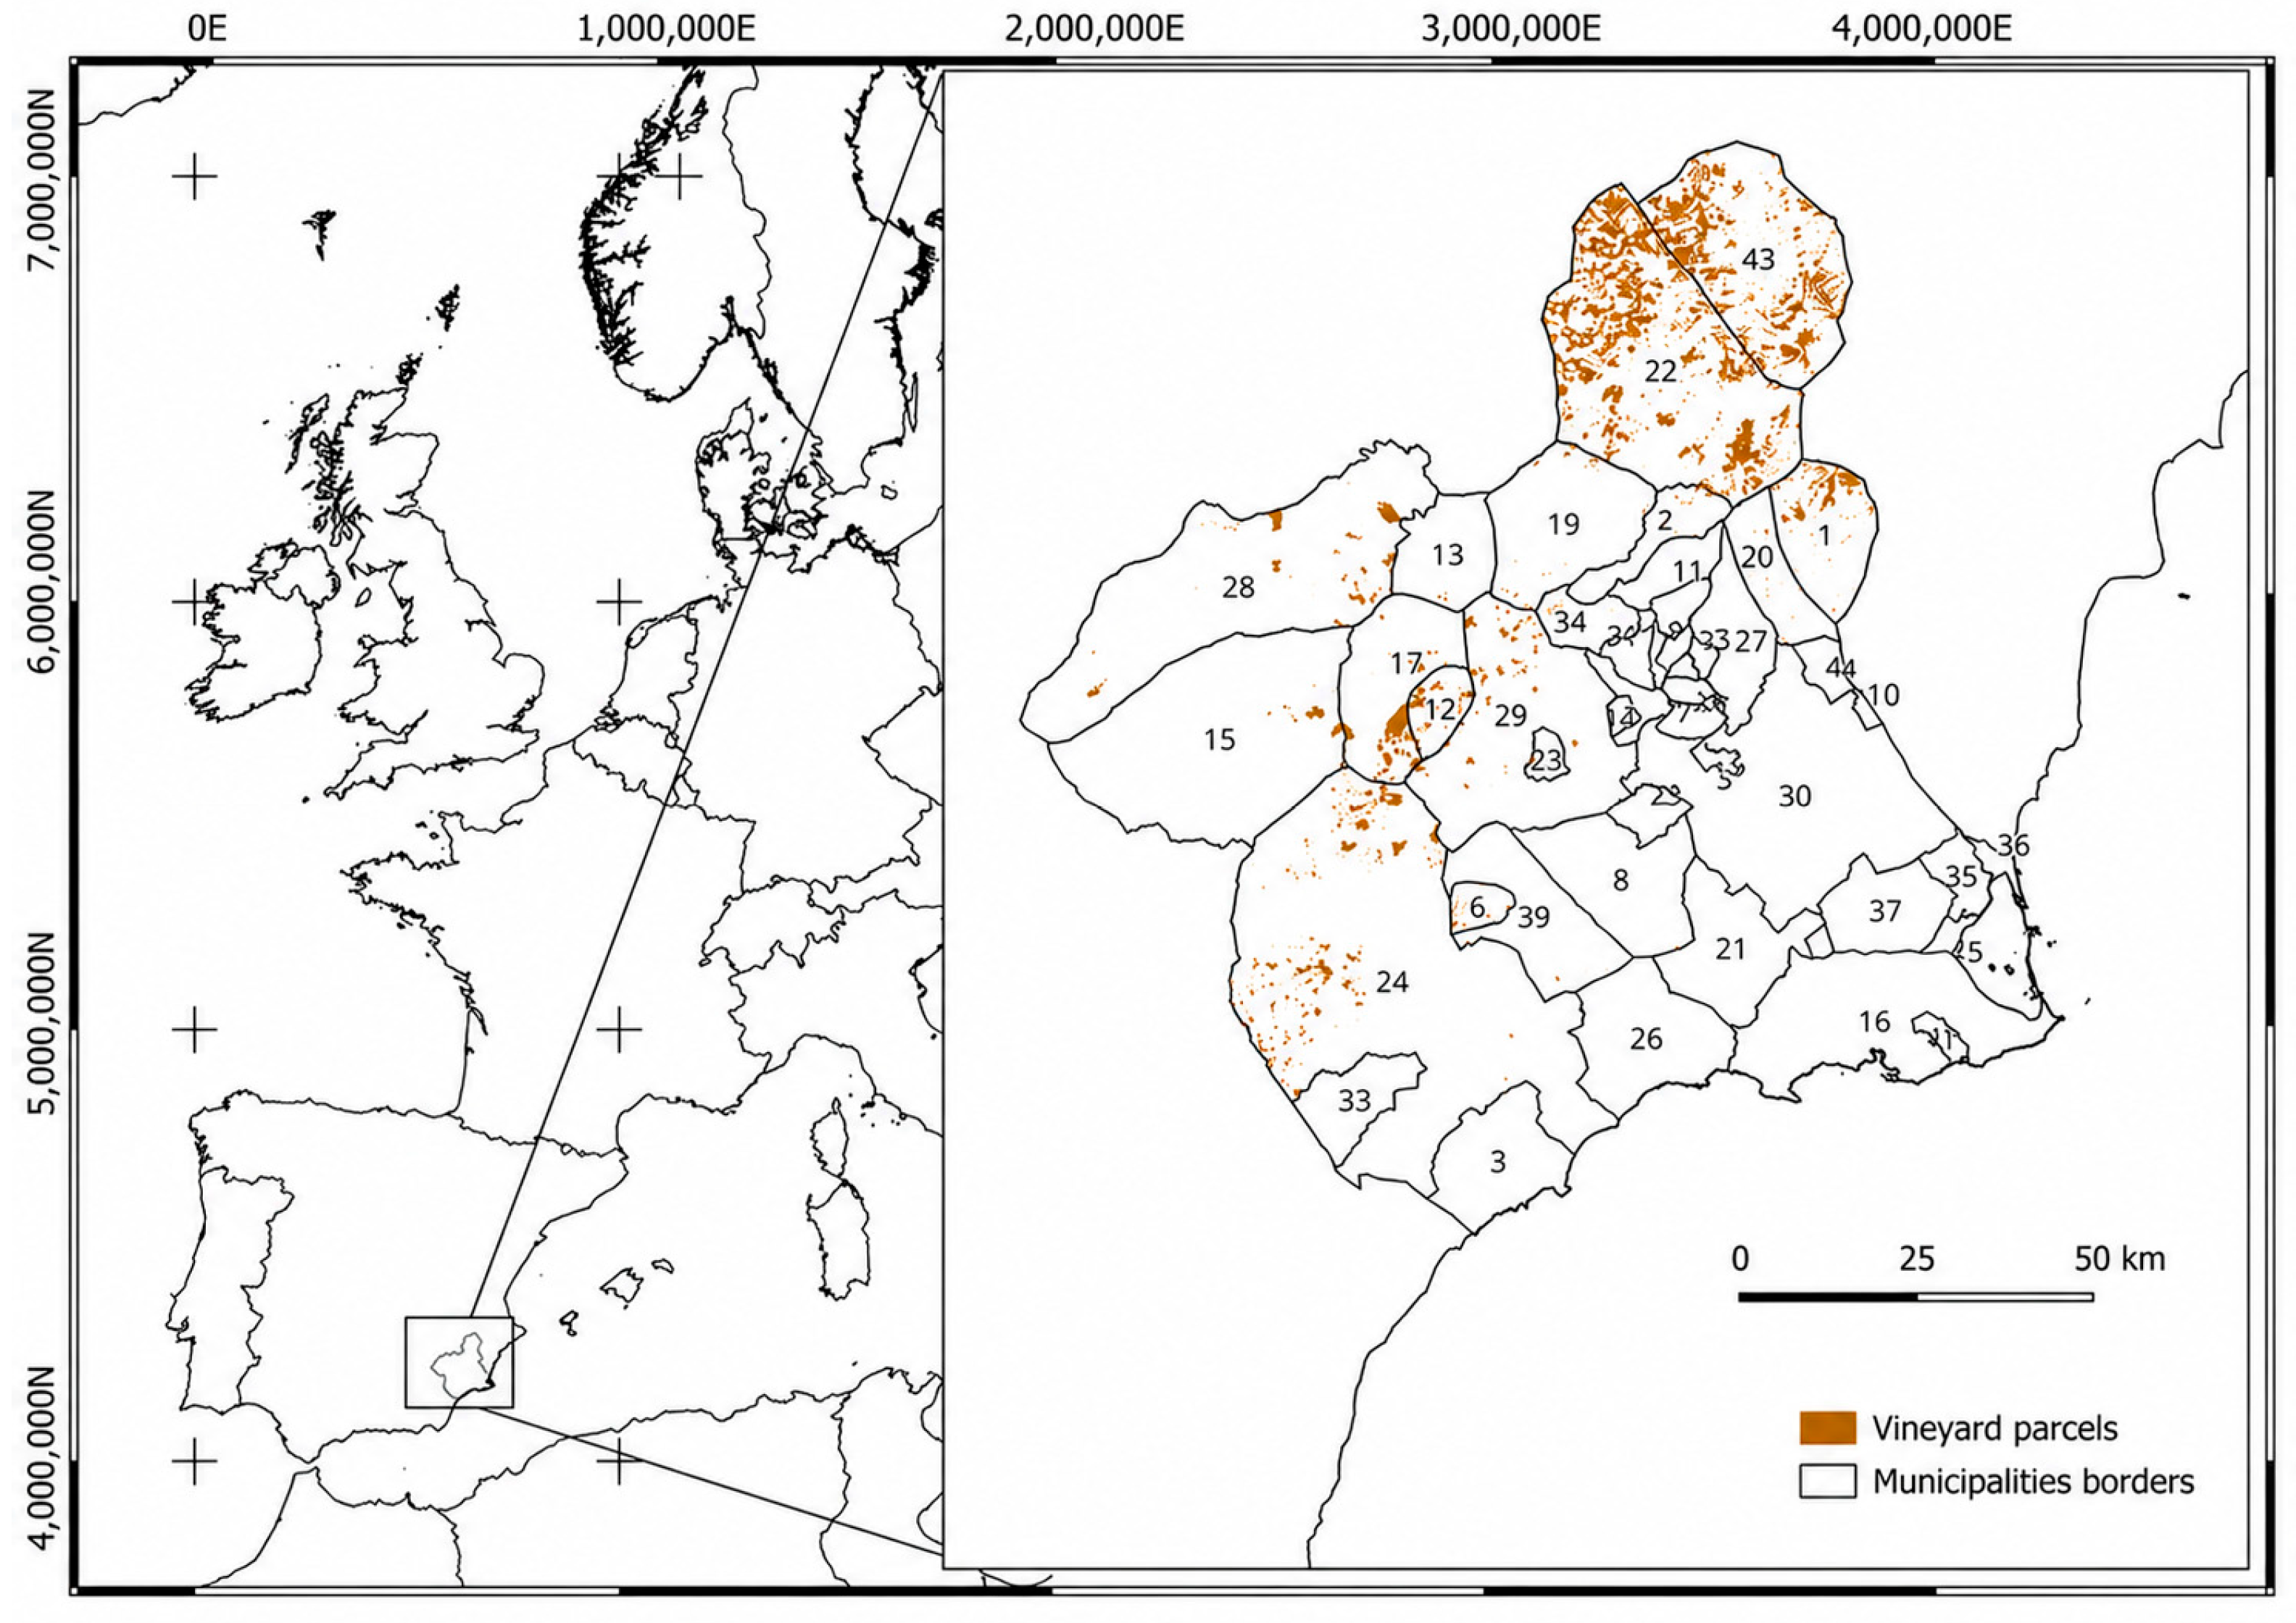
A total of 10,663 vineyard parcels were identified in the Region of Murcia, distributed across its 45 municipalities (see Figure 1). However, the presence of vineyards varies greatly between municipalities, as detailed in Table 1. Jumilla clearly dominates the vineyard sector, accounting for 50% of the total vineyard area in the region. In addition to its extensive surface area, Jumilla also hosts the highest number of vineyard parcels, with over 4500 registered.
Yecla follows with 30% of the vineyard area, while the remaining municipalities contribute far less, ranging from nearly 3% in Abanilla to near zero in Fortuna and Torre-Pacheco.
There is also significant variation in the average size of vineyard parcels across municipalities. Jumilla, Yecla, Mula, Cieza, Puerto Lumbreras, Blanca, Molina de Segura, Ulea and Calasparra have the largest average parcel sizes, each exceeding 2 hectares. Abanilla, Alhama de Murcia, Lorca, Cehegín, Bullas, Mazarrón, Águilas, Abarán, Moratalla, Caravaca de la Cruz, Ricote, Cartagena and Murcia, also show relatively large average sizes, with over 1 hectare per parcel. The remaining municipalities have average vineyard parcel sizes between 0 and 1 hectare.
Additionally, to assess the alignment between AV energy production and residential electricity consumption, a supply–demand analysis was carried out based on data from the Online Cadastral Information Service of Spain [31]. The Spanish Cadastre provides an open-access, georeferenced database that includes detailed records of land parcels and buildings throughout Spain. The dataset contains key attributes such as parcel geometry, land-use classification, and the constructed surface area of each property. This information can be accessed through national web services or downloaded in GIS-compatible formats for spatial analysis. To identify residential areas, the land-use classification field is used to filter properties categorized under residential designations. This allows for the selection of parcels intended for housing, whether single-family or multi-family dwellings. The constructed area field, which indicates the total built surface in square meters, is then used to quantify the size of the residential buildings. This combination of spatial and descriptive data enables researchers to map and analyze the distribution of housing, evaluate residential density, and distinguish between different types of urban and rural development.

2.2. Agrivoltaic System Description

The proposed system (coined ENOVOLTAICS [14]) is conceived as a vertically integrated AV solution in which PV modules are mounted directly above vineyard trellises, using the existing metallic structures as dual-purpose supports for both vine growth and energy generation. This approach minimizes land intervention, visual impact, and installation costs, while ensuring agronomic compatibility and preserving vineyard productivity.
The general architecture proposed consists of vertically oriented PV panels arranged in continuous rows along the trellis lines, occupying the surface delimited between 1.8 and 2.4 m above ground level. This height guarantees minimal interference with vineyard operations, including manual and mechanized harvesting, and ensures sufficient clearance to avoid significant shading on the canopy. These dimensions correspond to a 1.5:1 ratio between inter-row spacing and trellis height, which has been shown to allow full sun exposure of the vines under most seasonal conditions in this latitude.
Shading interactions between adjacent vineyard rows were not modelled as an additional loss term. This is because the deployment scenario is based on the ENOVOLTAICS configuration reported in [14], whose geometry was specifically conceived to avoid significant inter-row shading on the crop. In particular, the height range adopted for PV placement and the inter-row spacing to trellis-height ratio were selected to preserve vineyard operability and maintain full sun exposure of the vines under most seasonal conditions.
Three different vertical configurations were explored in pilot installations, namely vertical monofacial, vertical bifacial and venetian blind-type configurations (details shown in Table 2).
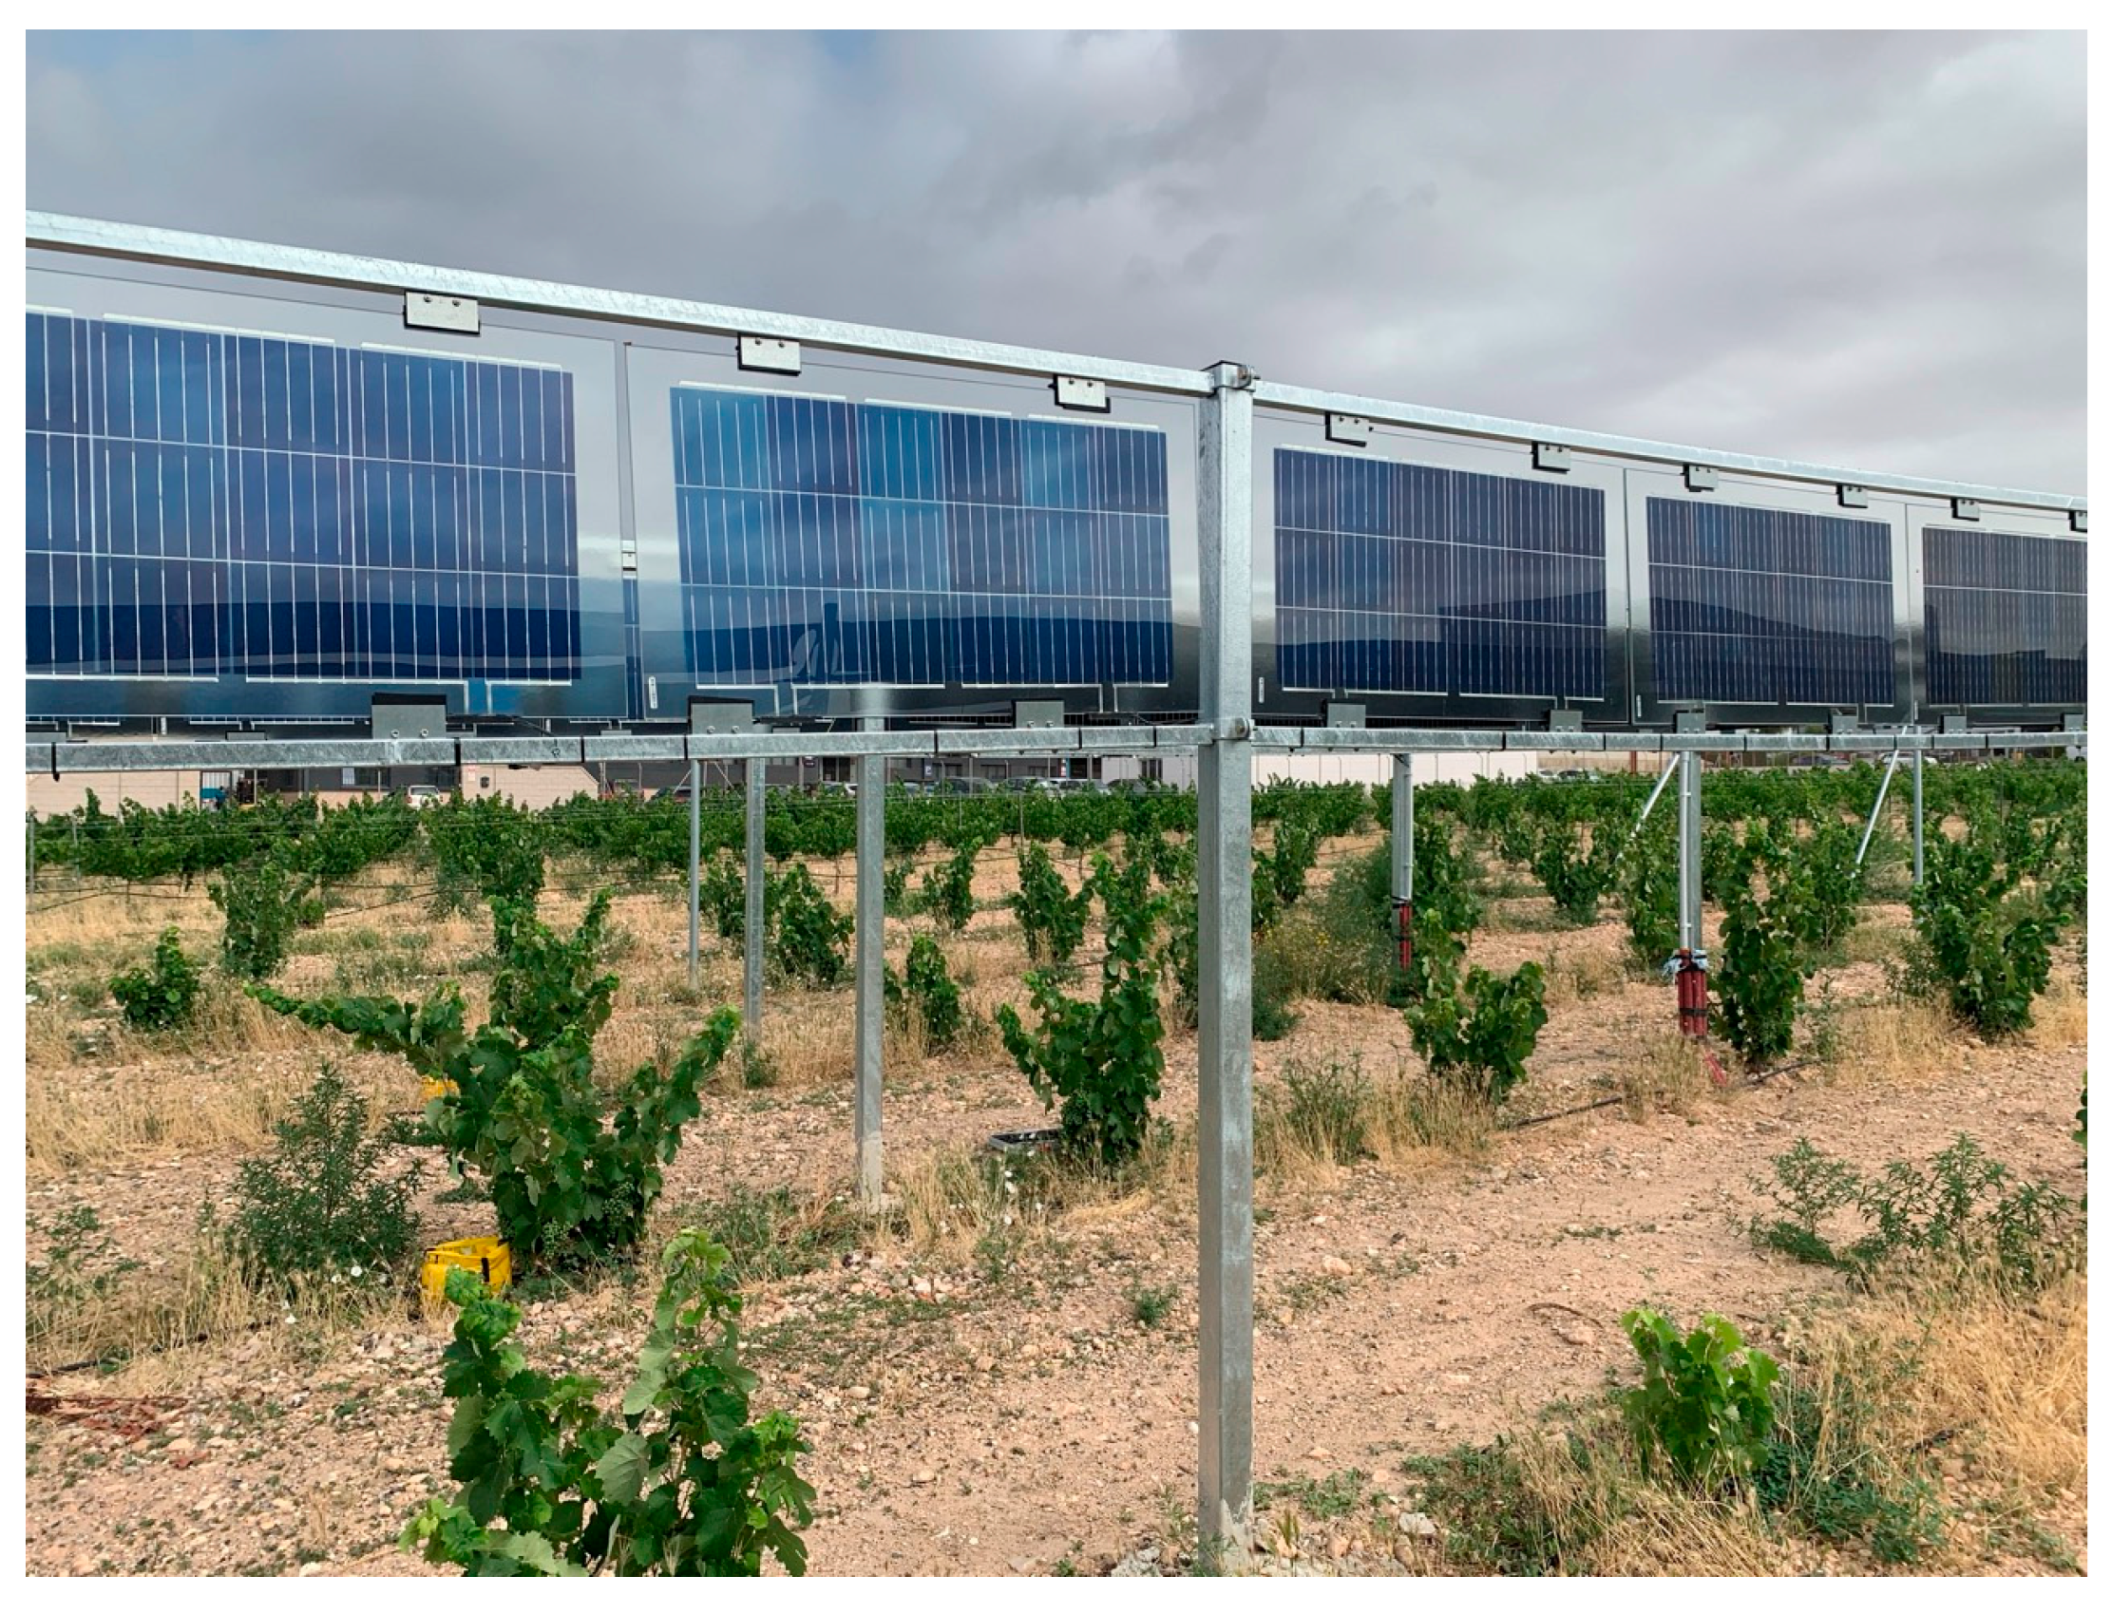
Among them, and in accordance with previously performed simulations [14], the vertical bifacial configuration outperformed the other two by approximately 30% in annual energy production under comparable conditions. Consequently, the vertical bifacial configuration was selected as the most promising layout for the regional deployment scenario assessed in this study (Figure 2).

2.3. Agrivoltaic Energy Generation

The yearly photovoltaic production is estimated using Equation:
E = A · H α , β · y
where
  • E: Annual electricity production (kWh/year);
  • A: Parcel area (m2);
  • H(α,β): Annual specific yield (kWh/kWp) at each location and PV system slope (β, 90º vertical) and surface azimuth (α, 180º south);
  • y: Installed PV capacity per land unit (kWp/m2).
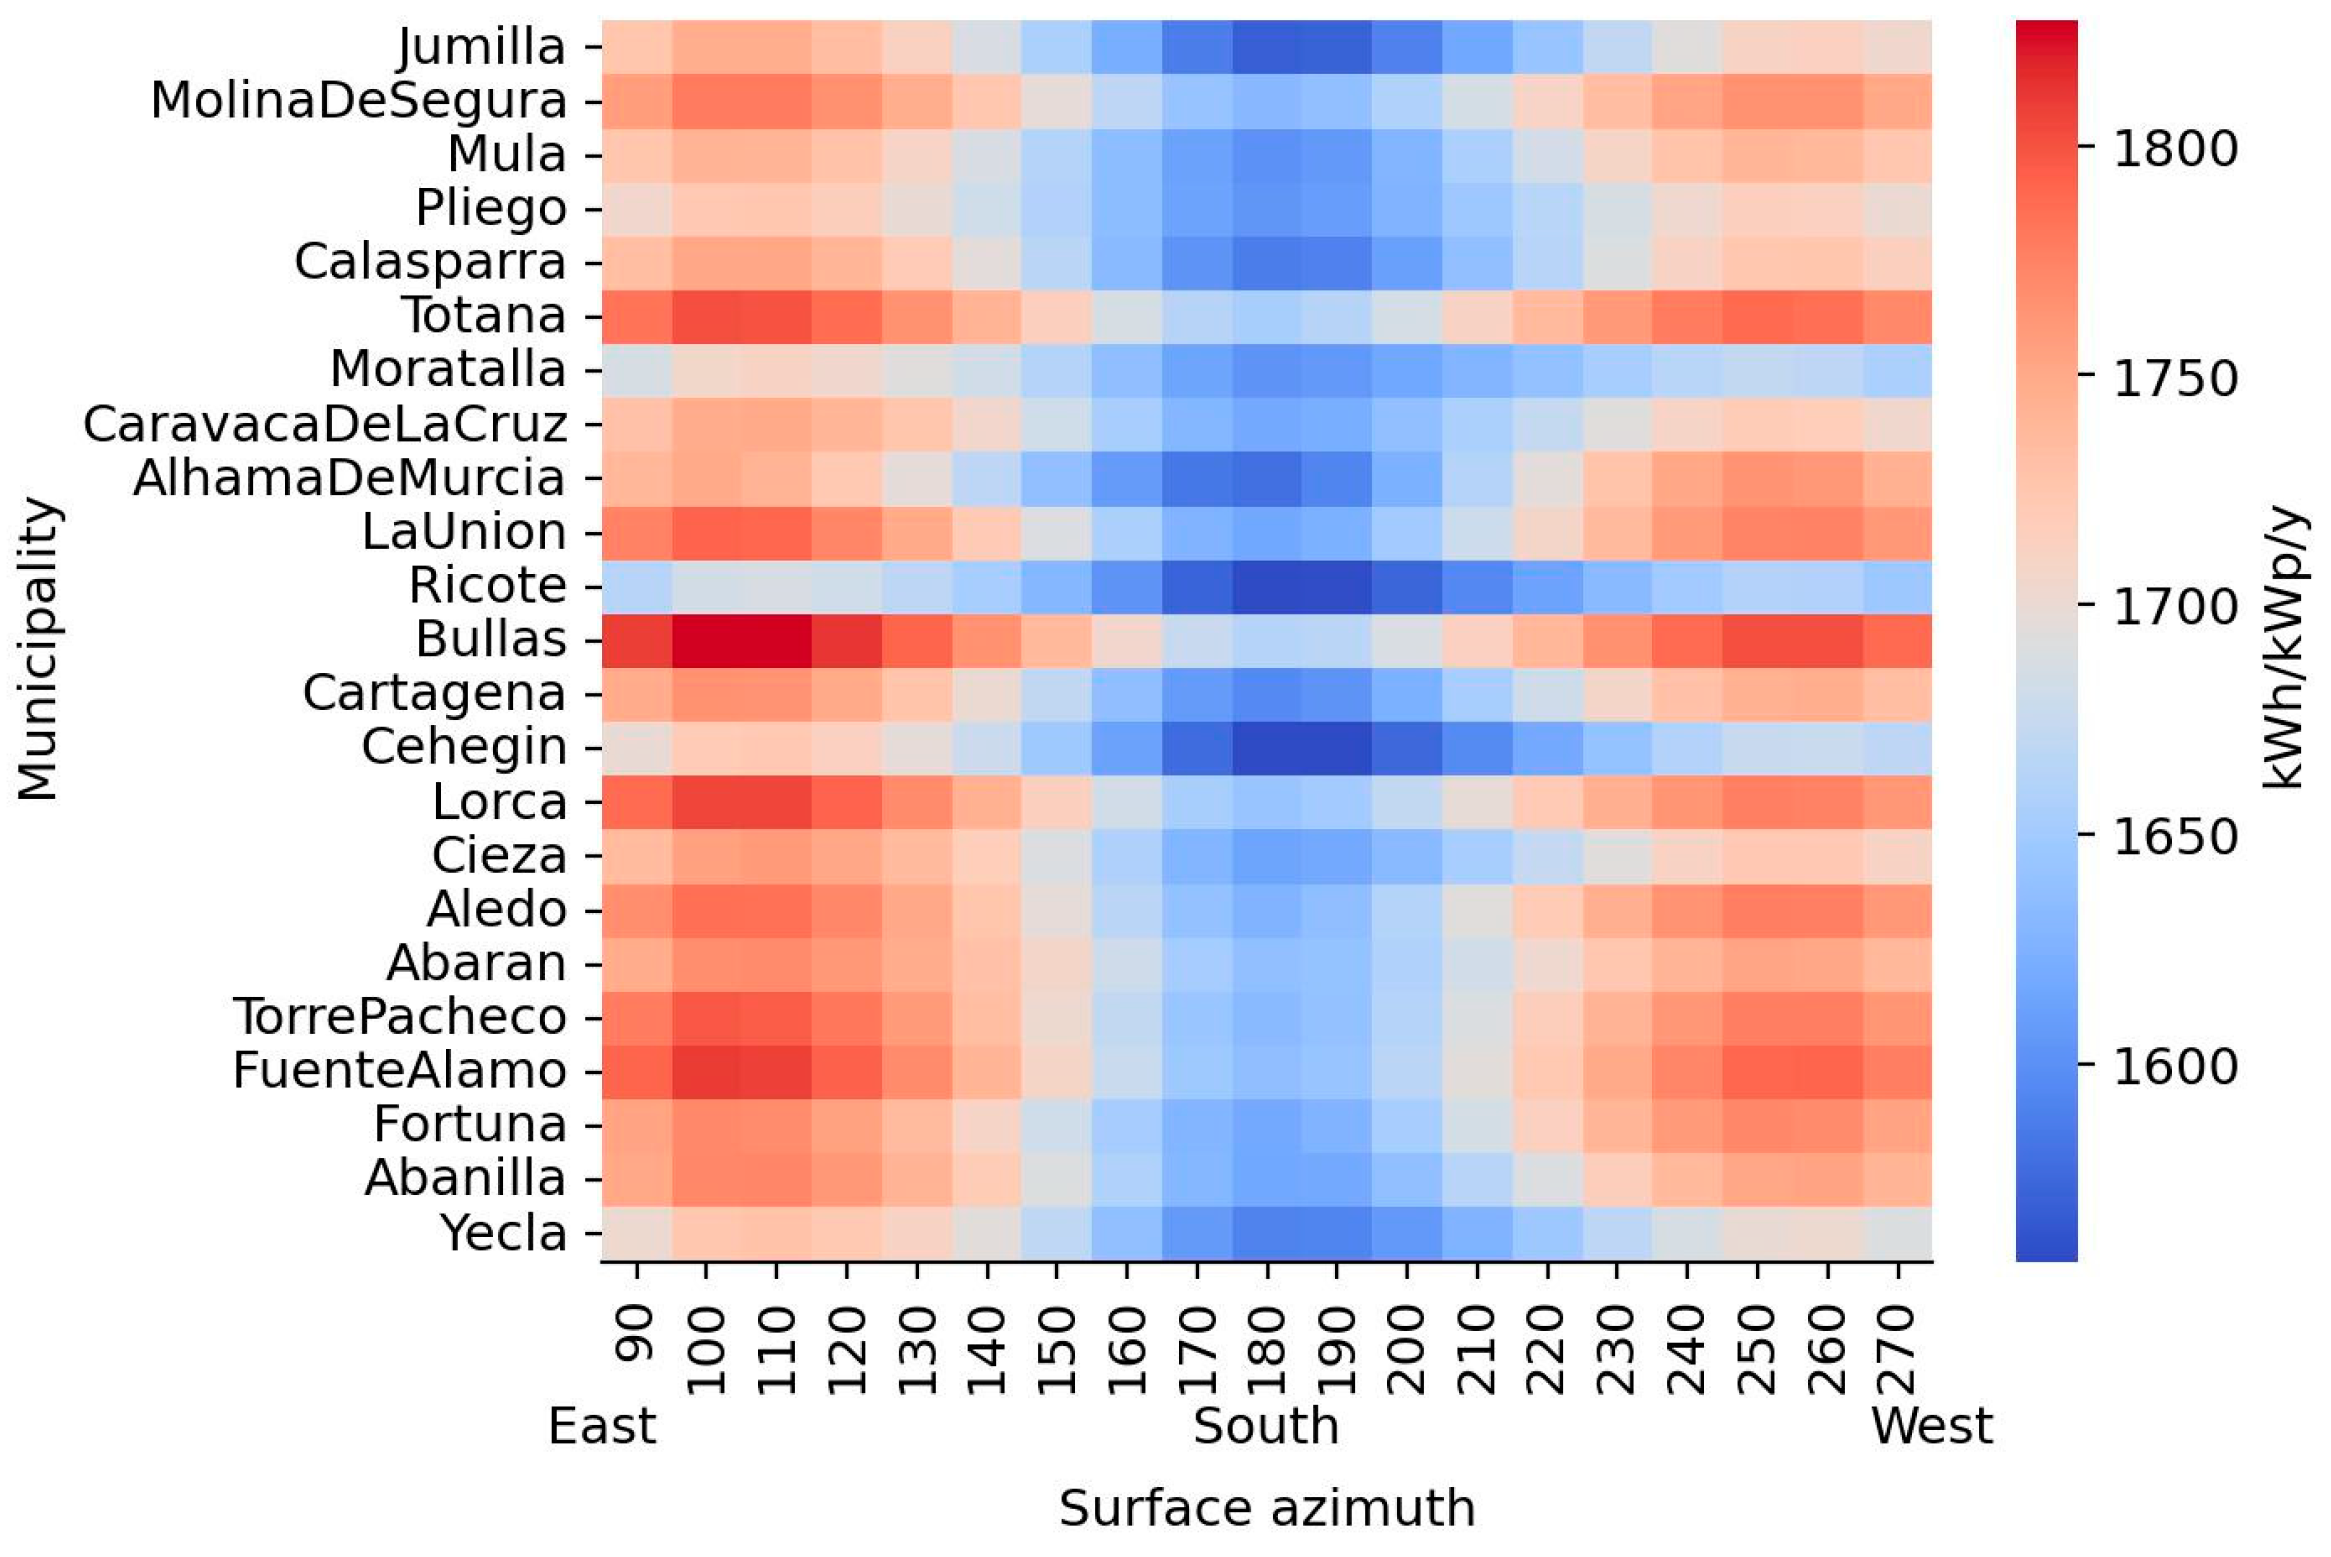
To estimate specific yield, Huld et al. [32]’s model, which considers output power as a function of the module temperature and in-plane irradiance, is used, considering coefficients (K1–K6) for silicon-crystalline PV technology and a bifaciality factor of 0.75. The PV module temperature is estimated using the method proposed by Faiman [33]. The annual in-plane irradiance of each parcel was obtained from the PVGIS TMY database [34] and calculated using the Perez transposition model [35] with the open-source PVLIB-python library [36]. The estimated system losses have been considered to be 14% (performance ratio, PR = 0.86); this value was adopted from the PVGIS [34] recommended “system loss” input, which accounts for generic system losses together with ageing effects, and was considered appropriate for a regional-scale assessment focused on deployment potential rather than detailed PV system design. The installed PV capacity per land unit (y) is set at 0.033 kWp/m2, based on data from the experimental pilot systems (a PV ground-mounted installation is conventionally considered to be 0.1 kWp/m2). Figure 3 presents the annual specific yield (H) for each municipality at different orientation angles (α).
Since the proposed solution is designed to adapt to the existing trellis structure, the orientation of the AV system (directly linked to the energy generation) is determined by the orientation of the vineyard rows. In this sense, the orientation of the vineyards was assumed to correspond to the orientation of the parcels themselves, as derived from the direction of their longest boundary edge. Since parcel-level empirical data on vineyard row direction were not available for the whole study area, and no single orientation rule can be assumed a priori across all vineyards, the longest polygon edge was used as a geometric proxy for row orientation. This should be understood as a first-order approximation rather than a direct measurement, and therefore as a limitation of the study. At the same time, this criterion introduces heterogeneity into the regional-scale assessment and provides a practical way to represent the variability found in real vineyard layouts. To complement this baseline assumption, an idealized optimal-orientation scenario is also presented in Section 3.5. This analysis was performed in a GIS environment. To determine the orientation of each vineyard parcel using only the polygon shapefiles provided by SIGPAC, the following steps were carried out:
  • Polygon Simplification: The Simplify tool was applied to reduce the number of vertices in each parcel polygon. This step helps avoid incorrect identification of parcel orientation due to complex or irregular boundaries, ensuring that the longest side of the polygon is not mistakenly selected if it is distorted by minor indentations or curvature.
  • Geometry Repair: The Repair Geometry tool was then used to fix any topological or structural errors in the simplified polygons, ensuring clean and valid geometry for the following operations.
  • Conversion to Lines: The polygons were converted into their boundary lines using the Polygon to Line tool.
  • Exploding Multipart Features: The resulting line layer was exploded using the Multipart to Singlepart tool to separate individual line segments, allowing for independent analysis of each segment.
  • Longest Edge Selection: For each parcel, the longest boundary line segment was identified. This line was assumed to represent the main direction of the parcel (often aligned with vineyard rows or access paths).
  • Angle Calculation: The orientation (azimuth) of the longest line segment was calculated. To standardize the results, angles were constrained to the 0–180° range, ensuring consistent directional reference regardless of the original digitization direction of the polygon.
As a validation-oriented check, the regional specific yield obtained from the GIS-PVGIS modelling chain was compared with monitored production data from the vertical bifacial ENOVOLTAICS pilot installation. The comparison was carried out on an annual specific-yield basis (kWh/kWp/year), allowing the field-scale pilot and the regional deployment scenario to be compared independently of system size.

2.4. Energy Demand by Residential Sector

Implementation of AV systems is transforming the landscape of energy generation, distribution, management, and consumption. Unlike conventional energy-centric infrastructures, AV systems introduce new challenges and opportunities and open up new business models and implementation scenarios.
In this context and given that certain vineyards are often spatially distributed near peri-urban residential zones, a supply–demand analysis was conducted to evaluate the extent to which the energy produced by AV systems could meet the electricity demand of the residential sector.
The estimation of residential electricity demand was based on cadastral data from the Region of Murcia, using information on the total surface area of residential dwellings and an estimate of average electricity consumption per dwelling. For this purpose, data from the Spanish Institute for the Diversification and Saving of Energy (IDAE) were used. IDAE conducted a nationwide study on residential energy consumption in Spain [37], which provides detailed data disaggregated by climatic zones and housing typologies. This analysis includes electricity consumption figures, enabling the identification of consumption patterns based on geographic location and building type. According to the study, the average household in the Region of Murcia consumes approximately 3487 kWh of electricity per year.
Using a GIS environment, the total surface area of residential buildings was calculated for each municipality and multiplied by the aforementioned average consumption value. This allowed for the estimation of the total annual electricity demand of the residential sector across the municipalities of the Region of Murcia.
To refine the analysis within the framework of local self-consumption, a spatial selection was performed by considering a maximum connection distance of 2 km between the agrivoltaic system and the residential buildings, in accordance with the maximum distance allowed for self-consumption under current Spanish legislation [38]). A radius of 2 km was created around each vineyard parcel with an associated AV system, and this layer was intersected with the residential dwellings layer derived from the cadastral dataset. Only dwellings located within this radius were considered as potentially supplied by the corresponding AV installation. Additionally, an annual electricity consumption value was assigned to each individual dwelling based on the number of residential units recorded in the cadastral database. This allowed for a more detailed estimation of the share of local demand that could be covered under a self-consumption scenario.

2.5. Assessment of Grid Connection Feasibility

In addition to the self-consumption scenario, a second analysis was carried out to explore the potential of grid-connected AV systems. This scenario considers the injection of electricity into the public grid, replacing the existing power supply at each substation with the energy produced by the nearest AV system, up to the maximum capacity allowed by the grid infrastructure. The connection points and available capacity at each substation were obtained from the public access capacity map provided by [39].
This analysis was based on calculating the distance from each AV installation to the closest substations within a predefined maximum connection radius. By applying spatial selection and distance tools, the number of substations accessible to each AV system was identified, depending on their geographic location.
To further support the grid injection scenario analysis, a proximity measurement was performed using the “shortest line between objects” operation in GIS. This tool was used to compute the minimum linear distance between each vineyard parcel and the available grid connection points included in the infrastructure dataset. The resulting distance values allow for evaluating the technical viability of each connection based on spatial criteria and can be used to prioritize parcels for grid injection according to their proximity to the network.
This approach enables the identification of potential grid connection options for each AV system and facilitates the evaluation of overall feasibility at the municipal level. The analysis highlights which municipalities are better positioned in terms of access to electrical infrastructure, providing an initial screening of areas with higher viability for decentralized renewable energy integration.

3. Results

This section presents the spatial and quantitative outputs of the GIS-based modelling of vertical photovoltaic integrated system deployment potential in the Region of Murcia. The analysis focuses on annual energy production, installed power, parcel structure, avoided emissions, and sensitivity to orientation.

3.1. Annual Energy Generation

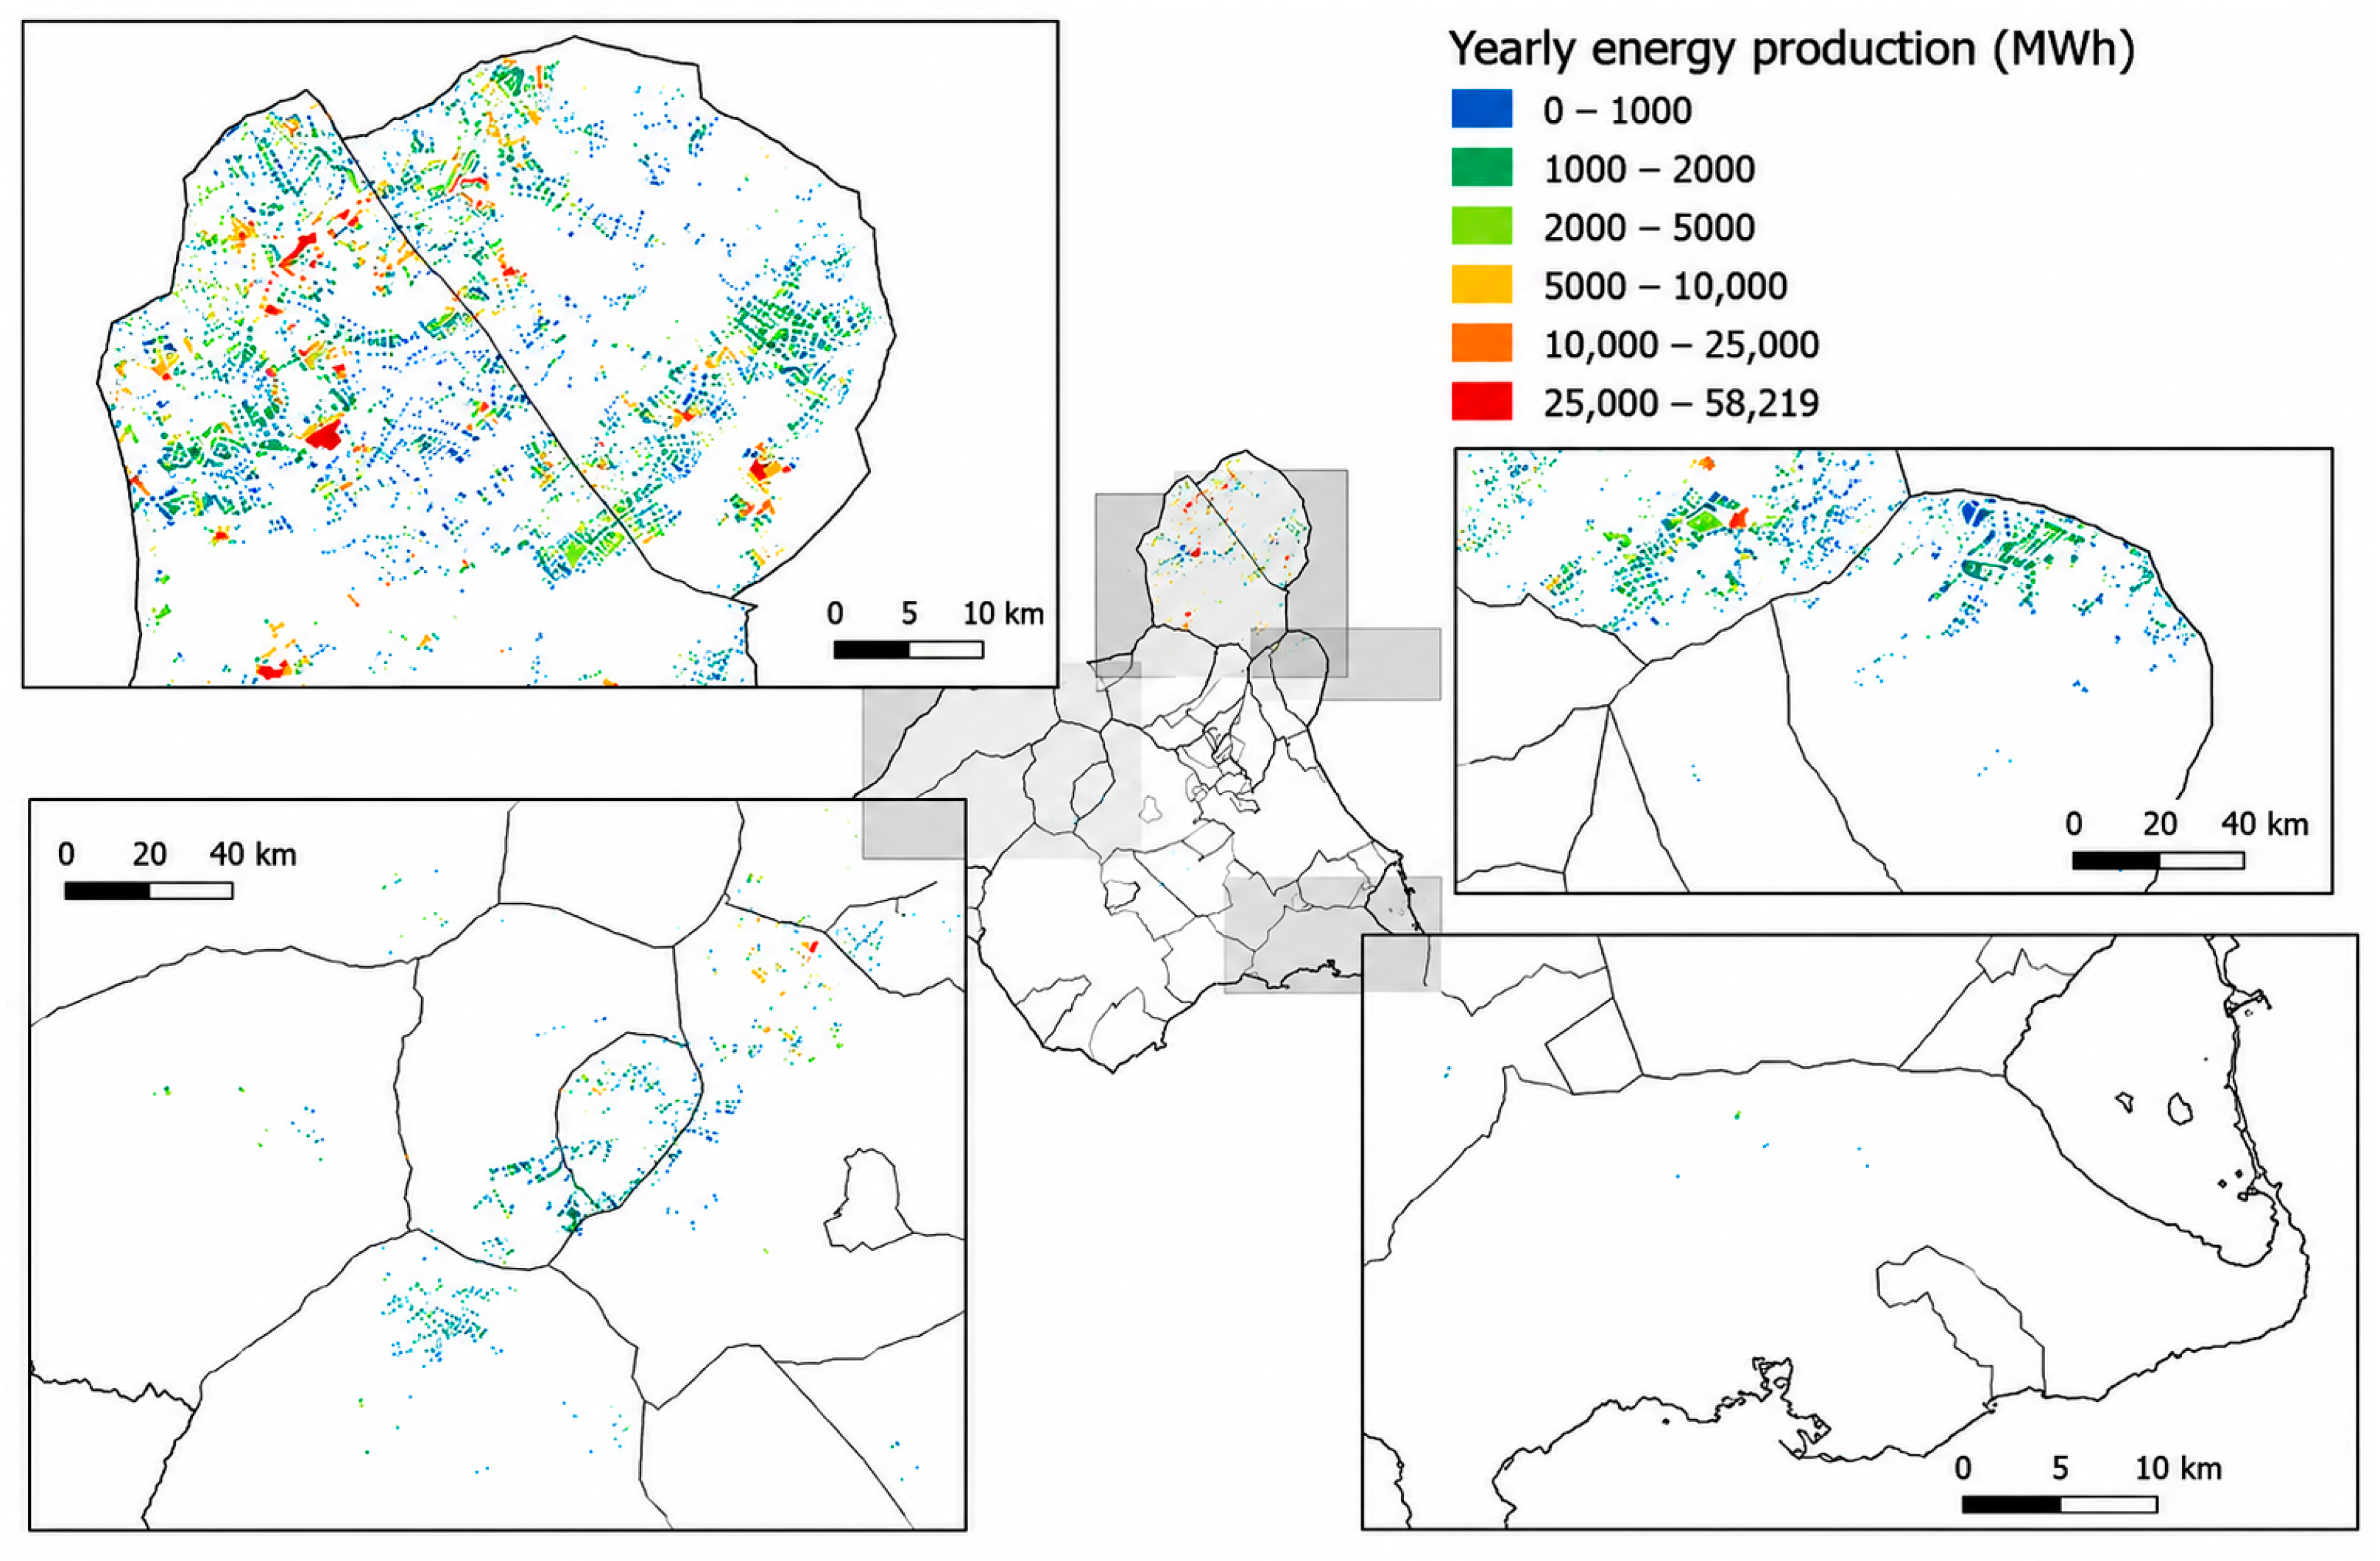
Figure 4 displays the estimated total annual energy generation for each vineyard parcel, expressed in MWh/year. The total estimated annual energy output for the Region of Murcia is estimated at approximately 11.84 TWh/year. The spatial distribution of energy production is highly uneven, with pronounced concentrations in the north quadrant of the region, particularly with area covered by PDO Jumilla and PDO Yecla wine appellations. Prominent clusters are observed in the northeastern part of the region, reflecting the extensive vineyard coverage concentrated in these areas.
Indeed, energy production from agrivoltaic plants is highly concentrated in the Jumilla municipality, which leads by a significant margin, accounting for 51% of the total production with over 5.86 TWh annually, covering 51% of the total surface area of the agrivoltaics surface in the region. Yecla ranks second, contributing 31% of the total, producing around 3.54 TWh/year, followed by Abanilla, accounting for slightly over 3% of both the production and surface. Together, these three municipalities are responsible for approximately 85% of the region’s total agrivoltaic energy production.
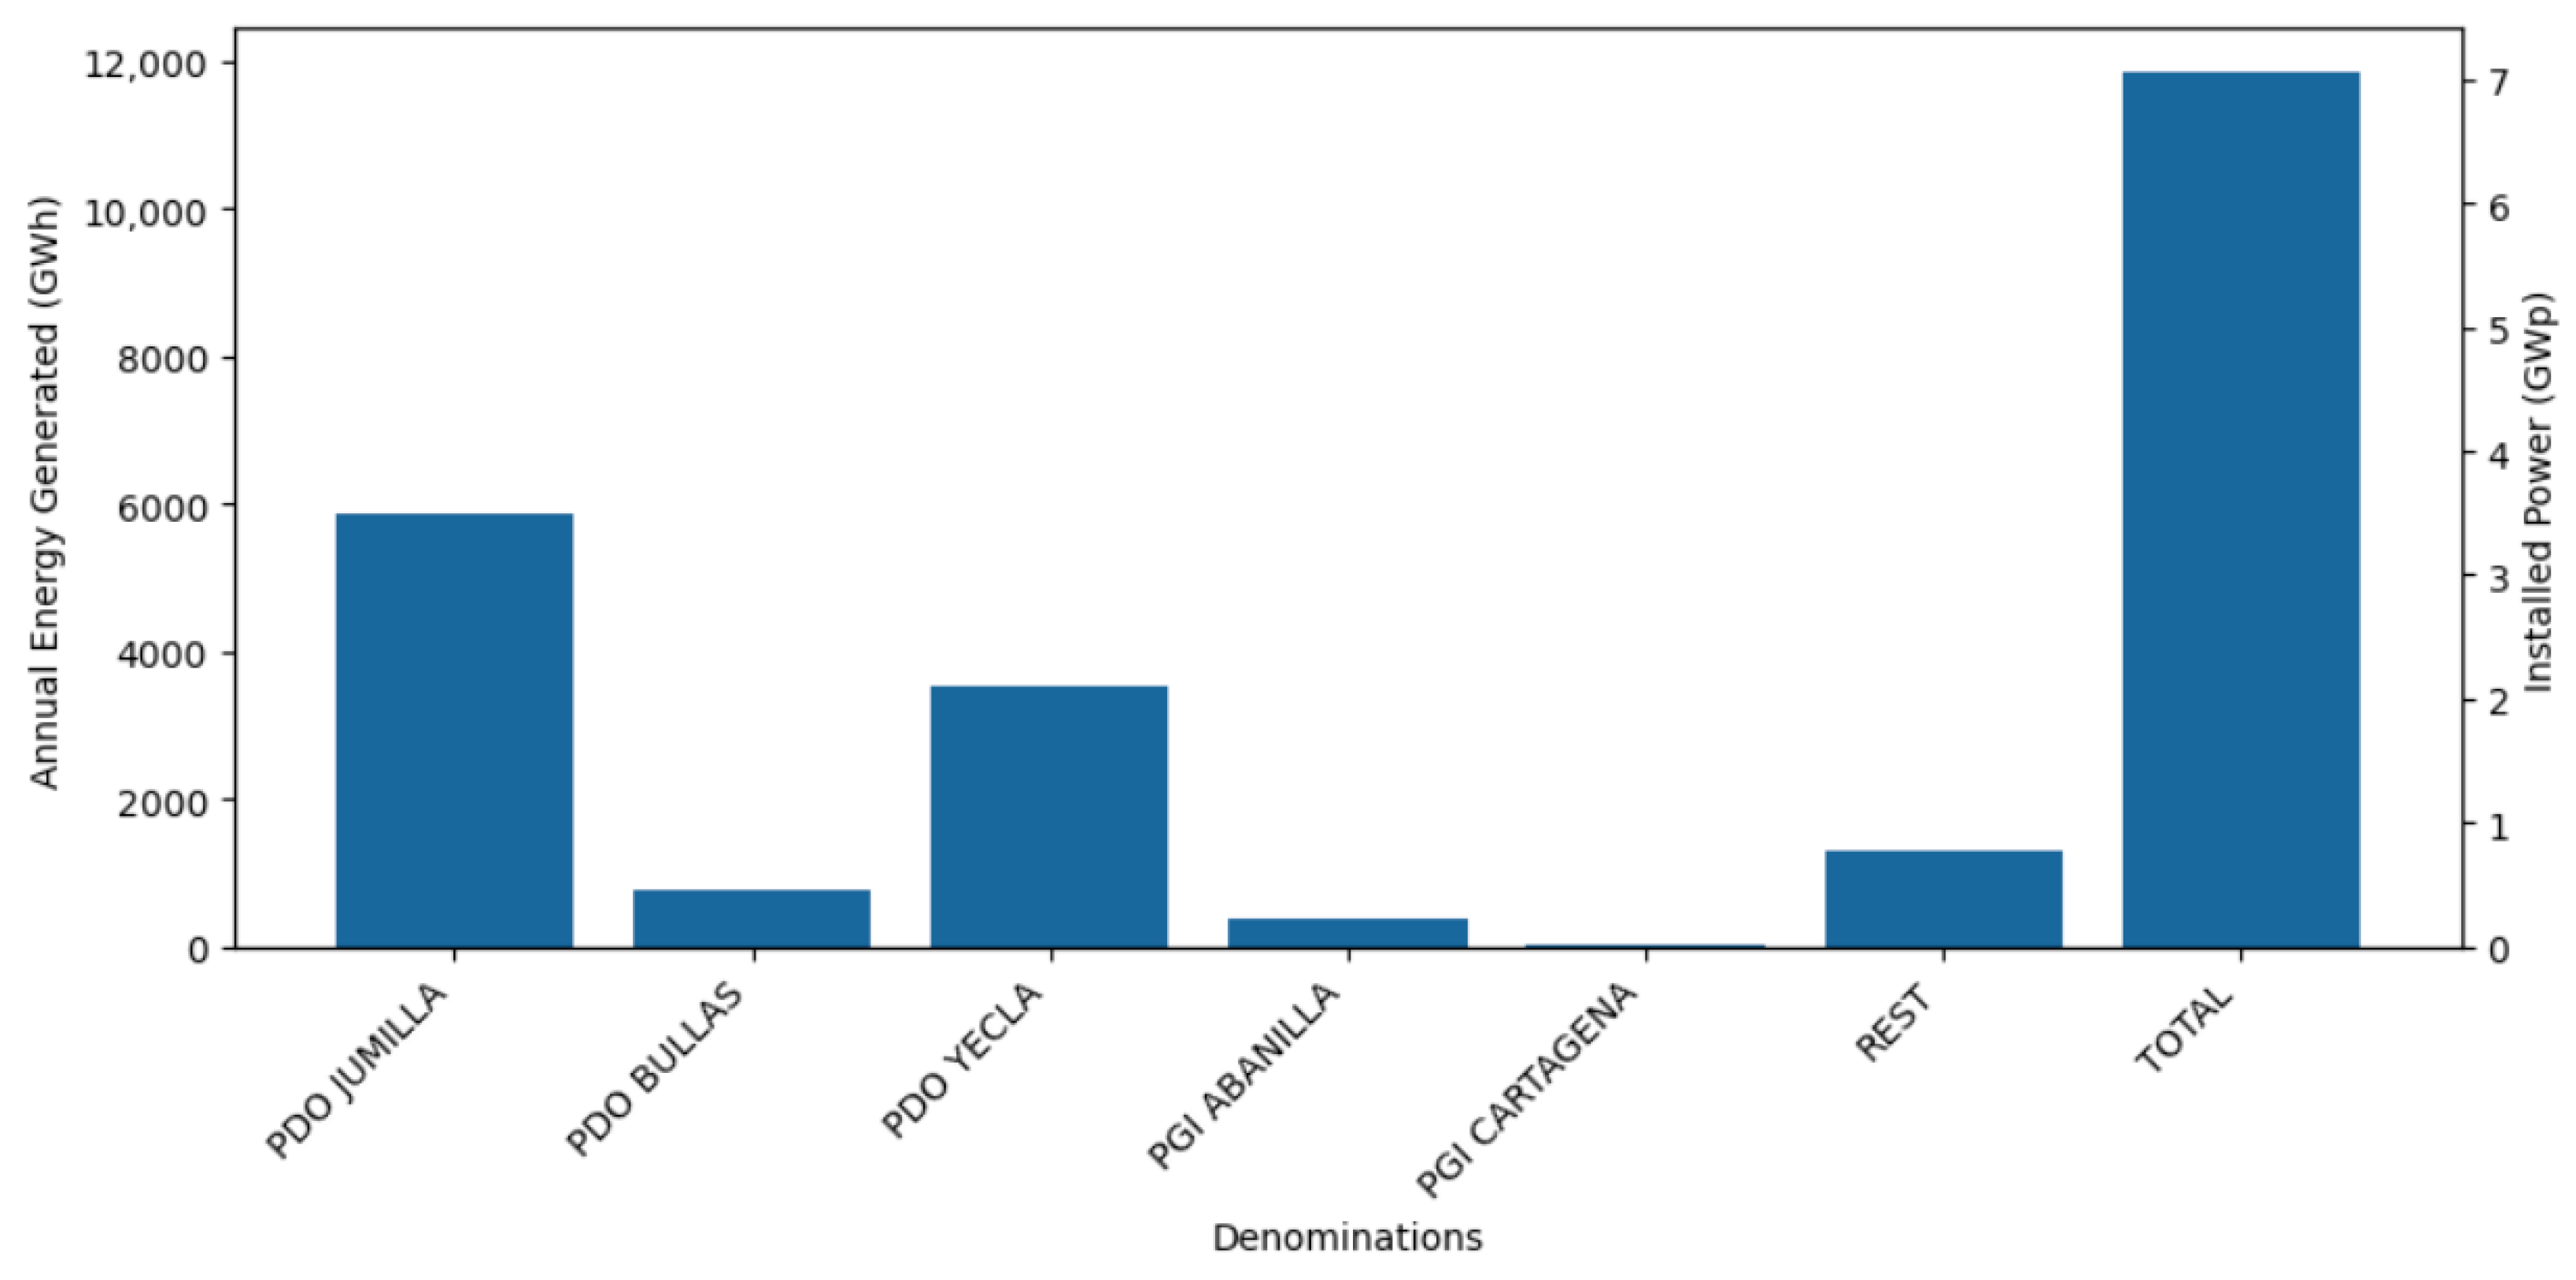
By contrast, the remaining 18 municipalities collectively contribute the remaining 15% of the total energy output and surface area. From the perspective of PDO, the areas with lower energy generation tend to fall outside PDO boundaries. Aggregating energy production by viticultural PDO areas provides a clearer understanding of the association between energy potential and wine-producing regions, as shown in Figure 5.

3.2. Empirical Plausibility Check of PV Yield Estimates

To provide an empirical plausibility check of the PV yield estimates used in the regional assessment, the simulated region-specific yield was compared with monitored production data from the vertical bifacial ENOVOLTAICS pilot installation. This configuration was selected because it is the reference layout adopted for the regional deployment scenario in the present study. The comparison was performed in terms of annual specific yield (kWh/kWp/year), rather than absolute electricity production, in order to make the field-scale pilot data and the regional GIS-based estimate comparable independently of system size.
The regional scenario estimated an annual electricity production of 11.84 TWh/year for a total installed capacity of 7.06 GWp, corresponding to an average specific yield of approximately 1677 kWh/kWp/year. By comparison, the monitored vertical bifacial pilot produced 555,905 kWh/ha/year with an installed capacity density of 338 kWp/ha, corresponding to 1645 kWh/kWp/year. The relative difference between the monitored pilot value and the regional modelled value was approximately 1.9% (Table 3).
This agreement indicates that the PVGIS-based modelling chain used in the regional analysis provides values that are consistent with the order of magnitude observed under real operating conditions in vineyard-integrated PV systems. Therefore, although the present study does not aim to perform a full plant-level calibration of the PV model, the comparison supports the empirical plausibility of the regional PV yield estimates used for the GIS-based deployment assessment.

3.3. Installed Power by Protected Designation of Origin (PDO) Area

Figure 5 presents the aggregate peak power potential by wine-growing region, calculated using a uniform installation density of 0.033 kWp/m2 across vineyard parcels. This value was taken from the ENOVOLTAICS pilot configuration reported in [14] and reflects a design criterion intended to avoid significant shading on the crop canopy. The total capacity for the region reaches 7.06 GWp, representing roughly a fourfold increase over the existing installed capacity of 1.8 GW.
The largest contributor is D.O. Jumilla, accounting for roughly 3.5 GWp (50% of total). This is followed by D.O. Yecla with approximately 2.1 GWp (30%). Both areas combine scale, regular parcel geometry, and high solar availability, positioning them as primary candidates for large-scale projects. D.O. Bullas ranks third with 0.5 GWp, while the two PGI zones—V.T. Abanilla and V.T. Campo de Cartagena—together contribute under 0.4 GWp. The remaining 0.8 GWp are distributed among smaller municipalities classified as “Rest”.

3.4. Distribution of Agrivoltaic System Capacity

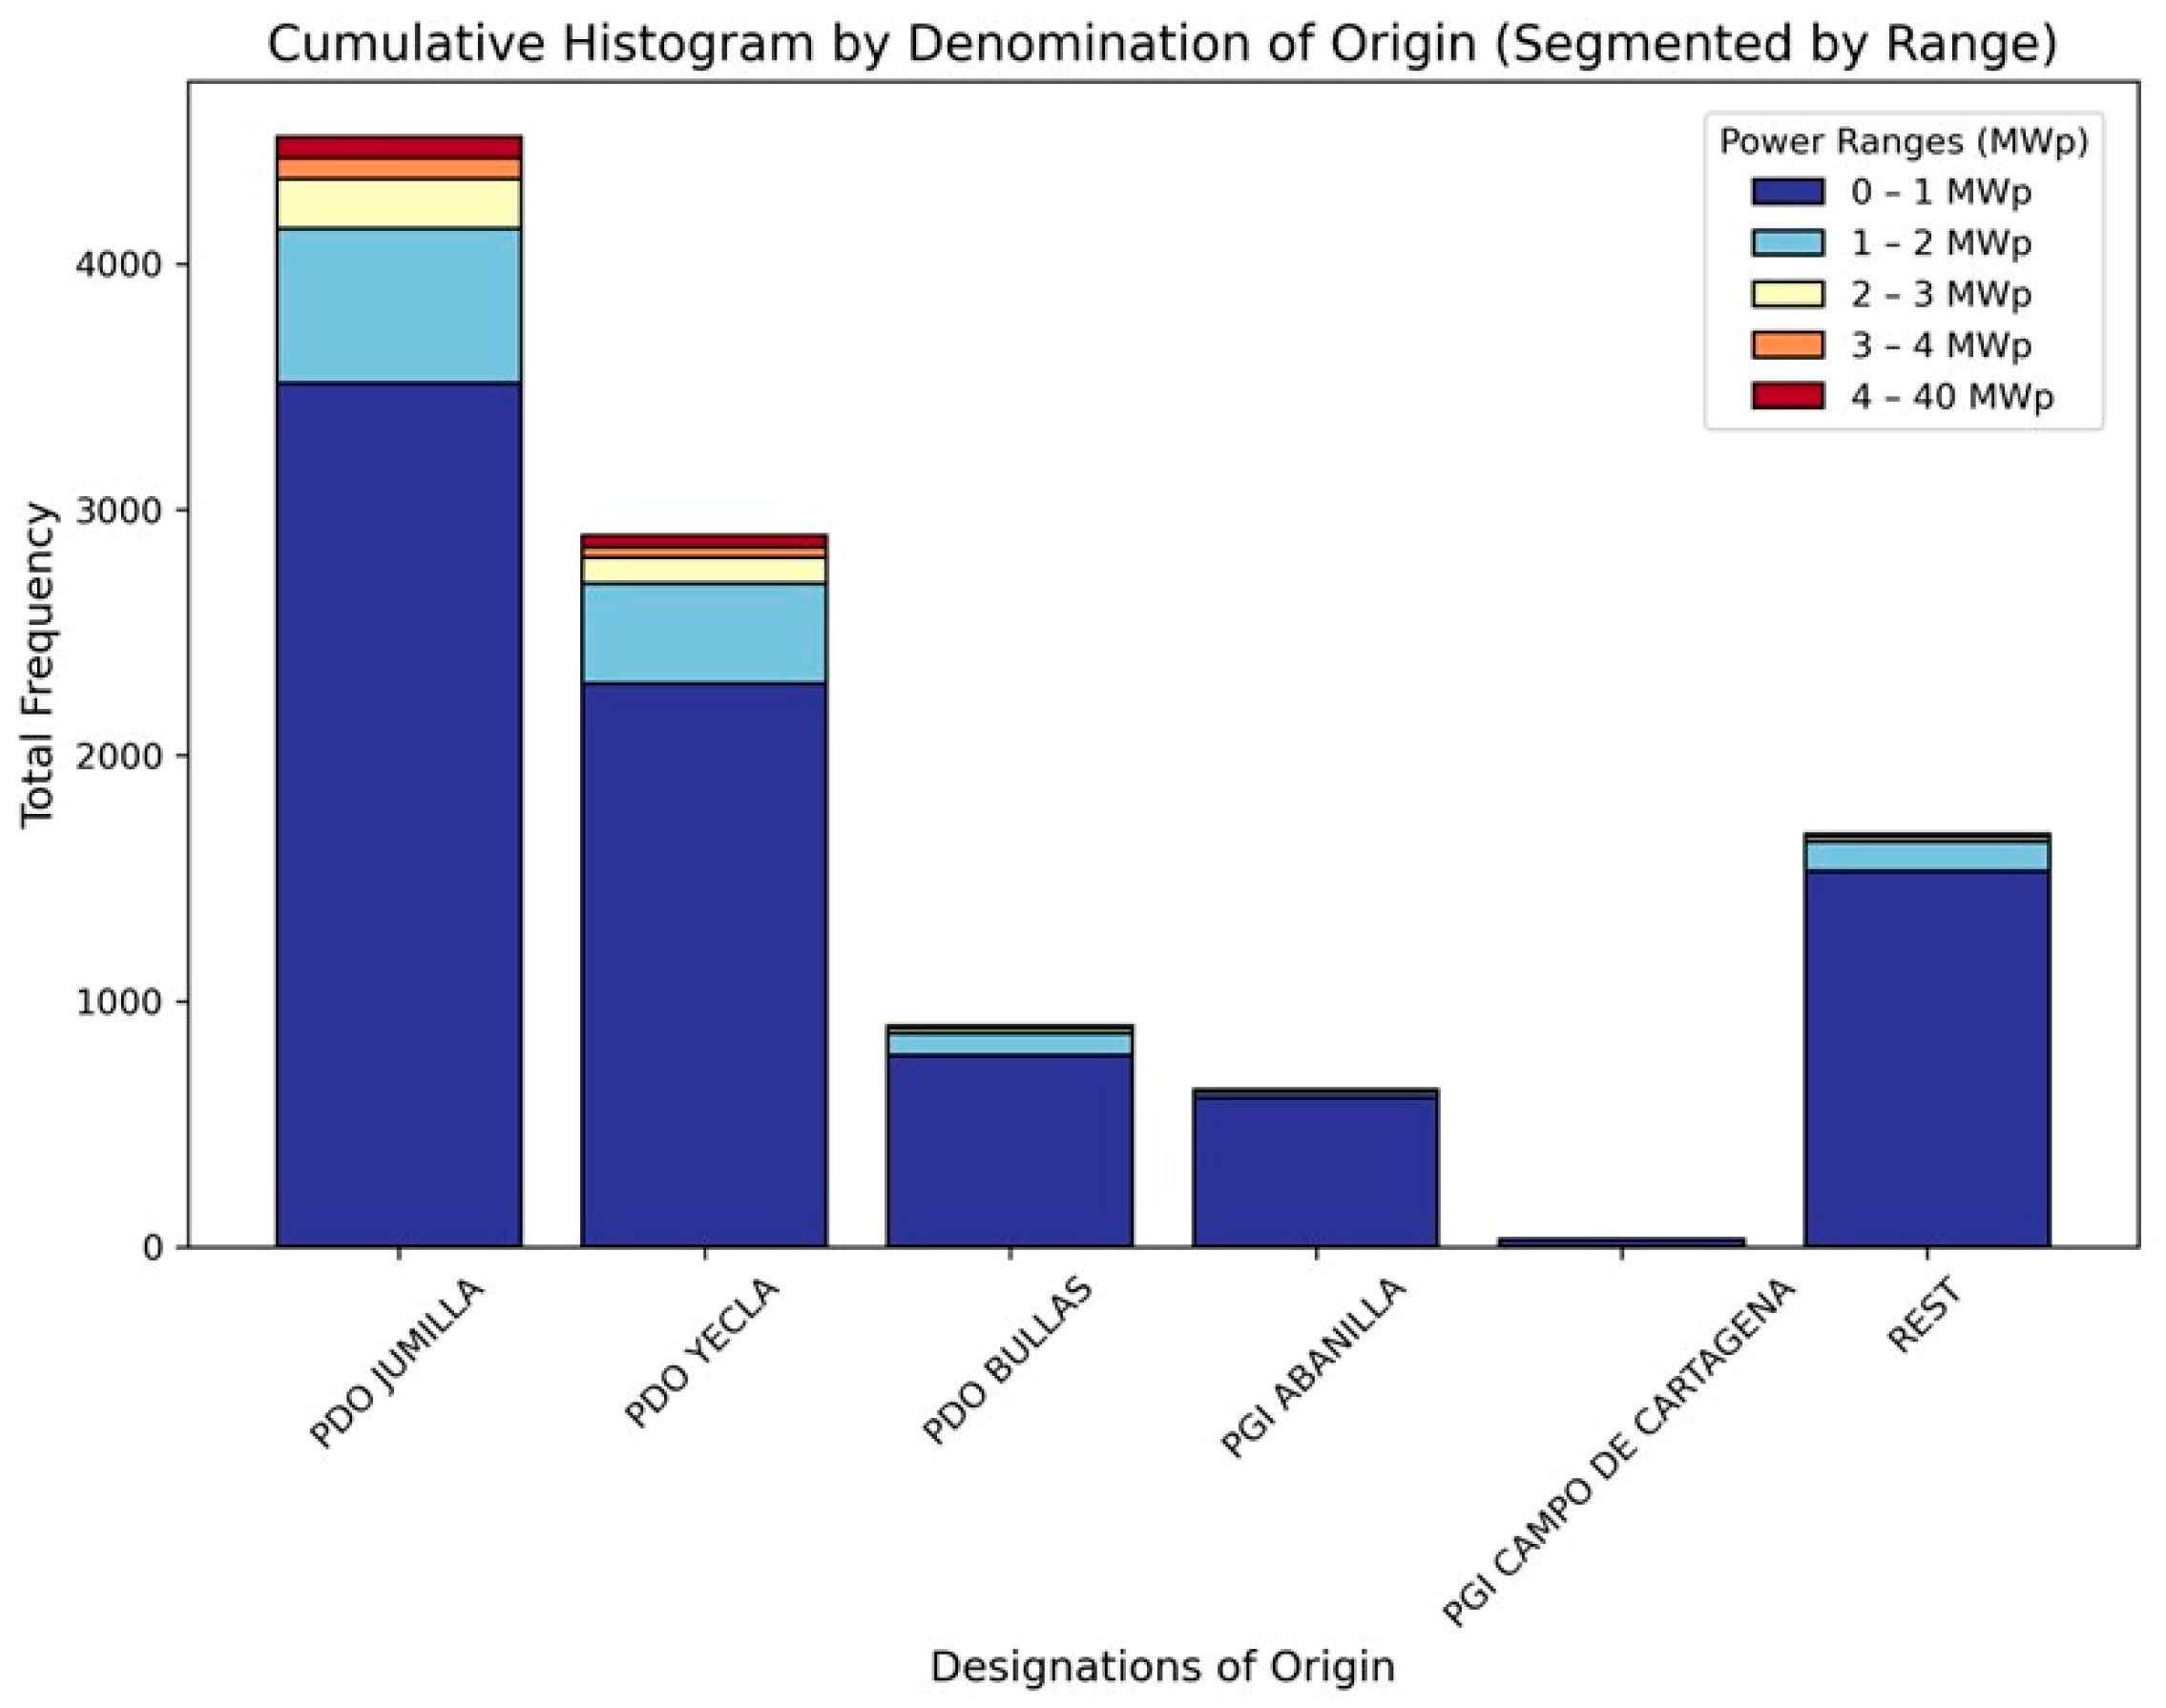
Figure 6 shows that most AV systems have a capacity below 1 MWp, while only a few reach several MWp. This pattern reflects significant fragmentation, with 58% of all parcels being smaller than 1 hectare and contributing 18% of the total power capacity. In contrast, the largest 2% of parcels (those larger than 5 hectares) account for 22% of the total capacity. This imbalance highlights the high variability in vineyard land ownership. Such structural diversity must be considered in the planning and implementation of agrivoltaic systems.
These results lay out clear governance implications. Small-scale, family-owned parcels will require cooperative frameworks or aggregation mechanisms to be viable for deployment. The top 9% of parcels already concentrate 45% of the potential, offering a short-term pathway to capture a large share of generation with reduced transactional complexity. However, inclusive long-term strategies must also address the operational integration of smallholders.

3.5. Avoided CO2 Emissions

The full deployment of the proposed AV systems across vineyard land in the Region of Murcia would generate an estimated 11.84 TWh of renewable electricity per year. To evaluate its potential climate impact, this value has been translated into avoided CO2 emissions using reference emission factors.
According to the European Environment Agency, the average carbon intensity of electricity generation in Spain was approximately 0.18 tCO2/MWh in 2022, a value that reflects the country’s ongoing decarbonization and the declining role of coal in the electricity mix [40].
Applying this national factor, the system would avoid around 2.13 million tons of CO2 per year. If we consider the average for 2020 (0.230 tCO2/MWh), the value rises to 2.72 MtCO2/year. In a scenario where the displaced electricity is mostly fossil-based—still common in peak-hour grid conditions or isolated areas—emissions avoided could reach up to 5.63 MtCO2/year, as suggested in other studies [41].
As a reference, Spain’s total electricity-related emissions in 2022 were around 50 MtCO2 [42] meaning that the system could offset between 4% and 11% of those emissions depending on the scenario. At a regional scale, this would equate to the electricity consumption of over 3 million households, assuming Murcia’s average residential demand and the national carbon intensity.
This reinforces the relevance of integrating agrivoltaics not only as a land-use strategy, but as a tool to accelerate decarbonization through distributed, socially grounded systems. As Spain advances towards the objectives set in its National Energy and Climate Plan [43], scalable dual-use models like those proposed herein could play a key role in bridging renewable expansion with rural development.

3.6. Orientation Optimization Scenario

To assess the upper bound for energy generation, an idealized scenario was considered in which all vineyard parcels are assumed to have optimal orientation ( α = 180º, equator-facing azimuth) for the AV system. The simulation reveals that such alignment would increase the total annual energy yield from 11.84 TWh/year to 12.35 TWh/year, representing a 4.2% gain compared to the baseline scenario.
This improvement, though seemingly modest in relative terms, translates into a substantial absolute increase of 500 GWh/year of electricity—without requiring any additional land or installed capacity. If implemented progressively during regular vineyard renewal cycles (assuming a rate of 4% of the vineyard area per year), the region could accumulate an additional 1 TWh of renewable energy over 15 years.
These findings underscore the value of integrating energy-oriented design criteria into viticultural management. Replanting vineyards with optimized row orientation, especially in large or newly established plots, could significantly enhance the overall efficiency of the proposed AV systems with minimal added cost in terms of PV installations. This synergy between agronomic planning and energy optimization offers a practical pathway to maximize land productivity and climate impact.

3.7. Deterministic Sensitivity Analysis of Key Assumptions

To assess the robustness of the regional estimates, a deterministic one-at-a-time sensitivity analysis was performed for the main scenario-defining assumptions. The analysis considered variations in PV specific yield, installation density, system losses, residential electricity demand, and orientation. These parameters were selected because they directly affect the main outputs of the study: annual electricity generation, installed capacity, self-consumption potential, and the upper-bound energy gain associated with optimized vineyard orientation (Table 4).
The baseline scenario corresponds to an estimated annual electricity generation of 11.84 TWh/year and an installed capacity of 7.06 GWp. Since annual electricity generation is directly proportional to both the PV specific yield and the installation density, variations in these parameters were propagated linearly from the baseline regional result. System losses were assessed by varying the performance ratio around the PVGIS default assumption used in the study. Residential demand was varied around the IDAE-based reference consumption value. Finally, the orientation sensitivity corresponds to the optimized-orientation scenario presented in Section 3.6.
The results show that the regional energy estimate is most sensitive to installation density and PV specific yield, while the self-consumption conclusions remain robust under the demand variation considered. Even when residential demand within the 2 km radius is increased by 10%, the local demand remains far below the total estimated agrivoltaic production. Similarly, the optimized-orientation scenario increases annual generation by 4.2%, indicating that orientation improvement can provide a relevant but secondary gain compared with the total deployment potential.
Overall, the sensitivity analysis confirms that the absolute magnitude of the regional generation potential depends on the assumed PV yield and installation density, as expected. However, the main qualitative conclusions of the study remain unchanged: vineyard-integrated vertical agrivoltaics presents a large regional generation potential, local self-consumption can absorb only a limited fraction of that potential under the current 2 km regulatory threshold, and grid accessibility remains a key constraint for large-scale deployment.

4. Discussion

The results above outline a technically viable and spatially detailed scenario for deploying integrated vertical agrivoltaic systems across all vineyards in Murcia. The next step is to interpret how this technical potential could be harnessed through real-world implementation models. Two complementary paths are explored: decentralized self-consumption and centralized grid injection.

4.1. Self-Consumption Potential

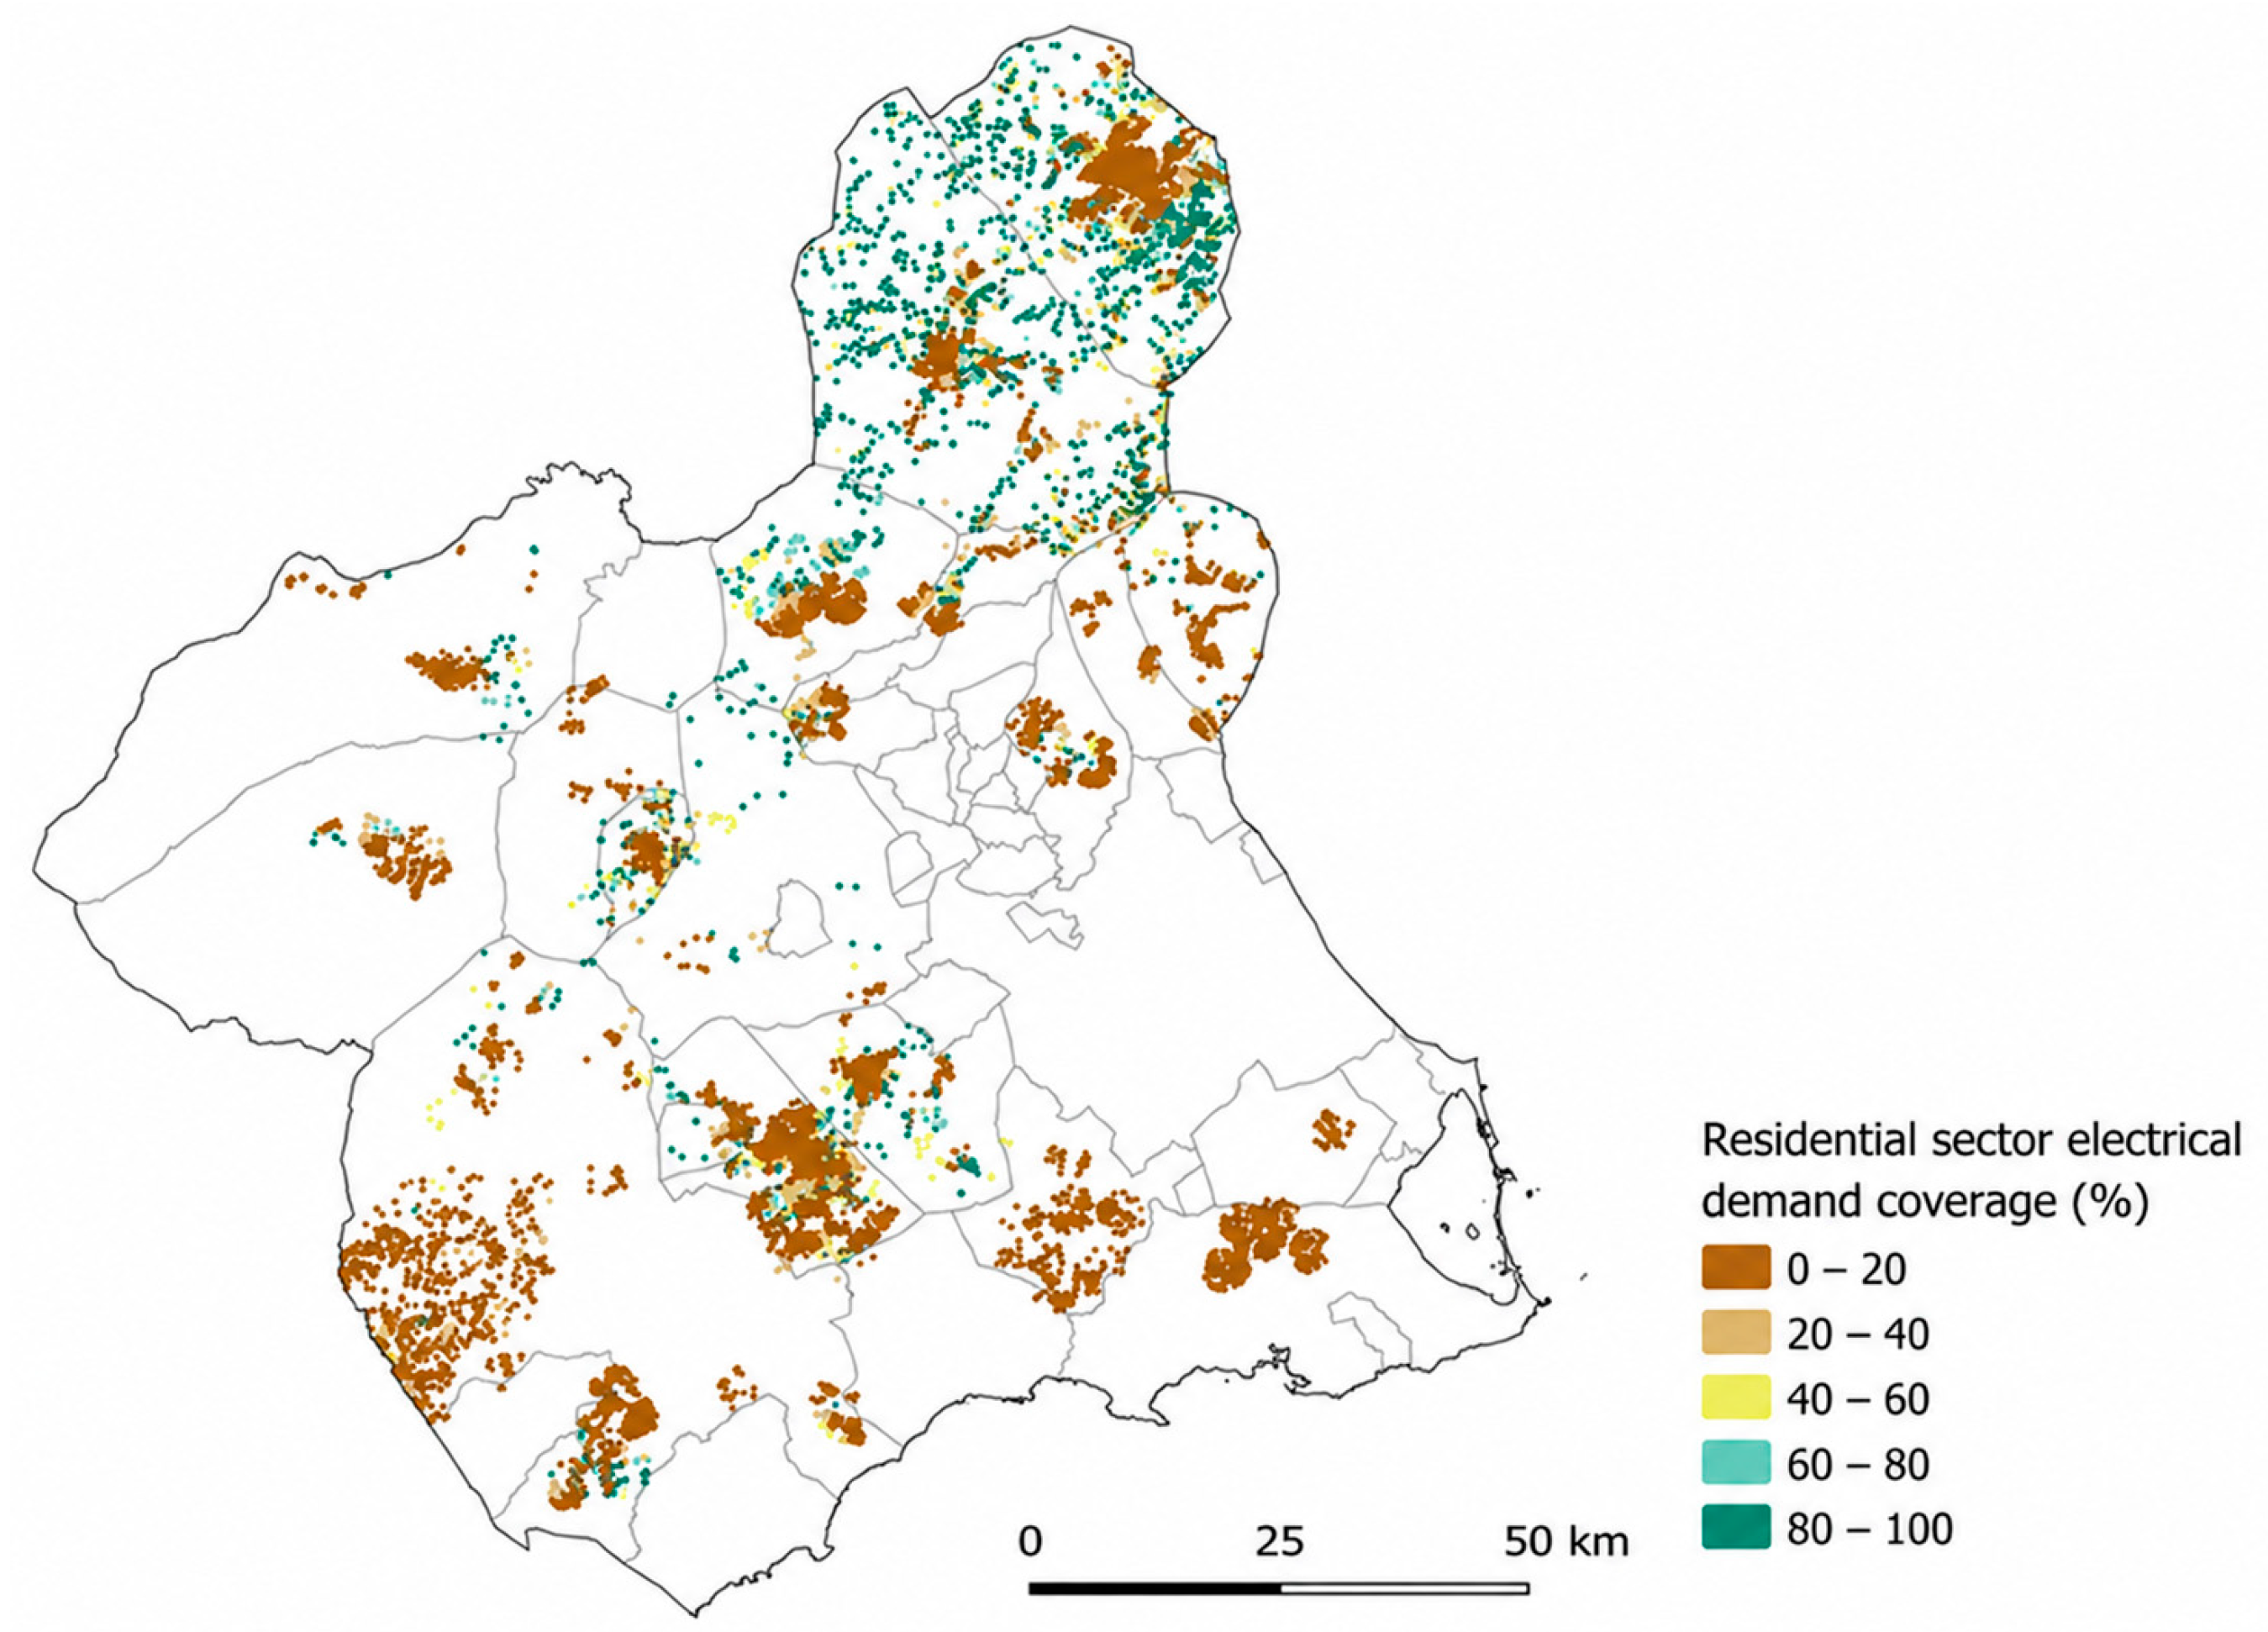
Based on cadastral data, the number of residential dwellings in the Region of Murcia was quantified and assigned an average annual electricity consumption of 3487 kWh per household, following national estimates provided by the IDAE (SECH-SPAHOUSEC project [44]. To evaluate the spatial viability of self-consumption, a 2 km radius was generated around each vineyard parcel, in line with current Spanish legislation regulating shared self-consumption [45]. Residential buildings located within this distance were identified through spatial intersection in a GIS environment (Figure 7).
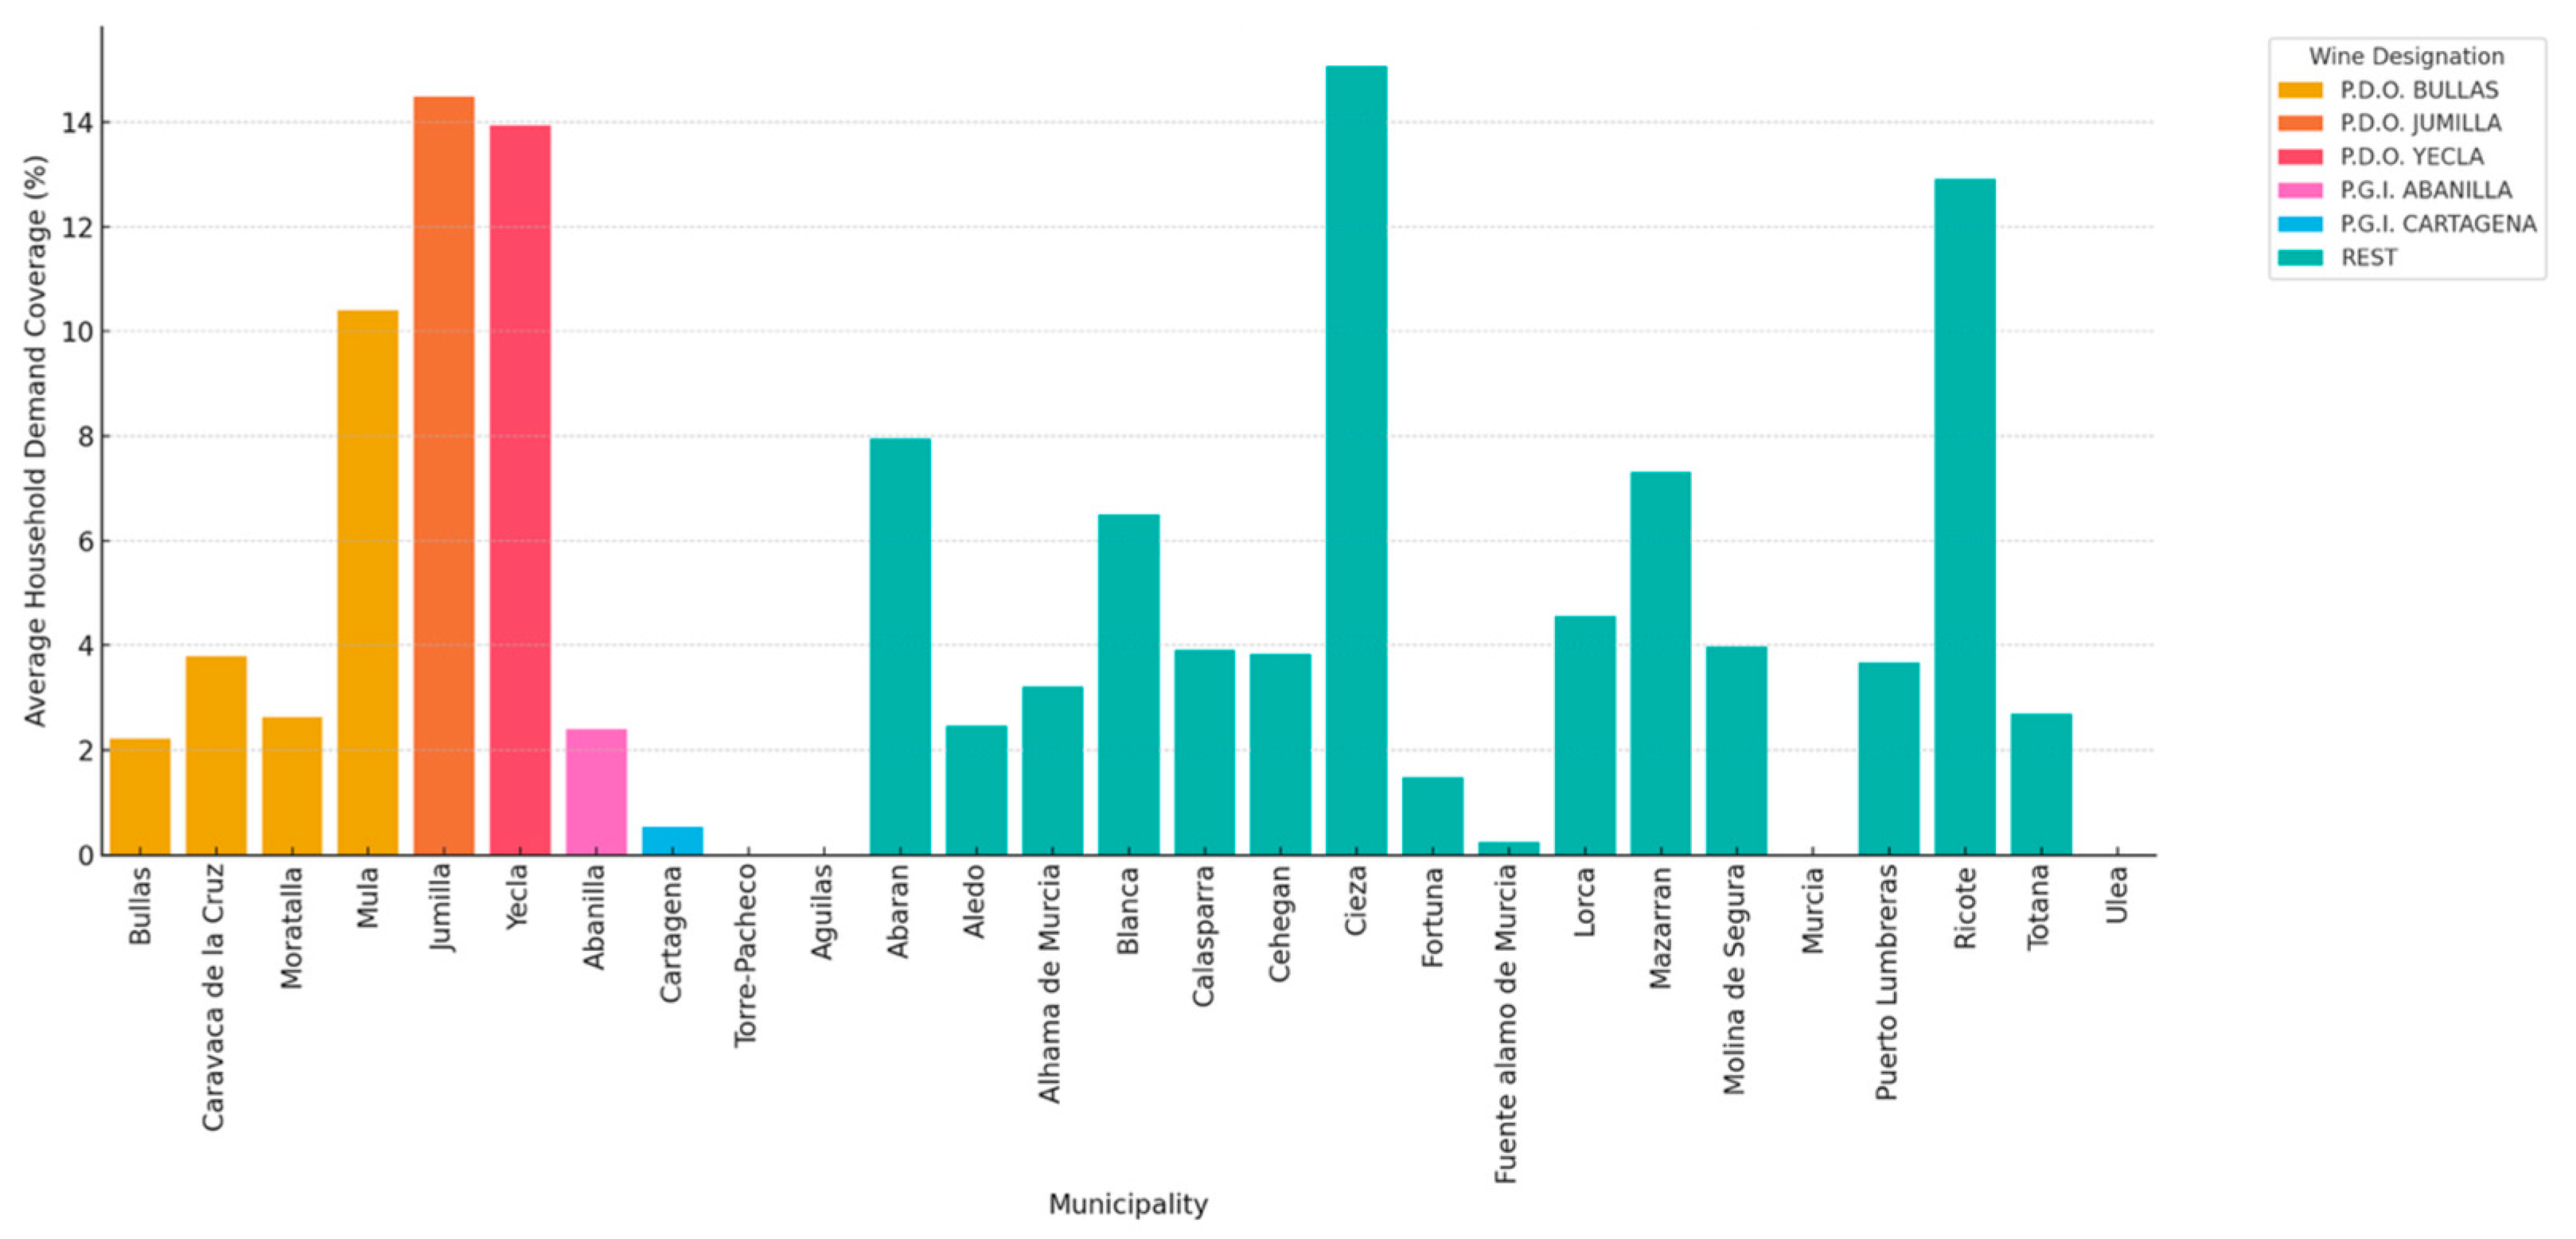
This analysis reveals that approximately 16% of the region’s total residential electricity demand is located within 2 km of a vineyard parcel suitable for agrivoltaic deployment (differentiated percentages for each municipality and protected designation are shown in Figure 8).
Specifically, the electricity demand of these dwellings amounts to 364.96 GWh/year, while the total residential electricity demand in the region is 2.27 TWh/year.
By comparing these figures with the total estimated electricity output—11.84 TWh/year across all vineyard land—it becomes evident that the production potential vastly exceeds the demand in the 2 km zone. This implies that, under current legal constraints, only about 3.1% of the total available generation capacity would be required to fully meet the residential demand within the proximity threshold.
This structural oversupply highlights two key insights. First, self-consumption is technically viable and robust, even under conservative proximity constraints. Second, there is considerable room for expansion through legislative adjustments (e.g., increasing the allowed distance), sectoral diversification (e.g., supplying industrial or service-sector loads), or energy export via grid injection.
Moreover, the fact that this residential demand is physically co-located with productive parcels—particularly in municipalities such as Jumilla, Yecla, Mula, and Torre-Pacheco—simplifies interconnection logistics and reinforces the case for cooperative energy communities and local ownership models. These configurations not only enhance energy autonomy but also allow for redistribution of value creation toward rural stakeholders, strengthening the social license of the transition.

4.2. Grid Injection and Infrastructure Compatibility

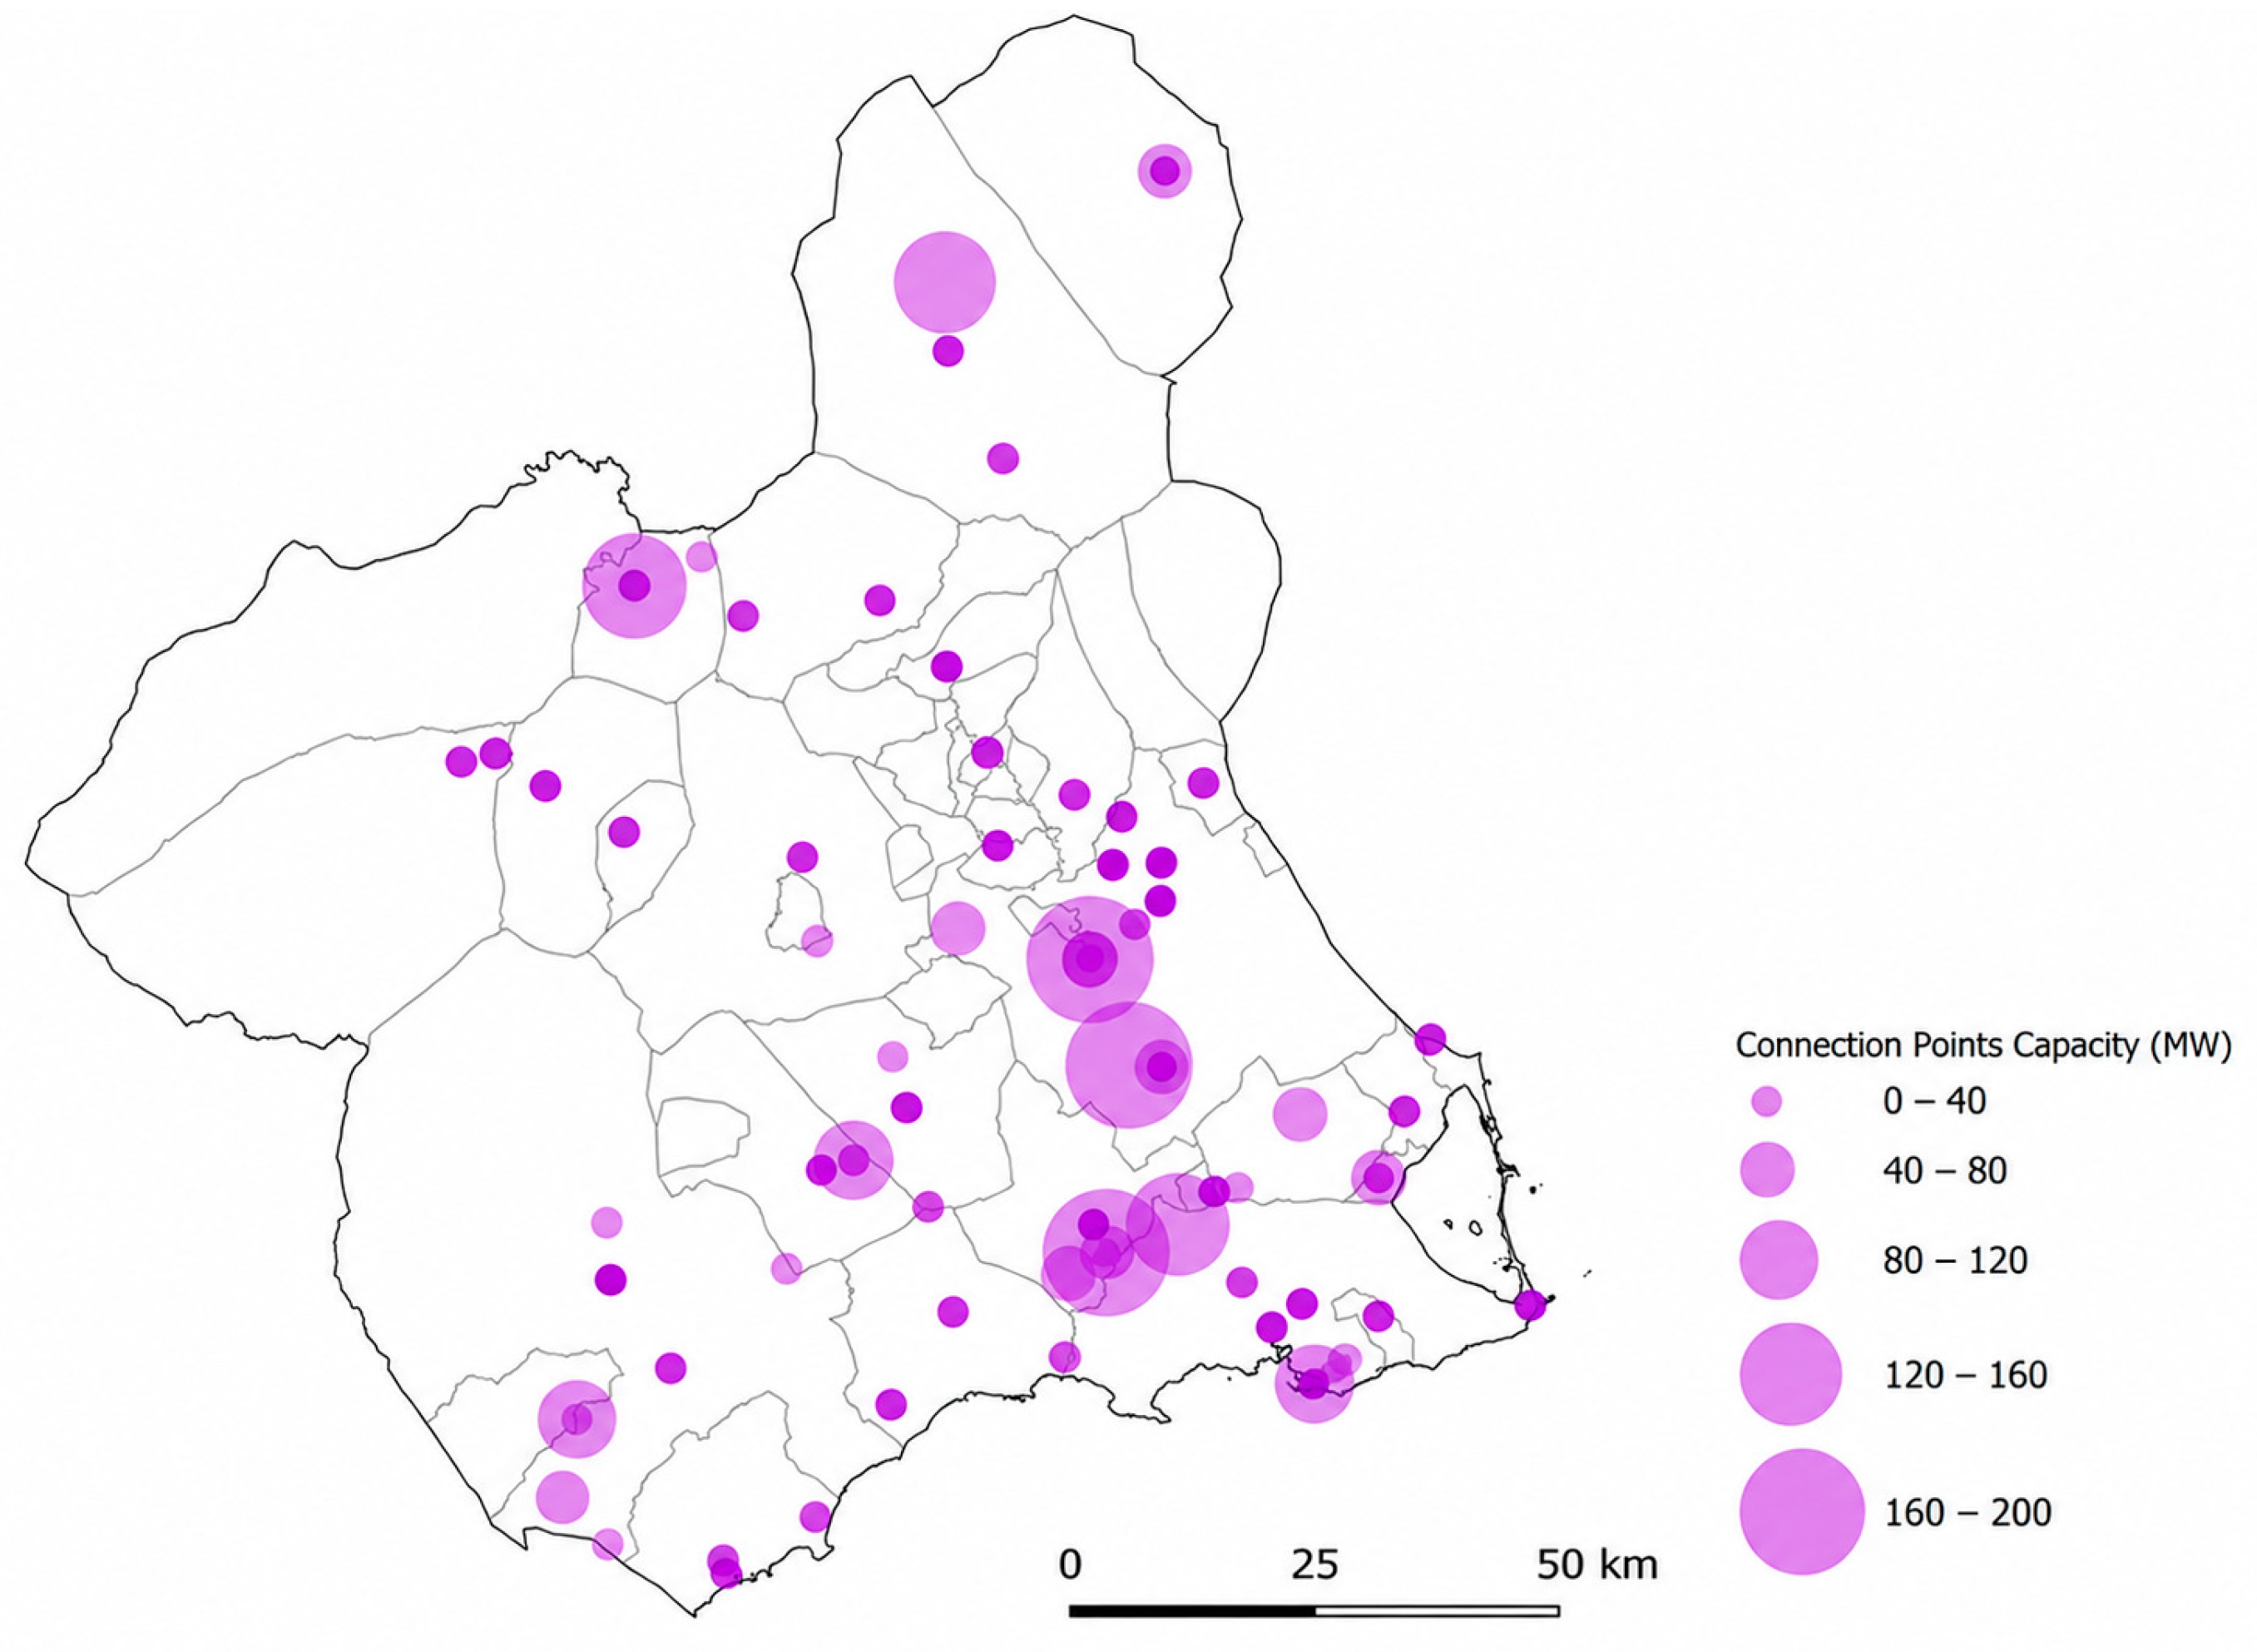
In addition to the self-consumption scenario, the large-scale deployment of the proposed AV systems across vineyard parcels in the Region of Murcia generates a significant surplus of electricity, far beyond what can be absorbed within the 2 km legal radius for local consumption. To make full use of this generation potential, the integration of these systems into the regional electricity grid was evaluated. The spatial distribution of substations in the Region of Murcia and their corresponding capacities are shown in Figure 9.
A spatial allocation analysis was conducted to evaluate the compatibility between productive vineyard parcels and the existing electricity infrastructure. First, the shortest linear distance between each parcel and the available electrical substations was calculated in a GIS environment. Then, a prospective planning scenario was applied in which substations (Figure 9) were assumed to be initially empty, while preserving their reported capacity values as upper limits for agrivoltaic power injection. Under this assumption, parcels were progressively assigned to substations according to shortest distance, filling each connection point until its capacity limit was reached. Parcels whose estimated AV capacity exceeded the remaining available capacity were skipped, and parcels already assigned were removed from the candidate pool to avoid double counting. This procedure provides an estimate of grid injection feasibility and associated infrastructure requirements under a capacity-constrained deployment scenario. The resulting values are shown in Table 5.
The results reveal a marked spatial dispersion in terms of grid accessibility. Only a small fraction of the potential installed capacity—approximately 20 MW, or 0.63% of the total—is located within 1 km of a connection point. An additional 136 MW (4.25%) falls within the 1 to 2 km range, and 306 MW (9.57%) between 2 and 5 km. As distance increases, the installed capacity becomes progressively more concentrated: 211 MW (6.60%) change is located between 5 and 10 km, 128 MW (4.00%) between 10 and 20 km, 576 MW (17.99%) between 20 and 40 km, and 677 MW (21.15%) between 40 and 60 km. Notably, the largest share—over 1146 MW representing 35.81% of the total—is situated more than 60 km from a connection point. These values underscore the challenges posed by the spatial mismatch between optimal AV production sites and the current electricity infrastructure, particularly in rural or less populated areas of the region.
This distance-dependent distribution of capacity highlights the need for differentiated deployment strategies. Vineyard parcels located near substations, especially within 10 km, present the most immediate and cost-effective opportunities for grid injection, requiring relatively modest infrastructure investments. In contrast, parcels situated further away may demand more extensive grid reinforcement, the construction of new substations, or the deployment of intermediate storage and aggregation systems to ensure economic and technical viability. The GIS-based allocation method used in this analysis, which matches parcels to substations until their estimated capacity is filled, reflects the practical limitations of the existing network and offers a replicable model for preliminary planning.
Taken together, these results suggest that grid injection can serve as a complementary pathway to self-consumption, enabling the absorption of surplus energy and expanding the reach of vineyard-integrated agrivoltaics systems beyond peri-urban zones. While self-consumption targets local demand in areas where production and consumption co-exist, grid injection unlocks the potential of remote, high-yield parcels and connects rural renewable generation to the broader energy system. This dual approach—territorially grounded and systemically integrated—maximizes both technical efficiency and regional impact, positioning vineyard-based agrivoltaics as a viable contributor to Murcia’s renewable energy strategy and its alignment with national decarbonization goals.

4.3. Study Limitations

This study should be interpreted as a regional-scale implementation scenario based on spatially explicit but simplified assumptions. Several limitations should therefore be acknowledged. First, the GIS analysis depends on the quality, update status, and thematic accuracy of the underlying parcel and cadastral datasets. Although SIGPAC and cadastral information provide a robust basis for regional assessment, mismatches may exist between database classification and the current on-ground situation, particularly in relation to land use, residential records, or recent parcel changes.
Second, vineyard row orientation was not available as an empirical parcel-level variable for the whole study area. For this reason, the longest polygon edge was used as a geometric proxy for row direction. This should be understood as a first-order approximation rather than a direct measurement, and therefore as a methodological limitation. To help frame the influence of this assumption, an idealized optimal-orientation scenario was also included as an upper-bound reference.
Third, PV yield estimates were derived from the PVGIS framework using a typical meteorological year and standardized system assumptions. Likewise, installation density was treated as a design constraint inherited from the ENOVOLTAICS configuration rather than as a free variable. As a result, the study does not provide a full uncertainty or sensitivity analysis of all technical inputs, but rather a consistent comparative framework for regional deployment assessment.
Finally, the manuscript does not include a detailed economic evaluation. This limits the conclusions that can be drawn regarding project profitability, bankability, or the cost implications of long grid-connection distances and possible reinforcement needs. These aspects, together with business models for fragmented parcels and cooperative deployment schemes, should be addressed in future research.

5. Conclusions

This study demonstrates that vertically integrated agrivoltaic systems can provide a substantial contribution to regional electricity supply when evaluated from an energy systems and grid integration perspective. Using vineyard landscapes in the Region of Murcia as a representative case, the spatial analysis shows that up to 7.06 GWp of vertically mounted bifacial PV could be deployed, generating approximately 11.84 TWh of renewable electricity per year. Areas such as the Designations of Origin of Jumilla and Yecla emerge as priority zones for early deployment due to their large continuous surfaces, structured parcel layouts, and high solar resource availability. However, the predominance of small parcel sizes highlights structural land fragmentation as a key constraint, pointing to the need for cooperative, aggregated, or community-based deployment models to enable large-scale implementation.
Beyond capacity estimates, the results underline the importance of integrating agrivoltaic deployment strategies with agricultural planning and power system requirements. Orientation analysis indicates that aligning vineyard rows toward south-facing configurations during renewal cycles could unlock an additional 500 GWh/year without increasing land occupation or installed capacity, reinforcing the potential synergies between viticultural practices and energy planning. From a climate perspective, full deployment could avoid between 2.13 and 5.63 million tons of CO2 emissions annually, depending on the displaced electricity mix, representing a meaningful contribution to decarbonization targets.
From a grid integration standpoint, proximity between vineyard parcels and residential areas enables local energy sharing under current Spanish regulation, allowing collective self-consumption within a 2 km radius. Although this pathway alone could supply approximately 365 GWh/year (around 16% of regional residential electricity demand) it would utilize only a small fraction of the overall generation potential. Most of the capacity lies beyond the current self-consumption radius and at considerable distances from existing substations, with more than 75% located over 10 km away, underscoring the need for grid reinforcement and coordinated infrastructure planning.
Overall, the findings support a dual deployment strategy that combines decentralized self-consumption in peri-urban areas with centralized grid injection from high-yield rural zones. While grounded in a specific crop, configuration, and regulatory context, the spatial framework presented here is transferable to other regions and agricultural systems. By explicitly addressing grid accessibility and infrastructure constraints, this approach contributes to more realistic, market-oriented assessments of agrivoltaic scalability and provides actionable insights for energy planners, network operators, and policymakers seeking to integrate dual land-use solutions into future low-carbon power systems.

Author Contributions

B.M.-C.: data curation, formal analysis, investigation, writing—original draft. A.R.-E.: conceptualization, data curation, formal analysis, investigation, methodology, writing—review and editing. C.T.: conceptualization, investigation, methodology, writing—review and editing. J.P.: conceptualization, funding acquisition, investigation, methodology, writing—review and editing. All authors have read and agreed to the published version of the manuscript.

Funding

This work was supported by Fundación Seneca (22248/PDC/23) and ENOVOLTAICS-Symbiotic photovoltaic integration in vineyards (EIP-AGRI Operational group APROVOLT).

Data Availability Statement

Data will be available upon request.

Acknowledgments

The authors would like to thank PVGIS for making their data freely available. The authors acknowledge support from the wineries Carchelo and BSI in Jumilla, Evine in Yecla and the Tomas Ferro experimental farm of the Technical University of Cartagena.

Conflicts of Interest

All authors declare that they have no conflicts of interest.

References

  1. Data. Available online: https://www.irena.org/Data (accessed on 22 July 2025).
  2. REPowerEU. Available online: https://commission.europa.eu/topics/energy/repowereu_en (accessed on 22 July 2025).
  3. Fthenakis, V.; Kim, H.C. Land Use and Electricity Generation: A Life-Cycle Analysis. Renew. Sustain. Energy Rev. 2009, 13, 1465–1474. [Google Scholar] [CrossRef] [Scilit]
  4. Cousse, J. Still in Love with Solar Energy? Installation Size, Affect, and the Social Acceptance of Renewable Energy Technologies. Renew. Sustain. Energy Rev. 2021, 145, 111107. [Google Scholar] [CrossRef] [Scilit]
  5. Hernandez, R.R.; Easter, S.B.; Murphy-Mariscal, M.L.; Maestre, F.T.; Tavassoli, M.; Allen, E.B.; Barrows, C.W.; Belnap, J.; Ochoa-Hueso, R.; Ravi, S.; et al. Environmental Impacts of Utility-Scale Solar Energy. Renew. Sustain. Energy Rev. 2014, 29, 766–779. [Google Scholar] [CrossRef] [Scilit]
  6. Serrano, D.; Margalida, A.; Pérez-García, J.M.; Juste, J.; Traba, J.; Valera, F.; Carrete, M.; Aihartza, J.; Real, J.; Mañosa, S.; et al. Renewables in Spain Threaten Biodiversity. Science 2020, 370, 1282–1283. [Google Scholar] [CrossRef] [Scilit]
  7. Singla, M.K.; Gupta, J.; Gupta, A.; Safaraliev, M.; Zeinoddini-Meymand, H.; Kumar, R. Empowering Rural Farming: Agrovoltaic Applications for Sustainable Agriculture. Energy Sci. Eng. 2025, 13, 35–59. [Google Scholar] [CrossRef] [Scilit]
  8. Barron-Gafford, G.A.; Pavao-Zuckerman, M.A.; Minor, R.L.; Sutter, L.F.; Barnett-Moreno, I.; Blackett, D.T.; Thompson, M.; Dimond, K.; Gerlak, A.K.; Nabhan, G.P.; et al. Agrivoltaics Provide Mutual Benefits across the Food–Energy–Water Nexus in Drylands. Nat. Sustain. 2019, 2, 848–855. [Google Scholar] [CrossRef] [Scilit]
  9. Cuppari, R.I.; Higgins, C.W.; Characklis, G.W. Agrivoltaics and Weather Risk: A Diversification Strategy for Landowners. Appl. Energy 2021, 291, 116809. [Google Scholar] [CrossRef] [Scilit]
  10. Agir, S.; Derin-Gure, P.; Senturk, B. Farmers’ Perspectives on Challenges and Opportunities of Agrivoltaics in Turkiye: An Institutional Perspective. Renew. Energy 2023, 212, 35–49. [Google Scholar] [CrossRef] [Scilit]
  11. Pascaris, A.S.; Schelly, C.; Pearce, J.M. A First Investigation of Agriculture Sector Perspectives on the Opportunities and Barriers for Agrivoltaics. Agronomy 2020, 10, 1885. [Google Scholar] [CrossRef] [Scilit]
  12. Hannah, L.; Roehrdanz, P.R.; Ikegami, M.; Shepard, A.V.; Shaw, M.R.; Tabor, G.; Zhi, L.; Marquet, P.A.; Hijmans, R.J. Climate Change, Wine, and Conservation. Proc. Natl. Acad. Sci. USA 2013, 110, 6907–6912. [Google Scholar] [CrossRef] [Scilit]
  13. Ferrara, G.; Boselli, M.; Palasciano, M.; Mazzeo, A. Effect of Shading Determined by Photovoltaic Panels Installed above the Vines on the Performance of Cv. Corvina (Vitis vinifera L.). Sci. Hortic. 2023, 308, 111595. [Google Scholar] [CrossRef] [Scilit]
  14. Padilla, J.; Toledo, C.; Abad, J. Enovoltaics: Symbiotic Integration of Photovoltaics in Vineyards. Front. Energy Res. 2022, 10, 1007383. [Google Scholar] [CrossRef] [Scilit]
  15. Toledo, C.; Ramos-Escudero, A.; Serrano-Luján, L.; Urbina, A. Photovoltaic Technology as a Tool for Ecosystem Recovery: A Case Study for the Mar Menor Coastal Lagoon. Appl. Energy 2024, 356, 122350. [Google Scholar] [CrossRef] [Scilit]
  16. Fattoruso, G.; Toscano, D.; Venturo, A.; Scognamiglio, A.; Fabricino, M.; Di Francia, G. A Spatial Multicriteria Analysis for a Regional Assessment of Eligible Areas for Sustainable Agrivoltaic Systems in Italy. Sustainability 2024, 16, 911. [Google Scholar] [CrossRef] [Scilit]
  17. Elkadeem, M.R.; Zainali, S.; Lu, S.M.; Younes, A.; Abido, M.A.; Amaducci, S.; Croci, M.; Zhang, J.; Landelius, T.; Stridh, B.; et al. Agrivoltaic Systems Potentials in Sweden: A Geospatial-Assisted Multi-Criteria Analysis. Appl. Energy 2024, 356, 122108. [Google Scholar] [CrossRef] [Scilit]
  18. Dere, S.; Elçin Günay, E.; Kula, U.; Kremer, G.E. Assessing Agrivoltaics Potential in Türkiye—A Geographical Information System (GIS)-Based Fuzzy Multi-Criteria Decision Making (MCDM) Approach. Comput. Ind. Eng. 2024, 197, 110598. [Google Scholar] [CrossRef] [Scilit]
  19. Reher, T.; Lavaert, C.; Ottoy, S.; Martens, J.A.; Van Orshoven, J.; Cappelle, J.; Diels, J.; Van De Poel, B. Room for Renewables: A GIS-Based Agrivoltaics Site Suitability Analysis in Urbanized Landscapes. Agric. Syst. 2025, 224, 104266. [Google Scholar] [CrossRef] [Scilit]
  20. Willockx, B.; Lavaert, C.; Cappelle, J. Geospatial Assessment of Elevated Agrivoltaics on Arable Land in Europe to Highlight the Implications on Design, Land Use and Economic Level. Energy Rep. 2022, 8, 8736–8751. [Google Scholar] [CrossRef] [Scilit]
  21. Ferreira, R.F.; Marques Lameirinhas, R.A.; Bernardo, C.P.C.V.; Torres, J.P.N.; Santos, M. Agri-PV in Portugal: How to Combine Agriculture and Photovoltaic Production. Energy Sustain. Dev. 2024, 79, 101408. [Google Scholar] [CrossRef] [Scilit]
  22. Jamil, U.; Bonnington, A.; Pearce, J.M. The Agrivoltaic Potential of Canada. Sustainability 2023, 15, 3228. [Google Scholar] [CrossRef] [Scilit]
  23. Rösch, C.; Fakharizadehshirazi, E. The Spatial Socio-Technical Potential of Agrivoltaics in Germany. Renew. Sustain. Energy Rev. 2024, 202, 114706. [Google Scholar] [CrossRef] [Scilit]
  24. Meteorología, A.E. de Resumen de Precipitaciones—Agencia Estatal de Meteorología—AEMET. Gobierno de España. Available online: https://www.aemet.es/es/serviciosclimaticos/vigilancia_clima/resumen_precipitaciones (accessed on 23 July 2025).
  25. Anuarios de Estadística Agraria. Available online: https://esam.carm.es/anuarios-estadistica-agraria/ (accessed on 23 July 2025).
  26. Ministerio de Agricultura, Pesca y Alimentación (MAPA). Información Del Sector Vitivinícola. Available online: https://www.mapa.gob.es/es/agricultura/temas/producciones-agricolas/vitivinicultura (accessed on 23 July 2025).
  27. Photovoltaic Geographical Information System (PVGIS)—European Commission. Available online: https://joint-research-centre.ec.europa.eu/photovoltaic-geographical-information-system-pvgis_en (accessed on 23 July 2025).
  28. Redeia Potencia Instalada. Available online: https://www.ree.es/es/datos/generacion/potencia-instalada (accessed on 23 July 2025).
  29. Región de Murcia. Consejería de Agua, Agricultura, Ganadería y Pesca. Estadística Agraria de Murcia 2021/22. Available online: https://www.carm.es/web/pagina?IDCONTENIDO=2589&IDTIPO=100&RASTRO=c80$m22721,22746,1174 (accessed on 13 May 2026).
  30. Visor Del SIGPAC Nacional. Available online: https://www.mapa.gob.es/es/agricultura/temas/sistema-de-informacion-geografica-de-parcelas-agricolas-sigpac-/visor-sigpac (accessed on 23 July 2025).
  31. Sede Electrónica Del Catastro—Inicio. Available online: https://www.sedecatastro.gob.es/ (accessed on 23 July 2025).
  32. Huld, T.; Friesen, G.; Skoczek, A.; Kenny, R.P.; Sample, T.; Field, M.; Dunlop, E.D. A Power-Rating Model for Crystalline Silicon PV Modules. Sol. Energy Mater. Sol. Cells 2011, 95, 3359–3369. [Google Scholar] [CrossRef] [Scilit]
  33. Faiman, D. Assessing the Outdoor Operating Temperature of Photovoltaic Modules. Prog. Photovolt. 2008, 16, 307–315. [Google Scholar] [CrossRef] [Scilit]
  34. PVGIS 5.2—European Commission. Available online: https://joint-research-centre.ec.europa.eu/photovoltaic-geographical-information-system-pvgis/pvgis-releases/pvgis-52_en (accessed on 23 July 2025).
  35. Perez, R.; Ineichen, P.; Seals, R.; Michalsky, J.; Stewart, R. Modeling Daylight Availability and Irradiance Components from Direct and Global Irradiance. Sol. Energy 1990, 44, 271–289. [Google Scholar] [CrossRef] [Scilit]
  36. Anderson, K.S.; Hansen, C.W.; Holmgren, W.F.; Jensen, A.R.; Mikofski, M.A.; Driesse, A. Pvlib Python: 2023 Project Update. JOSS 2023, 8, 5994. [Google Scholar] [CrossRef] [Scilit]
  37. IDAE SECH-SPAHOUSEC Project. Available online: https://www.idae.es/uploads/documentos/documentos_Informe_SPAHOUSEC_ACC_f68291a3.pdf (accessed on 23 July 2025).
  38. Jefatura del Estado Government of Spain. Royal Decree-Law 20/2022, of December 27, on Measures in Response to the Economic and Social Consequences of the War in Ukraine, Support for the Reconstruction of the Island of La Palma, and Other Vulnerable Situations (Art. 18); Official State Gazette, No. 311, 28 December 2022; Agencia Estatal Boletín Oficial del Estado: Madrid, Spain, 2022; Volume BOE-A-2022-22685, pp. 185813–185937. Available online: https://www.boe.es/buscar/doc.php?id=BOE-A-2022-22685 (accessed on 13 May 2026).
  39. Mapa de Capacidad | I-DE—Grupo Iberdrola. Available online: https://www.i-de.es/conexion-red-electrica/produccion-energia/mapa-capacidad-acceso (accessed on 23 July 2025).
  40. European Environment Agency (EEA). Greenhouse Gas Emission Intensity of Electricity Generation—Indicator Assessment. 2023. Available online: https://www.eea.europa.eu/en/analysis/indicators/greenhouse-gas-emission-intensity-of-1 (accessed on 23 July 2025).
  41. He, D.; Hou, K.; Li, X.X.; Wu, S.Q.; Ma, L.X. A Reliable Ecological Vulnerability Approach Based on the Construction of Optimal Evaluation Systems and Evolutionary Tracking Models. J. Clean. Prod. 2023, 419, 138246. [Google Scholar] [CrossRef] [Scilit]
  42. Red Eléctrica de España—REE. Informe Del Sistema Eléctrico Español 2022; REE: Madrid, Spain, 2023; Available online: https://www.sistemaelectrico-ree.es/es/2022/informe-del-sistema-electrico (accessed on 13 May 2026).
  43. Gobierno de España. Plan Nacional Integrado de Energía y Clima (PNIEC) 2021–2030; Ministerio Para La Transición Ecológica y El Reto Demográfico: Madrid, Spain, 2020; Available online: https://www.miteco.gob.es/es/prensa/pniec.html (accessed on 13 May 2026).
  44. IDAE. Consumos Del Sector Residencial En España (Año 2010) Información Básica (Proyecto SPAHOUSEC); IDAE: Madrid, Spain, 2011; Available online: https://www.idae.es/sites/default/files/estudios_informes_y_estadisticas/Informe_SPAHOUSEC_Basico_logo_Eurostat_negro_FINAL.pdf (accessed on 13 May 2026).
  45. Ministerio para la Transición Ecológica. Real Decreto 244/2019, de 5 de Abril, Por El Que Se Regulan Las Condiciones Administrativas, Técnicas y Económicas Del Autoconsumo de Energía Eléctrica; Agencia Estatal Boletín Oficial del Estado: Madrid, Spain, 2019; Volume BOE-A-2019-5089, pp. 35674–35719. Available online: https://www.boe.es/buscar/doc.php?id=BOE-A-2019-5089 (accessed on 13 May 2026).
Figure 1. Geographical location of the study area in the Region of Murcia (SE Spain), with municipalities borders and the distribution of vineyard parcels from the SIGPAC database. Each municipality is identified with a numerical code in the Cadastre, according to the following relation: Jumilla (43), Yecla (22), Abanilla (10), Mula (17), Alhama de Murcia (8), Lorca (15), Cieza (28), Cehegín (13), Totana (21), Bullas (29), Mazarrón (24), Puerto Lumbreras (33), Blanca (34), Águilas (3), Abarán (19), Molina de Segura (11), Moratalla (28), Caravaca de la Cruz (13), Ricote (19), Aledo (6), Ulea (25), Cartagena (16), Fuente Álamo de Murcia (26), Murcia (30), Calasparra (28), Fortuna (20) y Torre-Pacheco (37).
Agriengineering 08 00200 g001
Figure 2. Vertical bifacial pilot installation.
Agriengineering 08 00200 g002
Figure 3. Annual specific yield (kWh/kWp) for V-BI configuration ( β = 90 ) in each municipality at ranged orientation angles ( α ).
Agriengineering 08 00200 g003
Figure 4. Annual energy production of agrivoltaic vineyard parcels in the Region of Murcia.
Agriengineering 08 00200 g004
Figure 5. Estimated potential annual energy generation and potential AV capacity in the Region of Murcia, grouped by Protected Designations of Origin (PDO).
Agriengineering 08 00200 g005
Figure 6. Cumulative histogram of the capacity of AV systems grouped by Protected Designations of Origin (PDO).
Agriengineering 08 00200 g006
Figure 7. Residential sector electrical demand coverage.
Agriengineering 08 00200 g007
Figure 8. Average household energy demand coverage by municipality and protected designation.
Agriengineering 08 00200 g008
Figure 9. Grid connection points distribution in the Region of Murcia, together with their capacity ranges.
Agriengineering 08 00200 g009
Table 1. Vineyard distribution by municipality. Data extracted from [30].
MunicipalityVineyard Area (Ha)Number of ParcelsParcel Surface Average (Ha)Percentage of Total Vineyard Area (%)
Jumilla10,648.6545182.3649.75
Yecla6411.5328942.2229.96
Abanilla645.576361.023.02
Mula529.072572.062.47
Alhama de Murcia4463381.322.08
Lorca416.323551.171.95
Cieza367.741322.791.72
Cehegín340.052441.391.59
Totana310.723810.821.45
Bullas293.012551.151.37
Mazarrón213.081851.151
Puerto Lumbreras148.24818.530.69
Blanca99.91482.080.47
Águilas85.08531.610.4
Abarán72.22621.160.34
Molina de Segura69.42242.890.32
Moratalla66.06511.30.31
Caravaca de la Cruz60.15421.430.28
Ricote57.04491.160.27
Aledo54.5750.730.25
Ulea21.692.40.1
Cartagena14.6101.460.07
Fuente Álamo de Murcia13.69200.680.06
Murcia9.4891.050.04
Calasparra8.1932.730.04
Fortuna0.8240.210
Torre-Pacheco0.0610.060
Table 2. Pilot installation specifications and annual production per hectare for each installation.
PV ConfigurationLocationAzimuthInstalled Peak Power (kWp)Annual Energy per Ha (kWh)
Vertical bifacial38.4697, −1.3113−63°2.34555,910
Venetian blind-type38.4539, −1.2212−8°1.56304,720
Vertical monofacial38.5874, −1.034+8°2.34383,760
Table 3. Empirical plausibility check of the PV yield estimates using monitored production data from the vertical bifacial pilot installation.
CaseSourceAnnual Energy ProductionInstalled CapacityAnnual Specific Yield
Regional vertical bifacial deployment scenarioGIS-PVGIS model11.84 TWh/year7.06 GWp1677 kWh/kWp/year
Vertical bifacial pilot installationMonitored inverter data555,905 kWh/ha/year338 kWp/ha1645 kWh/kWp/year
Table 4. Deterministic sensitivity analysis of key assumptions used in the regional deployment scenario.
ParameterBaseline AssumptionSensitivity RangeResulting EffectInterpretation
PV specific yieldBaseline GIS-PVGIS yield±5%11.25–12.43 TWh/yearDirect proportional effect on annual electricity generation
Installation density0.033 kWp/m2±10%6.35–7.77 GWp and 10.66–13.02 TWh/yearDirect effect on both installed capacity and annual electricity generation
System losses14% losses, PR = 0.8610–18% losses, PR = 0.90–0.8211.29–12.39 TWh/yearModerate effect within a plausible performance-ratio range
Residential electricity demand3487 kWh/dwelling/year±10%328.5–401.5 GWh/year within the 2 km self-consumption radiusLocal residential demand remains much lower than total AV production
OrientationBaseline parcel-derived orientationOptimal south-facing orientation12.35 TWh/year+4.2% compared with the baseline scenario
Table 5. Percentages of substation power capacities supplied by agrivoltaic systems as a function of distance.
Distance Ranges (km)Power (MW)Percentage %
<120.110.63
1–2136.154.25
2–5306.409.57
5–10211.246.60
10–20127.924.00
20–40575.9117.99
40–60677.1721.15
>601146.2635.81
Total3201.17100.00
Disclaimer/Publisher’s Note: The statements, opinions and data contained in all publications are solely those of the individual author(s) and contributor(s) and not of MDPI and/or the editor(s). MDPI and/or the editor(s) disclaim responsibility for any injury to people or property resulting from any ideas, methods, instructions or products referred to in the content.