


Abstract
This study evaluated the agrotechnical, energy, and operational performance of a 7.0 m heavy disc harrow (two rows, eight sections, 72 notched discs of 660 mm diameter) designed for traction class 5–6 tractors. Field tests on perennial grass sod used a Kirovets K-735 tractor at angles of attack of 12°, 15°, and 18° and speeds of 9.0–11.5 km h−1. Mean tillage depth was 7.0–9.6 cm, the share of soil particles smaller than 50 mm was 80.1–94.5%, and crop residue incorporation was 60.0–92.7%. Draft resistance (44.1–53.9 kN) remained below the 65 kN limit, and specific energy consumption was 62.6–76.8 MJ ha−1. At the common speed of 10.8 km h−1, the angle of attack significantly affected tillage depth, draft resistance, residue cutting, and residue incorporation (p < 0.001), but not soil fragmentation or surface roughness. Because speed was not set independently of the angle, the nine single-pass modes form a multi-condition comparison rather than a single-factor experiment. The measured draft was 1.83–2.26 times the value predicted by ASABE D497.7. Complete residue cutting occurred at 18° and, at 15°, only at 11.3 km h−1; at 12°, depth remained below the required 8–12 cm. The results support selecting operating settings under comparable conditions in Northern Kazakhstan.
1. Introduction
In countries with continental climates, including Kazakhstan, improving resource efficiency, preserving soil fertility, and reducing the energy requirements of field operations have become major priorities [1]. The grain-producing regions of Northern Kazakhstan are characterized by a sharply continental climate (long, frosty winters with strong winds and blizzards, hot, dry summers, and a large annual temperature amplitude; mean January temperatures of about −15 to −19 °C, mean July temperatures of about +19 to +24 °C, and annual precipitation of about 300–400 mm). Consequently, the soil is dry and hard during the tillage period, and finely tilled bare soil is exposed to wind. Together with limited soil moisture availability and uneven precipitation distribution, this accelerates soil degradation processes within agricultural landscapes [2]. The region lies in the forest-steppe and steppe zones, and its flat terrain offers no natural barriers to wind; consequently, wind erosion is widespread. The arable soils of the region are predominantly medium and heavy loams with a high content of fine clay particles (up to 70–80%), making them highly susceptible to compaction and deterioration of the soil water–air regime [3].
Previous studies [4] have shown that a decline in soil organic matter (humus) content to 3–5% indicates progressive soil fertility degradation, which is further aggravated by the reduced application of organic fertilizers. The incorporation of crop residues into the upper soil layer enhances soil physical properties, improves soil moisture retention, and mitigates erosion processes [5].
Optimizing the geometry of disc and rotary tillage implements has been shown to reduce draft resistance and improve furrow formation quality [6]. Likewise, disc implements with modified cutting-edge geometry have been reported to improve the cutting of crop residues and to reduce the energy requirements of tillage [7]. However, existing designs are characterized by relatively high draft resistance, limited operational stability, and insufficient incorporation of crop residues, particularly on dry soils and perennial grass sod, where cone-penetrometer resistance can reach several MPa (this index is not comparable with the soil hardness of 0.38 MPa measured in the present study with the VISHOM tester (Moscow, Russia); Section 2.4). Previous studies [8] have demonstrated that the operating parameters of disc tillage implements, including the disc angle of attack, forward speed, and tillage depth, strongly influence the degree of crop residue fragmentation and incorporation.
Current trends in agricultural machinery development favor wide-cut tillage implements compatible with 350–550 hp tractors, which increase field capacity and reduce the number of field passes [9]. Nevertheless, the adaptation of such implements to the soil and climatic conditions of Northern Kazakhstan remains limited [10]. Studies on the effect of disc setup angles and working depth on the working resistance of disc harrows [11], on the estimation of draft force from soil-mechanics principles [12], and on the influence of implement geometry on soil failure [13] agree that draft force increases with working depth and disc angle. Research on the gang angle of offset disc harrows [14], the adjustment of disc harrows for stubble tillage [8], and the tractor energy requirements of disc-harrow systems [15] relates the same settings, together with forward speed, to soil tilth, work rate, and fuel consumption. Four research gaps remain. First, most of this work addresses draft force or fuel consumption per hour or per hectare for lighter implements, and specific energy per hectare is rarely related, within the same pass, to the quality indicators required by the standards (depth, fragmentation, residue incorporation, and cutting). Second, in field tests, the effects of angle and forward speed are often confounded and are seldom separated quantitatively. Third, to the authors’ knowledge, generalized draft-prediction models, such as the American Society of Agricultural and Biological Engineers (ASABE) D497.7 [16], have not been verified against measurements on wide-cut harrows of high specific mass (about 1 t per meter of working width) on heavy-loam sod. Fourth, practical structural measures that bring residue cutting at lower angles to the required level have not been documented for this class of soils. The present study addresses these gaps in turn: it relates specific energy per hectare to the quality indicators within a single pass (Section 3.1 and Section 3.2), separates the effects of angle and speed as far as the experimental design allows (Section 2.8 and Section 3.2), compares the measured draft with ASABE D497.7 (Section 3.2 and Section 4.1), and proposes structural measures for lower angles (Section 4.3).
An analysis of state-of-the-art designs indicates that further development of heavy disc harrows is primarily associated with novel arrangements of disc sections and the integration of combined working elements [17]. Particular emphasis has been placed on achieving stable furrow formation and enhancing soil–tool interaction, as demonstrated by studies investigating the influence of rotary and cutting elements on tillage performance [18].
Research on disc harrows for the continental, heavy-loam conditions of Northern Kazakhstan remains scarce. The available regional and neighboring literature addresses the reduction of the aftereffect of machine units on the soil [10], field tests of a disc-chisel harrow [19], a harrow with a turning disc section [17], and furrow formation by rotary and arrow-headed working bodies [18]. These studies deal with individual working elements or prototypes; to the authors’ knowledge, none of them combines the structural configuration, the load distribution between working and supporting elements, and the agrotechnical, energy, and operational indicators of a wide-cut (7 m) heavy disc harrow tested on perennial grass sod under local conditions. Among the heavy disc harrows of comparable working width produced in the Eurasian Economic Union, the APD-7.5M-1 (Bobruiskselmash, Belarus; 7.5 m) has 560 mm discs and a single angle of attack of 15° [20]. In Kazakhstan, farms also use heavy disc harrows of the BDT-7 type with the same nominal working width (7 m; 66 discs, angles of attack of 12°, 15°, and 18°, mass of about 3.55 t); the technical data of the model sold in the country [21] are compared with those of the studied harrow in Section 4.1. The spherical discs of the harrow studied here are adopted from the BDT/BDM heavy harrows; the study therefore concerns the configuration, the load-carrying elements, and the performance of the machine rather than a new disc design.
The novelty of this study is specific and limited in scope. The contribution consists of (i) an engineering configuration that, within the class of 7 m disc harrows compared in Section 4, combines three-step adjustment of the angle of attack (12–18°) with a specific mass of 0.96 t m−1, intermediate between that of the BDT-7 type (0.5 t m−1) and that of the AMAZONE Certos 7002-2TX (1.26 t m−1), and is carried by support wheels and a rod roller; the configuration is protected by patents of Kazakhstan (Section 6); and (ii) a quantified set of single-pass agrotechnical, energy, and operational indicators for this configuration on heavy-loam perennial grass sod, with the measured draft compared with ASABE D497.7 and related to the specific mass of the harrow. The study does not claim superior field performance over any of the machines considered, because comparable measured data are not available for them (Section 4).
The aim of this study was to investigate the structural and technological configuration and design parameters of a 7.0 m heavy disc harrow intended for use with traction class 5–6 tractors and to evaluate its agrotechnical, energy, and operational performance under field conditions. Tillage quality was assessed using the indicators required by the testing standards, namely, tillage depth and its uniformity, soil fragmentation, incorporation and cutting of crop residues and weeds, and surface roughness (Section 2.7). Improved quality of shallow tillage is understood here as strict compliance with the agrotechnical requirements at minimum energy expenditure while preserving soil structure, thereby creating favorable conditions for seed germination without disturbing the deeper soil biocenoses and while preventing erosion.
The specific objectives of the study were as follows:
- To investigate the structural and technological configuration and design parameters of a wide-cut heavy disc harrow;
- To determine the operating conditions and evaluate the influence of the selected working element parameters;
- To conduct field experiments and evaluate the agrotechnical and energy performance of the implement;
- To separate, as far as the experimental design allows, the effects of the angle of attack and of the forward speed, to compare the measured draft resistance with the ASABE D497.7 prediction, and to propose structural measures for improving residue cutting at the lower angles of attack.
2. Materials and Methods
2.1. Study Object and Description of the Heavy Disc Harrow
The investigated implement is a two-row disc harrow of heavy construction, intended for primary and intensive surface tillage with a high-traction-class tractor. Terminology for tillage implements follows ASABE S414.2 (Terminology and Definitions for Agricultural Tillage Implements) [22]. In this article, the term “heavy” is based on the specific mass of the implement: the construction mass of the studied harrow is 6700 kg (65.7 kN; Table 1), or about 0.96 t per meter of working width, which is about 1.9 times the mass per meter of BDT-7 harrows of the same working width (about 3.55 t for 7 m [21]).
The implement has a construction width of 7.2 m and a working width of 7.0 m (the difference allows for the overlap required to prevent untreated strips between adjacent passes). It is equipped with 72 notched disc working elements, 660 mm in diameter, arranged in eight sections of nine discs each. The sections are arranged in two rows of four, with a disc spacing of 210 mm. The angle of attack (α) of the disc section is defined as the angle between the longitudinal axis of the disc section and the direction of travel of the implement, measured in the horizontal plane. In the present study, three angles of attack (α = 12°, 15°, and 18°) were investigated (Figure 1). These three levels were chosen because they correspond to the three discrete positions of the section-bracket pin holes, coincide with the angles (12°, 15°, and 18°) specified for harrows of this class in ST RK 1559-2006 [23] (table No. 6 of the standard) and in the specification of the BDT-7 type [21], and cover the entire adjustment range of the machine (12° is the lowest setting, 18° the highest, and 15° the intermediate one). The 210 mm disc spacing was adopted as a fixed structural parameter of the disc sections to provide the required overlap of adjacent disc trajectories and continuous soil cutting across the working width.
Figure 1.
Angle of attack α of the disc section: (a) α = 12°; (b) α = 15°; (c) α = 18°.
The structural configuration of the implement is shown in Figure 2 and comprises a frame (1), a rod roller (2), deflector shields (3), disc sections (4), support wheels (5), support-transport wheels (6), and a hitch assembly (7).
Figure 2.
Structural configuration of the wide-cut heavy disc harrow designed for operation with tractors of traction classes 5–6: 1—frame; 2—rod roller; 3—deflector shields; 4—disc sections; 5—support wheels; 6—support-transport wheels; 7—hitch assembly.
During operation, the weight of the implement forces the disc working elements into the soil, where they cut and incorporate crop residues while forming the tilled soil layer.
In Figure 2, the support-transport wheels (6) are used only for transport and have no contact with the soil during operation.
2.2. Analytical Model and Mathematical Formulation
2.2.1. Assumptions and Equilibrium Equations
The theoretical analysis was based on mathematical modeling. The model is a quasi-static force balance of the implement. Only its horizontal part (Equations (1) and (4)) can be evaluated from the measured inputs (up to the rolling resistance of the support wheels) and is used here as a consistency check of the measured draft resistance; Equations (2) and (3) are given for completeness as equilibrium conditions; they cannot be solved for the vertical load distribution and are not used to predict it. They are retained because they show that the vertical load distribution is statically indeterminate (see below), and, together with the lever arms of Table 1, they give the upper bound Rxk ≤ 5.8 kN used in Section 3.4.
The analysis accounted for the soil reaction forces acting on the support wheels, the rod roller, and the disc working elements [24].
To simplify the analytical model, and following the assumptions adopted in previous studies [25], the implement was assumed to follow the field microrelief under the combined action of the active forces (tractive force and implement weight) and the constraint reactions generated by the support wheels, the rod roller, and the disc sections.
The assumptions of the model are summarized as follows: (i) the implement is treated as a rigid body in the vertical longitudinal plane (Figure 3) with left–right symmetry of the loads, so that the support wheels, the transport wheels and the disc sections of each row are represented by one reaction each; (ii) the motion is steady and rectilinear at constant speed, so that the inertial terms are zero; (iii) the drawbar force is horizontal (Pyt = 0) and is applied at the origin O; (iv) the soil reactions on the disc sections and on the rod roller are concentrated forces with the lever arms of Table 1; (v) the rolling resistance of the support wheels and of the rod roller is proportional to their vertical loads through constant coefficients µk and µp (Equation (4)), independent of the speed and of the soil state; (vi) the horizontal soil reactions Rxd and Rxp are taken from the rig tests and are assumed to be transferable to the full-width harrow without scaling; (vii) the frame, the tires, and the soil are not deformable in the model, so that no compatibility relations are available for the vertical reactions. Assumptions (vi) and (vii) are the main limitations: (vi) determines the accuracy of the horizontal check (Section 3.4), and (vii) is the reason why the vertical load distribution is not resolved.
Figure 3.
Computational model of the wide-cut heavy disc harrow for operation with tractors of traction classes 5–6. Pxt—horizontal drawbar force; Gb—implement weight; Rxd1, Rxd2 and Ryd1, Ryd2—horizontal and vertical soil reactions on the front and rear disc sections; Rxp, Ryp—horizontal and vertical reactions on the rod roller; Ryk—vertical reaction of the support wheels; Rxk—rolling resistance of the support wheels; Pyt—vertical drawbar force (Pyt = 0 in the calculations); O—hitch point (origin of the coordinates); Hk, Hd, Hp, Lk, Ld1, Ld2, LGb, and Lp—lever arms listed in Table 1 (L—horizontal distances from O; H—vertical distances from the horizontal plane through O to the lines of action of the horizontal reactions); the dimension Lc shown in the figure is not used in the equations.
The equilibrium of the implement is analyzed by d’Alembert’s principle in its quasi-static form: for steady motion at constant speed, the inertial forces are equal to zero, so that the problem reduces to static equilibrium and Equations (1)–(3) contain no inertial terms. Vertical oscillations of the harrow are assumed to be negligible because of the relatively low operating speed (up to 11.5 km h−1) and the large mass of the implement.
A computational model of the heavy disc harrow was developed to analyze forces and constraint reactions under steady-state operating conditions. The harrow design and force-equilibrium model are shown in Figure 2 and Figure 3, respectively. Soil reactions were resolved into horizontal and vertical components. The support wheels were assumed to share a common axis, while the support-transport wheels remained off the ground during operation. Because the implement is towed by a drawbar, the drawbar force was considered to act along the longitudinal axis of the implement, and its vertical component was neglected under the adopted quasi-static assumption (Pyt = 0); this differs from the three-point-hitch scheme of [26], in which a vertical hitch force appears, and the model therefore does not follow that scheme.
The quasi-static equilibrium equations of the implement can be expressed as follows:
In Equation (2) the vertical component of the drawbar force is zero (Pyt = 0) and the vertical reactions of the front and rear disc sections are written separately (Ryd1 + Ryd2), as in Equation (3) and Figure 3; vertical reactions are taken positive upwards. The vertical reaction values recorded in the preliminary rig tests (Ryd = 46.1 kN and Ryp = 35.3 kN) together exceed the implement weight (81.4 kN against 65.7 kN) and are inconsistent with Equation (2); they were therefore excluded from Table 1 and from all calculations, and they illustrate why the vertical load distribution was not calculated.
Sign convention. The origin O is at the hitch point, and the direction of travel is to the left in Figure 3. The lever arms L (backward from O) and the heights H (downward from the horizontal plane through O) are positive; the vertical reactions are positive upwards, and the horizontal soil reactions act against the direction of travel. The moment of the weight Gb about O is positive (clockwise in Figure 3); the moments of the soil reactions enter with a minus sign, and Pxt gives no moment. The reactions Rxk and Rxp act at the soil surface (Hk = Hp = 0.68 m), and Rxd1 and Rxd2 act at the working depth h = 0.10 m below it, so that Hd = Hk + h = 0.78 m (Table 1).
2.2.2. Rolling Resistance and Static Indeterminacy of the Vertical Load Distribution
The relationships between the reaction forces associated with rolling resistance can be expressed as follows:
where µk represents the rolling resistance coefficient of the support wheels;
µp represents the rolling resistance coefficient of the rod roller.
Table 1 contains the known quantities (Gb, Rxd = Rxd1 + Rxd2, Rxp, µk, and the lever arms); Pxt, Rxk, Ryk, Ryd1, and Ryd2 are unknowns and are not in Table 1. Ryp is also unknown. Equation (4) relates it to the measured Rxp = 8.8 kN through µp, i.e., Ryp = Rxp/µp; however, the value µp = 0.25 that follows from the rig forces would give Ryp = 35.3 kN, which is incompatible with Equations (2) and (3), whose admissible range is Ryp ≤ 26.8 kN (see below), i.e., µp ≥ 0.33. Ryp is therefore not derived from µp, and the unknowns of the vertical balance are Ryk, Ryd1, Ryd2, and Ryp. The coefficient µp of the rod roller was not determined independently and is therefore not given in Table 1. Because Rxd1 and Rxd2 act at the same height Hd, only their sum Rxd is needed in numerical form.
The vertical load distribution among the support wheels, the rod roller, and the disc sections is statically indeterminate: the number of unknown vertical reactions (Ryk, Ryd1, Ryd2, Ryp) exceeds the number of independent equilibrium equations (four unknown vertical reactions against the two Equations (2) and (3)), and a unique solution would require deformation (compatibility) relations for the soil, tires, and frame.
Vertical load distribution. From the vertical balance alone, only bounds can be derived: because the implement is supported solely by the vertical reactions, each of them lies between 0 and the implement weight, so that, with µk = 0.15, the omitted rolling resistance of the support wheels is at most 0.15 × 65.7 ≈ 9.9 kN. Equation (3) tightens this bound. With Rxd = 45.1 kN, Rxp = 8.8 kN, Rxk = 0.15Ryk, and the lever arms of Table 1, Equations (2) and (3) become Ryk + Ryd1 + Ryd2 + Ryp = 65.7 kN and 1.80Ryk + 3.1Ryd1 + 4.2Ryd2 + 5.9Ryp = 228 kN·m. The mean lever arm of the three other reactions cannot exceed Lp = 5.9 m; hence Ryk ≤ 38.9 kN and Rxk ≤ 0.15 × 38.9 ≈ 5.8 kN, and the same condition gives Ryp ≤ 26.8 kN. The input parameters used in the numerical calculations are summarized in Table 1. Because the vertical reactions are statically indeterminate and were not calculated (see above), the coefficient µk = 0.15 in Table 1 is used as an input value of the model and is treated as indicative.
2.2.3. Input Data of the Model
The values of Rxd and Rxp in Table 1 are representative values of the force characteristics measured on the test rig (Figure 4) under the conditions of the rig tests; their sum (53.9 kN) coincides with the highest draft measured in the field (53.93 kN at 18° and 11.1 km h−1; Section 3.4), so they cannot be assigned to the reference speed of 2.7 m s−1 and depth of 0.10 m given in Table 1 and are used as model input data. Uncertainty of the rig inputs. The rig data were obtained on a reduced-width prototype and were applied to the 7.0 m harrow without equivalent scaling, because the scaling relationship between the narrow rig and the full-width harrow (interaction of adjacent sections, share of the load carried by the support wheels, soil heterogeneity across 7 m) was not established. Rxd and Rxp are therefore indicative reference values and not predictions for the full-width machine. The lever arms in Table 1 (Hd, Hp, Hk, Ld1, Ld2, LGb, Lp, Lk) are used only in Equation (3) to bound Rxk in Section 2.2, and in no other calculation.
Figure 4.
Experimental setup based on a reduced-width prototype for measuring the horizontal and vertical components of the draft resistance of the disc working elements and the rod roller.
Table 1.
Input of the mechanical model (Figure 3, Equations (1)–(4)); the force characteristics Rxd and Rxp were obtained from rig measurements.
2.3. Software
The numerical evaluation of the model parameters and the force balance in Section 3.4 were performed using MATLAB R2024a (The MathWorks, Inc., Natick, MA, USA). Statistical analysis of the experimental data was carried out using Microsoft Excel (Microsoft Corporation, Redmond, WA, USA) and STATISTICA 13.0 (Dell Software Inc., Round Rock, TX, USA). Data visualization and the generation of graphs were performed using Microsoft Excel and MATLAB.
2.4. Experimental Setup and Measurement Procedure
Field experiments were conducted using a Kirovets K-735 Standard tractor (Petersburg Tractor Plant, St. Petersburg, Russia) of traction class 6 (Table 2). Tractor tire pressures were set according to the operating manual but were not recorded in test protocol No. 18-859-2025. The harrow has two support wheels and two transport wheels, with maximum tire pressures of 0.34 and 0.25 MPa, respectively. The tractive (drawbar) force was measured with a strain-gauge load cell in the hitch assembly, following the procedure described below, and was taken as the draft resistance of the implement. Wheel slip was not recorded; therefore, no slip values are reported (Section 3.2 and Section 4).
Table 2.
Main technical characteristics of the Kirovets K-735 Standard tractor used in the field experiments.
Preliminary measurements were performed on a dedicated reduced-width test rig (Figure 4) to determine the force characteristics of the disc working elements and the rod roller. The field tests comprised nine operating modes: three angles of attack (12°, 15°, and 18°), each at three forward-speed levels (about 9.0–9.5, 10.8, and 11.1–11.5 km h−1), with one pass per mode. The actual speed of each mode was measured and differed slightly between the angle groups (Section 3.1); the experiment is therefore a multi-condition comparison rather than a single-factor test (Section 2.8). Tillage depth was measured after a single pass of the disc harrow with a probe and a metal ruler (accuracy 1 mm) at 25 points in each of four replicates (100 readings per condition) in accordance with ST RK 1559-2006 [23]. The forward speed was determined from the time taken to cover a 100 m measured section, recorded with a stopwatch in four replicates per condition. The angular and spatial displacements of the implement components were recorded using MEMS-based sensors with an angular measurement accuracy of ±0.1°. The disc section angle of attack was determined relative to the direction of travel. The soil conditions were characterized by a moisture content of 14.4%, a hardness of 3.9 kgf cm−2 (0.38 MPa), measured in the 0–20 cm layer with a soil hardness tester of the VISHOM design (Moscow, Russia), and a bulk density of 1.4 g cm−3 (heavy loam soil).
The test rig was used to determine the soil reaction on the sections of disc working elements and the rod roller (preliminary values, Table 1); the selection of the number of disc rows is beyond the scope of this article. Draft resistance was measured using a strain-gauge measurement system comprising a UU S-type tension load cell (DACELL Co., Ltd., Cheongju, Republic of Korea; rated capacity 10 t) and a ZET017-T8 strain-gauge data acquisition system (ZETLAB Company, Zelenograd, Moscow, Russia), which provided real-time acquisition and processing of experimental data (Figure 5). Hourly fuel consumption was measured using an IP-197 PS flow meter (Experimental Enterprise of KubNIITiM, Novokubansk, Krasnodar Krai, Russia; 10.2 mL per pulse; four replicates of 40 s).
Figure 5.
Strain-gauge measurement equipment: (a) strain-gauge measurement system; (b) drawbar dynamometer test equipment; (c) calibration stand for strain-gauge load cells.
The prototype harrow coupled with the Kirovets K-735 tractor, as used in the field tests, is shown in Figure 6.
Figure 6.
Prototype of the wide-cut heavy disc harrow coupled with the Kirovets K-735 tractor: (a) side view; (b) rear-side view.
2.5. Calibration and Uncertainty of the Draft Measuring Channel
2.5.1. Calibration Procedure
Before and after the tests, the strain-gauge measurement system was calibrated on a dedicated calibration stand using a stepwise loading–unloading procedure with a reference dynamometer (capacity: 100 kN [10 tf]; stated measurement error: 0.5%). The error of the draft measuring channel (S-type load cell with the ZET017-T8 station) was 1.5%. The calibration was carried out stepwise up to 100 kN (10 tf), i.e., over the whole measuring range of the load cell (rated capacity 10 t, about 98 kN). The measured drawbar forces of 44.1–53.9 kN (45–55% of the range) lie inside the calibrated range, so no extrapolation beyond the calibration is involved, and the linearity of the measuring channel in the working range is covered by the channel error of 1.5% given above.
The statistical processing of the measurements, the replication of the tests, and the statistical tests used are described in Section 2.8 [27]. The uncertainty budget of the measured draft (reference dynamometer, measuring channel, and sampling variability) is given in the next paragraph.
2.5.2. Assessment of Draft Force Measurement Uncertainty
The known components are (i) the error of the reference dynamometer, 0.5%; (ii) the error of the measuring channel (load cell with the ZET017-T8 station), 1.5%; their root-sum-square is 1.6%, i.e., ±0.7 kN at 44 kN and ±0.9 kN at 54 kN; and (iii) the random (sampling) component, i.e., the standard error of the mean of the six readings per mode, which was 0.23–0.67 kN, or 0.4–1.2% of the mean (standard deviation (SD) of the readings, 0.55–1.62 kN; Section 3.1). Combined with the instrumental error (i)–(ii) (1.6%) by root-sum-square, it gives 1.7–2.0%, i.e., about ±0.8 kN at 44 kN and ±1.1 kN at 54 kN. The load-cell readings were converted from kgf to N at 9.81 N per kgf. Measurement uncertainty should be considered in relation to the differences between operating conditions: a 9.8 kN (22%) range in draft resistance, a margin of at least 11 kN below the 65 kN limit, and a ratio of measured draft to ASABE D497.7 predictions of 1.83–2.26. Systematic error components common to all operating conditions have limited influence on their relative comparison. Uncertainty in power and specific energy consumption depends on draft uncertainty; uncertainty in speed measurement and field capacity was not assessed separately.
2.6. Comparison with the ASABE D497.7 Draft Model
For comparative validation of the measured draft resistance, the experimental values were additionally compared with the draft force predicted using the ASABE D497.7 standard model [16]. The draft force was calculated according to Equation (5):
where D is the draft force, Fi is the soil-texture adjustment factor, A, B, and C are implement-specific coefficients (A = 309, B = 16 and C = 0 for a primary-tillage tandem disc harrow; these coefficients reproduce the predicted values given in Section 3.2), S is the operating speed, W is the working width, and T is the tillage depth. In this formula, D is in N, S in km h−1, W in m, and T in cm; these units reproduce the predicted values given in Section 3.2. For the present comparison, the soil was treated as medium-textured (loamy), and a soil-texture adjustment factor of Fi = 0.88 was used for the primary-tillage tandem disc harrow, in accordance with ASABE D497.7 (the table of draft parameters of the standard). The standard assigns the factors F1 = 1.00, F2 = 0.88, and F3 = 0.78 to fine-, medium-, and coarse-textured soils, respectively, for this implement category. As the particle-size distribution and clay content of the experimental soil were not determined, the medium-textured classification was treated as an assumption. A sensitivity analysis using Fi = 1.00 was therefore also performed.
2.7. Agrotechnical, Energy, and Operational Performance Evaluation
2.7.1. Indicators and Test Methods
Indicators analyzed. Agrotechnical (tillage-quality) indicators: mean tillage depth and its standard deviation, soil fragmentation (share of particles smaller than 50 mm, %), crop residue incorporation (%), crop residue and weed cutting efficiency (%), surface roughness (ridge height, cm) and the content of erosion-prone particles (<1 mm, %) in the 0–5 cm layer. Energy indicators: draft resistance (kN), drawbar power (kW), specific energy consumption (MJ ha−1), hourly fuel consumption (kg h−1), and fuel consumption per hectare (kg ha−1). Operational indicators: field capacity per hour of main, technological, and shift time (ha h−1), the time-utilization coefficients, and the shift-time fuel consumption.
The field tests were conducted in accordance with GOST 24055-2016 [28] (operational evaluation), GOST 20915-2011 [29], ST RK 1559-2006 [23], and GOST 34631-2019 [30]. To determine the content of erosion-prone soil particles, soil samples were collected from the 0–5 cm surface layer before and after tillage. For each operating condition, three samples (2.3–3.3 kg each) were taken before and three after the pass; the fraction passing a 1 mm round-hole sieve was separated on a sieve stand and weighed, and the value in Section 3.1 is the mean of the three samples. The 1 mm sieve was chosen because soil particles smaller than about 1 mm are conventionally regarded as erosion-prone (wind-erodible), whereas larger aggregates and clods resist deflation; the fraction below 1 mm therefore characterizes the erosion hazard of the surface layer. This indicator is particularly important in Northern Kazakhstan, where wind erosion is widespread. Each sample was dried, sieved, and weighed separately, and the content of erosion-prone particles of a sample was calculated as Epc = (m1/mt) × 100, where m1 is the mass of the fraction passing the 1 mm sieve, and mt is the total mass of the sample, g; in total, 54 samples were analyzed (three before and three after tillage in each of the nine operating conditions). Crop residue and weed cutting efficiency were determined after a single pass of the disc harrow by comparing the amount of crop residues and weeds present before and after tillage within the selected measurement areas. It was calculated as Wce = (1 − Ua/Ub) × 100, where Ub is the amount of crop residues and weeds in the measurement frame before the pass, and Ua is the amount left uncut after the pass; 15 sampling frames were used per condition; the cutting efficiency was calculated for each frame from its own amounts before and after the pass. The initial weed density of 23 plants m−2 is the mean value for the test plot given in the test protocol (plants counted in the sampling frames before the pass and expressed per m2), not a count that was identical in every frame. Weed infestation was assessed by the quantitative method on sampling plots distributed evenly over the test plot (along the diagonal or along the length of the machine pass), with the weeds counted separately on each plot; the number and size of the plots were chosen in accordance with GOST 20915-2011 [29]. Crop residue incorporation (Section 3.1) was determined in 10 sampling frames per condition as the share of the surface crop residues that were buried or mixed into the soil by the pass: Ci = (1 − Ra/Rb) × 100, where Rb and Ra are the amounts of surface crop residues per frame before and after the pass (Ci is denoted Crir in the figure in Section 3.1). It differs from the cutting efficiency, which characterizes the cutting of residues and weeds.
2.7.2. Operational and Energy Indicators
The operational and technological evaluation was conducted in accordance with GOST 24055-2016 [28] using time-motion observations of the unit. The working-stroke coefficient, technological service coefficient, process reliability coefficient, and technological-time and shift-time utilization coefficients were determined from the test protocol (Section 3.3). Field capacity was assessed per hour of main, technological, and shift time. The theoretical field capacity was calculated from the working width and operating speed as Wt = 0.1·B·V, where B is the working width (m), and V is the operating speed (km h−1). At a working width of 7.0 m, theoretical field capacity was calculated for each operating speed and angle of attack. Capacity per hour of main time was determined from the treated area and operating time; capacity per hour of technological and shift time was determined from the corresponding times (results in Section 3.3). Speed (V) is expressed in m s−1 in Table 1 and in km h−1 in the equation and the tables in Section 3 (1 m s−1 = 3.6 km h−1).
Energy indicators. The drawbar power was calculated as N = F·V/3.6 (kW), where F is the drawbar force (kN), and V is the measured actual operating speed (km h−1); the specific energy consumption as E = 3.6·N/W1 = F·V/W1 (MJ ha−1), where W1 is the field capacity per hour of main time (ha h−1).
2.7.3. Soil Fragmentation and Surface Roughness
Soil fragmentation (SF) (denoted SF in the figure in Section 3.1) was expressed as the mass percentage of soil particles smaller than 50 mm in the sampled tilled layer:
where m50 is the mass of the soil fraction passing the 50 mm sieve, g, and mt is the total mass of the sample, g. The content of erosion-prone soil particles was calculated in the same way for the fraction smaller than 1 mm. Three samples were taken per condition; the fractions >50, 25–50, 10–25, 5–10, 1–5, and <1 mm were separated by sieving and weighed. The soil fragmentation of a condition is the mean of the three values calculated for its samples.
Surface roughness (ridge height, cm) was determined in accordance with ST RK 1559-2006 [23] with a measuring rail and a ruler as the height of the ridges above the surface level, at 10 points in each of four forward and four reverse passes; the mean and the standard deviation over these measurements are given in Section 3.1 (the standard deviations are rounded to whole centimeters; they are of the same order as the means, which indicates strong variability of ridge height within each condition).
where hi is the ridge height at the i-th measurement point, cm; n = 80 (10 points × 8 passes) is the number of measurements per condition; Rs is the mean ridge height given in Section 3.1, cm; and sR is its standard deviation, cm. The soil conditions (moisture content, hardness, and bulk density) are given in Section 2.4. The soil was classified as a heavy loam, the field surface was level, and the mean height of the plant stand was 12 cm.
2.8. Statistical Analysis
Statistical analysis was performed after verifying the repeatability of the experimental data [27]. The number of observations followed the test program and differed between indicators: draft resistance–three readings in each of the forward and reverse directions (six values per condition); tillage depth–25 points in each of four replicates; surface roughness–10 points in each of four forward and four reverse passes; operating speed–four timed 100 m runs; fuel consumption–four 40 s intervals; soil fragmentation and erosion-prone particles–three samples per condition; crop residue incorporation–10 sampling frames; crop residue and weed cutting efficiency–15 sampling frames. Treatment means are reported with standard deviations (SD) and 95% confidence intervals calculated from the individual readings of the test protocol (Section 3.1); the energy indicators were calculated from the mean of six draft measurements, four speed measurements, and four fuel records for each operating condition (Section 3.2).
Each of the nine modes was run under one set of conditions, and replicated runs of a whole mode at a fixed speed were not carried out (Section 4); the variability reported is therefore the within-condition variability (spatial for the tillage depth and the surface roughness, between samples for the fragmentation, the incorporation, and the cutting), and the between-run variability is not available. Forward and reverse passes were treated as repeated measurements, not independent replicates. The experiment is a multi-condition comparison of nine operating modes (three angles of attack, each at three actual forward speeds), not a strict single-factor test: the forward speed was not fixed independently and differed among the angle groups (by up to 0.5 km h−1 at the lowest and 0.4 km h−1 at the highest speed level; the intermediate speed of 10.8 km h−1 was common to all angles), so the effect of the angle of attack is confounded with that of speed.
The effect of the angle was therefore examined in two ways. (i) At the common speed of 10.8 km h−1, where the speed was identical for all angles, it was tested by one-way analysis of variance on the individual readings (draft, n = 6 per angle; tillage depth, n = 100; surface roughness, n = 80; residue and weed cutting, n = 15 sampling frames; residue incorporation, n = 10 frames; soil fragmentation, n = 3 samples), followed by pairwise Welch t-tests with the Bonferroni correction for three comparisons (family-wise α = 0.05); the results are given in Section 3.1. (ii) An ordinary least-squares linear regression of each response on the angle α and the speed V over the nine modes gave partial coefficients for α and V with t-statistics and R2. With nine operating conditions and six residual degrees of freedom, the regression is descriptive and does not replace an experiment with replicates at a fixed speed. Standard errors, 95% confidence intervals of the coefficients, and the residual standard deviation are reported, and the predictive performance was assessed by leave-one-out cross-validation (Section 3.2). The regressions were fitted to the mean speed of each mode (Section 3.1). The decrease in the content of erosion-prone particles (<1 mm) after the pass was tested by a two-sided paired t-test on the nine pairs of before and after means of the operating modes (Section 3.1; the modes are treated as paired observations, so the test is descriptive) and, within each mode, by Welch’s t-test on the three samples taken before and the three taken after the pass (α = 0.05, without correction for multiplicity, so the per-mode results are indicative) (Section 3.1).
Tillage depth was not set independently of the angle: it is itself a response to the angle of attack (correlation coefficient 0.96 between the angle and the depth over the nine modes) and depends only weakly on the speed. Depth was therefore taken into account descriptively: the draft and energy indicators were also expressed per centimeter of tillage depth (Section 3.2), and the compliance of the depth with both standards was checked for each mode (Section 3.1).
3. Results
The tested harrow features a staggered two-row arrangement of the disc sections mounted on a flat frame. The implement is equipped with height-adjustable front support wheels and a rear-mounted rod roller. The design is intended to control tillage depth, level the field surface, and reduce the content of erosion-prone fine particles in the surface soil layer. However, soil resistance to wind erosion was not directly assessed. The results were obtained under the soil conditions described in Section 2.4; the individual contributions of the rod roller and support wheels were not determined. The adjustable support wheels are intended to enable tillage depth control, including on loose soils in summer fallow fields (this was not tested in the present experiments, which were carried out on perennial grass sod). Mean values and variability indicators are presented in Table 3, Table 4 and Table 5.
3.1. Agrotechnical Performance Evaluation of the Wide-Cut Heavy Disc Harrow
3.1.1. Tillage Quality Indicators
Field tests of the wide-cut heavy disc harrow coupled with a class 6 tractor were conducted during the tillage of perennial grass sod to evaluate its agrotechnical performance and to assess the influence of operating conditions on tillage quality. The experiments were carried out at forward speeds ranging from 9.0 to 11.5 km h−1 and at different angles of attack of the disc sections. The prototype harrow was operated in combination with the Kirovets K-735 tractor (Figure 6, Section 2.4). The experiments were conducted at disc section angles of attack of 12°, 15°, and 18° over the range of operating speeds specified by the applicable standards.
During tillage of perennial grass sod, the harrow operated stably under all tested conditions, with no clogging or soil adhesion to the working elements (Table 3). As the disc section angle of attack increased from 12° to 18°, mean tillage depth increased from 7.0–7.8 cm to 9.4–9.6 cm, reaching 8.5–8.8 cm at 15°. The depth requirement is stated differently in the two normative documents: up to 15 cm with a standard deviation of ±3 cm in ST RK 1559-2006 (Table 3) and 8–12 cm in GOST 34631-2019 (Table 5). All modes met the first; against the 8–12 cm range, the depth complied at 15° and 18° and was 0.2–1.0 cm below its lower limit at 12°. In all test conditions, the forward speed remained below the maximum permissible value of 12 km h−1, confirming that the operating conditions complied with the applicable standard requirements.
Table 3.
Agrotechnical performance of the wide-cut heavy disc harrow coupled with the Kirovets K-735 tractor during the tillage of perennial grass sod.
Table 4.
Within-mode variability of measured indicators (mean ± standard deviation, SD; number of readings, n; 95% confidence interval of mean draft).
The main soil tillage quality indicators obtained from the field experiments and reported in Table 3 are presented graphically in Figure 7, illustrating the effect of the disc section angle of attack on soil fragmentation, crop residue incorporation, weed cutting efficiency, and the content of erosion-prone soil particles.
Figure 7.
Effect of the disc section angle of attack α (12°, 15°, and 18°) on the main soil tillage quality indicators: (a) proportion of soil particles smaller than 50 mm, (b) crop residue incorporation, (c) crop residue and weed cutting efficiency, and (d) content of erosion-prone soil particles. Abbreviations used in the figure: α—disc section angle of attack, °; SF—proportion of soil particles smaller than 50 mm, %; Crir—crop residue incorporation, %; Wce—crop residue and weed cutting efficiency, %; Epc—content of erosion-prone soil particles (<1 mm) in the 0–5 cm layer after tillage, %. The values are for the common operating speed of 10.8 km h−1 (Table 3). Markers show the values at each angle of attack, and the lines are linear trend lines.
The results showed that the disc section angle of attack affected tillage performance. Mean tillage depth ranged from 7.0 to 9.6 cm, meeting GOST 34631-2019 requirements only at 15° and 18°, while ST RK 1559-2006 requirements were met in all modes. Soil fragmentation (particles < 50 mm) ranged from 80.1–82.1% at 12°, 83.1–90.5% at 15°, and 81.6–94.5% at 18°. Despite a tendency toward finer fragmentation at larger angles, the effect was not statistically significant (ANOVA, p = 0.63). Surface roughness did not exceed the permissible 5 cm under any operating condition (the maximum, 5.0 cm, was recorded at 18° and 11.1 km h−1; at that mode, the mean reached the limit, and the standard deviation of 4 cm indicates that some of the ridges were higher than 5 cm). The angle of attack strongly influenced crop residue and weed cutting efficiency. At 12°, efficiency ranged from 80.6% to 95.4%, increasing to 95.5–100% at 15° and reaching 100% across all tested speeds at 18°. The proportion of erosion-prone soil particles (<1 mm) decreased from 29.9% to 25.2% after tillage (paired t-test over the nine modes: mean decrease 4.7 percentage points, 95% CI 3.6–5.8, t = 9.9, df = 8, p < 0.001; Section 2.8). However, significant reductions were observed in only two of nine operating modes, tested separately in each mode (Welch’s t-test on three samples before and three after the pass, α = 0.05), and increased resistance to wind erosion cannot be inferred directly from these results. These findings are consistent with those reported in [31], where field performance tests of an implement equipped with actively driven rotary working elements also demonstrated improved crop residue and weed cutting efficiency with increasing soil-working intensity and optimized operating conditions.
3.1.2. Variability of Tillage Depth and Effect of the Angle of Attack at a Common Speed
The developed harrow operated reliably on perennial grass sod, although compliance with tillage-depth standards was only partial. The tillage depth varied considerably across the measurement points (SD 2.0–2.9 cm; coefficient of variation 21–41%). The probable reasons are the heterogeneity of the sod (the density of the root mat and patches of different hardness and moisture), the previous tillage of the field, the microrelief of the field, the flexing and vertical movement of the wide frame that carries all eight sections, and the fact that the 100 points were distributed over the whole working width, so that they include the zones of the tractor wheel tracks and of the junctions between the sections, where the load on the discs differs. These factors were not separated experimentally in this study; measurement of the depth by section and of the strength of the sod should be included in further tests (Section 4.4). At an 18° angle of attack, the harrow achieved the maximum tillage depth and soil fragmentation (94.5%) and complete cutting of crop residues and weeds. However, increased draft resistance and specific energy consumption should be considered when selecting the optimal operating mode. Because the operating speed differed among the angle groups (Table 3), the effect of the angle of attack is best seen at the common speed of 10.8 km h−1 (Table 3 and Table 5). At this speed, increasing the angle from 12° to 15° and 18° increased the tillage depth from 7.8 to 8.8 and 9.4 cm, the share of particles < 50 mm from 81.4 to 85.2 and 89.8%, the crop residue incorporation from 63.2 to 76.0 and 89.3%, and the residue and weed cutting efficiency from 82.3 to 95.7 and 100%, while the draft resistance increased from 47.1 to 49.1 and 52.0 kN and the specific energy consumption from 66.9 to 69.7 and 73.9 MJ ha−1. Statistical test of the effect of the angle of attack at the common speed of 10.8 km h−1. At this speed, the three angles were compared based on the individual readings (Table 4). The angle had a significant effect on the tillage depth (one-way ANOVA, F = 8.9, p < 0.001; 12° vs. 18°, +1.6 cm, p < 0.001; 12° vs. 15°, +0.9 cm, p = 0.06; 15° vs. 18°, +0.6 cm, p = 0.22; Bonferroni-adjusted), on the draft resistance (F = 45.7, p < 0.001; +2.0 kN from 12° to 15°, p = 0.04; +2.9 kN from 15° to 18°, p = 0.004; 4.9 kN from 12° to 18°, p < 0.001), on the residue and weed cutting efficiency (F = 165, p < 0.001; all pairs p < 0.001), and on the residue incorporation (F = 19.4, p < 0.001; 15° vs. 18° and 12° vs. 18°, p < 0.001; 12° vs. 15°, p = 0.07). No statistically significant effects were found for soil fragmentation (F = 0.5, p = 0.63) or surface roughness (F = 0.03, p = 0.97). At a 15° angle of attack, increasing speed from 10.8 to 11.3 km h−1 improved crop residue and weed cutting efficiency from 95.7% to 100% (p < 0.001). However, measurements were obtained during a single pass per mode; therefore, statistical conclusions regarding the angle effect remain limited, and the observed improvement in fragmentation should be considered a trend rather than a confirmed effect.
3.1.3. Compliance with Normative Requirements (Table 3 and Table 5)
All nine operating modes met the requirements for operating speed (≤12 km h−1), working width (7 ± 0.3 m), soil fragmentation (≥80%), crop residue incorporation (≥60%), tillage depth (up to 15 cm, with SD within ±3 cm), absence of clogging, surface roughness (≤5 cm), draft resistance (≤65 kN), power requirement, and specific energy consumption (≤95 MJ ha−1). Field capacity ranged from 6.3 to 8.1 ha h−1, within the specified range of 4.2–8.4 ha h−1. The following requirements were not met in some of the modes: tillage depth of 8–12 cm (not met at 12°: 7.0–7.8 cm); 100% cutting efficiency for crop residues and weeds (met at 18° in all modes and at 15° only at 11.3 km h−1).
3.2. Energy Performance of the Wide-Cut Heavy Disc Harrow Coupled with a Class 6 Tractor
3.2.1. Energy Performance Indicators
The results of the energy performance evaluation of the wide-cut heavy disc harrow coupled with the Kirovets K-735 tractor are presented in Table 5.
Table 5.
Energy performance of the Kirovets K-735 tractor coupled with the wide-cut heavy disc harrow.
To evaluate the effect of the disc section angle of attack on the specific energy consumption, experimental studies were conducted, and the results are presented in Figure 8.
Figure 8.
Effect of the disc section angle of attack on the specific energy consumption of the harrow. Markers show the mean of the three tested operating speeds at each angle of attack (Table 5); the line is a trend line through the three mean values. Abbreviations used in the figure: α—disc section angle of attack, °; E—specific energy consumption, MJ ha−1.
3.2.2. Effect of the Angle of Attack, Speed and Depth on Energy Consumption
The analysis of the energy performance results (Figure 8) revealed a consistent increase in the specific energy consumption of the implement with increasing disc section angle of attack. The individual value of 68.3 MJ ha−1 at 12° (11.5 km h−1) is the highest of the three modes at this angle; it is given in Table 5 and is higher than the plotted mean of 65.9 MJ ha−1, which is the value shown in Figure 8. The mean specific energy consumption (SEC) was 65.9 MJ ha−1 at an angle of attack of 12° (range 62.6–68.3 MJ ha−1; mean tillage depth 7.5 cm), 69.1 MJ ha−1 at 15° (range 66.2–71.5 MJ ha−1; mean tillage depth 8.7 cm) and 73.6 MJ ha−1 at 18° (range 70.0–76.8 MJ ha−1; mean tillage depth 9.5 cm). Linear regression of the mean values showed a high coefficient of determination (R2 = 0.99); however, when all nine operating modes were considered, R2 decreased to 0.61. To separate the effects of the angle and the speed, a two-factor linear regression was fitted over the nine modes: SEC = 19.9 + 1.41α + 2.73V (R2 = 0.97; t = 13.1 for α and 9.2 for V, p < 0.001 for both; six residual degrees of freedom); draft resistance F = 13.4 + 0.97α + 1.99V (R2 = 0.97); and tillage depth h = 5.18 + 0.326α—0.146V (R2 = 0.94), in which the speed term is not significant (t = −1.5, p = 0.18). The coefficients were fitted to the mean speeds of the modes given in Table 4 (two decimals) and to the unrounded protocol values; refitting to the rounded values of Table 4 and Table 5 reproduces the t-statistics (13.1 and 9.2), gives a residual SD of 0.78–0.79 MJ ha−1, and changes the slopes by no more than 0.02. Thus, within the tested range, each additional degree of the angle of attack added about 1.4 MJ ha−1 and 1.0 kN, and each additional km h−1 of speed added about 2.7 MJ ha−1 and 2.0 kN, whereas the tillage depth depended practically on the angle only. Including operating speed in the regression increased the coefficient of determination from R2 = 0.61 to 0.97, indicating that speed contributed substantially to SEC variation. However, the analysis is descriptive, as only nine operating modes were tested without replication at fixed speeds. Uncertainty of the regression coefficients. With six residual degrees of freedom, the 95% confidence intervals of the coefficients (angle; speed) were: for the specific energy consumption, 1.41 (1.15–1.68) MJ ha−1 per degree and 2.73 (2.00–3.44) MJ ha−1 per km h−1; for the draft resistance, 0.97 (0.78–1.16) kN per degree and 1.99 (1.48–2.50) kN per km h−1; for the tillage depth, 0.33 (0.24–0.41) cm per degree and −0.15 (−0.38 to 0.09) cm per km h−1. The residual standard deviations were 0.78 MJ ha−1, 0.56 kN and 0.26 cm, and the leave-one-out prediction errors (RMSE) were 0.93 MJ ha−1, 0.67 kN and 0.32 cm, i.e., about 1.4% of the mean specific energy consumption and of the mean draft. Effect of the tillage depth. The tillage depth increased with the angle (correlation coefficient 0.96 over the nine modes) and was not set independently, so part of the increase in the draft and in the energy consumption with the angle corresponds to the greater working depth. At an operating speed of 10.8 km h−1, draft resistance and specific energy consumption per centimeter of tillage depth decreased with increasing angle of attack. At angles of 12°, 15°, and 18°, draft resistance was 6.03, 5.57, and 5.53 kN cm−1, while specific energy consumption was 8.57, 7.92, and 7.86 MJ ha−1 cm−1, respectively. Across the nine tested operating modes, specific energy consumption per centimeter of tillage depth ranged from 8.2–9.8 MJ ha−1 cm−1 at 12°, 7.5–8.4 MJ ha−1 cm−1 at 15°, and 7.3–8.2 MJ ha−1 cm−1 at 18°. These results indicate a trend under the tested conditions but do not establish an independent effect of the angle of attack. Thus, energy consumption per unit depth was not higher at the larger angle; the higher energy consumption at the larger angle corresponds to the greater depth reached. The regression model including forward speed and tillage depth described the variation in specific energy consumption (SEC), with a coefficient of determination of R2 = 0.92 (p < 0.001 for both coefficients). However, the strong correlation between the disc angle and tillage depth (r = 0.96), together with the lack of a statistically significant depth effect when all three factors were included in the model (p = 0.82), limits the ability to distinguish their individual effects.
3.2.3. Energy Cost of the Quality Gain, Draft Prediction, and Tractive Performance
At the common speed of 10.8 km h−1 (Table 3 and Table 5), raising the angle from 12° to 15° increased the specific energy consumption by 2.8 MJ ha−1 (4%) and the draft by 2 kN, and improved residue and weed cutting by 13.4 percentage points (82.3 to 95.7%), residue incorporation by 12.8 points (63.2 to 76.0%), soil fragmentation by 3.8 points, and tillage depth by 0.9 cm. A further increase from 15° to 18° cost 4.2 MJ ha−1 (6%) and 2.9 kN and gave 4.3 points of cutting (to 100%), 13.3 points of incorporation, 4.6 points of fragmentation and 0.6 cm of depth. At a disc angle of 15°, increasing speed from 10.8 to 11.3 km h−1 increased specific energy consumption by 1.8 MJ ha−1 while achieving 100% cutting efficiency of plant residues and weeds. Four of the nine operating modes met all normative requirements: 18° at 9.0, 10.8 and 11.1 km h−1, and 15° at 11.3 km h−1. Specific energy consumption ranged from 70.0 to 76.8 MJ ha−1, draft resistance from 49.1 to 53.9 kN, field capacity from 6.3 to 7.9 ha h−1, and fuel consumption from 6.6 to 8.0 kg ha−1. To further assess the measured draft resistance, the experimental results were compared with the values calculated according to the ASABE D497.7 draft prediction model. Under representative operating conditions, the experimental draft resistance was 48.1 kN at an angle of attack of 12°, 50.0 kN at 15°, and 53.9 kN at 18° (in each case, the highest-speed mode: 11.5, 11.3, and 11.1 km h−1 at depths of 7.0, 8.5, and 9.4 cm; Table 5). Thus, the experimental draft resistance was approximately 2.26, 1.95, and 1.91 times the values predicted by the ASABE D497.7 model. Over all nine operating modes, the ratio ranged from 1.83 to 2.26. The deviation is too large to be attributed to the soil and the disc geometry alone and defines the limit of applicability of the model. The harrow studied here has a mass of 6.7 t (65.7 kN), i.e., 0.96 t per meter of working width and about 1.9 times the mass per meter of BDT-7 harrows. In our assessment, this specific mass, together with the support wheels and the rod roller that carry part of it, is a major contributor to the difference between measurement and prediction. The remaining difference is consistent with the larger disc diameter, the higher angles, and the heavy loam, but the separate contributions of the mass, the roller, the wheels, the disc geometry, and the soil were not isolated in this study.
According to the ASABE D497.7 model with Fi = 0.88 (Section 2.6), the predicted draft resistance of the investigated harrow ranges from 21.3 to 28.2 kN across the nine operating modes (24.2–32.0 kN if the soil were classified as fine-textured, Fi = 1.0), remaining below the measured values. Fuel consumption per hectare of main operating time ranged from 6.4 to 8.0 kg ha−1, corresponding to 275–340 MJ ha−1, based on an assumed diesel lower heating value of 42.7 MJ kg−1. The ratio of the harrow’s specific energy consumption to the energy supplied by fuel was 0.20–0.26, while fuel consumption per unit of drawbar power was 0.32–0.43 kg (kW·h)−1 (0.38–0.51 L (kW·h)−1 in Table 5). These indicators do not represent tractor efficiency, as they do not separately account for losses in the engine, transmission, and running gear. Tractive performance of the tractor. The measured draft resistance of the harrow was 44.1–53.9 kN, below the specified limit of 65 kN. At an angle of attack of 18° and a speed of 11.1 km h−1, the measured value (53.9 kN) coincided with the manufacturer’s reference drawbar pull of 53.9 kN. The measured drawbar force corresponded to 0.29–0.36 of the tractor’s weight at the recommended operating mass of 15,250 kg. Drawbar power ranged from 116 to 166 kW, equivalent to 45–65% of the rated engine power (257 kW). Wheel slip and tire inflation pressure were not recorded; therefore, their effects on traction performance could not be assessed.
3.3. Operational Performance Evaluation of the Wide-Cut Heavy Disc Harrow Coupled with a Class 6 Tractor
The results of the operational performance evaluation are presented in Table 6.
Table 6.
Operational performance evaluation results of the wide-cut heavy disc harrow coupled with the Kirovets K-735 tractor.
The operational evaluation was conducted during tillage of perennial grass sod at a disc angle of attack of 18° and a mean tillage depth of 9.4 cm. The machine operated without clogging, soil adhesion, or disruption of the tillage process. At an average speed of 10.8 km h−1, field capacity was 7.6 ha h−1 during main time, 6.8 ha h−1 during technological time, and 6.2 ha h−1 during shift time. Shift-time fuel consumption was 8.4 kg ha−1.
All three field-capacity values and the shift-time utilization coefficient met the specified requirements. No normative limit was available for shift-time fuel consumption; therefore, its compliance was not assessed. The evaluation covered a single operating mode (18°, 10.8 km h−1) over three days (Table 6).
According to the test protocol, the operational availability coefficient was 0.99, exceeding the required minimum of 0.98, while the technical utilization coefficient was 0.95. The underlying reliability assessment procedures are not detailed in this study.
3.4. Horizontal Force Balance as a Consistency Check of the Measured Draft Resistance
3.4.1. Horizontal Force Balance
The horizontal force balance of the implement, Equation (1) with Equation (4), is the only part of the mechanical model that can be evaluated from the measured inputs. With the measured components in Table 1, the draft resistance is Pxt = Rxd + Rxp + Rxk = 45.1 + 8.8 + Rxk = 53.9 kN + Rxk, where the rolling resistance of the support wheels, Rxk = µk·Ryk, is not determined because the vertical reaction Ryk was not calculated.
To compare the model with the experiment for all tested modes, the sum of the rig-based components (Rxd + Rxp = 53.9 kN) was compared with the measured draft resistance of each of the nine modes (Table 7).
3.4.2. Analysis of the Observed Discrepancy
The following contributions to the differences in Table 7 (up to +22.2% at 12° and 9.5 km h−1; mean +10.7%) can be identified. (1) The model value is the same, 53.9 kN, in all nine modes, because the rig values are a single representative pair. The difference is therefore equal to 53.9 kN minus the measured draft and carries no information on the response of the model to the angle, the speed, or the depth, although the measured draft varied by 9.8 kN (44.1–53.9 kN; about 1.0 kN per degree and 2.0 kN per km h−1, Section 3.2). The difference is largest in the least loaded mode and zero in the mode from which the rig values originate (Section 2.4). This is the main contribution, and it results from the use of one reference value, not from the structure of the force balance. (2) The uncertainty of the draft measurement (Section 2.5) can change each difference by no more than about 1.1 kN (2.0% of 54 kN); it cannot explain the differences of 4.8–9.8 kN found in six of the nine modes. (3) The transfer of the forces from the reduced-width rig to the 7.0 m harrow without scaling is uncertain by an amount that was not established; a deviation of ±20% in the rig sum would span the whole measured range (43–65 kN against 44–54 kN), so this contribution alone could account for the discrepancy. (4) The omitted rolling resistance of the support wheels increases the difference by 0–5.8 kN (the bound Rxk ≤ 5.8 kN of Section 2.2, which follows from Equations (2) and (3)); the model value would then be 53.9–59.7 kN and the difference in the least loaded mode up to about 15.6 kN (35%). The bound is reached only if the support wheels carry about 39 kN (59% of the weight) and the discs carry nothing, which is not realistic, so the actual increase is expected to be a fraction of the bound. (5) The quasi-static, rigid-body assumptions (Section 2.2) neglect the variation of the load caused by the heterogeneity of the soil and by the vertical motion of the implement, which was not measured. Contributions (1) and (3) cannot be separated with the data available. The observed discrepancy should be interpreted in the context of the assumptions and input parameters used in the model, rather than as a direct measure of model prediction error.
3.4.3. Evidence on the Validity of the Model
(a) In the mode from which the rig values originate, the sum of the measured components equals the measured draft within 0.1% (53.9 kN against 53.93 kN); this shows that the rig and field measurements are consistent in the same regime, but it is not an independent check. (b) In the other eight modes, the sum exceeds the measured draft by 3.7–22.2% (before Rxk is added), i.e., it is of the right order of magnitude, whereas the generic ASABE D497.7 estimate is lower than the measurement by 45–56% (a factor of 1.83–2.26, Section 3.2); the rig-based sum is thus much closer to the measurements than the generic model. (c) As a benchmark, the two-factor description of the measured draft by the angle and the speed (Section 3.2) reproduces each omitted mode with a leave-one-out error of 0.67 kN (RMSE), whereas the constant rig-based value deviates from the measurements by 5.8 kN (RMSE; mean +5.1 kN). A physically based model would have to reach at least the accuracy of this empirical description to be useful as a predictive tool; the present model does not, and it is therefore not presented as validated.
4. Discussion
4.1. Comparison with Other Studies
4.1.1. Comparison with Published Studies
The increase in draft resistance with the disc section angle observed in this study (Section 3.2) is consistent with earlier work. Kogut et al. [11] examined the effect of disc setup angles and working depth on disc harrow working resistance, and Serrano et al. [14] examined the effect of gang angle on soil tilth, work rate, and fuel consumption of offset disc harrows.
Beyond the direction of the effects, the present results can be set against the published work as follows. (i) The rise of the specific energy consumption with the disc angle (65.9, 69.1, and 73.6 MJ ha−1 at 12°, 15° and 18°) agrees with the field tests of a disc-chisel harrow, in which the highest fuel consumption was recorded at the largest tested disc angle [19]; the studies of disc-harrow adjustment [8,14,15] likewise show that the angle, the depth, and the speed act together, which is why they could be separated only partly in the present data (Section 3.2). (ii) Residue cutting at the lower angles depends on the edge geometry of the disc [7] as well as on the angle, so geometry changes are proposed in Section 4.3 and not the angle alone. (iii) The measured draft was 1.83–2.26 times the ASABE D497.7 prediction [16]. This generic equation contains no term for the mass of the implement, whereas the soil-mechanics approach to the draft of disc harrows [12] and the review of the effect of implement geometry on soil failure [13] relate the draft to the soil failure and to the geometry of the working tool; a heavy implement with a roller and support wheels therefore lies outside the range for which the generic coefficients were derived. Absolute values can be compared with the cited studies only approximately, because their implements, soils, and speeds differ; two numerical comparisons are given at the end of this section. The structural features of the studied harrow were compared with those of representative commercial disc harrows (Table 8; the data of the AMAZONE, HORSCH, and LEMKEN machines are taken from the manufacturers’ specifications) [32,33,34].
Table 8.
Structural comparison of the studied heavy disc harrow with representative commercial machines (manufacturers’ design data; not a comparison of field performance).
4.1.2. Structural Comparison with Commercial Machines
As shown in Table 8, the harrow has a working width of 7.0 m, comparable to that of the AMAZONE Certos 7002-2TX and LEMKEN Rubin 10 TF/700. Its 660 mm discs are similar in diameter to those of the AMAZONE machine and larger than those of the APD-7.5M-1, HORSCH, and LEMKEN machines (the disc diameter of the BDT-7 is not reported). The disc angle of attack can be adjusted to three positions within the range of 12–18°. Because comparable data on specific energy consumption, tillage quality, and field capacity were unavailable, a quantitative comparison of operational performance was not conducted.
The specific mass of the studied harrow (0.96 t m−1; Table 8) is approximately twice that of the BDT-7, 1.3 times that of the APD-7.5M-1, and lower than that of the AMAZONE Certos 7002-2TX. Quantities derived from Table 8 and from [21] show where the studied harrow differs from the other machines. The harrow carries approximately 93 kg per disc, about 1.7 times the load of the BDT-7, with slightly closer disc spacing (210 vs. 220 mm). This higher load may contribute to sod penetration in a single pass, although this relationship was not directly tested. The disc-angle range (12–18°) matches the BDT-7 and is comparable to the APD-7.5M-1, while the 660 mm disc diameter is among the largest considered. The published studies on disc harrows [8,11,14,15], mostly on lighter implements (Section 1), relate the draft, the fuel consumption, and the tillage quality to the angle, the depth, and the speed; the present results agree with them in direction (the draft and the energy consumption rise with the angle and the depth), and the absolute level can be set against them in two respects, with the caveat that the implements, soils, and speeds differ. (i) The measured draft of 44.1–53.9 kN over 7.0 m corresponds to a specific draft of 6.3–7.7 kN m−1, which lies within the range of 4–9 kN m−1 for which Serrano et al. [15] found a linear relationship between fuel consumption per hectare and specific draft on dry, undisturbed loamy soils; the sod tests therefore fall within the range of that relationship, although its coefficients were not applied here. (ii) The fuel consumption per hectare of main time, 6.4–8.0 kg ha−1 (about 7.6–9.5 L ha−1 at 0.84 kg L−1; Table 5), is higher than the 2.6–5.9 L ha−1 obtained by Damanauskas et al. [8] with a compact disc harrow on loam and clay loam stubble at depths of 5 and 8 cm, disc angles of 10–20°, and speeds of 1.4–3.6 m s−1 (5–13 km h−1), a speed range that includes the 9.0–11.5 km h−1 used here. The higher consumption is consistent with the heavier implement, perennial sod instead of stubble, and a depth of up to 9.6 cm, but these effects were not separated. The harrows of [11] (a 3.0 m compact disc harrow, attack angles of 12°, 16°, and 21°) and [14] (an offset harrow with 20 discs of 610 mm) are much smaller than the 72-disc machine studied here, so their values were not transferred and they are cited for the direction of the effects. The specific contribution is therefore the data for this class of machine rather than a general relationship.
4.1.3. Limitations of the Mechanical Model
The mechanical model is limited to a quasi-static force balance. The horizontal force balance was used to compare calculated and measured draft resistance; the calculated values exceeded the measured values by 0–22% across the nine operating modes (Section 3.4, Table 7). The vertical load distribution was not calculated because the system is statically indeterminate. The dynamic behavior of the tractor–implement unit, including its vibrations [35], is outside the scope of the quasi-static model.
4.2. Agrotechnical Quality Versus Energy Consumption
The rod roller was not evaluated separately; therefore, its contribution to surface roughness (3–5 cm) and the observed 2–7 percentage-point reduction in erosion-prone soil fractions cannot be isolated. The reduction in the fraction below 1 mm indicates a change in soil particle-size distribution after tillage but does not directly demonstrate improved wind erosion resistance. At an angle of 18°, residue incorporation reached 92.7% and cutting efficiency reached 100%, indicating potential relevance to resource-saving tillage. Trade-off between agrotechnical performance and energy efficiency. The practical choice among the operating modes is as follows.
- (1)
- The most favorable mode is 15° at 11.3 km h−1 among the four that met all the requirements: its specific energy consumption (71.5 MJ ha−1) is only 2% above the lowest among them (70.0 MJ ha−1 at 18° and 9.0 km h−1), but its field capacity (7.9 ha h−1) is 25% higher, its fuel consumption per hectare is the lowest (6.6 against 6.8–8.0 kg ha−1), and its draft (50.0 kN) is 7% below the reference drawbar pull of the tractor (53.9 kN), whereas at 18° and 11.1 km h−1 the draft (53.9 kN) is at the reference pull.
- (2)
- The 18° mode is justified where complete residue cutting, the greatest depth, and the best fragmentation are required at any speed; its cost is the highest draft (49.1–53.9 kN) and energy consumption (70.0–76.8 MJ ha−1) and, at 9.0 km h−1, the lowest capacity (6.3 ha h−1) and the highest fuel consumption per hectare (8.0 kg ha−1).
- (3)
- The 12° mode has the lowest draft and energy consumption (44.1–48.1 kN; 62.6–68.3 MJ ha−1) but does not meet the depth and cutting requirements (7.0–7.8 cm; 80.6–95.4%), so the savings are obtained at the expense of quality and are not recommended for perennial grass sod.
These recommendations are based on a descriptive analysis of nine operating modes, with speed and disc angle confounded. They rely on drawbar-based energy indicators and indicative fuel-based estimates and are limited to the tested soil, moisture, and tractor conditions.
4.3. Possible Structural Improvements for Residue Cutting at 12° and 15°
The 100% cutting requirement was not met at 12° (80.6–95.4%) or at 15° (95.5–95.7% at 9.2 and 10.8 km h−1).
The following measures follow from the data and from [7]; none of them was tested in this study (Section 4.4). (1) Different angles of the front and rear rows (for example, 15° and 18°), so that the rear row cuts the residues left between the front-row furrows with a smaller increase in energy consumption than setting all sections to 18° (about 1.4 MJ ha−1 per degree, Section 3.2). (2) A larger vertical load on the discs at 12° and 15° (ballast or a hydraulic down-force), because the depth at 12° (7.0–7.8 cm) is below the 8–12 cm range. (3) Deeper notches and a maintained sharpness of the disc edge [7], and a reduced spacing of the front-row discs (210 mm at present) or colters ahead of the first row, at the price of a higher mass and draft resistance. (4) At 15°, 100% cutting was reached at 11.3 km h−1, within the 12 km h−1 limit, at an additional 1.8 MJ ha−1 (Section 3.2).
4.4. Limitations and Future Research
4.4.1. Limitations
(i) The eight-section, 72-disc configuration with adjustable support wheels was evaluated in terms of tillage depth, its variability (SD 2.0–2.9 cm), and draft resistance; the load distribution among the working and supporting elements was not measured, so no advantage in load distribution is claimed. (ii) The tests were run on one heavy-loam sod at a single moisture level (14.4%) and with one tractor, which limits the extrapolation of the results to light or waterlogged soils and to other tractors; wheel slip, the tractive efficiency of the tractor, and its dependence on tire inflation pressure were not recorded. (iii) Each of the nine modes was run once, and the forward speed was not an independent factor, so the effect of the angle is partly confounded with that of speed (Section 2.8 and Section 3.2). (iv) The rig forces measured on a reduced-width prototype were used for the 7.0 m harrow without equivalent scaling and are indicative only (Section 2.2).
4.4.2. Future Research
The following work is needed to turn the present descriptive results into a validated design basis: (1) a factorial field experiment in which the angle of attack (12°, 15°, 18°) and the forward speed (for example 8, 10, and 12 km h−1) are set independently, with at least three replicated runs of each mode at a fixed speed and with the tillage depth controlled by the support wheels, so that the effects of angle, speed, and depth can be separated by analysis of variance; (2) measurement of wheel slip, tractor tire inflation pressure, and the drawbar power of the tractor, in order to evaluate the tractive efficiency of the unit; (3) direct measurement of the vertical reactions of the support wheels, the rod roller, and the disc sections (for example, with load cells in the wheel axles and in the section brackets) and rig tests on a section of full width, which would remove the static indeterminacy and allow the model to be validated on an independent data set; (4) tests of the structural measures proposed in Section 4.3 (differentiated front and rear angles, ballast or hydraulic down-force, edge geometry, front-row spacing) and of the harrow with the rod roller lifted, to separate the contribution of the roller and of the support wheels; (5) trials on other soils, moisture levels, and fields (summer fallow and stubble included), with the particle-size distribution and the strength of the soil (cone index) measured and with a wind-erosion test to confirm the effect of the changed fraction below 1 mm; (6) a comparison with the commercial harrows of Table 8 under identical conditions and a fuel and cost analysis over the whole season, so that the energy results can be related to the economic effect.
5. Conclusions
- A 7.0 m wide-cut heavy disc harrow for traction class 5–6 tractors, intended for tillage of perennial grass sod, summer fallow, and stubble fields, was described and tested on perennial grass sod under field conditions in Northern Kazakhstan. The configuration is presented as a locally adapted design; its novelty is limited to the configuration and the measured data set, and no quantitative advantage over commercial machines is claimed.
- Increasing the disc section angle of attack from 12° to 18° (forward speed not fixed independently) increased tillage depth from 7.0–7.8 cm to 9.4–9.6 cm, the share of soil particles smaller than 50 mm up to 94.5%, and crop residue and weed cutting efficiency to 100%. The 100% cutting requirement was met at 18° at all speeds and at 15° only at 11.3 km h−1; at 12° the tillage depth (7.0–7.8 cm) was below the 8–12 cm reference range. The depth varied considerably within each mode (SD 2.0–2.9 cm, within the ±3 cm tolerance of ST RK 1559-2006). The content of the <1 mm fraction in the surface layer decreased by 2–7 percentage points after the pass; resistance to wind erosion was not assessed. At the common speed of 10.8 km h−1, the effect of the angle was statistically significant for the tillage depth (12° vs. 18°), the draft resistance, the residue cutting, and the residue incorporation (ANOVA, p < 0.001) but not for the soil fragmentation (p = 0.63) or the surface roughness (p = 0.97); the increase of the fragmentation with the angle is therefore a tendency only.
- Specific energy consumption increased with the angle of attack (mean 65.9, 69.1, and 73.6 MJ ha−1 at 12°, 15°, and 18°; range 62.6–76.8 MJ ha−1). The measured draft resistance (44.1–53.9 kN) remained below the 65 kN limit of the normative documentation [30]. A two-factor regression over the nine modes gave about 1.4 MJ ha−1 per degree of angle and 2.7 MJ ha−1 per km h−1 of speed, so the angle effect is partly confounded with speed. The measured draft resistance was 1.83–2.26 times the ASABE D497.7 prediction, presumably related to the specific mass of the harrow (0.96 t m−1), which the generic model does not include. However, the separate contribution of the mass was not isolated in this study.
- At 18° and an average operating speed of 10.8 km h−1, the machine unit operated stably without clogging. The capacity per hour of main time was 7.6 ha h−1 (6.8 ha h−1 for technological time and 6.2 ha h−1 for shift time), the coefficient of working strokes was 0.87, and the shift-time utilization coefficient was 0.82.
- The quasi-static model of the harrow was used only as a consistency check of the horizontal forces: the sum of the rig-based draft components (53.9 kN) exceeded the measured draft resistance of the nine modes (44.1–53.9 kN) by 0–22% (mean 10.7%), the largest difference being at 12° and 9.5 km h−1. The vertical load distribution among the support wheels, the rod roller, and the disc sections is statically indeterminate and was neither calculated nor measured, so the model is not a validated predictive tool.
- The conclusions are valid for one heavy-loam sod at 14.4% moisture content, one tractor (Kirovets K-735), and a single pass per operating mode. The draft was measured with a load cell calibrated up to 100 kN (10 tf), which covers the measured forces of 44.1–53.9 kN; the combined uncertainty of the draft is about 1.7–2.0% (load-cell readings converted at 1 kgf = 9.81 N). Wheel slip and tire inflation pressure were not recorded.
- Recommendations. For perennial grass sod on heavy loams of Northern Kazakhstan, the choice of the angle of attack is a compromise between tillage quality and energy consumption. An angle of 18° gave complete residue and weed cutting, the greatest depth and the best fragmentation, at the highest draft resistance (49.1–53.9 kN) and specific energy consumption (70.0–76.8 MJ ha−1). Among the four modes that met all the requirements, 15° at 11.3 km h−1 combined a specific energy consumption within 2% of the lowest (71.5 against 70.0 MJ ha−1) with the highest field capacity (7.9 ha h−1) and the lowest fuel consumption per hectare (6.6 kg ha−1), but it is a single unreplicated mode and needs confirmation. The 12° angle gave the lowest draft and energy consumption (44.1–48.1 kN; 62.6–68.3 MJ ha−1) but did not meet the depth requirement (7.0–7.8 cm) or complete residue cutting (80.6–95.4%). Further work should separate the effects of angle, speed, and depth in a replicated factorial experiment, add measurements of wheel slip and vertical load distribution, and test the structural measures for residue cutting at 12° and 15° on other soils and moisture levels (Section 4.4).
6. Patents
The harrow described in this study is covered by the following patents of the Republic of Kazakhstan:
- Patent for Invention No. 37969, Wide-Cut Disc Harrow. Application No. 2024/1036.1, filed on 3 December 2024. International Patent Classification (IPC): A01B 21/00 (2006.01); A01B 7/00 (2006.01). Patent holder: Scientific and Production Center of Mechanical Engineering LLP (Kazakhstan). Inventors: Yurij V. Polishchuk, Artem P. Komarov, Alexey I. Derepaskin, Pavel G. Ivanchenko, Anton N. Kuvayev, Maxim A. Plokhotenko, and Rashid M. Mazitov. Published in Official Bulletin No. 14 on 10 April 2026.
- Industrial Design Patent No. 4471, Wide-Cut Disc Harrow. Application No. 2025375.3, filed on 11 November 2025. Locarno Classification: 15-03. Patent holder: Scientific and Production Center of Mechanical Engineering LLP (Kazakhstan). Inventors: Yurij V. Polishchuk, Alexey I. Derepaskin, Nikolay V. Laptev, Artem P. Komarov, Anton N. Kuvayev, Ivan V. Tokarev, and Aleksandr F. Dyadyuchenko. Published in Official Bulletin No. 29 on 24 July 2026.
Author Contributions
Conceptualization, A.K. and Y.P.; methodology, Y.P. and Y.B.; software, N.L.; validation, A.D. and A.K.; formal analysis, R.K.; investigation, A.D. and A.K.; resources, Y.B. and Y.P.; data curation, A.K.; writing—original draft preparation, N.L. and R.K.; writing—review and editing, R.K. and N.L.; visualization, R.K. and N.L.; supervision, Y.P. and A.D.; project administration, Y.P.; funding acquisition, Y.B. and Y.P. All authors have read and agreed to the published version of the manuscript.
Funding
This research was funded by the Industrial Development Committee of the Ministry of Industry and Construction of the Republic of Kazakhstan (Grant No. BR23992300).
Institutional Review Board Statement
Not applicable.
Informed Consent Statement
Not applicable.
Data Availability Statement
The raw data supporting the conclusions of this article will be made available by the authors on request.
Conflicts of Interest
The authors Yurij Polichshuk, Artem Komarov, Alexey Derepaskin, Yurij Binyukov and Nikolay Laptev were employed by the company Kostanay Branch of the LLP “Scientific Production Center of Mechanical Engineering”. The remaining authors declare that the research was conducted in the absence of any commercial or financial relationships that could be construed as a potential conflict of interest.
Abbreviations
The following abbreviations are used in this manuscript:
| ANOVA | Analysis of variance |
| ASABE | American Society of Agricultural and Biological Engineers |
| ASAE | American Society of Agricultural Engineers (now ASABE) |
| CI | Confidence interval |
| GOST | State Standard (Russian: Gosudarstvennyi Standart) |
| LHV | Lower heating value |
| MEMS | Micro-Electro-Mechanical Systems |
| R2 | Coefficient of determination |
| RMSE | Root-mean-square error |
| SD | Standard deviation |
| SEC | Specific energy consumption |
| ST RK | State Standard of the Republic of Kazakhstan |
References
- Rietra, R.P.J.J.; Heinen, M.; Oenema, O. A review of crop husbandry and soil management practices using meta-analysis studies: Towards soil-improving cropping systems. Land 2022, 11, 255. [Google Scholar] [CrossRef] [Scilit]
- Baisholanov, S.; Akshalov, K.; Mukanov, Y.; Zhumabek, B.; Karakulov, E. Agro-climatic zoning of the territory of Northern Kazakhstan for zoning of agricultural crops under conditions of climate change. Climate 2025, 13, 3. [Google Scholar] [CrossRef] [Scilit]
- Funakawa, S.; Yanai, J.; Takata, Y.; Akshalov, K.; Kosaki, T. Dynamics of water and soil organic matter under grain farming in Northern Kazakhstan—Toward sustainable land use both from the agronomic and environmental viewpoints. In Climate Change and Terrestrial Carbon Sequestration in Central Asia; Lal, R., Suleimenov, M., Stewart, B.A., Hansen, D.O., Doraiswamy, P., Eds.; Taylor & Francis: London, UK, 2007; pp. 279–331. [Google Scholar]
- Almanova, Z.; Kenzhegulova, S.; Kashkarov, A.; Kekilbayeva, G.; Ussalinov, E.; Yerzhan, D.; Zhakenova, A.; Zvyagin, G. Changes in soil fertility indicators after long-term agricultural use in Northern Kazakhstan. Int. J. Des. Nat. Ecodyn. 2023, 18, 1045–1053. [Google Scholar] [CrossRef] [Scilit]
- Blanco-Canqui, H.; Lal, R. Crop residue removal impacts on soil productivity and environmental quality. Crit. Rev. Plant Sci. 2009, 28, 139–163. [Google Scholar] [CrossRef] [Scilit]
- Xu, G.; Xie, Y.; Peng, S.; Liang, L.; Ding, Q. Performance evaluation of vertical discs and disc coulters for conservation tillage in an intensive rice–wheat rotation system. Agronomy 2023, 13, 1336. [Google Scholar] [CrossRef] [Scilit]
- Zeng, Z.; Thoms, D.; Chen, Y.; Ma, X. Comparison of soil and corn residue cutting performance of different discs used for vertical tillage. Sci. Rep. 2021, 11, 2537. [Google Scholar] [CrossRef] [Scilit] [PubMed]
- Damanauskas, V.; Velykis, A.; Satkus, A. Efficiency of disc harrow adjustment for stubble tillage quality and fuel consumption. Soil Tillage Res. 2019, 194, 104311. [Google Scholar] [CrossRef] [Scilit]
- Sarkar, P.; Upadhyay, G.; Raheman, H. Active-passive and passive-passive configurations of combined tillage implements for improved tillage and tractive performance: A review. Span. J. Agric. Res. 2021, 19, e02R01. [Google Scholar] [CrossRef] [Scilit]
- Okunev, G.A.; Astafiev, V.L.; Kuznetsov, N.A. Reduction of aftereffect of machine units on the soil. Trakt. Sel’khozmashiny 2016, 83, 43–47. (In Russian) [Google Scholar] [CrossRef] [Scilit]
- Kogut, Z.; Sergiel, L.; Zurek, G. The effect of the disc setup angles and working depth on disc harrow working resistance. Biosyst. Eng. 2016, 151, 328–337. [Google Scholar] [CrossRef] [Scilit]
- Ahmadi, I. A draught force estimator for disc harrow using the laws of classical soil mechanics. Biosyst. Eng. 2018, 171, 52–62. [Google Scholar] [CrossRef] [Scilit]
- Godwin, R.J. A review of the effect of implement geometry on soil failure and implement forces. Soil Tillage Res. 2007, 97, 331–340. [Google Scholar] [CrossRef] [Scilit]
- Serrano, J.M.; Peça, J.O.; Pinheiro, A.; Carvalho, M.; Nunes, M.; Ribeiro, L.; Santos, F. The effect of gang angle of offset disc harrows on soil tilth, work rate and fuel consumption. Biosyst. Eng. 2003, 84, 171–176. [Google Scholar] [CrossRef] [Scilit]
- Serrano, J.M.; Peça, J.O.; Marques da Silva, J.; Pinheiro, A.; Carvalho, M. Tractor energy requirements in disk harrow systems. Biosyst. Eng. 2007, 98, 286–296. [Google Scholar] [CrossRef] [Scilit]
- ASAE D497.7 MAR2011; Agricultural Machinery Management Data. American Society of Agricultural and Biological Engineers: St. Joseph, MI, USA, 2011.
- Tarasenko, B.F.; Kuzmin, V.V.; Troyanovskaya, I.P.; Partko, S.A.; Voinash, S.A. Harrow with Turning Disc Section. Eng. Technol. Syst. 2023, 33, 10–20. [Google Scholar] [CrossRef] [Scilit]
- Benyukh, O.A.; Kravchenko, R.I. Features of furrow formation with rotary and arrow-headed working bodies. Trakt. Sel’khozmashiny 2023, 90, 179–186. (In Russian) [Google Scholar] [CrossRef] [Scilit]
- Tarasenko, B.F.; Khav’yarimana, E.; Drobot, V.A.; Rudnev, S.G. Field testing of a disk-chisel harrow. Trakt. Sel’khozmashiny 2023, 90, 225–232. (In Russian) [Google Scholar] [CrossRef] [Scilit]
- AgroBase. Disc Tillage Unit Bobruiskselmash APD-7.5M-1 (APD-6, APD-7.5M-1): Description and Technical Specifications. Available online: https://www.belrusagro.com/techno/catalog/546/2270/? (accessed on 23 October 2026). (In Russian)
- Belagrotech. Heavy Disc Harrow BDT-7 (L-114A-02): Technical Specifications. Available online: https://www.belagrotech.kz/produktsiya/selkhoztekhnika/agregaty-dlya-obrabotki-pochvy/diskovye-borony/bdt-7-l-114a-02.php (accessed on 10 October 2026). (In Russian)
- ASABE S414.2 MAR2009 (R2023); Terminology and Definitions for Agricultural Tillage Implements; American Society of Agricultural and Biological Engineers. St. Joseph, MI, USA, 2009.
- ST RK 1559-2006; Testing of Agricultural Machinery and Implements for Surface Tillage. Methods for Evaluating Functional Indicators. State System of Technical Regulation of the Republic of Kazakhstan: Astana, Kazakhstan, 2006. (In Russian)
- Jakasania, R.G.; Yadav, R.; Mohnot, P. Soil-tillage tool interaction using numerical methods—A review. Acta Sci. Agric. 2018, 2, 63–70. [Google Scholar]
- Karkee, M.; Steward, B.L. Study of the open and closed loop characteristics of a tractor and a single axle towed implement system. J. Terramech. 2010, 47, 379–393. [Google Scholar] [CrossRef] [Scilit]
- Bentaher, H.; Hamza, E.; Kantchev, G.; Maalej, A.; Arnold, W. Three-point hitch-mechanism instrumentation for tillage power optimization. Biosyst. Eng. 2008, 100, 24–30. [Google Scholar] [CrossRef] [Scilit]
- Montgomery, D.C. Design and Analysis of Experiments, 10th ed.; Wiley: Hoboken, NJ, USA, 2020. [Google Scholar]
- GOST 24055-2016; Agricultural Machinery. Methods of Operational and Technological Evaluation. Standartinform: Moscow, Russia, 2016. (In Russian)
- GOST 20915-2011; Agricultural Machinery Testing. Methods for Determining Test Conditions. Standartinform: Moscow, Russia, 2013. (In Russian)
- GOST 34631-2019; Agricultural Machinery. Methods of Energy Assessment. Standartinform: Moscow, Russia, 2019. (In Russian)
- Kravchenko, R.I. The results of the operational test of a mock-up sample of the tool with an active drive of rotary working bodies with an assessment of agrotechnical indicators. Trakt. Sel’khozmashiny 2023, 90, 515–522. (In Russian) [Google Scholar] [CrossRef] [Scilit]
- AMAZONEN-WERKE H. DREYER SE & Co. KG. Certos-2TX Heavy Trailed Compact Disc Harrows: Technical Data. In Catros/Certos Catalogue; AMAZONEN-WERKE: Hasbergen-Gaste, Germany, 2024; Available online: https://downloadcenter.amazone.de/file/view/printnumber/P0053/language/en-gb/doctype/leaflet?page=70 (accessed on 11 October 2026).
- HORSCH Maschinen GmbH. Joker RT Compact Disc Harrow: Technical Data. Available online: https://www.horsch.com/it/prodotti/lavorazione-del-terreno/erpici-a-dischi/joker-rt (accessed on 11 October 2026).
- LEMKEN GmbH & Co. KG. Rubin 10 Compact Disc Harrow: Technical Data. Available online: https://lemken.com/en/soil-cultivation/stubble-cultivation/compact-disc-harrows/rubin-10 (accessed on 11 October 2026).
- Bulgakov, V.; Adamchuk, V.; Arak, M.; Nadykto, V.; Kyurchev, V.; Olt, J. Theory of vertical oscillations and dynamic stability of combined tractor-implement unit. Agron. Res. 2016, 14, 689–710. [Google Scholar]
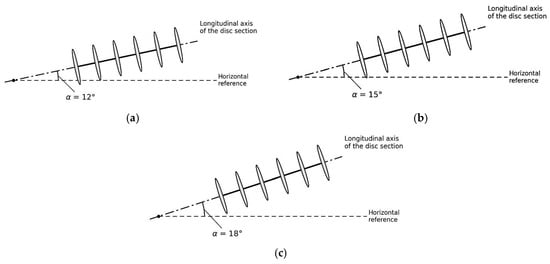
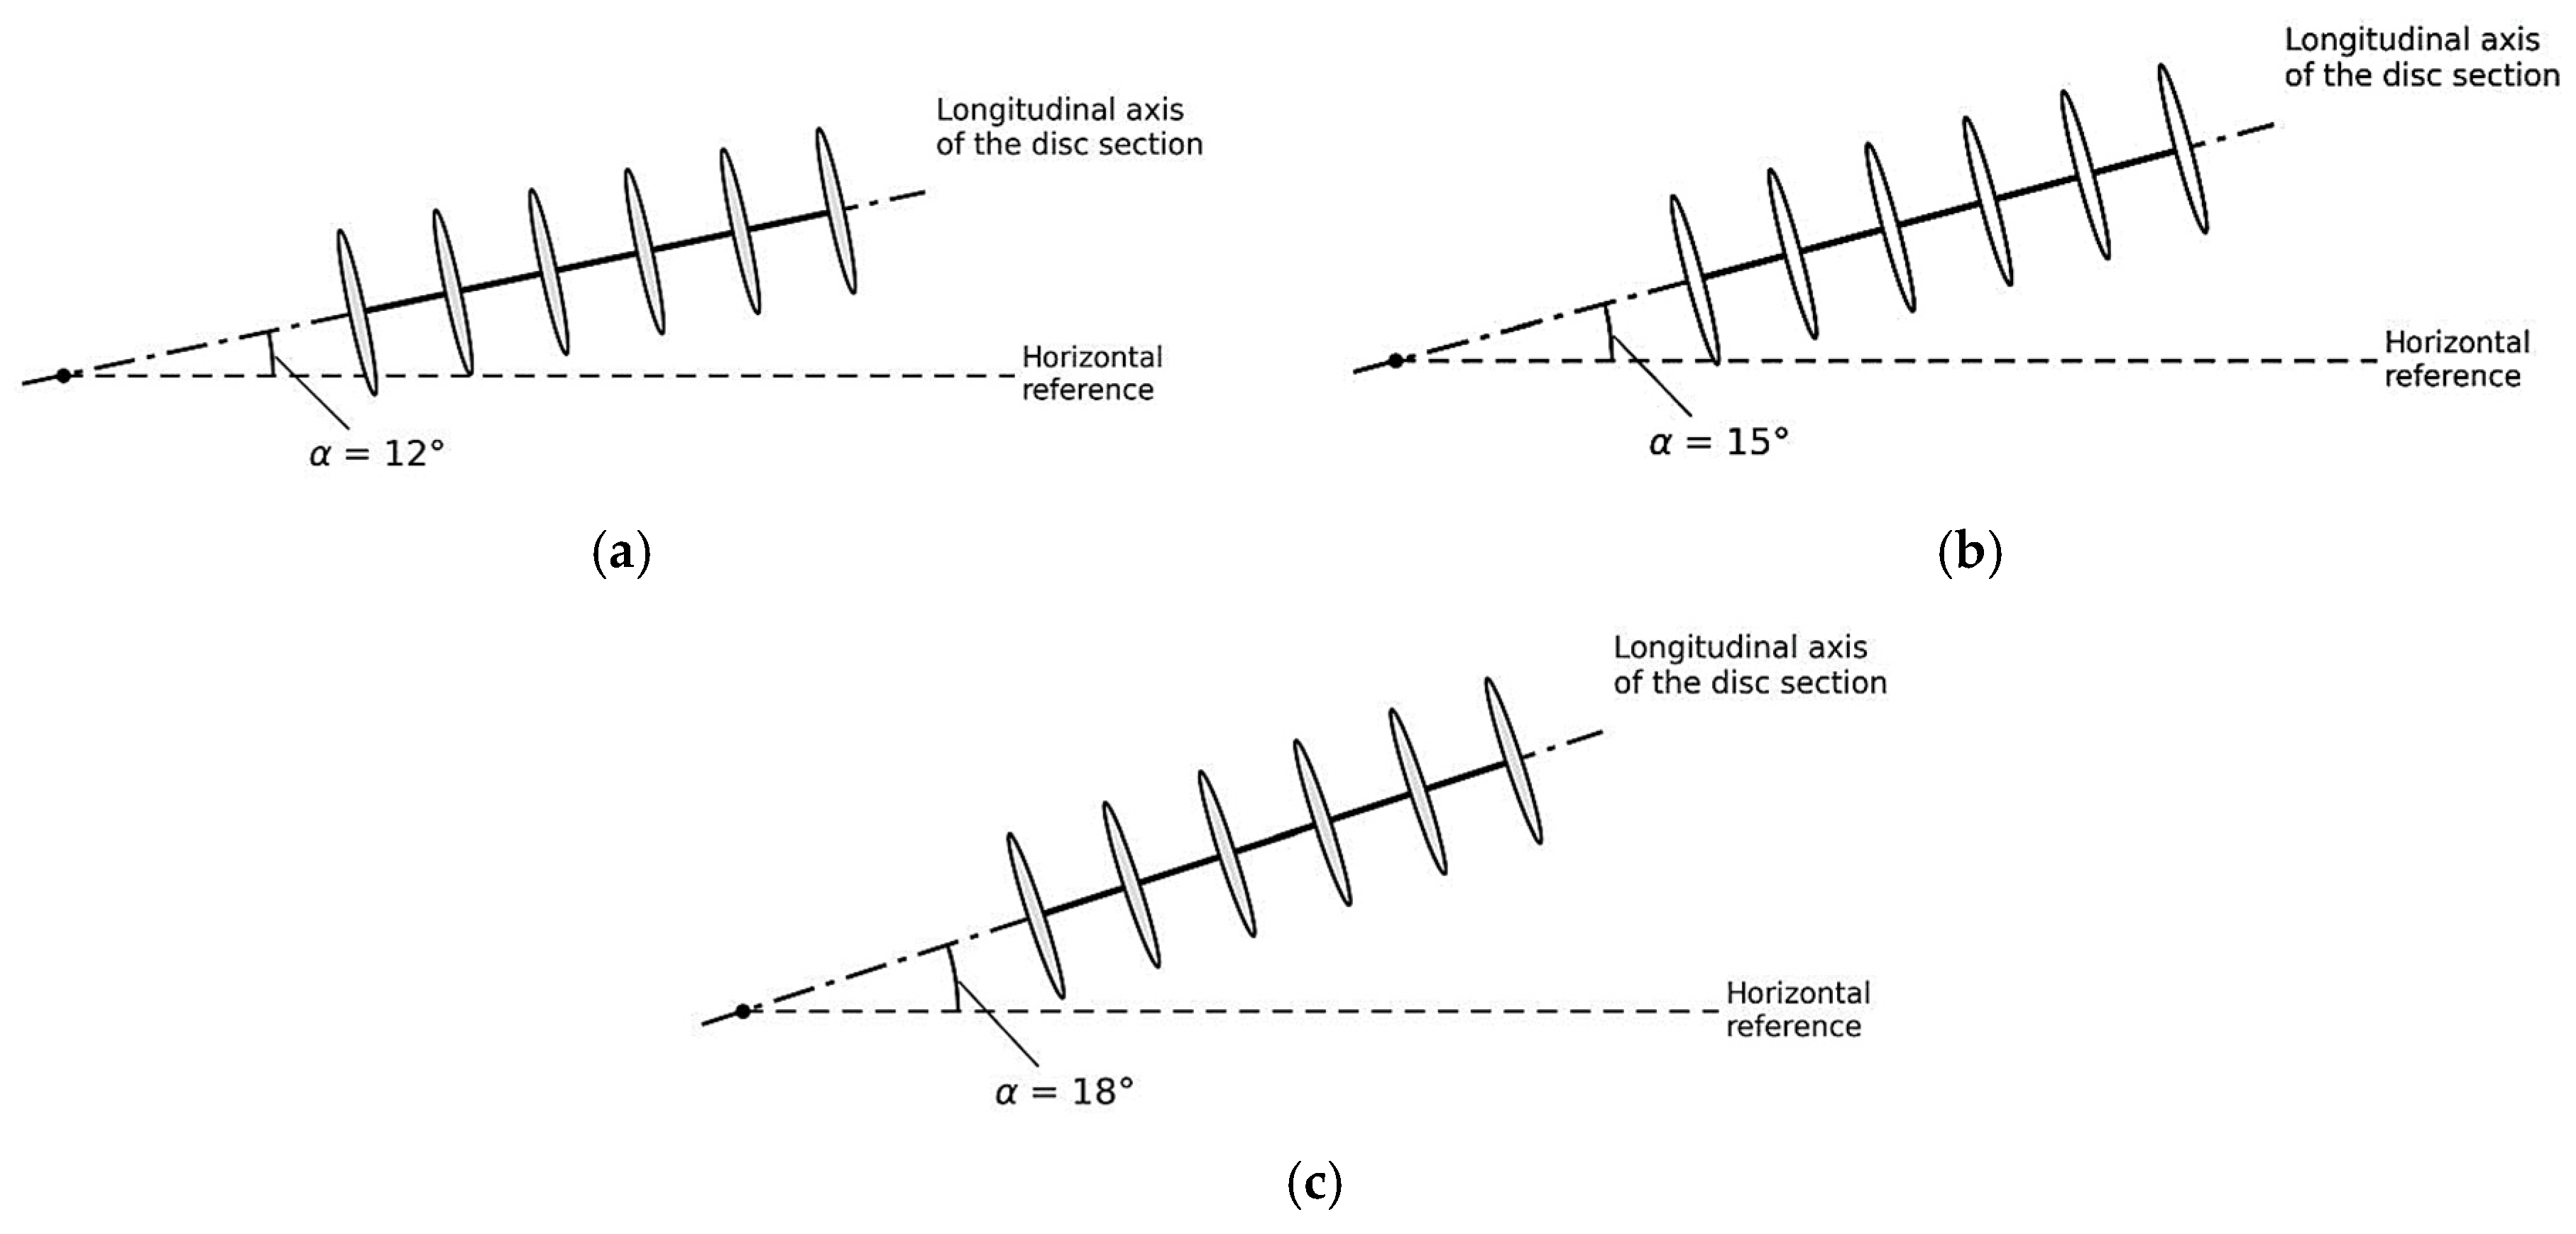
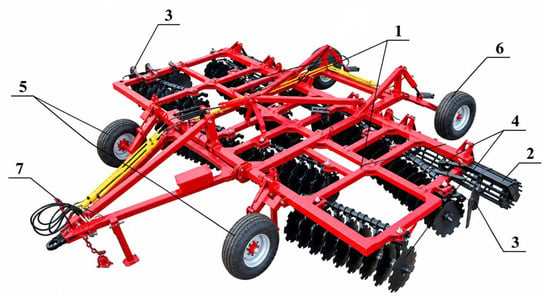
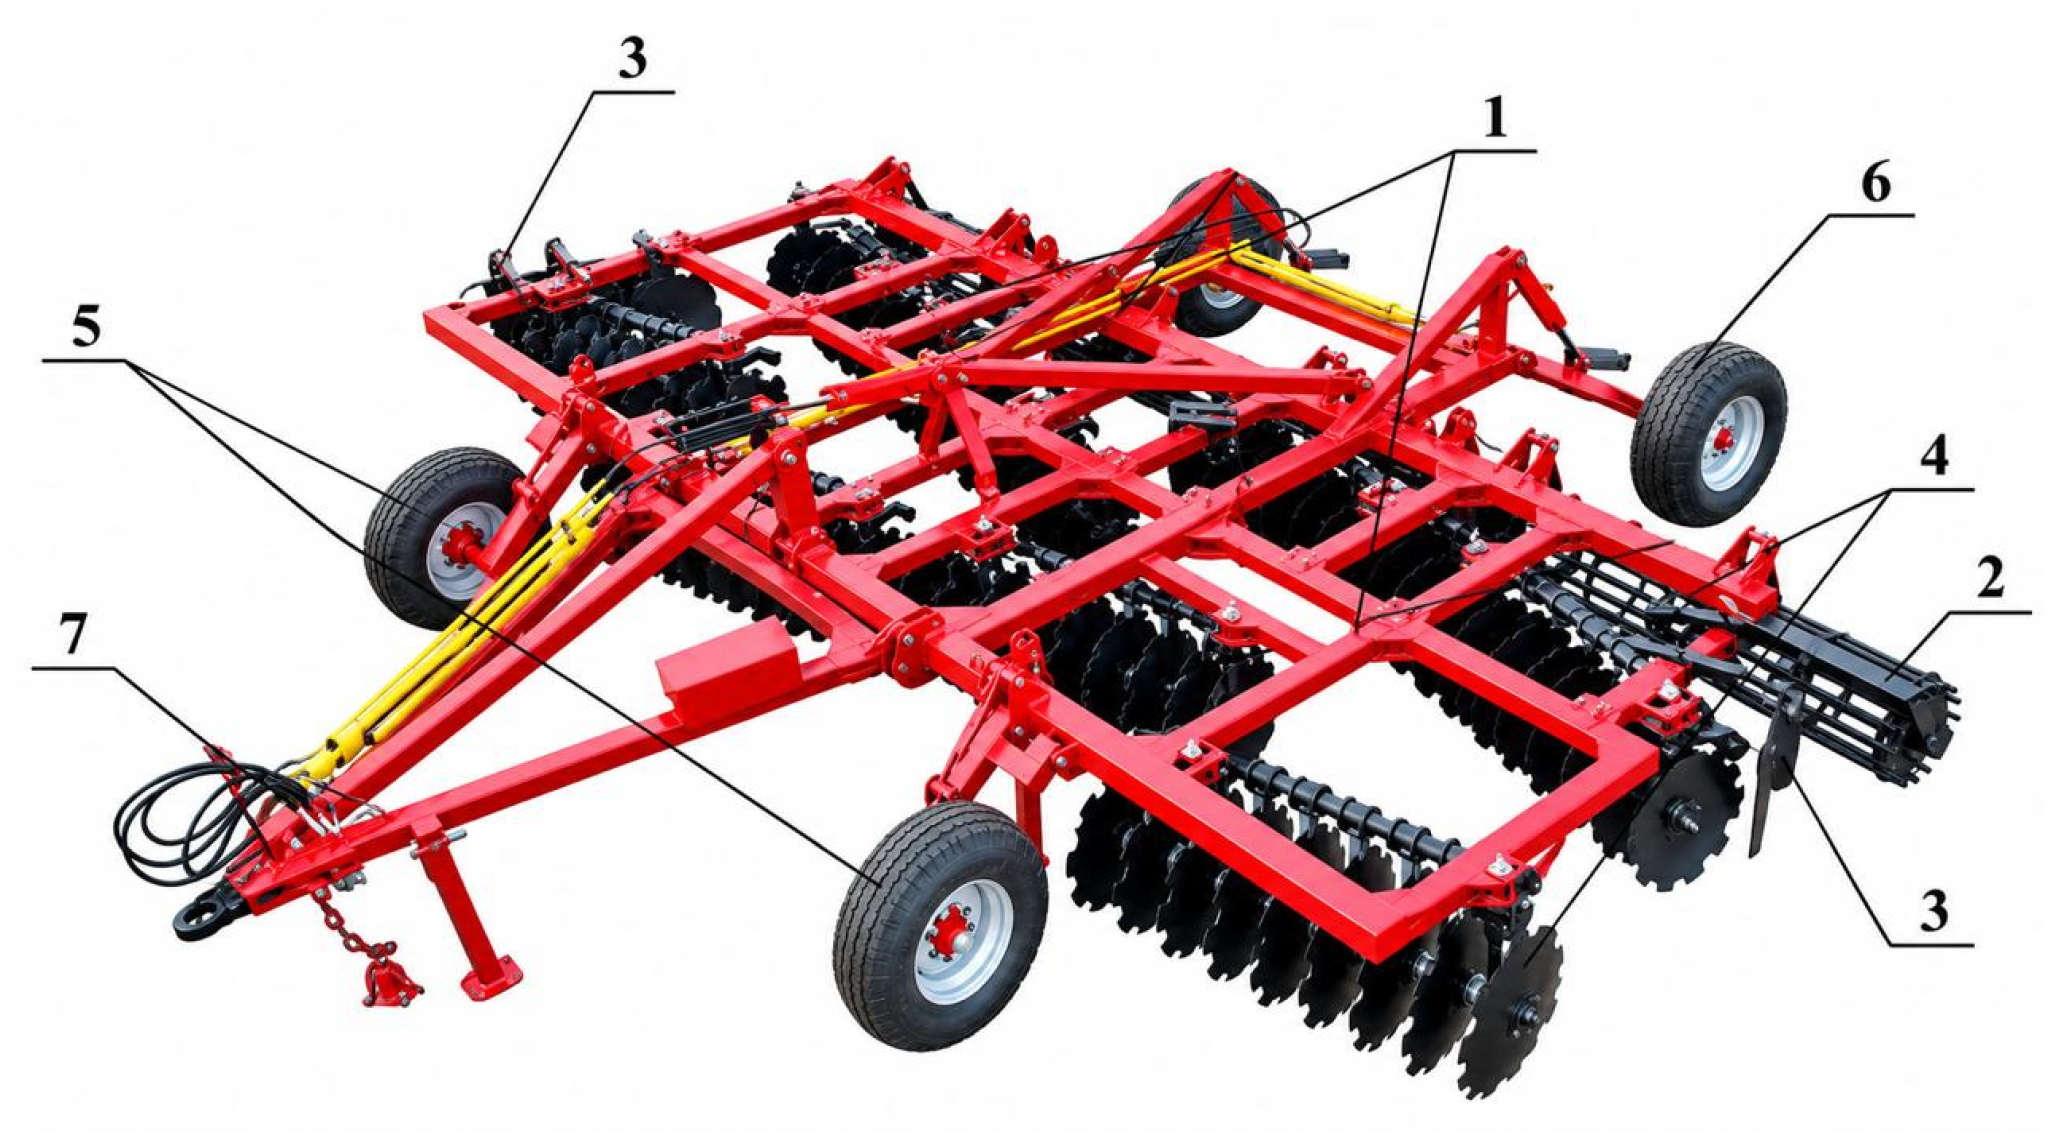
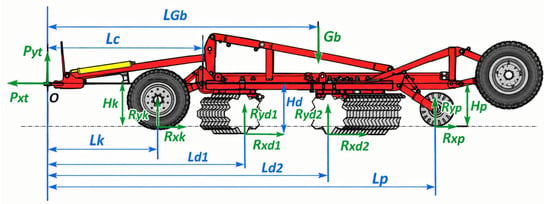
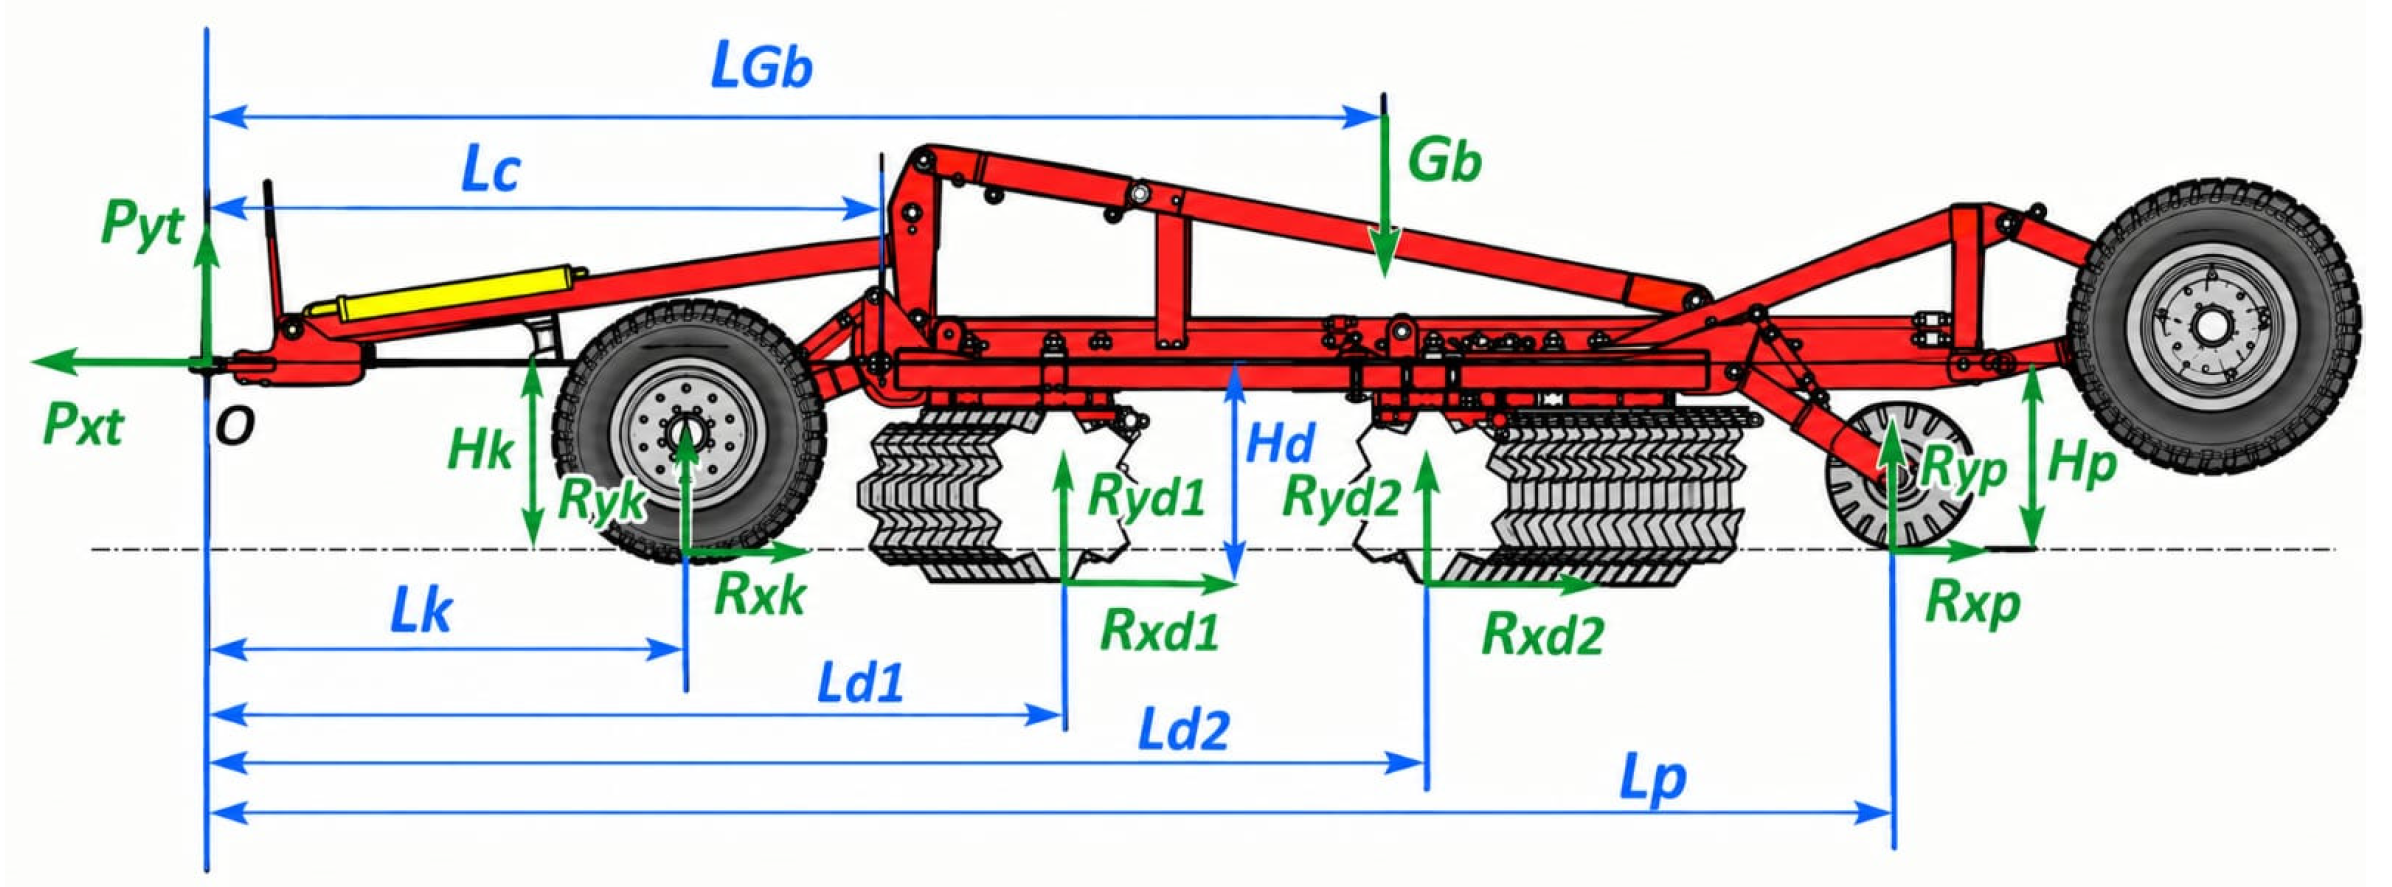
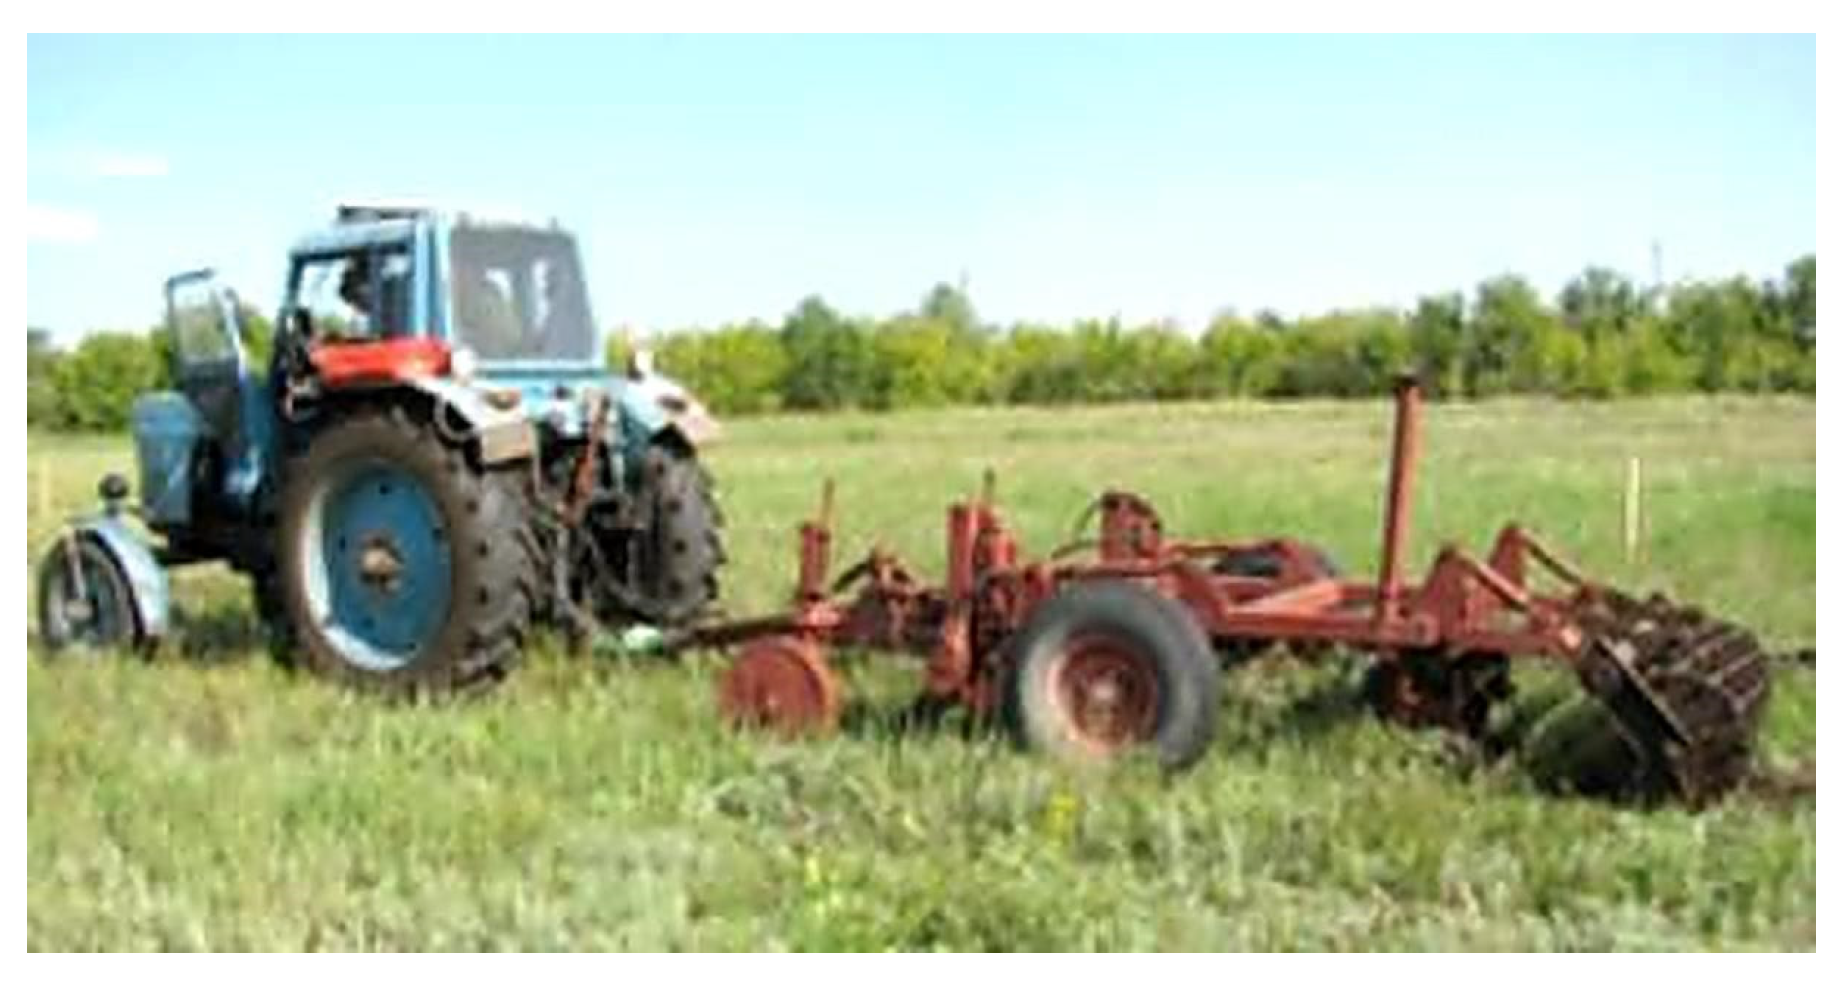
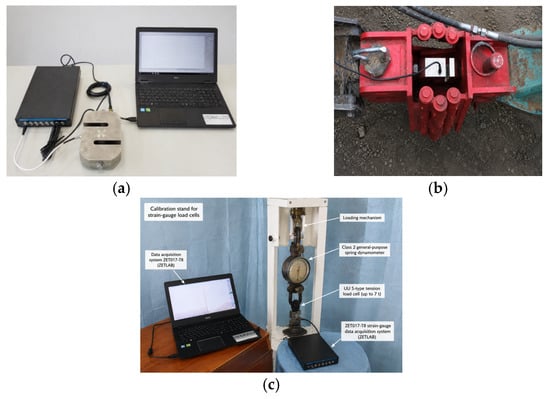
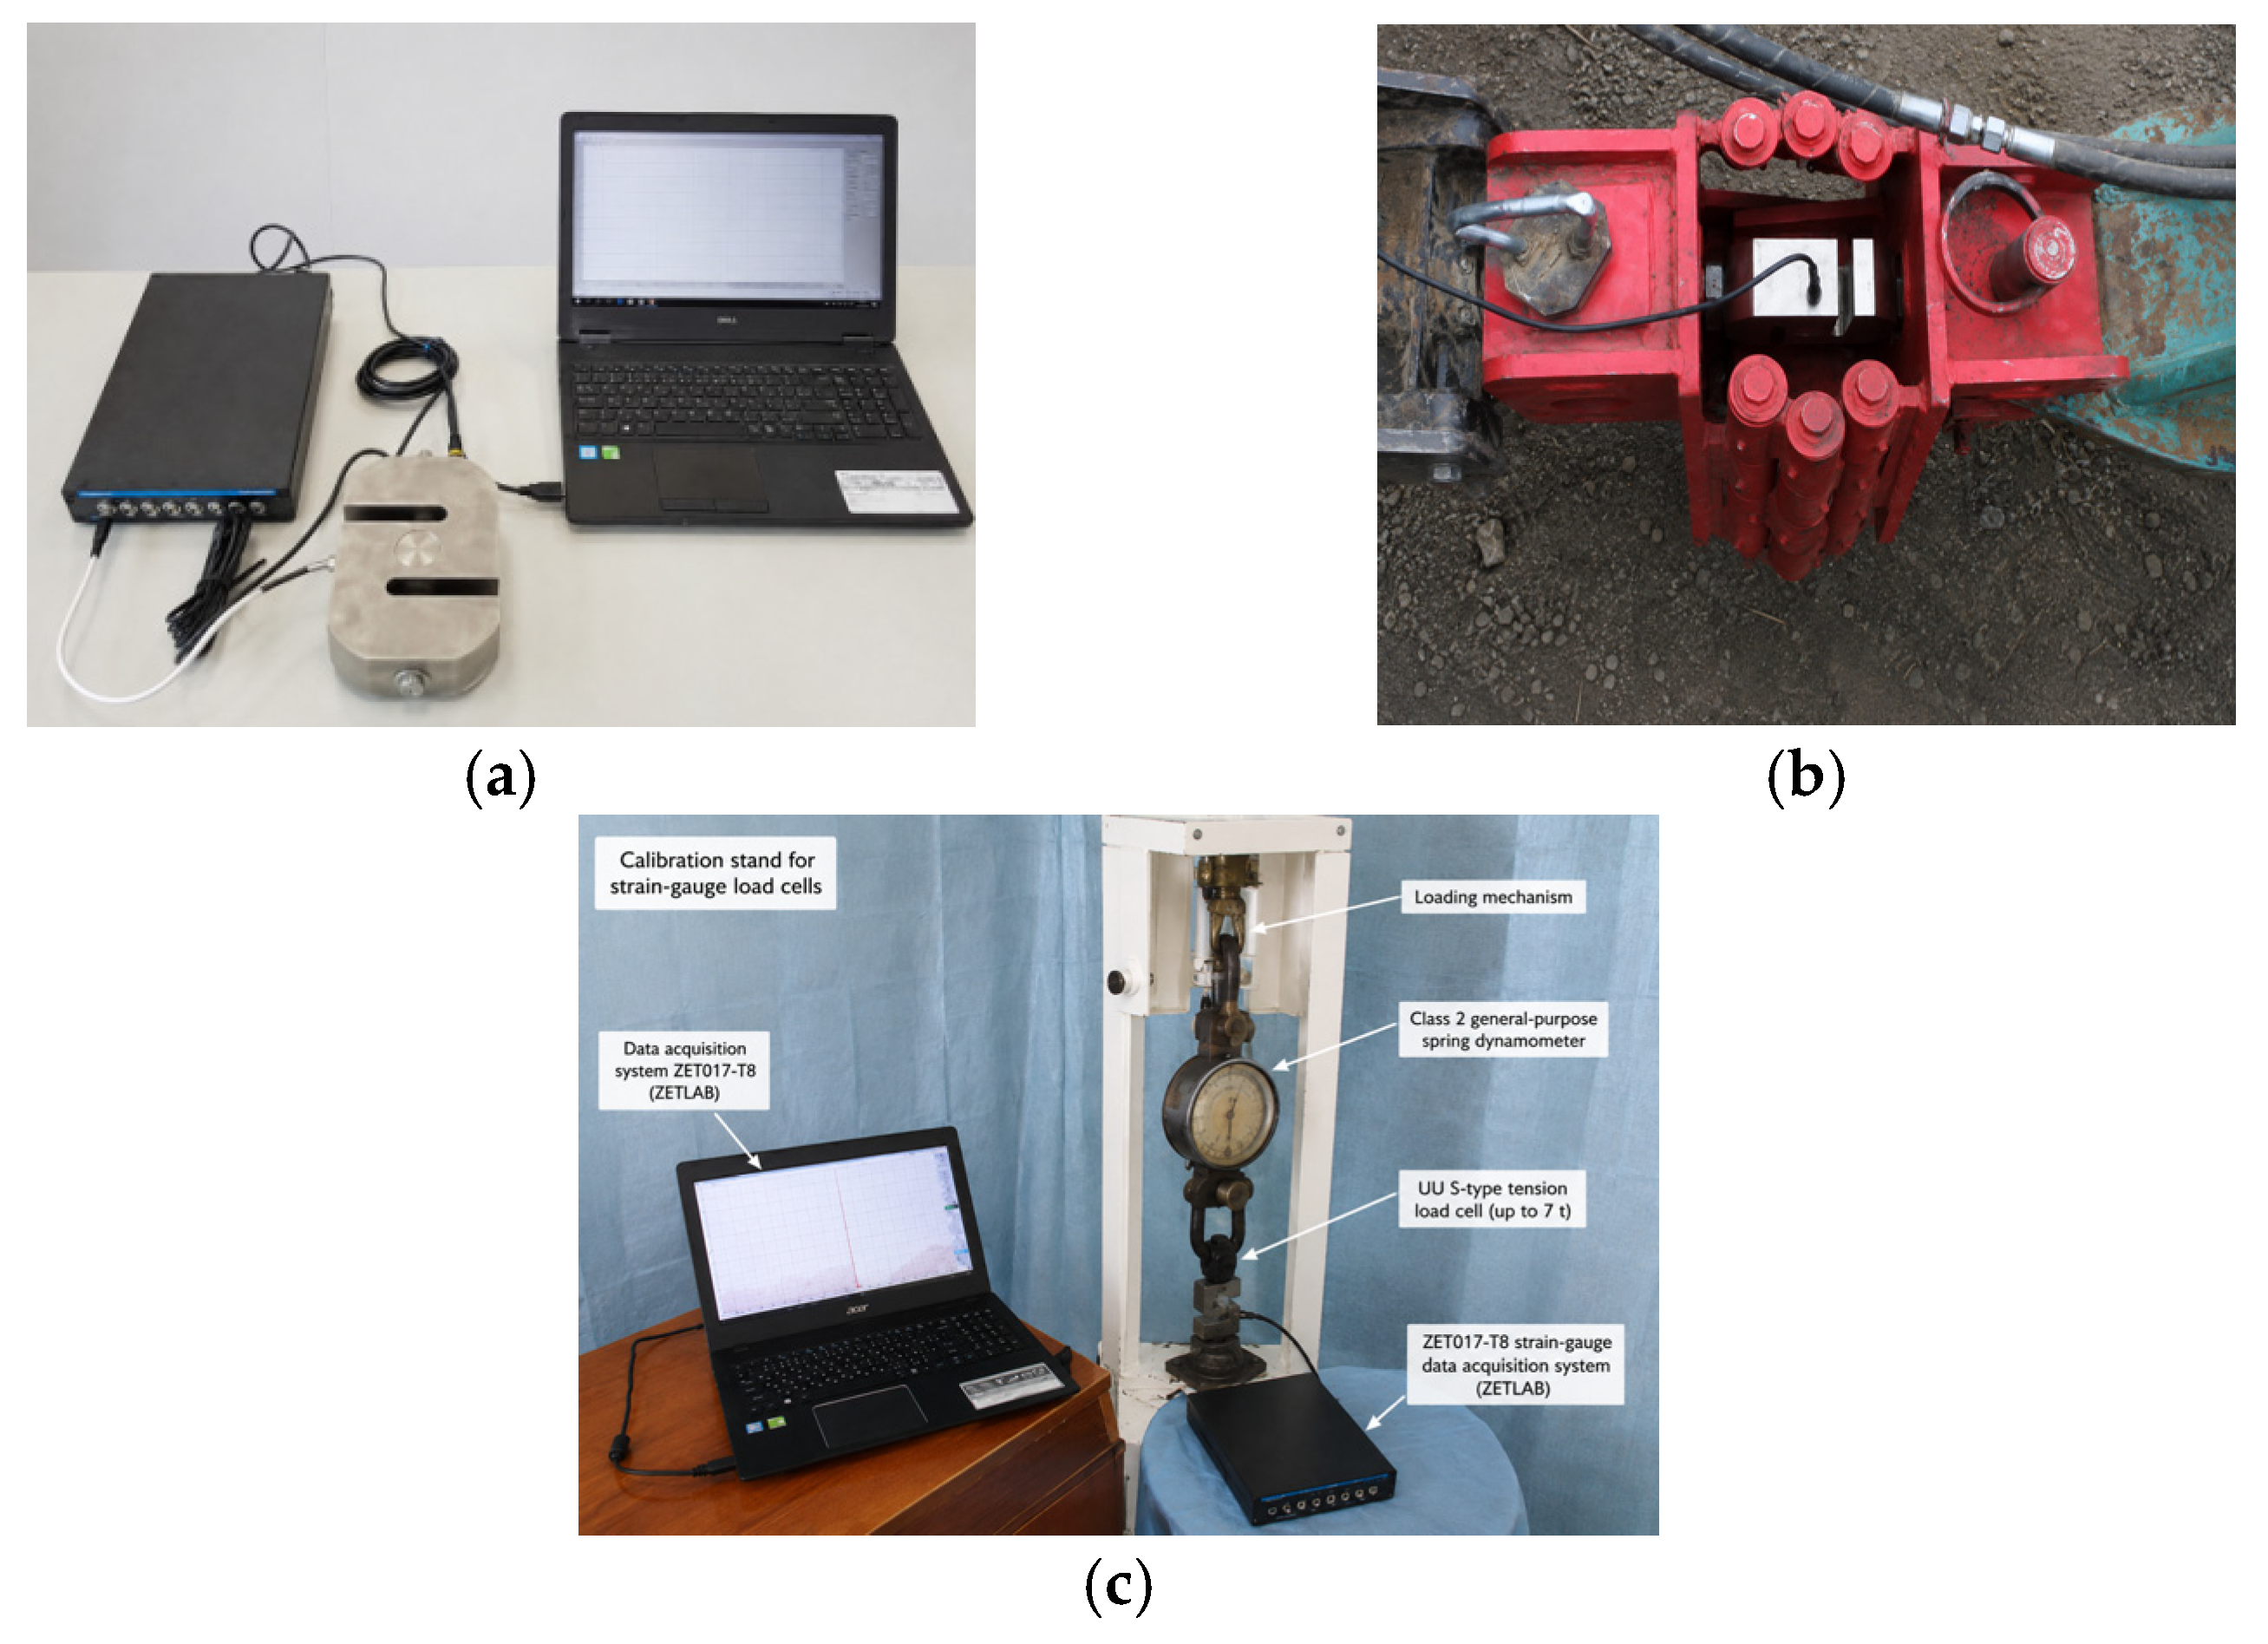
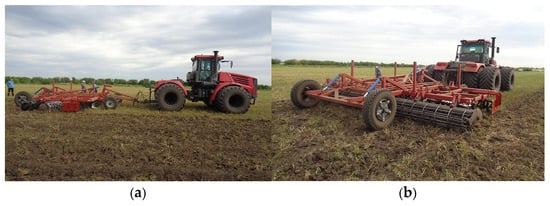
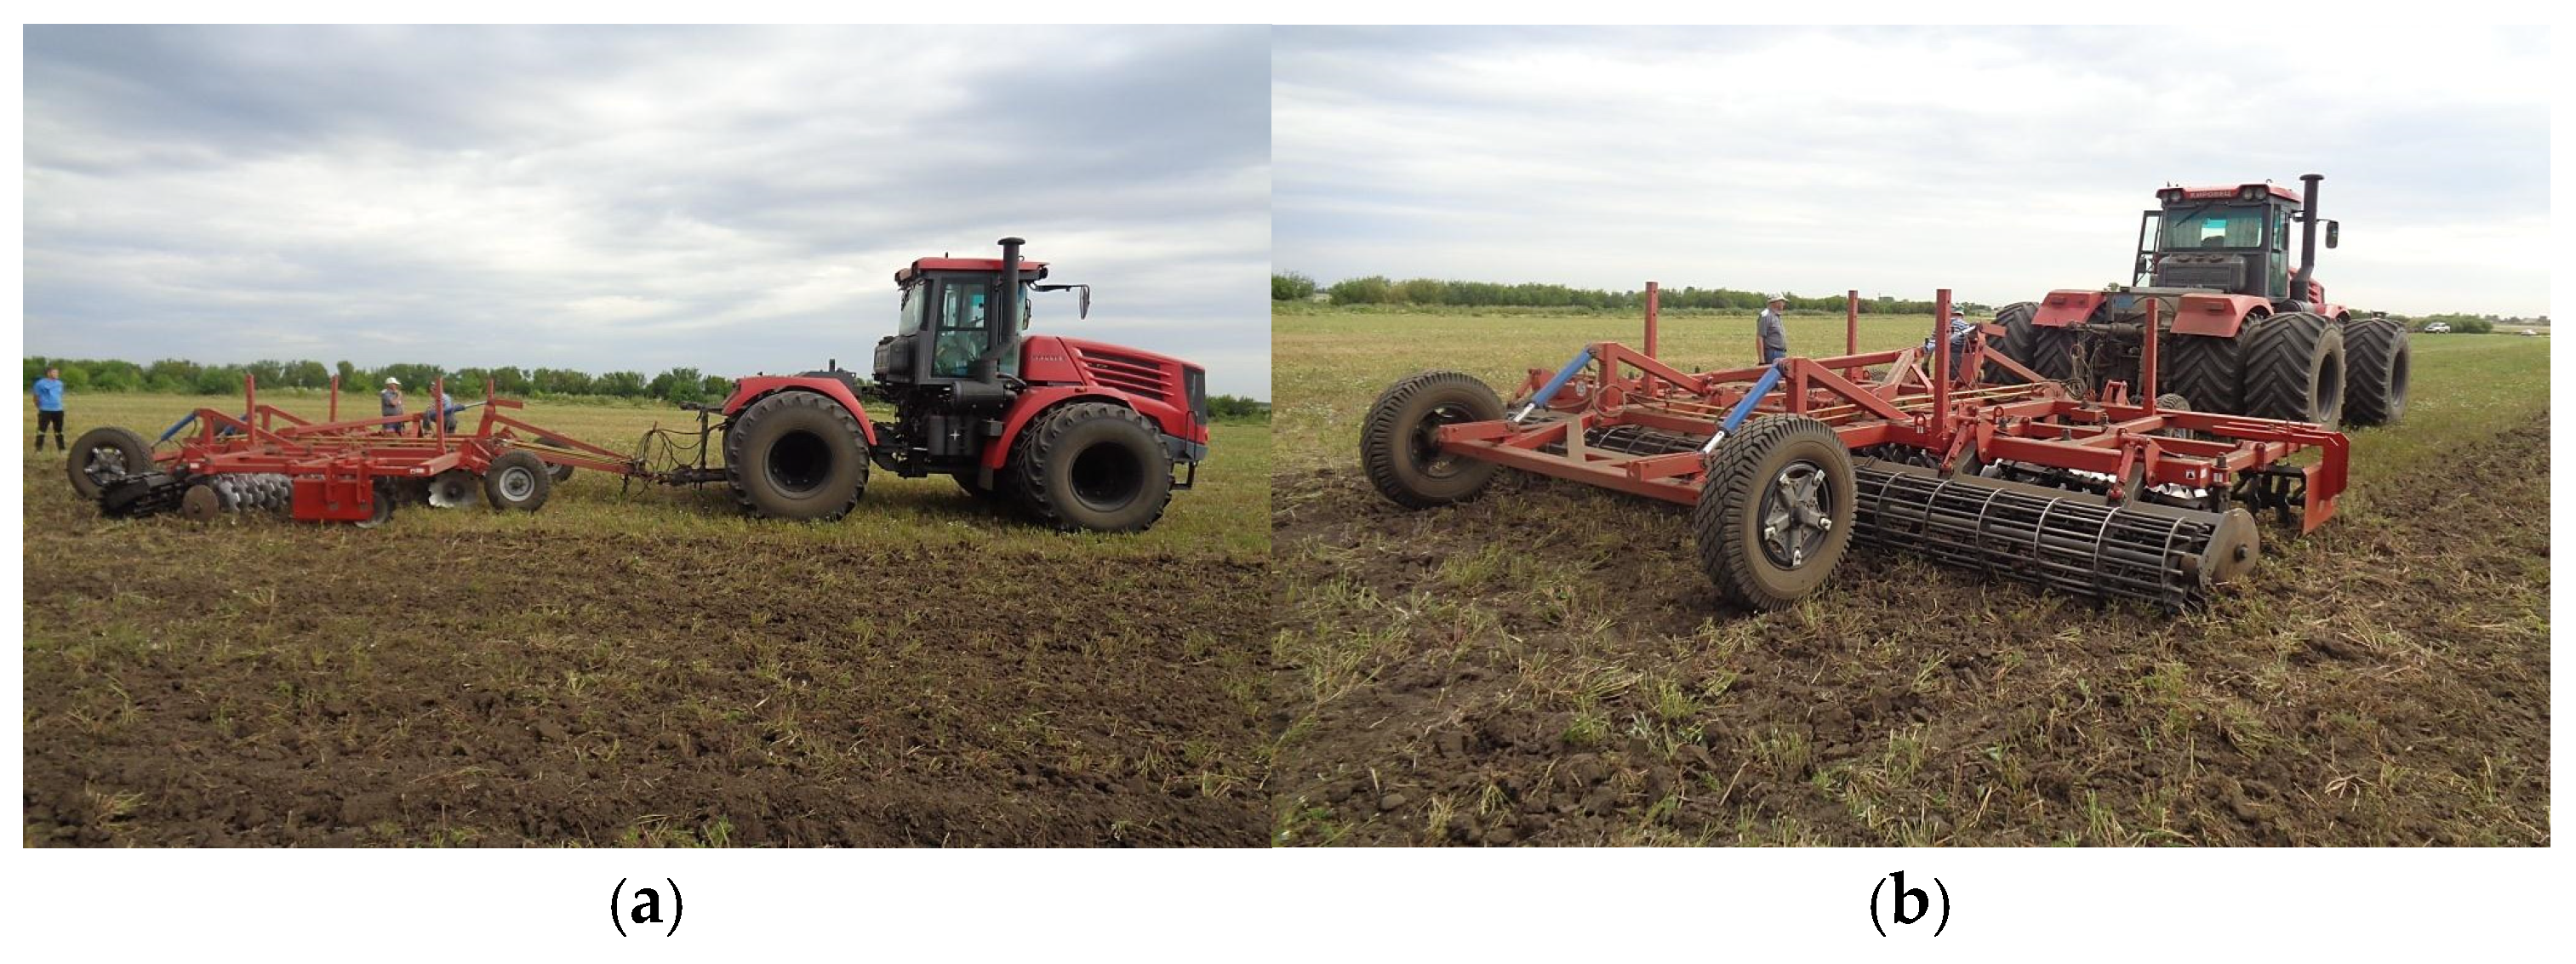
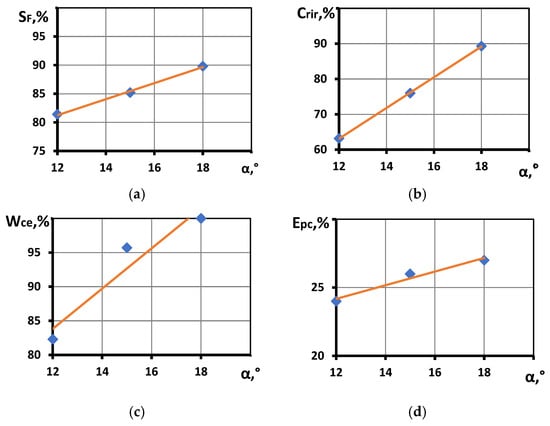
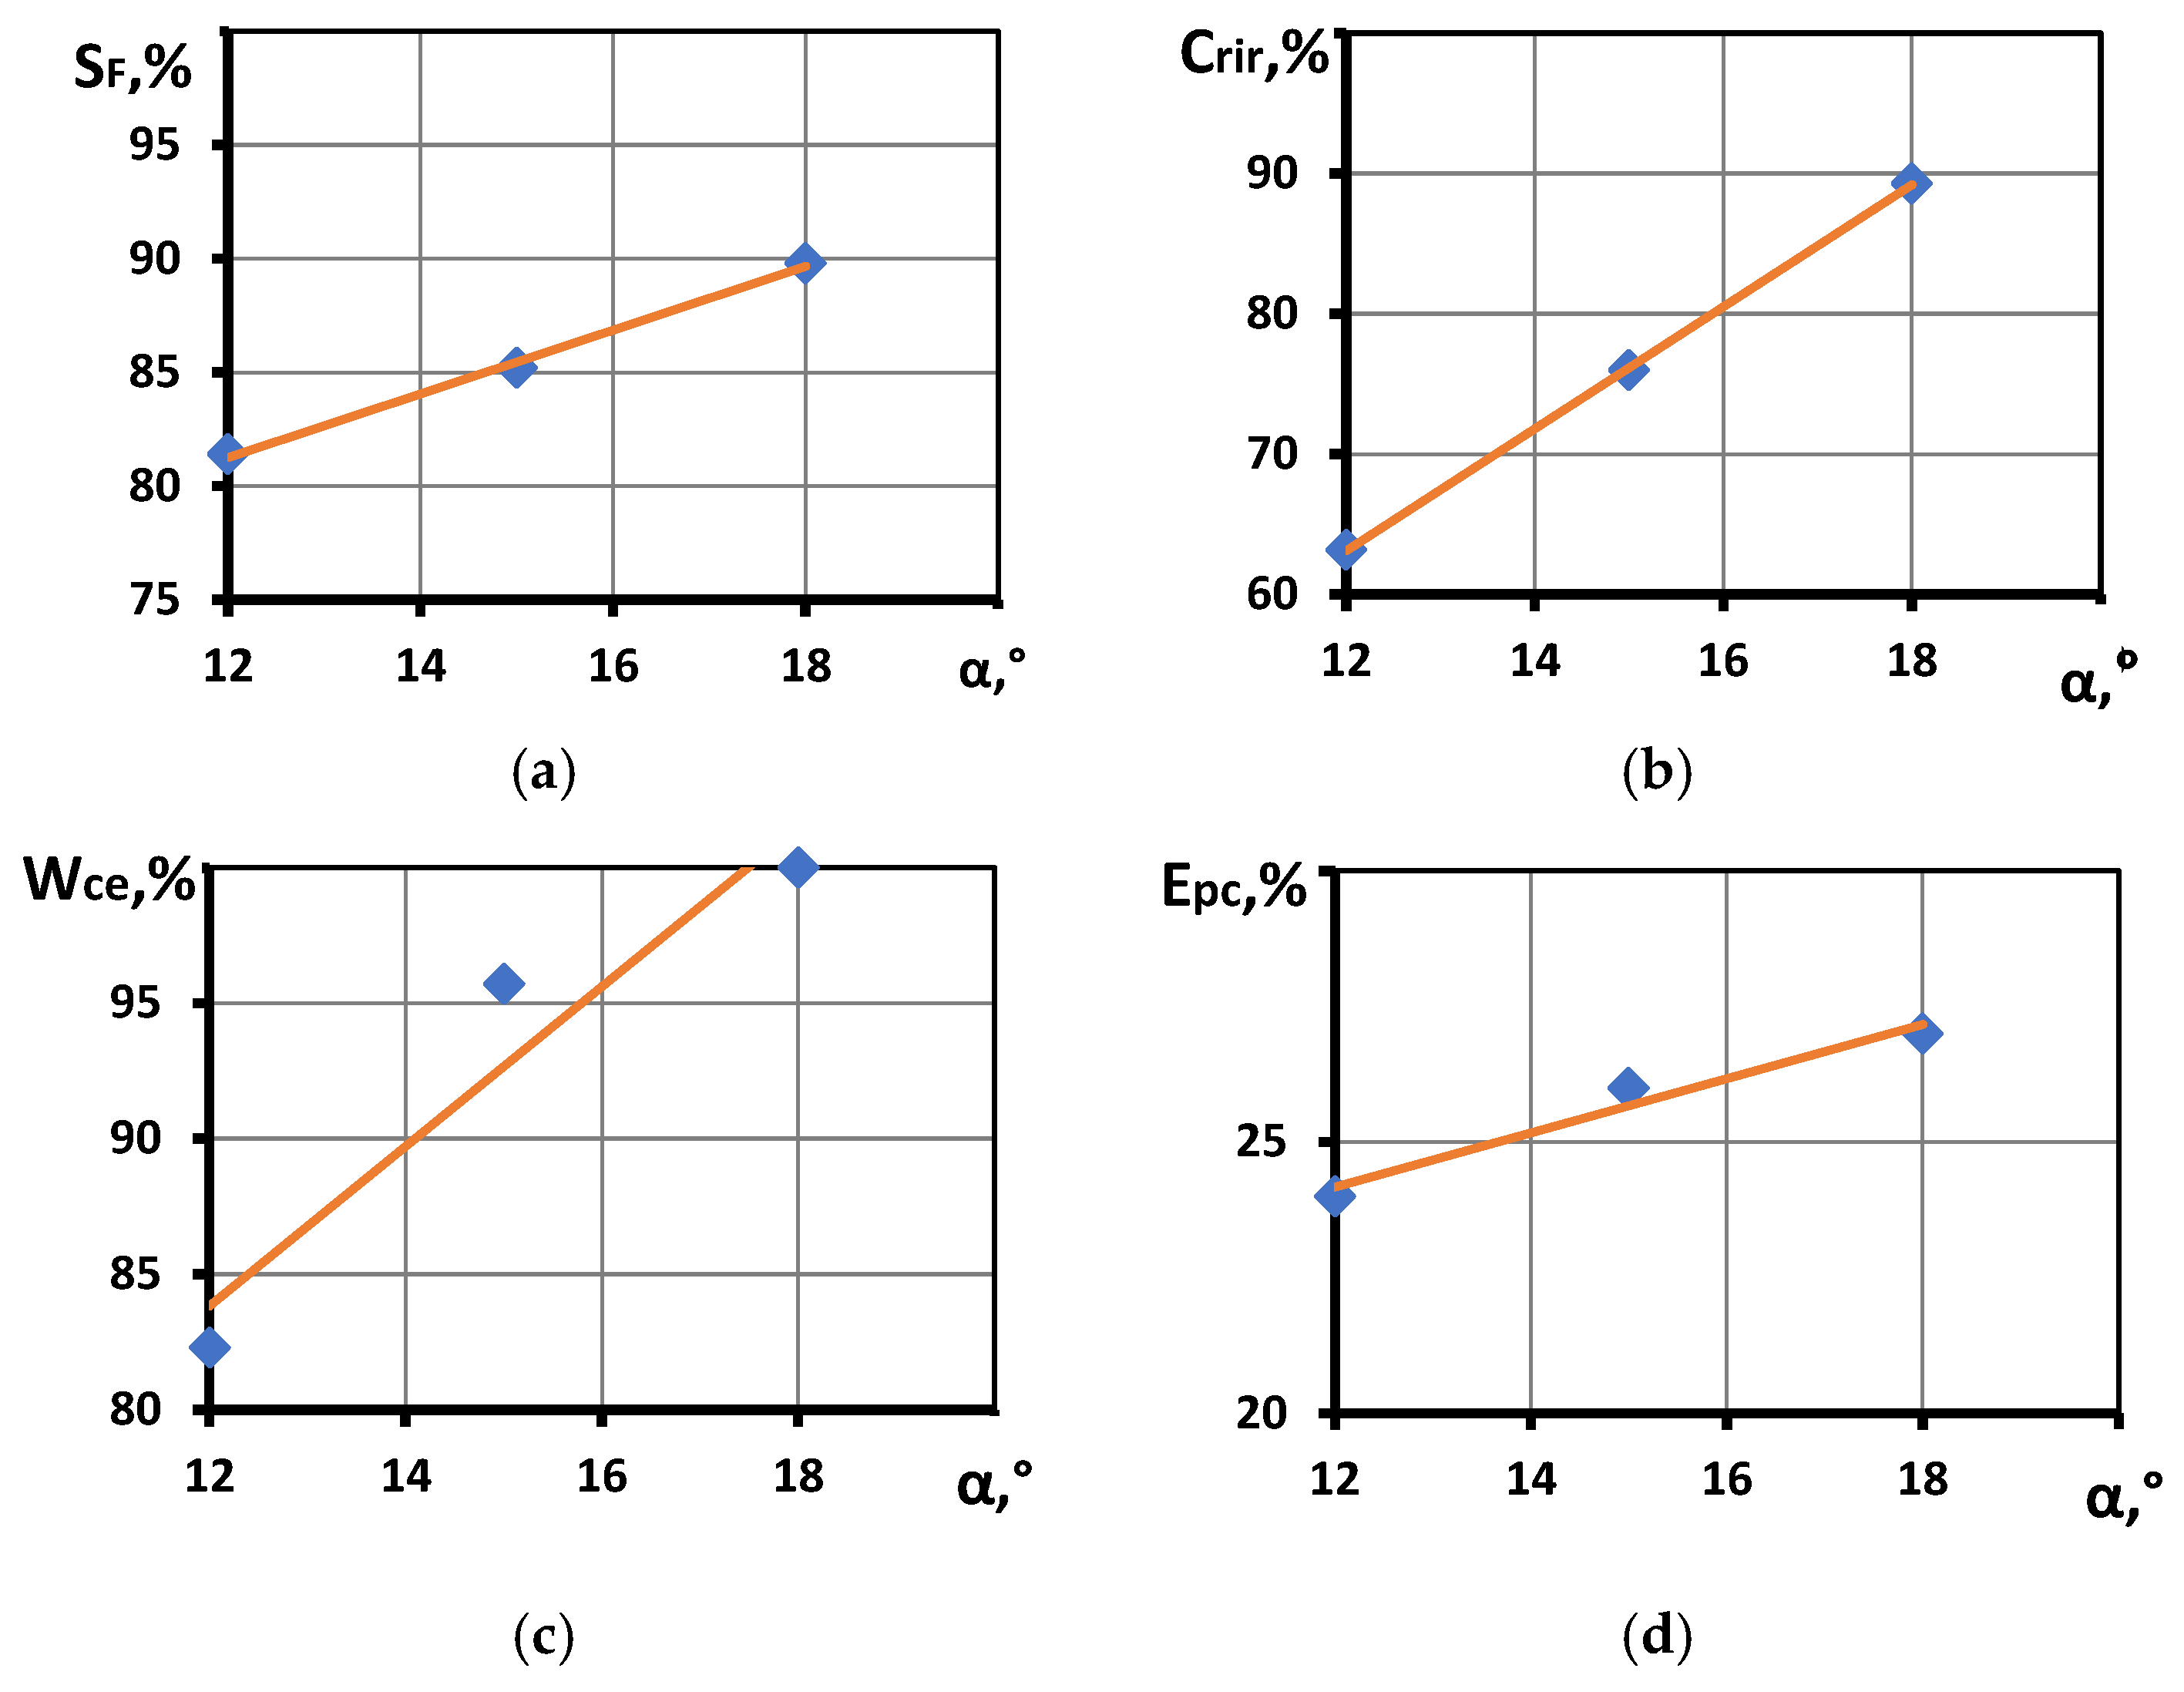
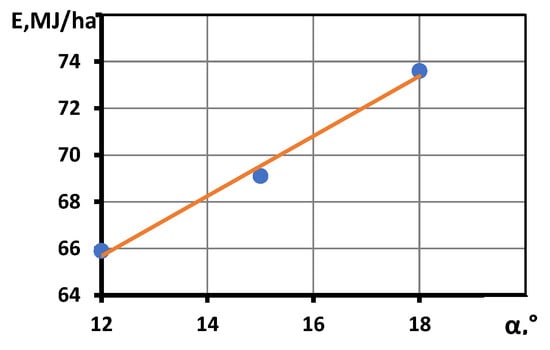
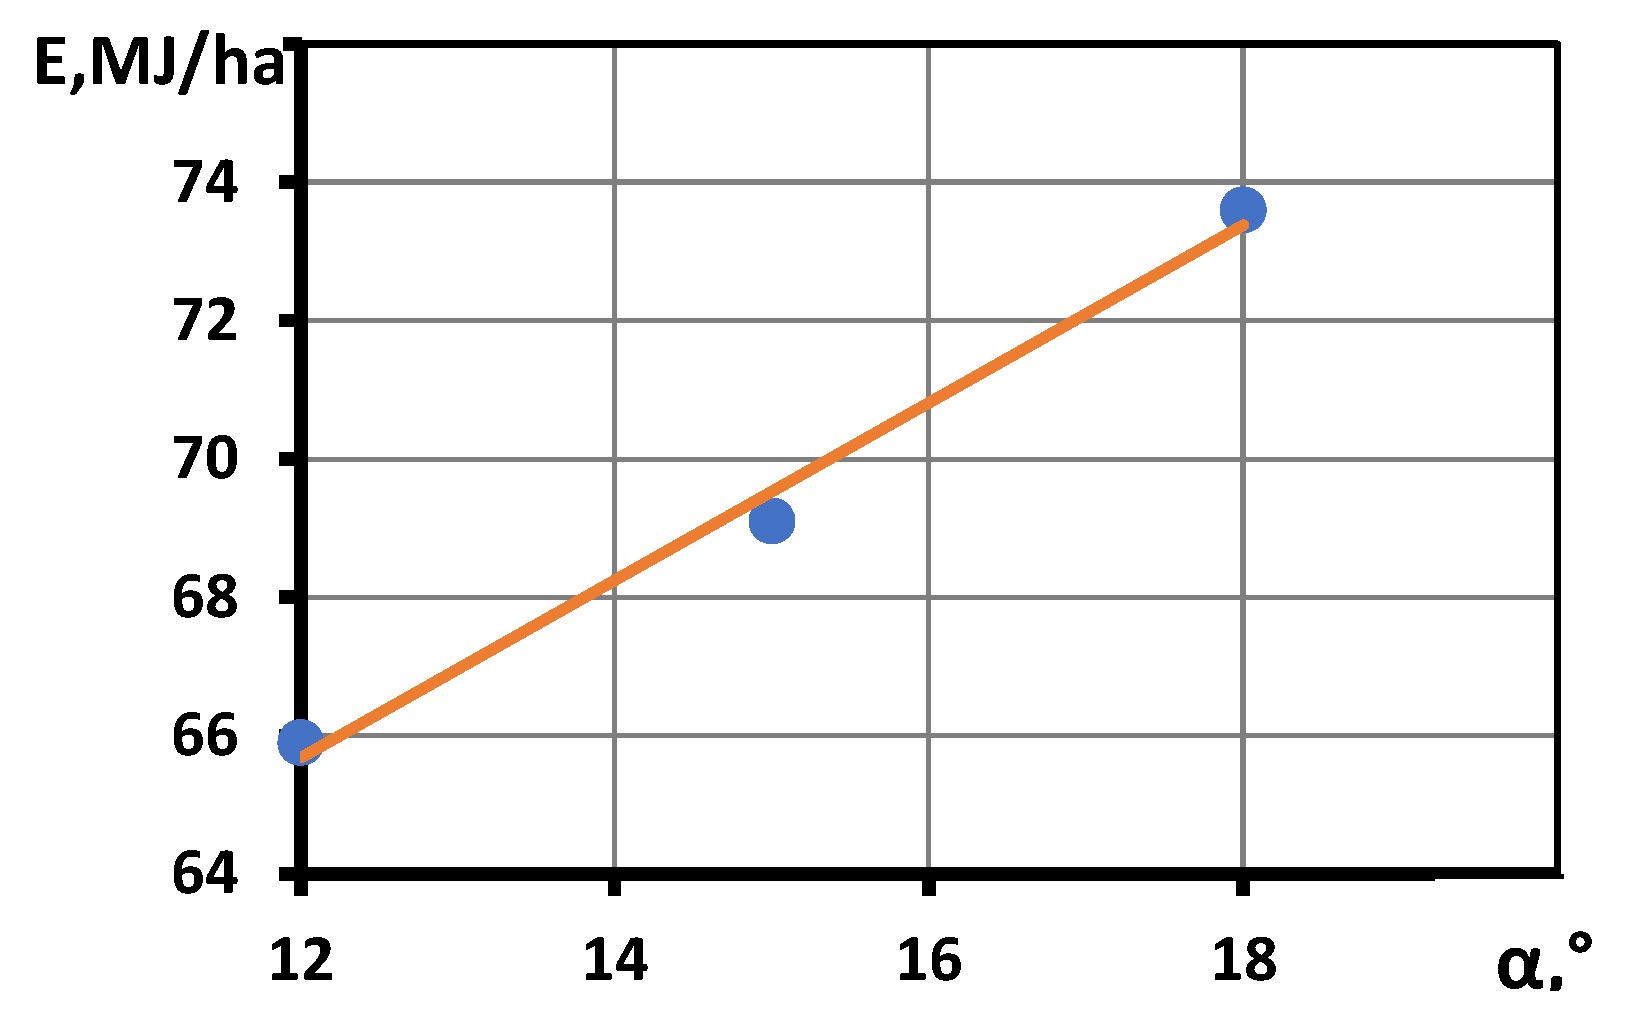

Disclaimer/Publisher’s Note: The statements, opinions and data contained in all publications are solely those of the individual author(s) and contributor(s) and not of MDPI and/or the editor(s). MDPI and/or the editor(s) disclaim responsibility for any injury to people or property resulting from any ideas, methods, instructions or products referred to in the content. |
© 2026 by the authors. Licensee MDPI, Basel, Switzerland. This article is an open access article distributed under the terms and conditions of the Creative Commons Attribution (CC BY) license.