


Abstract
The fine particle size of Ganoderma lucidum spore powder and the resulting low collection efficiency represent a prevalent challenge in the industry. To address this problem, a collection device for Ganoderma lucidum spore powder was designed in this study. The discrete element method and CFD-DEM coupling approach were adopted to conduct the contact parameter calibration of spore particles and the structural optimization of the gas collection hood. First, the factors significantly affecting the angle of repose were screened out via Plackett–Burman screening test and steepest ascent test, and a simplified regression model was established through the Box–Behnken experiment; the final parameter combination was then determined by EDEM verification, with a relative error of only 0.85% against the measured angle of repose. On this basis, the influence laws of side wall inclination angle, vertical height, and curved opening angle of the gas collection hood on flow-field characteristics and particle collection efficiency were analyzed. By comprehensively evaluating the three flow-field indicators (flow-field uniformity, effective negative pressure range, and vortex suppression), and using the collection efficiency as a verification indicator, the optimal structural parameter combination of the gas collection hood within the investigated ranges was determined as 50° side wall inclination angle, 90 mm vertical height, and 30° curved opening angle. The simulation results provide a reference for the structural design and parameter selection of the collection device.
1. Introduction
Ganoderma lucidum is a precious medicinal herb with an extremely long history of application in traditional Chinese medicine, and its medicinal value has long been fully recognized [1]. More importantly, modern pharmacology has provided clear and rigorous evidence that the main active components in Ganoderma lucidum, such as polysaccharides and triterpenoids, are enriched in its reproductive cells, namely Ganoderma lucidum spores. Therefore, the bioactive substances contained in Ganoderma lucidum spore powder have outstanding performance in anti-tumor, immunomodulatory, hypoglycemic, and antioxidant aspects [2,3], and exhibit good regulatory effects on various diseases [4,5]. For this reason, Ganoderma lucidum spores are widely recognized as an excellent functional food. Polysaccharides are the most important bioactive components in Ganoderma lucidum spores, contributing greatly to health benefits [6], and thus are also important high-value-added raw materials in the modern health industry.
Traditional harvesting methods for Ganoderma lucidum spore powder mainly include the bagging method, plastic film mulching method, and fan adsorption method. The bagging method involves wrapping the mushroom cap with plastic or paper bags. Although this method can reduce spore dispersion, it easily leads to poor ventilation, causing mold contamination or spore deterioration due to high temperature and humidity. The plastic film/cardboard method involves laying plastic film or cardboard under Ganoderma lucidum and collecting spores by gravity sedimentation. This method has extremely low collection efficiency, is prone to contamination by impurities such as dust and soil, and cannot collect spores dispersed into the air, resulting in significant resource waste. The implementation process of the fan adsorption method is as follows: when Ganoderma lucidum spores enter the initial ejection and release stage, fans are arranged in the central area of the greenhouse at an installation height of 1.0–1.5 m above the ground, and the collection of Ganoderma lucidum spore powder is completed by relying on the negative pressure adsorption effect formed by fan operation. The disadvantage is that it cannot collect Ganoderma lucidum spore powder from low and edge areas of the greenhouse, and energy consumption is high.
To address the problem of low collection efficiency of Ganoderma lucidum spore powder, this paper adopts the CFD-DEM coupling simulation method to study the collection device for Ganoderma lucidum spore powder, and the key first step is the determination of particle physical property parameters. In the field of ultrafine powder materials, Li Yongxiang et al. [7] conducted discrete element contact parameter calibration for wheat flour particles with an average particle size of 0.212 mm by scaling up the particles with a scaling ratio of approximately six times based on dimensional analysis and particle scaling theory. For agricultural irregular particles, Zhang Qing et al. [8] constructed a multi-sphere discrete element model matching the geometric characteristics of actual spiral-curled alfalfa pods and completed the parameter calibration of alfalfa seed discrete elements; Chen Leilei et al. [9] innovatively proposed a dual-response calibration method using angle of repose and area ratio on steel plate to address the problem of parameter multiplicity in the single angle of repose response value of cylindrical shrimp feed particles; in the field of algorithmic calibration, Yuan Shengyang et al. [10] established a BP neural network inversion calibration prediction model based on BP neural network, and calibrated the normal-tangential stiffness ratio and friction coefficient of sand–gravel model particles.
Currently, there are few studies on the flow field during the collection process of Ganoderma lucidum spore powder, but there have been extensive studies on dust collection. In industrial production, Zhang Minglu et al. [11] used CFD-DEM coupling to study the influence of airflow velocity, baffle structure, and shot blasting quantity on recovery and separation efficiency, and optimized the structural parameters of the system. In the field of agricultural machinery, Xi Xiaobo et al. [12] used CFD-DEM coupling to optimize the airflow velocity at the outlet of the fertilizer discharge pipe and fertilizer particle velocity, and designed an optimized gas-fertilizer mixing chamber structure to achieve precise fertilization. In the field of polar scientific research, Zheng Sijie et al. [13] studied ship resistance and ice motion, and discussed the relationship between ice impact resistance, flow rate, and rotating propellers under different Froude numbers, providing a theoretical reference for polar ship design.
This paper proposes a Ganoderma lucidum spore powder collection device, verifies the feasibility of the device through CFD-DEM coupling simulation [14,15], explores the influence of different structural parameters of the gas collection hood on collection efficiency, and accordingly optimizes the structural parameters of the device to improve the actual harvesting effect of Ganoderma lucidum spore powder.
2. Collection Device Design and Simulation Parameters
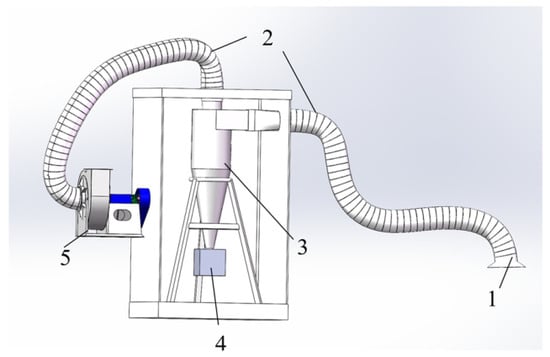
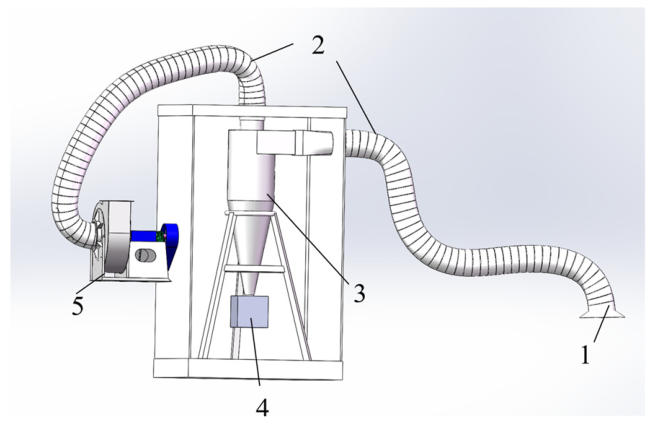
Given the particle characteristics of Ganoderma lucidum spore powder, including a particle size concentrated at 8–12 μm, low density, small particle mass, extreme susceptibility to floating and dispersion under weak airflow disturbances, and the tendency for escape and waste in conventional collection methods, this device is a spore directional adsorption collection device based on the principle of negative pressure suction. It relies on the gas collection hood to construct a gradient negative pressure field and utilizes the pressure difference driving force to achieve directional capture of suspended spores. A schematic diagram of the collection device is shown in Figure 1.
Figure 1.
Schematic of the collection device: 1—gas collection hood; 2—corrugated pipe; 3—cyclone separator; 4—centrifugal fan; 5—powder collection barrel.
The Ganoderma lucidum spore powder collection device adopts an integrated design of suction-separation-collection. Suction end: A gas collection hood installed in the greenhouse directly captures spores ejected from above the mushroom cap through negative-pressure suction. Conveying pipe network: Corrugated pipes are used to connect the airflow channel between the gas collection hood and the separation equipment. Gas–solid separation unit: The core component, mainly a cyclone separator. High-speed dust-laden gas enters the cyclone separator, spirals downward, and then enters the upper corrugated pipe, while the spore powder settles downward to achieve separation. Power source: A centrifugal fan provides the pressure head and air volume required by the system. Collection container: A powder collection barrel, into which the collected Ganoderma lucidum spore powder enters, completing the entire collection process.
3. Discrete Element Parameter Calibration Simulation Experiment
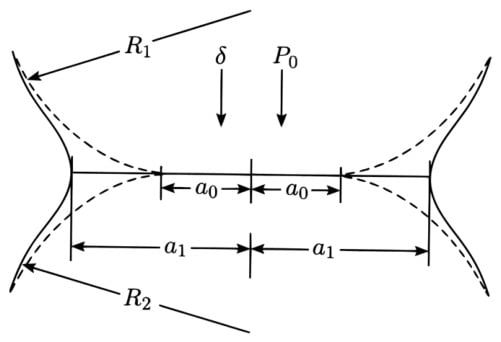
The JKR (Johnson–Kendall–Roberts) model is an adhesive contact model that, unlike the classical Hertz model, which considers only elastic contact under an external load, additionally accounts for the intermolecular adhesion induced by particle surface energy within the contact area. It is therefore suitable for describing the contact and adhesion behavior of micron-scale, high-surface-energy fine particles such as Ganoderma lucidum spore powder. A schematic of the inter-particle contact is shown in Figure 2 [16].
Figure 2.
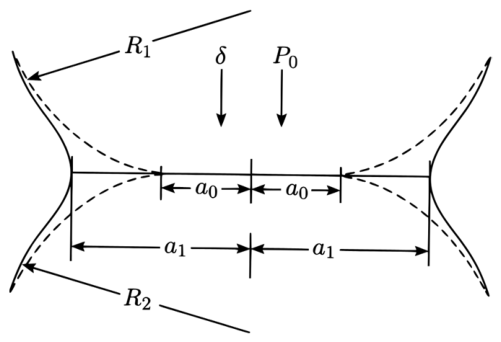
Schematic of the sphere model contact surface. Where R1 and R2 are the radii of the two spheres; P0 is the external load; a0 is the contact radius of the sphere under the classical Hertz model; a1 is the actual contact radius; and δ is the normal approach amount (approach displacement) of the two spheres.
In Figure 2, the dashed outline denotes the Hertz contact, which neglects surface adhesion so that the contact radius a0 under the same load is much smaller than the actual one; the solid outline denotes the JKR contact, in which surface energy γ enlarges the actual contact radius a1 and maintains a finite contact area even at zero external load, which explains the adhesion and agglomeration of ultrafine particles.
Based on the above theory, the experimental principle of discrete element parameter calibration is that the macroscopic parameter of particle angle of repose is affected by parameters such as friction coefficient, surface energy, and collision recovery coefficient. By adjusting various parameters, the variation trend and absolute value of the simulated angle of repose with the environment are determined to completely match the experimental values, completing the macroscopic calibration of parameters [17,18,19].
Experimental Setup and Experimental Methods
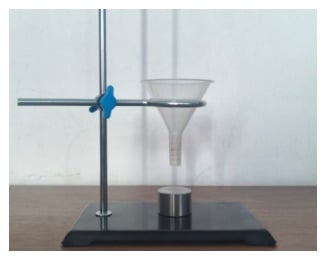
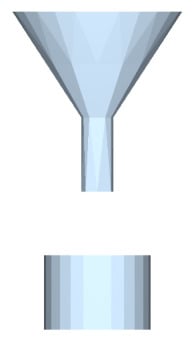
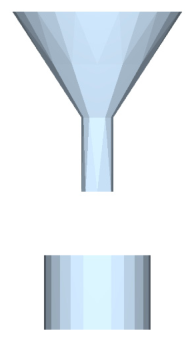
The equipment for the angle of repose measurement experiment is shown in Figure 3.
Figure 3.
Experimental equipment for measurement.
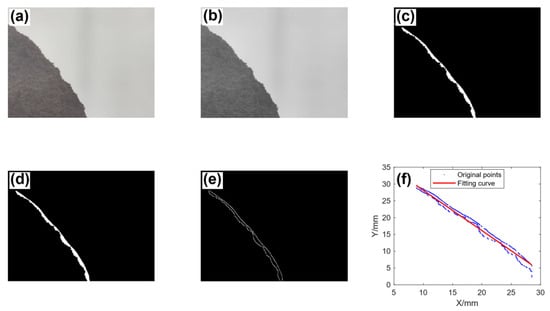
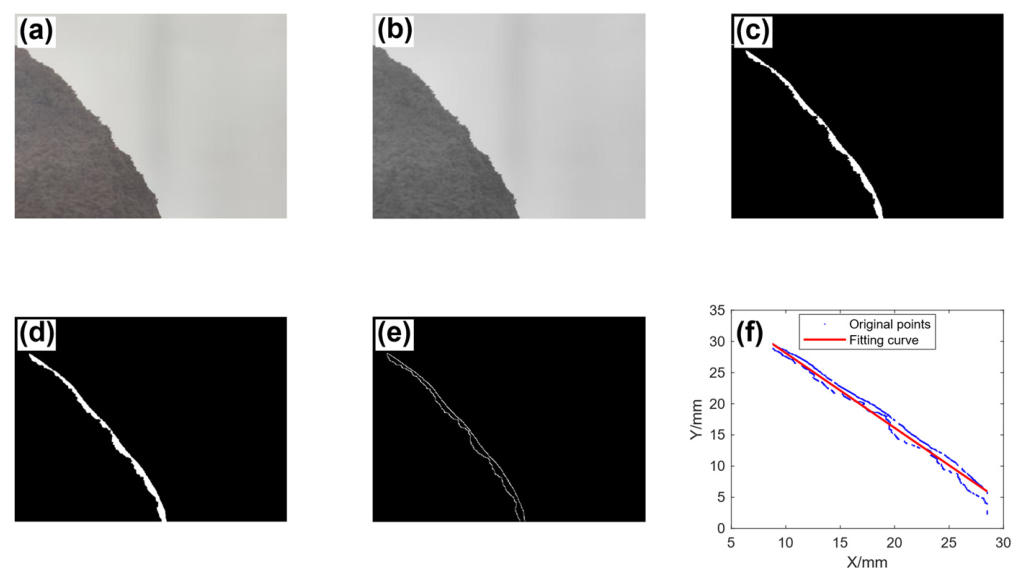
The images collected from the experiment were processed using MATLAB R2022a for image grayscaling, binarization, filtering, edge detection, and linear fitting, as shown in Figure 4.
Figure 4.
Image collection processing: (a) original image; (b) grayscale image; (c) binarized image; (d) filtered image; (e) edge detection result; (f) linear fitting result.
The angle of repose was measured 16 times, and the measured values are summarized in Table 1. The average angle of repose was obtained as 57.74°, with a standard deviation of 5.412°, a coefficient of variation of 9.37%, and a 95% confidence interval of [54.85°, 60.62°] (t15 = 2.131). The relatively small dispersion of the repeated measurements indicates that the measured angle of repose is stable and representative.
Table 1.
Statistical table of experimentally measured angles of repose.
4. EDEM Parameter Calibration Experiment
4.1. Discrete Element Model Parameter Setting
Since the angle of repose is a dimensionless macroscopic property determined by inter-particle friction and cohesion rather than by the absolute size of the pile, the angle of repose measuring instrument was uniformly scaled down with a linear scale factor of 0.1 and imported into EDEM 2023.0 software for simulation [20,21], which substantially reduces the particle number and the computational cost while preserving the accumulation behavior of the full-scale instrument, as shown in Figure 5.
Figure 5.
Simulation experiment modeling diagram.
Considering the fine particle size (8–12 µm) and the near-spherical morphology of Ganoderma lucidum spores, the particles were represented by single-sphere equivalent models with the measured size range of 8–12 µm, which is consistent with the common practice in DEM calibration of fine powders. Various parameters or parameter ranges of spore powder and stainless steel were determined through the GMEE database and various research materials. Among them, the shear modulus of spore powder [22], the true density of spore powder, and various parameters of stainless steel are known, while other parameters are to be calibrated through experiments, as shown in Table 2.
Table 2.
Range of experimental parameters.
4.2. Plackett–Burman Experiment and Significance Analysis
Taking the angle of repose as the response value, a Plackett–Burman experiment was conducted on the influence of factors A–H to determine the significant parameters. Virtual parameters J and K were added to evaluate the error, as shown in Table 3.
Table 3.
Plackett–Burman experiment parameter level division table.
Design-Expert 13.0.5.0 software was used for experimental design, and the parameters assigned by the software for each input are shown in Table 4.
Table 4.
Experimental parameter design and angle of repose statistics.
Significance analysis was performed on the experimental data, as shown in Table 5.
Table 5.
Analysis of the significance of experimental parameters.
H-JKR surface energy of spore powder: p-value = 0.0003 < 0.001, extremely significant, with the largest sum of squares, is the core decisive factor with the greatest influence on the angle of repose; D—spore powder–spore powder rolling friction coefficient: p-value = 0.0266 < 0.05, significant, with a clear influence on the angle of repose; B—spore powder–spore powder collision recovery coefficient: p-value = 0.0367 < 0.05, significant, with a clear influence on the angle of repose.
4.3. Steepest Ascent Test and Optimal Interval Determination
Three factors, B, D, and H, were selected for the climbing experiment, while other factors took the central value. Since B—spore powder–spore powder collision recovery coefficient has a negative effect, and D and H have positive effects, according to the principle of consistent influence, factor B was combined from large to small, and factors D and H from small to large for simulation, as shown in Table 6.
Table 6.
Test parameters and relative error statistics for the steepest slope test.
A secondary climbing experiment was designed as shown in Table 7. To approach the optimal interval as quickly as possible, the step size was set as large as possible.
Table 7.
Test parameters and relative error statistics for the second climbing test.
It can be seen from the table that the relative error first decreases and then increases from experiment No. 1 to experiment No. 3, and the optimal interval lies between the parameters set by experiment No. 1 and experiment No. 3.
4.4. Box–Behnken Experiment
Experiment No. 2 was selected as the central level, and a Box–Behnken experiment was conducted within the parameter ranges of experiments No. 1 and No. 3, as shown in Table 8, to determine the second-order regression equation of significant parameters and angle of repose.
Table 8.
Box–Behnken experiment angle of repose statistics.
The Box–Behnken experimental results were fitted with a standard quadratic response surface model, and the analysis of variance (ANOVA) is shown in Table 9.
Table 9.
ANOVA of the standard quadratic response surface model.
For the standard quadratic model, the model p-value = 0.0004 < 0.05, indicating that the overall model is highly significant, and the lack-of-fit p-value = 0.0872 > 0.05, indicating that the lack of fit is not significant and the model is adequate. Among the linear terms, H (JKR surface energy, p < 0.0001) and D (rolling friction coefficient, p = 0.0011) are highly significant, whereas B (collision recovery coefficient) is not significant (p > 0.05). All interaction terms (B × D, p = 0.3885; B × H, p = 0.6150; D × H, p = 0.3171) and all quadratic terms (B2, p = 0.6504; D2, p = 0.1168; H2, p = 0.7507) are non-significant (p > 0.05).
H (JKR surface energy) is the most influential factor: the higher the JKR surface energy, the stronger the van der Waals adhesion between particles and the larger the angle of repose. D (rolling friction coefficient) is the second most significant factor: the larger the rolling friction coefficient, the easier the particles accumulate on the slope and the larger the angle of repose. B (collision recovery coefficient) and all interaction and quadratic terms have no significant influence on the angle of repose.
Since all interaction terms and quadratic terms are non-significant in the full quadratic model, they were removed, and a simplified linear regression model containing only the significant factors D and H was established; the ANOVA of the simplified model is shown in Table 10.
Table 10.
ANOVA of the simplified regression model.
For the simplified linear model, the model F-value = 76.69 with p < 0.0001, indicating that the model is highly significant. The coefficient of determination R2 = 0.9163 and the predicted R2 = 0.8745 (PRESS = 25.78), indicating good fitting and prediction capability. The lack-of-fit p-value = 0.1178 > 0.05, indicating that the lack of fit is not significant and the simplified model adequately describes the variation in the angle of repose. The pure error sum of squares is only 1.75, showing that the random error of the repeated simulation experiments is extremely low and the repeatability of the original data is good.
In the simplified model, both retained factors show significant positive effects on the angle of repose. The final regression equation in terms of coded factors is α = 58.09 + 1.99D + 4.42H, where D and H are the coded values of the rolling friction coefficient and the JKR surface energy, respectively. A one-unit increase in the coded D increases the angle of repose by about 1.99°, and a one-unit increase in the coded H increases it by about 4.42°, indicating that the JKR surface energy has a stronger influence, which is consistent with the ANOVA results.
4.5. Factor Effect Analysis Based on the Simplified Regression Model
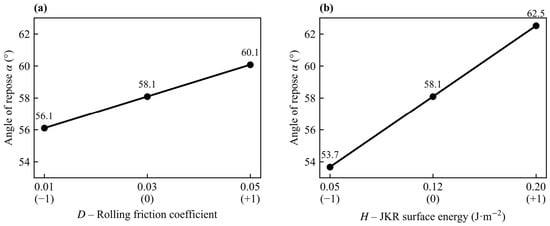
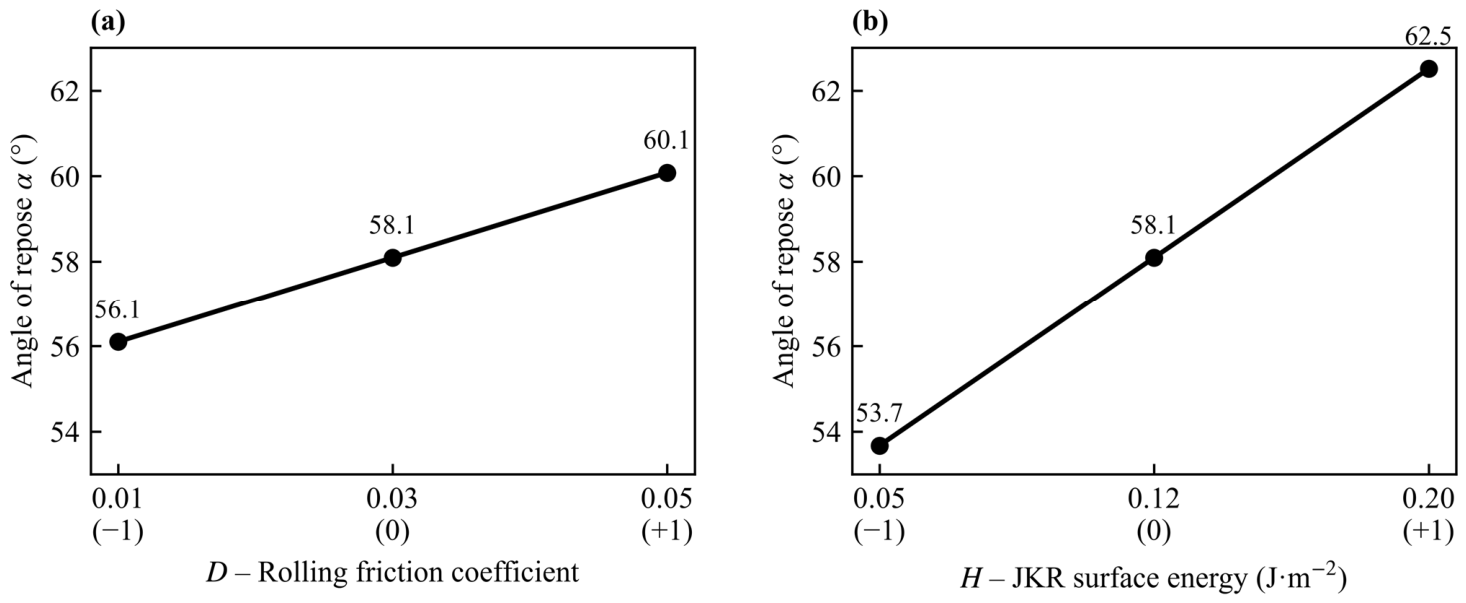
Since all interaction terms were non-significant in the full quadratic model (p > 0.05), the interaction response surfaces are not presented. Instead, the main effects of the two significant factors (D and H) on the angle of repose are analyzed, as shown in Figure 6.
Figure 6.
Main effects of the rolling friction coefficient and the JKR surface energy on the angle of repose based on the simplified linear model. (a) rolling friction coefficient D; (b) JKR surface energy H.
As shown in Figure 6, the angle of repose increases monotonically with both the rolling friction coefficient and the JKR surface energy. The slope along the JKR surface energy axis is steeper, indicating that the JKR surface energy has a stronger effect on the angle of repose, which is consistent with the ANOVA results. The collision recovery coefficient has no significant influence on the angle of repose.
Since no interaction terms are retained in the simplified model, the two significant factors act on the angle of repose independently (additively) within the investigated range, without obvious synergistic or antagonistic coupling effects.
4.6. Optimal Parameter Determination and Verification
The final angle of repose equation in terms of coded factors is given by the software as Equation (1):
α = 58.09 + 1.99D + 4.42H
Because the simplified model is linear, the parameter combinations satisfying the target angle of repose are not unique but distributed along a contour line of the model; therefore, the parameter set cannot be uniquely determined from the regression model alone. To resolve this non-uniqueness issue, the final parameters were determined by the EDEM simulation verification: within the optimal interval, the parameter combination of B (collision recovery coefficient) = 0.3930, D (rolling friction coefficient) = 0.02564, and H (JKR surface energy) = 0.1003 J/m2 gave the smallest relative error among all candidate combinations. The EDEM simulation experiment results based on the above parameters are as follows.
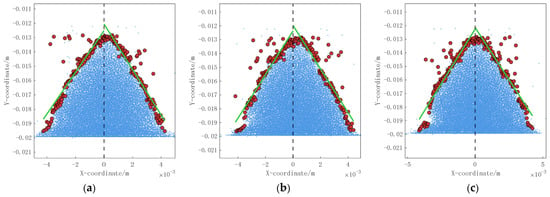
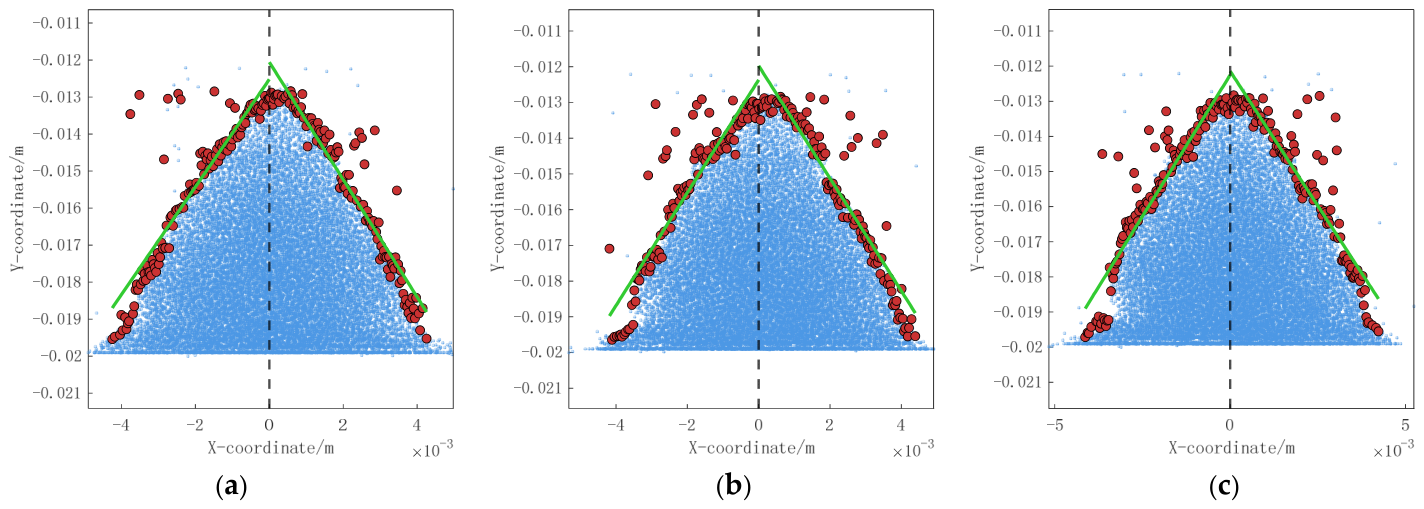
Three sections with azimuth angles of 0 degrees, 60 degrees, and 120 degrees were selected to fit the angle of repose, and the average value was 57.25 degrees, as shown in Figure 7. The relative error with the measured average value of 57.74 degrees is only 0.85%, and the simulation can better conform to the actual accumulation situation.
Figure 7.
Angle of repose multi-plane fitting verification diagram. Blue particles: main pile; red particles: scattered edge particles; green lines: fitted pile contour for the angle of repose. (a) 0°; (b) 60°; (c) 120° azimuth sections.
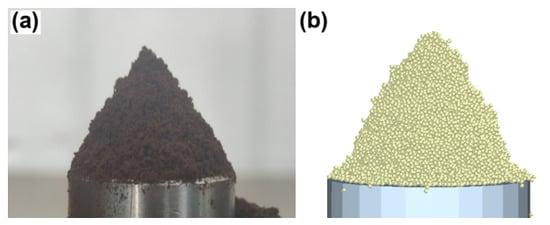
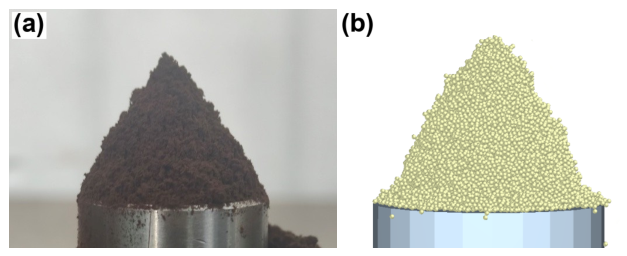
The comparison of experimental and simulation results is shown in Figure 8.
Figure 8.
Comparison of actual and simulated experimental pile angles. (a) experimental pile; (b) simulated pile.
5. Gas Collection Hood Flow-Field Coupling Simulation and Structure Optimization
5.1. Theoretical Formulas
This paper adopts the Euler–Lagrange two-way coupling method to simulate the gas–solid two-phase flow in the spore powder collection process.
The continuity equation is as follows.
where ρ—gas phase density; t—time; u, v, w—velocity components of the gas phase in the x, y, z directions. Since the gas Mach number is much less than 1, the compressibility effect can be neglected, and the flow is regarded as incompressible.
The momentum conservation equation is as follows.
where p—gas-phase static pressure; τij—viscous stress tensor; SMi—momentum source term of particles to the gas phase, reflecting the reaction of the discrete phase to the continuous phase.
The critical suspension velocity of particles refers to the minimum airflow velocity at which particles overcome gravity and air resistance and remain suspended in the flow field. According to Stokes law, this velocity is related to particle diameter, density, and gas viscosity, as follows.
where ρ0—density of Ganoderma lucidum spore powder, dp—particle diameter, g—gravitational acceleration, μ—aerodynamic viscosity, Cc—Cunningham correction coefficient. Substituting the data of Ganoderma lucidum spore powder, the critical suspension velocity is about 0.0036 m/s, indicating that an airflow velocity greater than 0.0036 m/s can suspend and transport spore powder. Therefore, more attention needs to be paid to the effective suction range of the gas collection hood.
5.2. Simulation Model and Boundary Condition Setting
5.2.1. Simulation Model
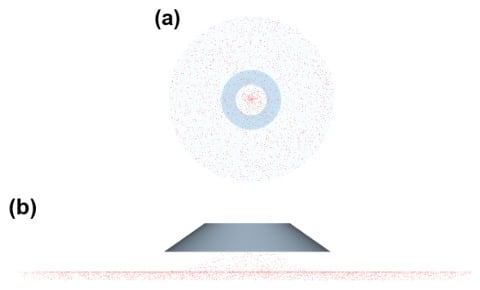
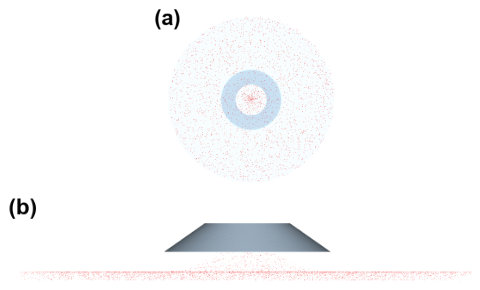
This paper takes the top-suction gas collection hood as the research object to study the distribution and optimization direction of the flow field inside and outside the gas collection hood during the collection of Ganoderma lucidum spore powder. The core geometric parameters of the gas collection hood are fixed as follows: top outlet radius 75 mm, side wall thickness 2 mm, which is much smaller than the characteristic size of the flow channel, and its influence on the flow can be neglected. The total size of the calculation domain is set to 800 mm × 800 mm × 100 mm, and the gas collection hood is located at the top center of the calculation domain. The specific structure of the gas collection hood and the schematic diagrams of particle motion and trajectories are shown in Figure 9 and Figure 10.
Figure 9.
Schematic of particle collection inside and outside the gas hood. (a) top view; (b) side view.
Figure 10.
Particle trajectories inside and outside the gas hood: the trajectories are colored by particle velocity, with blue denoting low velocity and red denoting high velocity.
5.2.2. Detailed Setting of Boundary Conditions
The inlet is set as a pressure inlet boundary with gauge pressure 0 Pa (atmospheric pressure) and turbulence intensity of 5%. The outlet is set at the top outlet of the gas collection hood as a pressure outlet boundary with a gauge pressure of −500 Pa and a backflow turbulence intensity of 5%. The −500 Pa suction pressure and the fixed mass flow rate of 0.264 kg/s correspond to the design operating point of the centrifugal fan of the collection system: −500 Pa is the fan suction pressure at the design air volume, and 0.264 kg/s is the design mass flow rate that ensures the average velocity at the hood opening is well above the critical suspension velocity (0.0036 m/s). In the simulation, the pressure outlet boundary was imposed at the outlet plane, and the simulated outlet mass flow rate was checked against the design value of 0.264 kg/s to confirm consistency with the fan operating condition. The bottom table surface of the computational domain and all walls of the gas collection hood were set as no-slip wall boundaries.
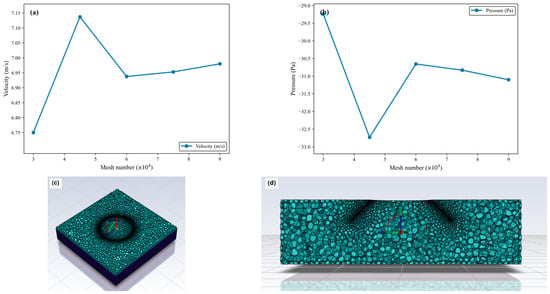
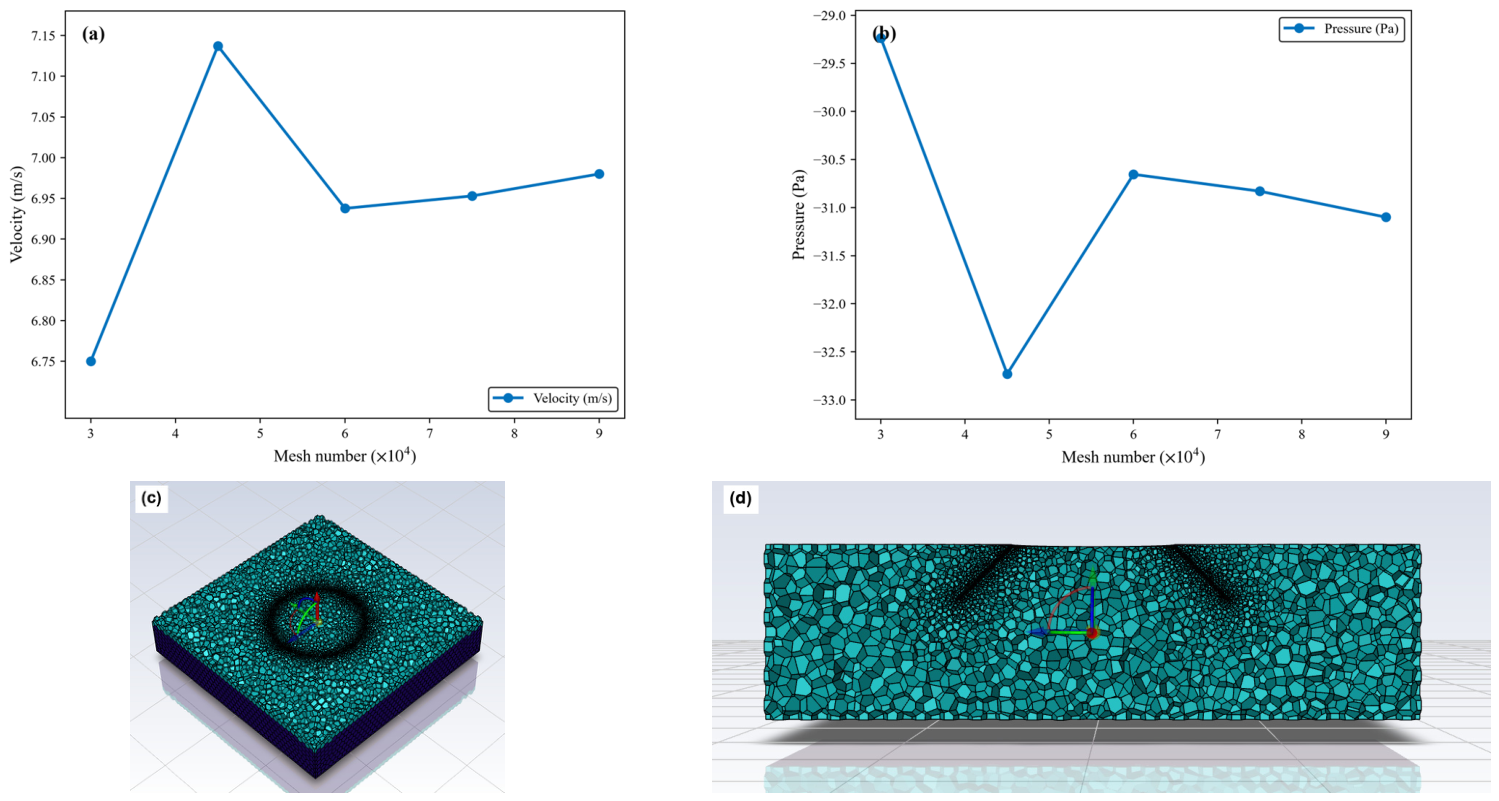
The accuracy of CFD numerical simulation is closely related to the mesh density, whereas the consumption of computational resources increases exponentially with it. Therefore, a mesh independence check was carried out before the flow-field calculation to ensure that the simulation results were not affected by the mesh number and density. As shown in Figure 11, five unstructured mesh models with mesh numbers ranging from 30,000 to 90,000 were established. Under identical boundary conditions and physical parameters, the wind velocity and static pressure at a fixed location in the flow field were calculated for each mesh. After comparing the stability of the results, the optimal mesh scheme was determined to be 60,000 cells. The slight rise in wind velocity at 45,000 cells, accompanied by a simultaneous dip in static pressure, is attributed to the monitoring point located in the inlet convergence section of the hood mouth, where the velocity and pressure gradients are large, and the local values are sensitive to the local mesh density. Beyond 60,000 cells, the adjacent variations in the wind velocity and static pressure were within 0.4% and 0.9%, respectively, indicating that the results were mesh-independent.
Figure 11.
Grid independence analysis: (a) wind velocity at the monitoring location versus mesh number; (b) static pressure versus mesh number; (c) mesh of the gas collection hood region; (d) mesh of the computational domain.
The time step is another key factor affecting the accuracy of transient CFD calculations. To eliminate its influence on the numerical results, transient calculations were carried out on the basis of the selected 60,000-element mesh with time steps of 5 × 10⁻⁵, 1 × 10⁻⁴, 1.5 × 10⁻⁴, and 2 × 10⁻⁴ s, respectively, with all other settings unchanged. The wind velocity and static pressure at the fixed monitoring point at the center of the hood inlet convergence section were extracted, and their time-averaged values over the whole simulation period (0–0.5 s) are listed in Table 11.
Table 11.
Monitoring results under different time steps.
As shown in Table 11, when the time step was halved from 1 × 10⁻⁴ to 5 × 10⁻⁵ s, the variations in the monitored wind velocity and static pressure were 2.5% and 0.2%, respectively, indicating that the results were essentially independent of the time step. In contrast, when the time step was enlarged to 1.5 × 10⁻⁴ and 2 × 10⁻⁴ s, the static pressure deviations reached 15.4% and 14.4%, respectively, indicating that excessive time steps introduce non-negligible temporal discretization errors. Considering both computational accuracy and cost, a time step of 1 × 10⁻⁴ s was adopted for all subsequent simulations.
The DEM time step is set to 30% of the Rayleigh time step. The basic data of Ganoderma lucidum spore powder particles are obtained from the calibration experiment above. A particle injection surface with a radius of 400 mm is set at 35 mm below the hood opening of the gas collection hood, with an initial velocity of 0.1 m/s. This injection method can simulate the ejection state of spore powder after detachment from the gills.
5.3. Study on the Influence of Gas Collection Hood Inclination Angle on Collection Efficiency
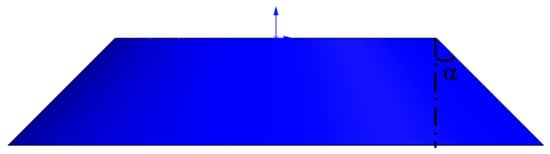
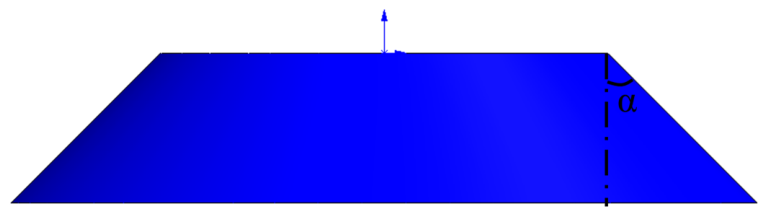
First, gas collection hood models with different inclination angles alpha were established, as shown in Figure 12, to analyze their effect on flow-field distribution and spore powder collection efficiency. EDEM software was used to export particle-related data for analysis. Based on the four divided characteristic regions (spore production area, midstream area, hood mouth area, outlet area) as shown in Figure 13, the particle average velocity curves were analyzed. The center of the spore production area is the particle generation surface, the center of the hood mouth area is the hood mouth plane of the gas collection hood, the center of the midstream area is the plane equidistant from the particle generation surface and the hood mouth plane, and the center of the outlet area is the outlet plane of the gas collection hood. The length and width of the four regions cover the entire calculation area, and the height is taken as 5 mm to obtain an effective number of particles.
Figure 12.
Schematic of the inclined hood with angle alpha.
Figure 13.
Schematic of the characteristic area of the gas collection hood.
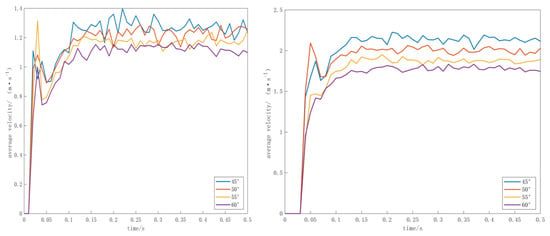
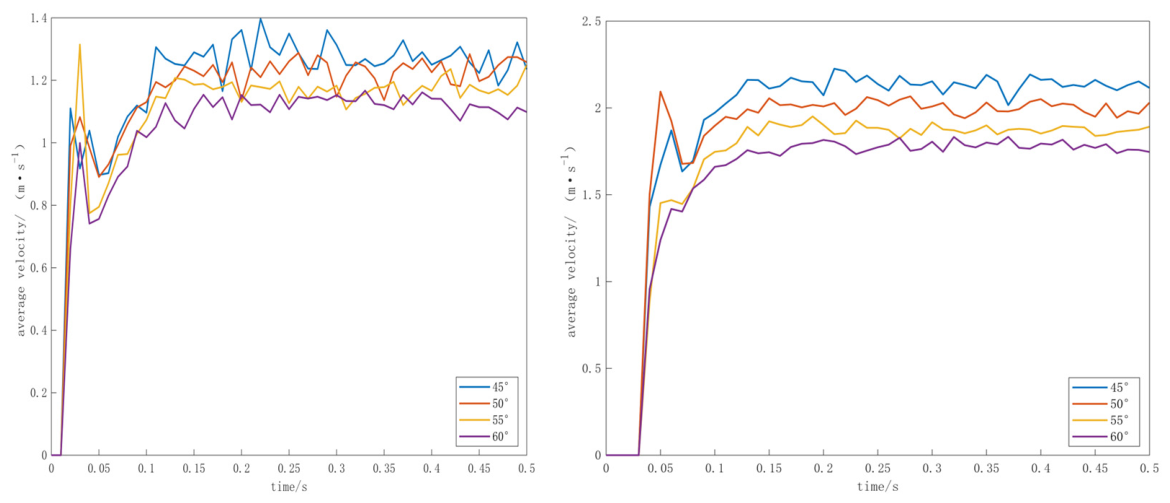
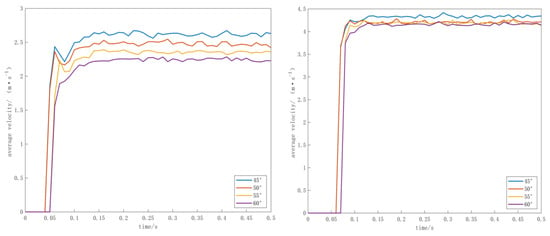
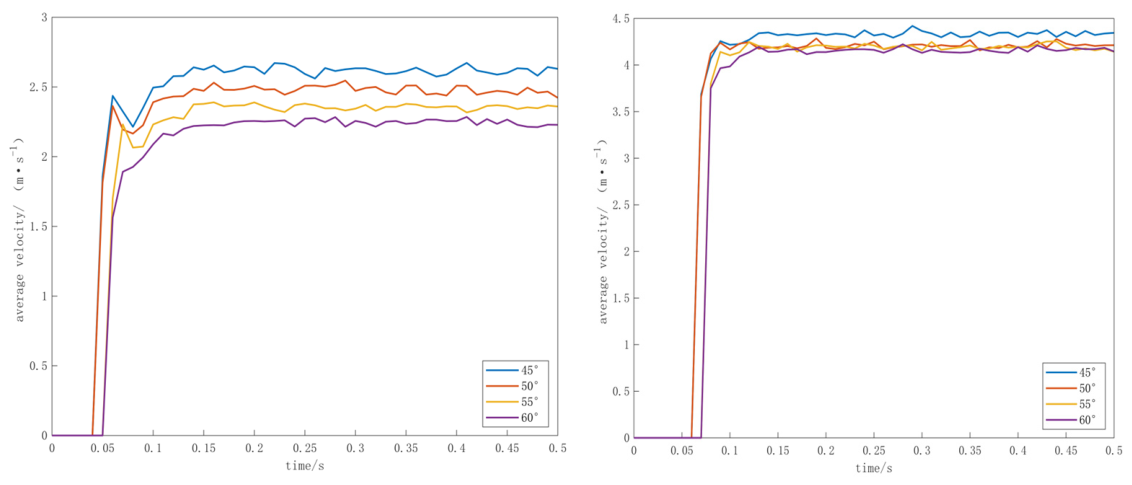
As shown in Figure 14 and Figure 15, the particle velocity curves in the gas collection hood area of all schemes present the characteristics of stationary, rising, and fluctuating. Stationary stage: The fan starts to operate, and the particles have not reached every area shown in Figure 13, with a velocity of 0. Impact rising stage: The particles reach each area, and the average velocity of particles rises rapidly, forming an obvious peak, then falls back. Steady fluctuation stage: The flow field is established, and the particle velocity stabilizes near the mean value with small fluctuations.
Figure 14.
Particle time-velocity diagram in the spore production and midstream areas.
Figure 15.
Particle time-velocity diagram for the shroud and outlet areas.
As shown in Figure 14, the spore production area is the core functional area, and the particle velocity determines whether the spores can be lifted. The velocity of spores in this area needs to be greater than the critical suspension velocity of 0.0036 m/s, which meets the requirements. Due to the minimal inertia of spores, the effect of this transient impact on the collection effect can be neglected. Steady-state velocity: 45 degrees stabilizes at 1.28 m/s, 50 degrees at 1.23 m/s, 55 degrees at 1.17 m/s, 60 degrees at 1.12 m/s. It can be seen that all 4 schemes can produce effective adsorption on suspended spores.
The midstream area is the transition area where spores are transported from the spore production area to the hood mouth area, requiring smooth airflow to avoid local accumulation of spores. It can be seen from the figure that the start-up times of the four inclination angles are basically consistent (approximately 0.05 s), with no obvious delay. The midstream area continues the velocity gradient and inclination angle law of the spore production area. Steady-state average velocity: 45 degrees is 2.14 m/s, 50 degrees is 2.01 m/s, 55 degrees is 1.88 m/s, and 60 degrees is 1.78 m/s.
As shown in Figure 15, the hood mouth area is the inlet convergence section of the gas collection hood, and its velocity determines the ability to gather spores in the edge area. The inclination angle affects the start-up time of particle collection: 45-degree and 50-degree inclination angles show obvious velocity signals at 0.05 s, while 55-degree and 60-degree inclination angles have a 0.01 s delay. This is due to the transient difference caused by the longer airflow path of the high-inclination gas collection hood, which has no significant effect on steady-state collection. Steady-state average velocity: 45 degrees is 2.62 m/s, 50 degrees is 2.48 m/s, 55 degrees is 2.36 m/s, and 60 degrees is 2.25 m/s.
The outlet area is the final stage before entering the pipeline. The start-up times of the four inclination angles continue the 0.01 s delay from the hood mouth area. Steady-state average velocity: 45 degrees is 4.33 m/s, 50 degrees is 4.21 m/s, 55 degrees is 4.19 m/s, and 60 degrees is 4.16 m/s. The difference between groups is reduced compared to the first three areas, indicating that the transient velocity characteristics of the outlet area are minimally affected by the gas collection hood inclination angle.
Summary of particle motion characteristics: The overall velocity gradient presents the convergence acceleration characteristics of spore production area < midstream area < hood mouth area < outlet area, which is consistent with the acceleration characteristics of particle collection in the gas collection hood; and the steady-state average velocity of all areas satisfies the monotonic decreasing law of 45 degree > 50 degree > 55 degree > 60 degree. For every 5-degree increase in inclination angle, the average velocity of each area decreases by about 0.1–0.2 m/s. The influence of the gas collection hood inclination angle on particle motion velocity is mainly reflected in the spore production area and midstream area, and the closer to the outlet, the smaller the influence of the inclination angle.
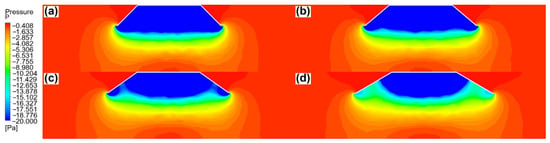
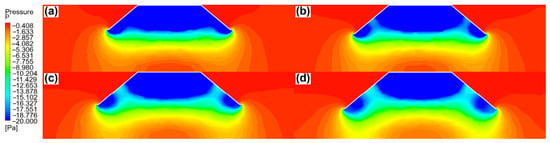
Figure 16 shows the vertical section pressure cloud maps of gas collection hoods with four inclination angles of 45 degrees, 50 degrees, 55 degrees, and 60 degrees. In all working conditions, the negative pressure gradually decreases from the hood opening outward to atmospheric pressure. As the inclination angle of the gas collection hood increases from 45 degrees to 60 degrees, the internal pressure field shows a gradual decrease in uniformity. The negative pressure distribution inside the hood of the 45-degree and 50-degree inclination gas collection hoods is uniform, without local low-pressure dead corners. When the inclination angle increases to 55 degrees, the overall negative pressure influence range shrinks. The high negative pressure area of the 60-degree inclination gas collection hood further contracts, and the hood mouth area completely degenerates into a medium negative pressure area.
Figure 16.
Pressure cloud maps of the gas collection hood at different tilt angles: (a) 45°; (b) 50°; (c) 55°; (d) 60°.
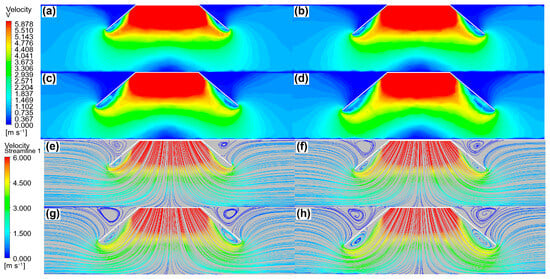
As shown in Figure 17, the airflow velocity inside the gas collection hood decreases gradually from the hood opening outward, and the high-speed area roughly coincides with the low-pressure area, consistent with Bernoulli’s principle. The hood opening wind speeds of 45-degree and 50-degree inclination angles are similar, and the velocity uniformity is better than the other two groups; among them, the 50-degree inclination angle has a larger opening range and a slightly wider horizontal effective action range. At a 55-degree inclination angle, the velocity uniformity begins to decrease, the velocity at the corners decreases, and small low-speed areas appear; the streamlines bend slightly at the hood opening but do not form obvious vortices. At a 60-degree inclination angle, the velocity non-uniformity is significantly intensified, the high-speed area obviously contracts, and the medium-speed area does not extend significantly downward.
Figure 17.
Velocity cloud maps and streamlines of gas collection hoods at different tilt angles: (a–d) velocity cloud maps at 45°, 50°, 55°, and 60°; (e–h) corresponding streamlines.
The vertical plane velocity streamlines show that the streamline patterns of 45–60 degree inclination angles are basically consistent: the airflow deflects downward at the edge of the gas collection hood and converges into the hood from all sides; there is a small vortex at the hood opening, but the influence is limited, and the main flow field still maintains good continuity.
Based on the analysis of the velocity field, pressure field, and particle motion field, the 50° inclination angle achieves the best compromise among flow-field uniformity, negative-pressure action range, and vortex suppression within the investigated range: its flow-field uniformity is comparable to that of the 45° case, while its effective action range is wider, and no strong local low-pressure region or large recirculation zone is formed inside the hood. The collection performance was verified by the particle-level tracking. Therefore, the 50° inclination angle was adopted for the subsequent optimization.
5.4. Study on the Influence of Gas Collection Hood Vertical Height on Collection Efficiency
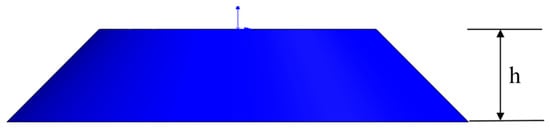
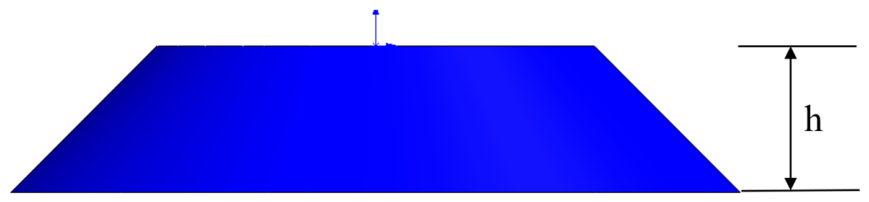
Keeping the optimal inclination angle of 50 degree unchanged, the vertical height h was changed to 60 mm, 70 mm, 80 mm, 90 mm, and other parameters were the same as in 4.2.2. The schematic diagram is shown in Figure 18.
Figure 18.
Schematic of the vertical height h gas collection hood.
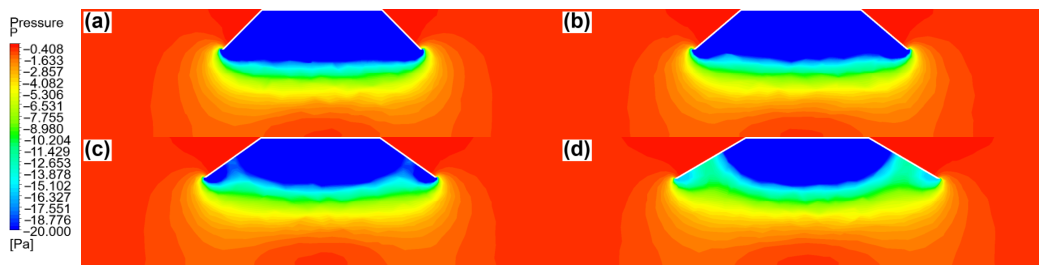
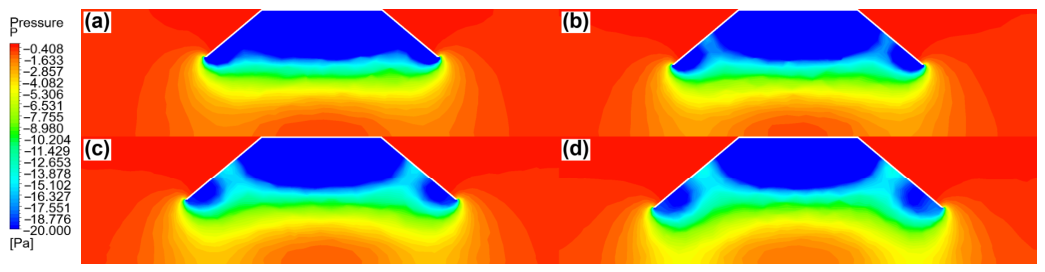
Under the optimal inclination angle of 50 degrees, the vertical section pressure cloud maps of gas collection hoods with vertical heights of 60 mm, 70 mm, 80 mm, and 90 mm are shown in Figure 19. As the vertical height increases, the shape of the blue strong negative pressure area inside the gas collection hood gradually evolves from a horizontal band to a downward convex arc, and the negative pressure uniformity gradually decreases, but the effective negative pressure action range in the vertical direction of the gas collection hood opening is significantly extended.
Figure 19.
Pressure cloud maps of the hood at different vertical heights: (a) 60 mm; (b) 70 mm; (c) 80 mm; (d) 90 mm.
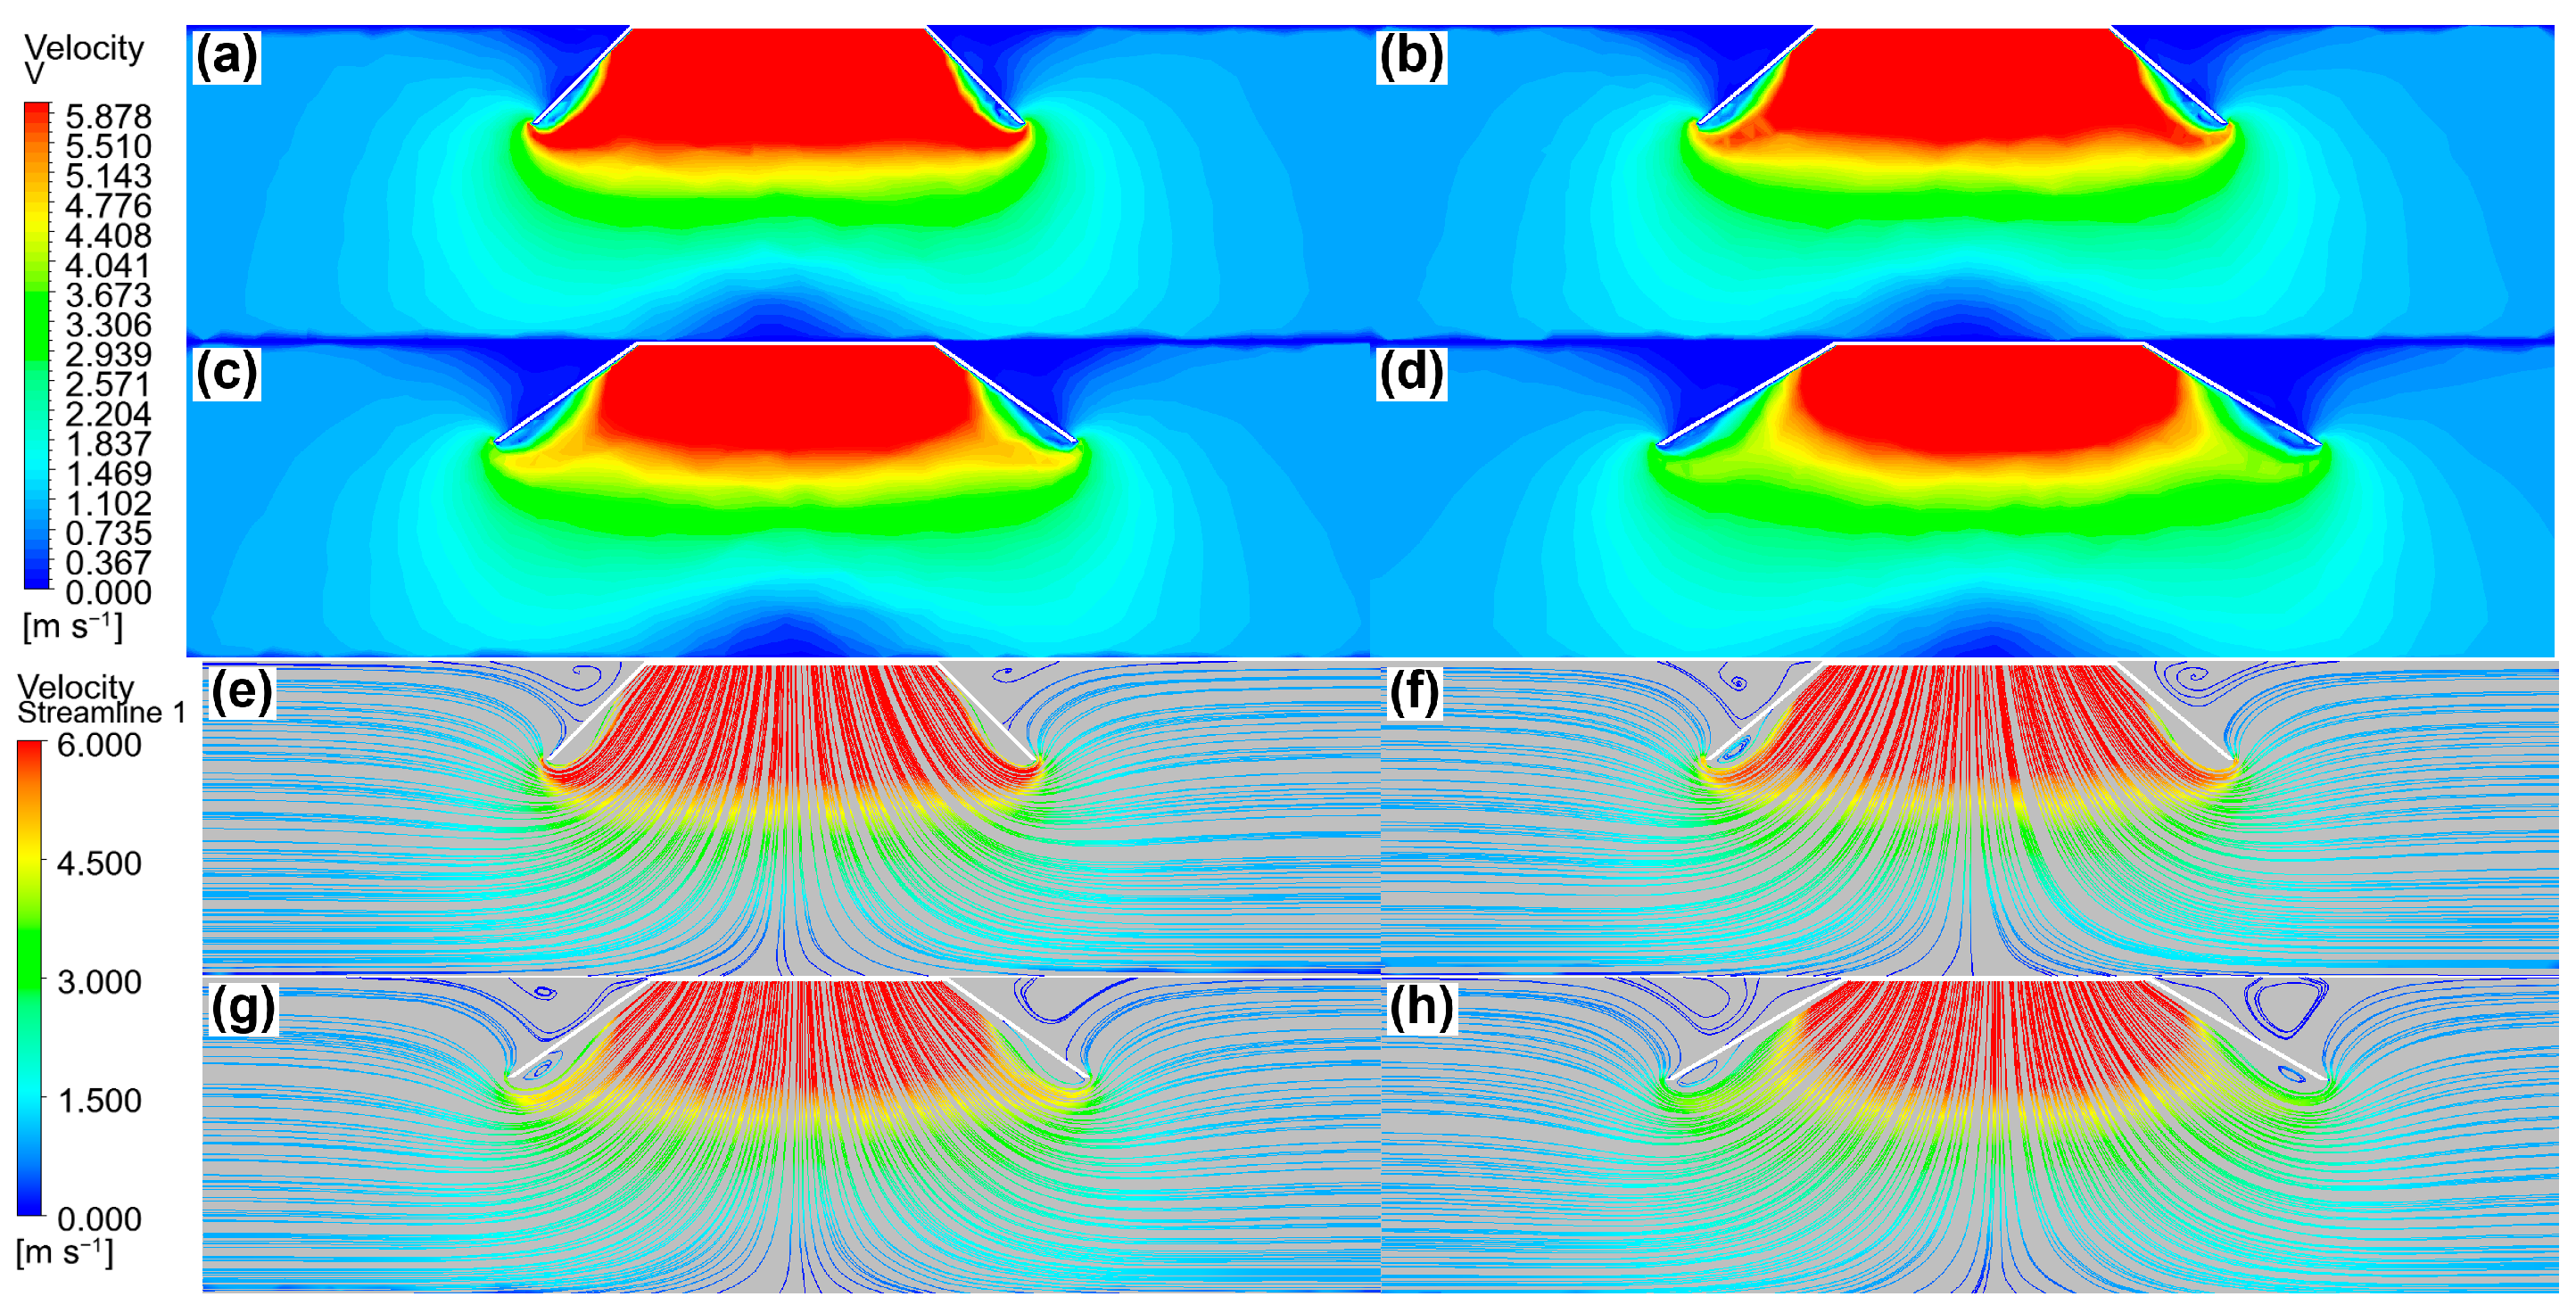
Under the optimal inclination angle of 50 degrees, the increase in vertical height reduces the negative pressure uniformity but significantly expands the action range. Within the vertical height range of 60 mm to 90 mm, the greater the vertical height, the larger the effective negative pressure action range; the negative pressure at the position of one-half of the inner wall surface from the hood opening gradually decreases, and the vortex trend increases. It is necessary to balance the flow-field uniformity and the effective action range to select an appropriate vertical height.
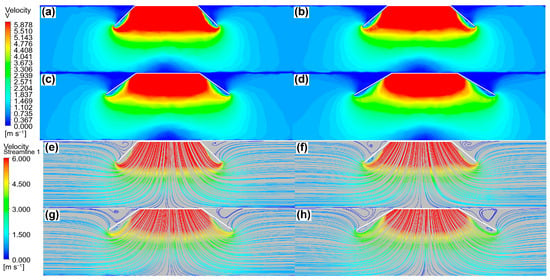
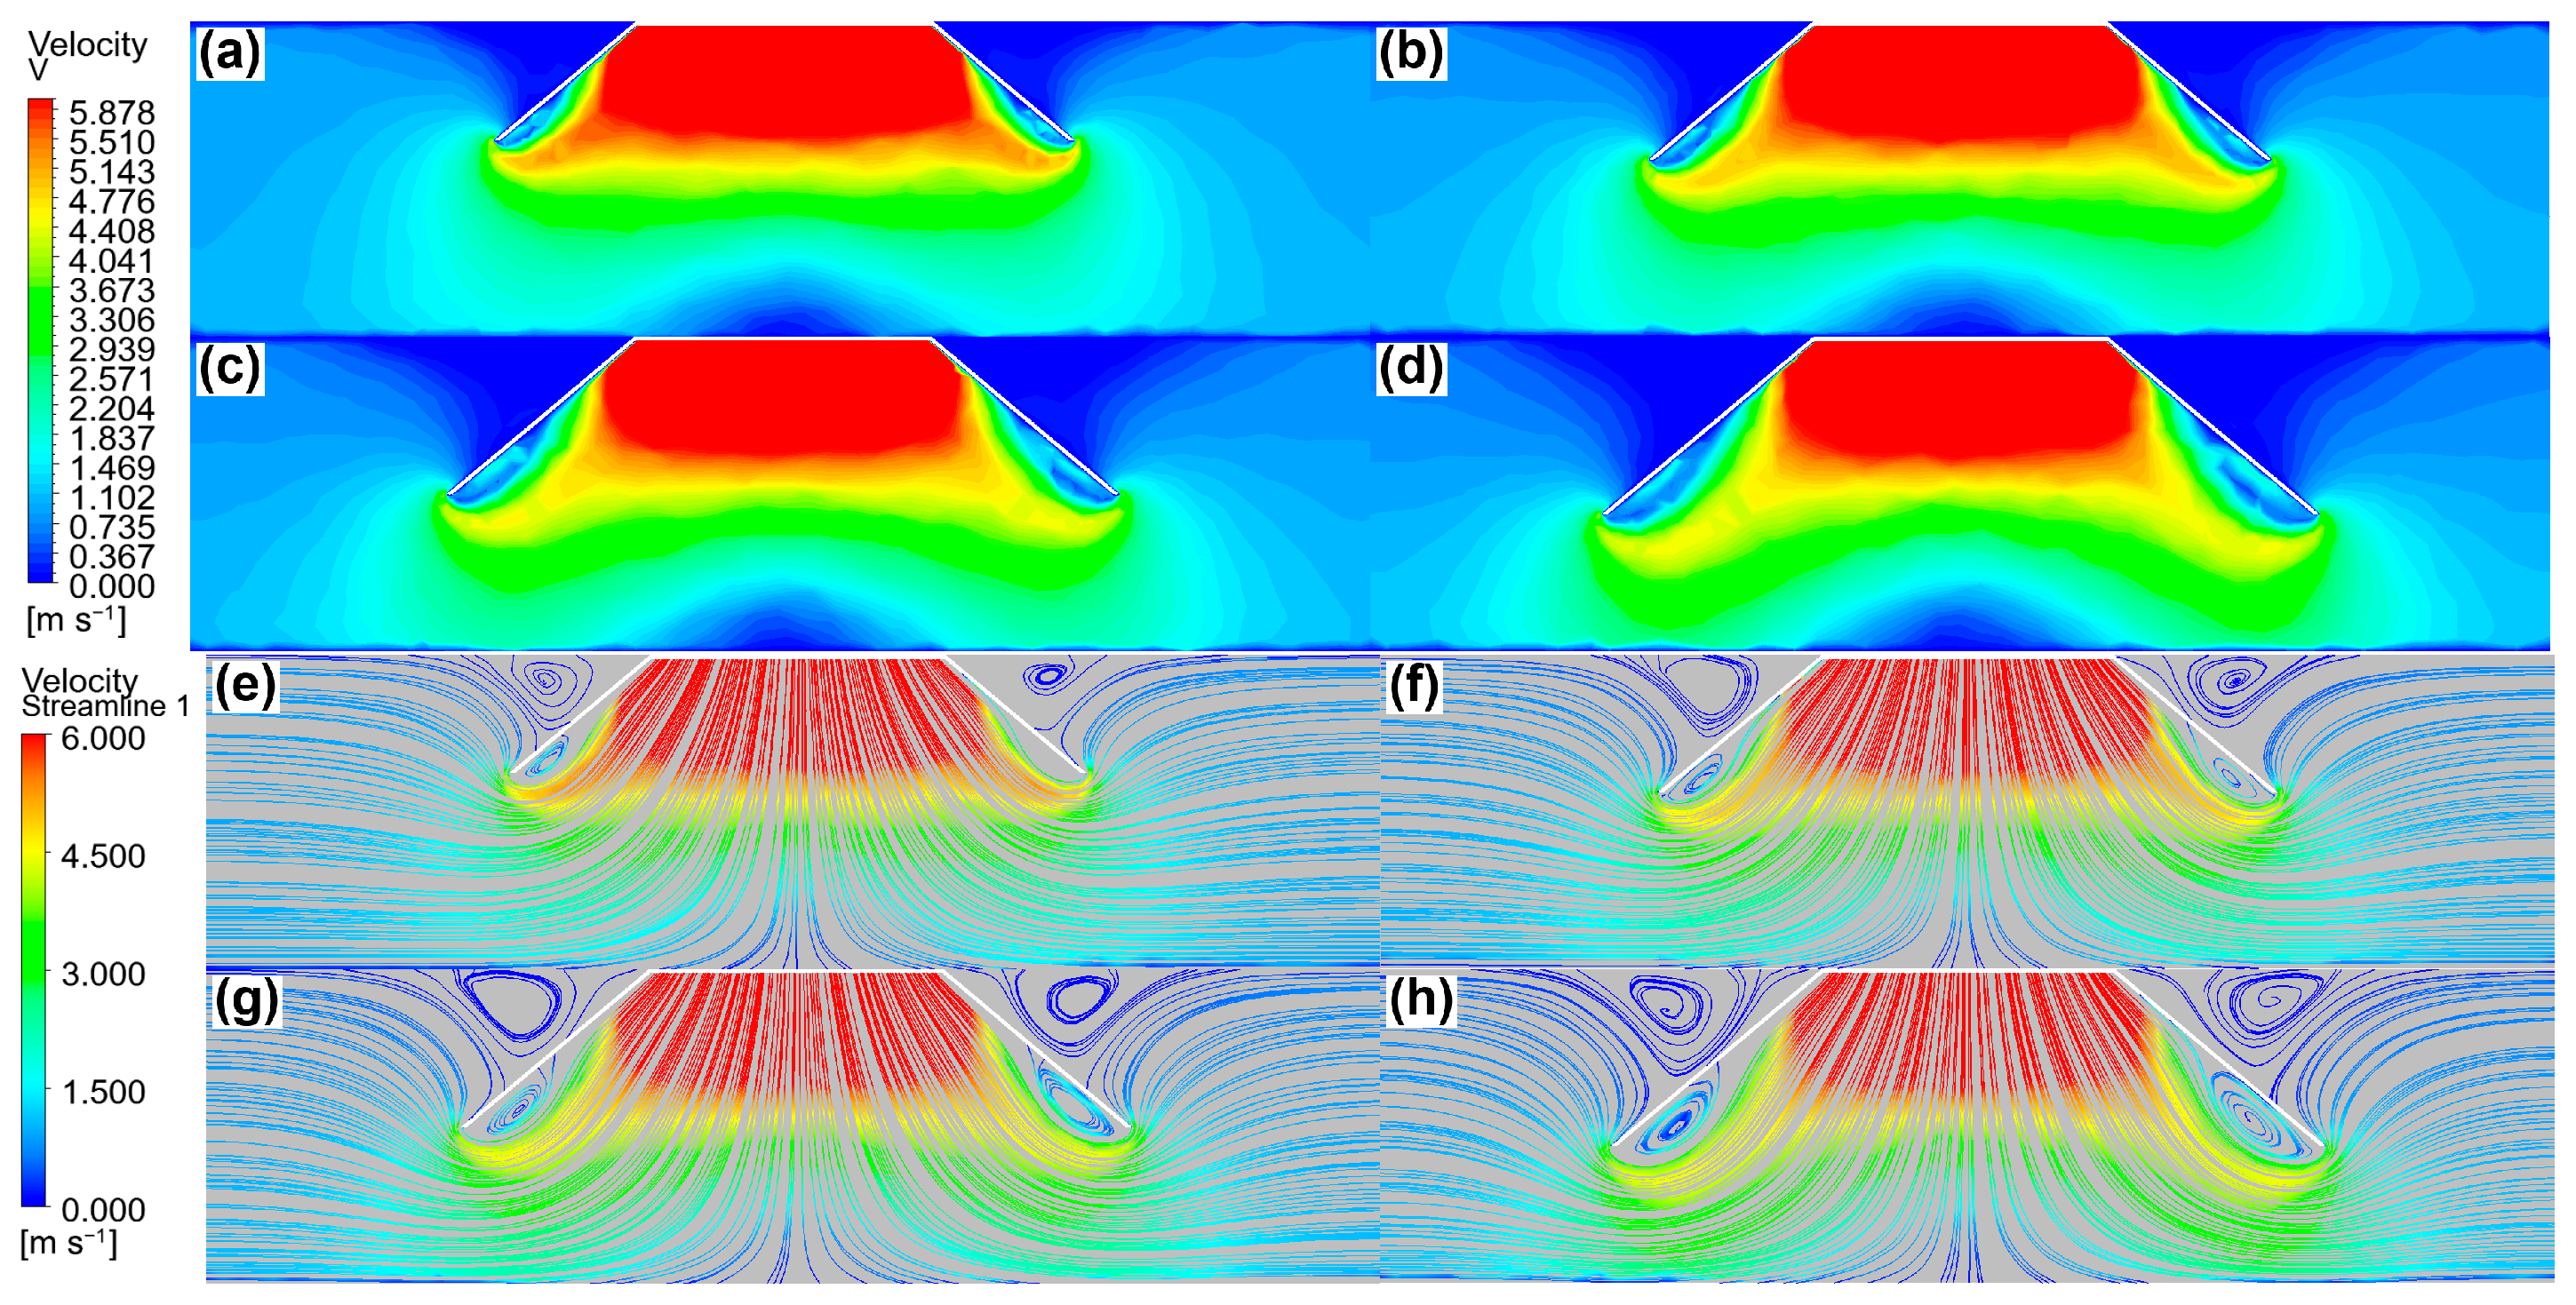
As shown in Figure 20, the influence of the vertical height of the gas collection hood on airflow velocity can be seen. The velocity pattern inside the hood is similar to that inside the gas collection hood in the previous section, and the airflow converges into the gas collection hood from all sides and gradually accelerates. As the vertical height increases, the vortex trend increases, the central high-speed area slightly contracts, but the range of the edge medium-speed area expands significantly, and the effective action range extends and expands.
Figure 20.
Velocity cloud maps and streamlines of the hood at different vertical heights: (a–d) velocity cloud maps at 60, 70, 80 and 90 mm; (e–h) corresponding streamlines.
Considering the effective action range and flow-field stability, the 90 mm vertical height provides the largest effective action range within the investigated range and remains at the collection-efficiency plateau (84.1%, Table 12; defined in Section 4.6), indicating good collection feasibility. Although the negative-pressure uniformity decreases with increasing height, the action range is given priority in this height-optimization step, and the uniformity loss is acceptable according to the contour maps (Figure 19). Therefore, the 90 mm vertical height was selected as the optimal height for the subsequent optimization, with the focus on improving capture capacity and reducing corner vortices.
Table 12.
Collection efficiency statistics of all tested configurations.
5.5. Study on the Influence of Gas Collection Hood Curved Opening Angle on Collection Efficiency
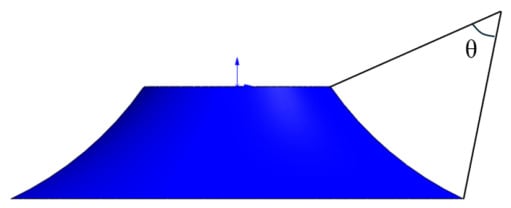
Based on the basic parameter combination of 50° side wall inclination angle and 90 mm vertical height, which showed the best performance within the investigated ranges in Section 4.3 and Section 4.4, further research was conducted on the influence of opening angles θ of 15°, 30°, 45°, 60° and 75° on the flow-field distribution law and Ganoderma lucidum spore powder collection performance when the gas collection hood opening shape was changed to a curved opening, as shown in Figure 21.
Figure 21.
Schematic of the gas collection hood with an arc-shaped opening angle theta.
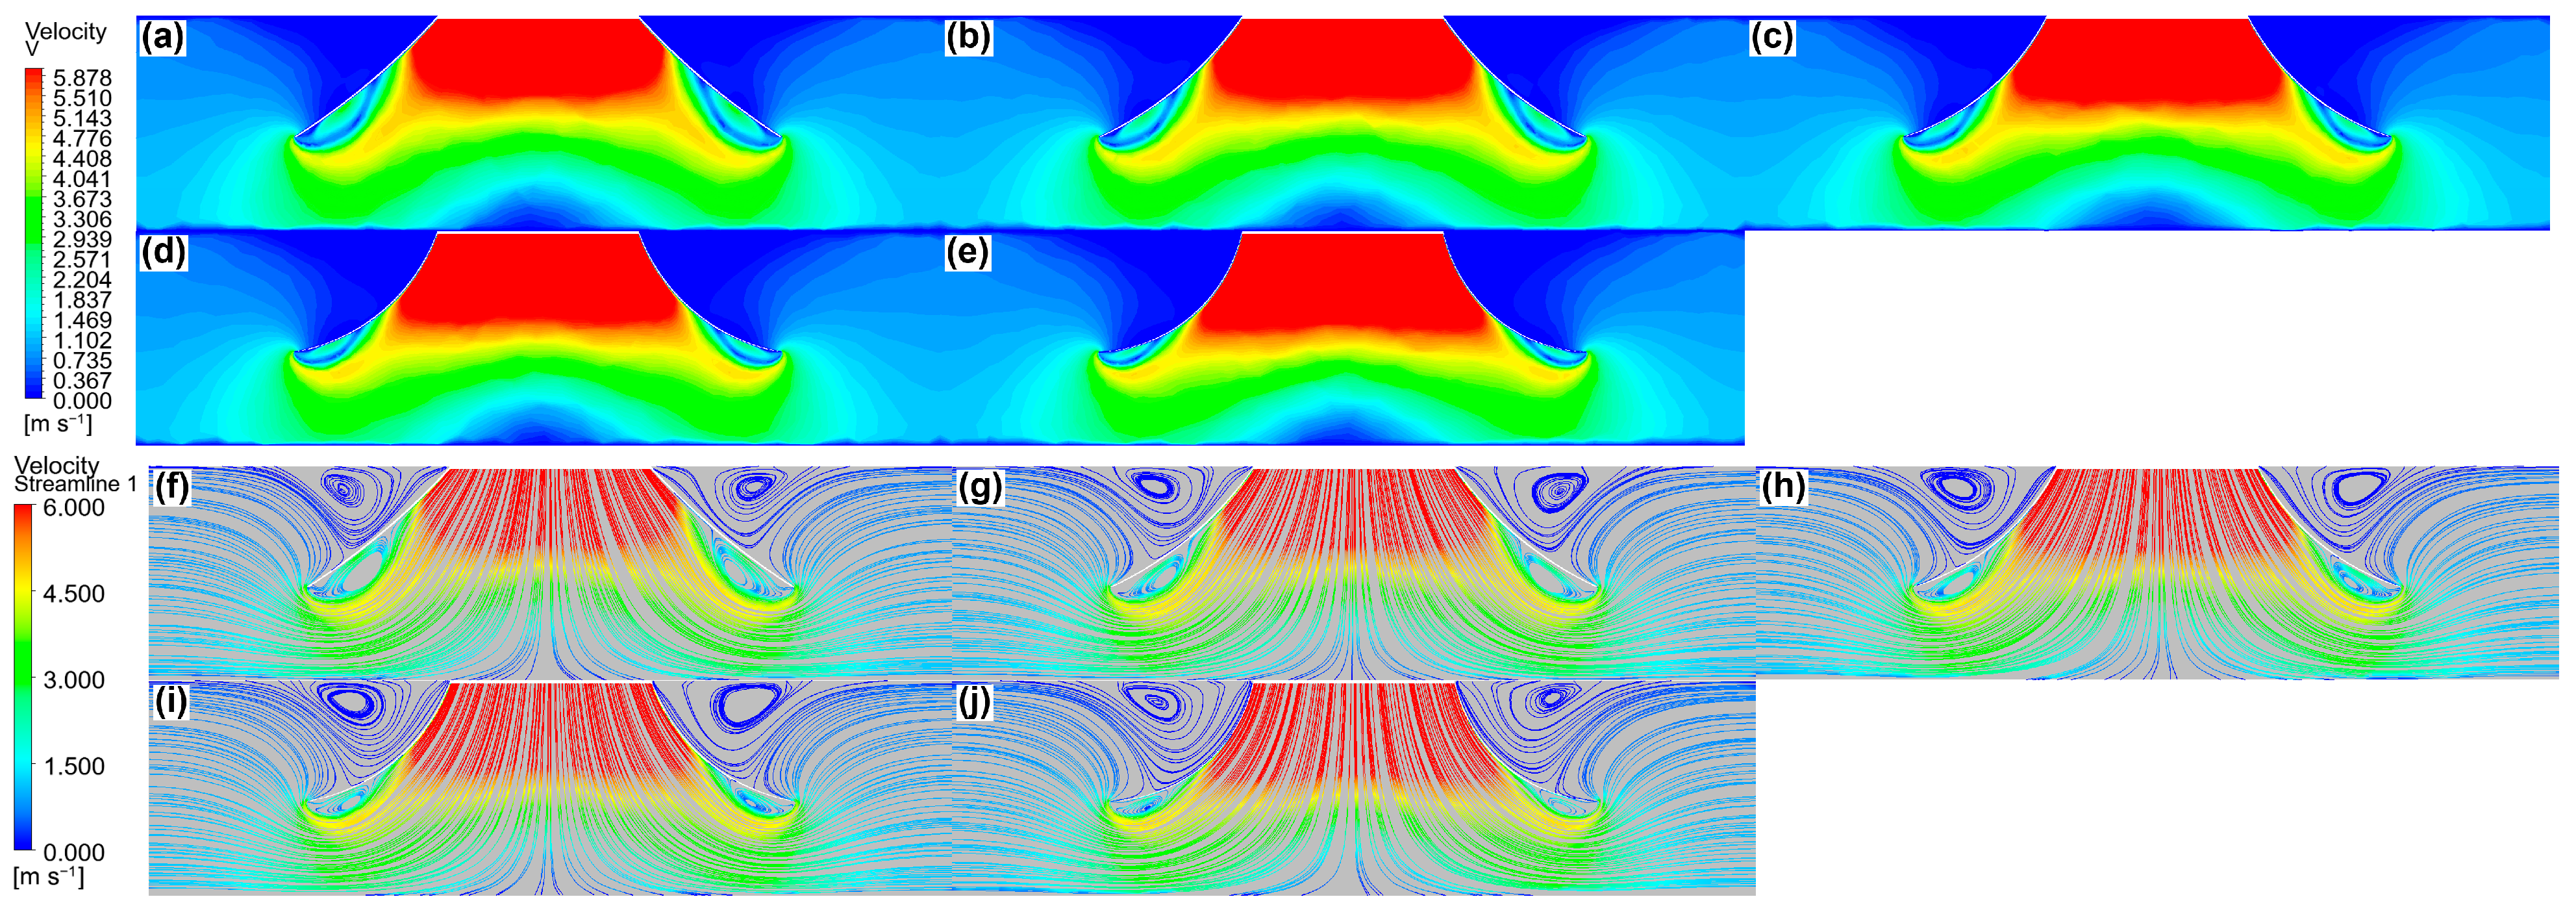
The flow-field maps in Figure 22 and Figure 23 show that as the curved opening angle increases, the two sides of the strong negative pressure area inside the gas collection hood extend downward, extending from curved edges to approximately straight edges. The block-shaped negative pressure area at the hood opening extends outward and continuously decreases. Under the 15-degree curved opening angle condition, a large-scale closed vortex is formed inside the hood opening, but compared with the traditional opening gas collection hood above, the corner vortex is slightly reduced. At a 30-degree curved opening angle, the streamline curvature is moderate, the closed vortex at the corners is effectively weakened, and the airflow transportation state can meet the collection needs of Ganoderma lucidum spore powder. As the curved opening angle continues to increase to 45 degrees and 60 degrees, the vortex area gradually decreases. At a 75-degree curved opening angle, the airflow streamlines transition smoothly along the curved wall surface, with the smallest vortex scale, but the vortex area extends downward and outward.
Figure 22.
Pressure cloud maps of the gas hood with different curved opening angles: (a) 15°; (b) 30°; (c) 45°; (d) 60°; (e) 75°.
Figure 23.
Velocity cloud maps and streamlines of the gas hood with different curved opening angles: (a–e) velocity cloud maps at 15°, 30°, 45°, 60°, and 75°; (f–j) corresponding streamlines.
As shown by the flow-field analysis (Figure 22 and Figure 23), the 15° curved opening forms a large-scale closed vortex inside the hood; the 30° opening effectively weakens the corner vortices with moderate streamline curvature and adequate airflow transport, and the 75° opening has the smallest vortex, but the vortex region extends downward and outward. The capture efficiencies ranged from 84.3% to 85.2% for all opening angles (Table 12), with differences of less than one percentage point among the configurations; the consistently high capture efficiencies across the investigated opening angles further confirm the collection feasibility of the device, consistent with the flow-field analysis.
Ultimately, within the investigated parameter space, the 30° curved opening angle achieves the best balance between vortex suppression and effective action range: compared with the 15° case, it effectively weakens the corner vortices, and compared with the 75° case, it retains a larger effective suction area without the downward/outward extension of the vortex region.
5.6. Verification of Collection Efficiency
To quantify the collection performance, the collection efficiency ηcoll is defined as the product of the capture efficiency ηcap and the transport collection efficiency ηtr: ηcoll = ηcap × ηtr. The capture efficiency is defined as the ratio of the number of particles entering the hood inlet plane, Nentry, to the number of particles injected within the unified statistical region, Ninj: ηcap = Nentry/Ninj × 100%. The transport collection efficiency is defined as ηtr = Ncollected/Nentry × 100%, where Ncollected is the number of particles reaching the outlet. Particle-level tracking of the EDEM data (HDF5) shows that ηtr = 100% for all tested configurations: every particle entering the hood is transported to the outlet without being blown out or retained inside, as verified by the mass closure between the injected particle count and the sum of the outlet particles captured by the sampling snapshots and those crossing the outlet plane between successive sampling instants. Since ηtr = 100%, the collection efficiency is numerically equal to the capture efficiency. Particles that do not enter the hood—whether remaining suspended in the flow field, adhering to the wall, or being carried out of the computational domain by the airflow—are not counted as collected. The collection efficiency serves to verify the collection feasibility of the device, whereas the structural comparison is primarily based on the flow-field characteristics (flow-field uniformity, effective action range, and vortex morphology), as evaluated in Section 4.3, Section 4.4 and Section 4.5. Unless otherwise stated, the collection efficiencies reported in Section 4.3, Section 4.4 and Section 4.5 refer to the capture efficiencies ηcap, which are summarized for all tested configurations in Table 12.
6. Conclusions
- (1)
- The JKR surface energy and the rolling friction coefficient significantly affect the angle of repose, whereas the collision recovery coefficient and the other factors have no significant influence; the simplified linear regression model (R2 = 0.9163) indicates that the two significant factors act on the angle of repose independently with positive effects. Based on the EDEM verification, the calibrated parameters were determined as: collision recovery coefficient = 0.3930, rolling friction coefficient = 0.02564, and JKR surface energy = 0.1003 J/m2. The simulated angle of repose was 57.25°, while the measured average of 16 repeated tests was 57.74° (standard deviation 5.412°, 95% confidence interval [54.85°, 60.62°]), giving a relative error of only 0.85%, which quantitatively demonstrates the accuracy of the calibration.
- (2)
- The simulation results show that changing the inclination angle, vertical height, and curved opening angle of the gas collection hood has a significant influence on the flow field inside and outside the hood. Within the inclination angle range of 45–60°, the effective action range first expands and then shrinks as the inclination angle increases; for every 5° increase in the inclination angle, the steady-state velocity of particles in each region decreases by about 0.1–0.2 m/s. Within the vertical height range of 60–90 mm, the greater the vertical height, the larger the effective action range and the stronger the vortex trend. Within the curved opening angle range of 15–75°, the larger the curved opening angle, the smoother the airflow transition and the more obvious the vortex suppression effect.
- (3)
- The side-wall inclination angle, vertical height, and curved opening angle influenced the hood flow field. Within the investigated ranges, 50°, 90 mm, and 30° were selected as the preferred configuration through a stepwise trade-off among flow-field uniformity, effective action range, and vortex suppression: 50° provided a wider effective range than 45° with comparable uniformity; 90 mm maximized the effective range with acceptable uniformity loss; and 30° best balanced vortex suppression and suction area compared with 15° and 75°. CFD-DEM simulations yielded collection efficiencies of 83.6–87.3% for the tested configurations.
Limitations and future work: Several limitations of this study should be acknowledged. First, the calibrated parameters are valid for Ganoderma lucidum spore powder with a particle size of 8–12 µm under dry conditions; extrapolation to spore batches with different particle size distributions, moisture contents, or storage states requires re-calibration. Second, the CFD-DEM simulations were performed under idealized boundary conditions (e.g., uniform particle injection from a plane and a constant fan operating point), whereas the actual spore-release process in a greenhouse is more complex and time-dependent. Third, the structural optimization of the gas collection hood was conducted by a sequential one-factor-at-a-time approach over discrete levels, and the resulting combination (50°, 90 mm, 30°) is a conditional optimum within the investigated ranges rather than a proven global optimum; a simultaneous multi-factor optimization is needed to verify global optimality. In future work, physical experiments will be conducted to validate the collection performance of the optimized gas collection hood, including the actual collection efficiency and energy consumption in a real greenhouse.
Author Contributions
Conceptualization, H.C.; methodology, G.Z. and P.W.; software, H.L. and P.W.; validation, H.L.; resources, K.W.; data curation, G.Z.; writing—original draft preparation, H.L.; writing—review and editing, K.W.; supervision, J.L.; project administration, J.L.; funding acquisition, J.L. All authors have read and agreed to the published version of the manuscript.
Funding
This research was funded by the Jilin Province Science and Technology Department, grant number 20240401090YY. The APC was funded by this project.
Institutional Review Board Statement
Not applicable.
Informed Consent Statement
Not applicable.
Data Availability Statement
The raw simulation data generated during this study are not publicly available due to large file size, but are available from the author upon reasonable request.
Conflicts of Interest
The authors declare no conflicts of interest. The funders had no role in the design of the study; in the collection, analyses, or interpretation of data; in the writing of the manuscript; or in the decision to publish the results.
References
- Shiao, M.-S. Natural products of the medicinal fungus Ganoderma lucidum: Occurrence, biological activities, and pharmacological functions. Chem. Rec. 2003, 3, 172–180. [Google Scholar] [CrossRef] [Scilit] [PubMed]
- Zhao, R.; Chen, Q.; He, Y.-M. The effect of Ganoderma lucidum extract on immunological function and identify its anti-tumor immunostimulatory activity based on the biological network. Sci. Rep. 2018, 8, 12680. [Google Scholar] [CrossRef] [Scilit] [PubMed]
- Cör Andrejč, D.; Knez, Ž.; Knez Marevci, M. Antioxidant, Antibacterial, Antitumor, Antifungal, Antiviral, Anti-Inflammatory, and Nevro-Protective Activity of Ganoderma lucidum: An Overview. Front. Pharmacol. 2022, 13, 934982. [Google Scholar] [CrossRef] [Scilit] [PubMed]
- Liu, X.; Yang, L.; Li, G.; Jiang, Y.; Zhang, G.; Ling, J. A novel promising neuroprotective agent: Ganoderma lucidum polysaccharide. Int. J. Biol. Macromol. 2023, 229, 168–180. [Google Scholar] [CrossRef] [Scilit] [PubMed]
- Cai, M.; Mu, H.; Xing, H.; Li, Z.; Xu, J.; Liu, W.; Yang, K.; Sun, P. In vitro gastrointestinal digestion and fermentation properties of Ganoderma lucidum spore powders and their extracts. LWT 2021, 135, 110235. [Google Scholar] [CrossRef] [Scilit]
- Liu, H.-M.; Cheng, J.; Wang, X.-Y.; Jiang, Y.; Ni, J.; Zhang, Y.; Wang, W. Structure Identification of Ganoderma lucidum Spore Polysaccharides and Their Antitumor Activity In Vivo. Molecules 2024, 29, 2348. [Google Scholar] [CrossRef] [Scilit] [PubMed]
- Li, Y.; Li, F.; Xu, X.; Shen, C.; Meng, K.; Chen, J.; Chang, D. Parameter calibration of wheat flour for discrete element method simulation based on particle scaling. Trans. Chin. Soc. Agric. Eng. 2019, 35, 320–327. [Google Scholar]
- Zhang, Q.; Sun, L.; Fan, X.; Ma, P.; Hu, J.; Liu, J. Calibration and Experiment of Discrete Element Model Parameters for Alfalfa Seed Pod Separation and Cleaning. Trans. Chin. Soc. Agric. Mach. 2025, 56, 156–164. [Google Scholar]
- Zhang, M.; Wang, J.; Gao, C.; Lü, X. Simulation and Experimental Analysis of Recovery and Separation System of Mobile Shot Blasting Machine. Sci. Technol. Eng. 2026, 26, 112–122. [Google Scholar]
- Chen, L.; Shen, K.; Li, J.; Wan, H.; Cao, C.; Hu, C.; Hu, Q.; Li, Z. Parameter Calibration and Experiment Verification of Shrimp Feed Pellet Based on Discrete Element Method. Trans. Chin. Soc. Agric. Mach. 2025, 56, 750–760. [Google Scholar]
- Yuan, S.; Lian, X.; Zhou, W.; Li, C.; Gu, Y.; Liu, X. Research on Mesoscopic Parameter Calibration for Chengdu Sandy Pebble Discrete Element Model Based on BP Neural Network. J. China Railw. Soc. 2026, 48, 140–150. [Google Scholar]
- Xi, X.; Du, H.; Chen, Z.; Shi, Y.; Zhang, B.; Yu, X. Design and Experiment of Subsoiling Pneumatic Deep Fertilization Device for Soybean-Corn Intercropping Based on CFD-DEM Coupling. Trans. Chin. Soc. Agric. Mach. 2026, 57, 77–87. [Google Scholar]
- Zhang, S.; Song, B.; Zhou, L.; Huang, Q.; Xie, C.; Li, H.; He, W.; Ling, H. Research on the Ice Resistance and Propulsion Performance of Polar Ships via the CFD-DEM Coupling Method. China Ocean Eng. 2025, 39, 232–243. [Google Scholar] [CrossRef] [Scilit]
- Li, C.; Wang, K.; Wang, M.; Li, J.; Cao, L.; Liu, M. Numerical Simulation of Traditional Chinese Medicine Paste in a Combined Paddle Kettle of the “Cow Horn Tube” Type. Sci. Technol. Eng. 2024, 24, 7249–7259. [Google Scholar]
- Yan, P.; Liu, Z.; Peng, D.; Yang, B.; Wang, Z. Characteristics of Water Jet Lithium-oil Depolymerization Based on CFD-DEM Coupling. Sci. Technol. Eng. 2025, 25, 5266–5272. [Google Scholar]
- Johnson, K.L.; Kendall, K.; Roberts, A.D. Surface energy and the contact of elastic solids. Proc. R. Soc. Lond. A 1971, 324, 301–313. [Google Scholar] [CrossRef] [Scilit]
- Han, R.; He, X.N.; Shang, S.Q.; Chang, X.L.; Han, M.M.; Xi, C.Z. Parameter Calibration and Model Development for Powdered Organic Fertiliser Based on Discrete Element Method. J. Agric. Mech. Res. 2026, 1–9. Available online: https://link.cnki.net/urlid/23.1233.s.20260623.1411.008 (accessed on 27 September 2026).
- Liu, W.; Su, Q.; Fang, M.; Zhang, J.; Zhang, W.; Yu, Z. Parameters Calibration of Discrete Element Model for Corn Straw Cutting Based on Hertz-Mindlin with Bonding. Appl. Sci. 2023, 13, 1156. [Google Scholar] [CrossRef] [Scilit]
- Sedara, A.; Zeng, Z.; Digman, M.; Timm, A. Optimization of Liquid Manure Injector Designs for Cover Crop Systems Using Discrete Element Modeling and Soil Bin Evaluation. AgriEngineering 2025, 7, 404. [Google Scholar] [CrossRef] [Scilit]
- Li, H.; Zhang, G.; Li, X.; Zhang, H.; Zhang, Q.; Liu, W.; Mu, G. Calibration of the Discrete Element Method Parameters in Living Juvenile Manila Clam (Ruditapes philippinarum) and Seeding Verification. AgriEngineering 2021, 3, 894–906. [Google Scholar] [CrossRef] [Scilit]
- Yang, K.; Li, X.; Wang, Y.; Du, X. CFD-DEM Simulation Study on Heat and Mass Transfer of Wheat Particles in Gas-Solid Fluidized Bed. J. Food Process Eng. 2025, 48, e70036. [Google Scholar] [CrossRef] [Scilit]
- Yang, Y.Q.; Pan, J.Z. Study on elastic modulus and hardness of sporoderm of Ganoderma lucidum spores. Chin. Q. Mech. 2008, 1, 166–172. [Google Scholar]







Disclaimer/Publisher’s Note: The statements, opinions and data contained in all publications are solely those of the individual author(s) and contributor(s) and not of MDPI and/or the editor(s). MDPI and/or the editor(s) disclaim responsibility for any injury to people or property resulting from any ideas, methods, instructions or products referred to in the content. |
© 2026 by the authors. Licensee MDPI, Basel, Switzerland. This article is an open access article distributed under the terms and conditions of the Creative Commons Attribution (CC BY) license.