


Abstract
Speech is a fundamental component of human communication and has become increasingly important with the widespread adoption of voice-based technologies, text messaging systems, Chatbots, and Large Language Models (LLMs). While AI systems are going through exponential breakthroughs, they often prioritize the dominant variant of a language. Using the TEDx Talks Brazilian Accents (TTBAcc) dataset, this research provides an acoustic analysis of two Brazilian Portuguese accents: Nordestino and Paulistano and an unsupervised accent clustering to find distinctive characteristics and investigate factors that can potentially support the monitoring of emerging and endangered accents. The acoustic analysis compares rhotics and vowels produced by speakers of both accents. The analysis of rhotics provided limited evidence of meaningful difference between accents. In contrast, the vowels exhibit significant differences in the fundamental frequency (), the first and second formant frequencies ( and ) and intensity, suggesting that these acoustic features may be more effective to distinguish between the investigated accents. For accent clustering, , length, volume, and formant frequencies ( and ) are used as inputs. Among the evaluated approaches, K-Means, with achieves the best performance, obtaining a Rand Score of 0.775 ± 0.028 and 0.524 ± 0.032 homogeneity, the best performing model. The optimal number of cluster exceeds the number of classified accents, which may indicate either an over-segmentation of data or a finer-grained phonetic variation captured in acoustic features. These findings highlight the potential of using acoustic features for investigating the variation in regional accents, and provides a basis for further research in monitoring emerging and endangered accents.
1. Introduction
An accent can be defined as “Modo de articular os sons, palavras ou frases, peculiar de uma pessoa, de uma região etc.” (i.e., way to produce the sounds, words or sentences, specific to a person, region etc.), while a dialect is a broader definition that includes pronunciation, vocabulary, and grammar [1]. The accents directly impacts on peoples communication and social interactions. They represent several cultural and social aspects of a person or population, making it a fundamental part of what defines them [2]. Thus, preserving and including such ‘ways of producing’ sounds in speech technologies is extremely important [3].
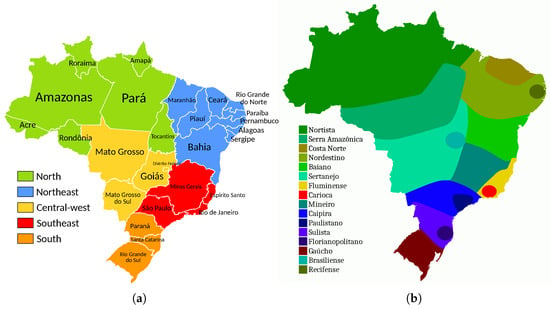
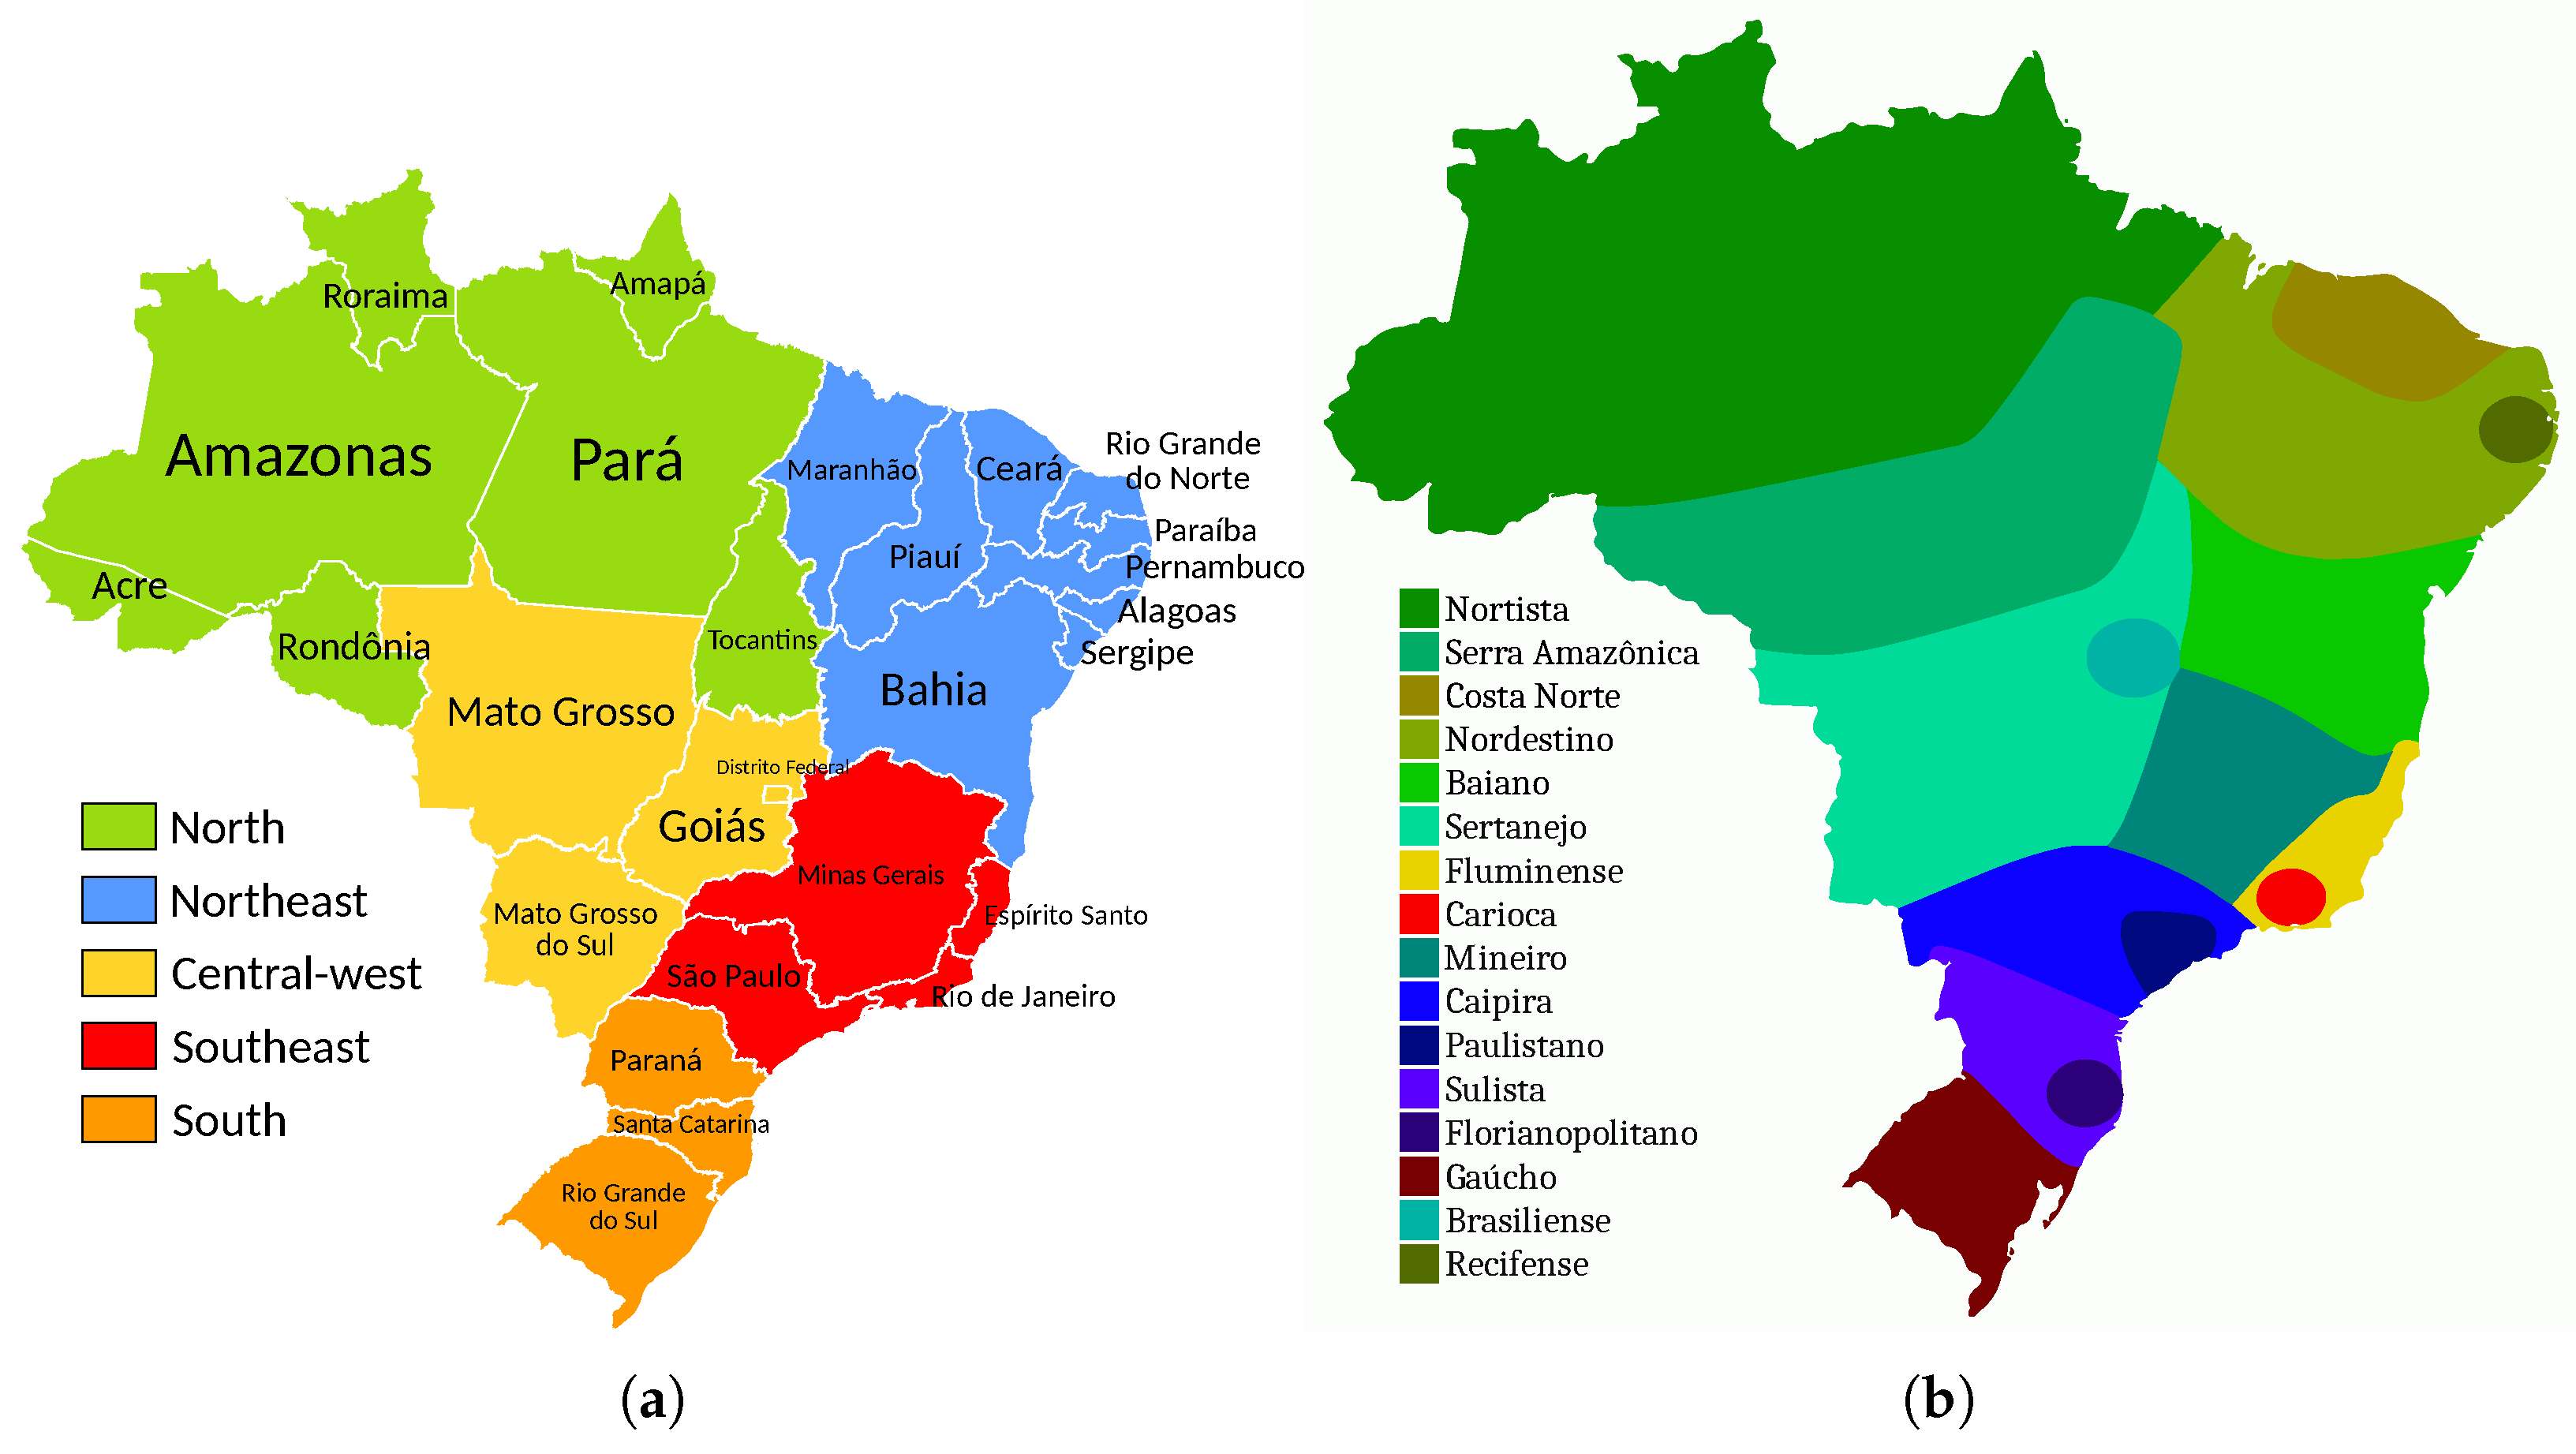
The importance of accents increases as they mark changes in languages, sometimes carrying the history of civilisations. For example, an Afro-Asiatic language called Coptic was found to be a modern version of Egyptian and was used to better understand missing sounds from hieroglyphics translations [4]. Similarly, the Brazilian Portuguese (PT-BR) has the influences of several cultures: Portuguese, African, Aboriginals (Indigenous people), Italian, and many others. Hence, preserving and understanding the accents, and the language itself, means to preserve the cultural aspects and the history of an ethnicity. Figure 1 presents a geopolitical map of Brazil alongside the linguistic boundaries of PT-BR dialects. The maps illustrate that political and linguistic boundaries do not necessarily coincide, although substantial overlap may occur in some regions. For example, the boundaries of the state of Rio Grande do Sul largely overlap with those of the Gaúcho accent. The linguistic boundaries shown in the figure are based on the findings of the Atlas Linguístico do Brasil [5], a project dedicated to documenting and characterizing the regional varieties of Brazilian Portuguese.
Figure 1.
Geopolitical (a) and dialectal (b) limits of Brazil.
The outstanding features of an accent are reflected in its prosodic characteristics, particularly in acoustic parameters such as fundamental frequency, intensity, duration, and spectral distribution. However, listeners distinguish accents based on how speech is perceived and heard. Accent perception is therefore associated with perceived melody, loudness, duration, and timbre, which correspond directly—or, in some cases, indirectly—to these underlying acoustic parameters.
1.1. Literature Review
The use of signal processing techniques to describe, compare and measure the sound information in voice is called acoustic analysis [6]. To describe accents, it is common base the analysis on fundamental frequency, pitch, energy, and other speech parameters in the form of statistics. An acoustic analysis has been done for other languages [7], and for PT-BR as well [8]. There are a variety of accent datasets available [9], unfortunately, the majority covers only English accents, while low resource languages are rarely represented.
The novelty on this investigation is on the diversity of the dataset. This research uses a more general approach, relying on the dataset size and variety of accents, cultures and regions. Moreover, we also present an unsupervised methodology for clustering accents.
1.2. Paper Organisation
The next section describes the dataset transformations and any parameters used to extract or compare the accents. More specifically, this study starts with a comparison between Nordestino and Paulistano rhotics in Section 2.1. Another acoustic analysis is performed for the vowels in Section 2.2. Then, Section 2.3 describe the material and methods for the unsupervised clustering. The results are presented in the same order, in Section 3. Finally, there is a brief discussion in Section 4.
2. Materials and Methods
This section describes the methods and data transformations. It first presents an acoustic analysis of the rhotics, followed by the vowels, and subsequently details the configuration adopted for the unsupervised clustering procedure.
The TEDx Talks Brazilian Accents Dataset (TTBAcc) [10] is a recently introduced dataset for Brazilian Portuguese (PT-BR). It comprises 520 PT-BR speakers, including 251 males, from different regions of Brazil. The dataset contains approximately 109.8 h of speech and covers 77.8% of the country’s territory, representing 21 of the 27 Brazilian states.
The dataset was automatically collected from Portuguese-language TEDx Talks available on YouTube. Speakers from other Portuguese varieties, such as European Portuguese and Mozambican Portuguese, are not considered in this study.
Based on the speaker’s birthplace and the linguistic boundaries shown in Figure 1, a sample is classified as belonging to the Nordestino (NRD) accent when the speaker was born in one of the following states: Alagoas (AL), Pernambuco (PE), Paraíba (PB), Rio Grande do Norte (RN), Ceará (CE), or Bahia (BA). Among the speakers from these states, 70 have available phonetic data. Of these, only 45 have sufficient regional information for the present analysis. Therefore, this study considers a total of 45 speakers representing 8 Brazilian Portuguese accents.
The data used for investigation covers 4 out 5 regions of Brazil, the Center-west is the only one without speakers. These 45 speakers have 23 men and represent 8 accents, including NRD and PLST. Age is well distributed across many intervals. All this information is available in Table 1.
Table 1.
Speaker demographics.
2.1. Acoustic Analysis: Rhotics
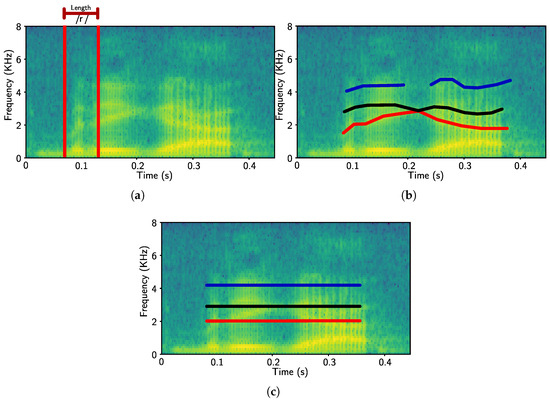
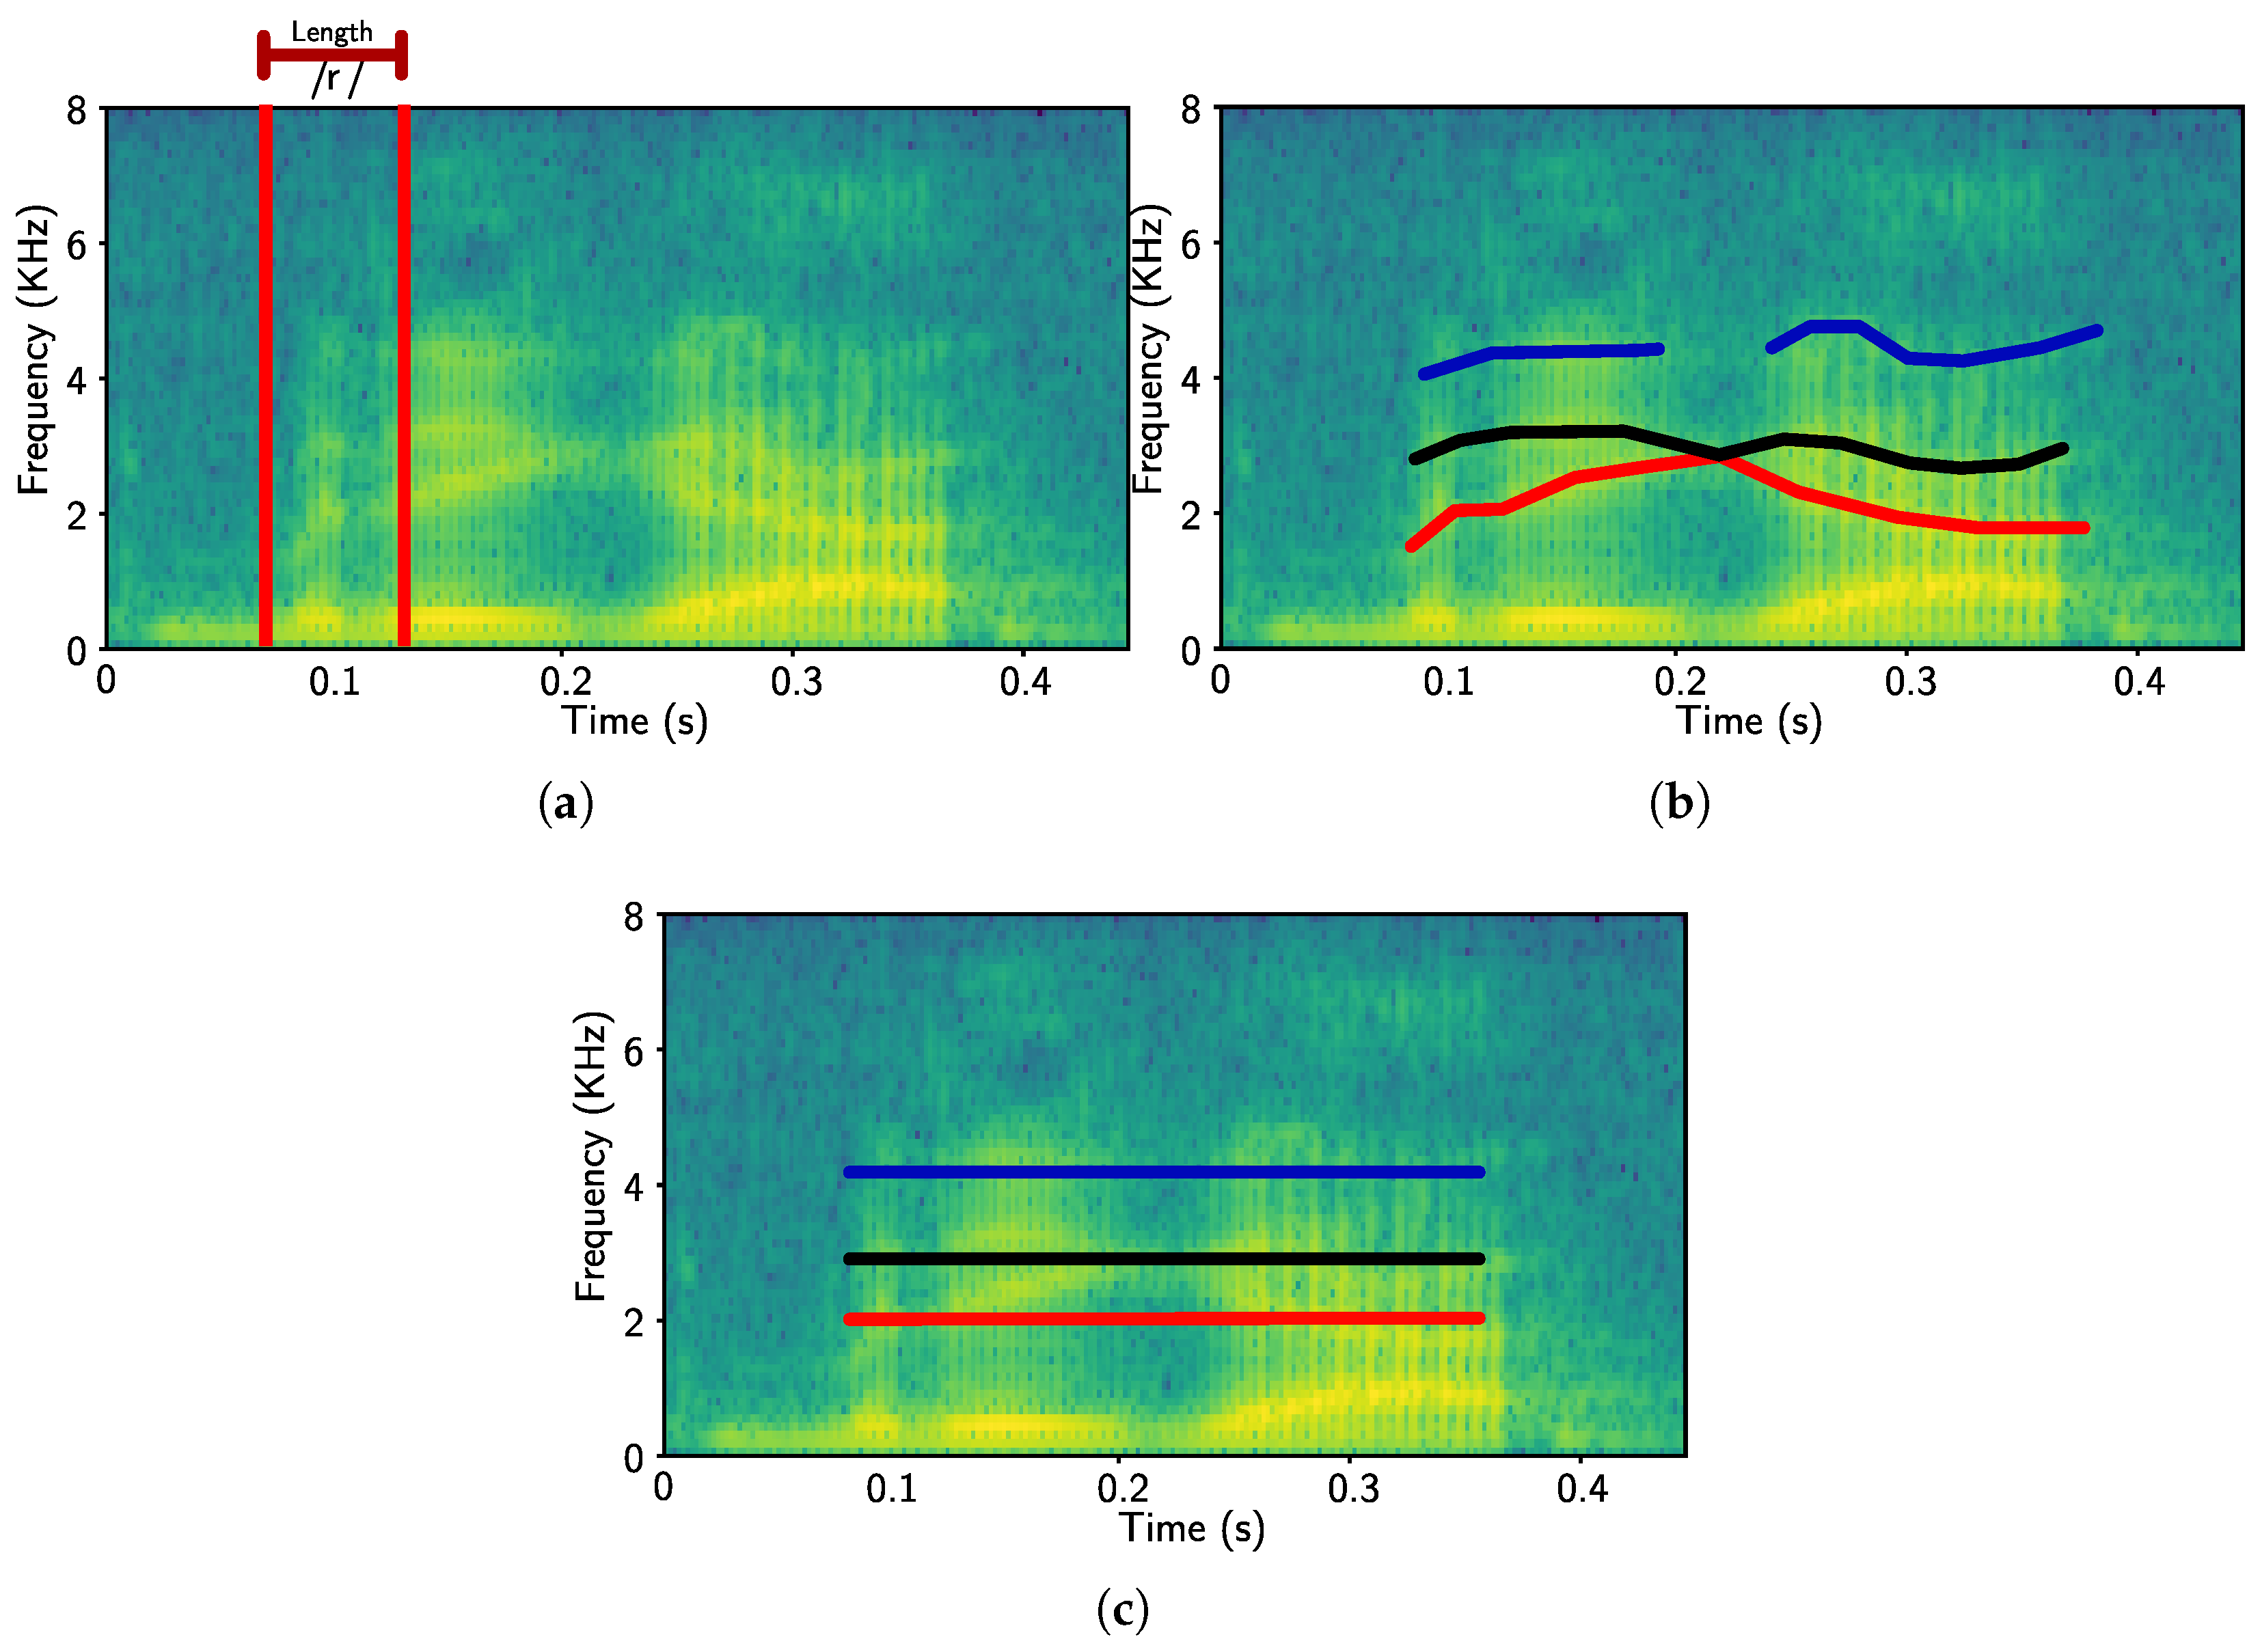
The rhotics are the sounds of R, i.e., /ɾ/ (Go to https://bit.ly/3Wwn9f2, accessed on 3 November 2022, and listen to a sample /ɾ/ in a word.) and /ʁ/ (Go to https://bit.ly/3Wwn9f2, accessed on 3 November 2022, and listen to a sample /ʁ/ in a word.). These sounds are said to have a high variation across PT-BR accents and are very characteristic [2,11]. Their main characteristics in PT-BR are a vanishing /ɾ/ at the end of words and a louder /ʁ/ [2]. In this study, we restrict the analysis to the length in milliseconds and the distance between formants (gaps) 3, 4 and 5 [12]. The gaps will be referred to as , which means the distance between formants 4 and 3. To estimate the formants frequency, this study uses Linear Predictive Code (LPC). Figure 2 illustrates the features in the spectrogram. All features are extracted from the interval where the sound was produced.
Figure 2.
Length L (a), formants contour (b) and static formants frequency (c) for /ɾ/ in “Obrigado” (i.e., Thank you). The third, fourth and fifth formants are red, black and blue, respectively.
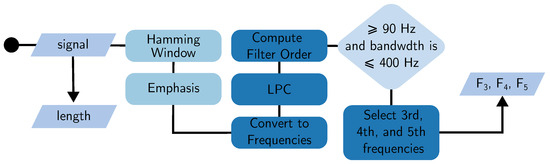
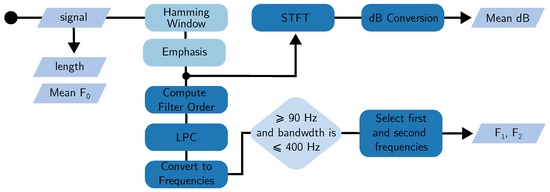
Figure 3 illustrates the process of extracting the length L and formants from a spectrogram. First, compute the L of the rhotic, then the signal passes through a Hamming Window of size L and is emphasised with a high-pass filter with a gain of 0.63. The spectrum is obtained with an NFFT and window length of 128 and 32 samples of stride, formants are obtained by computing the LPC residuals with positive imaginary parts, and filter order is adjusted with Equation (1), and only roots between 90 Hz and 400 Hz are considered.
Figure 3.
Rhotics feature extraction.
2.2. Acoustic Analysis: Vowels
This section examines differences in the production of oral and nasal vowels between the NRD and PLST accents. Nasal vowels are represented by a ~ over the vowel symbol (e.g., a). As with rhotics, vowel characteristics can provide useful cues for distinguishing between accents [11]. To account for differences in the number of observations across vowel categories, this study employs bootstrapping with 5000 resamples, a 95% confidence interval (CI), the median as the statistic, and the percentile resampling strategy.
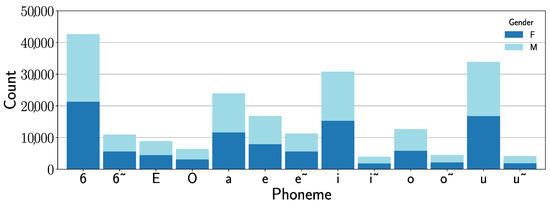
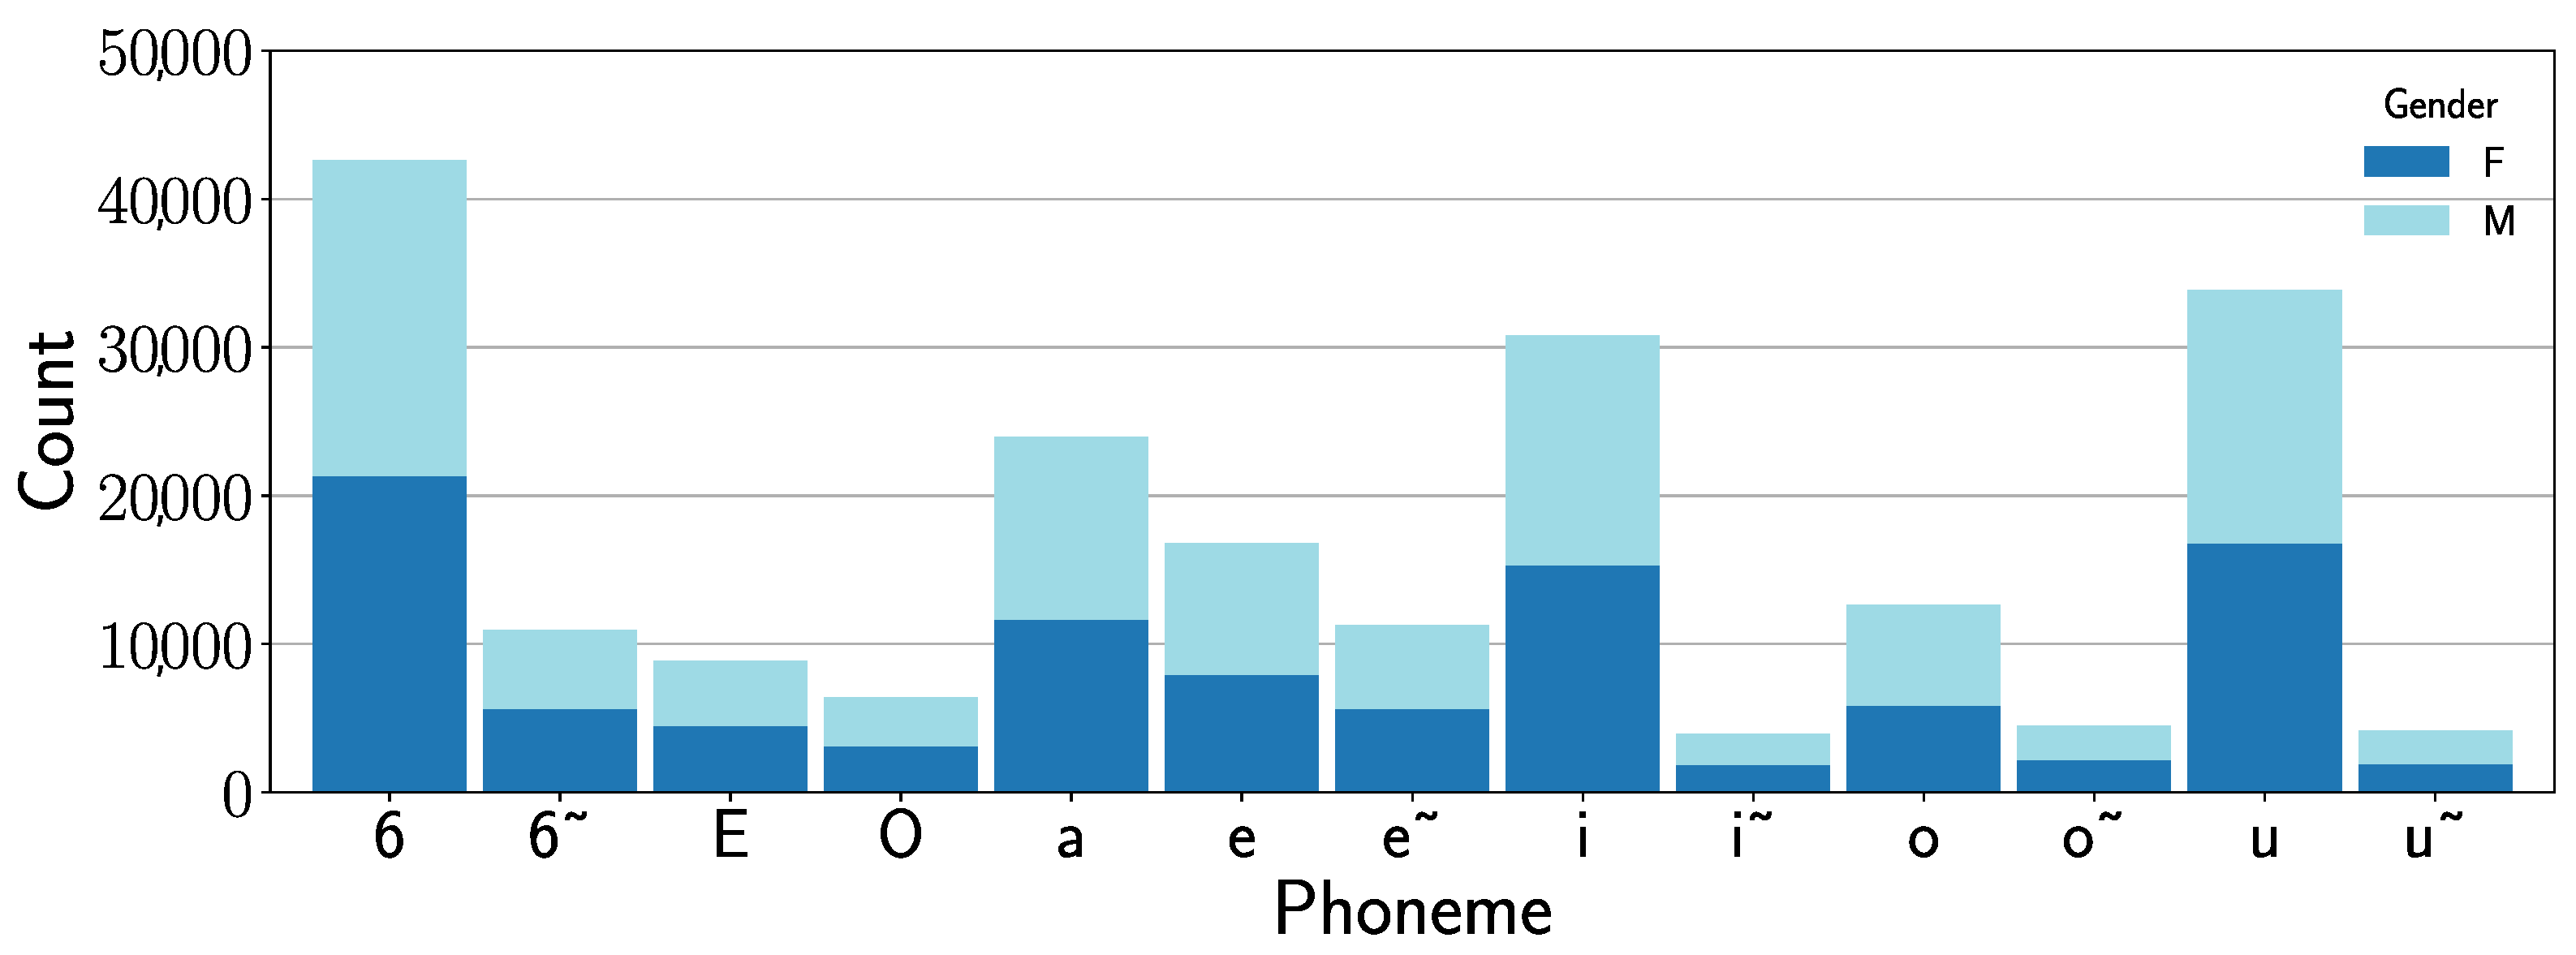
Among the vowels analyzed, // is the least represented, with 3948 samples, whereas // is the most frequent, with 42,604 samples. The distribution of vowel occurrences by speaker gender is shown in Figure 4.
Figure 4.
Vowels frequency from speakers between 20 and 35 years.
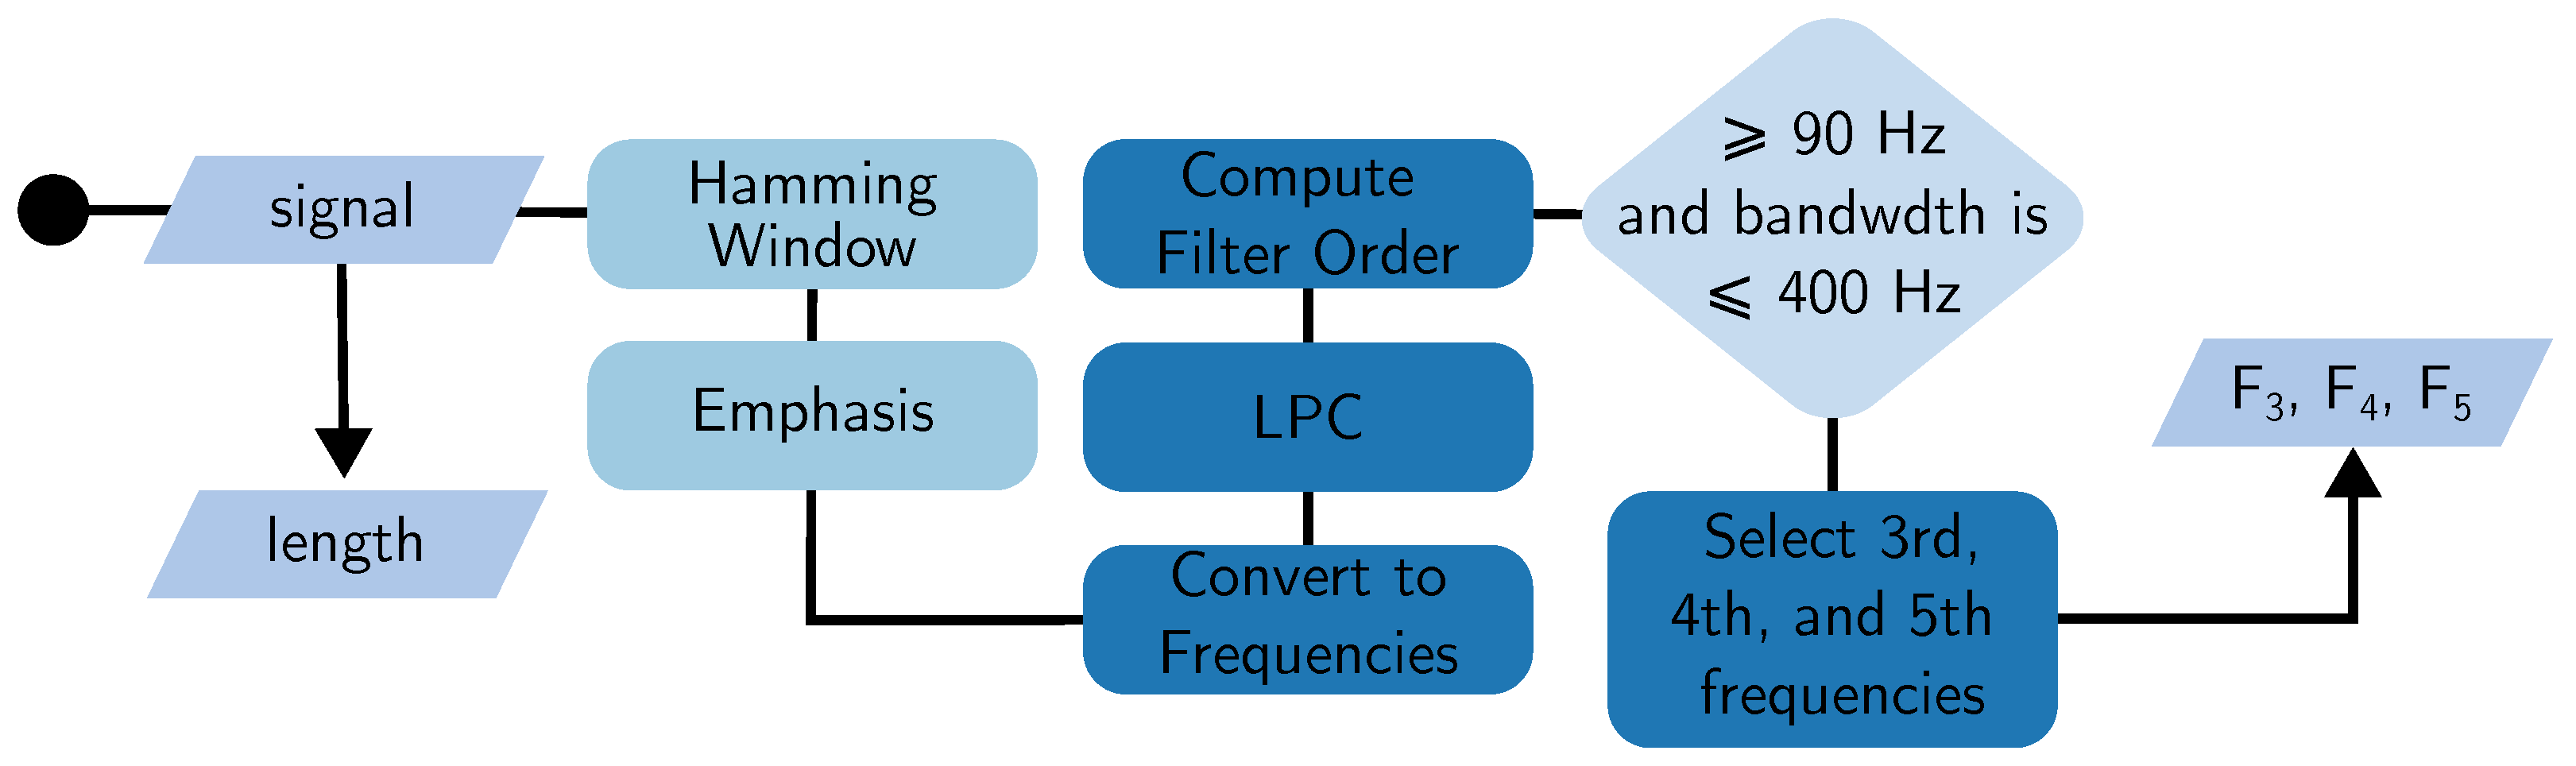
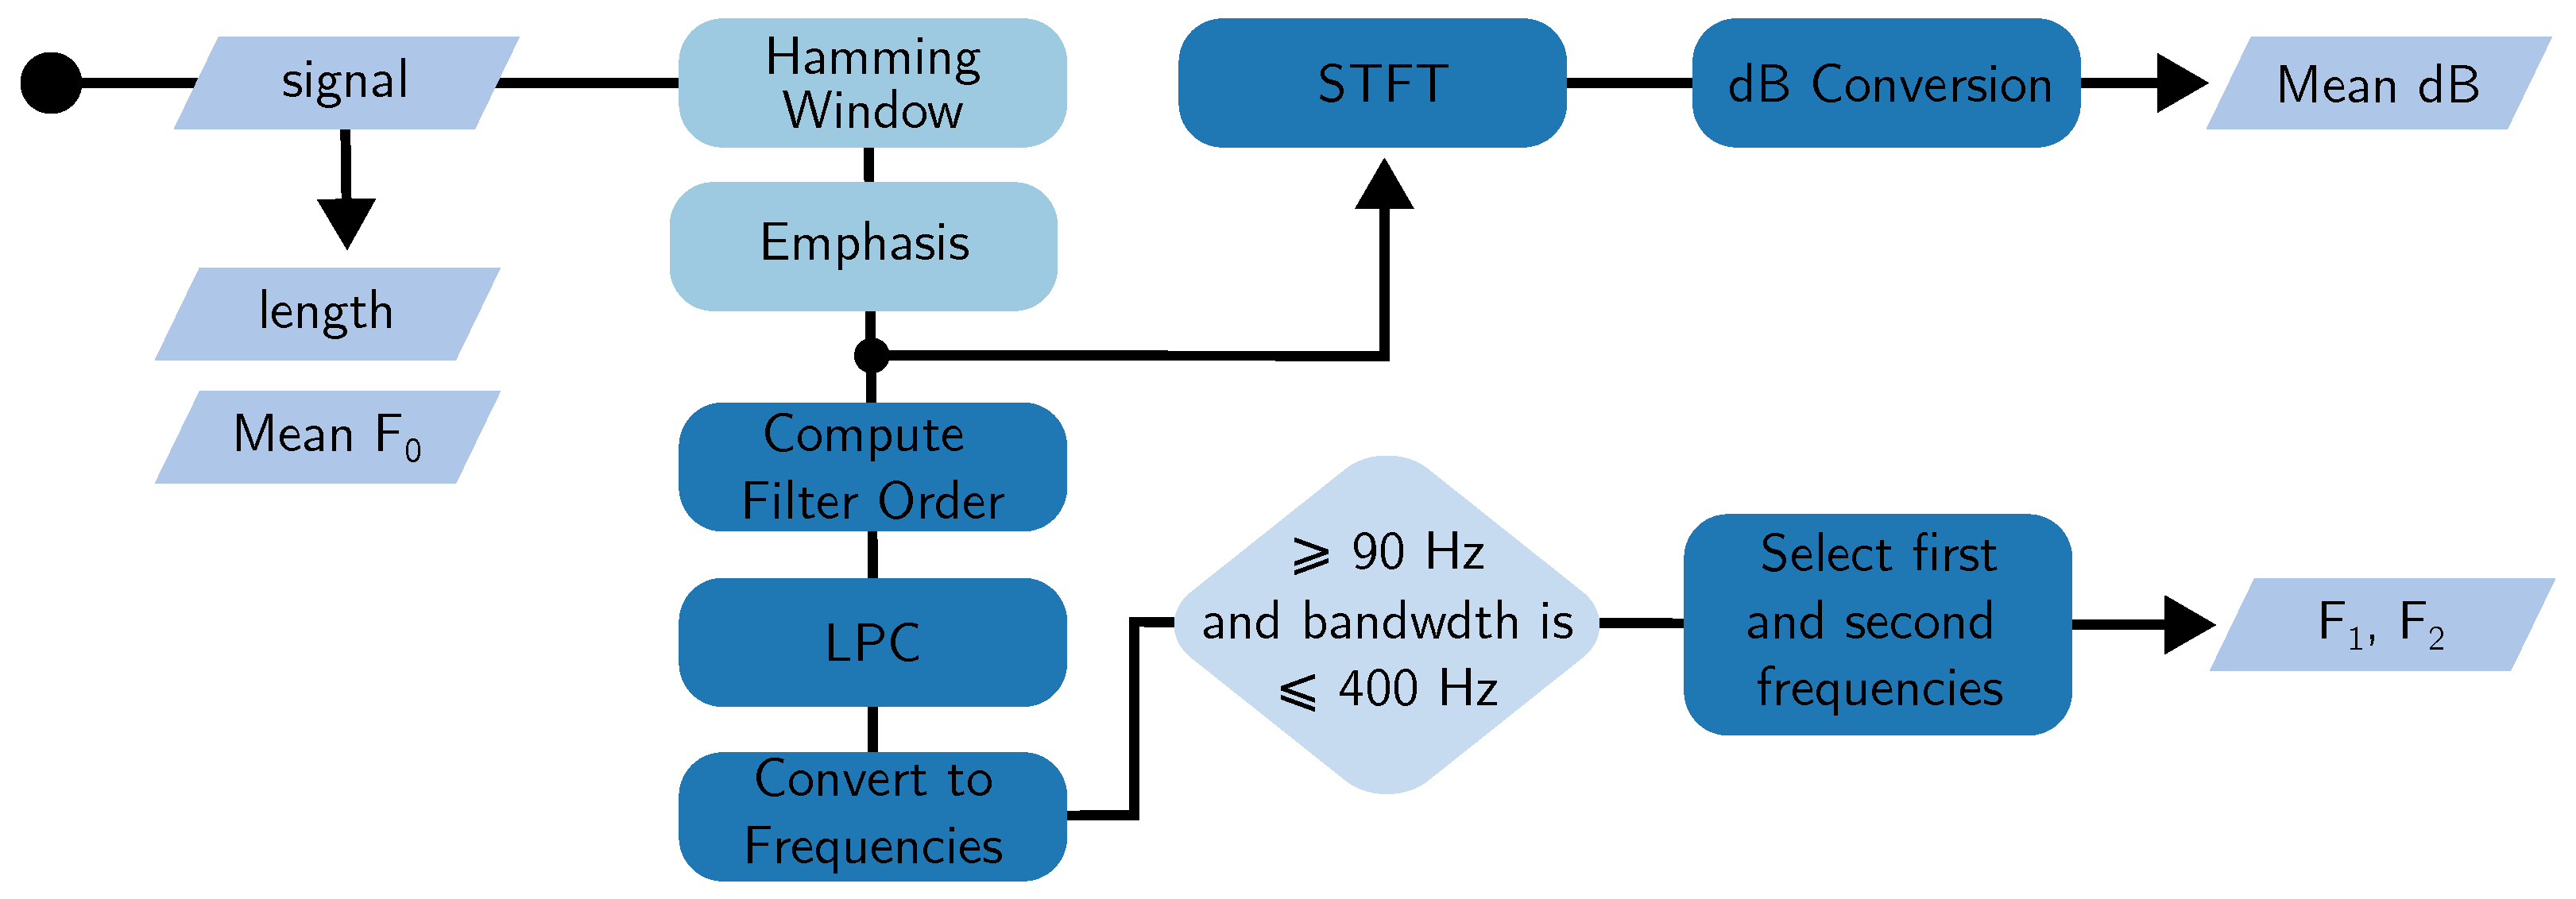
To compare accents, this study selected the volume, duration L, fundamental frequency, and formants [13,14]. The extraction process is depicted in Figure 5. The signal is first windowed with a hamming window of size L, then it is emphasised with a high-pass filter using a gain of 0.63. The intensity of the phoneme is calculated as the mean dB of its spectrogram, which is computed with a hamming window, a NFFT and window length of 128, and 32 samples of stride. The resulting spectrum is converted to dB using the maximum amplitude of each frame as reference. Finally, the formants are computed as the roots from the LPC residuals with positive imaginary parts. To adjust the filter order, this study used Equation (1) which solves to 18 since all recordings are sampled at 16 kHz. Results with frequency over 90 Hz and bandwidths below 400 Hz are selected as the formant estimation. This process is illustrated in Figure 5.
Figure 5.
Acoustics extraction process for vowels.
2.3. Accent Clustering
This section takes advantage of the vowel information from the acoustic analysis to cluster the PT-BR accents. The dataset is preprocessed, and three unsupervised clustering algorithms are used: K-Means, Balanced Iterative Reducing and Clustering using Hierarchies (BIRCH), and Gaussian Mixture Model (GMM), all from the SkLearn library. The decision of the algorithms is based on their popularity for unsupervised problems.
The vowel features are the mean fundamental frequency (), their duration in milliseconds, the mean volume in decibels, and the first and second formants ( and L). The data was computed using 1,215,659 vowel from 45 speakers from 4 regions of Brazil and 8 accents. We include every vowel in the speaker features, which makes each of them to 65 features (13 times 5). This data is summarized in Table 2.
Table 2.
Accent Clustering features description. Statistics calculated using 1,215,659 vowel samples.
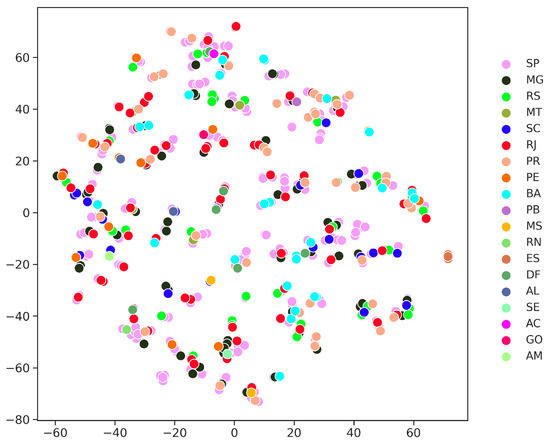
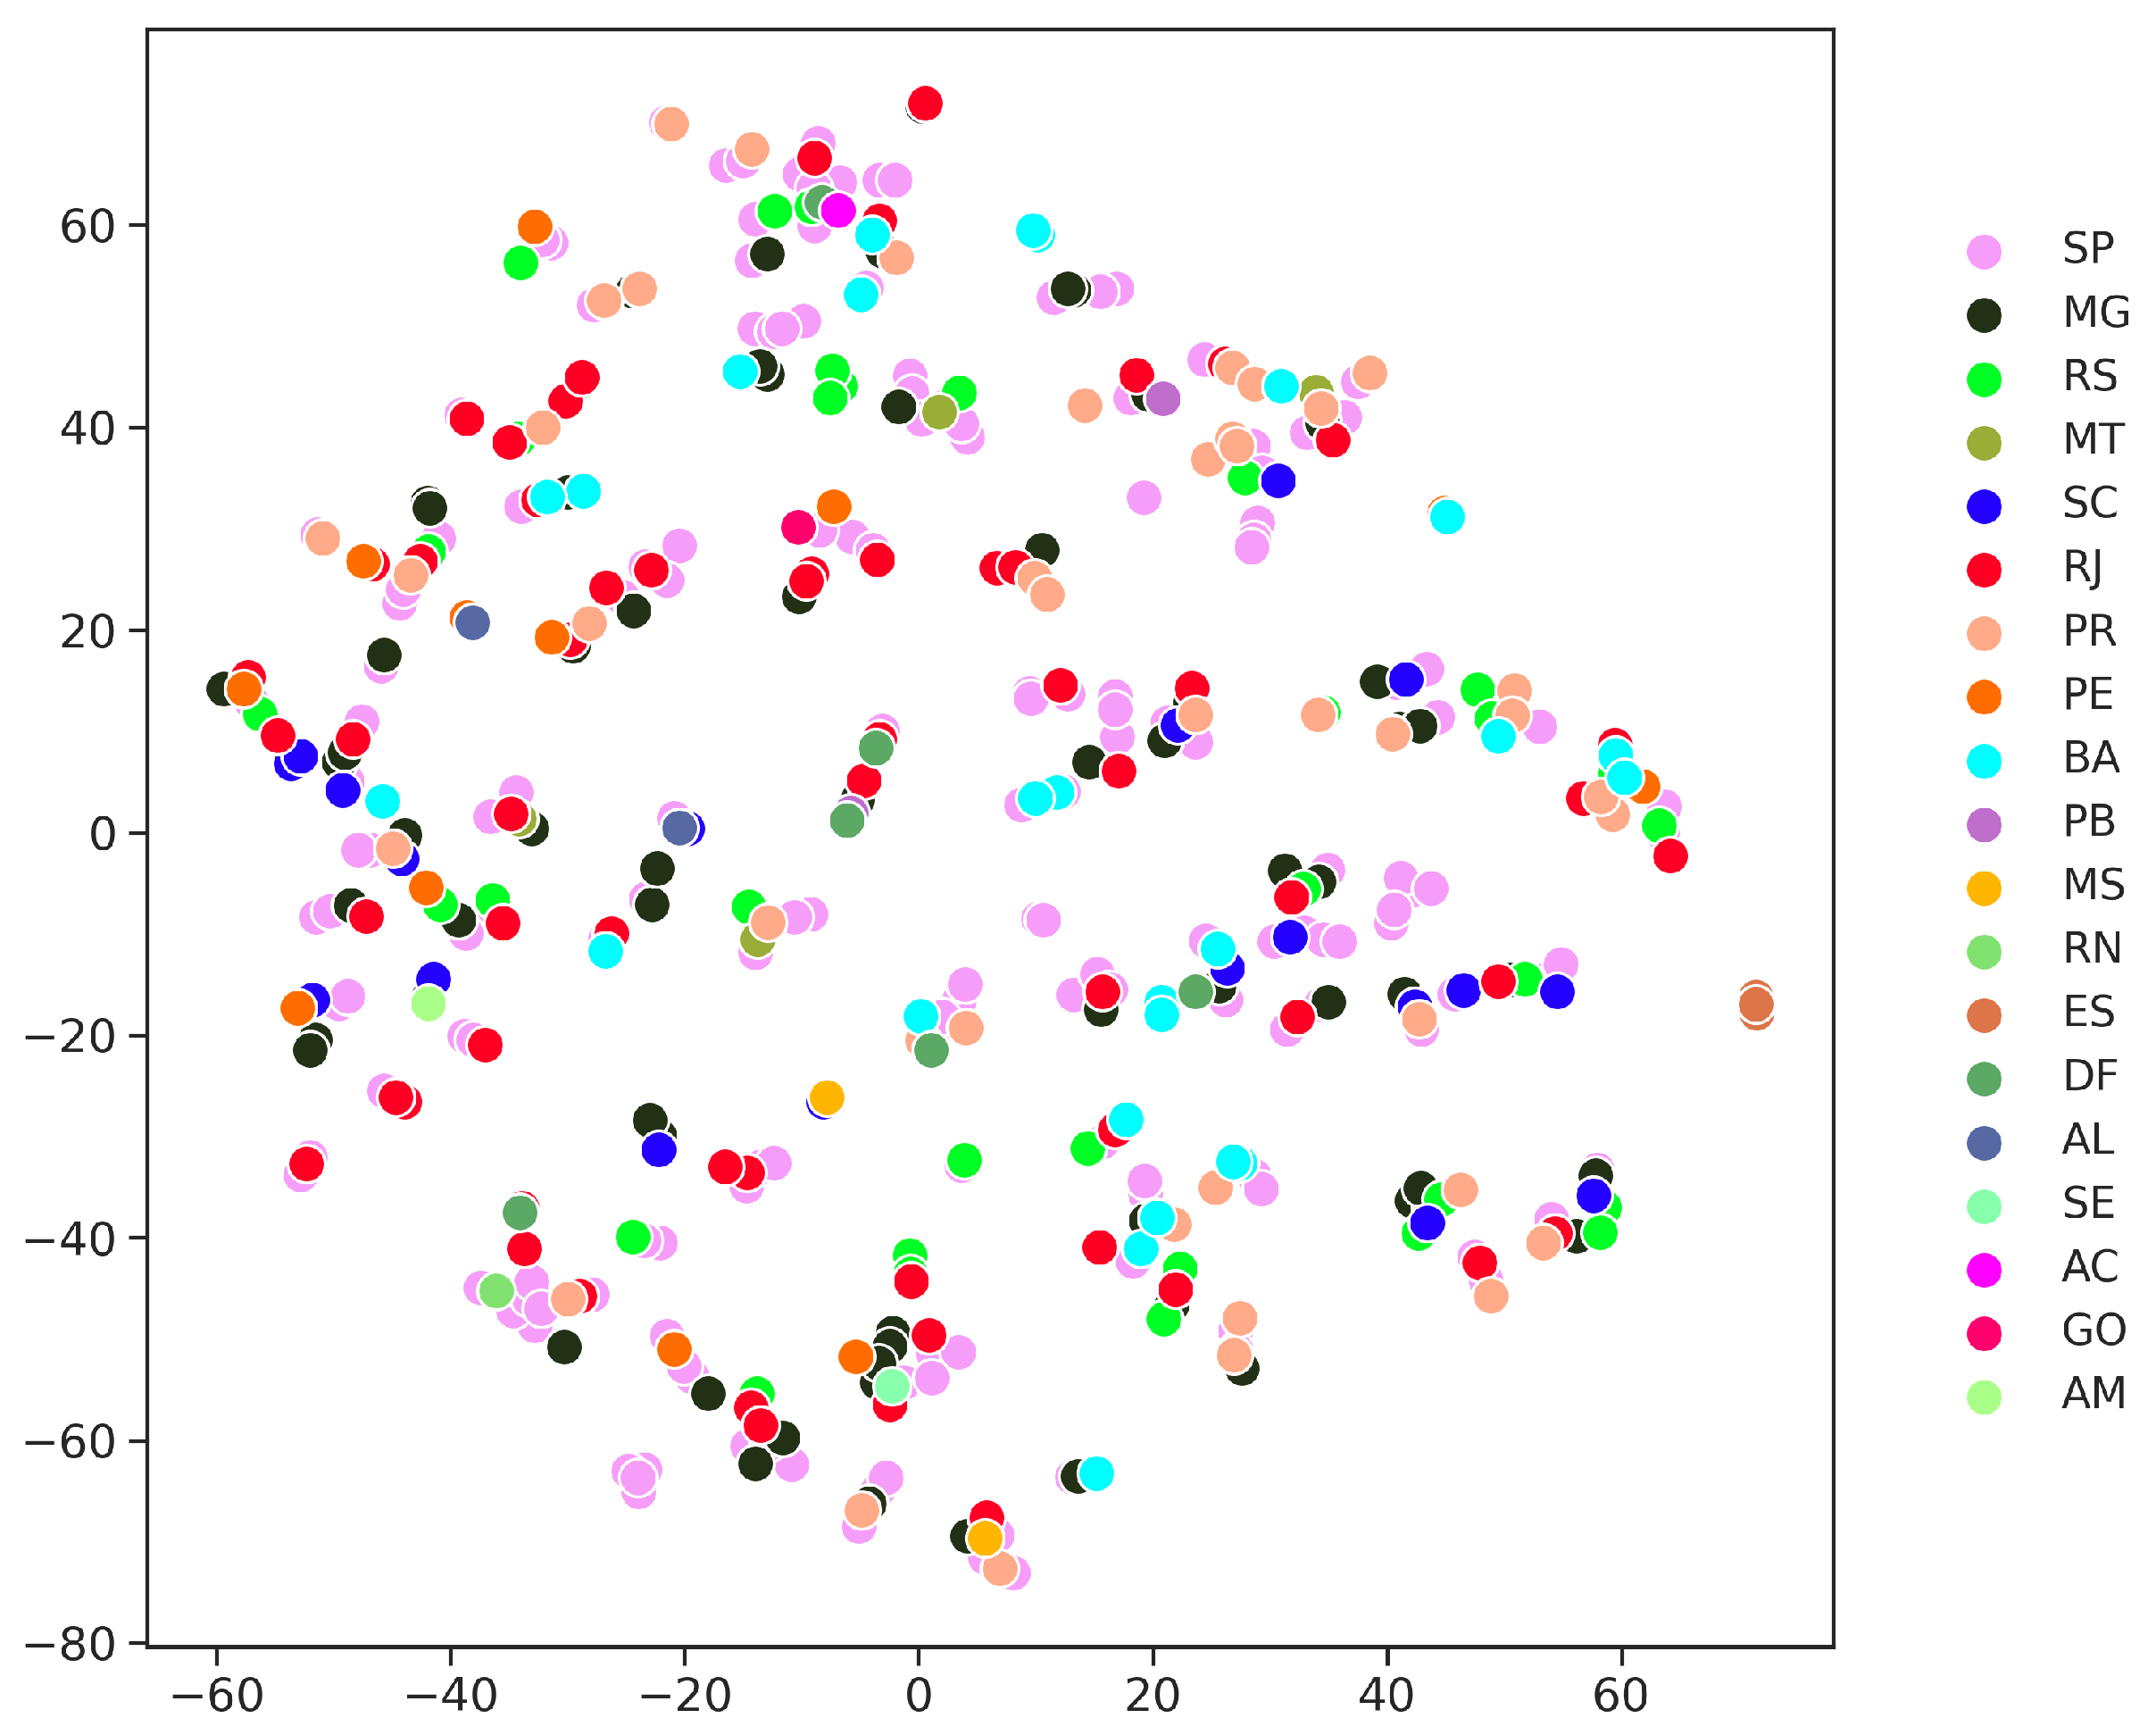
To use these features for clustering, the samples are grouped by speaker, then we calculate the mean of each feature. Figure 6 shows a data projection in two dimensions obtained with t-SNE algorithm. A few clusters can be identified, but the small number of speakers for the complexity of the problem make the data appear very noisy.
Figure 6.
Dataset in two-dimensional projection from t-SNE.
This study uses the Rand score and homogeneity to evaluate the quality of the resulting clusters. To obtain a more reliable estimate of model performance on unseen samples, 5-fold cross-validation was employed. Due to the relatively small size of the dataset, splitting the data into separate training and test sets would substantially reduce the amount of data available for model development. Cross-validation provides a more robust approximation of the model’s expected performance on unseen data while allowing all samples to contribute to both training and evaluation across different folds. The choice of five folds also provides a balance between retaining a larger proportion of the data for training and obtaining a reliable estimate of model performance.
2.4. AI Statement
During the preparation of this manuscript, the authors used Generative to review the grammar and spelling (at some section, not all), adjust BibTeX entries, and improve the readability of tables. After using this tool, the authors reviewed the generated content as needed.
3. Results
3.1. The Rhotics
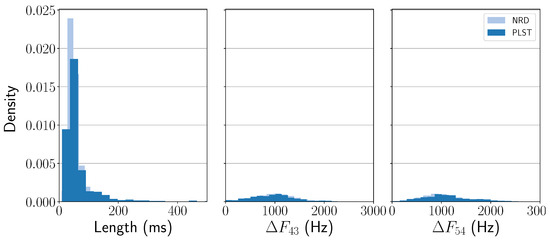
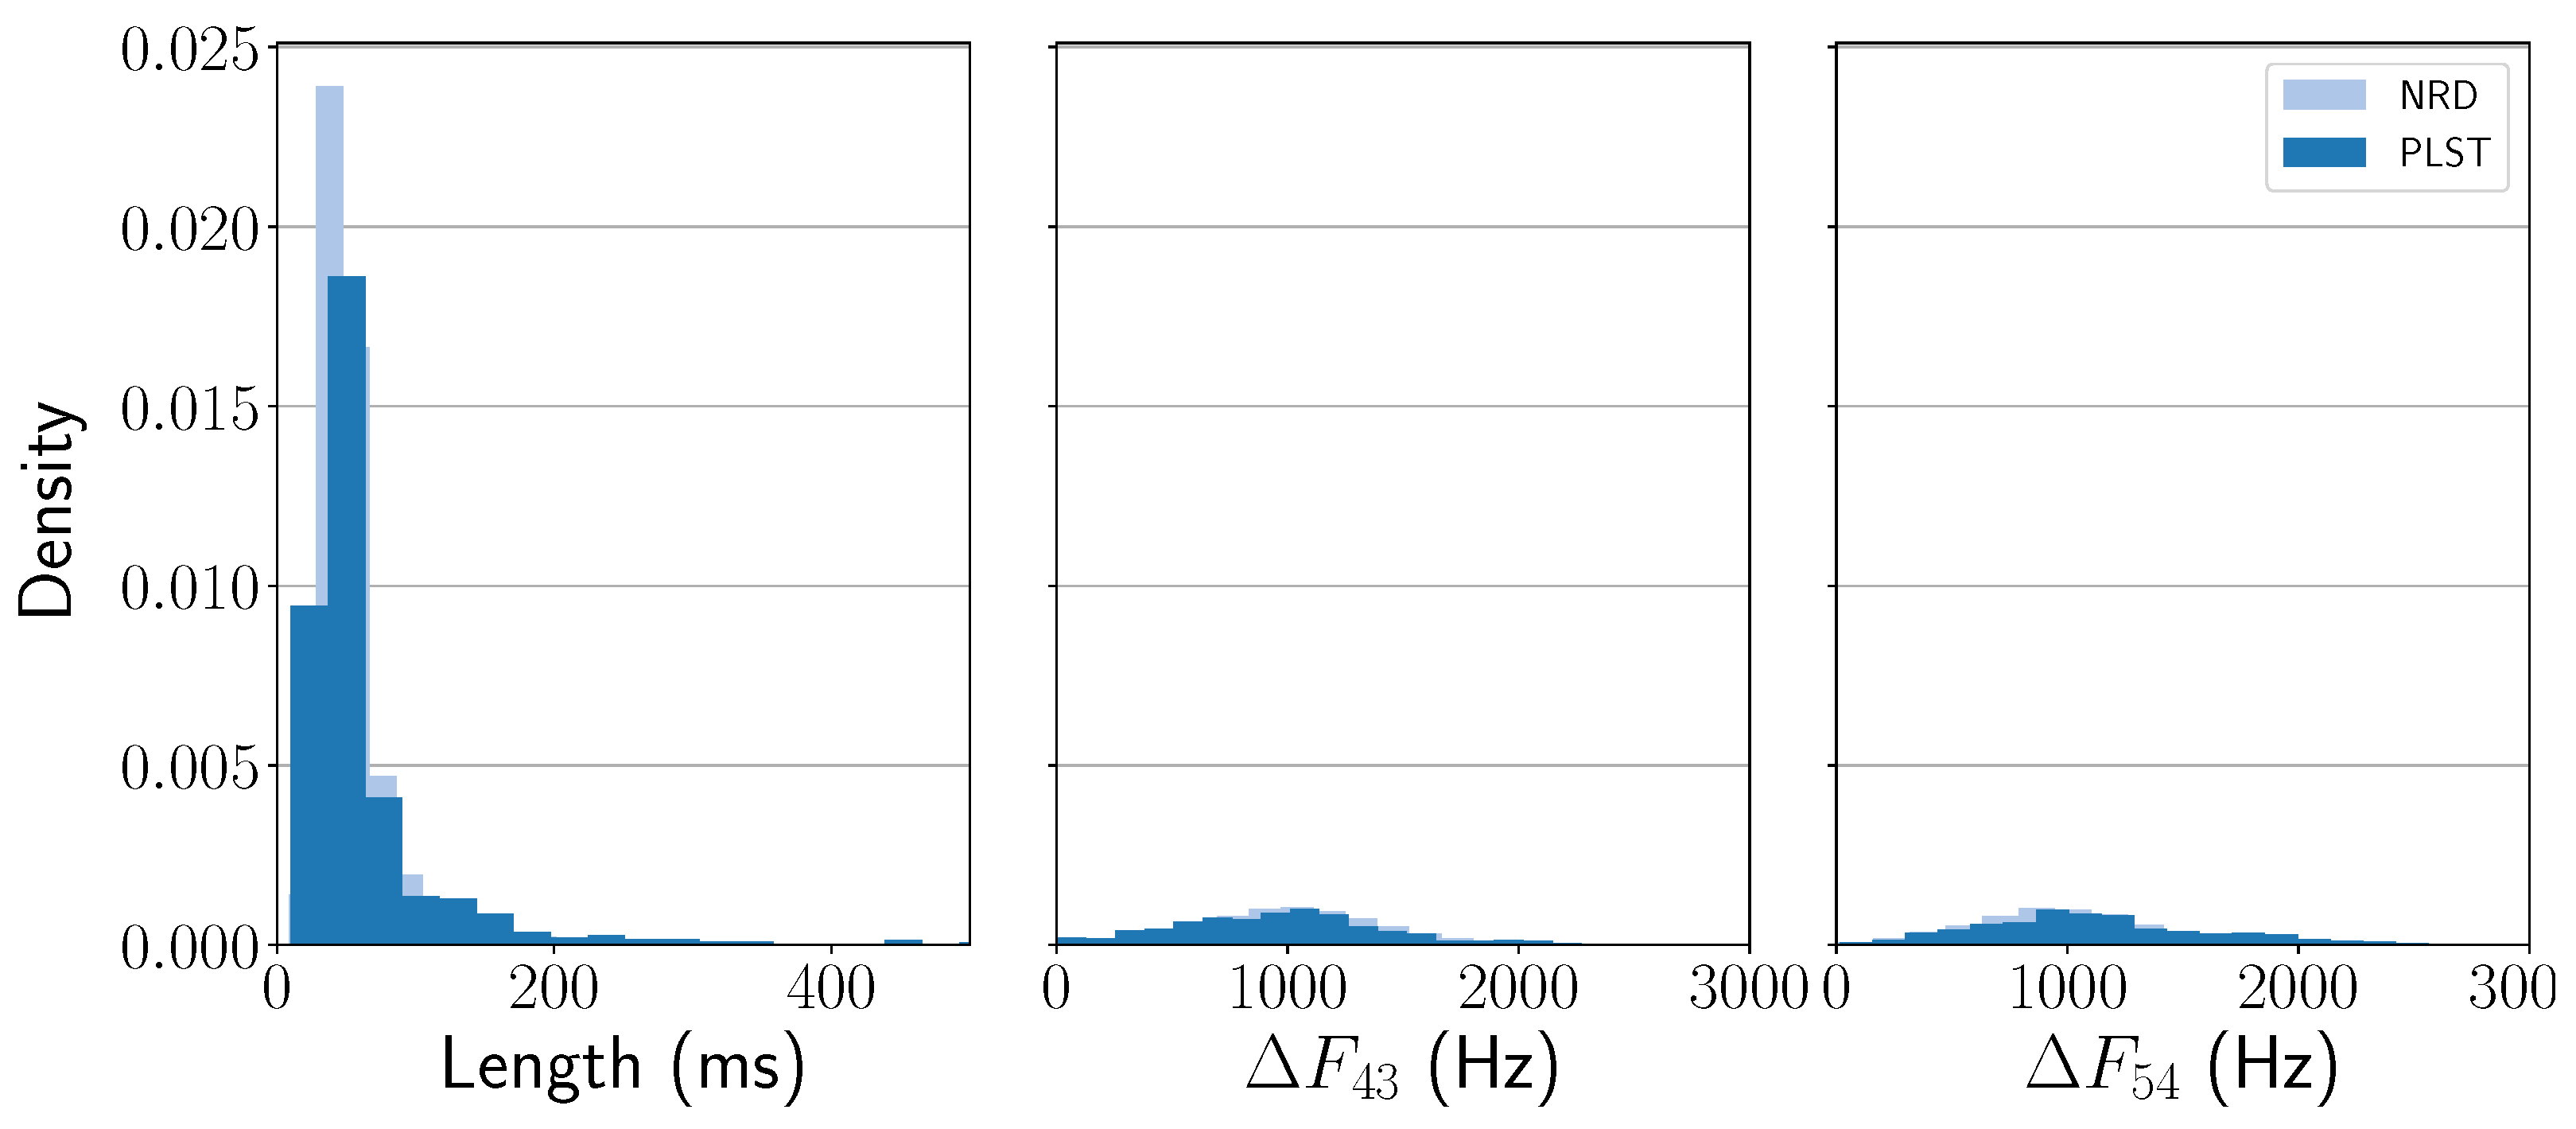
The distributions of the accents for each rhotic are similar, and mostly skewed to the left due to high frequency of outliers in the opposite direction, as illustrated in Figure 7.
Figure 7.
Features distribution for PT-BR rhotics. Length in ms with mean 64.1, for NRD, and 54.5, for PLST. in Hz with mean 984.9, for NRD, and 1029.2, for PLST. in Hz with mean 1129.5, for NRD, and 1028.0, of PLST.
To assess the statistical significance of each feature, this study employed the Kruskal–Wallis test and bootstrapping. The bootstrap analysis was performed using 5000 resamples, a 95% confidence interval (CI), the median as the statistic, and the percentile resampling method. The results are summarized in Table 3.
Table 3.
Kruskall-Wallis p-value, NRD Bootstrapping CI, and PLST medians for rhotics. Signifficant differences are in bold.
Using the TTBAcc and the results shown in the Table 3, there are three main indications. First, considering /ɾ/, NRD has a significant difference for both and . The Kruskall-Wallis p-value and CIs indicate such difference for the . Therefore, NRD has a smaller distance between formants 5 and 4, indicating a faster hit of the tongue into the palate for this accent. Second, despite the statistically significant p-value observed for , the median PLST value falls within the bootstrap confidence interval, suggesting limited evidence of a meaningful difference. Finally, results for /ʁ/ indicates that NRD pronounces /ʁ/ faster than PLST.
3.2. The Vowels
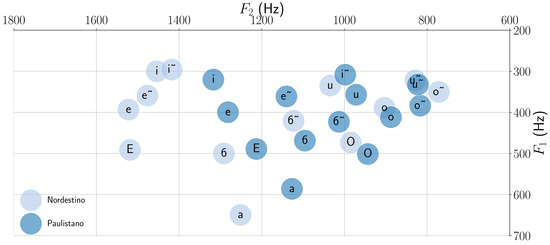
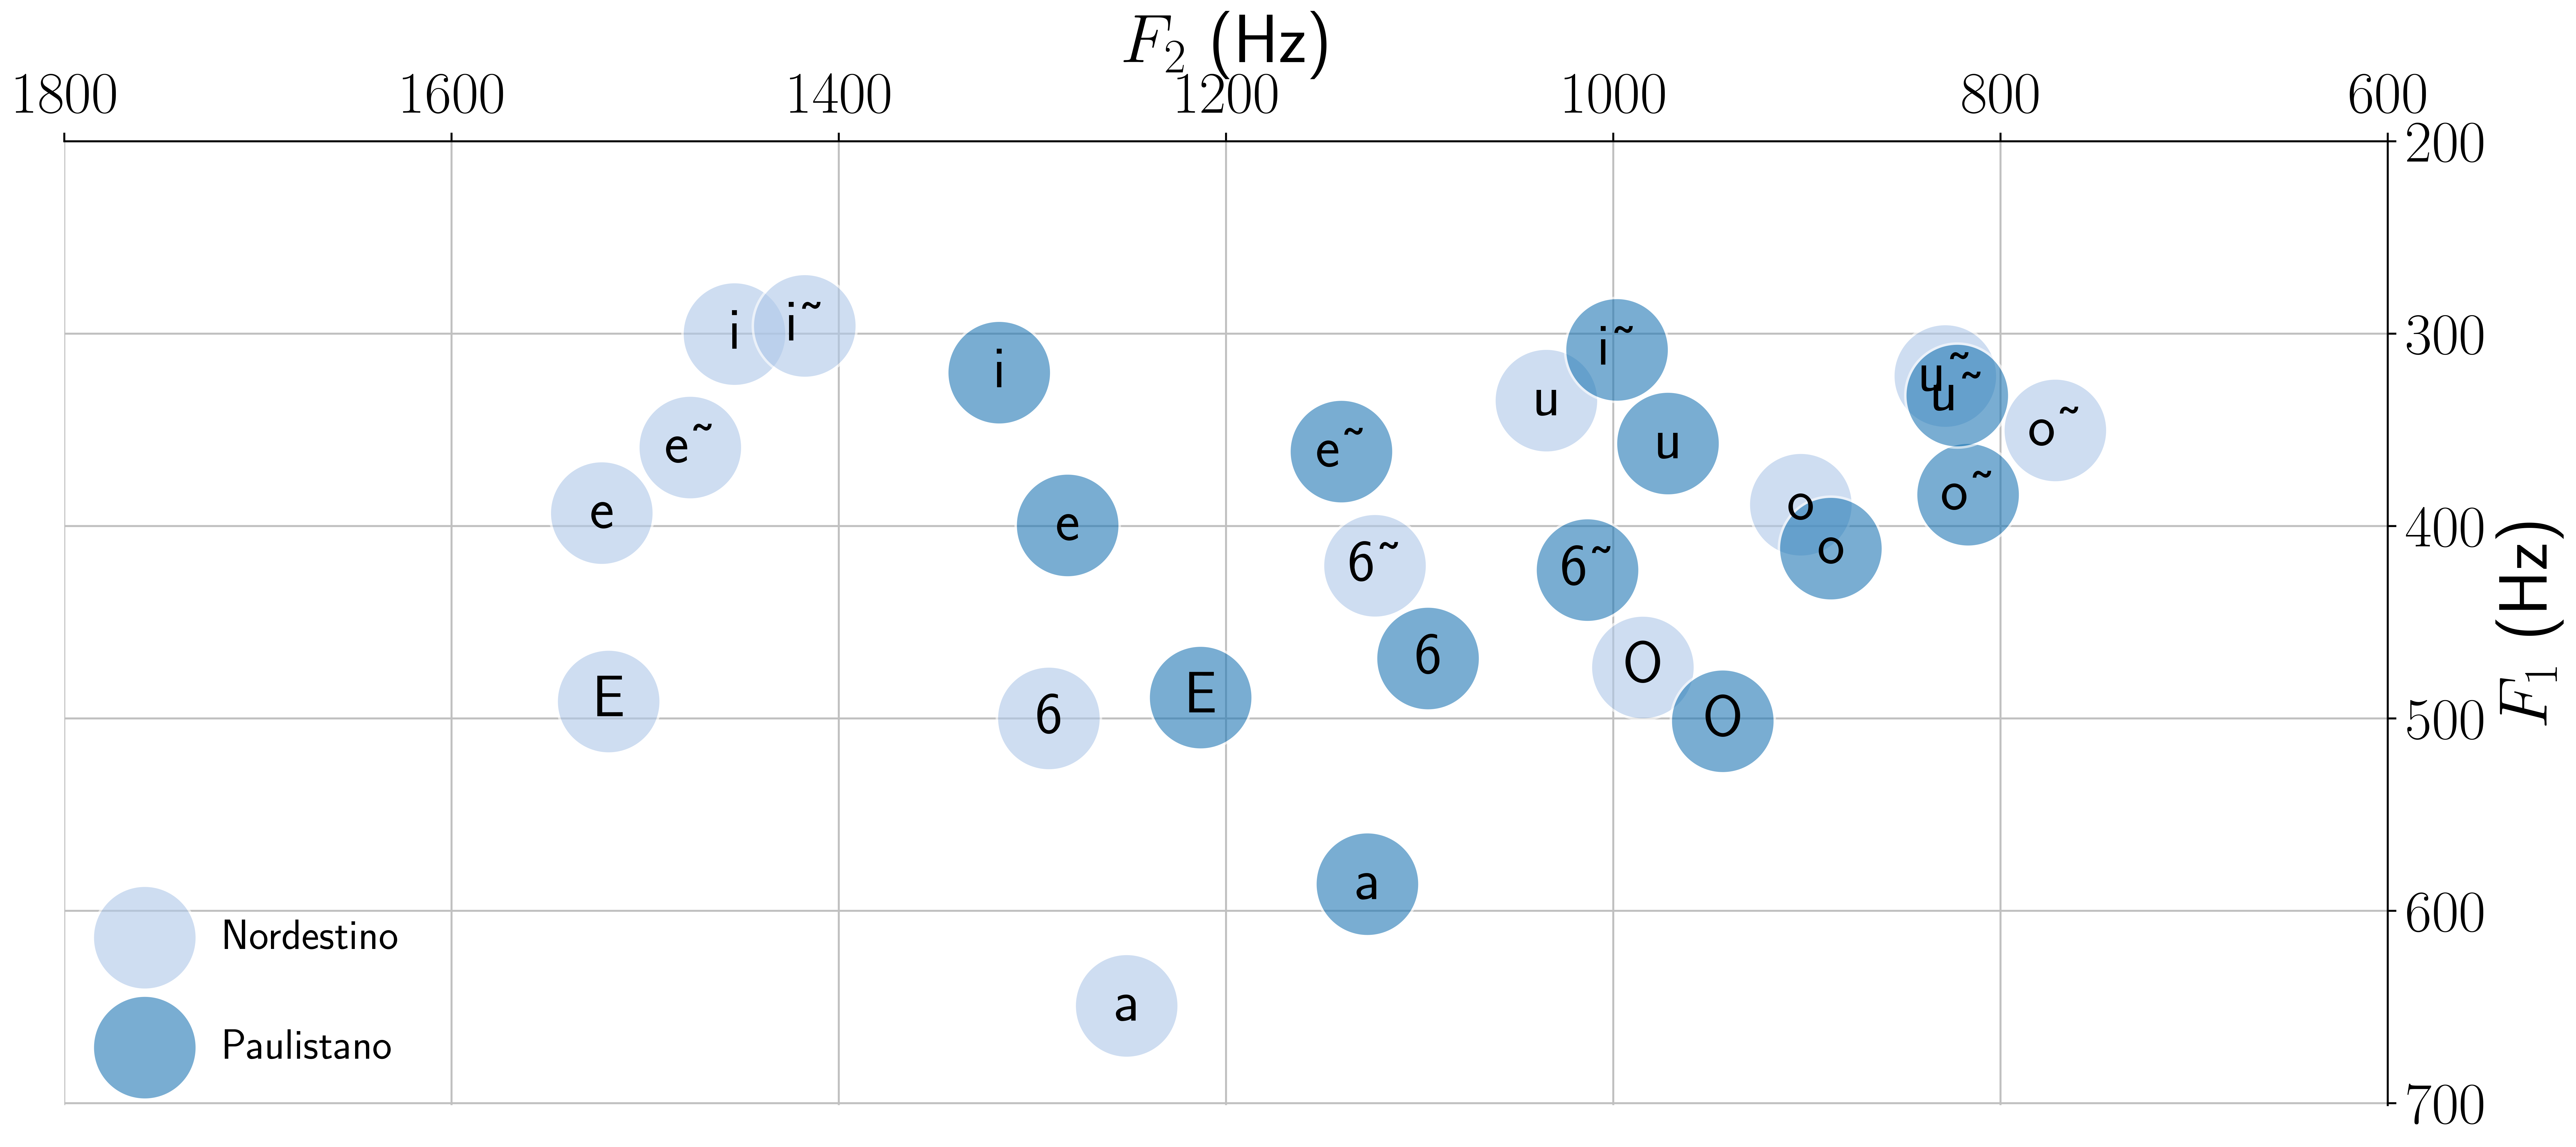
This section describes notable differences between NRD and PLST vowels production. Figure 8 compares their formants, showing several shifts in both and .
Figure 8.
Vowel plane, comparing NRD to PLST.
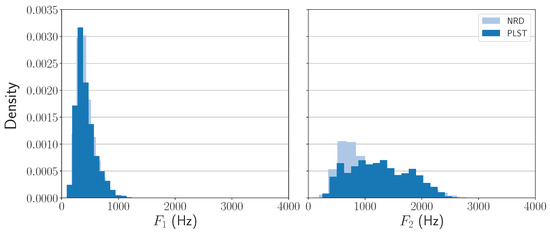
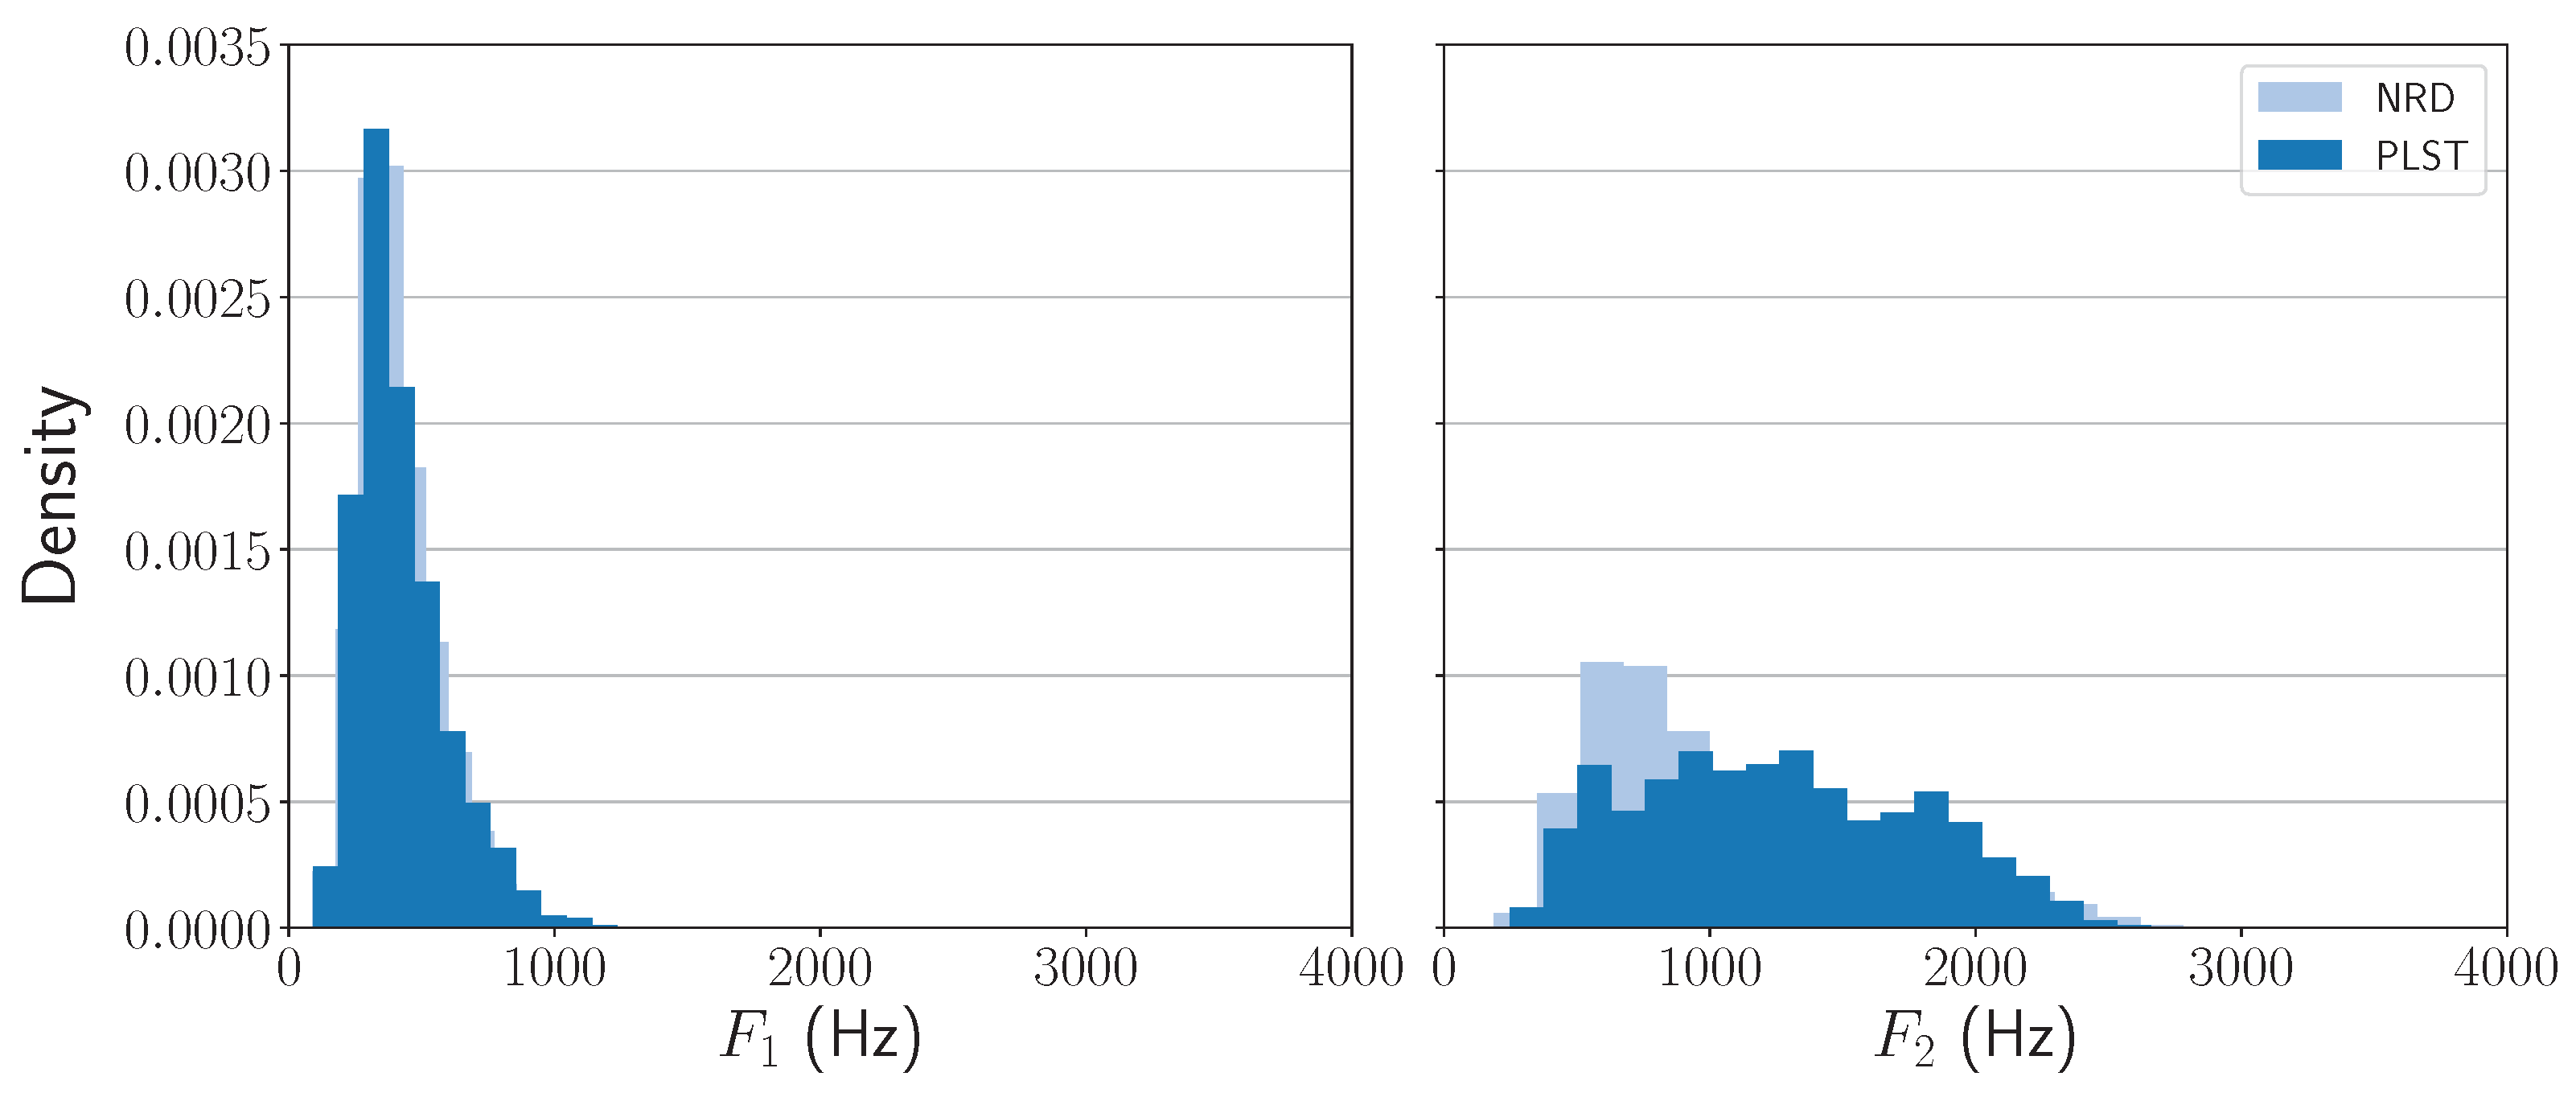
The formant distributions appear to be similar across the two accents, as illustrated in Figure 9. To assess potential differences, a bias-corrected and accelerated bootstrap analysis (SciPy stats module.) was performed for the NRD values using 5000 resamples, a 95% confidence interval, and the median as the statistic. The resulting confidence interval ranged from 377.41 to 384.39 Hz, with a standard deviation of 1.80 Hz. The PLST median was 385.18 Hz, falling outside the NRD confidence interval, suggesting a significant difference between the accents for this measure.
Figure 9.
NRD and PLST formants distributions. NRD with mean 423.3, and PLST with mean 413.6, . NRD with mean 12.2, and PLST with mean 1060.6, .
The same procedure was applied to and intensity (dB), with the results summarized in Table 4. The PLST median for falls outside the NRD confidence interval, indicating a difference between the accents. In particular, PLST speakers tend to produce vowels with an approximately 300 Hz lower than that of NRD speakers. In contrast, the PLST median is close to the upper bound of the NRD confidence interval, and the observed difference does not provide sufficient evidence of a significant difference for this feature. Overall, PLST speakers tend to produce vowels with lower intensity, with a median approximately 4.4 dB lower than that of NRD speakers.
Table 4.
Bootstrapping results for NRD.
To apply the tests, each feature was bootstrapped and subsequently combined across vowels. The bootstrapping settings were preserved, except that the sampling method was replaced with basic. This was necessary due to low variance, which is worsened when isolated per vowel. That smaller variation also causes a “Degenerate Distribution” (A degenerate distribution is a probability distribution with support only at a single point.) issue with the bias-corrected and accelerated method. The confidence intervals, standard deviation, and Mdn. of PLST for each vowel is available at Table 5 and Table 6.
Table 5.
Vowel length, fundamental frequency (), and first formant () statistics for NRD and PLST. Values are reported as bootstrap confidence intervals (CI), standard deviation (), and PLST median (Mdn.). Values in bold are significant differences between the two accents.
Table 6.
Second formant () and intensity statistics for NRD and PLST. Values are reported as bootstrap confidence intervals (CI), standard deviation (), and PLST median (Mdn.). Values in bold are significant differences between the two accents.
The PLST /ẽ/ is often 10 ms (12.5%) longer than NRD. This small difference, and the other vowels medians falling within the confidence intervals, is likely due to the tool used for extracting the phonemes: the Montreal Forced Aligner. Since it was the same tool and model across all phonemes and accents, they will tend to have a similar or fixed length. In contrast, the other features are much less dependent on the tool, being more related to the speaker characteristics.
The fundamental frequency has demonstrated its ability to distinguish between speakers in several previous studies [15]. In this study, except for /ĩ/ and /õ/, all PLST medians lie outside the confidence intervals. For these vowels, PLST exhibits higher values than NRD, with increases ranging from 3.4% to 16.8% on average.
Formant frequencies are another set of features that distinguish the two accents. The PLST median falls outside the NRD confidence interval for every oral vowel except /ɔ/. Table 5 and Table 6 also indicate differences in the first formant (). However, no differences in the medians are observed for any of the nasal vowels.
The second formant () exhibits a substantially larger difference, with an average median difference of 384.5 Hz, making it a more prominent distinguishing feature than fundamental frequency and . Differences in are observed for all oral vowels and for three of the five nasal vowels. Similarly, the PLST vowel intensity is consistently outside the NRD confidence intervals. On average, PLST speakers produce vowels with a median intensity approximately 3.62 dB lower than that of NRD speakers.
The data presented in this and the previous sections provide evidence of differences between the NRD and PLST accents in both vowel and consonant features. The corresponding results are summarized in Table 4. When considering the combined set of features, the first formant () falls within the confidence interval when the standard deviation is taken into account, whereas the remaining features show significant differences between the accent medians.
In the following analysis, the features extracted from rhotics and vowels are combined to evaluate the effectiveness of clustering techniques in distinguishing between the NRD and PLST accents.
3.3. Accent Clustering
This section leverages the vowel information from the acoustic analysis to cluster the PT-BR accents. The hyperparameters and results are described in Table 7, Table 8 and Table 9.
Table 7.
Unsupervised accent clustering results for BIRCH. Values are reported as mean ± standard deviation () over the evaluated runs. Bold indicates the best configuration.
Table 8.
Unsupervised accent clustering results for Gaussian Mixture Model (GMM). Values are reported as mean ± standard deviation () over the evaluated runs. Bold indicates the best configuration.
Table 9.
Unsupervised accent clustering results for K-Means. Values are reported as mean ± standard deviation () over the evaluated runs. Bold indicates the best configuration.
4. Discussion and Conclusions
The results indicate that K-Means with provides the most effective unsupervised clustering configuration among the models evaluated. Although the GMM with 38 components achieves comparable performance, the difference between the two approaches is marginal. Additionally, it is important to highlight that increasing the number of clusters also increases the homogeneity score. Therefore, the choice is also based on the rand score results.
Consequently, the simpler K-Means algorithm is preferred, as it provides similar clustering performance with lower model complexity and fewer assumptions regarding the underlying data distribution. Furthermore, both K-Means and GMM attain their optimal performance with 38 clusters/components, which may indicate an over-segmentation of the data. This result suggests that the acoustic features may capture finer-grained phonetic variation than the 16 accent categories identified by the Atlas Linguístico do Brasil.
These findings indicate a higher degree of variation in the acoustic realisation of vowels and rhotics in Brazilian Portuguese (PT-BR) than might be expected from the accent descriptions provided by [5]. This discrepancy may reflect differences in the objectives and methodologies of the two approaches. While the Atlas Linguístico do Brasil focuses primarily on geographic and linguistic variation, the present study relies on acoustic characteristics extracted from spontaneous speech. Consequently, the clusters identified here may capture finer-grained phonetic variation that does not necessarily correspond directly to traditionally defined geographic accents. A more systematic exploration of the TTBAcc dataset, including a more balanced distribution of speakers and regions, could further clarify these patterns and potentially lead to more consistent clustering results.
Overall, the findings suggest that emerging and endangered accents can be investigated by combining acoustic analysis with unsupervised clustering techniques. The proposed approach provides a data-driven alternative for identifying patterns of accent variation without requiring predefined accent labels. Nevertheless, several limitations remain. In future work, the authors intend to increase the number of speakers and apply speaker anonymization techniques to reduce the possibility that speaker-specific characteristics are captured by the clustering process and subsequently interpreted as accent-related variation. This is particularly important because acoustic measures may reflect individual speaker characteristics, such as vocal tract differences, speaking style, or recording conditions, in addition to regional accent.
Although the results are promising, the methodology can also be further refined. The combination of acoustic analysis and accent clustering proved useful, but the overall process is relatively complex and involves several stages in which methodological choices may influence the final clusters. Future studies could therefore investigate a simplified and more robust version of the proposed pipeline, including a more consistent statistical analysis approach using a Linear Mixed-Effects Model, normalization procedures, and validation strategies. Such improvements could make the approach easier to reproduce and facilitate comparisons across datasets. Furthermore, incorporating evaluation metrics can contribute to a more comprehensive comparison between the methods, primarily by reducing the dependency of homogeneity score on the number of clusters.
Ultimately, this approach could contribute to the documentation and monitoring of the evolution of PT-BR and other languages. By combining acoustic measurements with unsupervised learning, it may be possible to identify subtle changes in pronunciation and detect emerging patterns of linguistic variation that are not yet represented in traditional dialectological classifications.
Author Contributions
Conceptualization, T.A.d.L. and M.C.d.C.A.; Methodology, T.A.d.L. and M.C.d.C.A.; Software, T.A.d.L.; Validation, T.A.d.L. and M.C.d.C.A.; Formal Analysis, T.A.d.L.; Investigation, T.A.d.L.; Resources, T.A.d.L. and M.C.d.C.A.; Data Curation, T.A.d.L.; Writing—Original Draft Preparation, T.A.d.L.; writing—Review and Editing, T.A.d.L. and M.C.d.C.A.; Visualization, T.A.d.L.; Supervision, M.C.d.C.A.; Project Administration, M.C.d.C.A.; All authors have read and agreed to the published version of the manuscript.
Funding
This research received no external funding.
Data Availability Statement
The raw data supporting the conclusions of this article will be made available by the authors on request.
Conflicts of Interest
The authors declare no conflicts of interest.
References
- Michaelis. Definição de “Sotaque”. In Dicionário Brasileiro da Língua Portuguesa; Editora Melhoramentos: Sao Paulo, Brazil, 2022. [Google Scholar]
- Callou, D. Iniciação à Fonética e à Fonologia; Jorge Zahar: Rio de Janeiro, Brazil, 1990. [Google Scholar]
- Veliche, I.E.; Fung, P. Improving Fairness and Robustness in End-to-End Speech Recognition Through Unsupervised Clustering. In Proceedings of the ICASSP 2023–2023 IEEE International Conference on Acoustics, Speech and Signal Processing (ICASSP), Rhodes Island, Greece, 4–10 June 2023; pp. 1–5. [Google Scholar] [CrossRef] [Scilit]
- Layton, B. Coptic in 20 Lessons; Peeters Publishers: Leuven, Belgium, 2007; p. 210. [Google Scholar]
- Cardoso, S.A.M.; Mota, J.A.; Aguilera, V.d.A.; Aragão, M.d.S.S.d.; Isquerdo, A.N.; Altenhofen, C.V.; Razky, A.; Margotti, F.W. Atlas Linguístico do Brasil; EDUEL: Delhi, India, 2014; Volume 1. [Google Scholar]
- Hegde, S.; Shetty, S.; Rai, S.; Dodderi, T. A Survey on Machine Learning Approaches for Automatic Detection of Voice Disorders. J. Voice 2019, 33, 947.e11–947.e33. [Google Scholar] [CrossRef] [Scilit] [PubMed]
- Labov, W. Contraction, Deletion, and Inherent Variability of the English Copula. Language 1969, 45, 715. [Google Scholar] [CrossRef] [Scilit]
- dos Santos, P.F. Da Região da Costa Verde ao Noroeste Fluminense: A Prosódia dos Enunciados Interrogativos Totais do Rio de Janeiro. Master’s Thesis, Universidade Federal do Rio de Janeiro, Rio de Janeiro, Brazil, 2016. [Google Scholar]
- Salifu, A.; Mensah, H.N.; Tchao, E.T.; Ibrahim, A.M.; Acheampong, F.A.; Kponyo, J.J.; Agbemenu, A.S. A systematic review of accent classification techniques and datasets for inclusive speech recognition. Int. J. Data Sci. Anal. 2026, 21, 12. [Google Scholar] [CrossRef] [Scilit]
- Aguiar, T.; Da Costa-Abreu, M. Automatic Collection of Transcribed Speech for Low Resources Languages. In Proceedings of the 2023 IEEE 13th International Conference on Pattern Recognition Systems (ICPRS), Guayaquil, Ecuador, 4–7 July 2023; pp. 1–6. [Google Scholar] [CrossRef] [Scilit]
- Ramsammy, M.; Raposo de Medeiros, B. Rhotic Variation in Brazilian Portuguese. Languages 2024, 9, 364. [Google Scholar] [CrossRef] [Scilit]
- University of Manitoba. Identifying Sounds in Spectrograms. 2005. Available online: https://home.cc.umanitoba.ca/~krussll/phonetics/acoustic/spectrogram-sounds.html (accessed on 29 November 2022).
- de Lima, M.F.B.; de Camargo, Z.A.; Ferreira, L.P.; Madureira, S. Qualidade vocal e formantes das vogais de falantes adultos da cidade de João Pessoa. Rev. CEFAC 2007, 9, 99–109. [Google Scholar] [CrossRef] [Scilit]
- dos Santos, G.B. Análise Fonético-Acústica das Vogais Orais e Nasais do Português: Brasil e Portugal. Ph.D. Thesis, Universidade Federal de Goiás, Goiânia, Brazil, 2013. [Google Scholar]
- Fatima, N.; Zheng, T.F. Short Utterance Speaker Recognition A research Agenda. In Proceedings of the International Conference on Systems and Informatics, Yantai, China, 19–20 May 2012; ICSI; pp. 1746–1750. [Google Scholar] [CrossRef] [Scilit]

Disclaimer/Publisher’s Note: The statements, opinions and data contained in all publications are solely those of the individual author(s) and contributor(s) and not of MDPI and/or the editor(s). MDPI and/or the editor(s) disclaim responsibility for any injury to people or property resulting from any ideas, methods, instructions or products referred to in the content. |
© 2026 by the authors. Licensee MDPI, Basel, Switzerland. This article is an open access article distributed under the terms and conditions of the Creative Commons Attribution (CC BY) license.