


Abstract
Prestressed steel strands transfer structural loads through complex anchorage systems. During through-anchorage ultrasonic guided-wave inspection, strong reflections generated in the anchorage segment may obscure defect-related echoes and create blind zones in the received signals. This study investigates the generation mechanisms of these anchorage-induced reflections and evaluates the relative roles of stress-induced acoustoelastic impedance variation and load-dependent interfacial contact evolution. An acoustoelastic finite element model is first used to estimate the reflection contribution caused by stress concentration alone. The results show that the stress-induced reflection remains weak, with the reflection coefficient remaining below 0.0125 even at 80% of the ultimate tensile strength. A sensitivity-based equivalent spring-contact model is then employed to examine whether effective strand–wedge and wedge–anchorage interfacial stiffness variations can generate anchorage reflections with comparable order of magnitude and load-dependent trends. The contact-based model produces much stronger reflections, and roughness-sensitivity analysis indicates that the load-dependent trend is not governed by a single nominal roughness assumption. Multi-specimen stepwise tensioning experiments show repeatable load-dependent reflection trends at both 80 kHz and 240 kHz. The results therefore suggest that, within the investigated geometry and loading range, interfacial contact evolution is a more plausible dominant contributor to anchorage-induced guided-wave reflections than stress-induced acoustoelastic impedance variation. This work focuses on the physical origin of anchorage reflections and provides a mechanistic basis for interpreting anchorage-induced interference in future through-anchorage defect detection.
1. Introduction
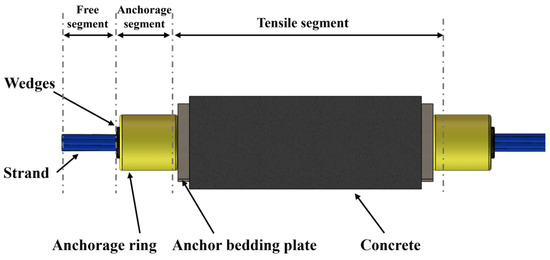
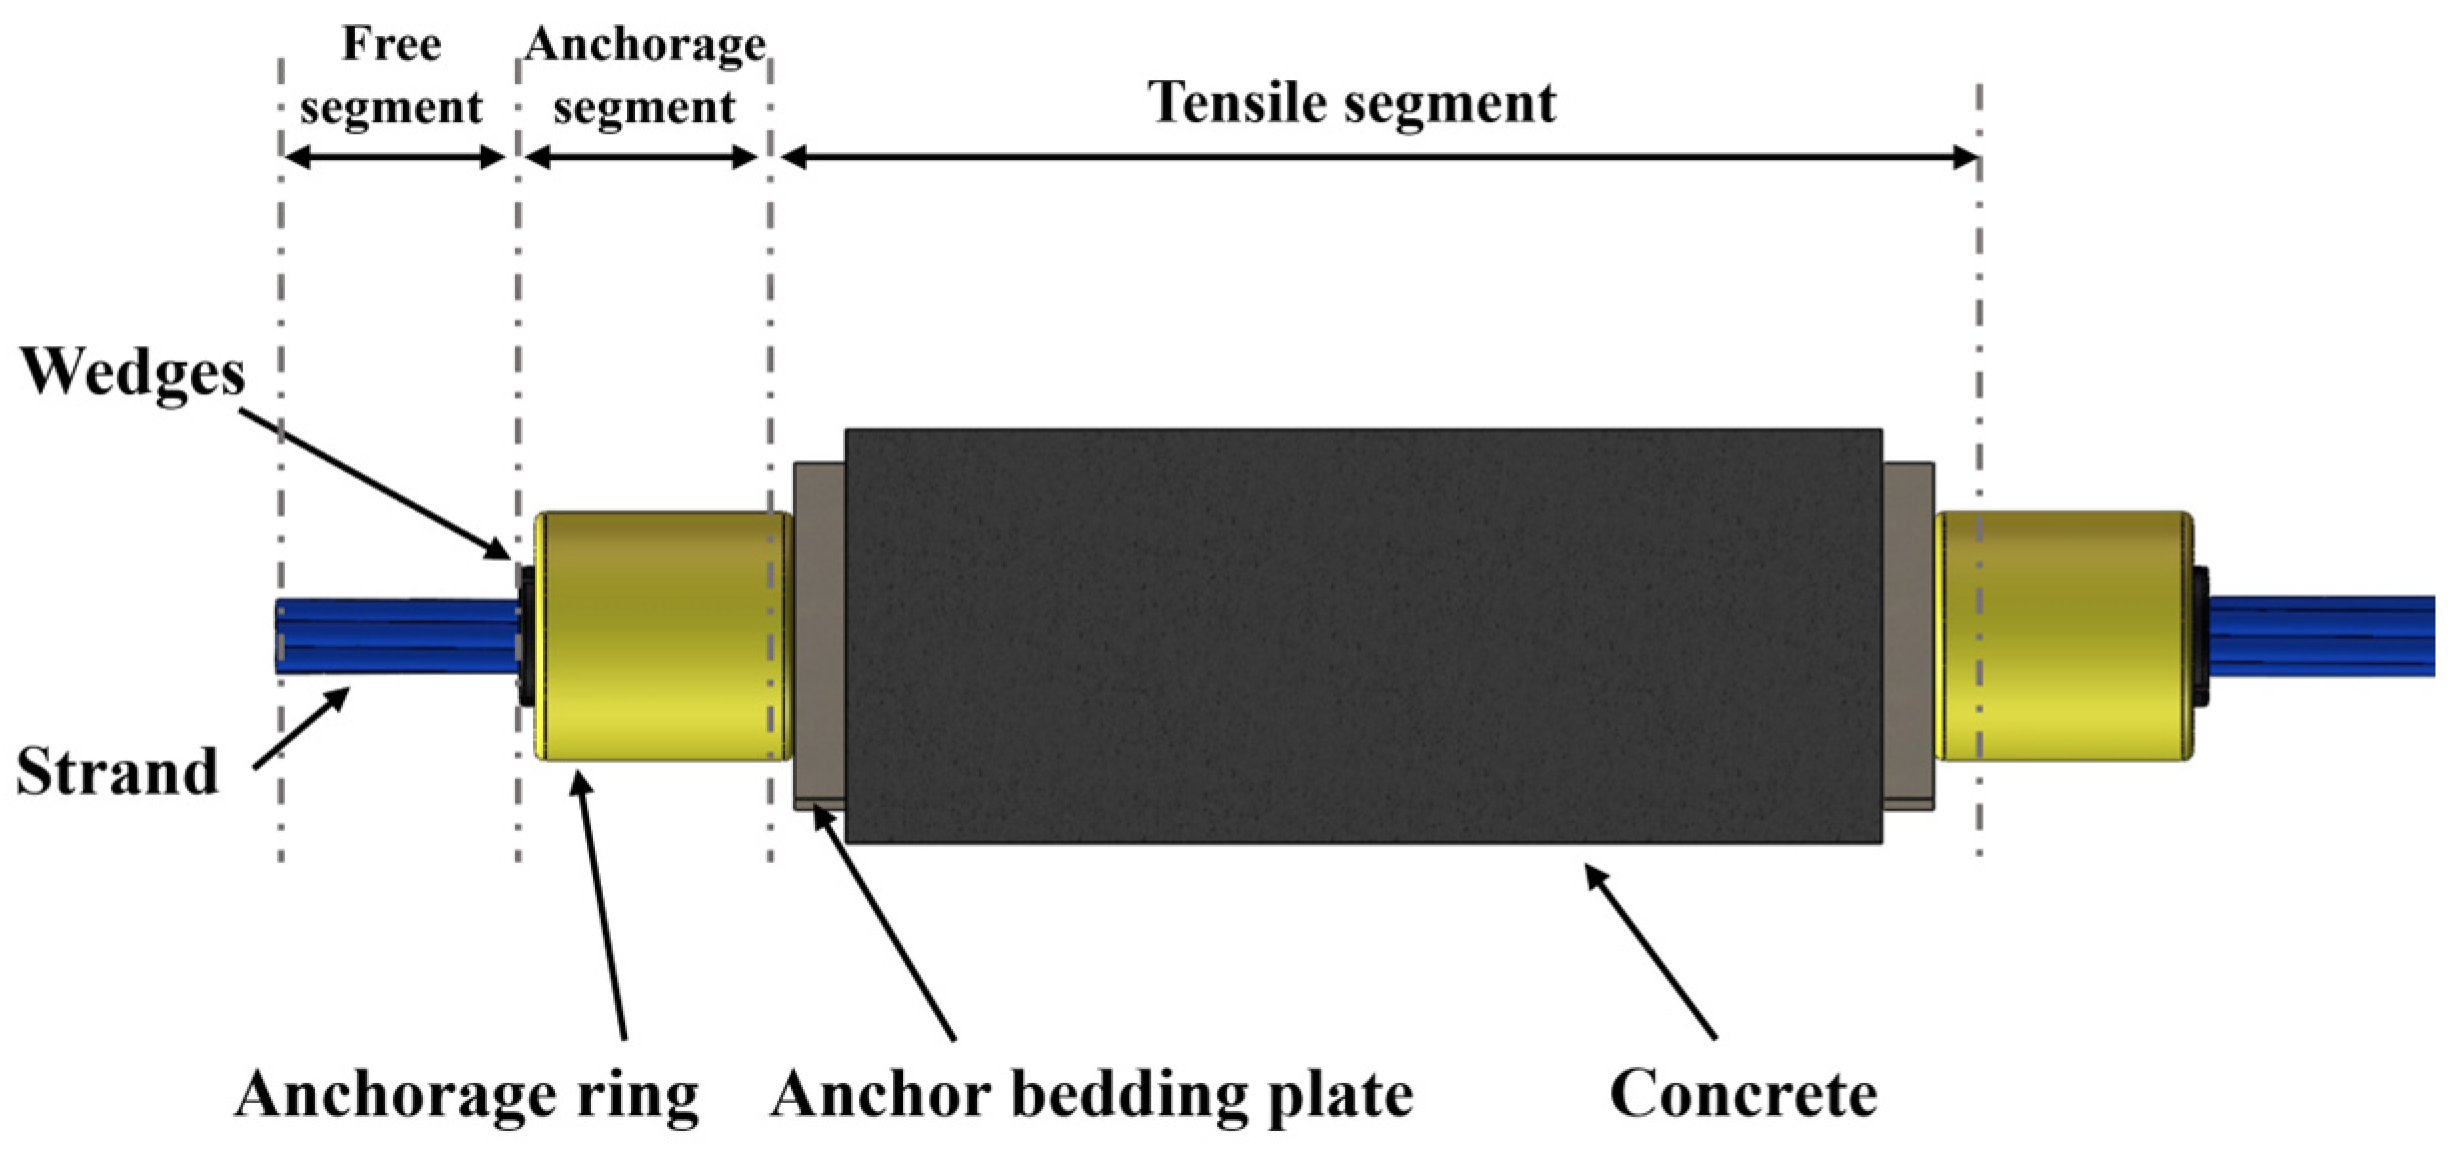
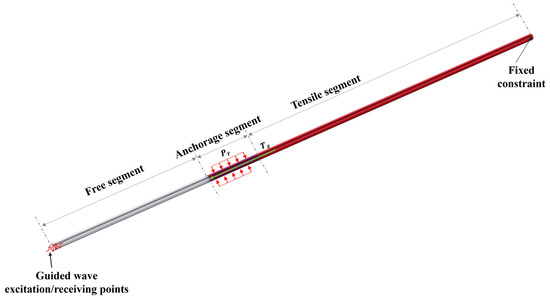
Prestressed anchorage structures are widely used in long-span bridges, high-rise buildings, slope reinforcement systems, rail transit structures, and nuclear power facilities because of their high load-bearing capacity and structural reliability [1]. A typical prestressed anchorage assembly consists of a free segment, an anchorage segment, and a tension segment, as shown in Figure 1. The prestressed strand is the main load-carrying component, whereas the anchorage ring and wedges provide the mechanical constraint required for force transfer. In practical structures, the tension segment of the strand is usually embedded in concrete, grout, or protective ducts, making direct inspection difficult. Once corrosion, wire breakage, or local section loss occurs in this hidden region, the load-bearing performance of the entire anchorage system may be severely reduced [2].
Figure 1.
Anchorage structure of prestressed steel strand.
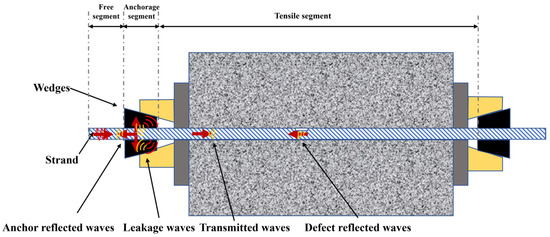
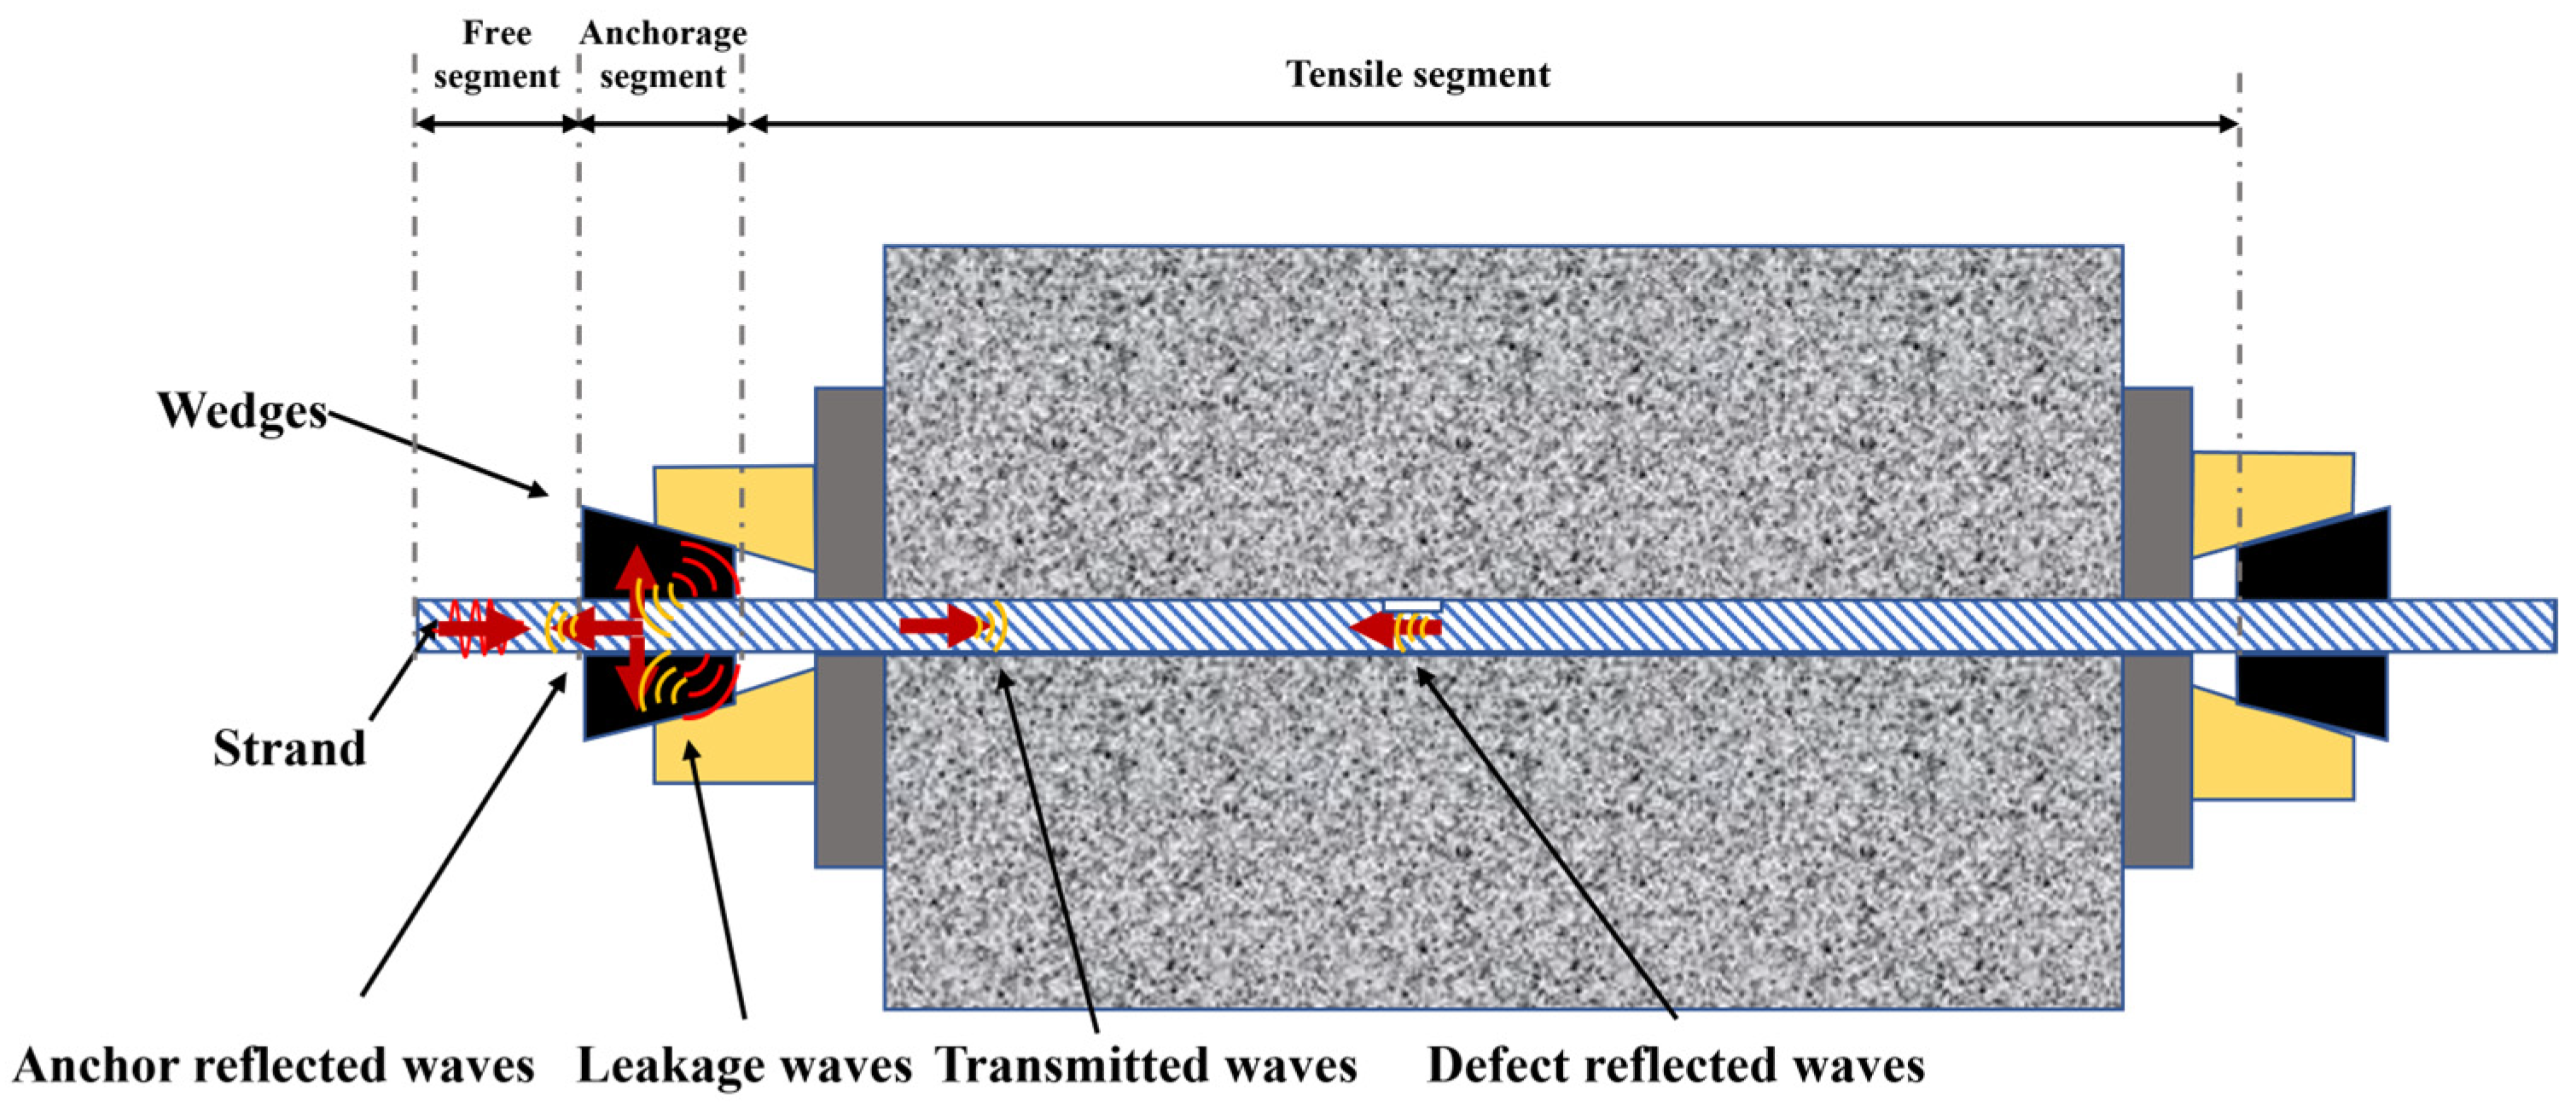
Various non-destructive testing (NDT) techniques have been developed for the evaluation of prestressed strands and anchorage systems, including magnetic flux leakage (MFL) testing, acoustic emission (AE) testing, radiographic testing (RT), and ultrasonic testing [3]. Specifically, MFL testing [4,5] utilizes magnetic sensors to scan encased strands through concrete, identifying corrosion by capturing magnetic flux leakage at defect locations. Nevertheless, this method is constrained by its scanning mode and sensor lift-off effects. It is primarily suitable for small-scale concrete beams and remains difficult to apply to complex structures like slope anchors. AE testing [6,7,8] employs acoustic sensors to capture characteristic signals generated during corrosion or wire breakage. This approach requires a large sensor array, and the captured data is often contaminated by environmental noise, complicating the extraction of accurate results. Although RT [9] can improve the detection of hidden damage, the necessary equipment is often bulky and involves cumbersome operational safety procedures. Ultrasonic NDT, including both bulk wave and guided wave approaches, offers an attractive alternative because elastic waves are sensitive to defects, interfaces, and changes in mechanical properties. Bulk wave ultrasonic inspection has been investigated for multilayer concrete/steel/concrete structures. For example, Raveendran [10] studied ultrasonic inspection of concrete/steel/concrete pipes affected by corrosion, where bulk waves, guided waves, and vibration techniques were considered for detecting holes and assessing the remaining steel thickness from the outside of the pipe. Their work showed that bulk-wave measurements through concrete, combined with signal-processing strategies such as pulse compression, can provide useful information when a suitable through-thickness wave path is available. This indicates that bulk-wave inspection is a valuable option for some concrete–steel composite structures. However, the through-anchorage inspection configuration considered in the present study is different from conventional bulk-wave inspection through concrete. In practical prestressed anchorage systems, a bulk wave excited from the outside would have to propagate through concrete or anchorage components and then transmit across concrete–steel, steel–anchorage, or imperfect contact interfaces before reaching the target strand. At the frequencies relevant to millimeter-scale strand and anchorage features, scattering and attenuation in concrete, together with insufficient transmission across dissimilar material interfaces, may reduce the signal-to-noise ratio and complicate path interpretation. Recent studies on ultrasonic concrete inspection have shown that modelling ultrasonic propagation in concrete is challenging because concrete contains aggregates, voids, pores, interfacial transition zones, and embedded metallic objects [11,12]. Multiple scattering from embedded inclusions or aggregate-like scatterers can also affect the effective wave propagation characteristics in concrete-like media [13]. Therefore, bulk-wave inspection was not pursued in the present study. Instead, this work focuses on guided waves excited from the accessible free end of the strand, which offer a relatively direct propagation path along the load-bearing component itself. Ultrasonic guided waves have been widely studied for the inspection of steel strands because they can propagate over relatively long distances and can be excited from a single accessible point [14,15,16]. In the through-anchorage configuration, as illustrated in Figure 2, guided waves are excited at the end face of the free segment and must pass through the anchorage segment before entering the hidden tension segment. Defect-related echoes from the tension segment must also traverse the anchorage region before being received. This propagation process is strongly influenced by the anchorage assembly. In particular, strong reflected waves can be generated at the anchorage segment and may persist in the free segment as multiple echoes. These anchorage-induced echoes can overlap with or mask defect-related reflections, thereby forming detection blind zones and reducing the reliability of through-anchorage guided-wave inspection. The generation of anchorage-induced reflections is associated with the complex mechanical state of the anchorage segment. On the one hand, tensile loading produces localized stress concentration in the strand and anchorage region. According to acoustoelastic theory, stress can change the effective elastic constants and wave velocity of the material, leading to local acoustic-impedance variation. On the other hand, the wedge-type anchorage system contains strand–wedge contacts and wedge–anchorage contacts. As the tensile load increases, these interfaces become progressively tighter, changing the effective boundary condition of the strand-guided wave from a nearly free state to an elastically constrained and mass-loaded state. Both stress-induced impedance variation and load-dependent interfacial contact evolution may therefore contribute to the reflected echoes observed in the free segment.
Figure 2.
Schematic of guided-wave propagation paths in the through-anchorage. The arrows indicate the propagation directions of the anchorage-reflected waves, leakage waves, transmitted waves, and defect-related waves.
Extensive research has investigated the effects of stress and interfacial contact on through-anchorage wave propagation. Huynh [17] utilized piezoelectric elements to monitor the stress state of anchorage devices, confirming that prestress loss leads to variations in interfacial contact stiffness and electromechanical impedance responses. Dang [18] observed that strand fracture redistributes the stress field, suggesting that stress state changes can serve as indicators for assessing strand damage. Drinkwater [19] explored the low-frequency ultrasonic propagation across solid–solid interfaces, establishing that frequency and contact pressure jointly regulate interfacial reflectivity. Mo [20] established a correlation between load force and signal energy using a time-reversal method, quantifying the regulatory effect of interfacial stiffness on ultrasonic reflections. Gonzalez-Valadez [21] employed spring models to characterize rough contact interfaces, proposing that the ratio of normal to tangential stiffness is intrinsically linked to surface roughness. Qian [22] demonstrated that reflection coefficients and nonlinear stiffness decrease nonlinearly with increasing interface pressure, stabilizing after reaching a specific threshold. Wang [23] further showed that the energy distribution of the L(0,1) mode is frequency-dependent; high-frequency L(0,1) waves exhibit stronger spatial concentration in the outer spiral wires, which allows more energy to traverse the anchorage while reducing boundary-sensitive reflected energy. Finally, Zima [24,25] analyzed the impact of geometry and concrete debonding, noting that debonding distorts stress distribution and results in abnormal interfacial stiffness, which in turn alters mode conversion and diffraction behavior.
Despite these advances, the physical origin of the strong reflections generated in prestressed strand anchorage segments remains insufficiently clarified. In particular, it is still unclear whether the observed anchorage echoes are mainly caused by stress-induced acoustoelastic impedance variation or by load-dependent changes in interfacial contact stiffness. The present study addresses this issue using a hierarchical modelling and experimental strategy. First, an acoustoelastic finite element model is used to estimate whether stress-induced impedance variation alone can generate reflection coefficients comparable to those observed in through-anchorage inspection. Second, an equivalent spring-contact model is used as a sensitivity-based representation to examine whether load-induced changes in effective strand–wedge and wedge–anchorage interfacial stiffness can generate anchorage reflections with the observed order of magnitude and load-dependent trend. Finally, stepwise tensioning experiments on three nominally identical specimens are conducted to examine the repeatability of the load-dependent reflection trends. The objective is to identify the more plausible dominant contributor to anchorage-induced reflections under the investigated conditions. The present work does not directly quantify defect detectability; instead, it focuses on anchorage-induced reflections as a major source of interference that must be understood before through-anchorage guided-wave defect detection can be improved.
2. Theoretical Analysis
2.1. Formation of Detection Blind Zones in the Anchorage Segment
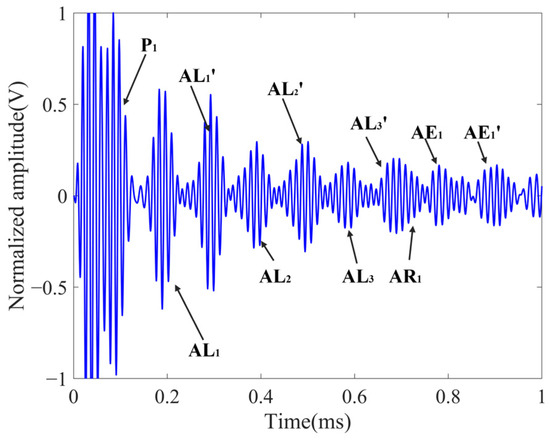
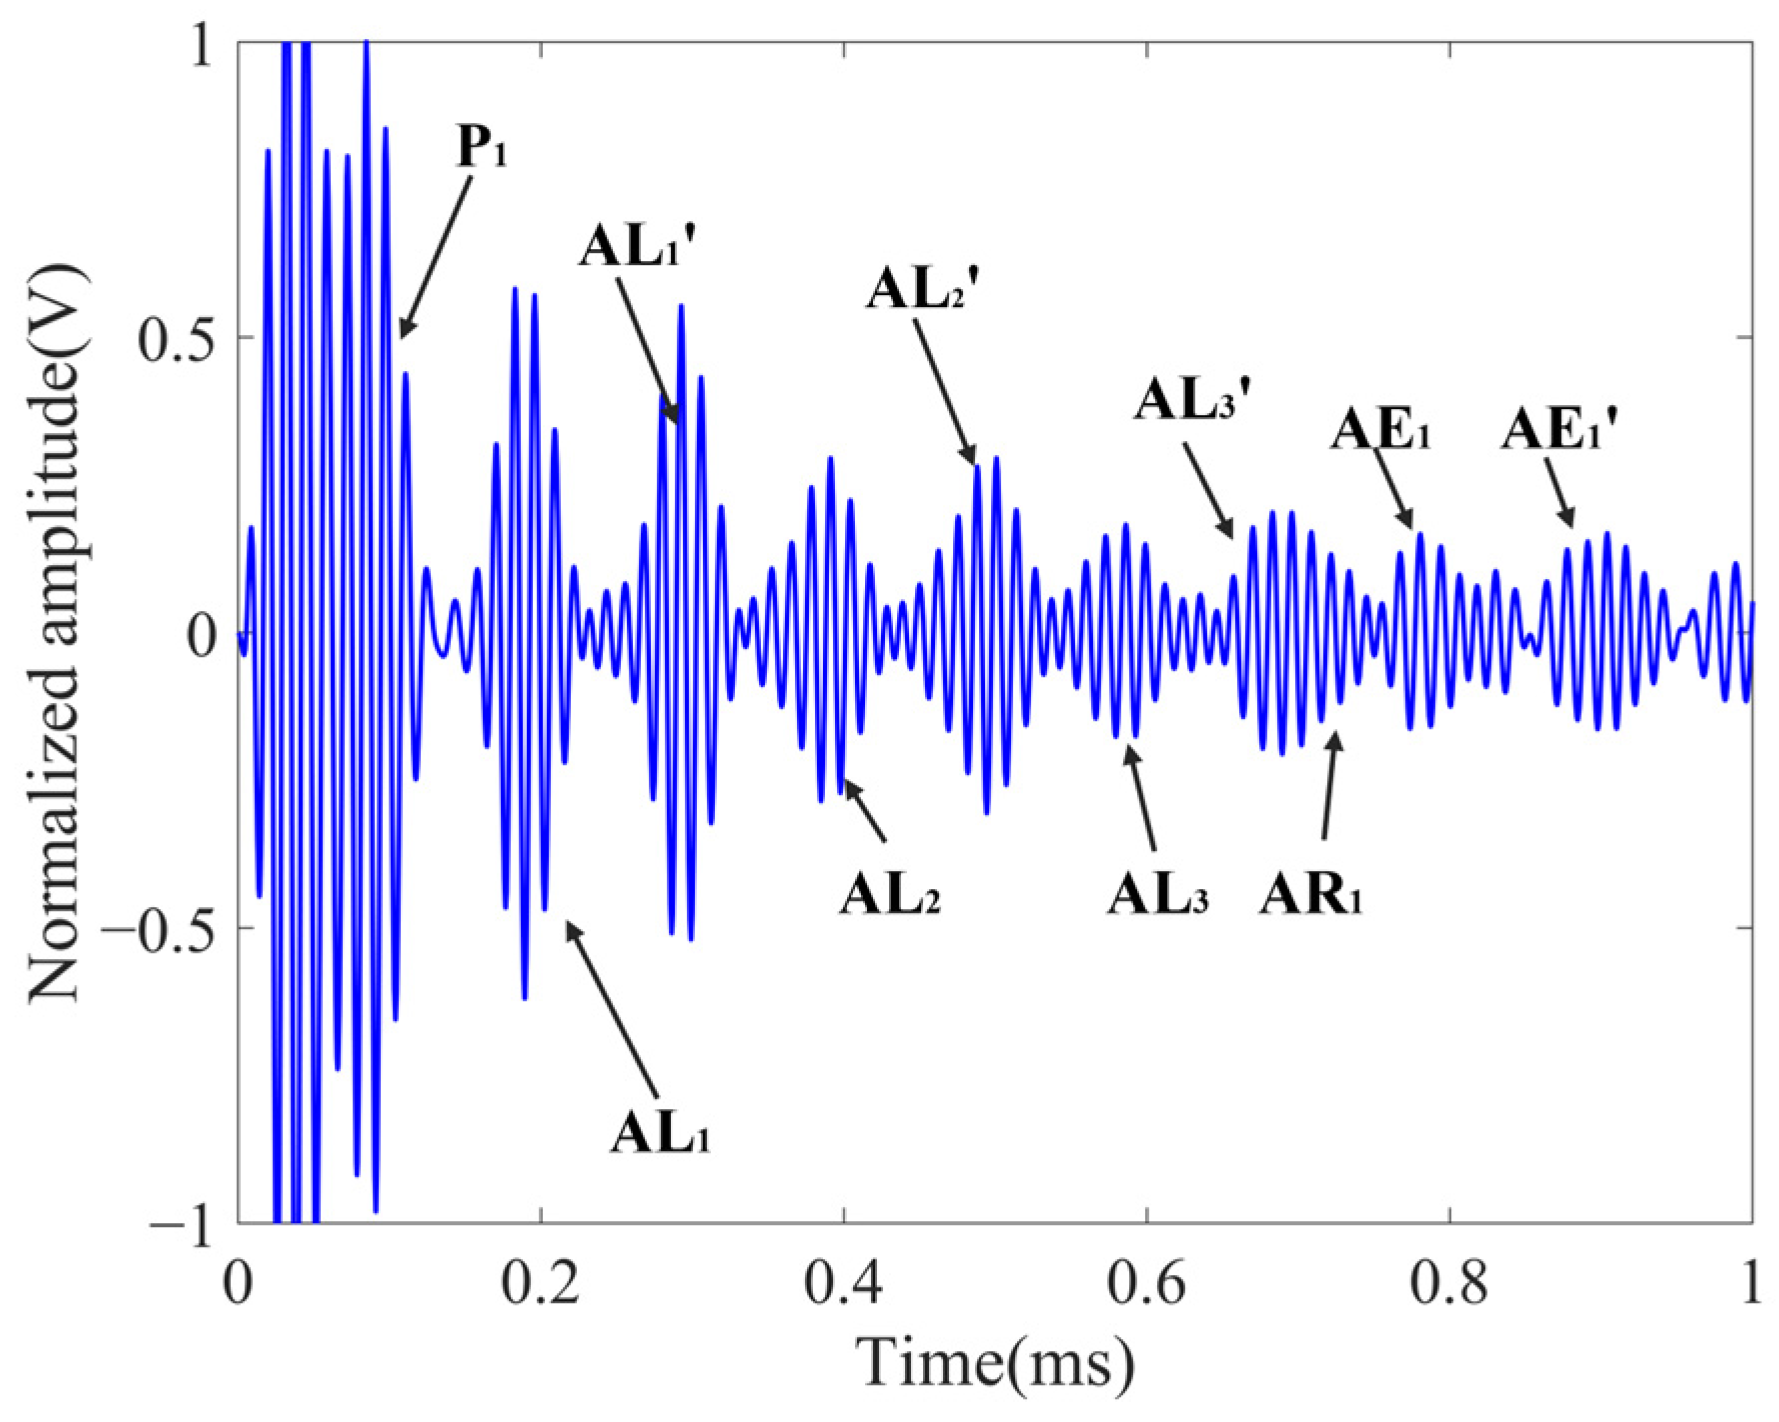
To further elucidate the detection blind zones induced by reflected echoes within the anchorage region, representative guided-wave signals for through-anchorage detection are analyzed at 80 kHz under a tensile load equivalent to 80% of the ultimate tensile strength (UTS). As illustrated in Figure 3, the captured waveform contains several discrete components. P1 denotes the direct wave signal, whereas AL1, AL2, AL3 and AR1 represent the primary reflected wave packets originating from the anchorage segment. Furthermore, AL1′, AL2′, AL3′ and AR1′ denote the secondary reflections generated when these anchorage reflections interact with the left end face of the prestressing strand, whereas AE1 and AE1′ denote the reflection from the right end face and its subsequent secondary reflection at the left end face, respectively.
Figure 3.
Time-domain waveform of guided waves in through-anchorage inspection.
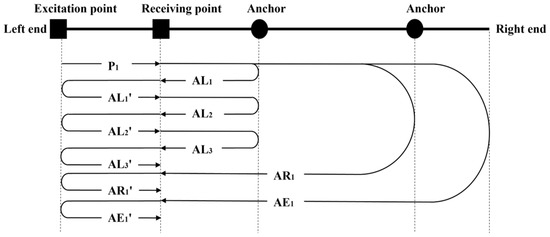
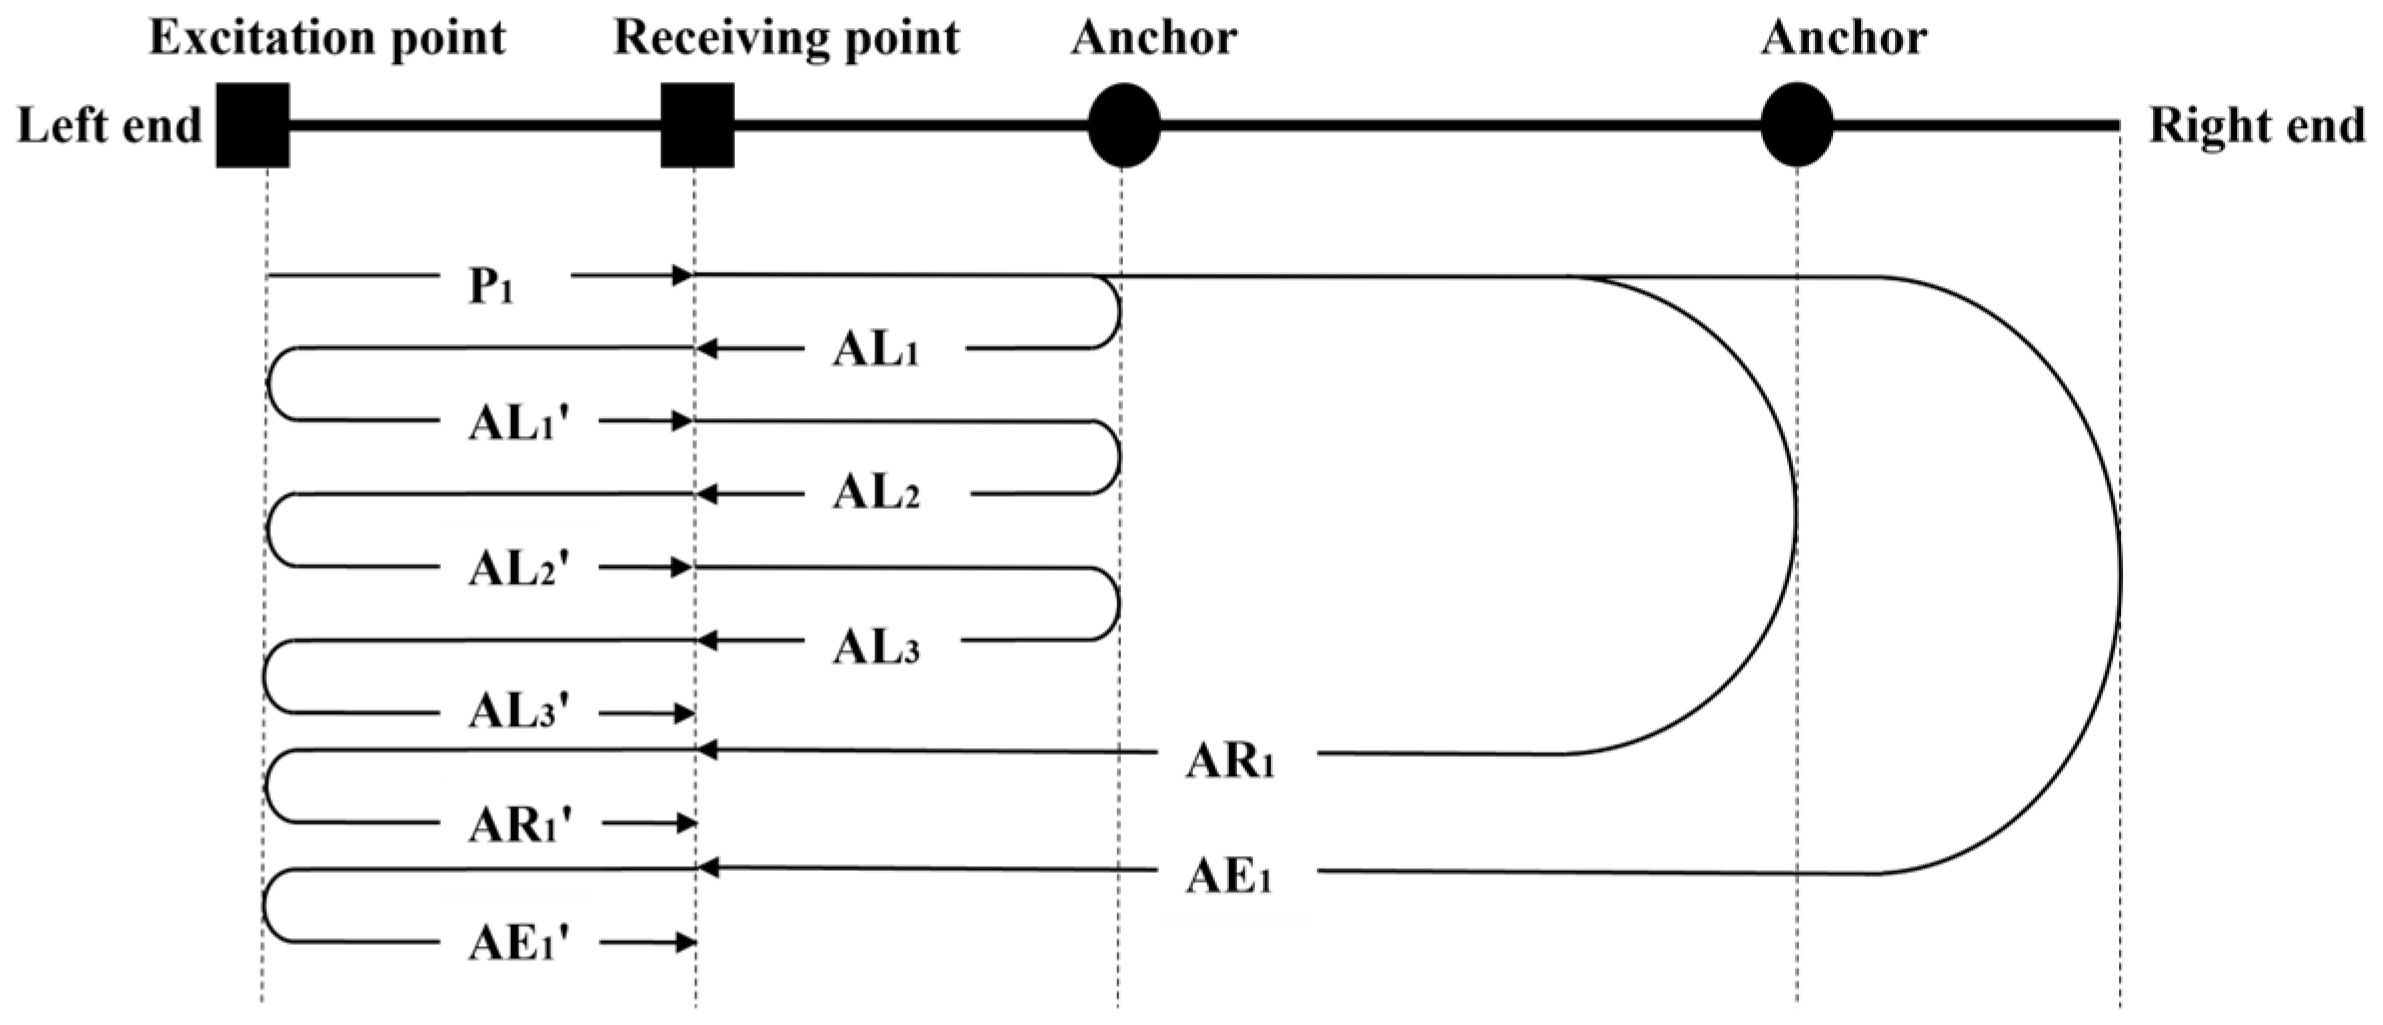
A simplified schematic diagram of the propagation path is depicted in Figure 4. The primary anchorage-reflected wave packet AL1 oscillates between the left end of the strand and the anchorage device, subsequently generating multiple echo signals, including AL2, AL3, AL1′, AL2′ and AL3′. These persistent signals interfere with the identification of defect echoes. In addition, defect-related echoes must pass through the anchorage region twice before being received, which causes additional energy loss and makes them more likely to be buried in the aliased anchorage reflections. This mechanism creates the characteristic detection blind zones in through-anchorage guided-wave inspection.
Figure 4.
Schematic of guided-wave propagation paths for through-anchorage inspection.
For quantitative comparison, the reflection coefficient of the anchorage-induced echo is defined following the amplitude-ratio concept used in through-anchorage propagation study [23]:
where R is the reflection coefficient, A0 is the envelope amplitude of the incident wave packet before interaction with the anchorage segment, and A1 is the envelope amplitude of the primary reflected wave packet generated by the anchorage segment.
In this study, A1 and A0 are extracted from predefined wave-packet windows in the received time-domain signal. The analytical envelope of the signal is first obtained, and A1 and A0 are then taken as the peak envelope values within the incident-wave and primary anchorage-reflection windows, respectively. The same window definition is maintained for all load levels at the same excitation frequency to avoid load-dependent bias in peak selection. Secondary reflections, end face reflections, and leakage-related components outside the primary reflection window are excluded from the calculation of R.
The reflection coefficients were calculated from the envelope amplitudes before waveform normalization. The normalized waveforms shown in the figures are used only for visual comparison among different load levels. When partial overlap between wave packets was unavoidable, no additional deconvolution was applied; instead, the same predefined primary-reflection window was used consistently, so that the extracted value represents the apparent peak amplitude of the primary anchorage-reflected packet under the same processing rule.
2.2. Prestressed Steel Strand Anchorage Structure
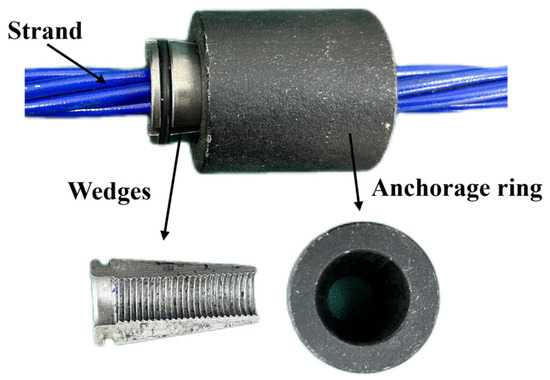
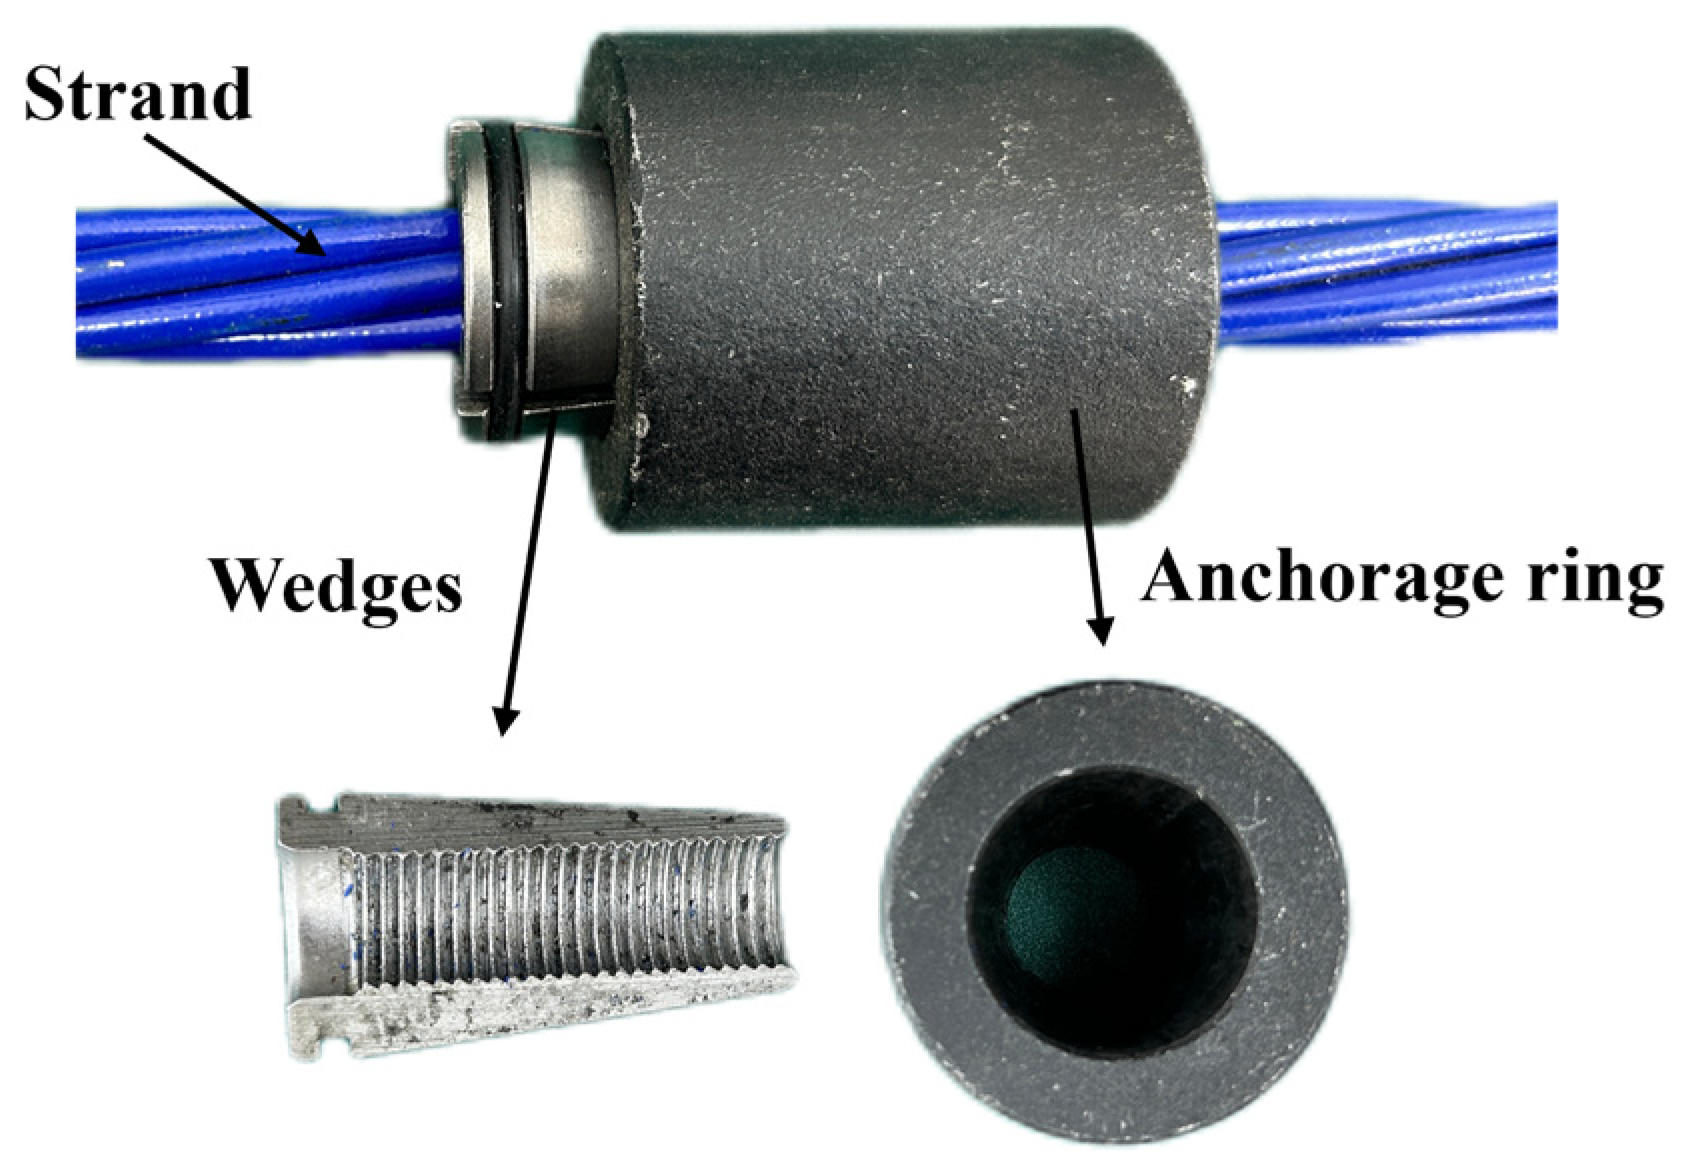
The mechanical configuration of the anchorage segment, as shown in Figure 5, primarily consists of the steel strand, wedges, and an anchorage ring; the main geometrical parameters are listed in Table 1. Upon the application of a tensile load to the strand, the radial contact pressure between the internal steel wires increases progressively, resulting in significant inter-wire contact. Simultaneously, the strands drive the wedges toward the loaded side of the anchorage ring through frictional forces, eventually establishing a stable anchorage state through the wedge-friction self-locking mechanism.
Figure 5.
Anchorage segment of prestressed steel strand.
Table 1.
Geometrical parameters of the prestressed strand anchorage structure.
Compared to the free segment, the anchorage segment exhibits the distinct characteristics of a composite contact structure, encompassing both the mutual contact between internal wires and the tight interfacial coupling between the wires and the anchorage components. Under high tensile loads, this composite structure tends to induce localized stress concentration in the contact regions, while the evolution of interfacial contact further modifies the overall mechanical response. Consequently, both the stress concentration and the interfacial contact are likely to trigger reflected echoes by perturbing the physical parameters governing guided wave propagation.
2.3. Acoustoelastic Effect Theory
Static analysis of the anchorage segment, as established by Wang [23], reveals that the application of prestress induces significant localized stress concentration within the strand. The tension force applied to the strand directly modulates the stress distribution in this critical region. According to acoustoelastic theory, the internal stress state of a material can alter its effective elastic constants, which in turn affects elastic-wave velocity and causes variations in acoustic impedance. For steel strands subjected to axial stress, the relationship between wave velocity and the axial stress is expressed as follows:
where CL and CT denote the longitudinal and transverse wave velocities, λ and µ represent the second-order Lamé constants, l, m and n signify the third-order Murnaghan constants, σ corresponds to the axial stress, and ρ is the material density of the component.
Since acoustic impedance is intrinsically related to material density and wave velocity, a stress-concentrated region can induce velocity shifts and local impedance mismatches. Such abrupt impedance changes are theoretically capable of generating wave reflections, suggesting that stress concentration is a potential mechanism for reflected echoes from the anchorage segment.
2.4. Non-Ideal Interface Spring Contact Theory
The formation of a stable prestressed anchorage system involves the strands driving the wedges into the anchorage ring via friction, resulting in a typical non-ideal mechanical bonding interface. The contact state of this interface directly affects the propagation behavior of guided waves, yet the traditional Coulomb friction model is limited to describing macroscopic correlations and fails to characterize the microscopic influence of non-ideal boundary conditions on ultrasonic propagation. Although fractal theory has been proposed to characterize such rough interfaces [26], directly constructing guided wave models based on this approach often faces technical bottlenecks, including excessive model scales and difficulties in numerical convergence.
To address these challenges, the mechanical response of non-ideal interfaces containing micro-gaps or localized contact can be equivalently simplified using a spring system. In this equivalent model, the spring stiffness represents the tightness of the contact interface: lower stiffness corresponds to looser bonding, whereas higher stiffness indicates tighter mechanical coupling. From the viewpoint of the strand-guided wave, the free segment and the anchorage segment correspond to two different effective waveguide states. In the free segment, the outer wires are approximately traction-free. In the anchorage segment, however, the outer wires are elastically constrained by the wedges and anchorage ring through the equivalent spring-type interfaces. Therefore, increasing interfacial stiffness does not only represent improved local contact transmission; it also changes the effective boundary condition encountered by the strand-guided wave.
This effect can be described in a simplified manner using the equivalent spring boundary condition. The contact traction is related to the relative displacement across the interface as
where tc is the contact traction, K is the equivalent interfacial stiffness, and us and ua are the displacements of the strand side and anchorage-side component, respectively. When K is small, the contact traction is weak, and the anchorage-side boundary is closer to the nearly free boundary condition of the free strand. As K increases with tensile load, the same relative displacement can produce a stronger contact traction, so the strand becomes more strongly constrained and mass-loaded by the anchorage components.
From an effective waveguide viewpoint, the reflected amplitude is related to the contrast between the free-strand waveguide state and the constrained anchorage waveguide state. By analogy with a one-dimensional impedance transition, the anchorage-induced reflection can be approximately interpreted as
where Zf denotes the effective modal impedance of the free strand segment, and Za,eff(K) denotes the load-dependent effective modal impedance of the constrained anchorage segment. This expression is not used as an exact analytical solution for the multi-wire strand–anchorage system. Instead, it provides a simplified physical interpretation showing that the reflected response is associated with the effective contrast between the free segment and the anchorage segment.
Therefore, under the present model assumptions and loading range, tighter contact may increase the effective waveguide discontinuity because the anchorage segment gradually behaves as a more strongly constrained composite waveguide. This interpretation is specific to the through-anchorage guided-wave configuration and does not imply that a stiffer interface necessarily increases reflection in a simple two-solid transmission problem.
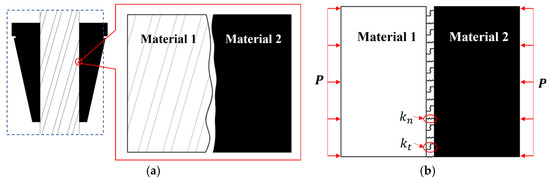
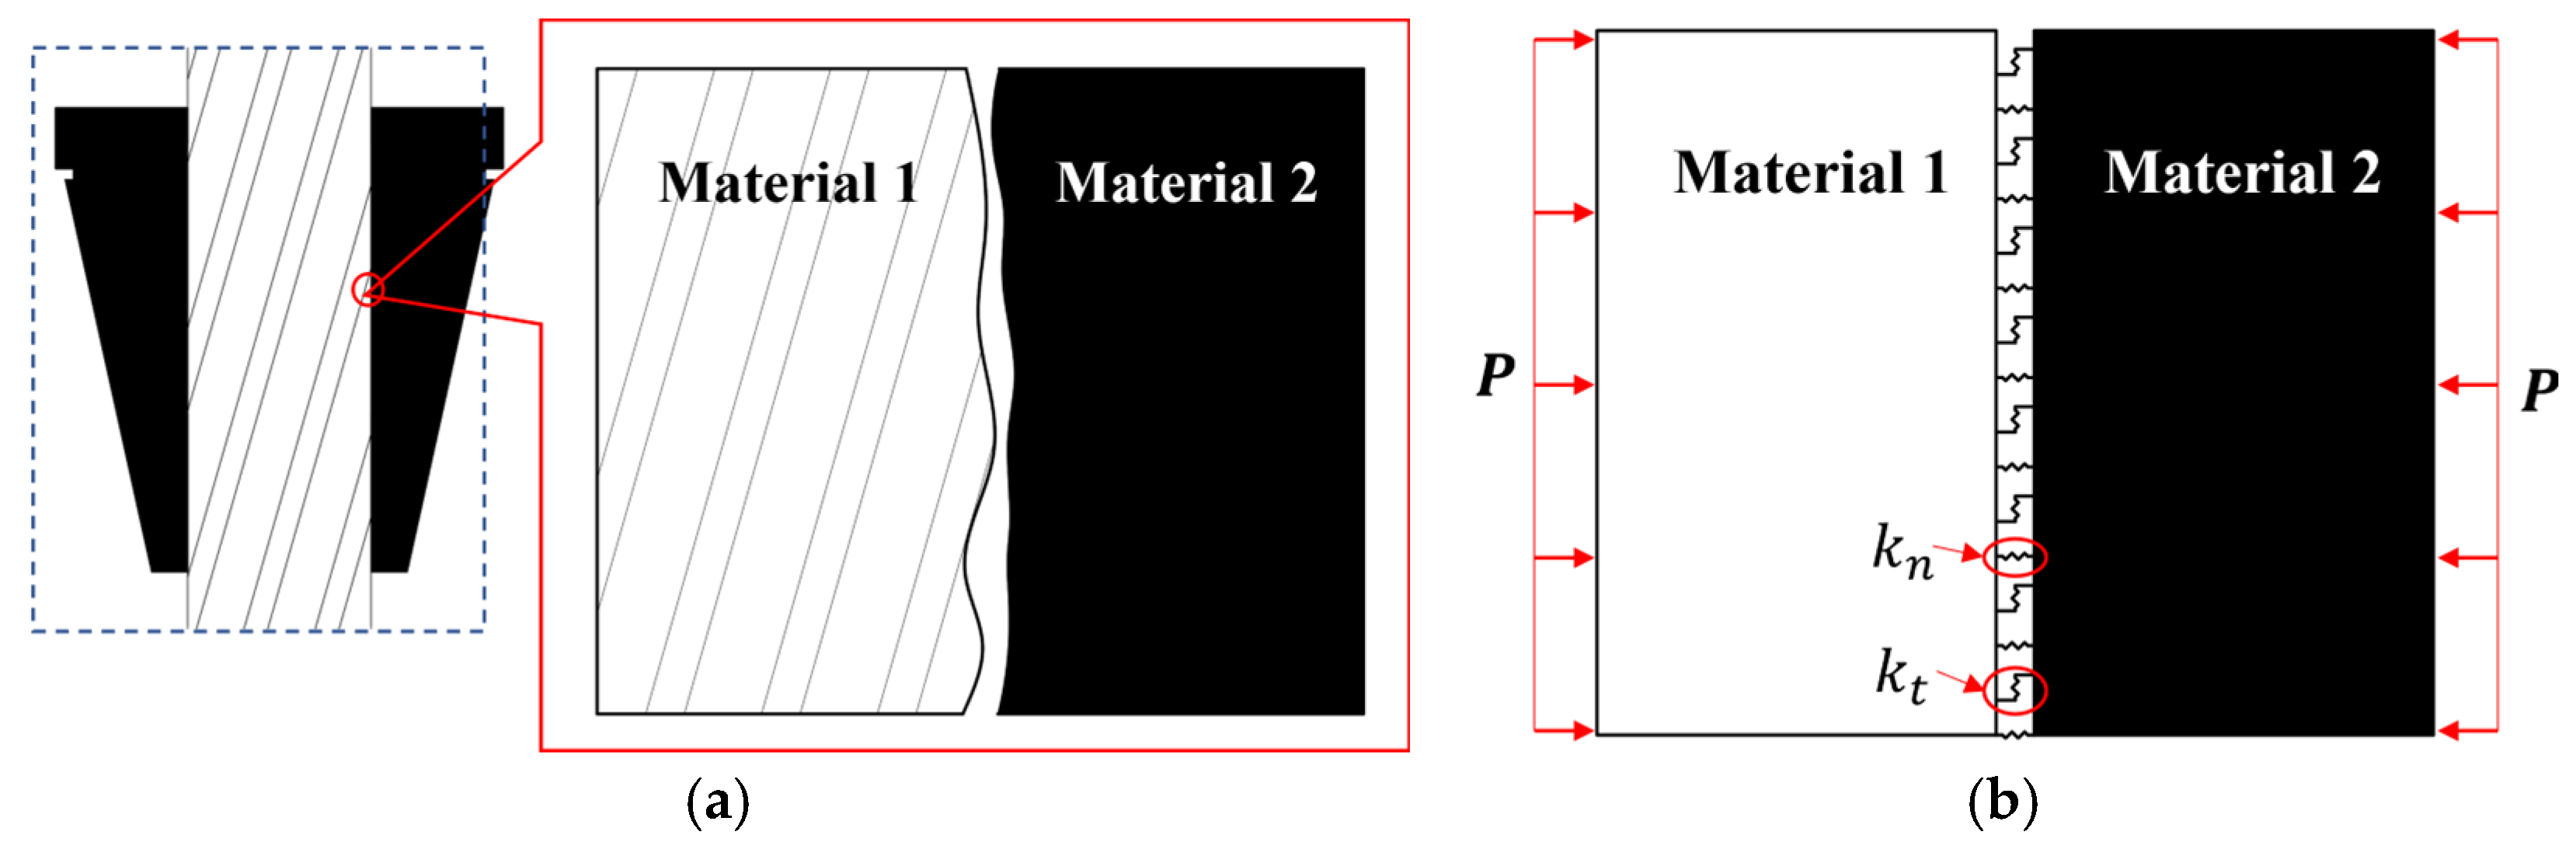
Figure 6 illustrates the non-ideal contact interface of the anchorage segment and its equivalent spring representation, in which the interface is replaced by discrete spring elements to quantify its transmission characteristics.
Figure 6.
Non-ideal contact interface based on the equivalent spring model: (a) non-ideal contact interface of the anchorage segment; (b) equivalent spring model.
At the mesoscale, each contact element is modeled as a parallel system of normal and tangential springs. Based on finite contact stiffness theory and assuming a continuous distribution of interfacial stress, the relationship between interfacial stress and displacement difference satisfies the following linear constitutive relation [27]:
where K denotes the contact stiffness matrix.
This matrix incorporates the interfacial normal contact stiffness (Kn) and the tangential contact stiffness (Kt). By incorporating the normal contact stress (p), the material Poisson’s ratio (ν), and the root-mean-square value of interfacial roughness (u0), these stiffness components are expressed as follows [28]:
3. Finite Element Simulation
3.1. Acoustoelastic Effect Simulation
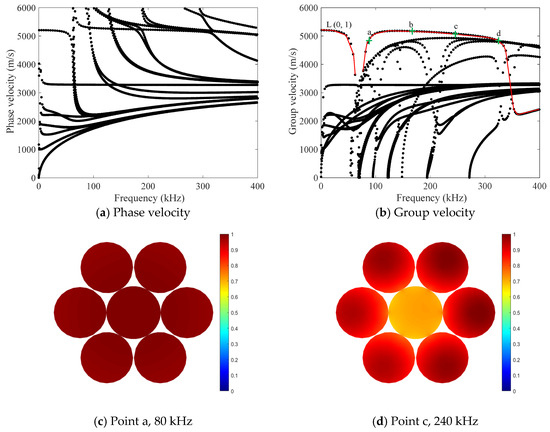
To estimate the reflection contribution that can be produced by stress-induced acoustoelastic impedance variation alone, a simplified acoustoelastic finite element model was established in COMSOL Multiphysics 6.1. A three-dimensional steel-wire model with a diameter of 5 mm and a length of 0.5 m was established as illustrated in Figure 7. The material properties assigned to this model were an elastic modulus of 210 GPa, a Poisson’s ratio of 0.28, and a density of 7800 kg/m3. Within the solid mechanics module, hyperelastic material properties were defined using the Lamé and Murnaghan constants summarized in Table 2. The Murnaghan formulation was adopted not merely to apply a static stress field, but to incorporate the acoustoelastic dependence of incremental wave velocity on the prestress state. In contrast, a conventional linear elastic material with an applied static load would not include the third-order elastic-constant contribution to wave-speed variation. To approximate the stress state near the anchorage contact region, an axial static tensile load Tz and a radial pressure Pr were applied to simulate the stress distribution under prestress. Given that ASTM A416-270 grade low-relaxation strands with an ultimate tensile strength (UTS) of 1860 MPa are standard in engineering applications [29], the simulation load was incrementally increased to 80% of the UTS in steps of 10%. No explicit material damping was introduced in the transient simulations, because the objective was to compare the reflection mechanisms associated with stress-induced impedance variation and interfacial stiffness evolution under simplified modelling conditions. Dissipation in real anchorage systems may reduce absolute amplitudes, but it is not expected to change the order-of-magnitude contrast between the weak stress-induced reflections and the much stronger contact-induced reflections. Guided by the reflection-coefficient frequency-response characteristic curves established by Wang [23], the excitation signals were defined as three-cycle Hann-windowed sinusoidal pulses at 80 kHz and 240 kHz. The modal basis of the selected frequencies was examined based on SAFE analysis of the same type of 15.2 mm seven-wire prestressed strand [23]. To make this modal interpretation explicit in the manuscript, the corresponding dispersion curves and cross-sectional displacement fields are included in Figure 8. The L(0,1) branch can be identified in the investigated frequency range, and the group-velocity curve provides the basis for interpreting the arrival time of the longitudinal guided-wave packets. The phase velocity was used to estimate the wavelength at the two excitation frequencies, as summarized in Table 3. At 80 kHz, the estimated wavelength is 65.5 mm, which is slightly larger than the effective anchorage length of 48 mm. At 240 kHz, the estimated wavelength decreases to 21.2 mm, which is shorter than the effective anchorage length. This wavelength–structure-size comparison indicates that the two selected frequencies correspond to different sensitivities to the anchorage boundary condition.
Figure 7.
Acoustoelasticity-based finite element model for guided-wave propagation in steel wires.
Table 2.
Lamé and Murnaghan constants of the steel wire.
Figure 8.
SAFE-based dispersion curves and cross-sectional displacement fields of the L(0,1) mode for the same type of 15.2 mm seven-wire prestressed strand, adapted from Wang [23]: (a) phase-velocity dispersion curves; (b) group-velocity dispersion curves, where the red curve marks the L(0,1) branch, the green line indicates the selected group-velocity trend used for wave-packet interpretation, and points a–d indicate selected frequency points; (c) displacement field at point a, 80 kHz; (d) displacement field at point c, 240 kHz.
Table 3.
Phase velocity, group velocity, and estimated wavelength of the L(0,1)-type guided wave.
The cross-sectional displacement fields at 80 kHz and 240 kHz further show that the selected responses are dominated by longitudinal L(0,1)-type motion, although the spatial distribution of modal energy changes with frequency. In particular, the higher-frequency response shows stronger displacement concentration in the outer helical wires, which is consistent with the frequency-dependent boundary sensitivity reported in previous strand-guided-wave studies. Therefore, the 80 kHz and 240 kHz signals used in the present work are interpreted as representative L(0,1)-type guided-wave responses rather than perfectly pure single-mode responses after interaction with the anchorage system. Weak mode conversion may still occur because of inter-wire contact, strand–wedge contact, wedge–anchorage contact, and local geometric discontinuities. In the acoustoelastic simulation, these wave packets were excited by applying boundary load elements at the end face of the steel wire.
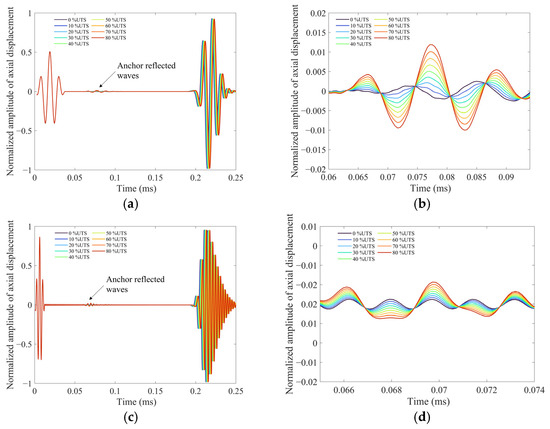
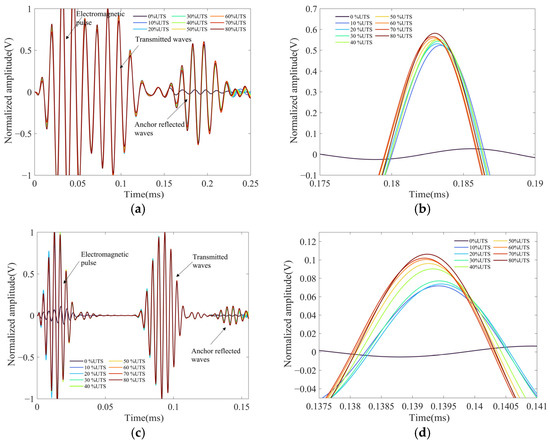
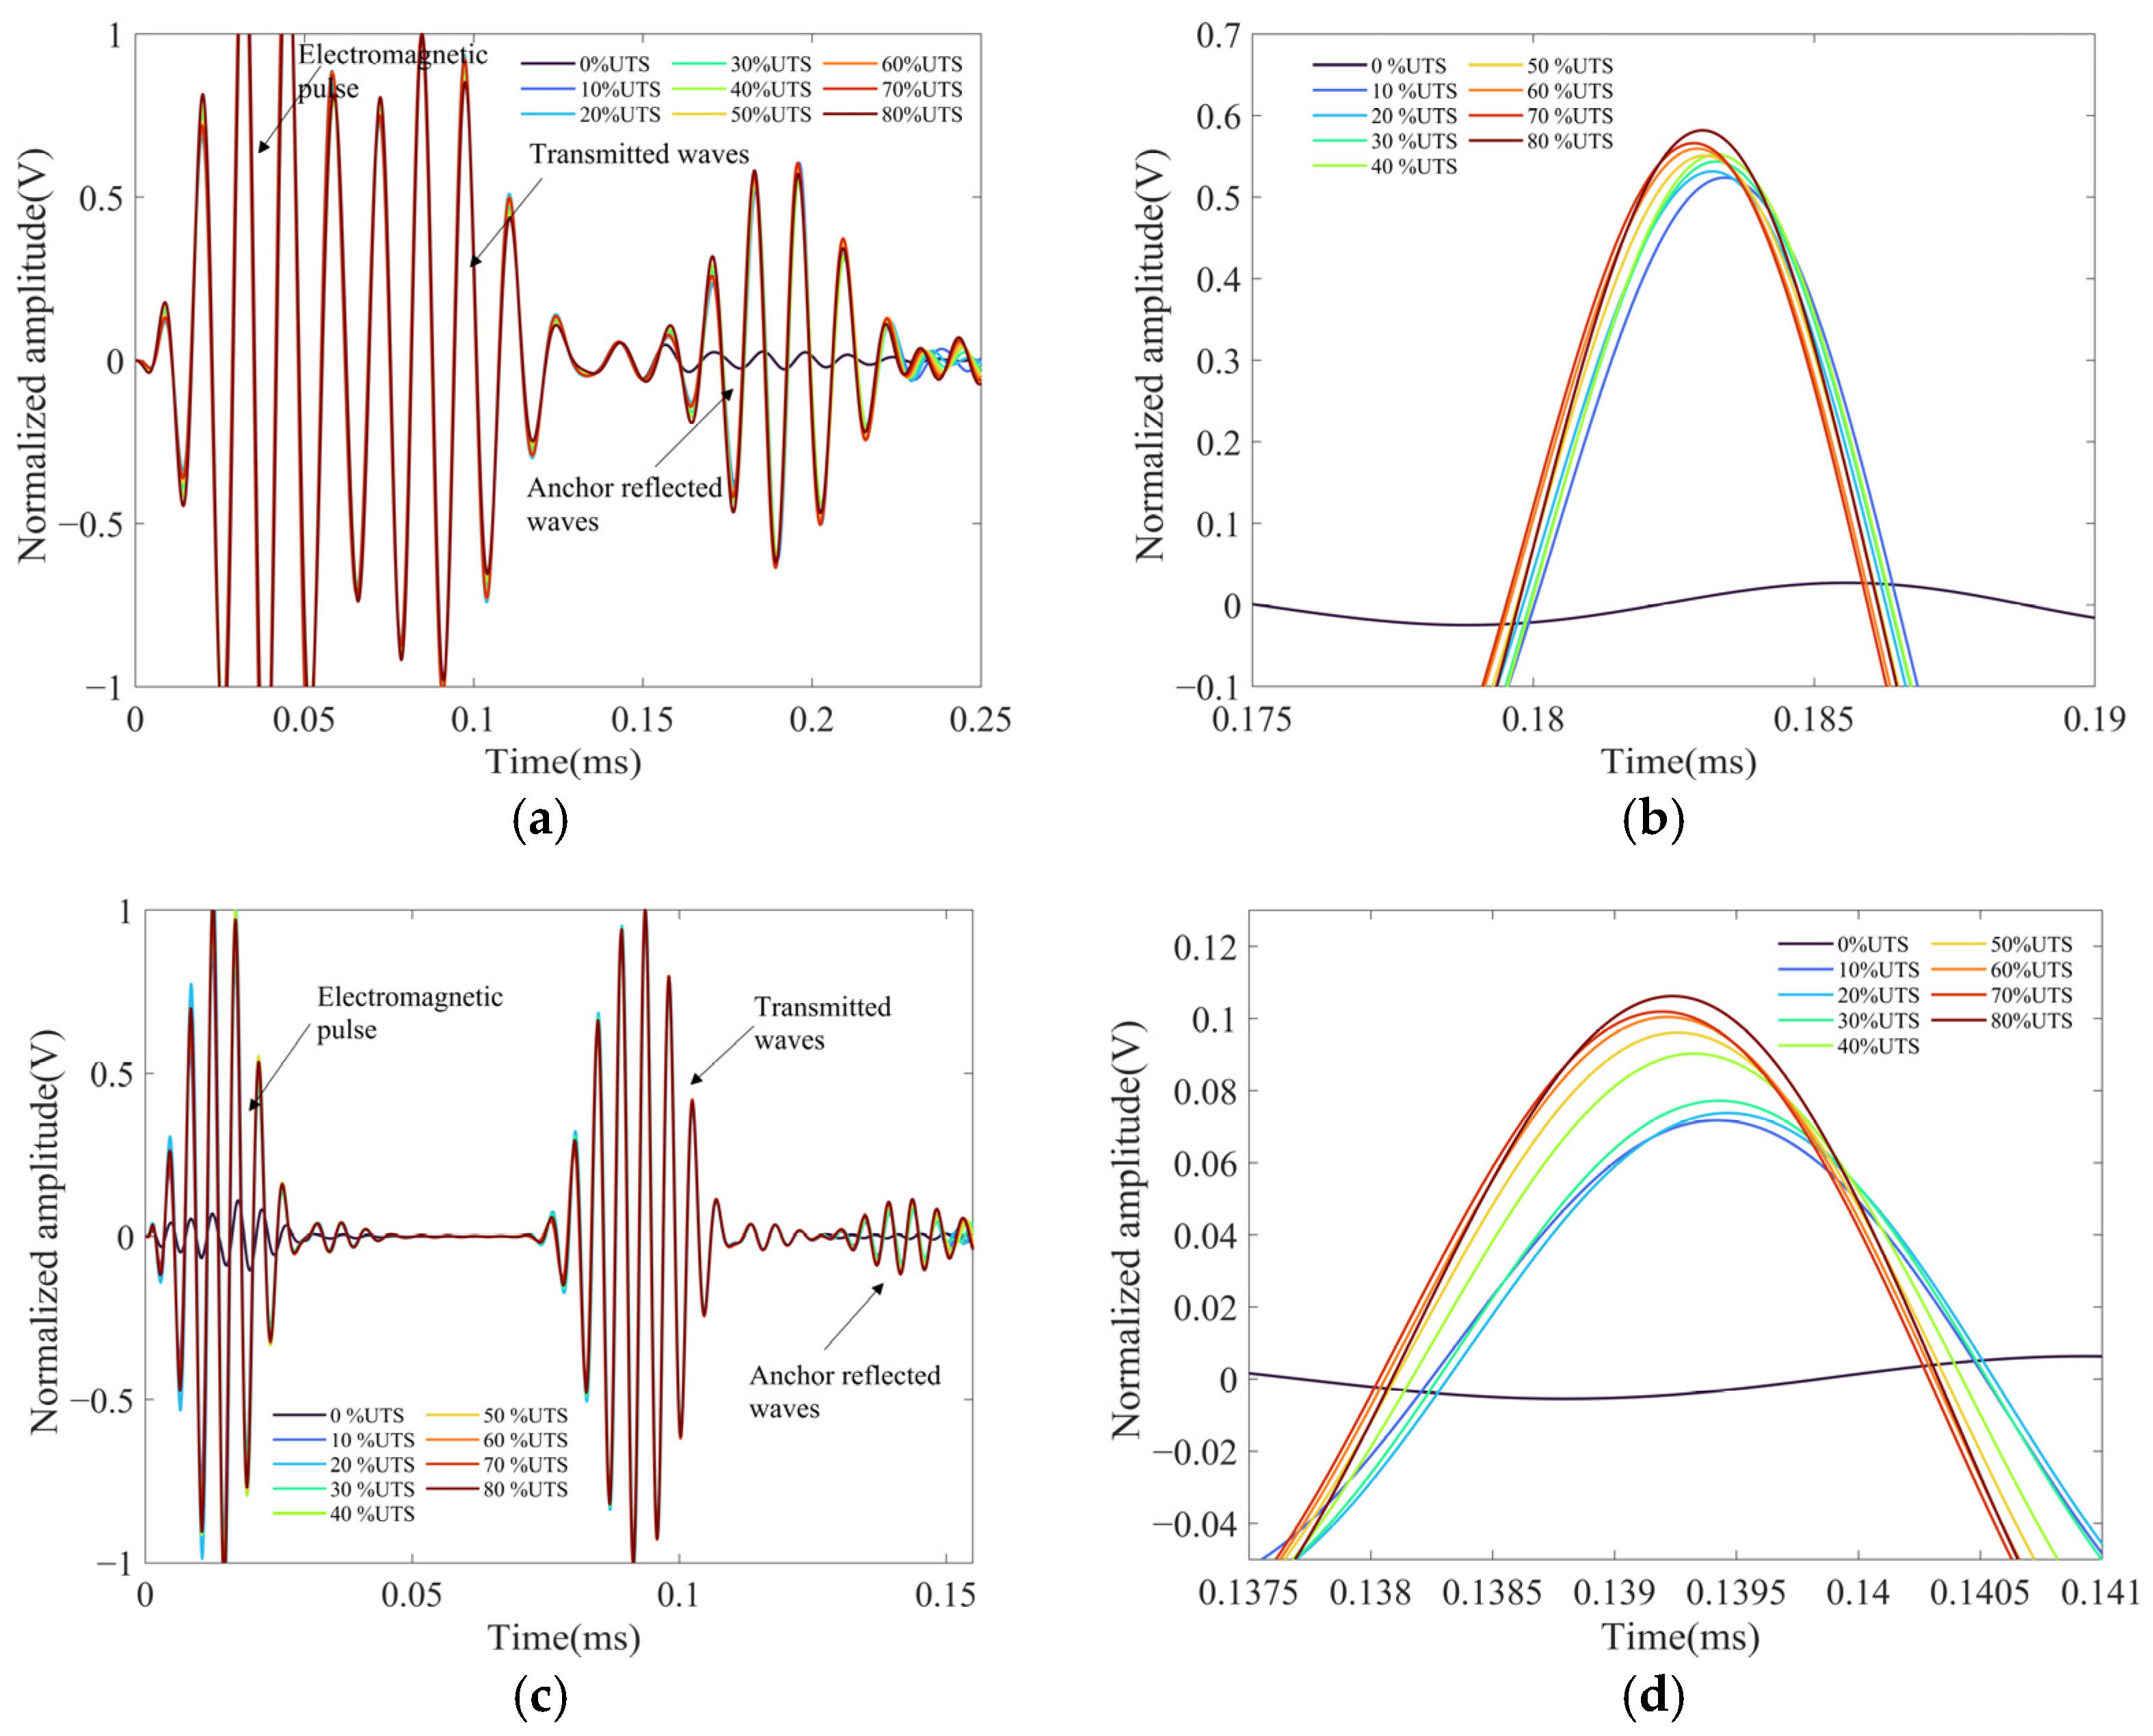
The axial displacement was used to characterize the guided-wave response. As shown in Figure 9, the locally stressed region generates only weak reflected wave packets, and their amplitude increases with tensile load. The relatively large wave packets appearing after approximately 0.2 ms in Figure 9a,c are associated mainly with far-end reflections and the superposition of later components in the finite-length, undamped model; these later responses are outside the primary reflection window and are not used for calculating the stress-induced reflection coefficient. Even at 80% UTS, the reflection coefficient remains below 0.0125 at 80 kHz and approximately 0.006 at 240 kHz. Therefore, the acoustoelastic simulation indicates that stress-induced impedance variation alone is insufficient to explain the strong anchorage-induced echoes.
Figure 9.
Time-domain waveforms of the received guided-wave signals under varying tensile loads: (a) received signals at 80 kHz; (b) reflected signals from the anchorage segment at 80 kHz; (c) received signals at 240 kHz; (d) reflected signals from the anchorage segment at 240 kHz.
3.2. Equivalent Spring Contact Interface Simulation
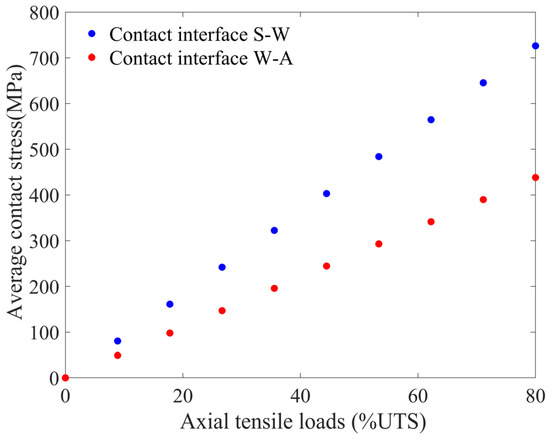
To evaluate the sensitivity of anchorage-induced reflections to interfacial contact evolution, an equivalent spring-contact model was established for the strand–wedge (S-W) and wedge–anchorage ring (W-A) interfaces. Following the transient analysis framework [23], an elastic thin layer was used to represent the equivalent normal and tangential contact stiffness of the interfaces. This model is not intended to reproduce every local feature of the real anchorage system, but to examine whether the evolution of interfacial stiffness can generate reflection coefficients with the same order of magnitude and load-dependent trend as those observed experimentally. Therefore, the model is used as an equivalent representation and sensitivity-analysis approach rather than for unique calibration of the real interface stiffness. The specific relationships between the interfacial contact stress at the S-W and W-A boundaries and the applied axial tensile load were calculated and are presented in Figure 10.
Figure 10.
Correlation between interfacial contact stresses and axial tensile loads within the anchorage segment.
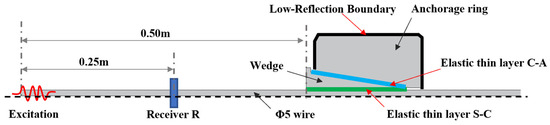
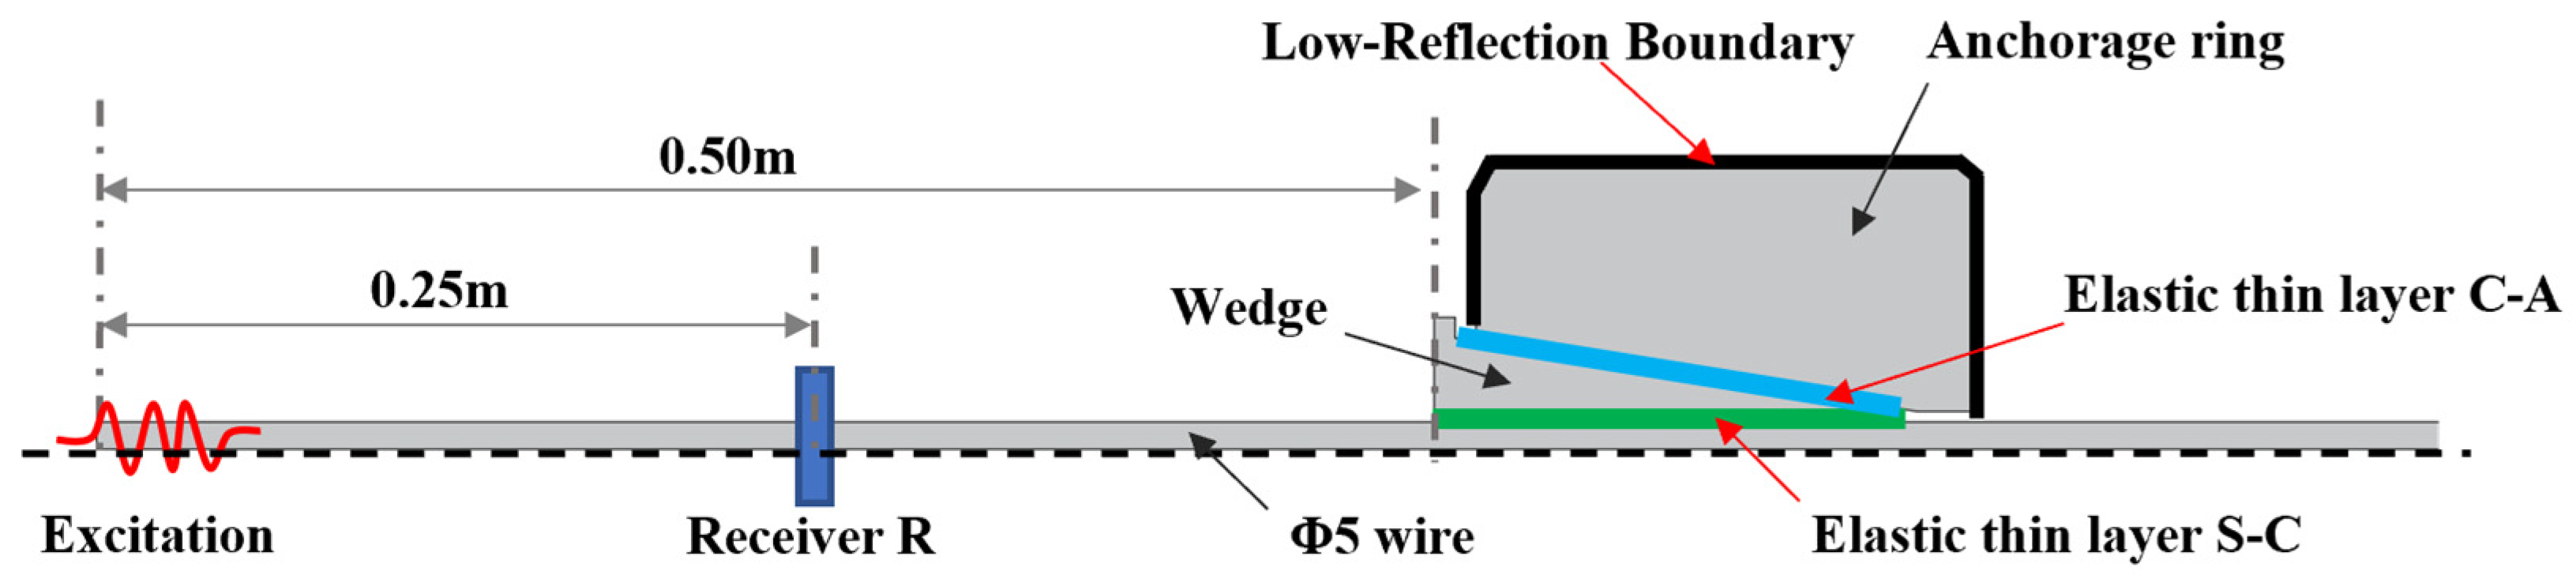
A nominal equivalent root-mean-square interfacial roughness of 400 nm was used in the baseline simulation to calculate the normal and tangential contact stiffnesses through Equation (8). This value is used as an equivalent modelling parameter rather than a directly measured surface roughness of the strand–wedge or wedge–anchorage interfaces. Campañá [28] provides the theoretical basis for relating rough-surface contact stiffness to interfacial roughness, whereas the specific value of u0 is examined further through the sensitivity analysis presented in Section 3.3. Using the interfacial contact stresses shown in Figure 10, the corresponding contact stiffness parameters were calculated for different tensile load levels and then assigned to the elastic thin layer module. This procedure enabled the establishment of an equivalent spring-contact model for the anchorage segment. To reduce interference from leakage waves during propagation, a low-reflection boundary condition was applied at the outer anchorage boundary, as shown in Figure 11. Transient simulations were then performed at 80 kHz and 240 kHz, using the same excitation parameters as those adopted in the acoustoelastic simulation. The finite element model was discretized using triangular elements. The maximum element size was limited to 1/15 of the guided-wave wavelength, and the minimum element size was set to 1/30 of the shortest wavelength to ensure adequate spatial resolution.
Figure 11.
Two-dimensional axisymmetric finite element model for guided-wave propagation in the spring-contact interface of the anchorage segment.
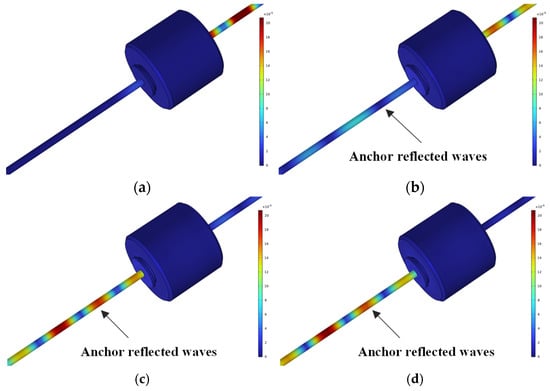
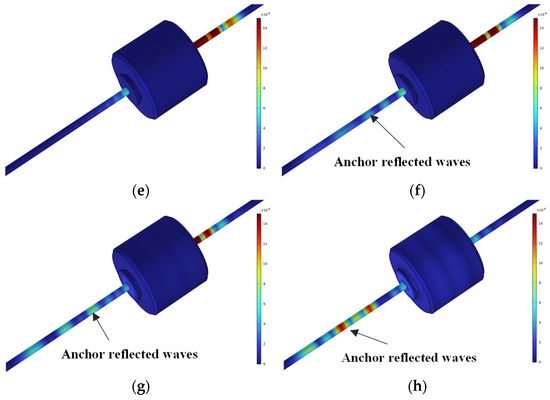
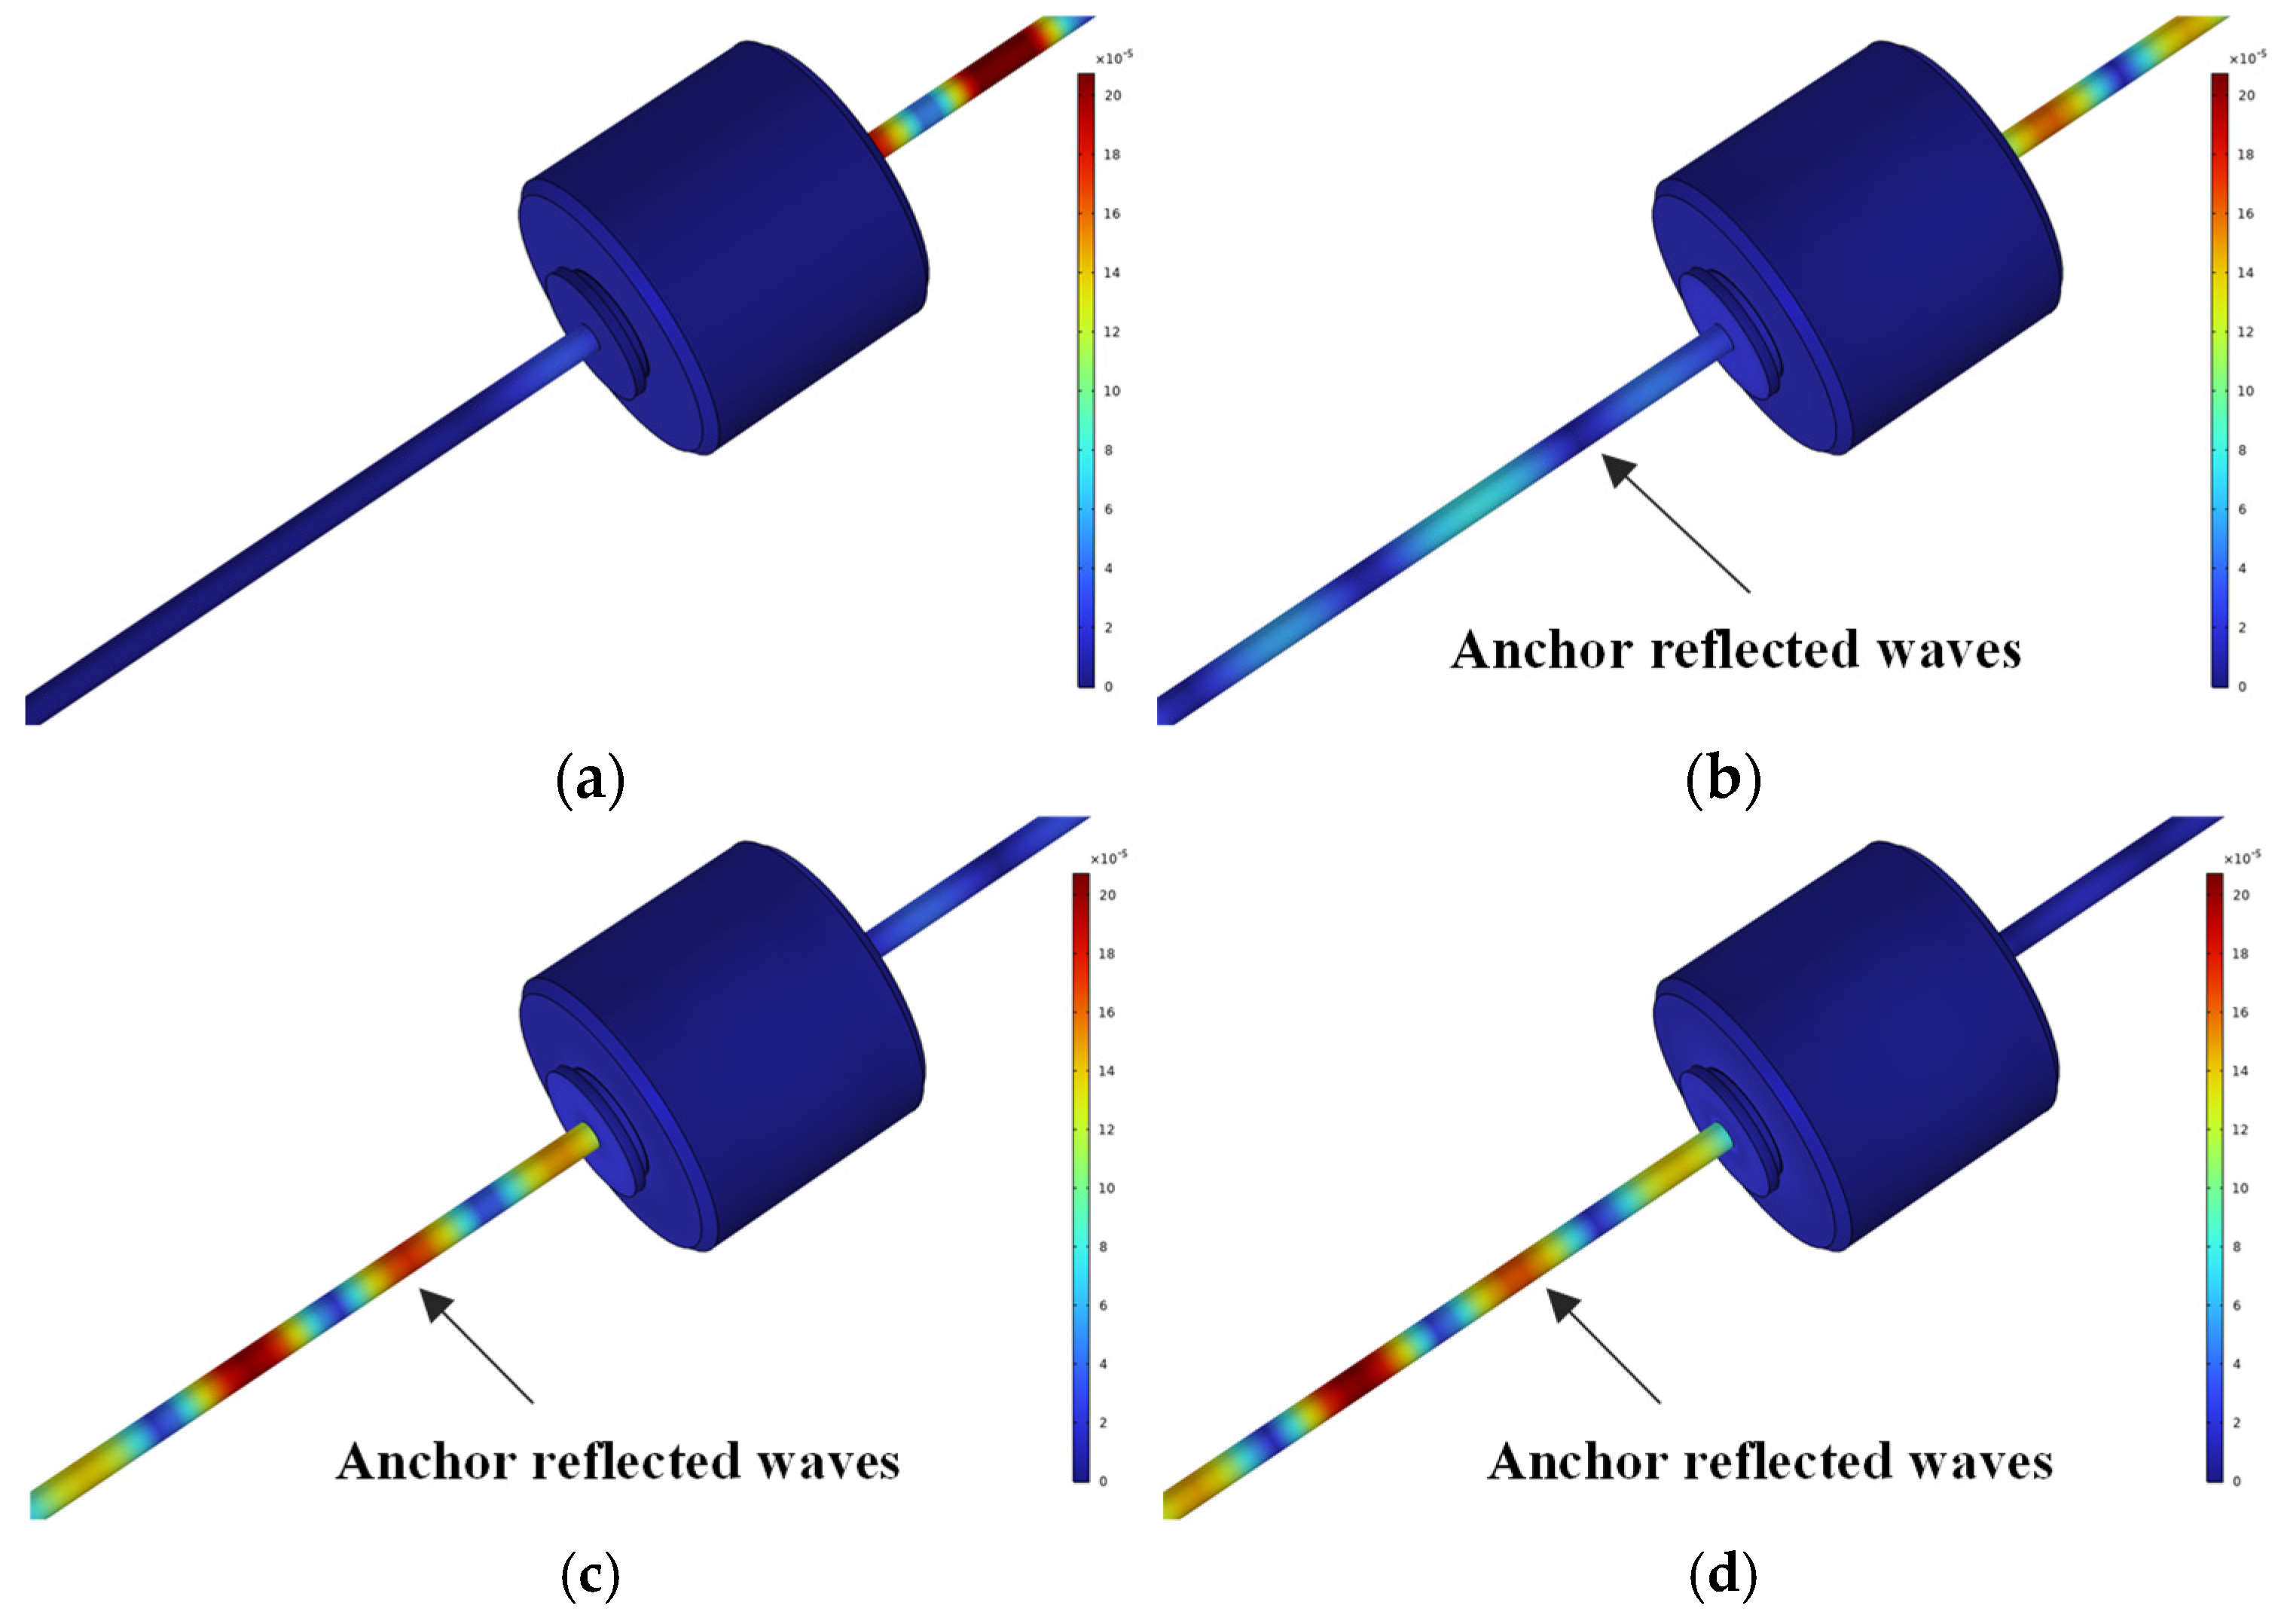
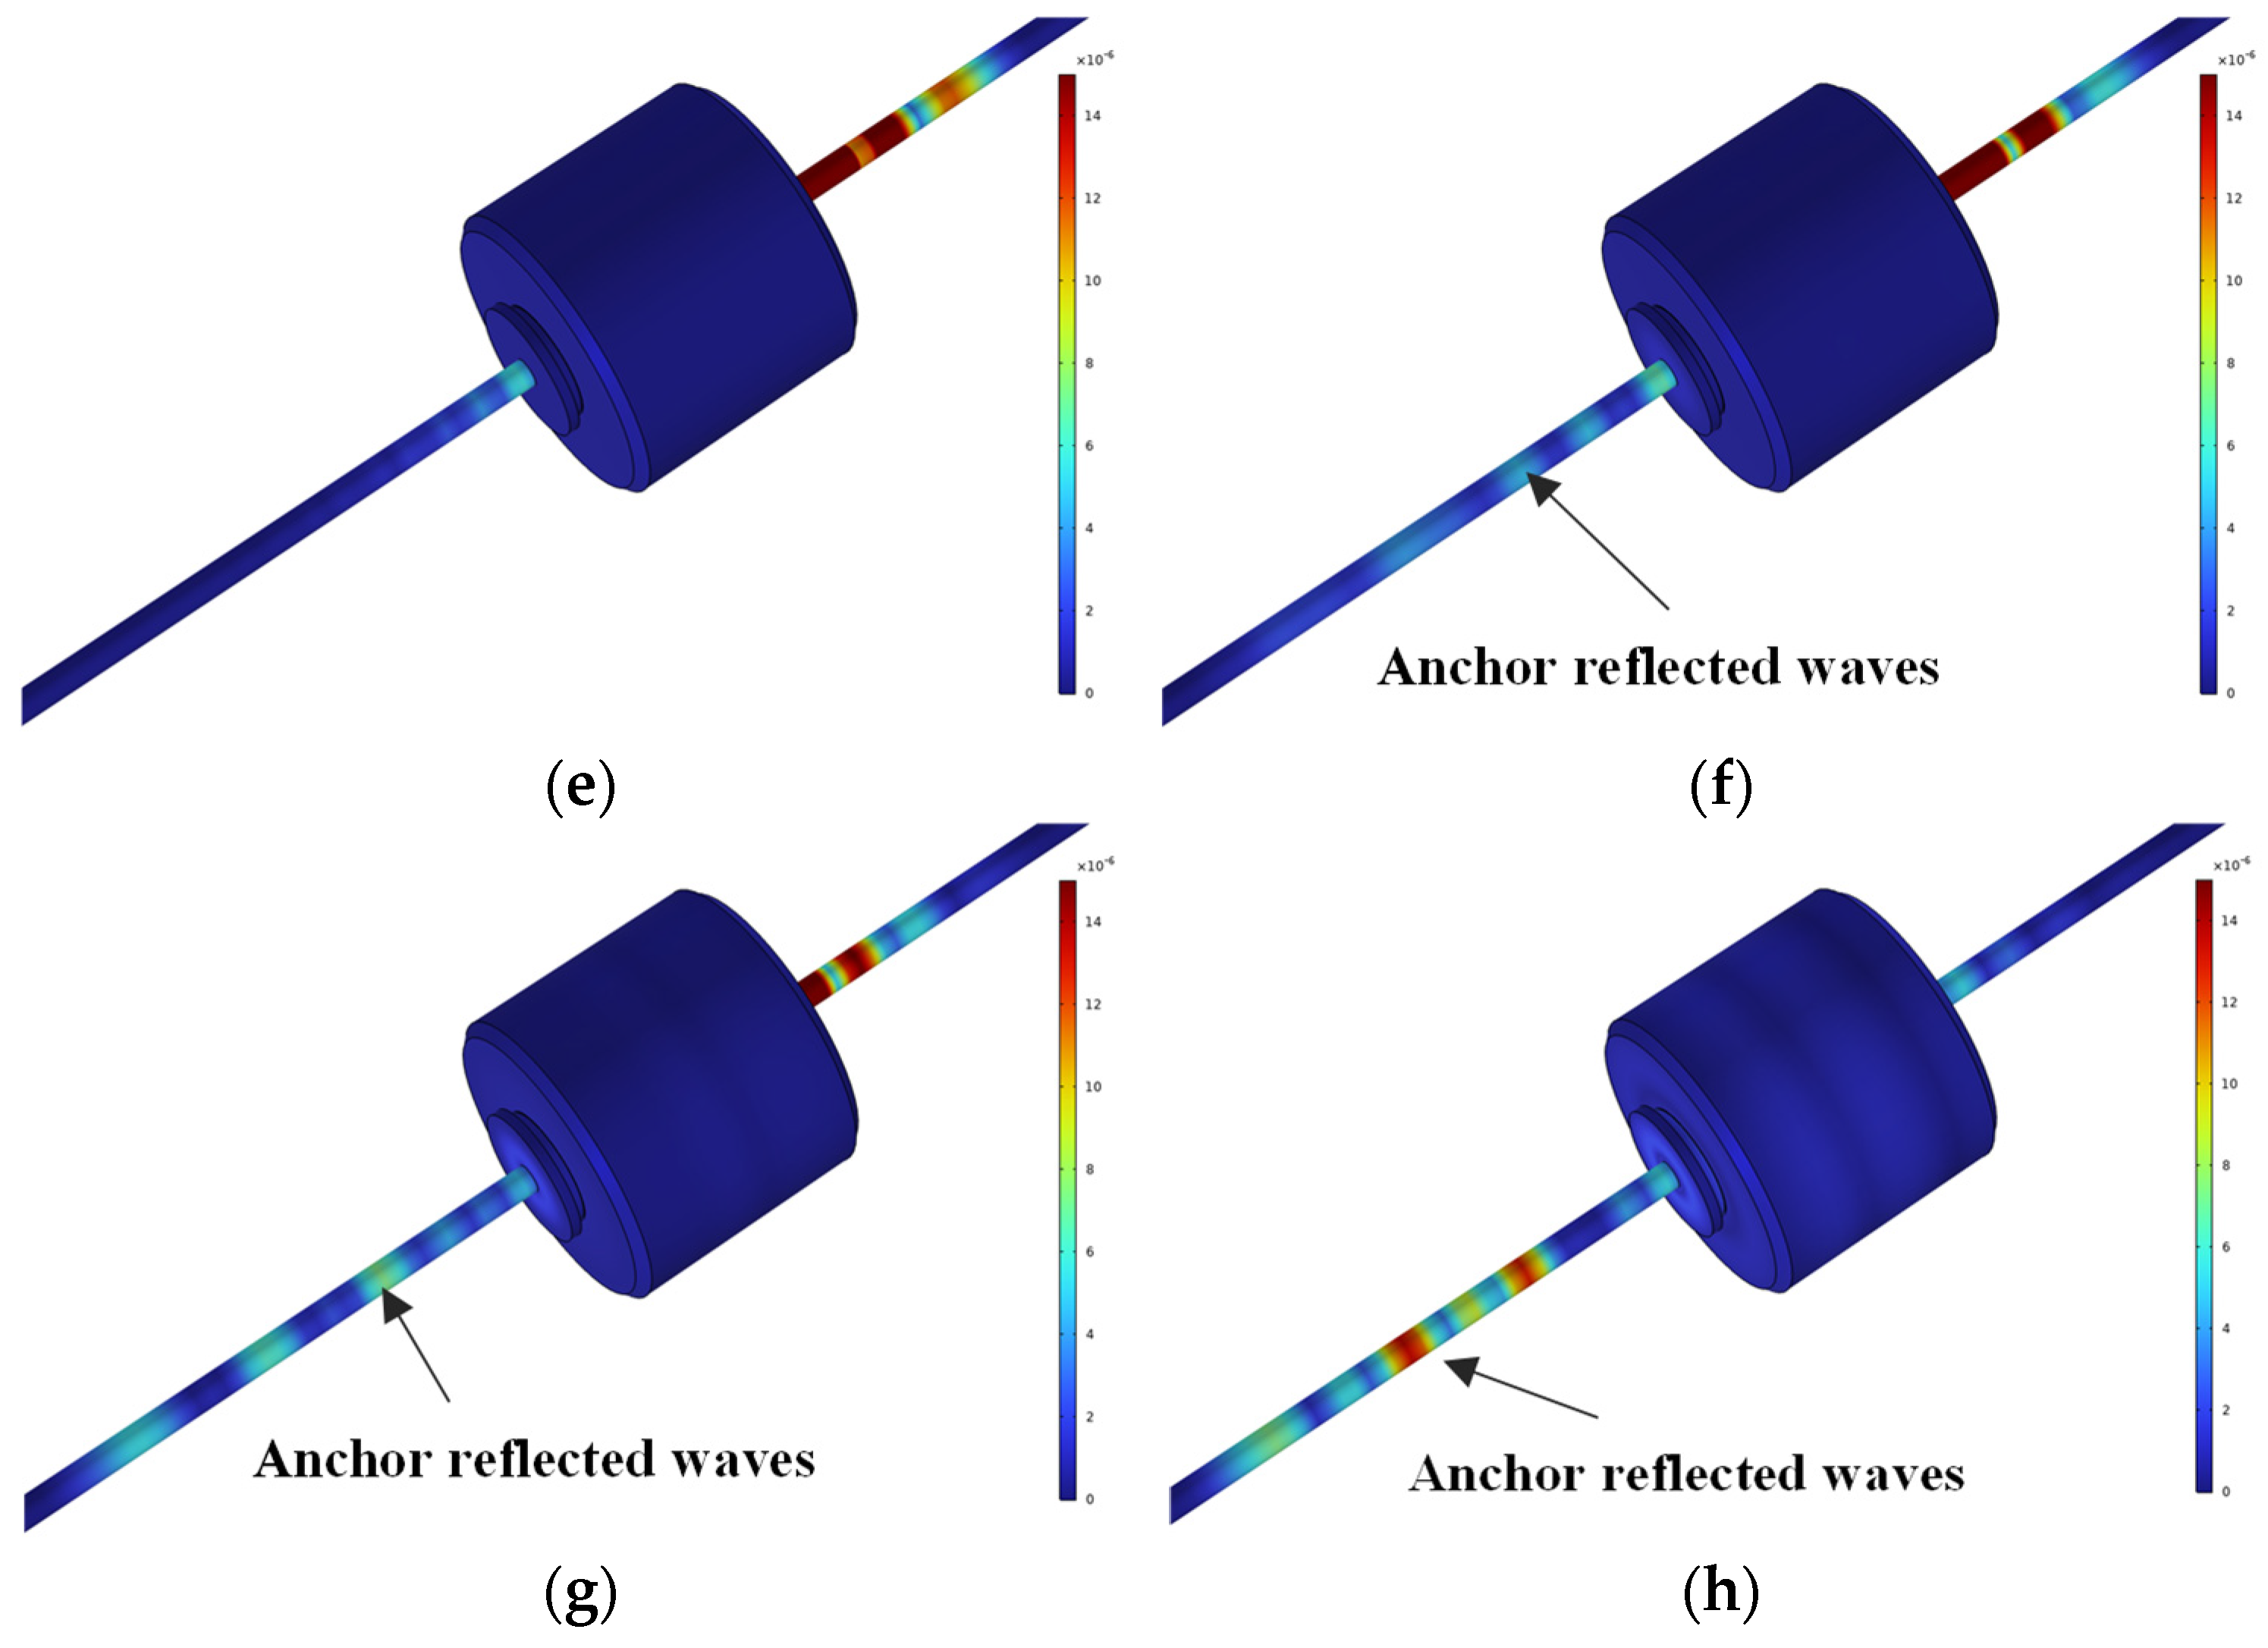
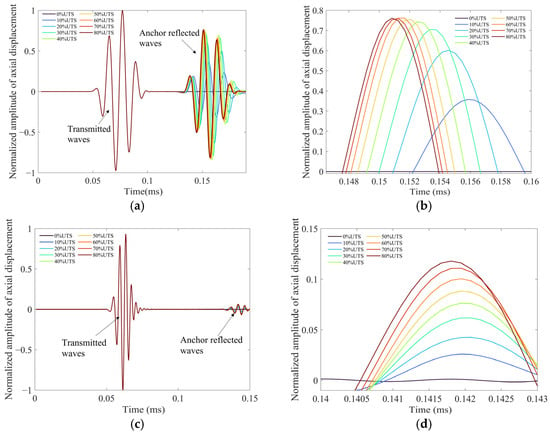
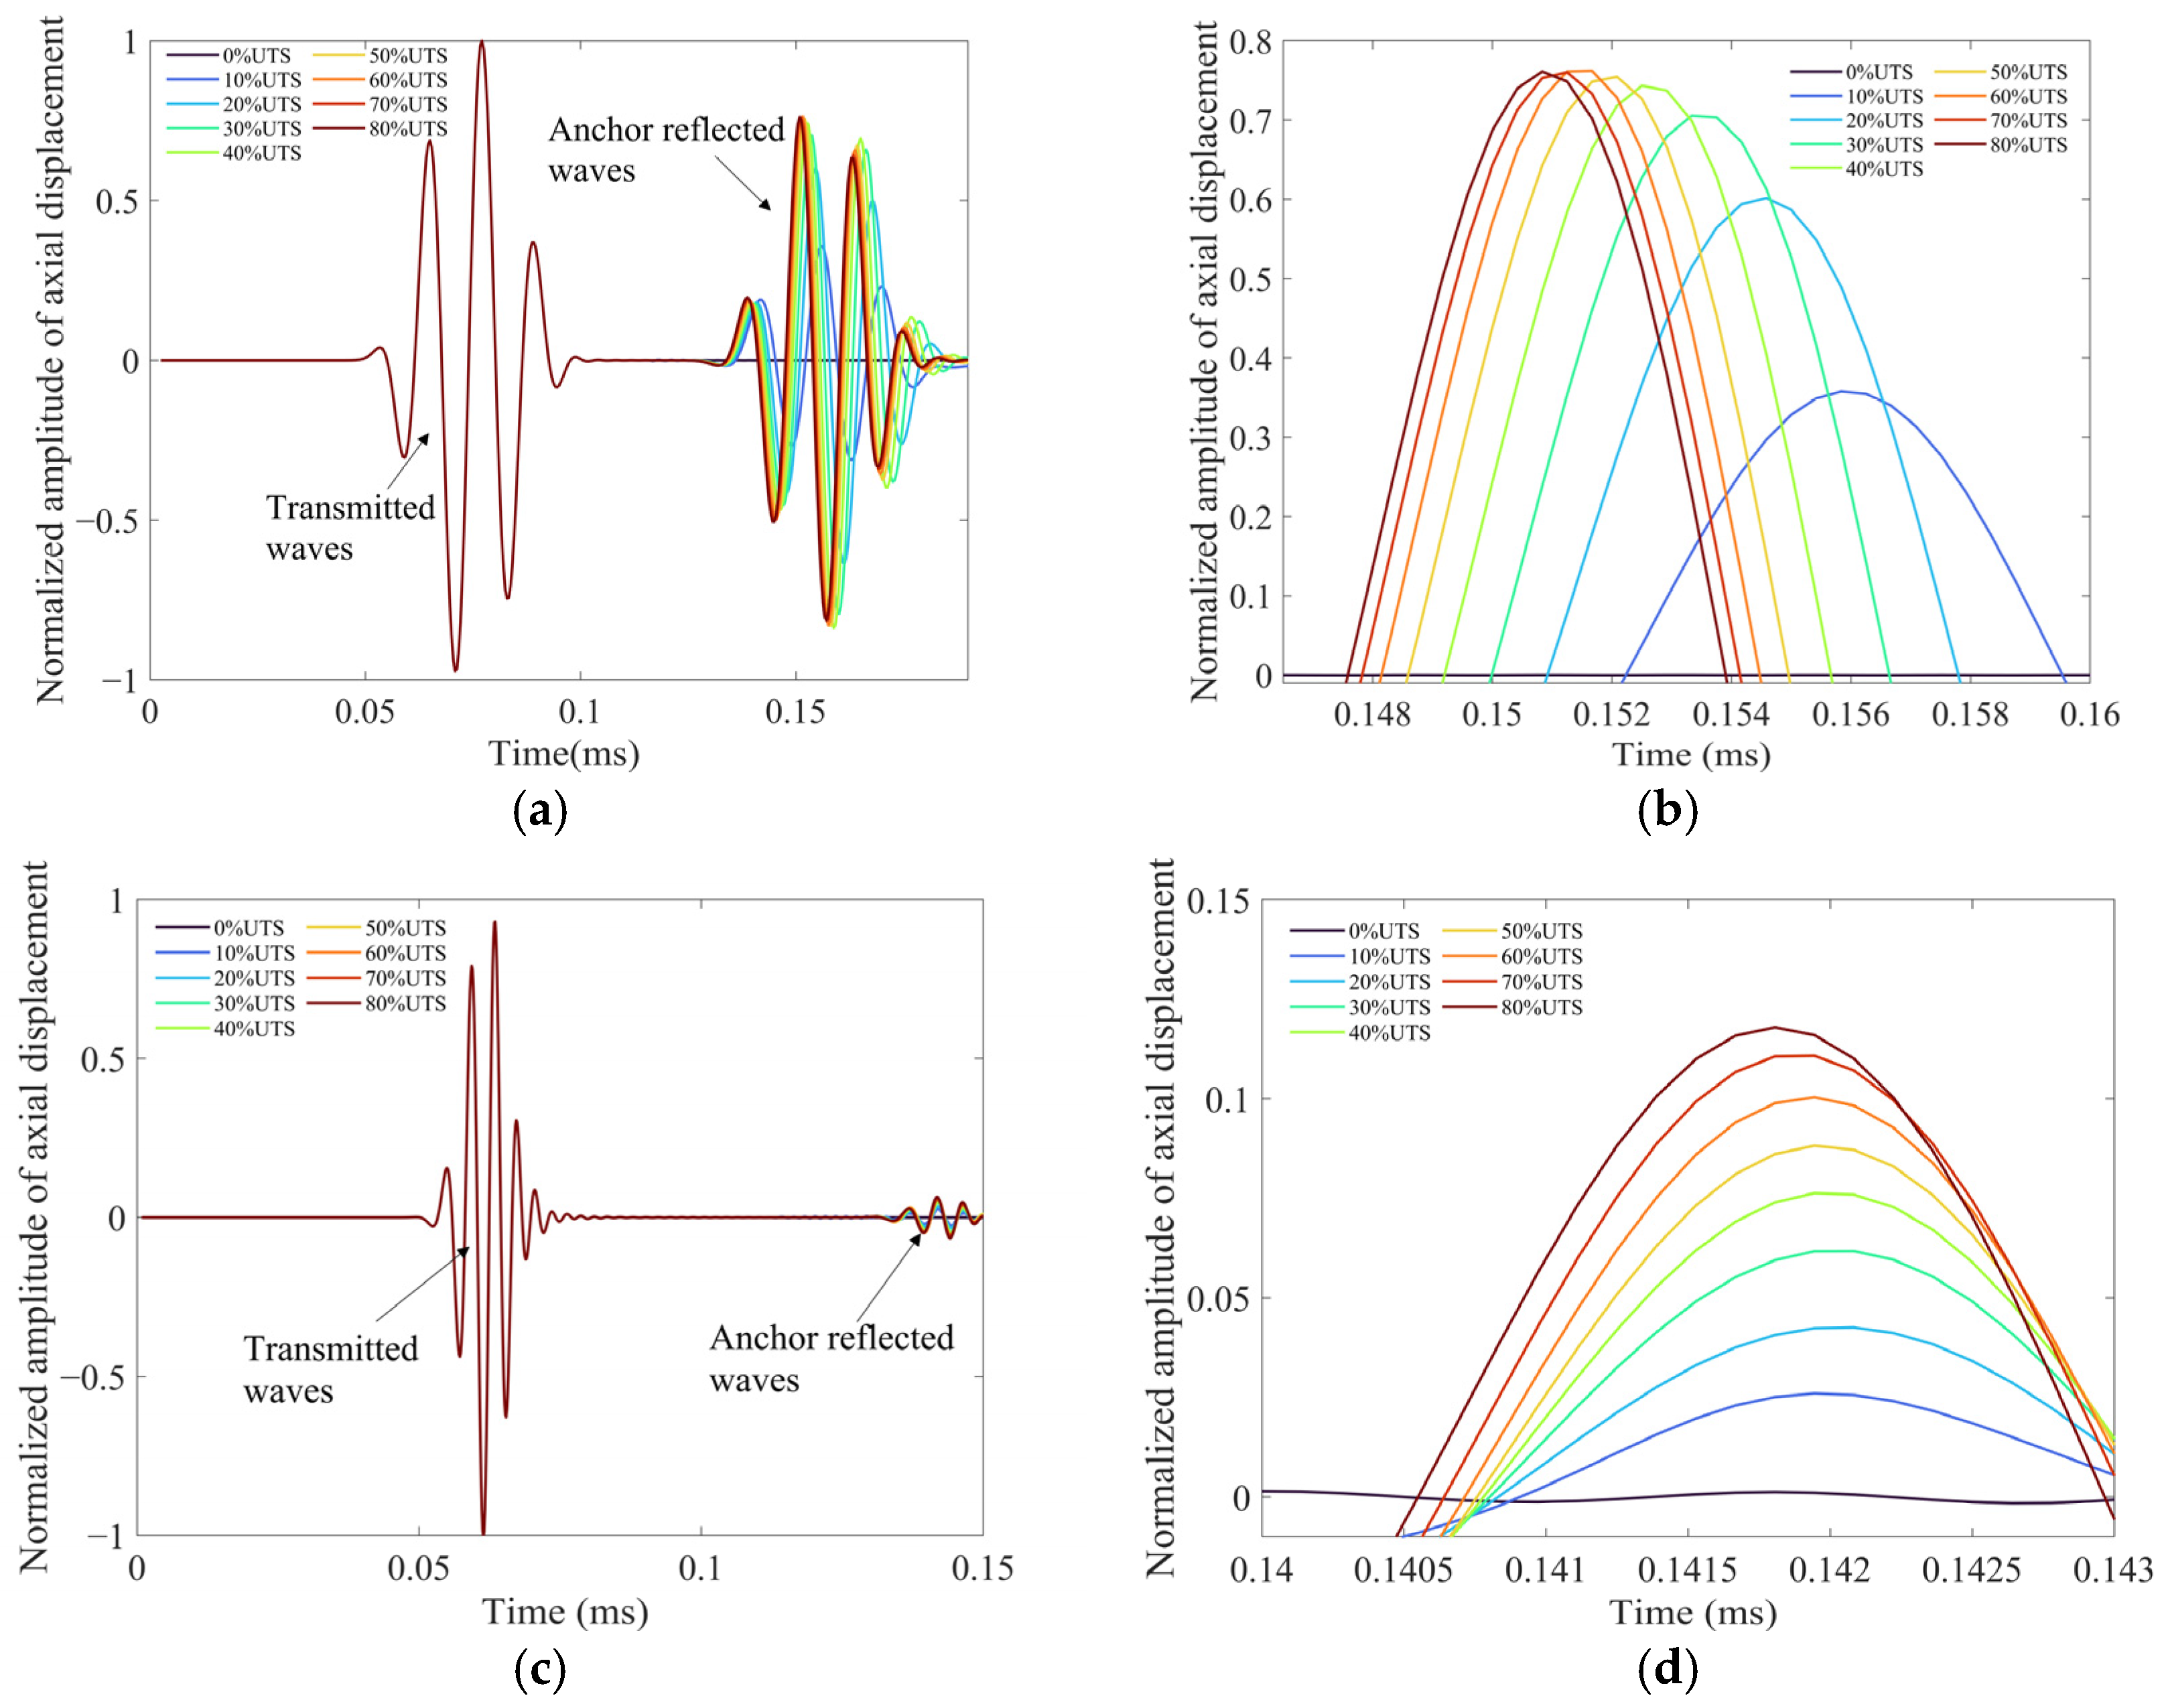
The resulting axial displacement fields are shown in Figure 12. The snapshots correspond to 0.13 ms for the 80 kHz excitation and 0.11 ms for the 240 kHz excitation under different tensile load levels. The corresponding normalized time-domain responses at the receiving position are shown in Figure 13. The results indicate that pronounced reflected wave packets are generated at the anchorage contact region. Compared with the stress-only acoustoelastic model, the equivalent spring-contact model produces much stronger anchorage-induced reflections. As the tensile load increases, the calculated interfacial stiffness increases, and the strand–anchorage system behaves as a more strongly constrained composite waveguide. From the viewpoint of the strand-guided wave, this strengthens the effective discontinuity between the nearly free boundary condition in the free segment and the elastically constrained boundary condition in the anchorage segment. Consequently, stronger reflected echoes are generated at the entrance of the anchorage segment.
Figure 12.
Contour plots of displacement field distribution under varying tensile loads: (a) 80 kHz, 0% UTS, 0.13 ms; (b) 80 kHz, 20% UTS, 0.13 ms; (c) 80 kHz, 50% UTS, 0.13 ms; (d) 80 kHz, 80% UTS, 0.13 ms; (e) 240 kHz, 0% UTS, 0.11 ms; (f) 240 kHz, 20% UTS, 0.11 ms; (g) 240 kHz, 50% UTS, 0.11 ms; (h) 240 kHz, 80% UTS, 0.11 ms.
Figure 13.
Comparison of reflected signals from the anchorage segment under varying tensile loads: (a) received signals at 80 kHz; (b) enlarged reflected signals from the anchorage segment at 80 kHz; (c) received signals at 240 kHz; (d) enlarged reflected signals from the anchorage segment at 240 kHz.
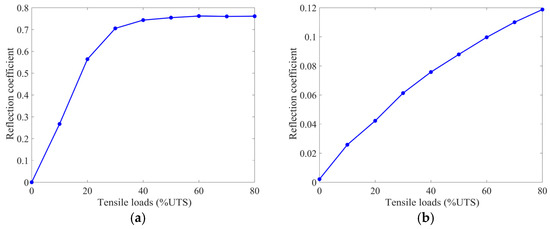
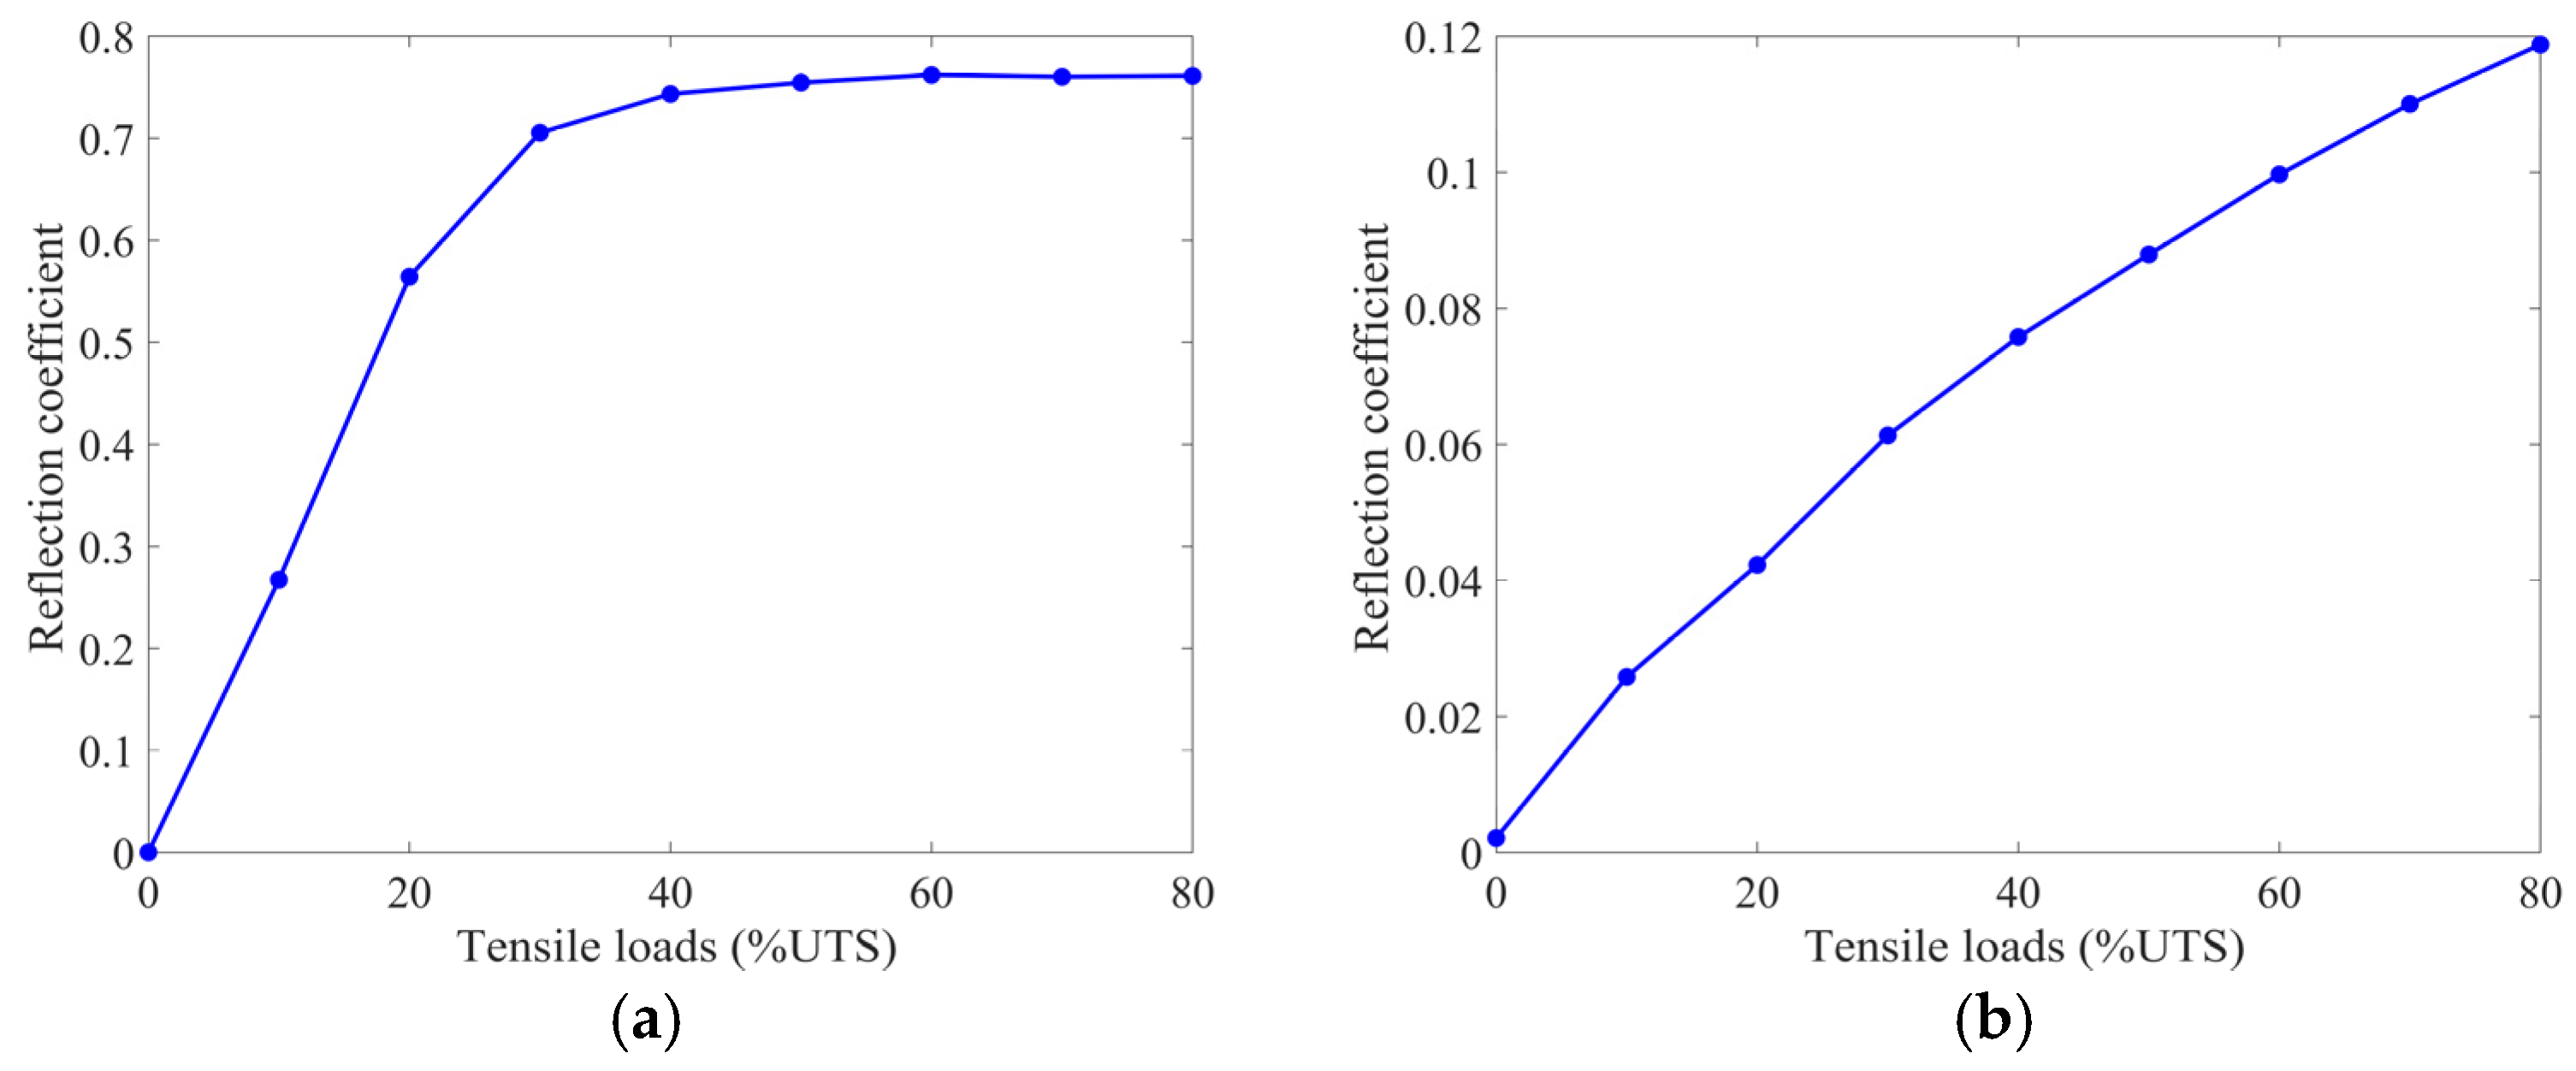
The reflection coefficients extracted from the simulated signals are summarized in Figure 14. Under 80% UTS, the reflection coefficient reaches 0.761 at 80 kHz and 0.120 at 240 kHz. These values are much larger than those obtained from the stress-induced acoustoelastic simulation, indicating that interfacial contact evolution is a more plausible major contributor to the strong anchorage-induced reflections. However, because the model is an equivalent axisymmetric representation, the calculated reflection coefficients should be interpreted mainly in terms of order of magnitude and load-dependent trend rather than exact quantitative agreement. The effects of helical strand geometry, local wedge teeth, inter-wire contact, and detailed strand-level mode conversion are not explicitly resolved in this simplified model, but are represented through the equivalent interfacial stiffness.
Figure 14.
Finite element modeling of reflection coefficients for the anchorage segment: (a) 80 kHz; (b) 240 kHz.
3.3. Sensitivity to Equivalent Interfacial Roughness
As noted in Section 3.2, the baseline spring-contact simulation adopted a nominal equivalent root-mean-square roughness of 400 nm. Since this value was not directly measured from the strand–wedge or wedge–anchorage interfaces, a sensitivity analysis was conducted to examine whether the main conclusion depends on this specific roughness assumption. The equivalent roughness u0 was varied from 200 to 600 nm with an interval of 200 nm, while all other model parameters, boundary conditions, and excitation settings were kept unchanged.
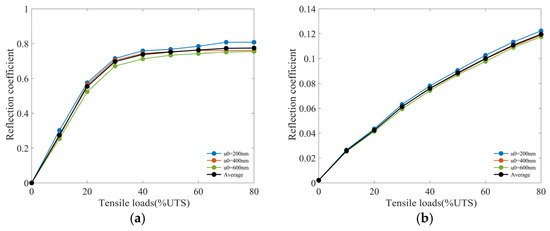
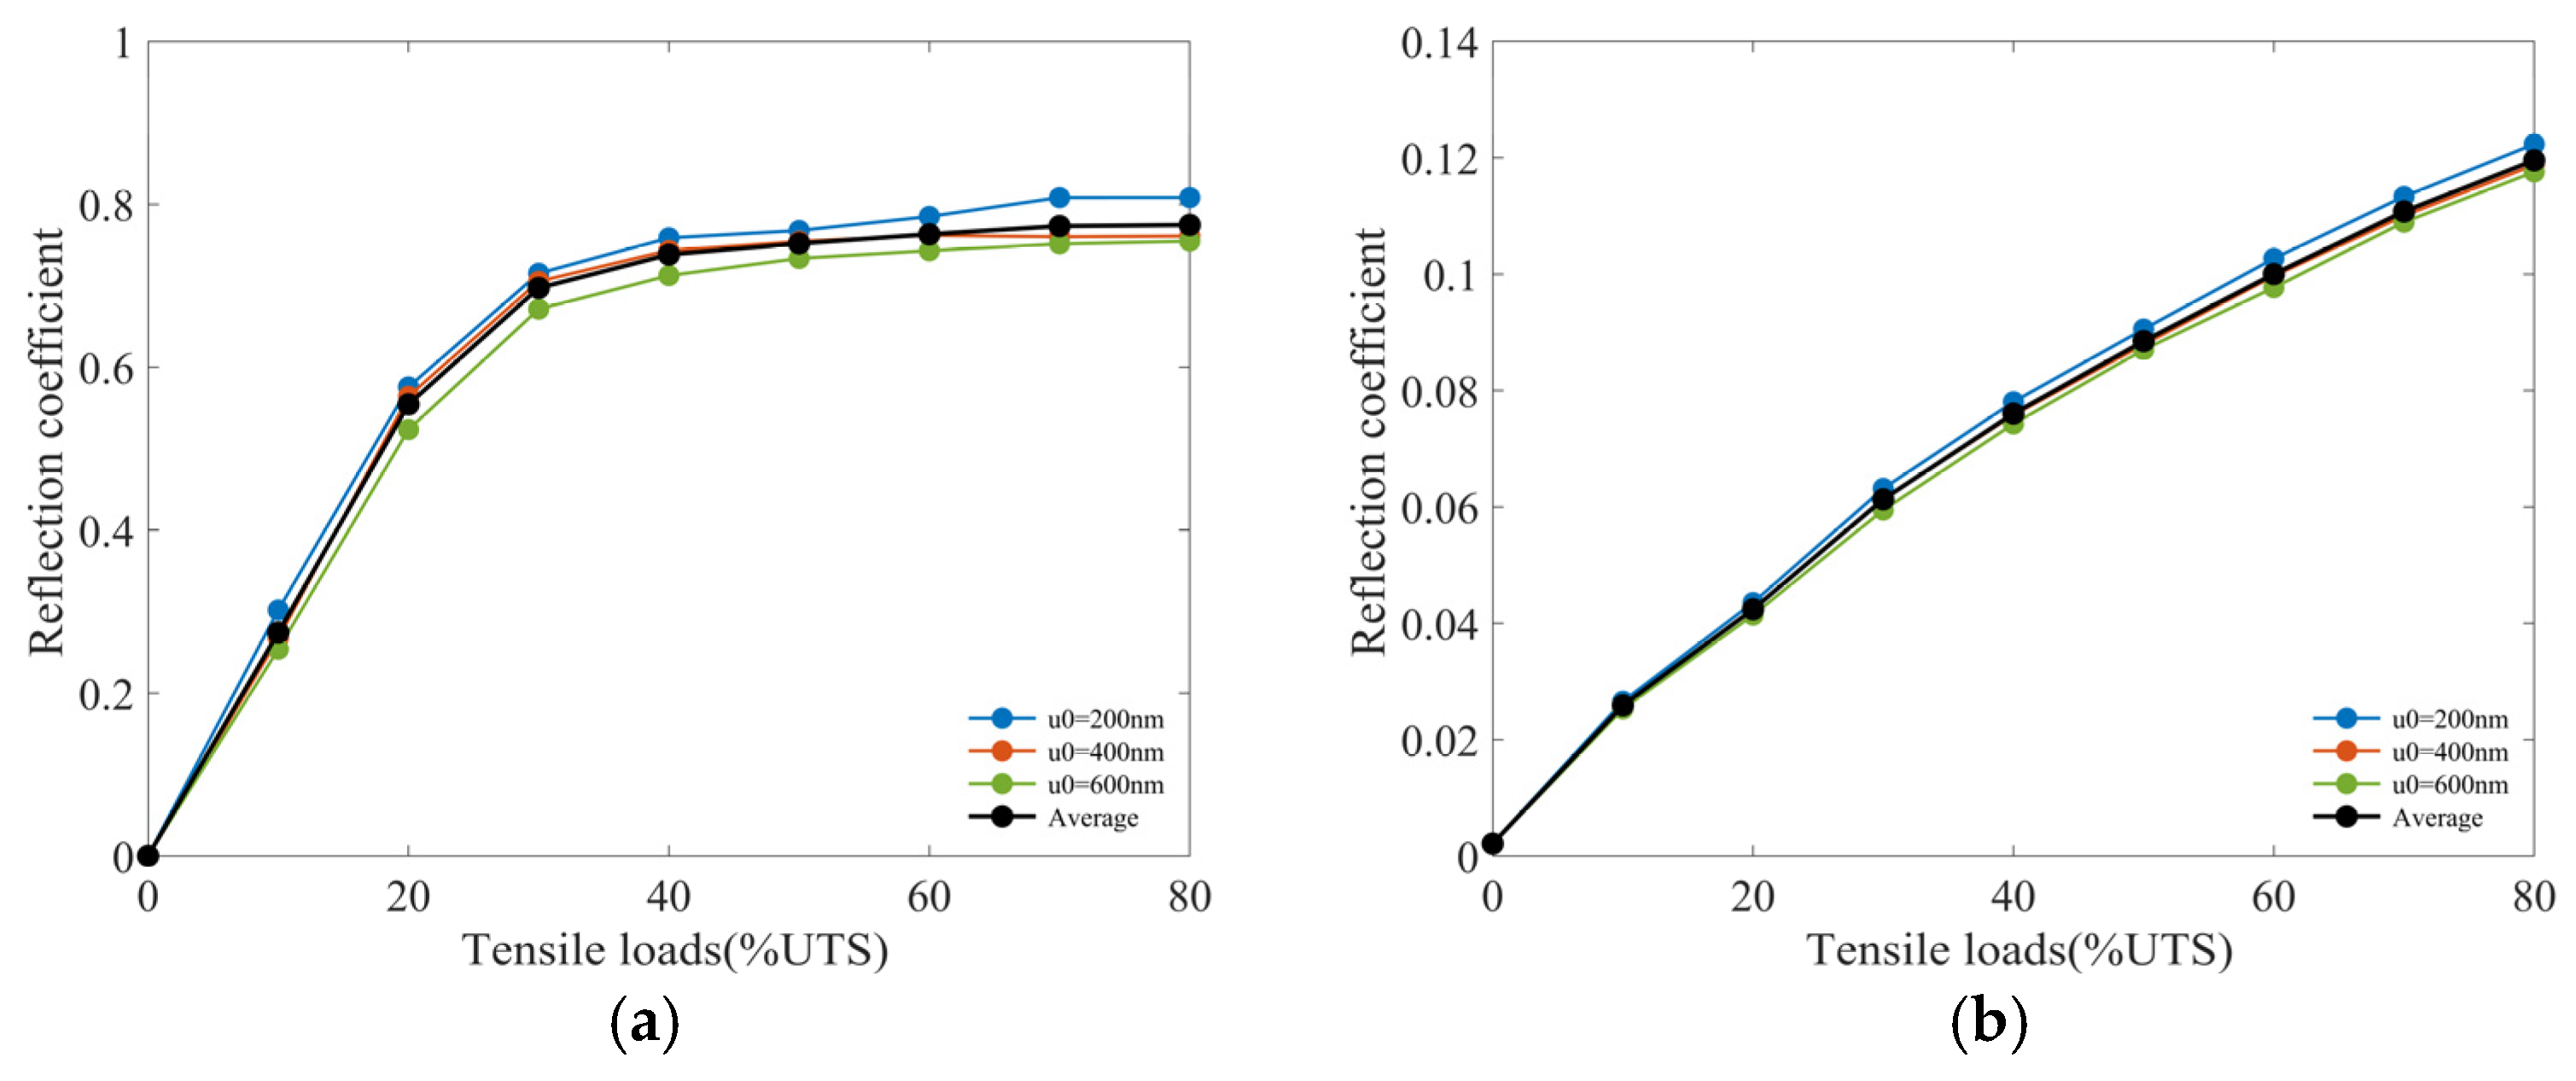
The corresponding reflection coefficients at 80 kHz and 240 kHz are shown in Figure 15. As expected from Equation (8), changing u0 modifies the calculated interfacial stiffness and therefore affects the absolute value of the simulated reflection coefficient. A smaller equivalent roughness generally corresponds to a stiffer contact interface and stronger coupling between the strand and the anchorage components, whereas a larger equivalent roughness leads to a lower equivalent contact stiffness and weaker anchorage-induced reflection. Nevertheless, the load-dependent trends remain similar within the investigated roughness range. At 80 kHz, the reflection coefficient shows a generally increasing tendency with load, with a higher sensitivity in the low-load range. At 240 kHz, the reflection coefficient exhibits a generally increasing load-dependent tendency. More importantly, for all investigated roughness values, the contact-induced reflection remains much larger than the stress-induced acoustoelastic reflection estimated in Section 3.1.
Figure 15.
Sensitivity of the finite element modeling reflection coefficient to the equivalent interfacial roughness: (a) 80 kHz; (b) 240 kHz.
Therefore, the interpretation that interfacial contact evolution provides a stronger contribution to anchorage-induced reflections is not dependent on the specific baseline assumption of u0 = 400 nm.
4. Experimental Investigation
4.1. Experiment Setup
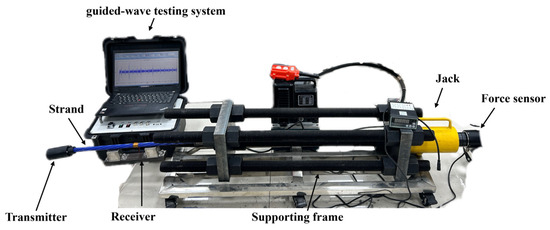
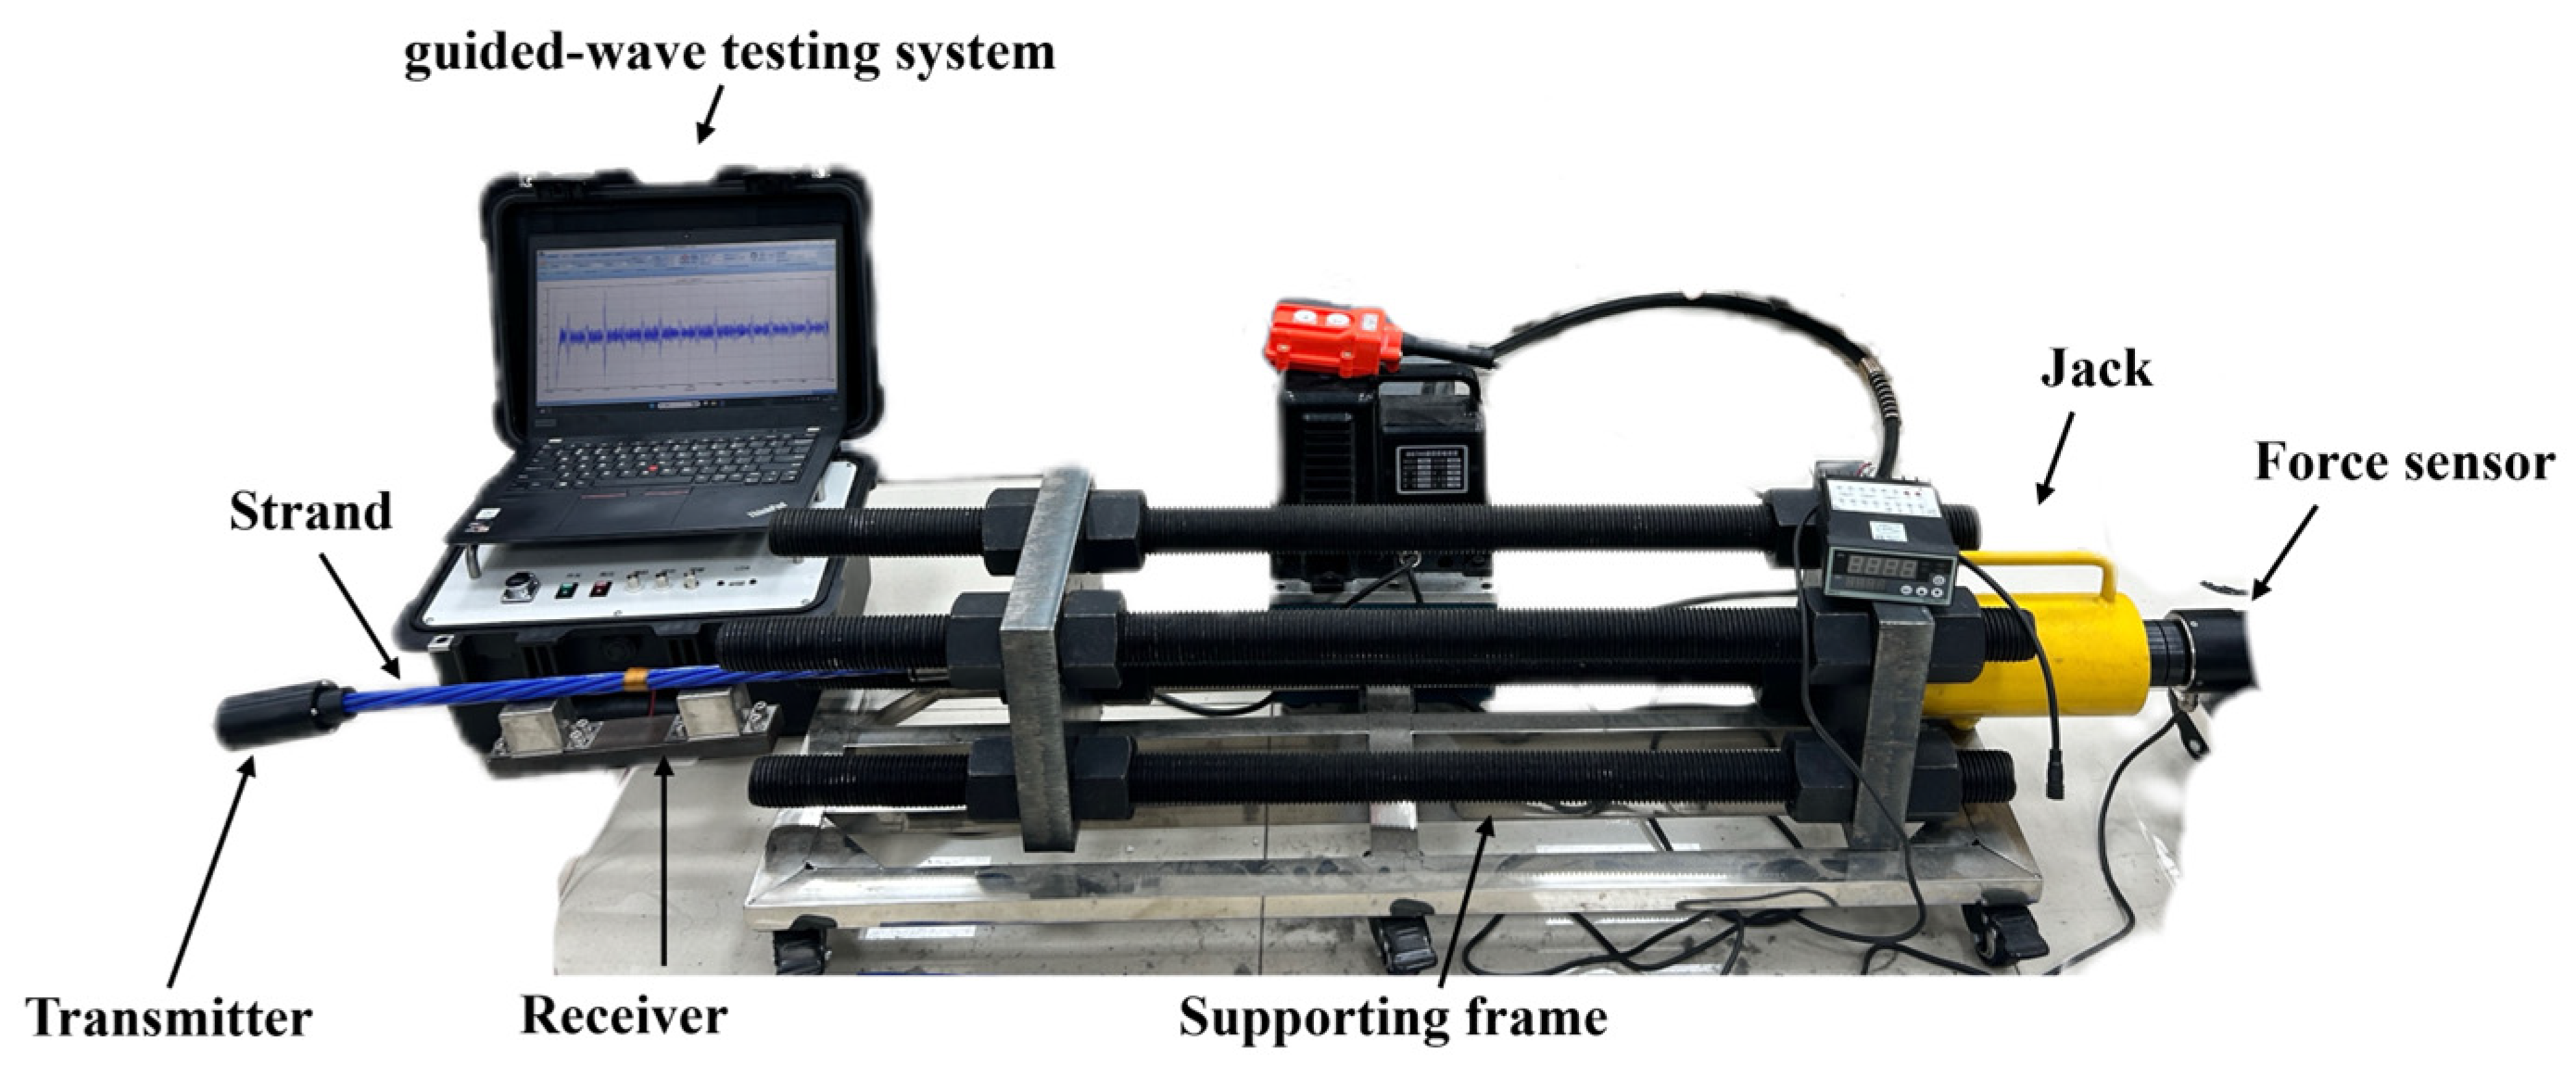
To examine whether the load-dependent trends predicted by the equivalent contact model could be observed experimentally and reproduced across nominally identical specimens, stepwise tensioning tests were conducted on three prestressed strand anchorage specimens. The tests were performed using the same laboratory loading platform as that reported by Wang [23], and a photograph of the experimental setup used in the present study is shown in Figure 16. Each specimen was a low-relaxation seven-wire prestressed steel strand conforming to ASTM A416-270 (commercially purchased from Foshan Nanhai District Mingyuansheng Hardware Store, Foshan, Guangdong, China). The nominal strand diameter was 15.2 mm, the nominal diameter of each outer wire was 5 mm, the ultimate tensile strength was 1860 MPa, and the specimen length was 2.0 m. A single-hole prestressed anchorage (commercially purchased from Liuzhou Liunan District Henggu Prestressing Technology Business Department, Liuzhou, Guangxi, China) was used. The tensile loading system consisted mainly of a 20 t axial hydraulic jack (commercially purchased from Liuzhou Liunan District Henggu Prestressing Technology Business Department, Liuzhou, Guangxi, China), a high-strength alloy-steel supporting frame (custom-built by Huazhong University of Science and Technology, Wuhan, China), and a 260 kN axial force sensor (commercially purchased from Bengbu Economic Development Zone Senser Electronic Products Business Department, Bengbu, Anhui, China). These loading components were commercially available quasi-static loading fixtures selected according to the required load capacity. Guided-wave inspection was carried out using a self-developed GWM electromagnetic ultrasonic guided-wave testing system (Huazhong University of Science and Technology, Wuhan, China). The excitation signal was a three-cycle Hann-windowed sinusoidal burst with a peak voltage of 200 V. The receiving-circuit gain was adjustable within 60–70 dB, and the hardware filter passband was 50 kHz–5 MHz, with the specific filter range selected according to the excitation center frequency. To improve the signal-to-noise ratio, each recorded signal was averaged over 100 acquisitions.
Figure 16.
Photograph of the experimental setup for the stepwise tensioning test and guided-wave measurement of the prestressed strand anchorage specimen.
To avoid interference from bidirectional wave propagation, the transmitter was placed at the end of the free segment of the strand, at a distance of 0.5 m from the proximal anchorage. The receiver was located between the excitation transducer and the proximal anchorage. Before the stepwise loading test, each strand was first tensioned to 80% UTS and maintained for 24 h. This preloading procedure was designed to reproduce the seated anchorage condition encountered in practical prestressed systems, in which the wedges have already been driven into the anchorage ring and the strand–anchorage interfaces are not pristine free interfaces. The load was then completely removed, and the subsequent stepwise test was conducted from 0 to 80% UTS in increments of 10%. After the force reading stabilized at each load level, guided-wave signals at 80 kHz and 240 kHz were collected. Consequently, the 0% UTS condition in the stepwise test should be interpreted as an unloaded but conditioned-interface baseline after anchorage seating, rather than as a pristine stress-free interface. A measurable reflection coefficient at 0% UTS is therefore physically expected because residual interfacial contact and seating-induced interface changes remain after unloading.
4.2. Results and Discussion
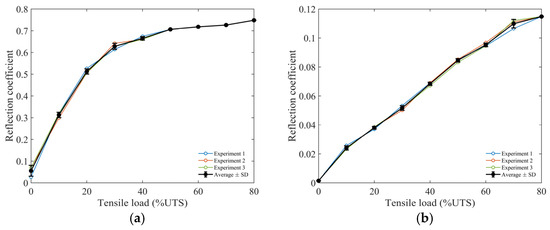
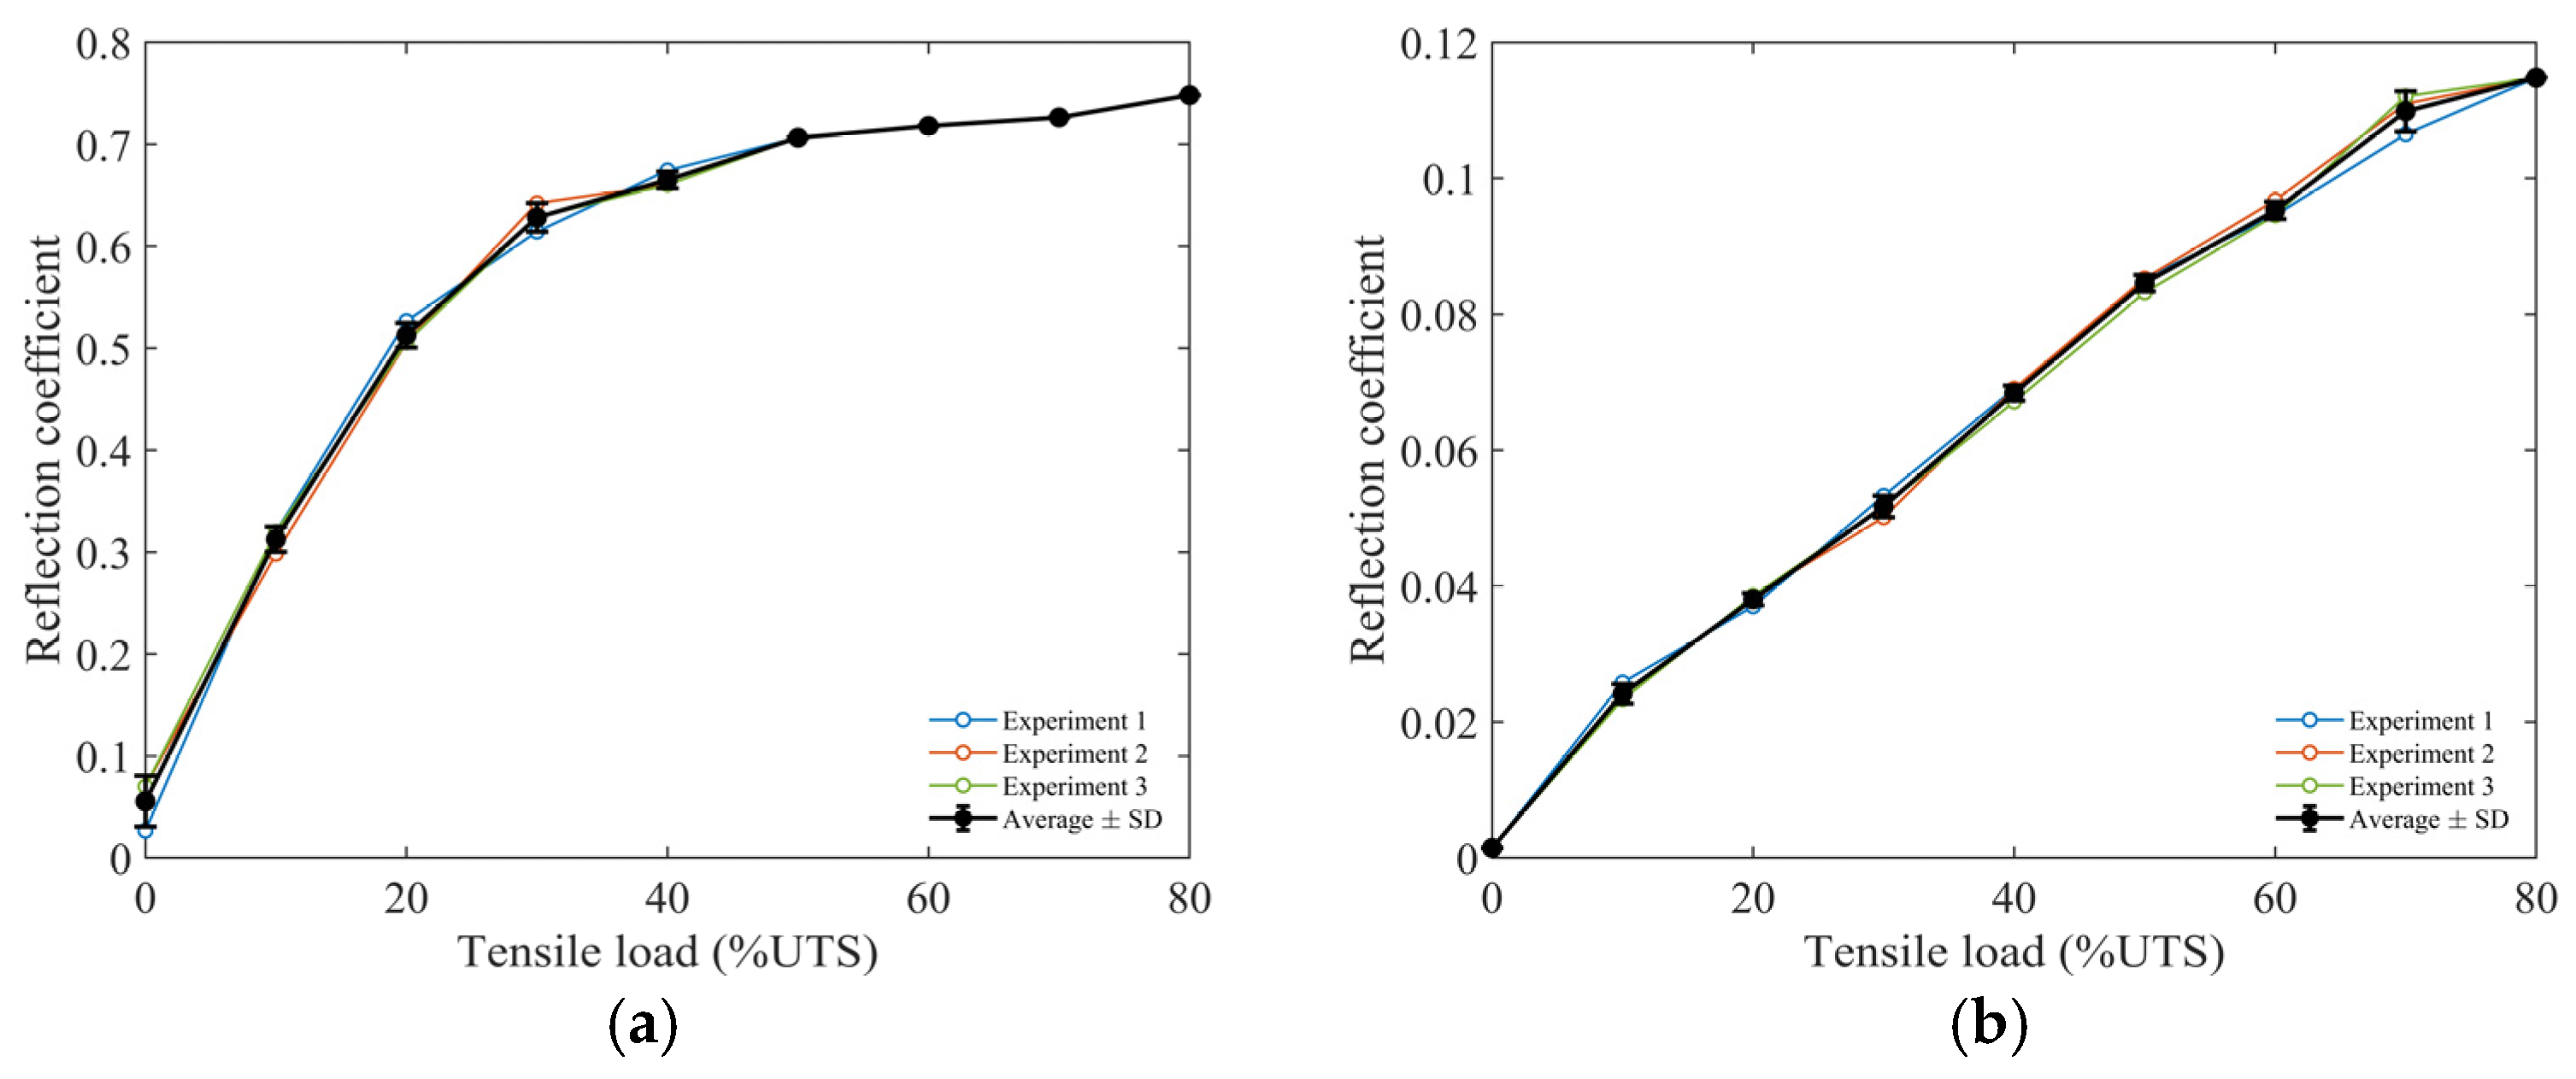
Representative time-domain signals obtained under different tensile loads are shown in Figure 17, and the reflection coefficients measured from the three nominally identical specimens are summarized in Figure 18 together with their average curve and standard deviation error bars. The comparison is intended to evaluate the repeatability of the load-dependent trend and its consistency with the contact-stiffness mechanism, rather than exact quantitative agreement with a fully calibrated contact model. At 80 kHz, the experimental reflection coefficient increases rapidly within the low-load range and then tends to stabilize. This behavior is consistent with the relatively long wavelength of the 80 kHz wave packet. Using the estimated guided-wave velocity [23], the wavelength scale at 80 kHz is comparable to the effective anchorage length listed in Table 1. Therefore, the 80 kHz response is sensitive to the global transition of the anchorage boundary condition and to the closure of macroscopic interfacial gaps. Once the main gaps are closed, further load increase mainly compacts smaller asperity-scale contacts, to which the long-wavelength response is less sensitive.
Figure 17.
Representative experimental time-domain waveforms at the receiver under varying tensile loads: (a) time-domain signal at 80 kHz; (b) enlarged main peaks of reflected waves from the anchorage segment at 80 kHz; (c) time-domain signal at 240 kHz; (d) enlarged main peaks of reflected waves from the anchorage segment at 240 kHz.
Figure 18.
Reflection coefficients measured from three nominally identical strand–anchorage specimens and their average values with standard deviation error bars: (a) 80 kHz; (b) 240 kHz. The error bars indicate ±1 standard deviation calculated from the three specimens at each tensile-load level.
At 240 kHz, the wavelength is approximately one third of that at 80 kHz and is therefore more sensitive to finer changes in the evolving contact state, resulting in a more gradual load-dependent increase. The three repeated specimens show the same overall monotonic tendency at both frequencies, and the average curve captures the common load-dependent behavior. Specimen-to-specimen differences are mainly attributed to variations in wedge seating, local contact condition, and transducer coupling. Although dissipative mechanisms such as material damping, frictional loss, scattering from local geometric details, and imperfect transducer coupling are present in the real experiment, they mainly affect absolute amplitudes and do not alter the observed order of magnitude or the repeated load-dependent trend of the reflection coefficient. The results therefore provide trend-level experimental support for the interpretation that interfacial contact evolution contributes more strongly to the measured anchorage reflections than stress-induced acoustoelastic impedance variation. Because the initial preloading establishes a conditioned-interface baseline, the experimental trends should be interpreted as load-dependent changes superimposed on this seated anchorage state rather than as the response of a pristine interface from zero load.
To directly show the specimen-to-specimen variability, the average reflection coefficient at each tensile-load level is plotted with ±1 standard deviation error bars calculated from the three repeated specimens. The individual specimen curves are also retained in Figure 18. Therefore, the figure presents both the repeatability of the load-dependent trend and the scatter associated with local wedge seating, interfacial contact condition, and transducer coupling among nominally identical specimens. Although specimen-to-specimen scatter is observed, the three repeated specimens show a consistent load-dependent trend at both frequencies. Therefore, the repeated tests support the trend-level repeatability and order of magnitude of the anchorage-reflection response, rather than exact specimen-to-specimen quantitative equivalence or complete calibration of the equivalent interface-stiffness parameters.
5. Conclusions and Future Work
This study investigated the generation mechanisms of reflected echoes in prestressed strand anchorage segments during through-anchorage ultrasonic guided-wave inspection. Acoustoelastic modelling, equivalent spring-contact simulation, roughness-sensitivity analysis, and repeated stepwise tensioning experiments were used to compare the relative importance of stress-induced impedance variation and load-dependent interfacial contact evolution. The main conclusions are as follows.
- (1)
- The acoustoelastic simulations indicate that stress-induced impedance variation alone produces only weak reflections within the investigated load range. Even at 80% UTS, the reflection coefficient remains below 0.0125, suggesting that localized stress concentration is insufficient to explain the strong anchorage echoes observed in the through-anchorage configuration.
- (2)
- The equivalent spring-contact model produces much stronger anchorage reflections than the stress-only acoustoelastic model. As tensile load increases, the strand–wedge and wedge–anchorage interfaces become more strongly coupled, causing the anchorage segment to behave as a constrained composite waveguide. The resulting transition from a nearly free strand boundary to an elastically constrained boundary provides a plausible physical source of the observed anchorage reflections.
- (3)
- The load-dependent reflection trends are frequency-dependent. At 80 kHz, the reflection coefficient increases rapidly at low load levels and then tends to stabilize, which is associated with the closure of macroscopic interfacial gaps and the relatively long wavelength of the wave packet. At 240 kHz, the shorter wavelength remains sensitive to finer-scale changes in interfacial contact, leading to a more gradual load-dependent increase. The roughness-sensitivity analysis further indicates that this trend is not dependent on the specific baseline assumption of u0 = 400 nm.
- (4)
- The stepwise tensioning experiments on three nominally identical specimens show repeatable trends consistent with the contact-stiffness mechanism. Because each specimen was preloaded to seat the anchorage interface, the 0% UTS state should be interpreted as a conditioned-interface baseline rather than a pristine stress-free state. Therefore, the experimental results provide trend-level support for the proposed mechanism rather than a complete quantitative calibration of the interface parameters.
In future research, the focus will be placed on full three-dimensional helical strand modelling, direct characterization of interface conditions, broader multi-configuration validation, and defect-detection experiments to further validate and extend the present findings.
Author Contributions
Conceptualization, Z.Z., C.W. and C.L.; Methodology, Z.Z. and C.W.; Investigation, Z.Z., C.W. and G.L.; Writing—original draft preparation, Z.Z. and C.W.; Writing—review and editing, J.X.; Funding acquisition, J.X. All authors have read and agreed to the published version of the manuscript.
Funding
This research was funded by the National Natural Science Foundation of China, grant number 52575625. The article processing charge (APC) was waived by the journal.
Data Availability Statement
The data presented in this study are available on request from the corresponding author.
Conflicts of Interest
Guoming Li, and Chengcai Liu are employees of Jiangsu XianDai Road and Bridge Co., Ltd. The company had no role in the design of the study; in the collection, analysis, or interpretation of data; in the writing of the manuscript, or in the decision to publish the article. The paper reflects the views of the scientists and not the company.
References
- Dong, Z.; Peng, H.; Liu, T.; Wang, K.; Zheng, J.; Li, H.; Qiu, X. Study on the mechanism of prestress loss caused by friction in the free segment of anchor cables. Constr. Build. Mater. 2024, 413, 134927. [Google Scholar] [CrossRef] [Scilit]
- Li, F.; Liu, Z.; Zhao, Y.; Qu, Y.; Lu, R. Experimental study on corrosion progress of interior bond section of anchor cables under chloride attack. Constr. Build. Mater. 2014, 71, 344–353. [Google Scholar] [CrossRef] [Scilit]
- Liu, S.; Sun, Y.; Jiang, X.; Kang, Y. A review of wire rope detection methods, sensors and signal processing techniques. J. Nondestr. Eval. 2020, 39, 85. [Google Scholar] [CrossRef] [Scilit]
- Shams, S.; Ghorbanpoor, A.; Lin, S.; Azari, H. Nondestructive testing of steel corrosion in prestressed concrete structures using the magnetic flux leakage system. Transp. Res. Rec. 2018, 2672, 132–144. [Google Scholar] [CrossRef] [Scilit]
- Azari, H.; Ghorbanpoor, A.; Shams, S. Development of robotic nondestructive testing of steel corrosion of prestressed concrete bridge girders using magnetic flux leakage system. Transp. Res. Rec. 2020, 2674, 466–476. [Google Scholar] [CrossRef] [Scilit]
- Ma, G.; Du, Q. Structural health evaluation of the prestressed concrete using advanced acoustic emission (AE) parameters. Constr. Build. Mater. 2020, 250, 118860. [Google Scholar] [CrossRef] [Scilit]
- Abdel-Jaber, H.; Glisic, B. Monitoring of prestressing forces in prestressed concrete structures—An overview. Struct. Control Health Monit. 2019, 26, e2374. [Google Scholar] [CrossRef] [Scilit]
- Fernandes, B.; Nims, D.; Devabhaktuni, V. Comprehensive MMF–MFL inspection for corrosion detection and estimation in embedded prestressing strands. J. Civ. Struct. Health Monit. 2014, 4, 43–55. [Google Scholar] [CrossRef] [Scilit]
- Peng, P.-C.; Wang, C.-Y. Use of gamma rays in the inspection of steel wire ropes in suspension bridges. NDT E Int. 2015, 75, 80–86. [Google Scholar] [CrossRef] [Scilit]
- Raveendran, T.; Hénault, J.-M.; Recoquillay, A.; D’Urso, G.; Vautrin, D.; Garnier, V.; Mailhe, J.; Bisarah, P. Inspection of Concrete/Steel/Concrete pipes by ultrasonic methods affected by corrosion. e-J. Nondestruct. Test. 2022, 27, 9. [Google Scholar] [CrossRef] [Scilit]
- Dorval, V.; Imperiale, A.; Darmon, M.; Demaldent, E.; Hénault, J.-M. FEM-based simulation tools for ultrasonic concrete inspection. e-J. Nondestruct. Test. 2022, 27, 9. [Google Scholar] [CrossRef] [Scilit]
- Darmon, M.; Khalid, N.; Ramaniraka, M.; Dorval, V.; Hénault, J.-M.; Chaix, J.-F. Modeling of ultrasonic velocity and attenuation for concrete inspection: A review. Ultrasonics 2025, 154, 107690. [Google Scholar] [CrossRef] [Scilit]
- Khalid, N.; Darmon, M.; Chaix, J.-F. Homogenization model for a dense elastic medium of cylindrical scatterers and based on a realistic pair correlation function. J. Sound Vib. 2026, 620, 119442. [Google Scholar] [CrossRef] [Scilit]
- Rizzo, P.; di Scalea, F.L. Feature extraction for defect detection in strands by guided ultrasonic waves. Struct. Health Monit. 2006, 5, 297–308. [Google Scholar] [CrossRef] [Scilit]
- Xu, J.; Wu, X.J.; Wang, L.Y.; Huang, C.; Kang, Y. Detecting the flaws in prestressing strands using guided waves based on the magnetostrictive effect. Insight 2007, 49, 647–650. [Google Scholar] [CrossRef] [Scilit]
- Tse, P.W.; Liu, X.C.; Liu, Z.H.; Wu, B.; He, C.F.; Wang, X.J. An innovative design for using flexible printed coils for magnetostrictive-based longitudinal guided wave sensors in steel strand inspection. Smart Mater. Struct. 2011, 20, 055001. [Google Scholar] [CrossRef] [Scilit]
- Huynh, T.C.; Kim, J.T. RBFN-based temperature compensation method for impedance monitoring in prestressed strand anchorage. Struct. Control Health Monit. 2018, 25, e2173. [Google Scholar] [CrossRef] [Scilit]
- Dang, N.L.; Huynh, T.C.; Pham, Q.Q.; Lee, S.-Y.; Kim, J.-T. Damage-sensitive impedance sensor placement on multi-strand anchorage based on local stress variation analysis. Struct. Control Health Monit. 2020, 27, e2547. [Google Scholar] [CrossRef] [Scilit]
- Drinkwater, B.W.; Dwyer-Joyce, R.S.; Cawley, P. A study of the interaction between ultrasound and a partially contacting solid—Solid interface. Proc. R. Soc. A 1996, 452, 2613–2628. [Google Scholar] [CrossRef] [Scilit]
- Mo, D.; Zhang, L.Y.; Wang, L.; Wu, X. A PZT active sensing method for monitoring prestressing force based on the ultrasonic reflection coefficient. Measurement 2024, 228, 114348. [Google Scholar] [CrossRef] [Scilit]
- Gonzalez-Valadez, M.; Baltazar, A.; Dwyer-Joyce, R.S. Study of interfacial stiffness ratio of a rough surface in contact using a spring model. Wear 2010, 268, 373–379. [Google Scholar] [CrossRef] [Scilit]
- Qian, J.; Zhou, L.Q.; Qiao, Z.Z.; Song, S.J.; Wang, F. Characterization of stresses under anchor in prestressing steel strands by contact properties at the anchorage interface. Structures 2025, 80, 109768. [Google Scholar] [CrossRef] [Scilit]
- Wang, C.; Xiao, W.J.; Xu, J. The effect of frequency on the propagation of L (0,1) guided waves in the prestressed strand anchorage segment. Appl. Acoust. 2025, 239, 110859. [Google Scholar] [CrossRef] [Scilit]
- Zima, B.; Rucka, M. Non-destructive inspection of ground anchors using guided waves propagation. Int. J. Rock Mech. Min. Sci. 2017, 94, 90–102. [Google Scholar] [CrossRef] [Scilit]
- Zima, B.; Rucka, M. Guided ultrasonic waves for detection of debonding in bars partially embedded in grout. Constr. Build. Mater. 2018, 168, 124–142. [Google Scholar] [CrossRef] [Scilit]
- Ren, L.; Zhu, B.L.; Li, J.; Wang, Q. A novel model for detecting prestress by external anchor head section of prestressed anchor cables. Ocean Eng. 2024, 311, 118978. [Google Scholar] [CrossRef] [Scilit]
- Pilarski, A.; Rose, J.L. A transverse-waves ultrasonic oblique-incidence technique for interfacial weakness detection in adhesive bonds. J. Appl. Phys. 1988, 63, 300–307. [Google Scholar] [CrossRef] [Scilit]
- Campañá, C.; Persson, B.N.J.; Müser, M.H. Transverse and normal interfacial stiffness of solids with randomly rough surfaces. J. Phys. Condens. Matter 2011, 23, 085001. [Google Scholar] [CrossRef] [Scilit]
- ASTM A416/A416M-24; Standard Specification for Low-Relaxation, Seven-Wire Steel Strand for Prestressed Concrete. ASTM International: West Conshohocken, PA, USA, 2024.

Disclaimer/Publisher’s Note: The statements, opinions and data contained in all publications are solely those of the individual author(s) and contributor(s) and not of MDPI and/or the editor(s). MDPI and/or the editor(s) disclaim responsibility for any injury to people or property resulting from any ideas, methods, instructions or products referred to in the content. |
© 2026 by the authors. Licensee MDPI, Basel, Switzerland. This article is an open access article distributed under the terms and conditions of the Creative Commons Attribution (CC BY) license.