


Abstract
A new electronic tester consisting of capacitive sensors and optical sensors is now introduced into raw silk inspection. Compared with the traditional seriplane test, the quality indices change a lot. In assessing the yarn evenness, the electronic tester measures the coefficient of variation of the raw silk size (CVeven%, CV5 m%, CV50 m%), while the seriplane uses evenness II. In assessing the yarn defects, the electronic tester measures the slubs, thick places and thin places, SIE (small imperfection element), while the seriplane test uses cleanness and neatness. However, raw silk users who have been used to the seriplane test report want to know how to interpret the electronic test indices, they want to be convinced by knowing the correlation between the indices of the two test systems. In this study 50 lots of raw silk are sampled and tested by the two test systems, and the correlation coefficients of the corresponding indices are computed and analyzed. The result shows that there are significant correlation between evenness II and CV5 m%, a strong correlation between cleanness and slub by the optical sensor, a strong correlation between neatness and SIE by both the capacitive and the optical sensor, and a strong correlation between neatness and the thick and thin places by optical sensor. The result confirms the substitution of the electronic test for seriplane test in future from the technical viewpoint.
1. Introduction
Decades ago, seriplane test was often used to inspect textile yarns. However, this kind of test method mainly relies on the examiner’s subjective judgment and experience [1], thus the test results have low repeatability. Under such circumstance, the automatic testing method was proposed, and experts had made great efforts to study the automatic test method. Generally the following methods, the capacitive method [2], the CCD (Charged Coupled Device) digital image processing method [1,3], and the photoelectric method [2,4], are developed to test the defects and evenness of yarns automatically.
The Switzerland Uster Company has developed a series of Uster testers using the capacitive method. At present, the Uster yarn evenness tester has been greatly used in cotton, wool, and chemical fiber industry except for the silk industry. In 1991, an automatic testing and grading draft based on the Uster-III yarn evenness tester was submitted to the conference of International Silk Association (ISA), but failed to pass. One of the reasons is that the Uster tester is not fit for raw silk test. In the raw silk test by Uster tester, much sericin is rubbed off the silk filament, which affects the results greatly, and the test efficiency is also low. Most importantly some studies [5,6,7] have found that there were great differences between the test results of the Uster tester and seriplane test, and that during the test of the raw silk faults and imperfections, the Uster tester cannot get the same quality information as the seriplane test [6]. No obvious correlation between cleanness by seriplane test and neps by Uster tester, and no obvious correlation between neatness and total imperfections were found [7].
For the next decades, there were no universal raw silk test standards in the international raw silk trade, which brought many difficulties and disputes in the international silk trade. Thus during the period, experts continued to study for a good method to test the defects and evenness of raw silk yarns automatically [8,9,10]. A new test means for raw silk using capacitive sensors and optical sensors altogether was developed by the Japanese Keisoki Company. Using this technique, China and Italy have developed a new electronic tester for raw silk, and this tester has been put into use for many years [11]. As there are 12 spindles in the tester, 12 samples can be tested at the same time, while the Uster-III tester can only test one sample at the same time, the test efficiency is highly enhanced. The tested silk yarns can be collected by a winding device, while the Uster-III tester cannot collect the yarns without damage. Thus the electronic tester is greatly valued by the global silk industry. An international work group including experts from 8 countries is now developing an ISO standard on the test method under ISO directives.
However, with the introduction of the new electronic test method for silk inspection, the raw silk buyers or the twisted yarn manufacturers have to face a different raw material quality report, as the two test systems have different test principles and methods, the test indices are consequently different. In the seriplane test the quality information of raw silk defects are mainly expressed by the indices of cleanness and neatness, the evenness information are mainly expressed by the indices of evenness II and evenness III. And correspondingly, in the electronic test the defects and evenness information are expressed by the indices of small slub, big slub, thick places and thin places, Small Imperfection Elements (SIE), coefficient of variation of the raw silk size (CVeven%, CV5 m%, CV50 m%) . Thus, some companies, for example, the France company Hermes who uses a great deal of high quality silk in their ties, scarves, and silk bags, are against the ISO draft on the new electronic test just because they are familiar with the seriplane report, and are not sure if the electronic tester is as reliable as the seriplane test. Under such circumstance, this study focuses on studying the intensity of the correlation between the corresponding quality indices of the two test method, and tries to reveal the reason for their correlation extent by comparing the definition or test rules of the indices of the two different test systems, and thus to convince the raw silk downstream manufacturers that the new electronic test means can get the same quality results as the seriplane test in a more objective and efficient manner.
2. Experimental
2.1. Sample Preparation
To find the correlations between the seriplane test indices and the electronic test indices, 50 lots of raw silk are tested. For the seriplane test, 25 skeins are taken randomly from one lot of raw silk, and each skein is wound into four packages. The skeins are wound from different positions: 10 from surface end, 10 from inside end, 3 from the region one quarter to the surface end, 2 from the region one quarter to the inside end. Thus 100 packages are prepared. Fifty packages are taken randomly from the 100 packages, and wound onto the seriplane board with uniform spacing. Thus the samples will consist of a total of 100 panels from the 50 packages at the rate of two panels from each package [12].
For the electronic test, 24 skeins are taken randomly from one lot of raw silk, and wound into 12 packages at the rate of one package from every two skeins. 10 from the surface end, 10 from the inside end, 2 from the region one quarter to the surface end, 2 from the region one quarter to the inside end. Each package has a length of 13 km, and thus the test sample of each lot has a total length of 156 km [13].
All the test samples are conditioned under a standard atmosphere of 65±5% relative humidity and 20±2 °C temperature for 24 h.
2.2. Test Method
2.2.1. Seriplane Test
The seriplane test is carried out in the inspection room with special lighting design. The three test indices of evenness, cleanness, and neatness are evaluated by the seriplane test. For the evenness test, the examiner should assess the seriplane panels at a distance of about 2.1 m in front of the panels [12]. The uneven stripes on the panels should be judged from its width and degree carefully compared with the standard variation photographs. Evenness variations have been classified into Evenness Variation I, II and III according to their different intensity of variations. However, Evenness I has little effect on the silk yarn quality, and Evenness III is rare, thus the two indices will not be discussed in this study. The Evenness II is expressed by the total number of stripes of the 100 panels.
For the cleanness and neatness test, the panels are examined from the position of 0.5 m [12], and are compared with the standard photographs. The cleanness mainly includes super major, major, and minor defects, while the neatness includes the defects which are smaller than the minor cleanness defects. For the cleanness test, each kind of defects should be given penalty points according to the Chinese Raw Silk Standard. The final cleanness value should be the result subtracting by the total penalty from 100. For neatness test, each panel is assessed by comparing with the standard photographs rated as 100, 90, 80, 70, 60, 50, 30, 10. The average value of the 100 panels is recorded as the final neatness result.
2.2.2. Electronic Test
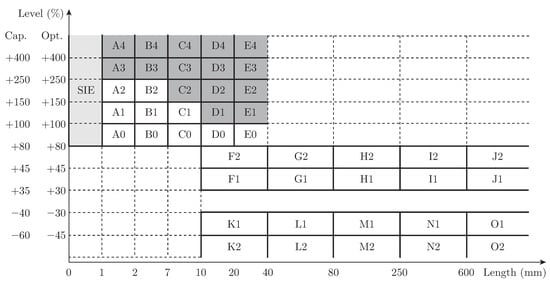
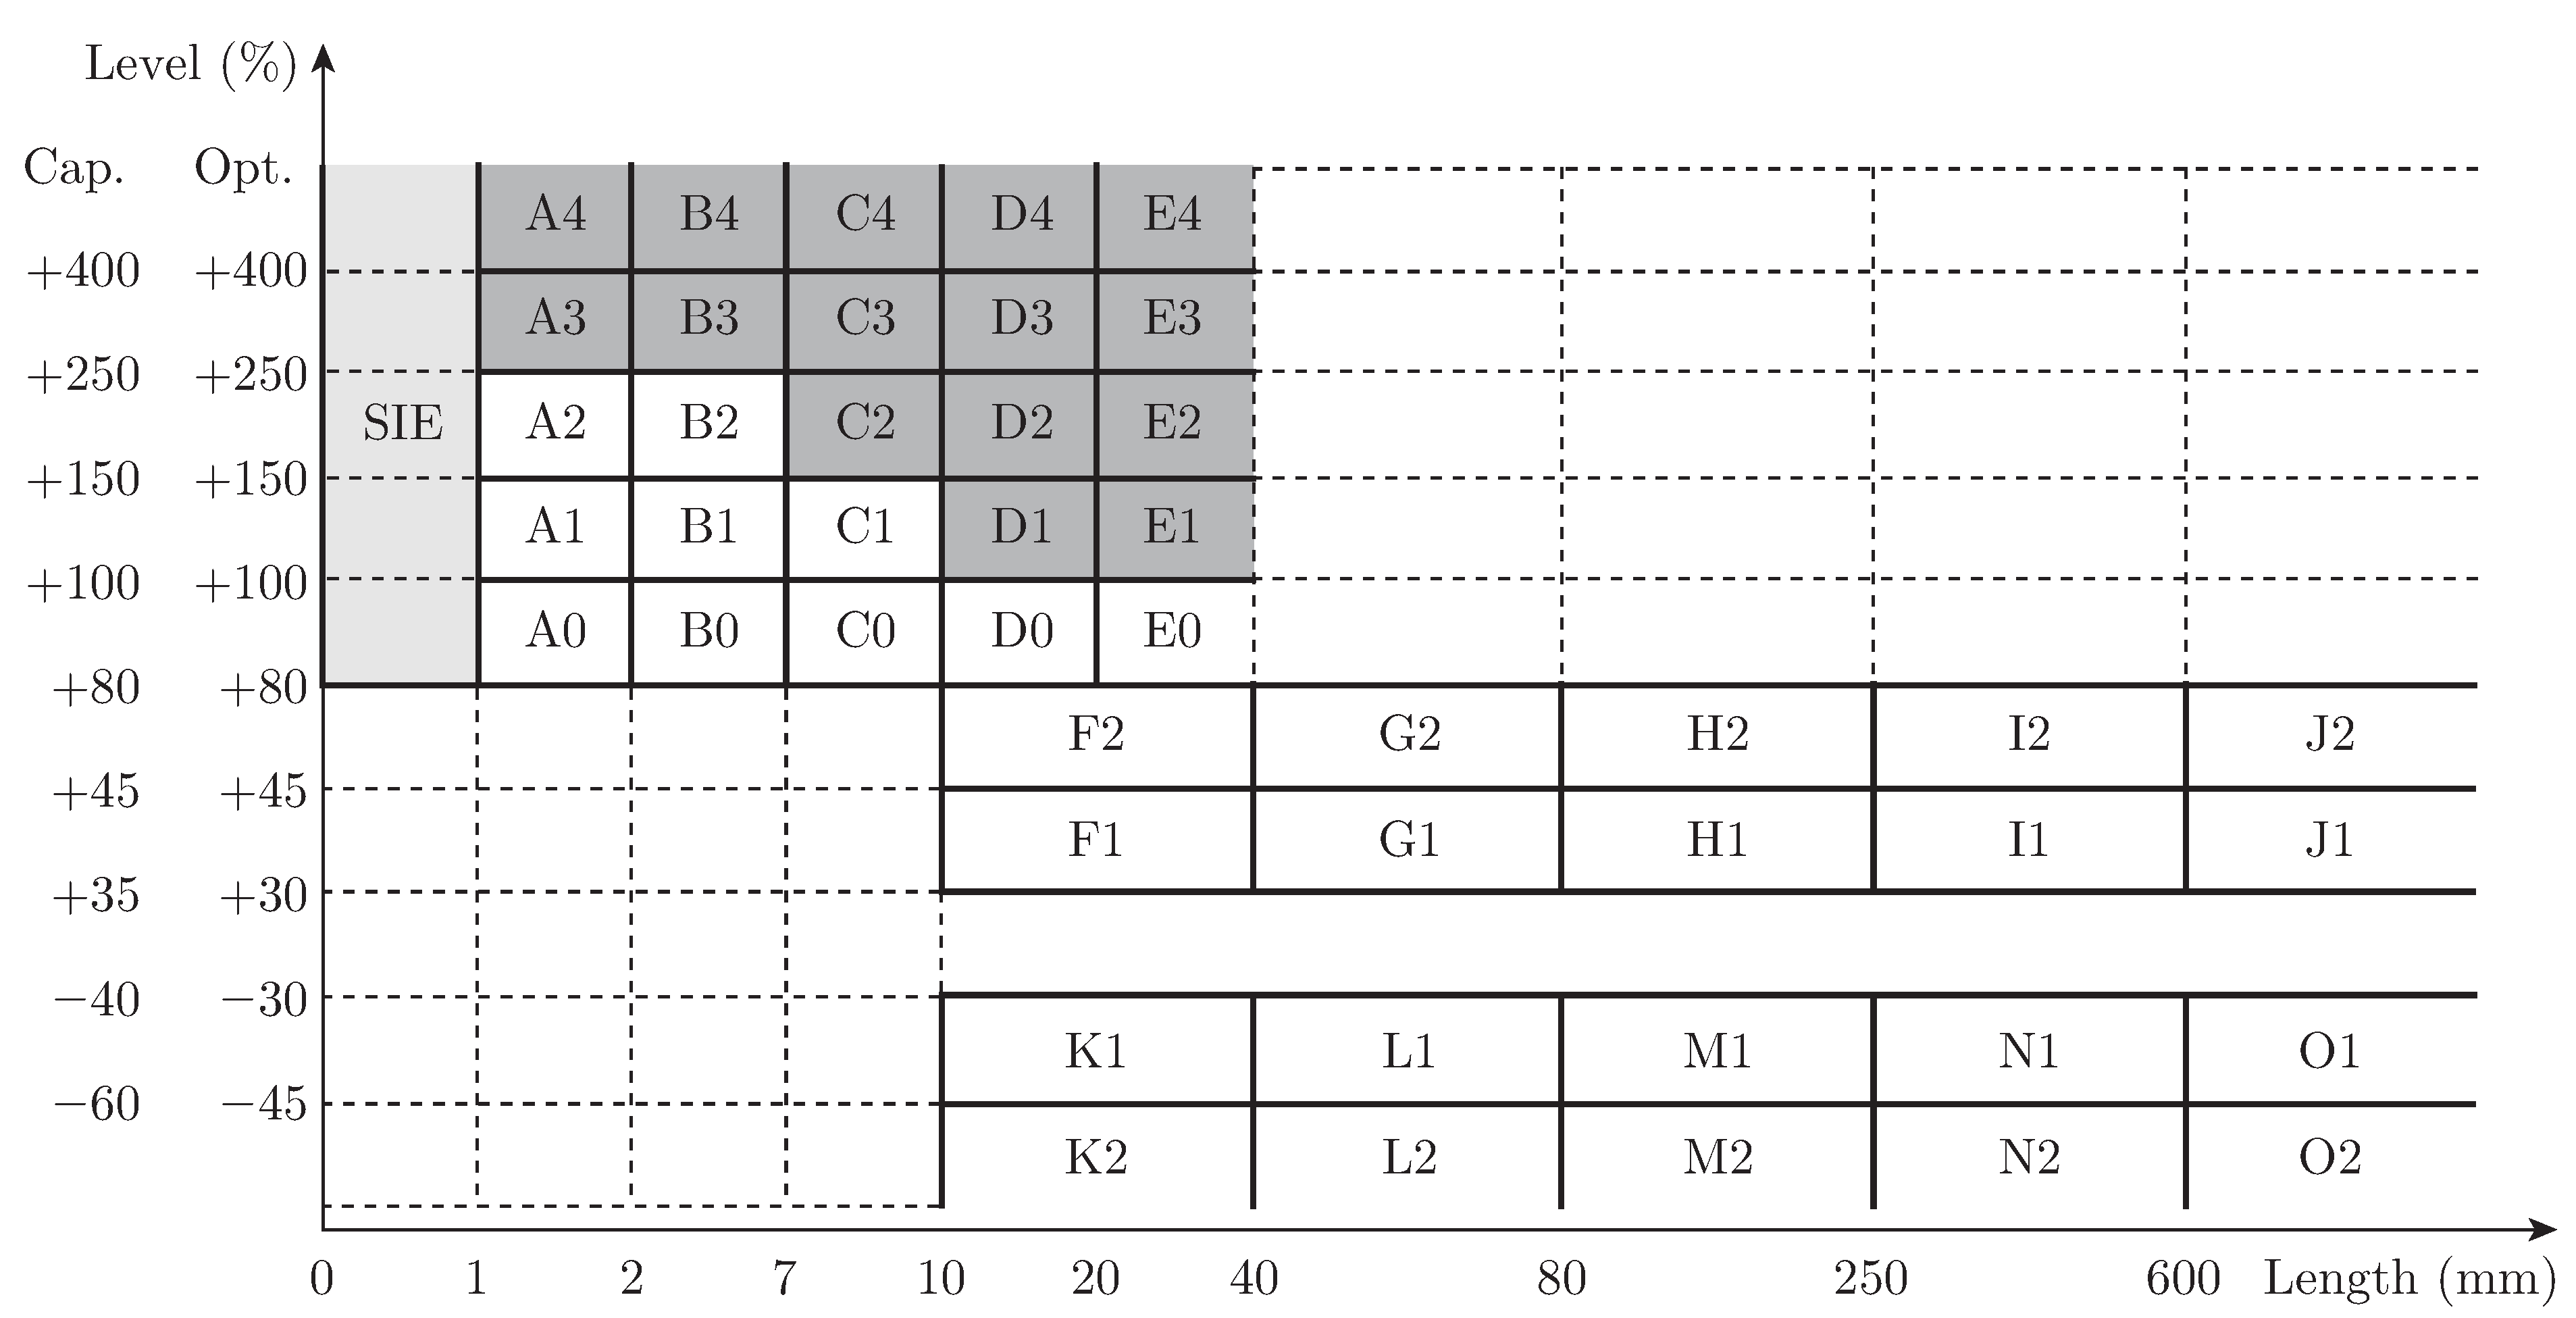
The electronic tester has 12 spindles, and can test 12 packages at the same time. For each spindle, two capacitive sensors and one optical sensor work together. When the silk filament passes through the sensors, one capacitive sensor and the optical sensor test the defects respectively, while another capacitive sensor tests the evenness at the same time. For capacitive sensor, each defect is judged according to their length and mass variation comparing with the average mass; and the defects are classified into 46 classes (region A∼D, F∼O, SIE) as shown in Figure 1, and these defects are divided into small slub (A2∼B2, A1∼C1, A0∼E0), big slub (A4∼E4, A3∼E3, C2∼E2, D1∼E1), thick place (F1∼J1, F2∼J2), thin place (K1∼O1, K2∼O2). For optical sensor, the setting of the defects is also illustrated by Figure 1 only that the classification limits of the thick and thin places are different from the capacitive setting. Figure 1 shows the general setting of the defects tested by capacitive and optical method. From Figure 1, it can be seen that the defect whose length is no more than 1 mm, and whose mass or cross sectional area surpasses 80% of the average mass or the average cross sectional area of the testing sample, is classified as Small Imperfection Element (SIE). SIE is a recently defined term, and it evolves from the original index Element of Imperfection Monitor (IPMe), therefore in the test the setting parameters of IPMe have been changed according to the definition of SIE. The yarn evenness is tested by a special capacitive sensor, and it is expressed as CVeven%, CV5 m%, CV50 m%. The three indices are the coefficients of variation of the sample mass calculated from the masses of 1 cm, 5 m, and 50 m yarn length segments respectively.
Figure 1.
Classification of the defects tested by capacitive sensor (optical sensor).
Therefore, we can get the total number of small slub, big slub, thick place, and thin place, SIE of the 156 km raw silk samples, and then convert the value of each index into number per 100 km, and record the data in the test report. For the indices of CVeven%, CV5 m% and CV50 m%, the average value of the data of the 12 spindles are calculated and recorded.
3. Results and Discussion
50 lots of raw silk are tested both by the electronic test system and the seriplane system according to the above sample preparation and test methods. Thus we can get the test data of each lot of raw silk sample tested by the two test methods respectively. By calculating the Pearson correlation coefficients (CR) [14] of any two indices, their CR values can be obtained, thus the intensity of their correlation can be assessed. Suppose X is a variable representing an index of the seriplane test, and Y is a variable representing an index of the electronic test. For the 50 lots of raw silk samples, we have obtained a series of test data {x1,x2,··· ,x50} of X, and data {y1,y2,··· ,y50} of Y . Using the following equation
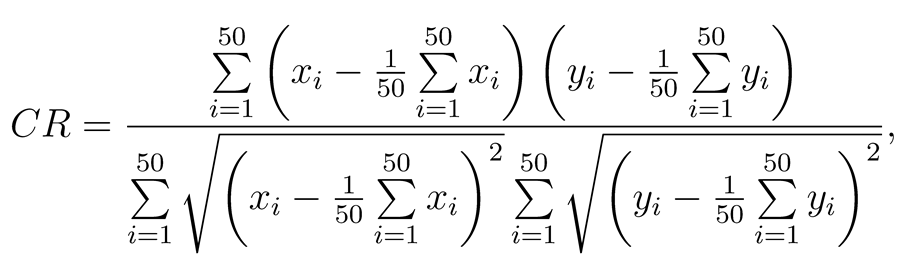 the CR of the two indices X and Y can be calculated. Table 1 has listed the CR values of corresponding indices.
Table 1.
Correlation coefficients between the indices of the two test systems.
Referring to the critical value table of CR [14], we can get the critical values at different significant levels. In this trial, as the degree of freedom is n−2 = 48, we can find that the critical value F0.05 = 0.28 at the significance level p = 0.05, F0.01 = 0.36 at the significance level p = 0.01. It means that if the CR value is less or equal to 0.28, there is no obvious correlation between the two indices; if the CR value is greater than 0.28, and lower than 0.36, the correlation between the two indices is significant, i.e. the correlation is moderate; if the CR value is greater than 0.36, the correlation is remarkably significant, i.e. the correlation is strong. In table 1 the remarkably significant correlation is labeled as “**”, the significant correlation is labeled as “*”, the non significant correlation will not be labeled. In the third column the data in the bracket are the correlation coefficients between seriplane indices and the corresponding electronic test indices by the optical sensor.
From Table 1, the intensity of the correlation between two indices can be referred, and in the following sections, the correlation of each pair of indices will be discussed including the reason for their correlation extent.
3.1. Evenness and CV5 m%
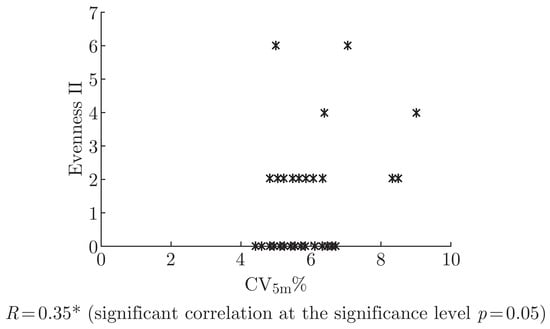
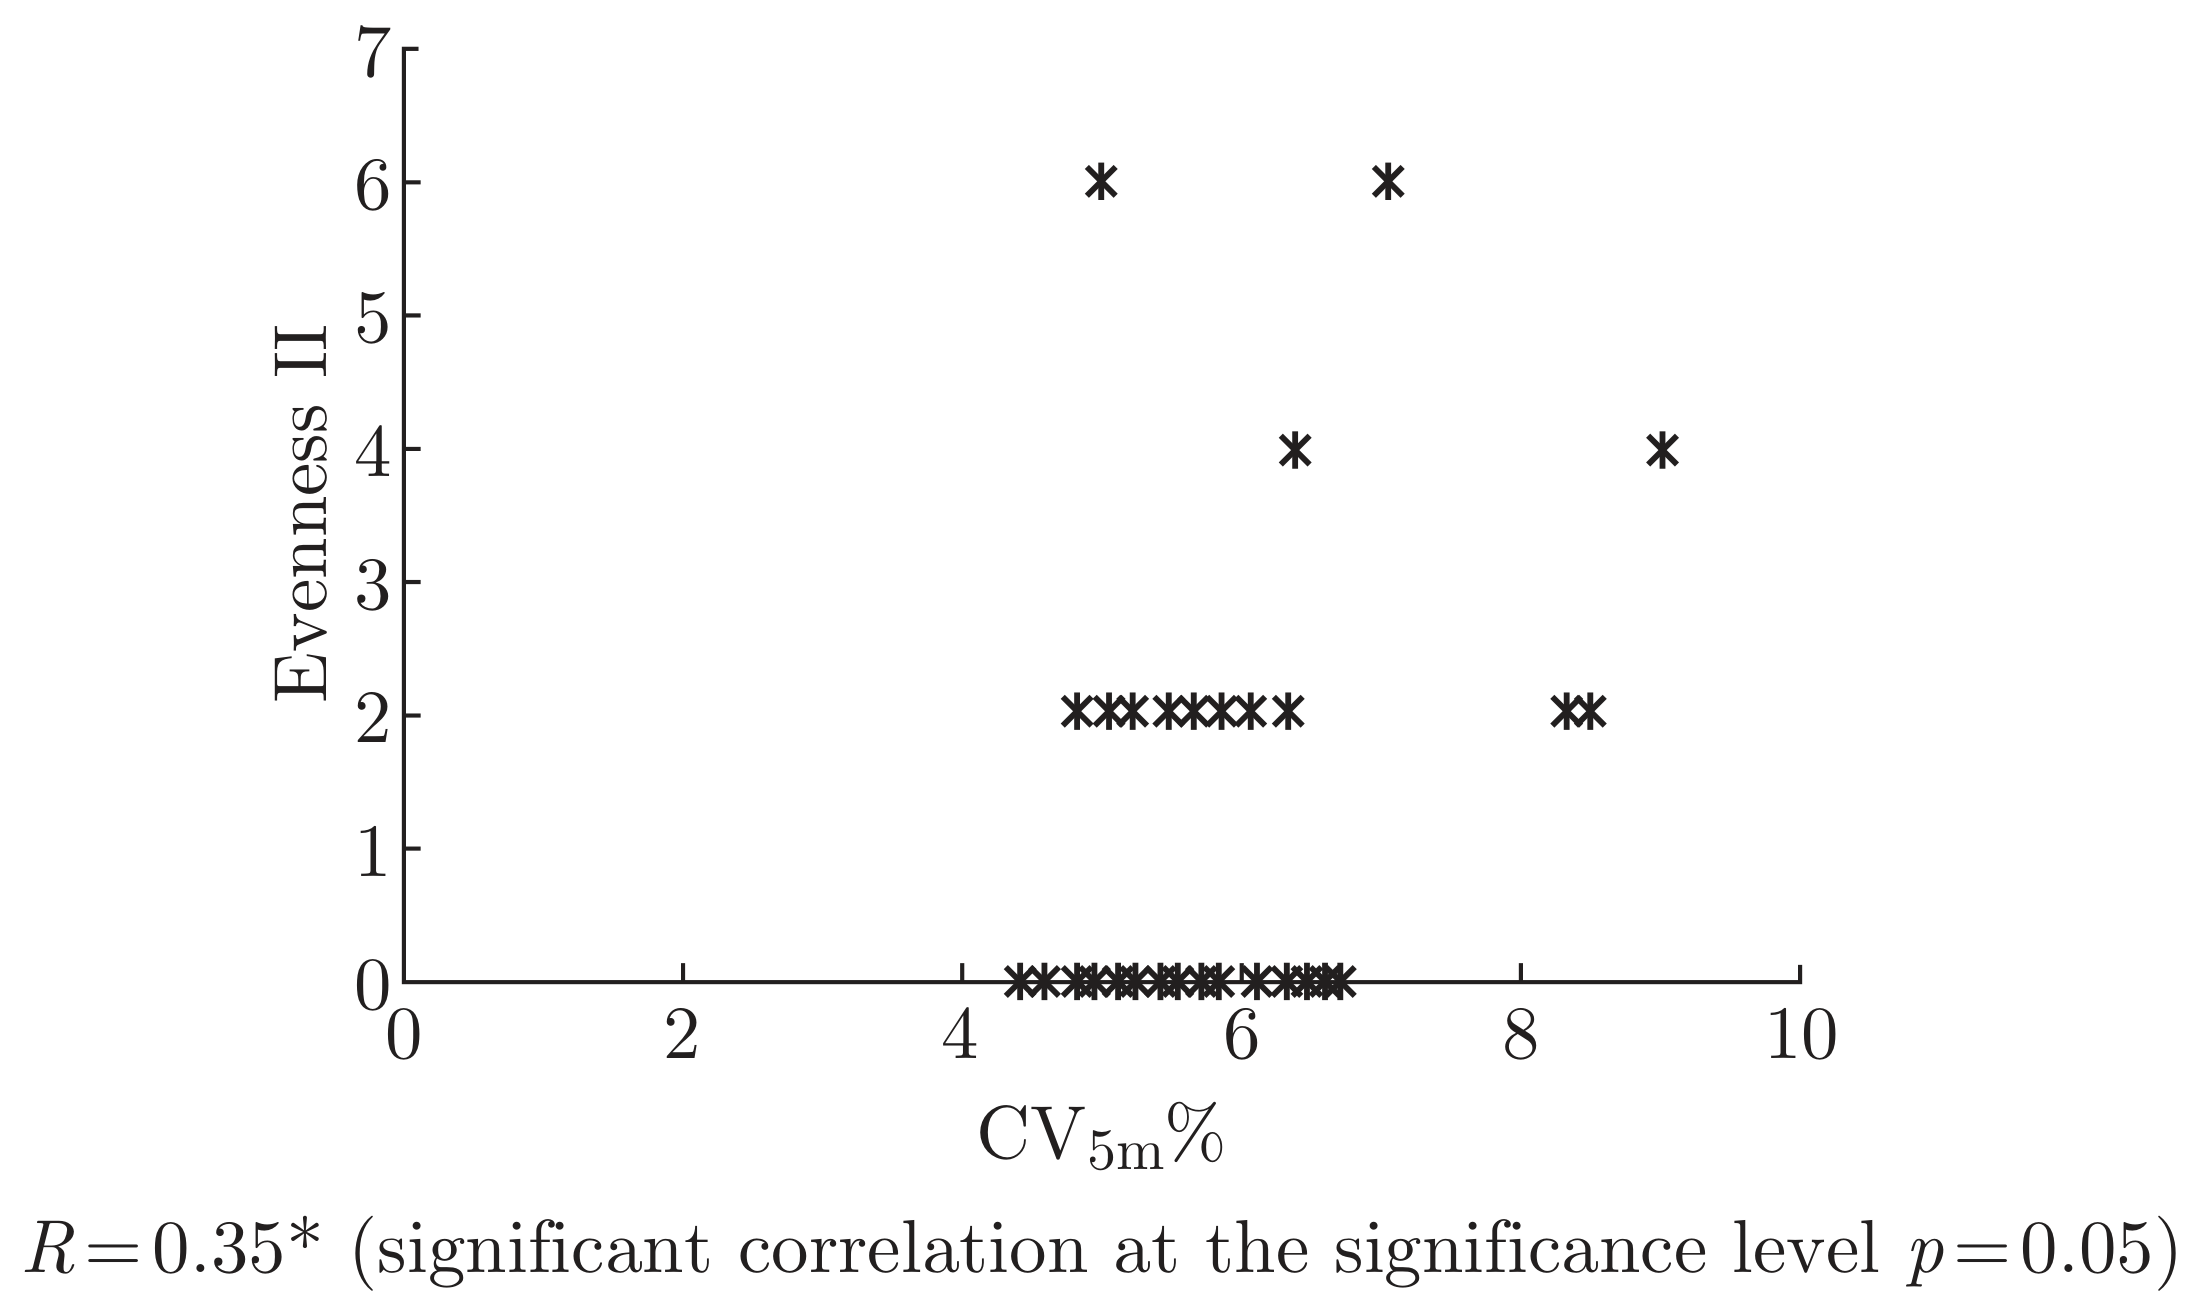
Figure 2 is the scatter plot that shows the correlation between evenness II and CV5 m%. From Figure 2 and Table 1, it can be seen that the correlation between evenness II and CV5 m% is significant. As we know, the evenness II shows the unevenness information of raw silk with a length of about 3 to 5 meters long, while CV5 m% expresses the unevenness information of raw silk with a length of 5 meters long. Thus the two indices represent similar quality information of yarn evenness, and they are expected to have strong correlation between them. However, the evenness II value is expressed by the number of the unevenness stripes; CV5 m% is expressed by the coefficient of variation of the raw silk mass of unit length. The former is a discrete variable, while the latter is a continuous variable, which determines that there is no strong correlation between the values of the two indices, but a moderate correlation between them.
Figure 2.
Correlation between evenness II and CV5 m%.
3.2. Cleanness and Slub
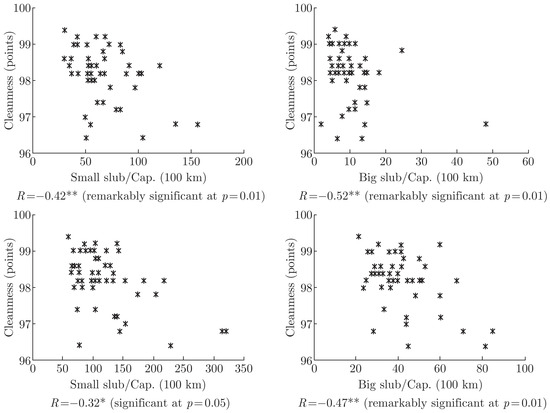
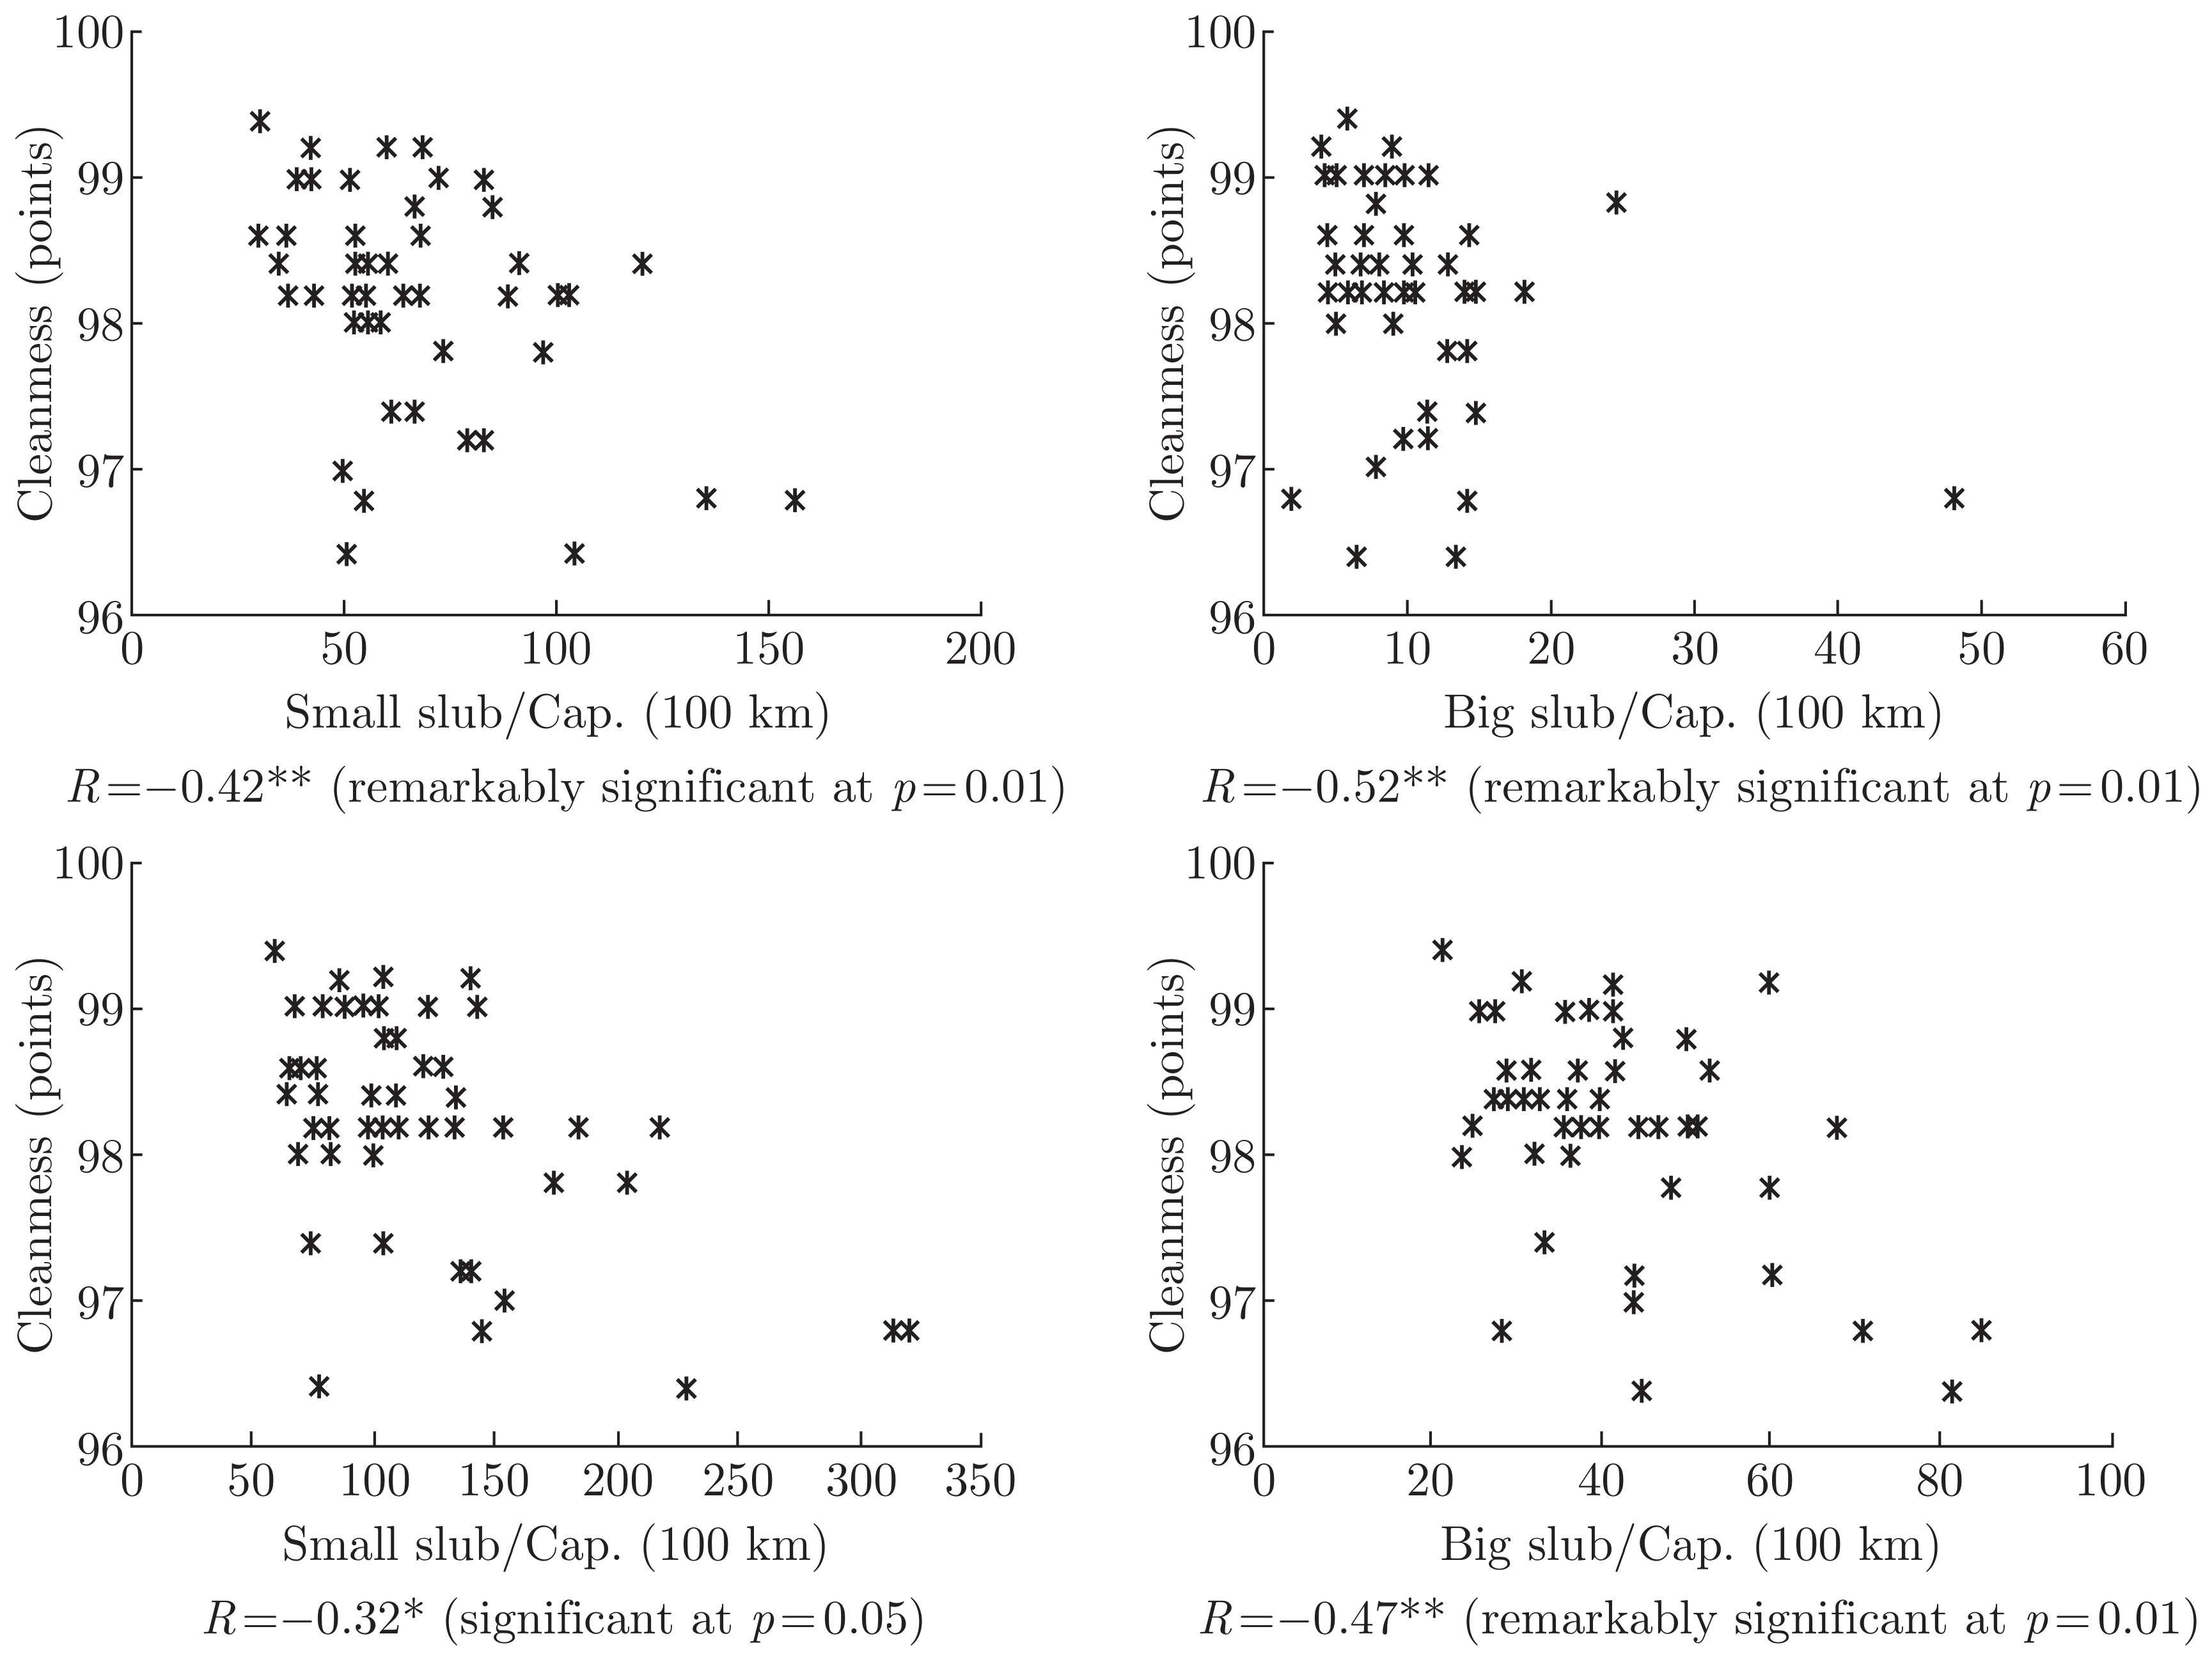
From Table 1, it can be seen that in most cases the correlation between cleanness and slubs is remarkably significant, only when the slubs are tested by the capacitive sensor, the correlation between cleanness and big slub is moderate. Figure 3 shows their correlations more visually. In the figure the ordinates are the seriplane test indices, the abscissas are the electronic test indices; and with the increase of the number of slubs, the cleanness value tends to decrease at the same time, which indicates that the index of slub is in accord with the cleanness value in judging the imperfection quality of raw silk in most cases. The reason can be given by judging what the same defects will be classified by the two test systems.
Figure 3.
Correlations between cleanness and slub.
The cleanness defects are classified into 11 kinds of defects according to their shape and potential damage [12]; while for the electronic test, the defects can be classified into 46 classes. By comparing their definitions for the defects, for example, it can be found that a defect that is tested by the electronic tester as E4 may be inspected as major defects in the seriplane test. Thus, by analyzing which class will the same defect be classified into in the electronic test system and in the seriplane test system respectively, we can find the internal correlation between the two test systems. Table 2 has listed all such correlations, the first column lists all the cleanness defects that are classified in the seriplane test; the second and the third columns have listed the definitions and lengths of the cleanness defects respectively [12]; the fourth column has listed all the electronic classified slubs that might be inspected as the subclasses of the cleanness defects. From Table 2, it can be found that the cleanness defects may be measured as big slubs or small slubs when using the electronic tester, which explains their remarkably significant correlations.
Table 2.
Comparison between cleanness and slub.
3.3. Neatness and Small Slub, Neatness and SIE
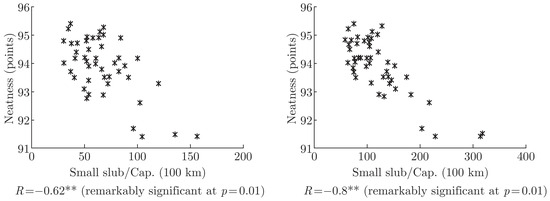
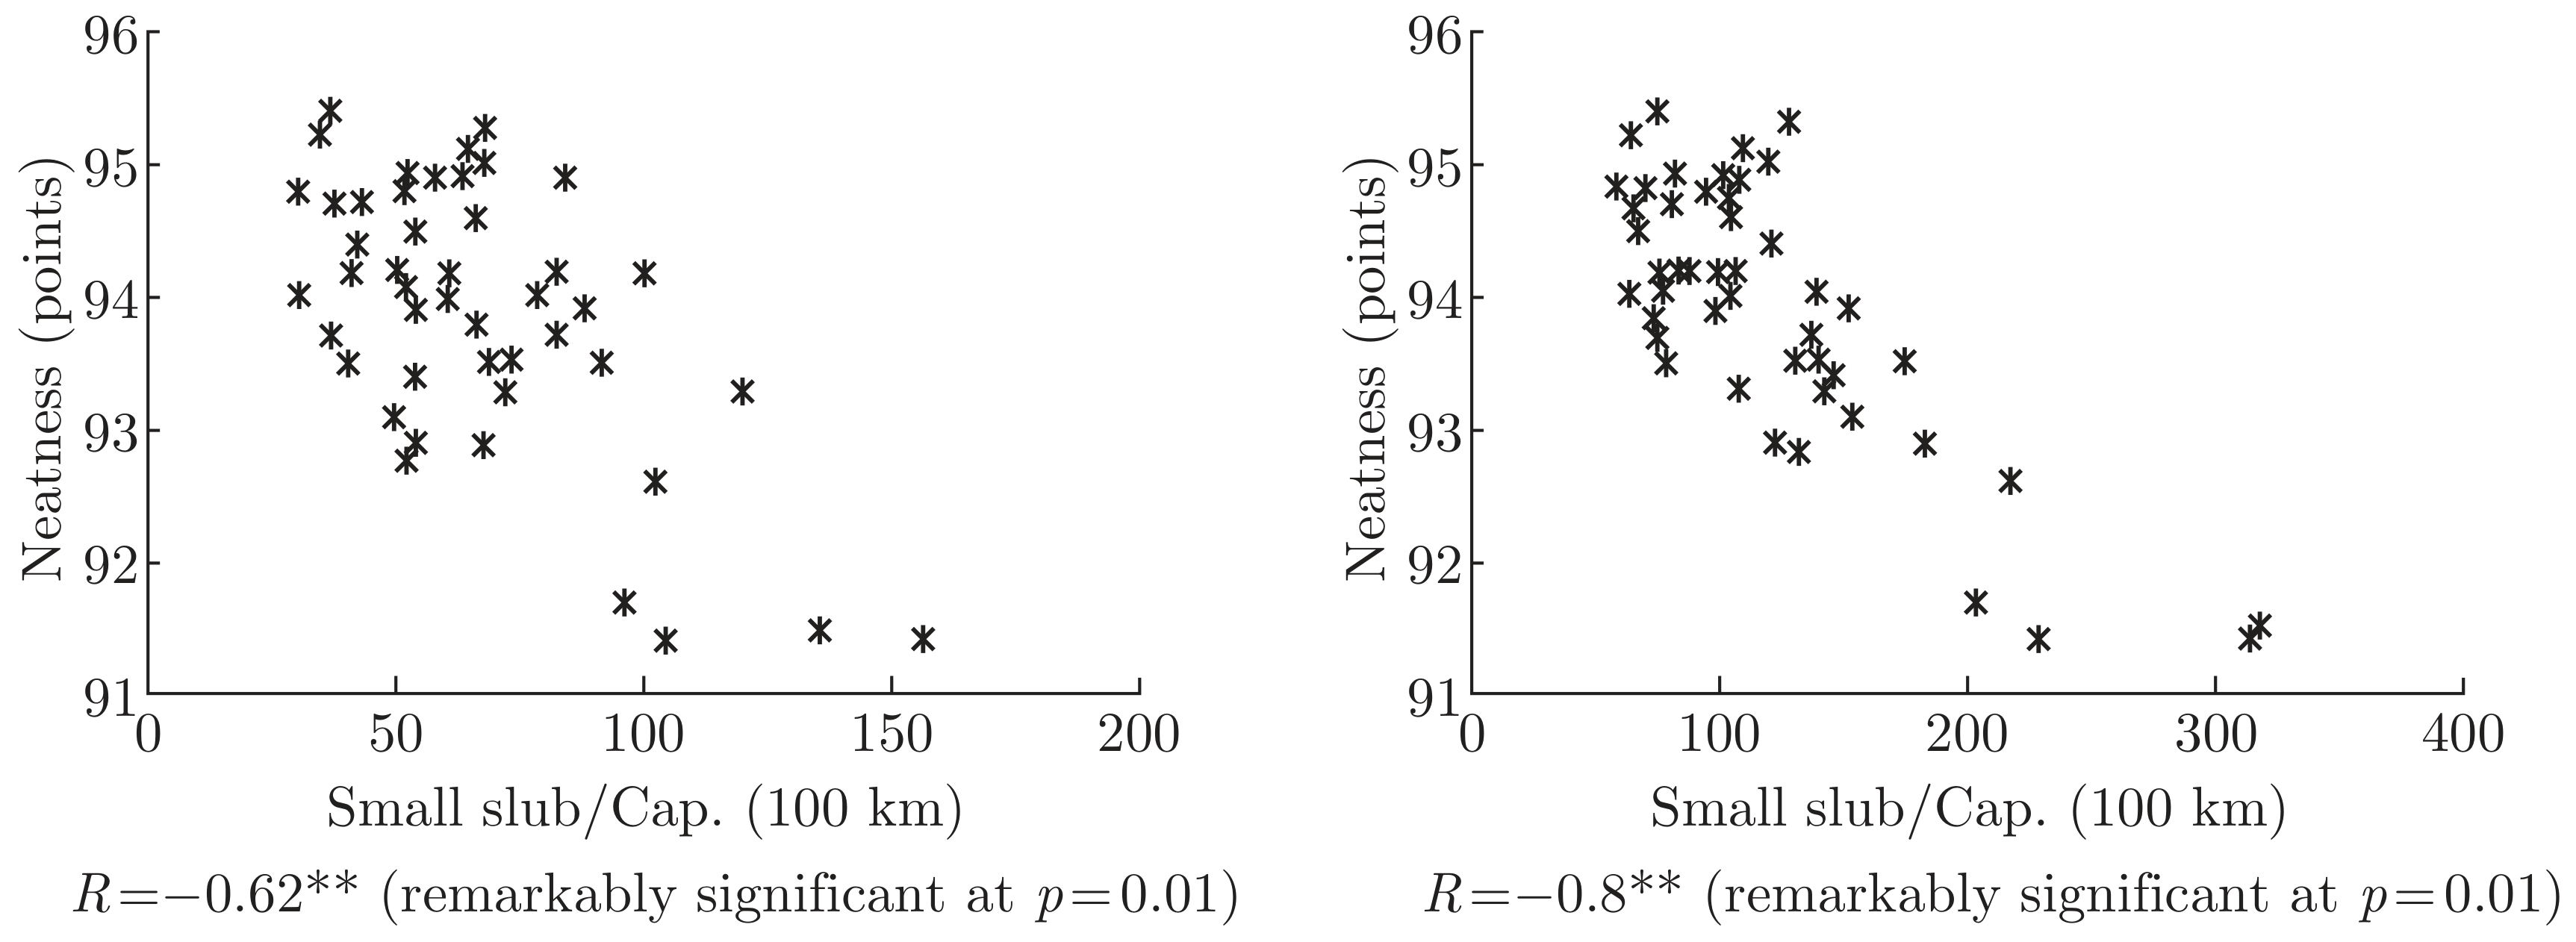
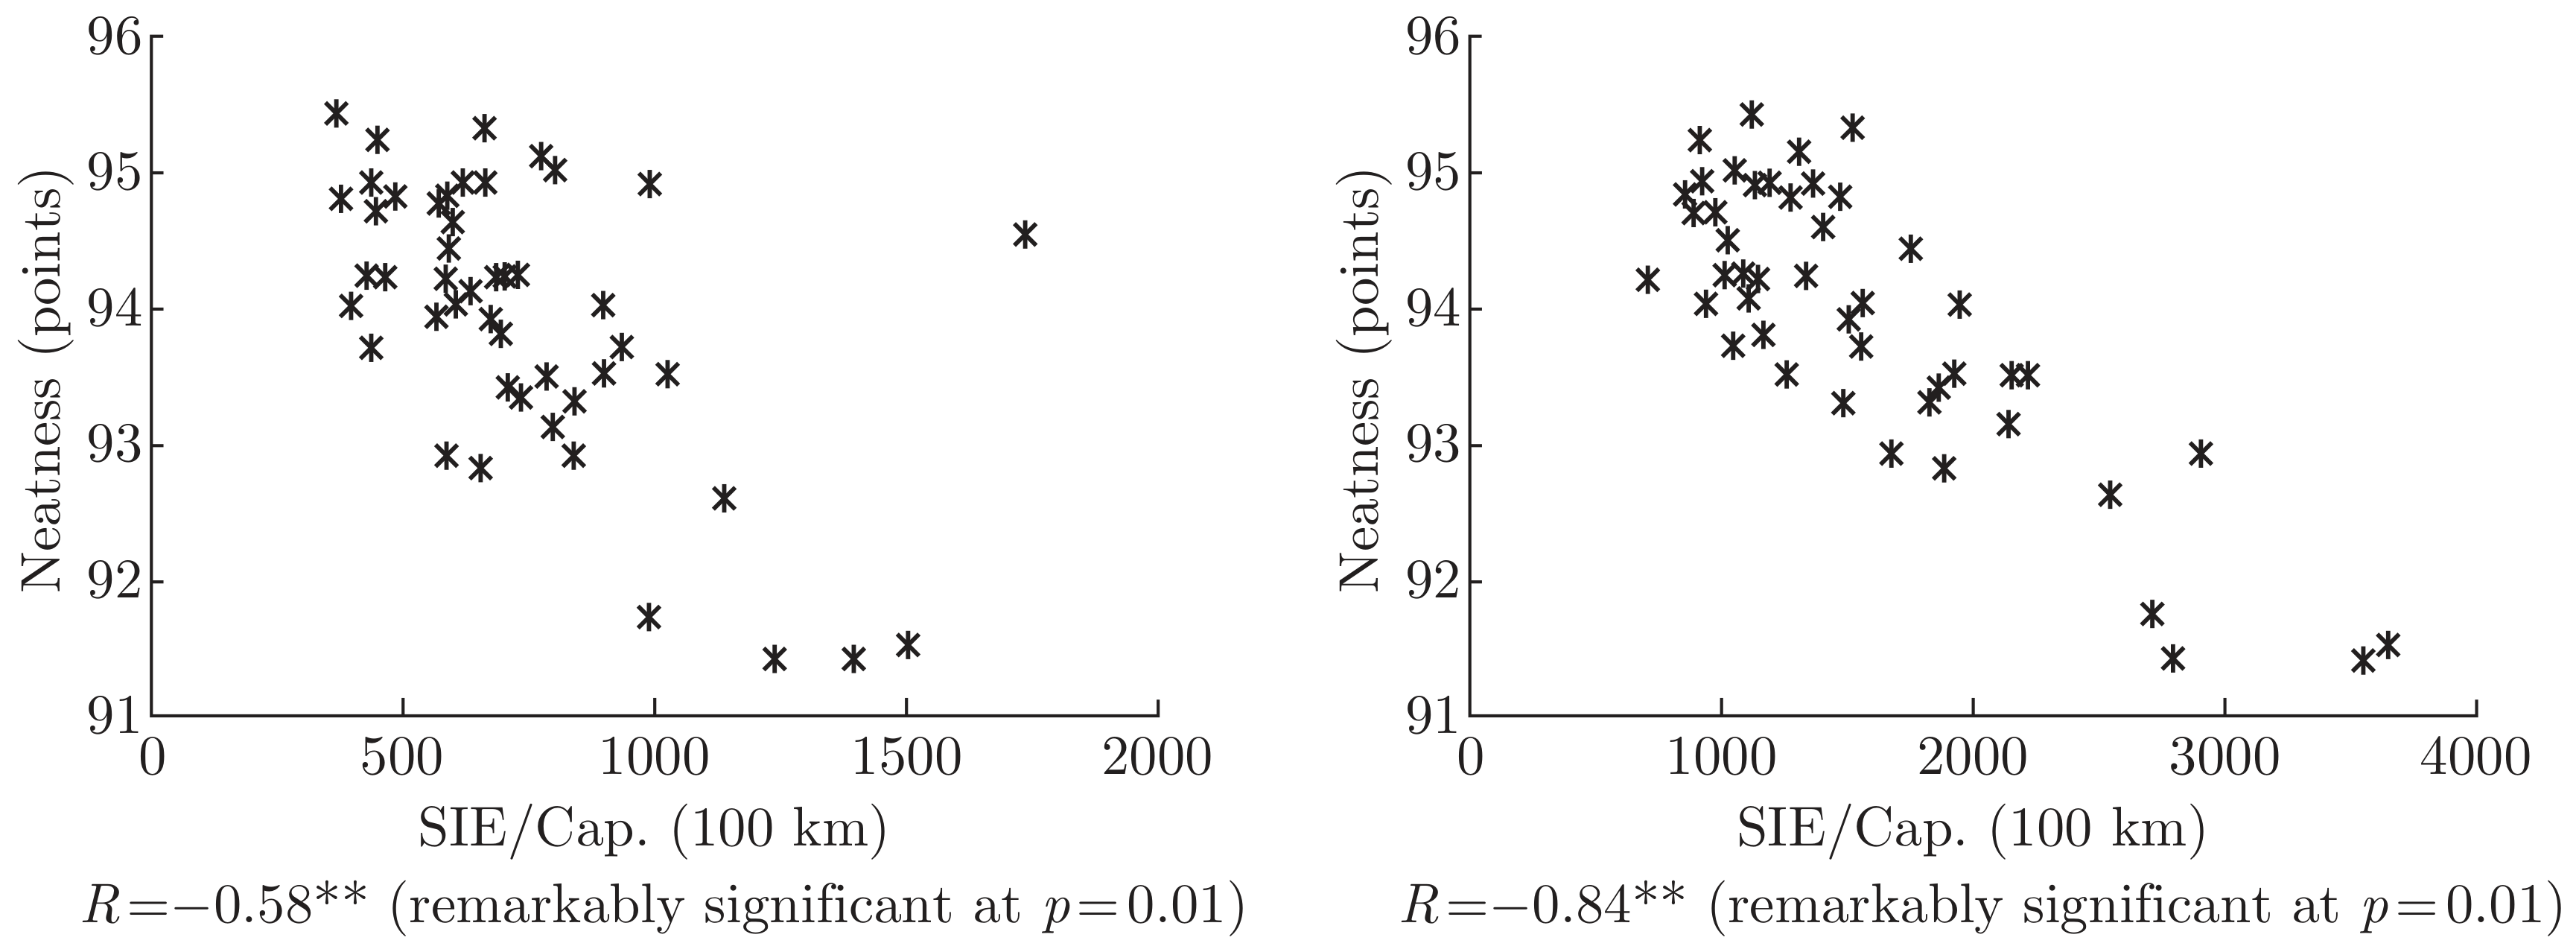
Figure 4 and Figure 5 are the scatter plots of neatness and the two electronic test indices respectively. Compared with Figure 3, it can be concluded that the correlation between small slub and neatness is stronger than between small slub and cleanness, and that the correlations between neatness and slub or SIE will be more obvious when slub and SIE are tested by optical sensor. Thus, the result also indicates that the optical sensor is more reliable than capacitive sensor in defects testing.
Figure 4.
Correlation between neatness and small slub.
Figure 5.
Correlation between neatness and SIE.
According to the characteristics of the neatness defects [12], many defects can be detected as small slubs when using the electronic test method, such as nibs, loops, hairiness, short knots, etc., while many defects can also be detected as SIE. Thus, there are significant correlations between neatness and small slub, and between neatness and SIE.
3.4. Neatness and Thick Place, Neatness and Thin Place
From Table 1, it can be seen that when tested by the optical sensor the thick place and the thin place will have a significant correlation with the neatness value. From Figure 1, it can be found that the thick and the thin places have two classes respectively. Take the thick place by optical sensor as an example, thick1 (F1∼J1) detects defects whose cross-sectional areas surpass 30% to 45% of the average cross-sectional area of the test sample, while thick2 (F2∼J2) tests defects whose cross-sectional areas surpass 45% to 80% of the average. Similarly, thin 2 defects are thinner than thin1 defects. According to the test data of the 50 lots of raw silk, it is found that the thick places and the thin places mainly aggregate in thin1 (K1∼O1) and thick1 respectively. The defects in this area can always be judged as a chain of small neatness defects in the seriplane test, thus there are strong correlations between neatness and thick place, between neatness and thin place.
As the capacitive sensor is not sensitive to small neatness defects, the correlation between them will be less obvious when using the capacitive sensor.
4. Conclusions
According to the above analysis and discussion, the following conclusions can be obtained from the comparison between the quality indices of the seriplane test and the electronic test.
Firstly, there are significant correlation between evenness II and CV5 m% at the significance level p = 0.05, remarkably significant correlation between cleanness and slub by the optical sensor at the significance level p = 0.01, remarkably significant correlation between neatness and SIE by both the capacitive and the optical sensor at the significance level p = 0.01, remarkably significant correlation between neatness and thick place, between neatness and thin place by optical sensor at the significance level p = 0.01.
Secondly, the seriplane test and electronic test are in accord with each other in assessing the defects quality information of the 50 lots of raw silk, which provides practical support for substitution of the electronic test for seriplane test in future from the technical viewpoint.
Finally, the optical sensor is superior to the capacitive sensor in measuring the defects of raw silk, and when using the electronic test report for raw silk, the data of the defects given by the optical sensor should be referred first.
Acknowledgments
This work was imbursed by National Natural Science Foundation of China (51303117), and the Priority Academic Program Development of Jiangsu Higher Education Institutions.
References
- Zhang, D.R.; Cheng, L. Comparison of two different yarn evenness test methods. Mod. Appl. Sci. 2010, 4, 71–76. [Google Scholar] [CrossRef] [Scilit]
- Price, J.B.; Calamari, T.A.; Meredithjr, W.R. A comparison of yarn evenness and imperfection data. Tex. Res. J. 2002, 72, 810–816. [Google Scholar] [CrossRef] [Scilit]
- Porat, I.; Greenwood, K.; Saharkhiz, S. Problems and perspectives of continuous yarn testing. J. Text. Inst. 2000, 91, 117–132. [Google Scholar] [CrossRef] [Scilit]
- Carvalho, V.; Cardoso, P.; Belsley, M.; et al. Yarn irregularity parameterisation using optical sensors. Fibers Text. East Eur. 2009, 17, 26–32. [Google Scholar]
- Zhou, B.L.; Xu, H.X. Correlation between indices of seriplane grading and Uster tester 1-s. J. Suzhou Inst. Silk Text. Tech (in Chinese). 1985, 5, 1–10. [Google Scholar]
- Zhou, B.L.; Xu, H.X. Restudy on the correlation between indices of seriplane grading and Uster tester 1-s. J. Suzhou Inst. Silk Text. Tech in Chinese. 1986, 6, 1–10. [Google Scholar]
- Chattopadhyay, R.; Das, S.; Gulrajani, M.L.; et al. A comparison between the quality attributes of silk yarn using the Uster and seriplane test systems. J. Text. Inst. 1997, (88)2, 92–98. [Google Scholar] [CrossRef] [Scilit]
- Fei, W.C.; Zheng, Y.G.; Li, W.; et al. Analysis on photoelectric method of measuring the fineness of raw silk. Adv. Mater. Res. 2011, 175-176, 565–569. [Google Scholar] [CrossRef] [Scilit]
- Liu, X.; Wei, W.Z.; Chen, Q.G. Development of electronic real-time inspecting system for raw silk based on FPGA. Adv. Mater. Res. 2011, 175-176, 460–464. [Google Scholar] [CrossRef] [Scilit]
- Zhang, X.; Xu, Y.Q.; Meng, K. Dynamic detection and analysis of raw silk’s flatness. Adv. Mater. Res. 2011, 175-176, 385–388. [Google Scholar] [CrossRef] [Scilit]
- Zhou, Y. Research and expectation of the electronic testing technique for raw silk. Silk Mon. (in Chinese). 2009, 42–51. [Google Scholar]
- National Raw Silk Inspection Standard Compiling Committee. GB/T 1798-2008 Test method of raw silk; (in Chinese). Chinese Standardization Press, 2008. [Google Scholar]
- ISO/FDIS 15625; Protein fibres-Electronic test method for defects and evenness of raw silk, 2013 (E).
- Rice, J.A. Mathematical statistics and data analysis, 2nd ed.; Duxbury Press, 1994; p. 546. [Google Scholar]

© 2014 Textile Bioengineering and Informatics Society. This article is an open access article distributed under the terms and conditions of the Creative Commons Attribution (CC BY) license (https://creativecommons.org/licenses/by/4.0/).