


Abstract
Although shoes are conventionally chosen based on the size indicated on the label, it is also possible to accurately gauge foot size using a technique known as morphometry to measure the three-dimensional shape of feet in a state of rest. However, because shoe sizes differ slightly for each shoe manufacturer despite the use of a standardized labeling system, there is no guarantee that consumers will be able to choose a pair of shoes that properly fit the size of their feet. Furthermore, some consumers are in the habit of wearing larger shoes to accommodate the width of their feet. The purpose of this study was to develop a quantitative understanding of the relationship between shoe size (foot length) and gait by using techniques such as electromyogram of the lower leg, measurement of ground reaction force, and subjective evaluation. The subjects, five male university students with no history of leg injury, all had a foot length of 26.5 cm and a foot width of size D as defined by JIS standards. Prior to the experiment, the subjects’ consent were obtained after briefing them on anticipated risks and safety considerations, management of their personal information, and other aspects of the study. Experimental samples consisted of a total of five D-width shoes in sizes ranging from 26.0 cm to 28.0 cm, in 0.5 cm increments. Each subject was fitted with an electromyogram measuring device on the gastrocnemius and tibialis anterior muscles on his right leg, and a plantar pressure distribution measuring sheet was placed in each of the sample shoes. Each subject took 10 strides while wearing each sample shoe along a predetermined route in the lab, under which a device for measuring floor reaction force had been installed. After each subject had walked in each shoe sample, they filled out a questionnaire on the sensations experienced while walking. When the shoe size (foot length) was at least 1 cm longer than the subject’s proper size, a significant increase in activity by the gastrocnemius muscle was noted along with a significant decrease in the floor reaction force value (F2) at kick-off. These changes were attributed to the psychological effects of factors such as ease of kick-off. The findings suggest that the parameters used in this study, including muscular activity level, floor reaction force peak value, and gait reproducibility, have the potential to serve as useful indicators in evaluating the functional compatibility between shoe wearers and shoe size.
1. Introduction
Currently, the aging of Japanese society is becoming a significant issue. According to demographic data compiled by the Ministry of Health, Labour and Welfare in 2012, the number of elderly individuals as a percentage of the country’s total population has been increasing annually, rising from 4.9% in 1950 to 23.0% in 2010. At the same time, the birthrate has been declining, and some experts predict that the population-aging rate will exceed 30% in 2030 [1]. As Japan continues to evolve into a rapidly-graying society, the number of people involved in sports is increasing, and 48.2% of all people who engaged in some sport over the last year cited “building strength” as a goal, reflecting a rising awareness of sport as a facilitator of good health [2]. In this way, health consciousness has been increasing, and walking has become the most popular activity for maintaining fitness. According to a study conducted by the Public Relations Office of the Cabinet Office Minster’s Secretariat, walking was the most common type of exercise during the last year [3]. About 40 million people are said to walk regularly, and an extremely large number of people engage in some sort of exercise for the purpose of staying in good health. Health-conscious people work to maintain a healthy lifestyle through basic physical exercise, for example by running or walking. As a result, many consumers exhibit a high level of interest in the shoes they wear.
Recently, running and walking shoes with a variety of functions have been introduced in the athletic shoe market, representing an increasingly broad range of options for consumers. However, most shoes are chosen based on labeling that has been chosen by manufacturers during the design stage or by trying on shoes in stores. Some manufacturers have recently begun to offer morphometry as a way to measure the three-dimensional shape of the foot using foot-measuring instruments in stores. However, the labeling of shoe sizes is determined by manufacturers, and shoes incorporate some degree of toe room, typically around 1 to 2 cm of space between the tip of the wearer’s toes and the end of the shoe. Individual manufacturers have their own standards for toe room, which also varies with the shoe design. This way, even shoes labeled with the same size reflect a variety of sizes and standards, and it is not always possible to choose a shoe that fits based on size labeling or foot morphometry. Wearing shoes that are too small for one’s feet or shoes that do not match the shape of one’s feet can lead to foot diseases such as hammer toe or hallux valgus. On the other hand, some consumers find themselves choosing shoes that are too large to make up for their narrow width. There is an empirical basis for expecting that wearing shoes that are too large for one’s feet will make walking difficult. However, the effects of improperly sized shoes on gait remain unclear, and there has been very little scientific research on the subject.
The purpose of this study was to provide a quantitative accounting of the relationship between shoe size (foot length) and gait by using techniques such as electromyogram of the lower leg, measurement of ground reaction force, and subjective evaluation [4].
2. Methodology
In this study, electromyograms of the lower leg were taken, ground reaction force and tracked load point movement was measured while the subjects were walking. A questionnaire was also administered, asking subjects to rate the sensation of walking in terms of four characteristics: ease of kick-off, shoe comfort, shock, and fit. Then the effects of improper shoe sizing were quantified by combining the resulting measurement data and psychological evaluations.
2.1. Walking Measurement
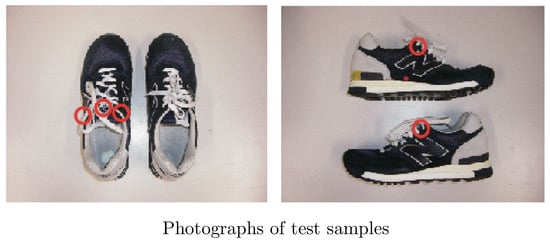
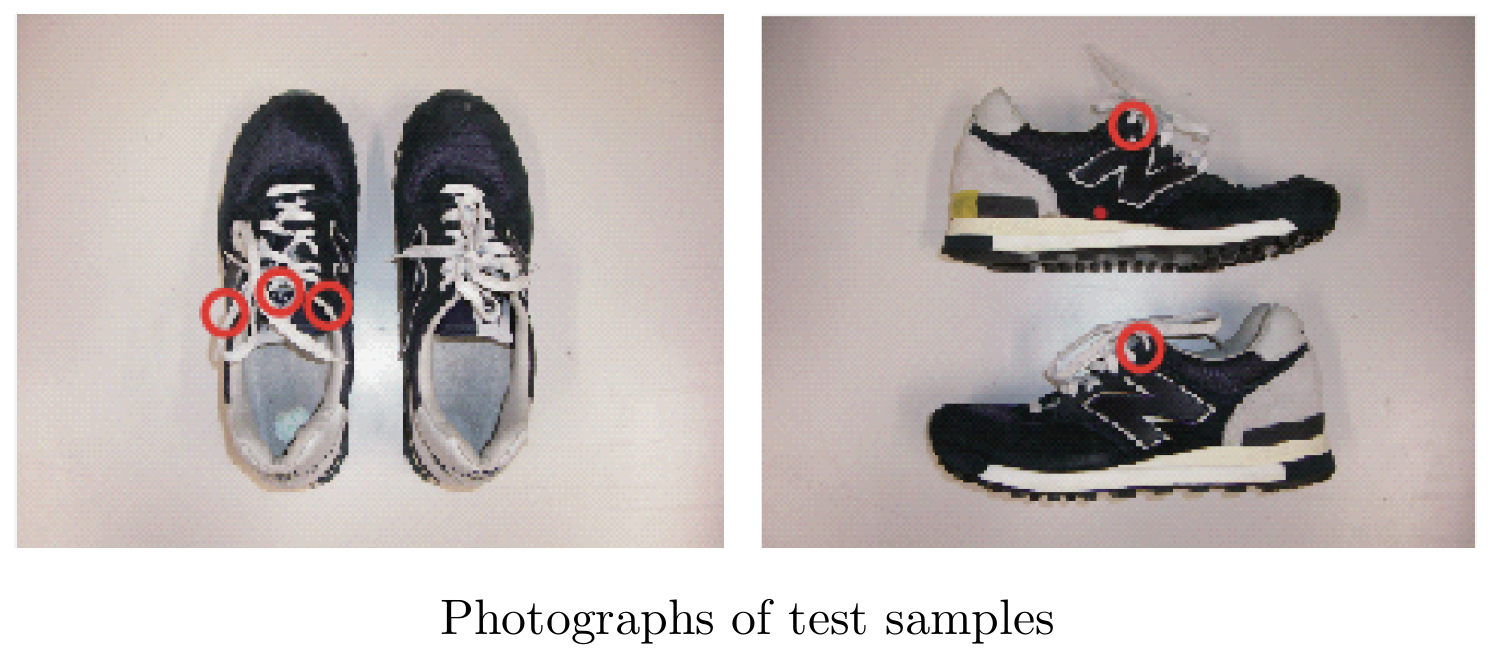
A total of five sample running shoes were used in sizes 26.0 cm, 26.5 cm, 27.0 cm, 27.5 cm, and 28.0 cm (New Balance model CM575M in width D), as outlined in Table 1 and pictured in Figure 1. The subjects were five male university students with a shoe size of 26.5 cm and a width of D, all healthy and lacking any history of serious leg injury (age: 23.6±1.4 years; height: 170.6±6.4 cm; weight: 62.8±5.2 kg) (see Table 2). Subjects with a foot width of D as defined by the JIS were chosen for this experiment [5,6]. Prior to the experiment, the subjects’ consent were obtained after briefing them on anticipated risks and safety considerations as well as management of their personal information.
Table 1.
Test Samples.
Figure 1.
Test samples.
Table 2.
Subject data.
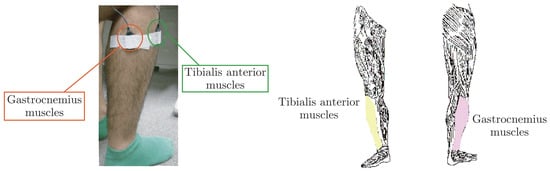
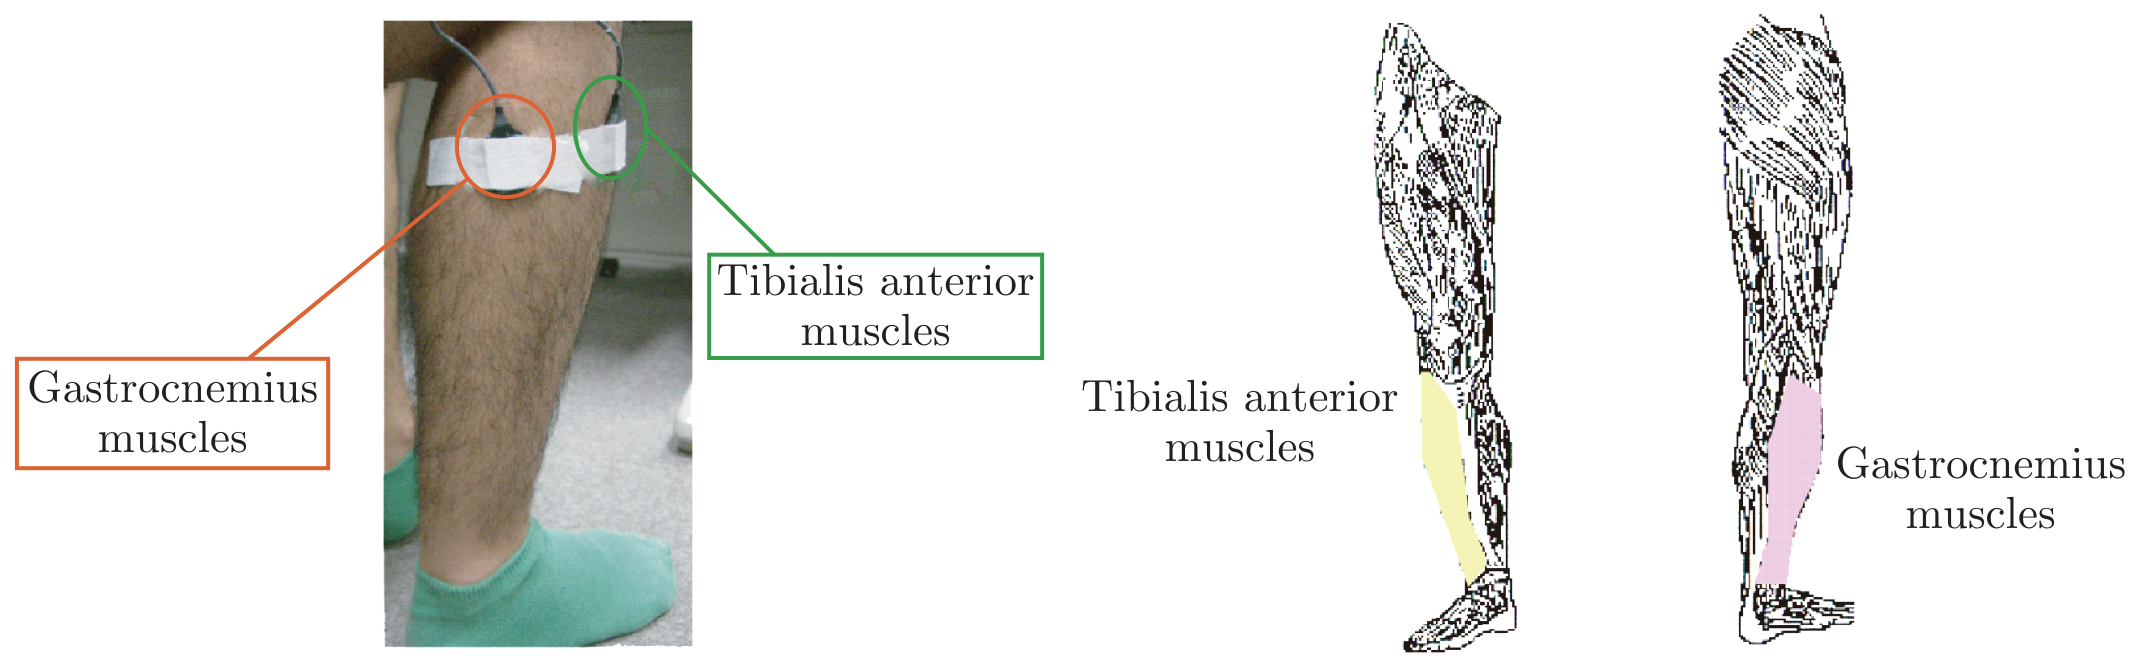
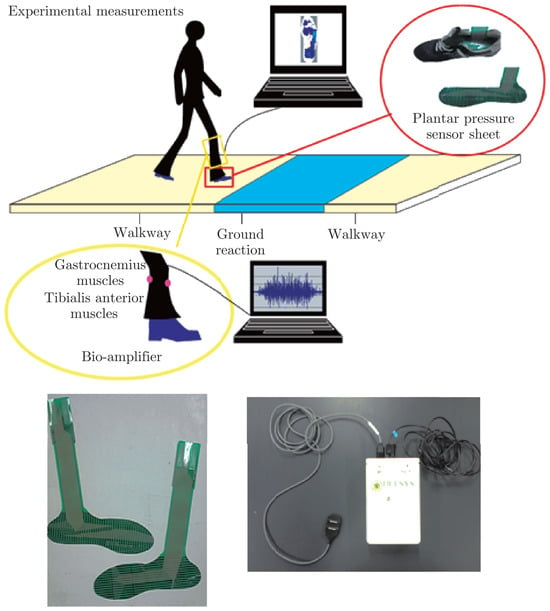
Electromyograms of the targeted muscles were taken at two locations while subjects walked: the tibialis anterior and the gastrocnemius (lateral head) (see Figure 2) [7,8,9]. Prior to taking measurements while the subjects walked, we measured the Maximum Voluntary Contraction (MVC) of both the tibialis anterior and gastrocnemius muscles in order to normalize subjects’ muscular activity levels. To measure the MVC of the tibialis anterior muscle, the subjects were directed to extend the muscle with as much strength as they could muster for about 10 seconds while their ankle was fixed at a 90° angle. To measure the MVC of the gastrocnemius muscle, the subjects were asked to flex the muscle with as much strength as they could muster for about 10 seconds while their ankle was fixed at a 90° angle. To capture electromyograms during MVC and while walking, an analog/digital converter (BIOPAC System’s MP150) was used to convert the electrical signal data for recording. Data was recorded on a notebook computer using a sampling frequency of 1 kHz.
Figure 2.
Tested Muscles.
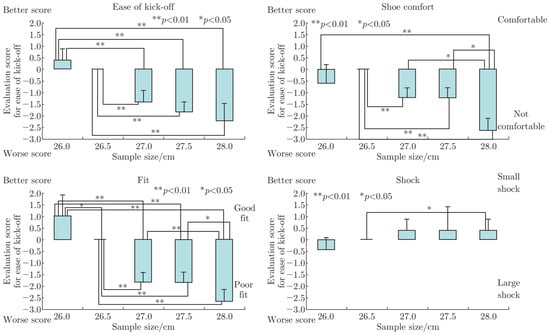
As illustrated in Figure 3, the walking test was accomplished by having each subject walk about 10 strides along a predetermined route in the lab while wearing each of the sample shoes in the following order: reference size (26.5 cm), 26.0 cm, 27.0 cm, 27.5 cm, and 28.0 cm. A foot-shaped, low-profile pressure sensor sheet (Nitta Corporation’s F-scan system) was placed on the insole of the right shoe to make measurements. During this test, the subject stepped on a force plate (manufactured by DKH Co., Ltd.) that had been placed in the center of the walking route to measure the ground reaction force waveform while the subject’s foot was in contact with the ground (during the stance phase). To ensure each of the sample shoes was worn in a consistent manner, the force used to tighten the laces was set to 35±5 gf/cm2 at the three locations circled in Figure 1. Furthermore, each subject evaluated their walking sensation in terms of the four characteristics of ease of kick-off, shoe comfort, shock, and fit after testing each sample relative to the reference size of 26.5 cm using a 7-point scale (from −3 [poor] to +3 [good]).
Figure 3.
Gait Measurement.
2.2. Analysis Methods
2.2.1. Analysis of Muscular Activity
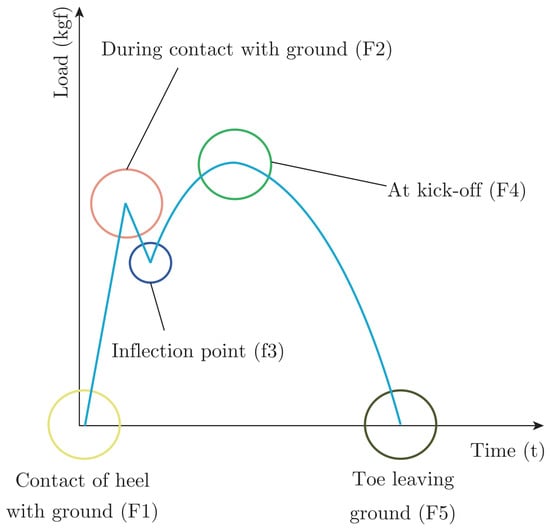
To analyze muscular activity during each test, we clipped the myoelectric potential signal corresponding to the stance phase from the time the foot contacted the ground (F1) until it left the ground (F5) on the ground reaction force waveform obtained from the force plate. After rectifying the extracted myoelectric potential signal for the tested muscles, the integral myoelectric potential was calculated by performing a time integration. Then the results were normalized by using the Maximum Voluntary Contraction (MVC) as the basis (yielding values as %MVC).
2.2.2. Analysis of Ground Reaction Force
We extracted the time of the stance phase, from the contact of the subject’s foot with the ground until kick-off, based on the ground reaction force waveform measured with the force plate. The peak value immediately after contact with the ground (F2) and the peak value at kick-off (F4) on the ground reaction force waveform were also calculated as shown in Figure 4. Furthermore, the inflection point on the waveform (F3) was identified and then extracted and compared to the time from contact of the heel with the ground (F1) to F3 and from F3 to F5.
Figure 4.
Ground reaction force waveform.
2.2.3. Analysis of Walking Sensations
We then analyzed walking sensation as evaluated using the four characteristics of ease of kick-off, shoe comfort, shock, and fit by calculating the average score and standard deviation for each evaluation item.
2.2.4. Analysis of Measured Values
To assess the reproducibility of subjects’ gaits, coefficients of variation for the electromyogram, ground reaction force, and time in contact with the ground (stance phase) were calculated. The coefficient of variation is calculated by dividing the average value of measurement data by the standard deviation. Large values indicate low reproducibility of the movement—in other words, they indicate that the movement is not regular. The average value and standard deviation was calculated for all measured values for each subject’s 10-pace test of each sample shoe and conducted a one-way analysis of variance.
3. Results
3.1. Muscular Activity while Walking
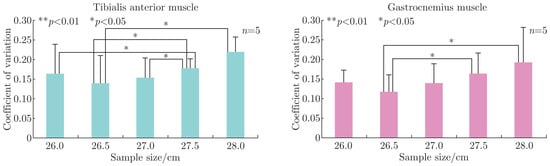
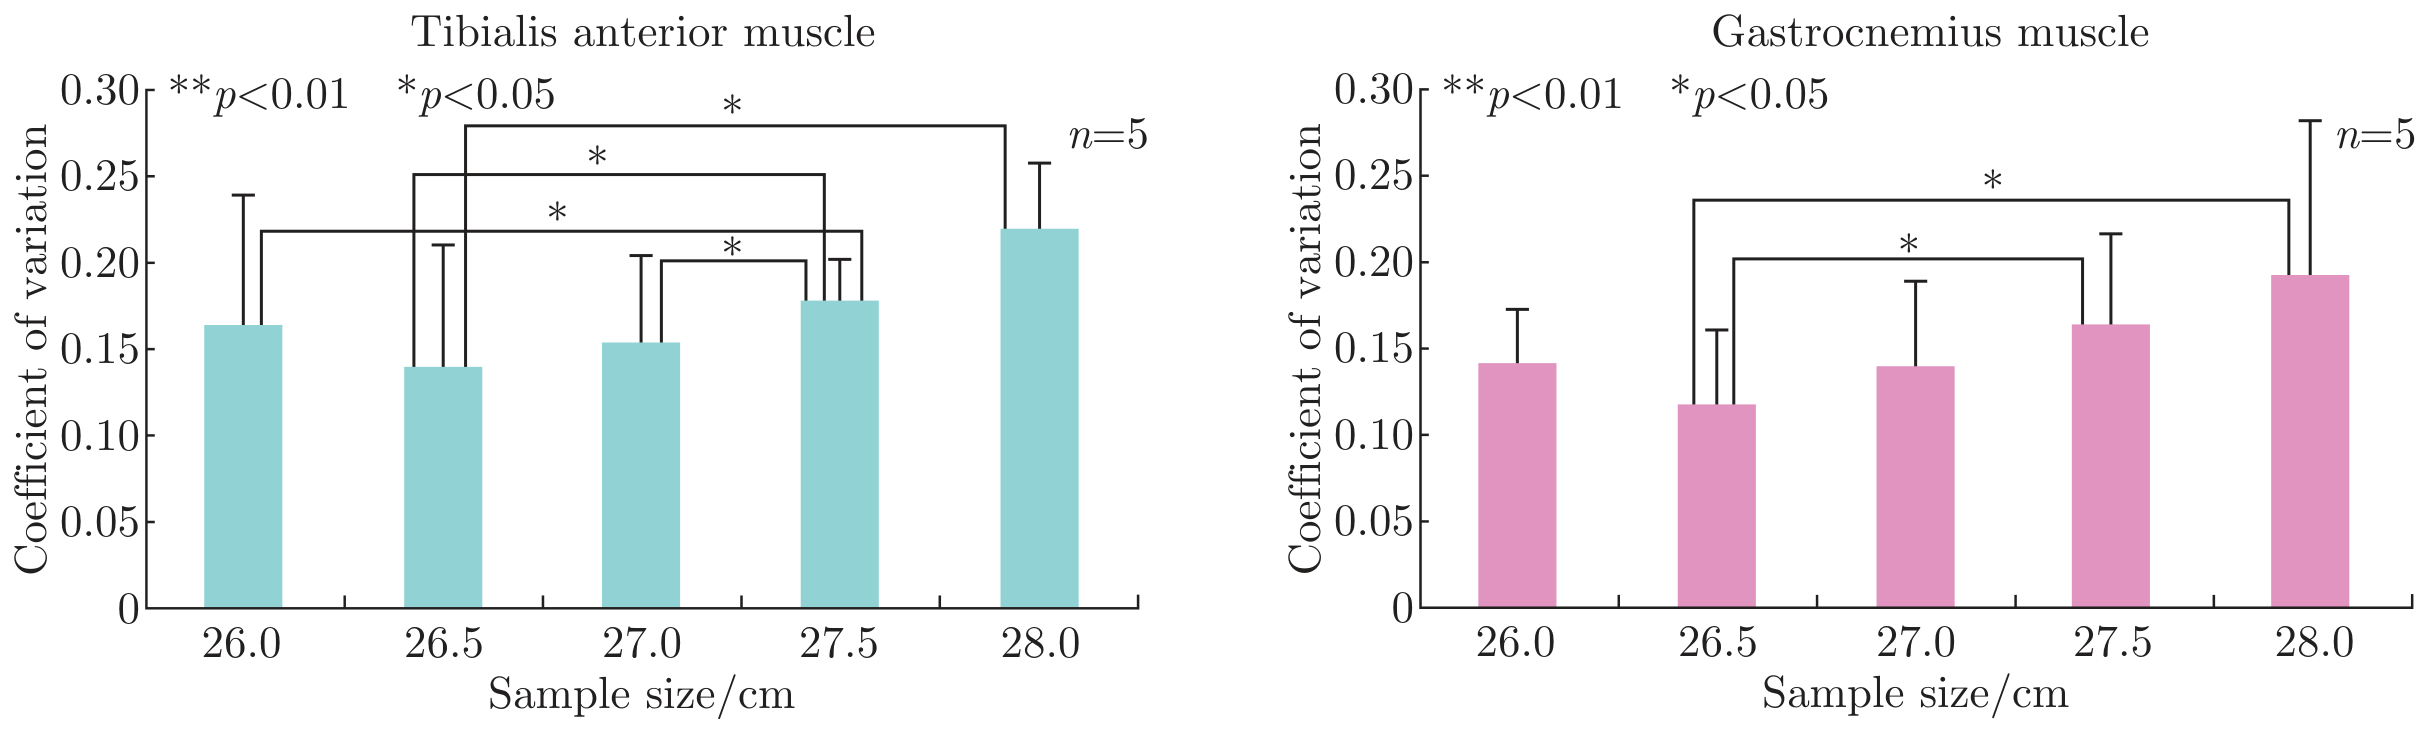
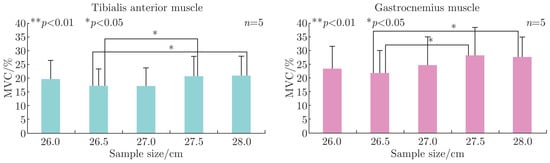
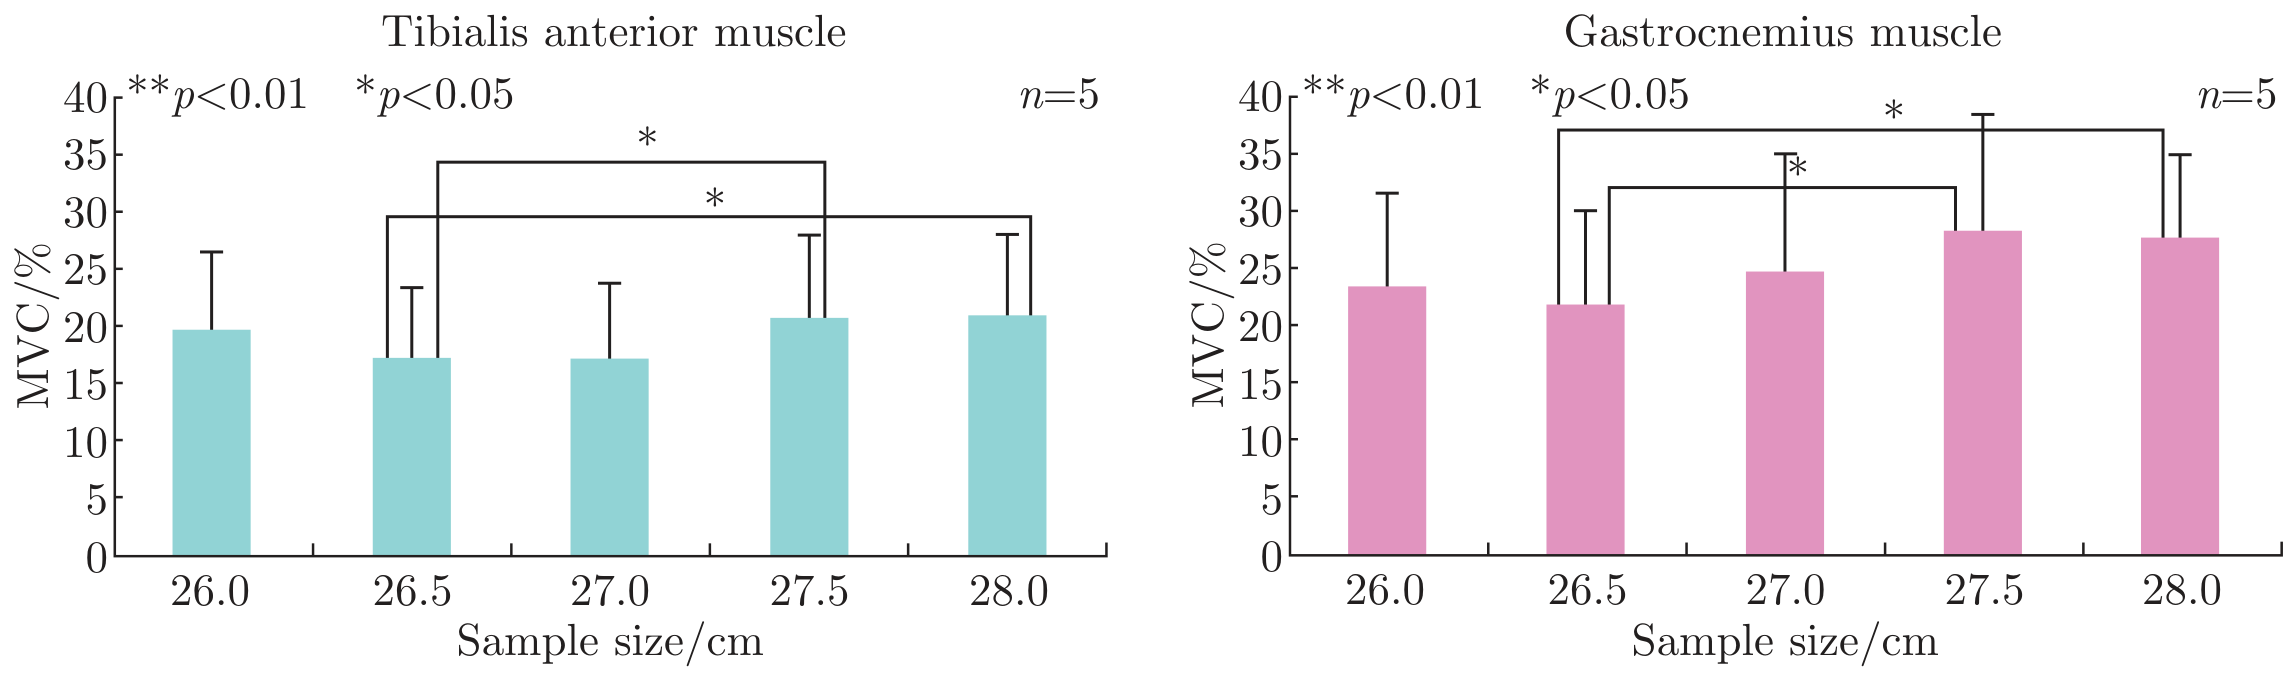
Figure 5 illustrates the results for activity of the tibialis anterior and gastrocnemius muscles during the stance phase, while Figure 6 illustrates the associated coefficients of variation. For the 27.5 cm and 28.0 cm samples, activity of the gastrocnemius muscle was significantly (p < 0.05) greater than for the reference size (26.5 cm). Similarly, activity of the tibialis anterior muscle while wearing the 27.5 cm and 28.0 cm samples was also significantly (p < 0.05) greater than the reference size. Based on these facts, it is clear that the muscle load while walking increases when the shoe size is at least 1 cm larger than the reference size. Additionally, the coefficients of variation for activity of the tibialis anterior and gastrocnemius muscles while wearing the 27.5 cm and 28.0 cm samples exhibited a statistically significant (p < 0.05) tendency to increase beyond the corresponding values for the reference size. This fact suggests that reproducibility of gait declines when the shoe size is at least 1 cm larger than the reference size.
Figure 5.
Muscular activity during stance phase (%MVC).
Figure 6.
Coefficients of variation for muscular activity (%MVC).
3.2. Ground Reaction and Duration of Ground Contact
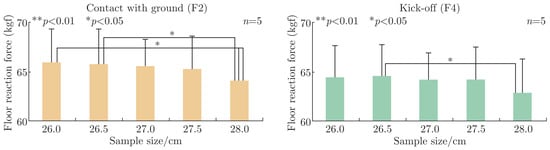
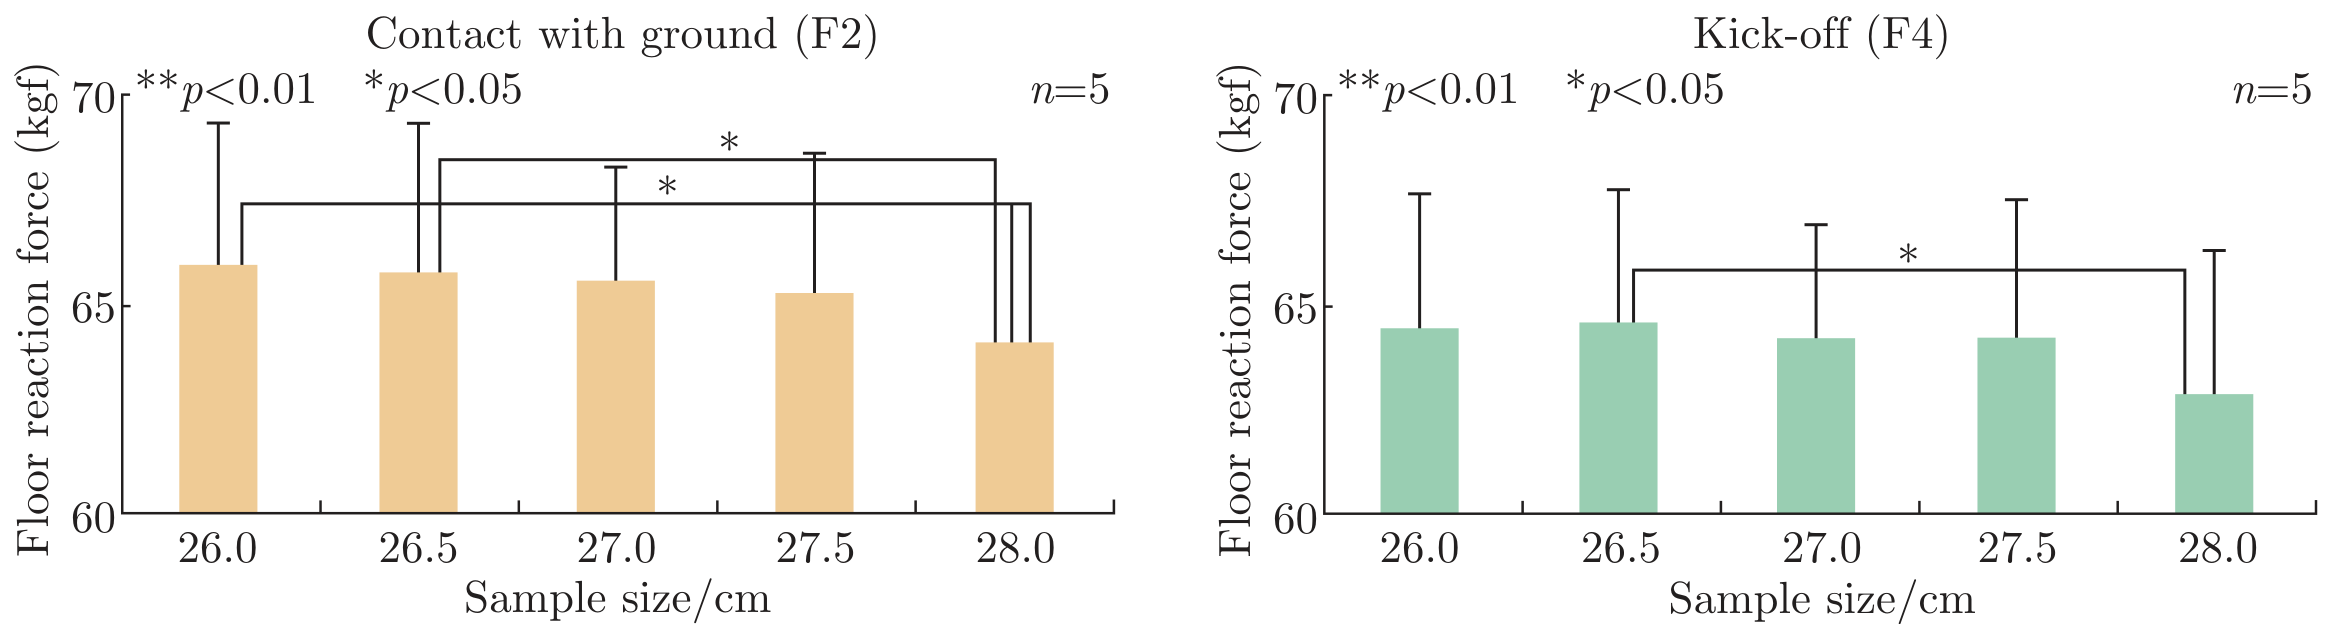
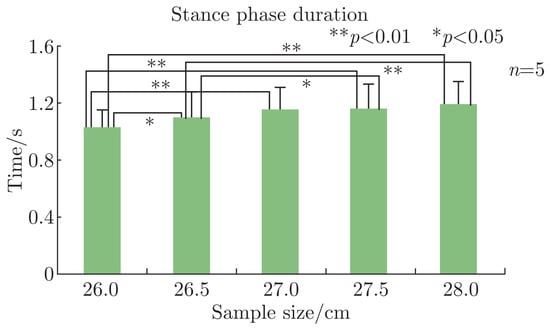
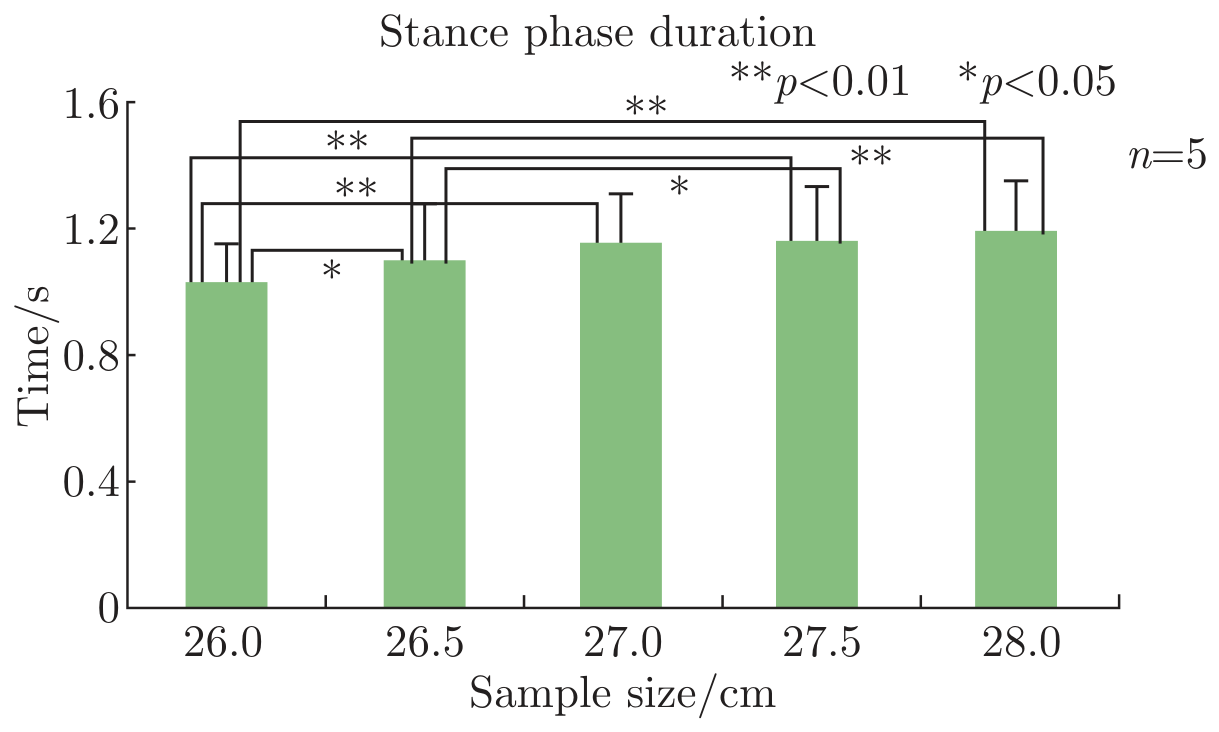
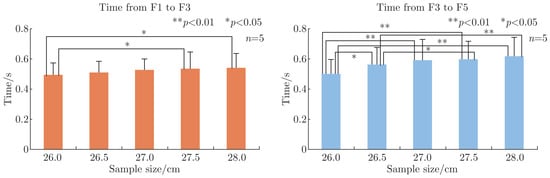
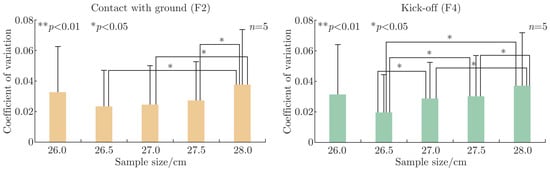
Looking at the two peak values for ground reaction force (F2 and F4) as shown in Figure 7, the F2 value for the 28.0 cm sample was significantly (p < 0.05) smaller than for the reference size (26.5 cm). Similarly, the F4 value for the 28.0 cm sample was significantly (p < 0.05) smaller than for the reference size (26.5 cm).The stance time shown in Figure 8 was significantly (p < 0.01, p < 0.05) longer when the shoe size was at least 1 cm larger than the reference size (26.5 cm). Additionally, it was significantly (p < 0.05) shorter for the 26 cm sample compared to the reference size (26.5 cm). The time from ground contact (F1) to the inflection point (F3) shown in Figure 9 was significantly (p < 0.05) longer for the 27.5 cm and 28.0 cm samples compared to the 26.0 cm sample, while the time from the inflection point (F3) to separation from the ground (F5) was significantly (p < 0.05, p < 0.01) longer for the 27.5 cm and 28.0 cm samples compared to the reference size (26.5 cm). A similar trend was observed for the 26.0 cm sample as well. These results suggest that differences in foot size have an effect on kick-off movement duration (F3 to F5) during the stance phase. It was observed that a statistically significant tendency (p < 0.05) for the coefficient of variation for the (F2) ground reaction force peak value shown in Figure 10 to increase for the 28.0 cm sample relative to the reference size (26.5 cm). Similarly, a statistically significant (p < 0.05) tendency for the value to increase for the 28.0 cm sample relative to the 27.0 cm and 27.5 cm samples were also observed. For its part, the coefficient of variation for the (F4) ground reaction force peak value was significantly (p < 0.05) larger for samples at least 0.5 cm larger than the reference size (26.5 cm). The value was also significantly (p < 0.05) larger for the 27.0 cm and 27.5 cm samples than for the 28.0 cm sample.
Figure 7.
Ground reaction force peak values (F2, F4).
Figure 8.
Stance phase duration.
Figure 9.
Time from F1 to F3 and from F3 to F5.
Figure 10.
Coefficients of variation for ground reaction force peak values (F2, F4).
3.3. Walking Sensations
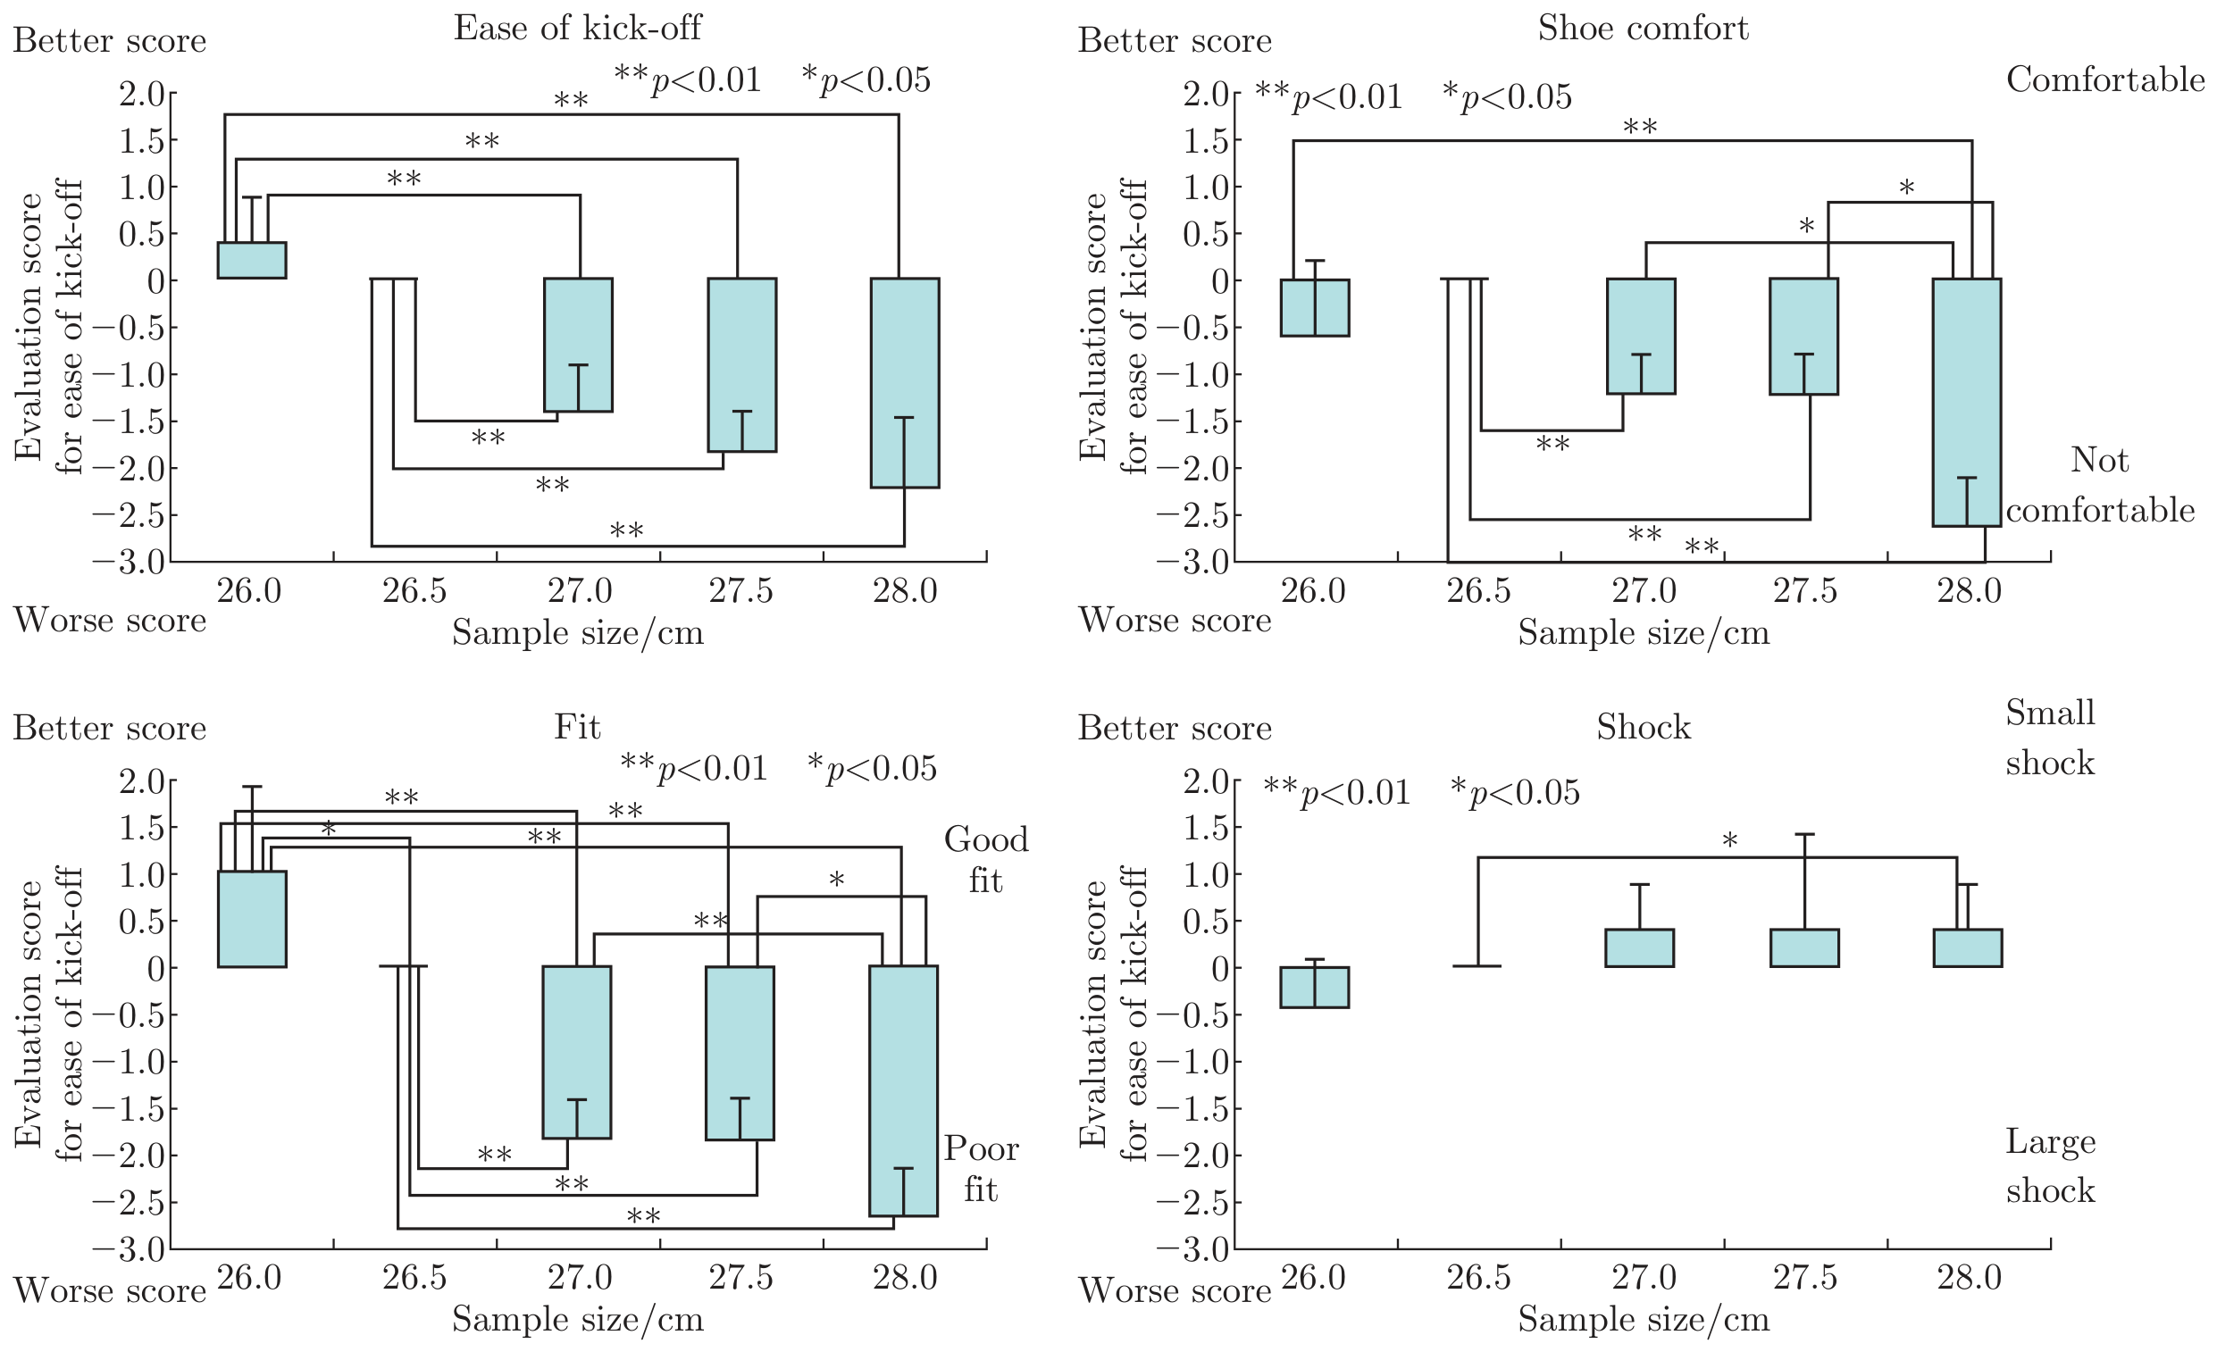
Figure 11 illustrates the evaluation results for walking sensation. Subjects indicated that ease of kick-off was significantly (p < 0.01) greater for the 26.0 cm sample than for the reference size (26.5 cm). By contrast, they indicated that ease of kick-off was significantly (p < 0.01) lower for sample sizes larger than the reference size. They indicated that fit was significantly (p < 0.01) worse for all samples than for the reference size (26.5 cm) and that it was significantly (p < 0.05) worse for the 28.0 cm sample compared to both the 27.0 cm and 27.5 cm samples. They also indicated that shoe comfort was significantly (p < 0.01) worse for all samples larger than the reference size (26.5 cm) and that it was significantly (p < 0.05) worse for the 28.0 cm sample compared to the 26.0 cm, 27.0 cm, and 27.5 cm samples. Finally, a tendency in their evaluations for shock to be less noticeable as the shoe size increased above the reference size (26.5 cm) was observed.
Figure 11.
Results of Walking Sensation Questionnaire.
4. Discussion
A tendency for muscular activity in the lower leg and load to increase as the shoe size increased beyond the reference size (26.5 cm) was observed. Additionally, the associated coefficients of variation exhibited a tendency to increase, and it is likely that the resulting decrease in the reproducibility of gait and associated increase in variation acted to increase muscle load. Based on the fact that the time from the inflection point (F3) to separation from the ground (F5) was significantly longer when the sample size was larger than the reference size (26.5 cm), we believe that the foot was sliding inside the shoe in the direction of movement during kick-off. Since the ground reaction force impulse needed to generate forward motion remained the same for different sample sizes, it is only natural that the ground reaction force at kick-off (F4) would decline if the time required for kick-off movement were to increase. Based on the walking sensation questionnaire results, ease of kick-off decreased as shoe size increased. Here, too, we believe that movement of the foot inside the shoe had an effect on walking sensation. In contrast, the higher score for shock received by these samples reflects the lower ground reaction force peak value caused by movement of the food in the shoe. When consumers choose shoes in a store, the sensation of tightness associated with shoes that are too small for the wearer’s foot size makes it rare for them to choose such sizes. However, most shoe designs from Japanese shoe manufacturers and athletic shoe manufacturers are available in only a small number of widths. Many consumers are likely to choose shoes based on how well they fit the width of their feet, resulting in the selection of shoes that are too long [10]. Since these shoes do not feel tight when worn, they are not problematic in terms of user sensation. However, the findings of this study indicate that shoe size impacts walking, the most frequent type of exercise, including by increasing the load on the muscles of the lower leg and by decreasing reproducibility of gait.
5. Conclusions
It was discovered that use of shoes that do not fit — in short, shoes that are too large for the wearer’s feet — have the following effects on walking:
- Activity of the gastrocnemius muscle, which functions primarily during kick-off movement, increases. In short, muscle load increases.
- The amount of time required for kick-off movement increases, and the ground reaction force peak value decreases. That is to say, movement becomes less efficient.
- Reproducibility of gait decreases, and walking sensation generally deteriorates.
We believe that the measurement and evaluation methods employed in this study enabled us to quantify the effects of improperly sized shoes on gait. Furthermore, the findings suggest the importance of considering functional fit as it relates to gait in addition to fit as evaluated in terms of shape based on size labeling and foot morphometry.
In addition to the length component of size that was investigated in this study, there is a width component. The effect of improper width on gait remains a topic for future study.
Acknowledgments
We would like to express our deepest gratitude to Prof. Hosoya who provided carefully considered feedback and valuable comments.
References
- Somushou kokuseityousa ooyobi zinnkosukei, kokuritushakaihoshou zinnkoumonndaikennkyuusho –nihon no shouraisuikeizinnkou. http://www.soumu.go.jp/johotsusintokei/whitepaper/ja/h24/html/nc112120.html.
- MmonnbukagakushouTaikyokuSportsnikansuruyorontyousa (2014.JAN). http://www.mext.go.jp/b_menu/hakusho/html/hpad199201/hpad199201_2_005.html.
- Naikakufu-Taikyoku SPORTS ni kannsuru yorontyousa. http://www8.cao.go.jp/survey/h21/h21tairyoku/index.html.
- Mori, Y.; Omori, T. Problems of fashionable shoes from the viewpoint of foot pressure distribution and EMG analysis. Jpn. Soc. Home Econ. 2001, 52(5), 411–420. [Google Scholar]
- Dokuritugyouseihouzinn Sangyousougoukenkyuusho ASHInokeizyoutotokutyou. http://www.dh.aist.go.jp/jp/research/centered/foot/.
- Otonari, Y.; Kasahara, S. Recognition to shoes and a foot size: comparison between male and female. Ryutukagakukenkyu 2006, 6(1), 33–39. [Google Scholar]
- Nakamura, Ryuiti; Saitou. FUNDAMENTAL KINESIOLOGY; Tokyo Ishiyaku Publishers, 2000; Vol 5, pp. 342–50. [Google Scholar]
- Takahashu, Akira. Health and physical education anatomy, Nihon Taikusha, 1978, 89-90, 97.
- Kato, Z.; Ookubo, T. Sogakushanotameno seitaikinouno hakarikata, nihon shupan sa-bisu, 1999, 29-43, 159-162.
- Otsuka, A.; Kikuta, F. Similarity between proper size assigned from foot measurement values and self-styled size of leather shoes in Japanese adults. Jpn. Soc. Home Econ. 1992, 43(4), 311–318. [Google Scholar]

© 2014 Textile Bioengineering and Informatics Society. This article is an open access article distributed under the terms and conditions of the Creative Commons Attribution (CC BY) license (https://creativecommons.org/licenses/by/4.0/).