


Abstract
A heat and humidity transfer model for the pilot wearing bladder anti-G garment system is developed. In the model, an 85-node human thermoregulatory model is developed for predicting pilots’ thermal stresses and the coupled heat and humidity transfer equations including latent heat sorption/release of the Phase Change Materials (PCM) are utilized for the garment. Meanwhile, the garment inner boundary conditions are treated by considering the bladder effects. Also, the model is validated by comparing the simulation with experimental results. After the validation, water vapour concentration and temperature at different parts of garment and evaporation heat loss, dry heat loss and skin temperature at different parts of body are predicted and compared to study the influences of bladder. Otherwise sweat rate, sweat accumulation, mean skin temperature and comprehensive index of thermal stress under garments with different volumetric fractions of PCM are also predicted and compared to study the influences of PCM. The conclusion shows that bladders will produce more heat stress on wearers and PCM can improve the thermal performance of the bladder anti-G garment.
1. Introduction
To protect the fighter pilots from injurious G-load resulting from fighter high acceleration, bladder anti-G garments are designed specially. The bladders are impermeable, they will be flatted and will compress skin surface to protect pilots from blacking-out during periods of high acceleration. Because of impermeable bladders and high thermal resistance, anti-G garments always produce heat stress on wearers even in a moderate environment. The heat stress will reduce pilots’ work efficiency and decrease their endurance to the high G-load. To mitigate pilot heat stress in various environments, research on thermal performance of anti-G garment is essential to provide critical information for improving the garment design. In the past years, many models for the general clothing or the clothed human body have been developed. For human body, Gagge [1] developed a 2-node model and divided human body into two layers, core and skin which have the same temperature in each layer. Gagge’s model is simple and useful in homogeneous conditions, but it cannot describe human body accurately in a complex and polytropic environment. Therefore, Jones [2] divided the layer of skin into multiple nodes based on a two-node model. Alireza and Mehdi [3] presented a simplified three-node model, in which the passive system of the human body is considered as core, bare skin, and clothed skin compartments, and the relative energy balance equation is used to determine the human thermoregulatory parameters. Stolwijk [4] developed a 25-node model including 6 segments and each segment were divided into core, muscle, fat and skin layers. Stolwijk’s model is mostly complete and can simulate sweating and shivering accurately except for considering sweat accumulation on skin. Wafaa and Nesreen [5] improved an arterio- venous anastomoses model of the digits to accurately predict skin blood flow rate in the hands and fingers, and the local and overall human thermal responses in transient environments. For anti-G garments, Qiu Yifen [6] developed a thermal performance analysis model of bladder anti-G garments based on thermal and moisture resistance model of the garment and human bioheat transfer equations. However, the thermal resistance and moisture resistance are measured under steady-state conditions, which cannot fully describe the real heat transfer process within the anti- G garments. To consider the coupled heat and humidity transfer processes in the anti-G garment, the fiber hygroscopicity must be taken account. Li and his collaborators [7,8,9,10,11] developed a series of the garment models, in which the water vapor diffusion, moisture absorption/desorption by the fibers, liquid water penetration due to capillary pressure, evaporation/condensation, phase change heat generation, radiation and pressure gradient have been taken into the model gradually. Some models have been used to simulate thermal responses of clothed human body model [12]. However, the above mentioned are only for general garments. To overcome the disadvantage of the thermal and moisture resistance model for garment and discuss the improvement of thermal performance method for the bladder anti-G garment, this paper combines the coupled heat and humidity transfer model for garment and an improved human thermoregulatory model to study the thermal performance of bladder anti-G garment. Influences of bladders and phase change materials in anti-G suit on pilots’ thermal responses are analyzed using this model respectively.
2. Mathematical Models
The mathematical models include human thermoregulatory model, clothing heat and humidity transfer model and boundary conditions.
2.1. 85-node Human Thermoregulatory Model and Index of Heat Stress
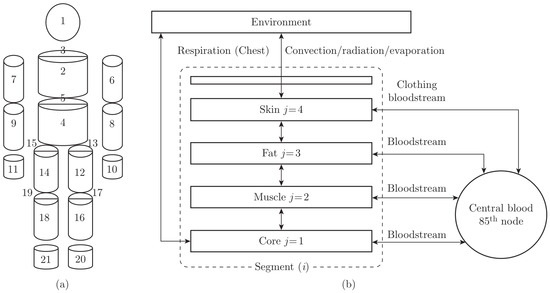
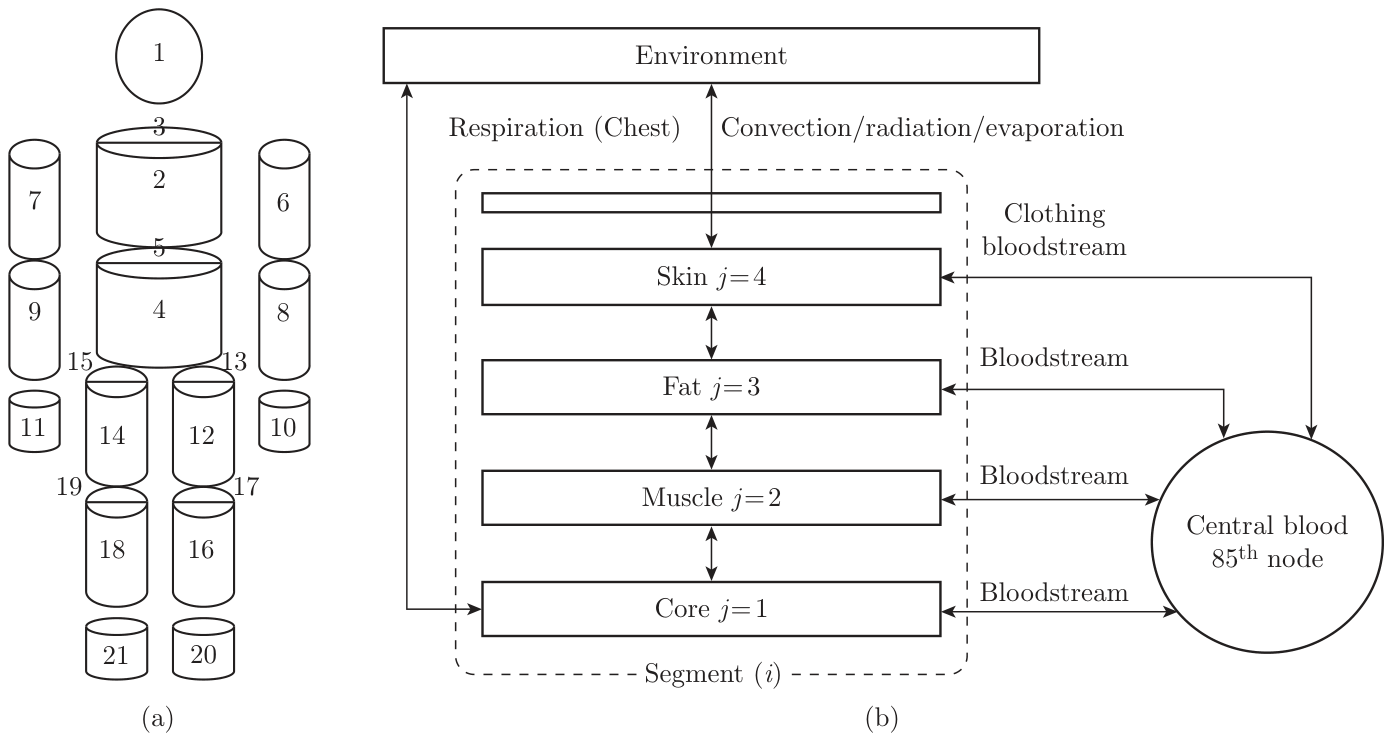
To consider the bladder effect on the human body temperature, the 25-node Stolwijk’s model [4] and 61-node model of Salloum and Ghaddar [13] are improved in this paper. Figure 1 (a) shows the controlled system of human body. The whole human body is divided into 21 segments, and the abdomen, front of left thigh, front of right thigh, front of left lower leg and front of right lower leg, which are near the bladders, are separated from the trunk, legs in Stolwijik’s model so that influences of bladders on pilots’ thermal responses can be researched more accurately. Also, each segment is subdivided into 4 layers: core, muscle, fat, and skin, as shown in Figure 1 (b). Similar to Stolwijk’s model, an additional central blood pool is used to illustrate heat exchange between blood and each tissue layer. The whole human body is considered as 85-node, so we can call it 85-node model. The energy conservation equations for tissue layers and blood can be written as follows:

 where, (i, j) is the i-th segment and j-th layer. C, Q, B and D denote heat capacity, heat generation rate, blood flow heat loss and conductive heat exchange rate, respectively. T˙ is temperature change rate. RES represents respiration heat loss, which only exists in the chest core layer, 85 denote the blood node. Qt is the skin surface dry heat loss, which can be expressed as:
 where, hc and hr are convective and radiative heat transfer coefficient, Ti,1,left denotes the tem- perature at left node of clothing layer 1 near the i-th human body segment. S(i) is the surface area of the i-th segement.
Figure 1.
Controlled system for human body (a) segment subdivision: 1. Head; 2. Chest; 3. Back; 4. Abdomen; 5. Waist; 6. Left upper arm; 7. Right upper arm; 8. Left forearm; 9. Right forearm; 10. Left hand; 11. Right hand; 12. Front of the left thigh; 13. Back of the left thigh; 14. Front of the right thigh; 15. Back of the right thigh; 16. Front of left lower leg; 17. Back of left lower leg; 18. Front of right lower leg; 19. Back of right lower leg; 20. Left foot; 21. Right foot. (b) Segment i.
E is the skin evaporation heat loss, which can be written as [2]:
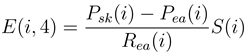 where, Psk is skin surface water vapour pressure, which can be calculated by Jones method [2]. Pea denoted the ambient vapour pressure. Rea represents evaporation thermal resistance of ambient air layer. Sweating rate and sweat evaporation rate control the liquid sweat accumulation on the skin surface [2]:
 where, ms is liquid sweat accumulation on the skin surface, mrsw is sweating rate, Psat represents skin saturate vapour pressure. Resk is skin evaporation resistance, hfg denotes sweat vaporization heat.
The human thermoregulatory system is same as that in Stolwijk’s model, more detail informa- tion can be found in Ref. [4].
For describing the body heat stress, a comprehensive index of heat stress C was defined by Ref. [6]:
 where, ∆Tb is rise of average body temperature, Sw is the sweat rate (g/min).
2.2. Heat and Humidity Transfer Model for the Bladder anti-G Gar- ment
In order to describe the heat and humidity transfer in the bladder anti-G garment and investigate the PCM on the thermal performance of the garment, the coupled heat and humidity transfer model for the textiles inserting PCM is used. The basic mathematical formulas, in order, mass balance of water vapour, energy conservation of clothing, and the volumetric fraction relation are listed as following [14]:
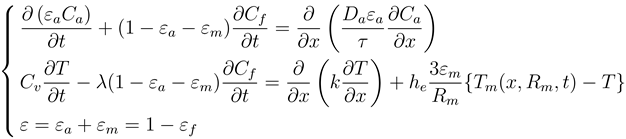 where, ε denotes the volumetric fraction. Subscripts for, a, m, f represent air, PCM and fiber respectively. C is water vapor concentration except volumetric thermal capacity, Cv. D is the diffusion coefficient, τ is the effective tortuosity of water vapor through the fabric, T is the temperature, λ and k represent the moisture sorption latent heat by the fiber and the fabric thermal conductivity. he denotes the effective heat transfer coefficient between fabric and PCM. x, Rm and t represent the position of fabric, PCM microcapsule radius and time, respectively.
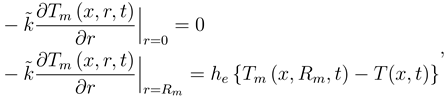
Cf can be obtained by Fick’s Law [10]. PCM microcapsule temperature, Tm(x, Rm, t) can be obtained by solving the energy conservation equation for the PCM microcapsule [14]:
 with the boundary conditions [14]:
 and the initial condition [14]:
where, is effective thermal capacity, which can be found in Ref. [14], and is the effective heat conductivity.
Tm (x; r; 0) = Tm0;
2.3. Boundary Conditions
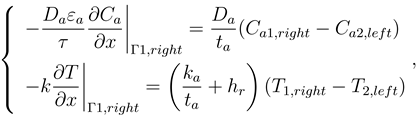
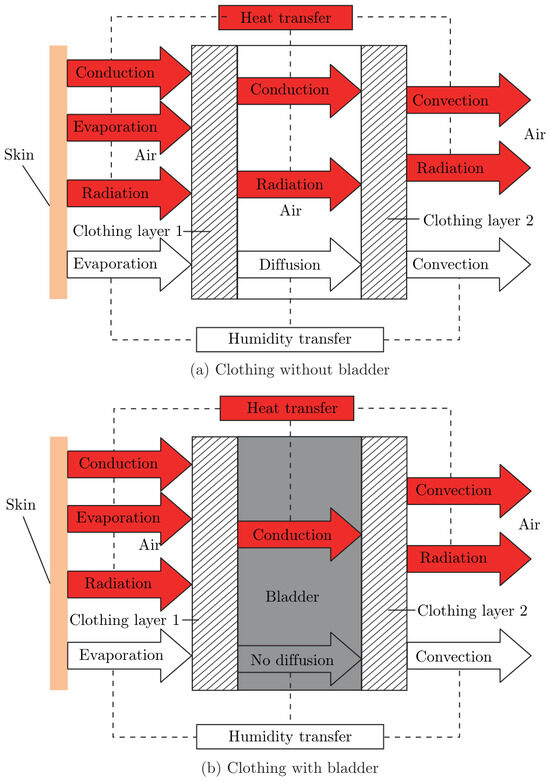
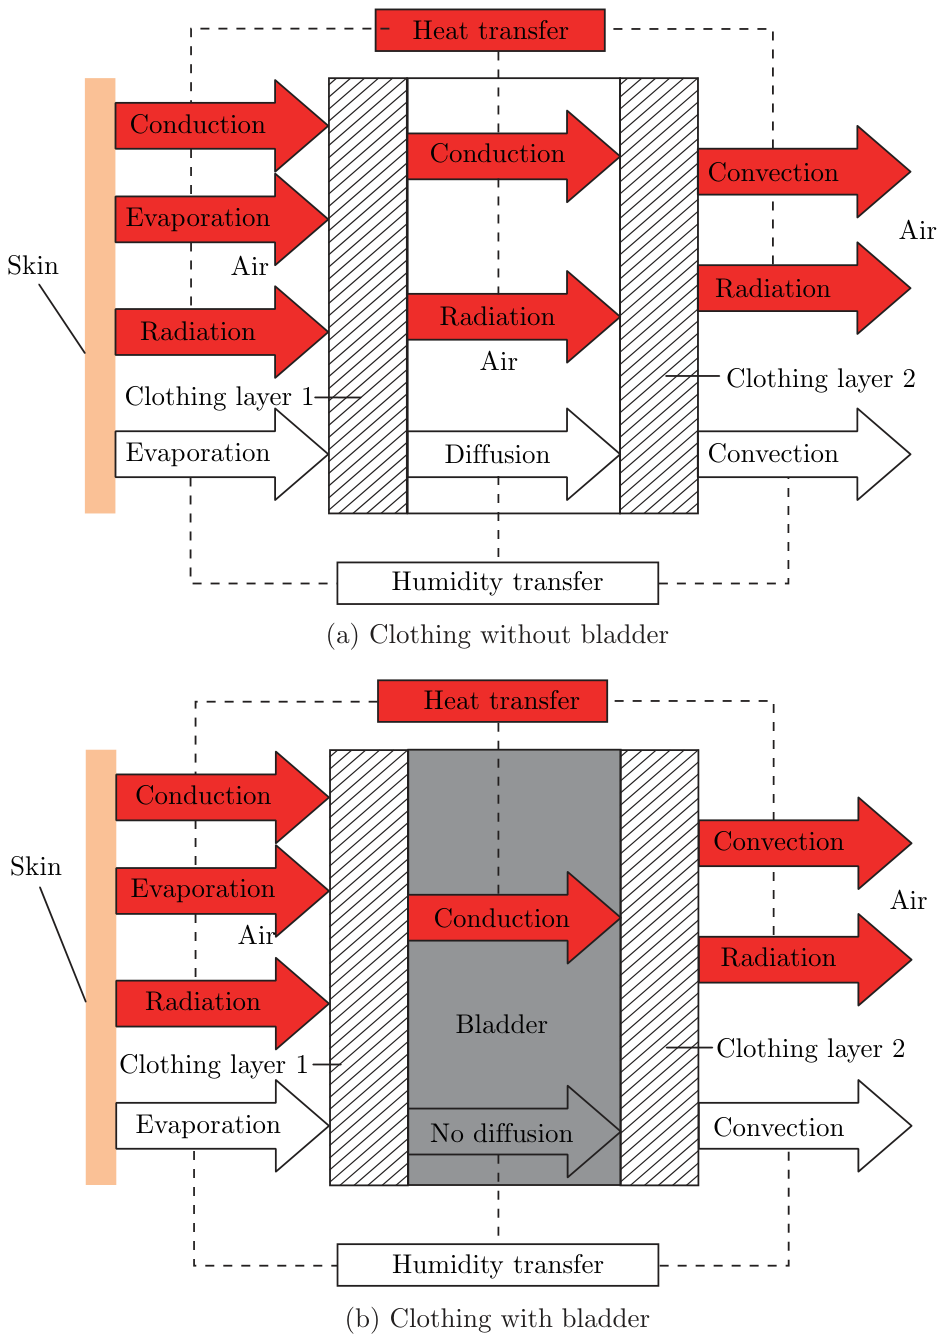
To solve the equations (7), the initial and boundary conditions must be listed. The initial condi- tions can be given by calculating the temperature and concentration at equilibrium state between clothing and environment. The schematic boundary conditions of heat and humidity transfer in anti-G suit is given in the Figure 2. Figure 2 (a) shows the case of clothing without bladder. There is air layer between the clothing layers. For this case, the conduction and radiation heat transfer between clothing layers takes place simultaneously, and diffusion humidity transfer occurs due to the water vapour concentration difference. Thus, the boundary conditions for the right side of clothing layer 1 can be written as:
 The left side of clothing layer 2 is
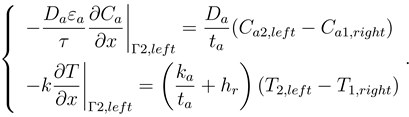 where, ta is thickness of air, represents the diffusion humidity transfer coeffcient in the static layer, and denotes conduction heat transfer coeffcient. hr is radiation heat transfer coeffcient.
Figure 2.
The schematic boundary conditions of heat and humidity transfer in Anti-G suit.
Figure 2 (b) shows the case of clothing with bladder. For this case, only conduction heat transfer through the bladder takes place between the clothing layers, no humidity diffusion occurs due to the impermeable bladder. Thus, we also can use the same equations (10) and (11), but make some assumptions to describe the case of clothing with bladder:
where, kb and tb represent the bladder thermal conductivity and thickness, respectively.
hr = 0
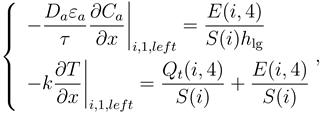
Comparing the case with and without bladder bladder, we can see that the left boundary conditions on the clothing layer 1 are same, and right boundary conditions on the clothing layer 2 are also same. For the i-th human body segment, the left boundary conditions on the clothing layer 1 can be written as:
 Right boundary conditions of clothing layer 2 are given by:
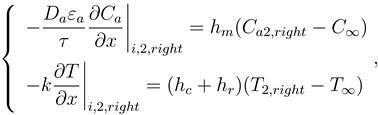 where, hc is convective heat transfer coefficient, which is a function of the air velocity v for a seated person, hc= 3.43+5:93v W/m2 K. The mass transfer coefficient hm can be obtained from the Lewis Relation [15].
3. Model Validation and Simulation
3.1. Model Validation
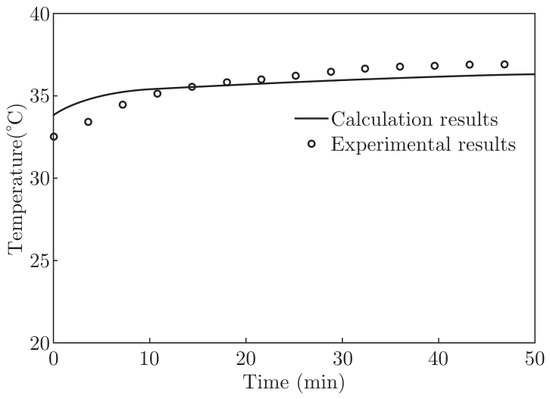
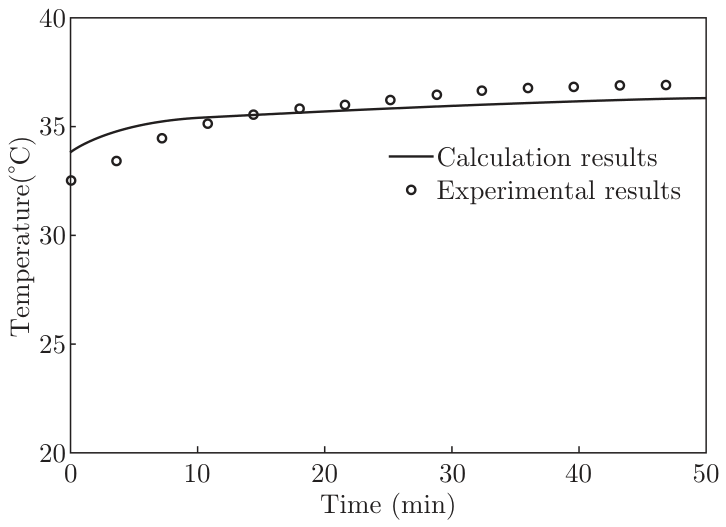
The numerical technique for the human body is an explicit differential method, and is an implicit central differential method for clothing. The simulation program is written in FORTRAN. The model in this paper is developed from our previous model. In our past models [12,14], we have already done lots of verification on different kinds of garments including with and without PCM. In this paper used the following experiment to verify the model of anti-G suit with the bladders. We simulated a process of an experiment in a hot climate chamber [6]. The chamber wind velocity is less than 0.1 m/s and the vertical and horizontal temperature difference is below 1 °C. The dry temperature 40 °C while the relative humidity is 54%. Under each pre-determined environmental conditions six male volunteers are tested. No female volunteers are tested because application of anti-G garments is mainly for male pilots. The volunteers are seated in the climate chamber with anti-G garments without PCM and relevant clothing. The anti-G garment is made of 2-layer cotton fabric each with 2 mm thickness and the bladder is made of polyester materials with 3 mm thickness. The five bladders are distributed near the abdomen, left front thigh, right front thigh, left front leg and right front leg. The physical parameters can be found in Ref. [12]. Each volunteer is exposed to the hot chamber environments for several minutes. Body thermal physiological parameters are measured, covering skin temperature, rectal temperature, heartbeat rate and eight point skin temperatures at body back, chest, abdomen, waist, upper arm, forearm, thigh and calf respectively. Human responses are simulated by using the thermoregulation system model under the same experimental conditions. Model predictions are compared to the experimental results, as presented in Figure 3 (40 °C chamber environment). Final values of mean skin temperature predicted by modeling and by experiments are consistent with each other. According to the above comparisons the thermal system simulation model is validated to be sufficiently accurate, and could be used for analyzing the thermal performance of anti-G garments.
Figure 3.
Comparison of modelling and experimental mean skin temperatures in a 40 ◦C climate chamber.
3.2. Model Simulation
After validating the model, we can use it to investigate the influences of bladders and phase change materials in anti-G suit on pilots’ thermal responses. In the simulations below, the thermoregulation system model is used under the same experimental conditions above.
3.2.1. Influences of Bladders
To investigate the influences of bladders, we compared the difference between the variables of the chest without bladder and the abdomen with bladder. The simulation results are shown from the Figure 3, Figure 4, Figure 5, Figure 6 and Figure 7.
Figure 4.
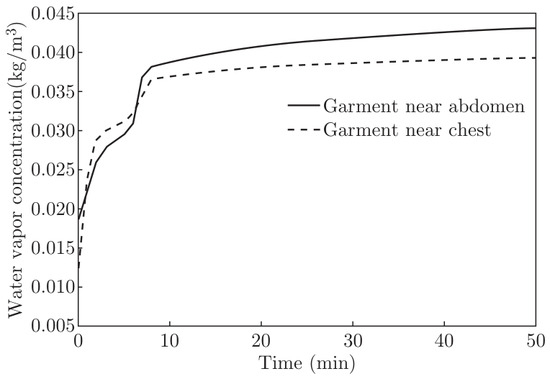
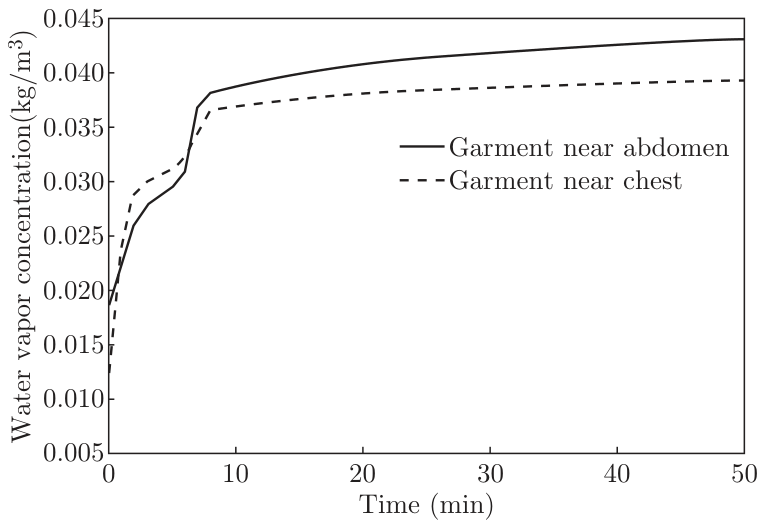
Water vapour concentration at inner surface of garment near abdomen and chest.
Figure 5.
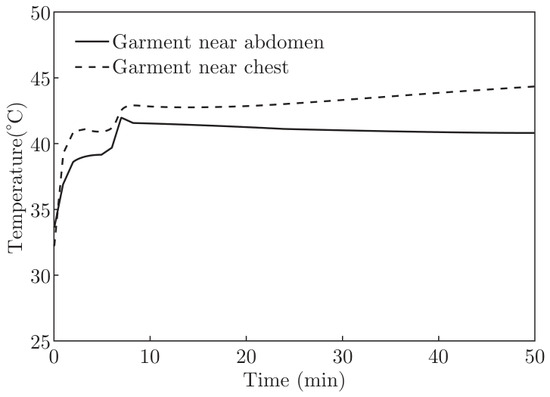
Temperature at inner surface of garment near abdomen and chest.
Figure 6.
Skin evaporation heat loss at chest and abdomen.
Figure 7.
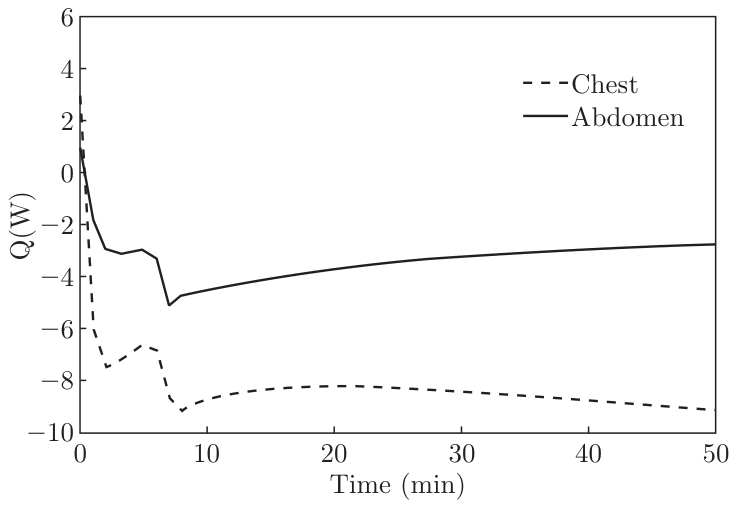
Dry heat loss from skin at chest and abdomen.
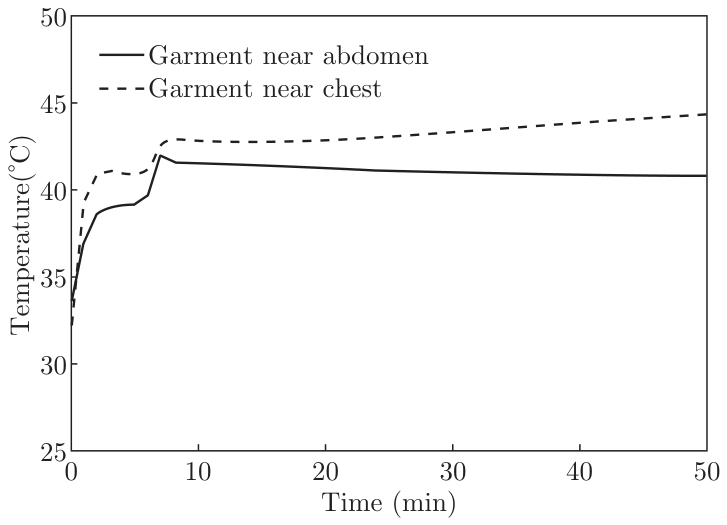
Figure 4 shows water vapour concentration at inner surface of garment near abdomen and chest. The water vapour concentration at inner surface of garment increases quickly at the beginning due to the effect of the water vapour pressure at skin surface and that in the environment and keeps balance around 5 min. At about 7 min, water vapour concentration increases again for sweat accumulation on the skin surface. Because of bladders’ impermeability, water vapour concentration at inner surface of garment near abdomen is higher than that near chest. Figure 5 shows temperature at inner surface of garment near abdomen and chest. The temperature at inner surface is influenced by the environment temperature and water vapour concentration at garment.
From 2 to 6 min, the temperature keeps balance. In the following 2-3 min, the temperature increases again due to the evaporation heat transfer. The temperature of the garment near chest is higher than when compared to the garment near abdomen due to greater evaporation heat from the skin of chest without bladder covered.
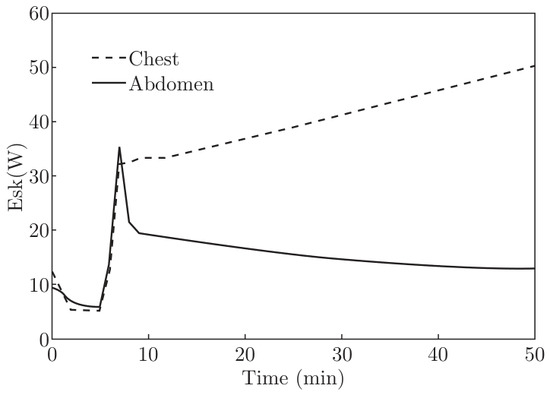
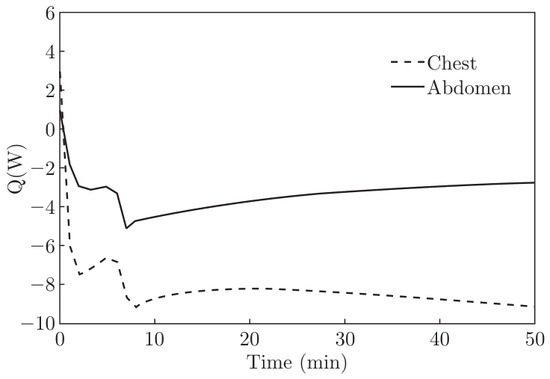
We can find skin evaporation heat loss at chest and abdomen from Figure 6. The sweat evaporation increases quickly from 5 min to 7 min, then evaporation heat loss at abdomen decreases because of bladder stopping sweat evaporation from skin while that at chest without bladder covered still increases. Figure 7 shows dry heat loss from skin at chest and abdomen. Dry heat loss is related with the temperature of skin and garment. The temperature of skin is lower than that of garment so dry heat loss is negative.
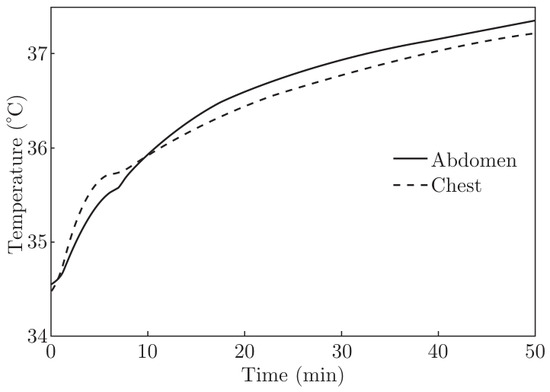
Figure 8 shows skin temperature at chest and abdomen. Before 10 min, the skin temperature at chest is higher at a high temperature environment. After that, the skin temperature at abdomen is higher, because skin evaporation heat loss at abdomen is less due to the bladder stopping sweat evaporation from skin.
Figure 8.
Skin temperature at chest and abdomen.
From above mentioned, we can easily see that bladders in anti-G suit produce more heat stress on pilots for the impermeability.
3.2.2. Influences of PCM
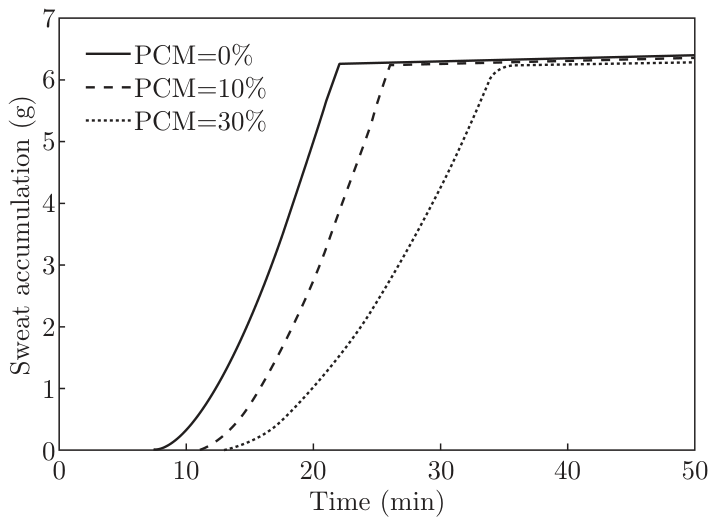
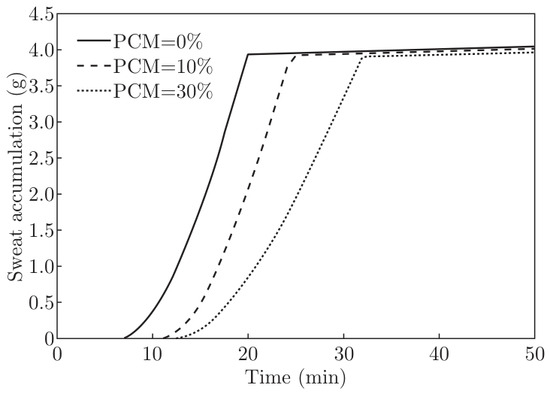
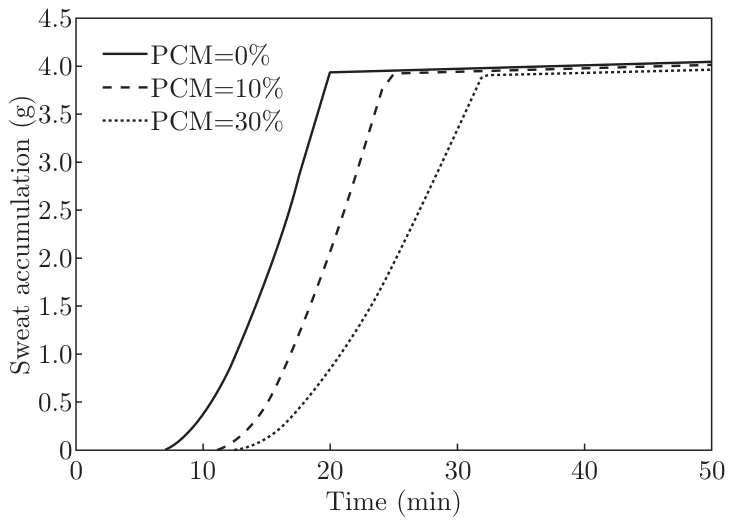
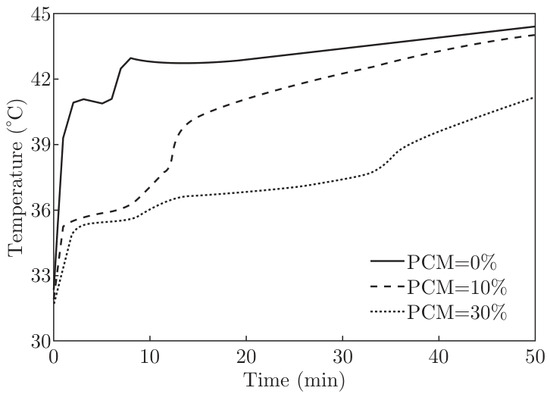
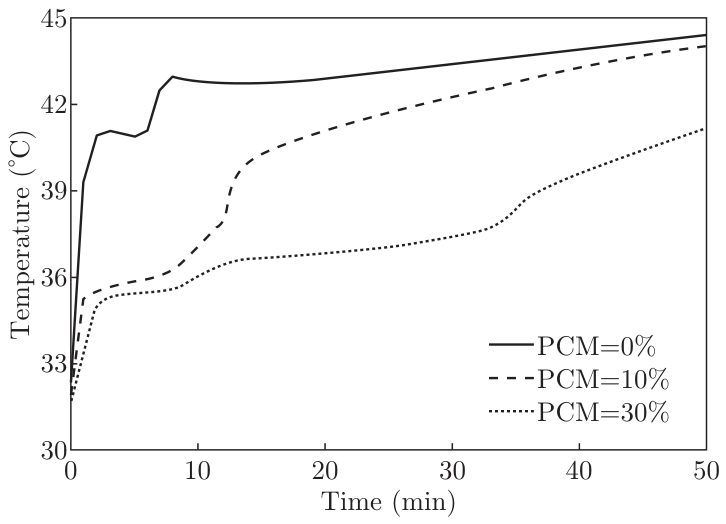
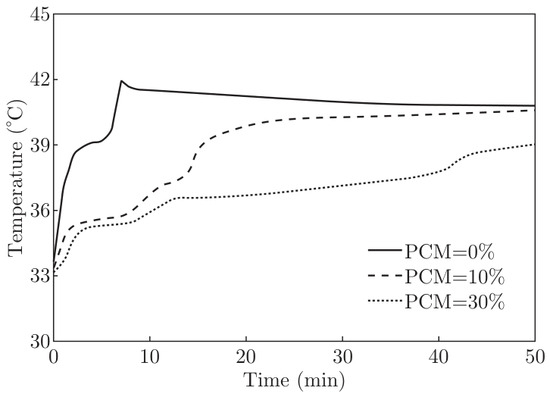
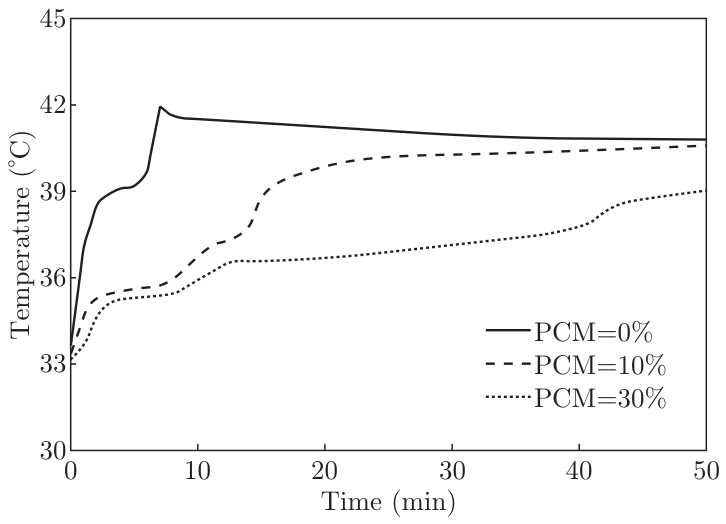
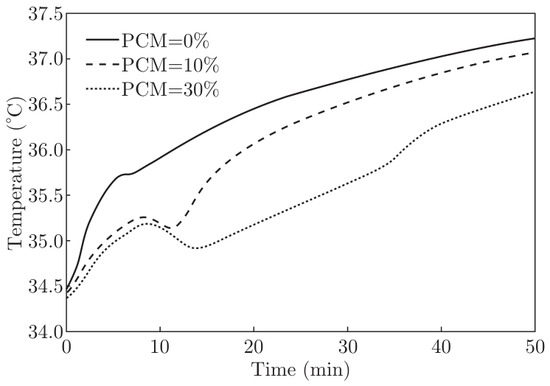
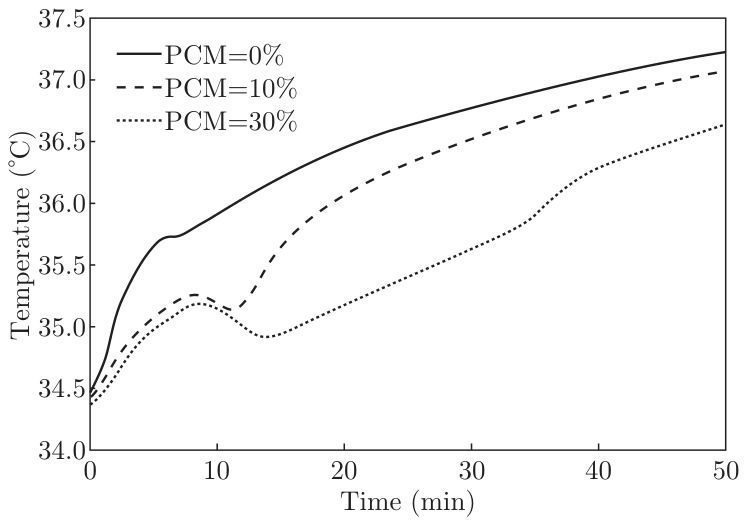
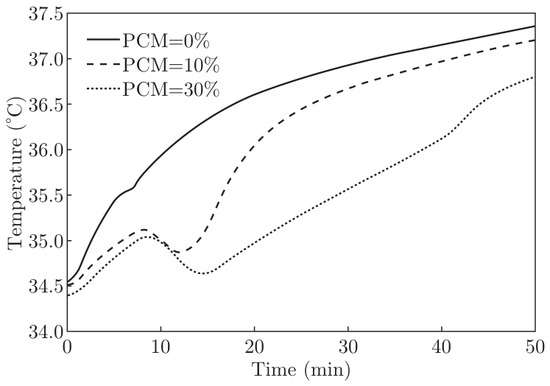
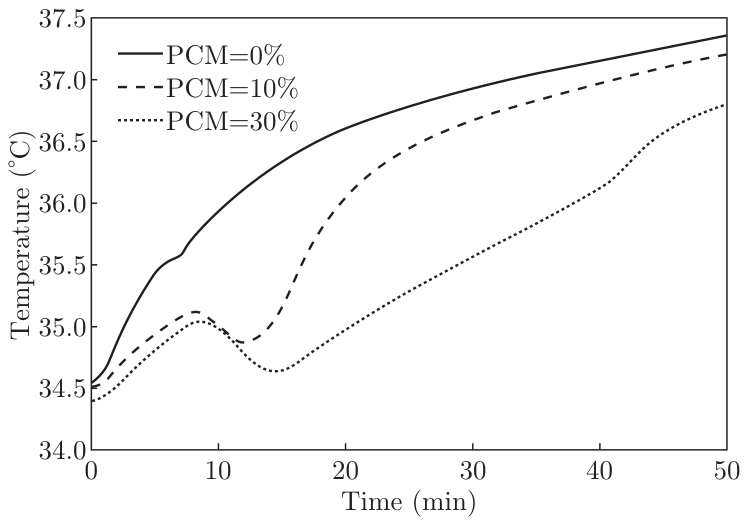
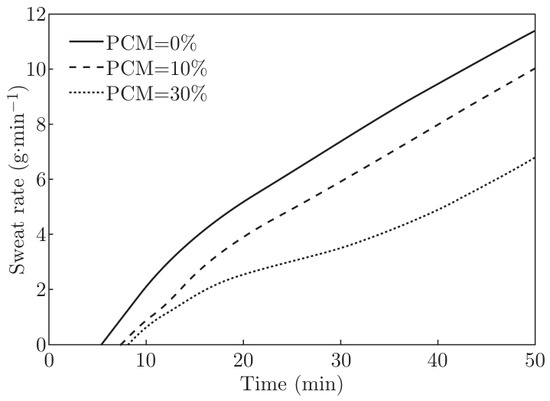
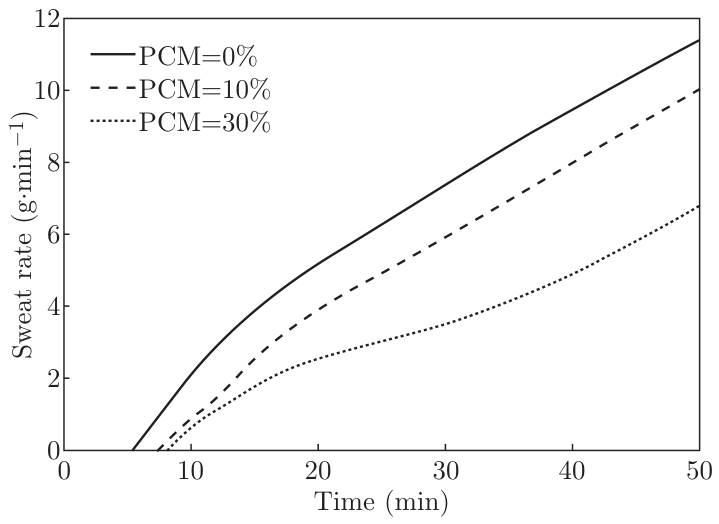
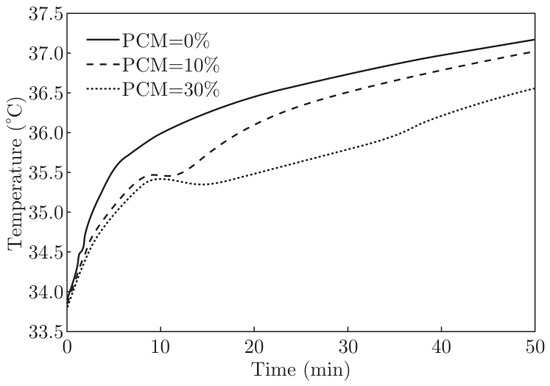
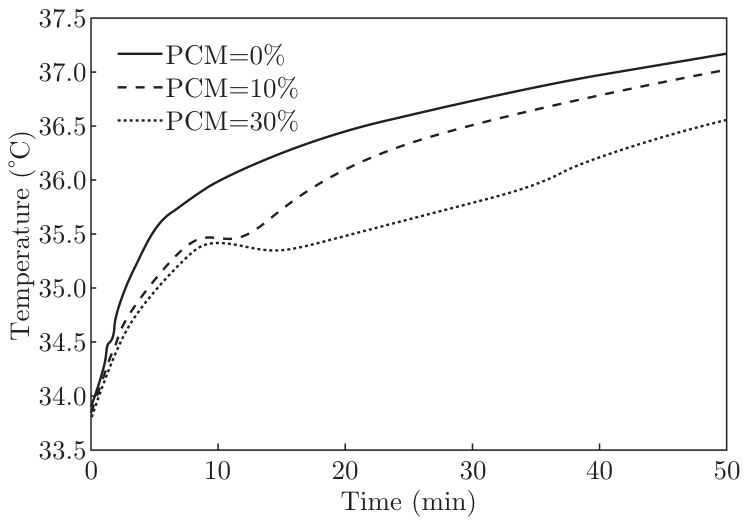
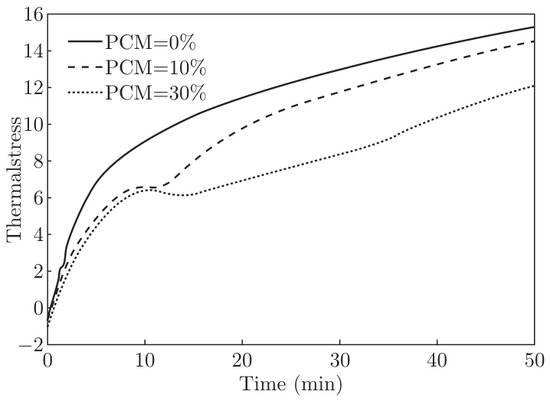
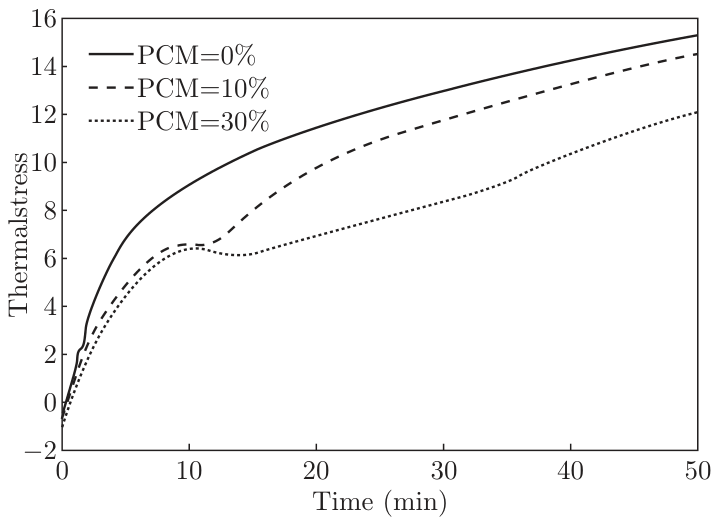
To investigate the influences of PCM, we compared the difference of variables while garments have different volumetric fraction of PCM (0%, 10%, 30%). The simulating results are shown in the Figure 9, Figure 10, Figure 11, Figure 12, Figure 13, Figure 14, Figure 15, Figure 16 and Figure 17. The PCM microcapsules are made of eicosane. The radius of the micro-PCM was 5 µm. The physical parameters for the PCM are given in Table 1.
Figure 9.
Sweat accumulation at chest.
Figure 10.
Sweat accumulation at abdomen.
Figure 11.
Temperature of garment near chest.
Figure 12.
Temperature of garment near abdomen.
Figure 13.
Skin temperature at chest.
Figure 14.
Skin temperature at abdomen.
Figure 15.
Sweat rate under garments with different volumetric fraction of PCM.
Figure 16.
Mean skin temperature under garments with different volumetric fraction of PCM.
Figure 17.
Comprehensive index of thermal stress under garments with different volumetric fraction of PCM.
Table 1.
Physical parameters for eicosane.
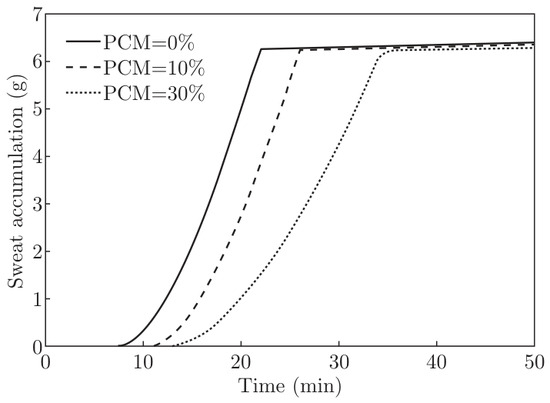
Figure 9 and Figure 10 show sweat accumulation at chest and abdomen covered by garment with dif- ferent volumetric fraction of PCM respectively. We can see that PCM delayed sweat accumulation and the greater the volumetric fraction of PCM the more time delay. The sweat accumulation at chest covered by garment without PCM begins at about 7 min. When garment with 10% PCM it begins at about 12 min, and begins at 14 min when garment with 30% PCM. At last sweat accumulation keeps balance. The sweat accumulation at abdomen is similar with that at chest.
Figure 11 and Figure 12 shows temperature of garment with different volumetric fraction of PCM near chest and abdomen respectively. When the temperature of garment reached a melting point (35 °C) for PCM, PCM changes from solid to liquid and absorbs lots of heat. As a result the temperature of garment stops increasing until all PCM becomes liquid.
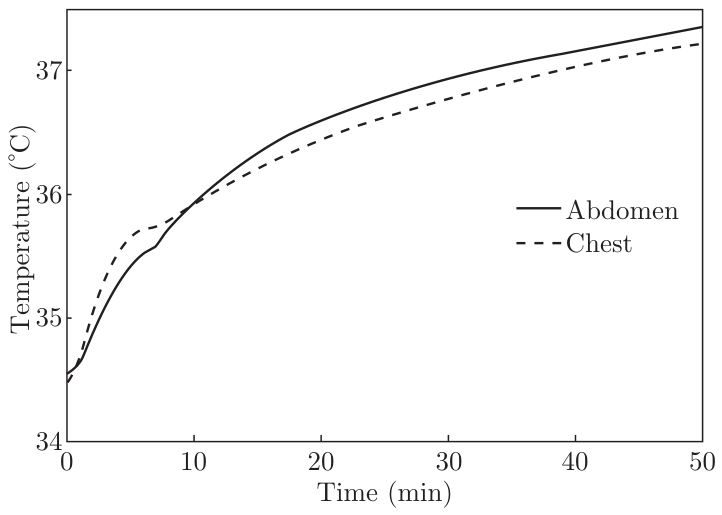
Skin temperature at chest and abdomen covered by garment with different volumetric fraction of PCM are shown in Figure 13 and Figure 14 respectively. Between 5 and 15 min, the skin temperature decreases for a while because of sweat evaporation heat loss. Because the temperature of garment with PCM stops increasing, the skin temperature decreases more than when compared to the garment without PCM. Increase of skin temperature is delayed by PCM and the greater the volumetric fraction of PCM the more time delay.
Figure 15 shows sweat rate under garments with different volumetric fraction of the PCM. The sweat rate under garments with more volumetric fraction of the PCM is less. Figure 16 shows the mean skin temperature under garments with different volumetric fraction of the PCM. The mean skin temperature of the person dressed in anti-G garment with the PCM is lower and delayed due to the effect of the PCM absorbing heat through melting. The temperature decreases at around 10 min, because the body begins to sweat and sweat evaporation takes off heat from body. The human body wearing the anti-G garment with 30% PCM can keep lower skin temperature.
Figure 17 shows us the anti-G garment with PCM can prevent thermal stress better than that without PCM. Comprehensive index of thermal stress under garments with 30% PCM is the lowest and delayed obviously. The human body wearing the anti-G garment with 30% PCM is the most comfortable.
4. Conclusion
In this paper, a new 85-node thermal model for human body passive system is developed. And a heat and moisture transfer model for analyzing thermal responses of the pilot wearing bladder anti-G suit with PCM is presented. The model is validated by experimental data from literature. The influences of bladder and PCM content on thermal responses of pilot and anti-G suit are investigated by using the model. The conclusion shows that in the hot environment, evaporation heat loss from skin surface near the bladder is lower than that without bladder. Although the dry heat transfer to the skin near the bladder is lower than that without bladder, finally, the total heat loss from skin surface near the bladder is lower than that without bladder, which can increase thermal stress of the pilot. Adding PCM into the anti-G suit can decrease the index of the thermal stress. The more PCM added into the anti-G suit, the lower body temperature and the lower index of the pilot thermal stress are.
Acknowledgments
The authors wish to acknowledge the Research Founds of NUAA (NS2013007).
References
- Gagge, A.P.; Stolwijk, J.A.J.; Nishi, Y. An effective temperature scale based on a simple model of human psysiological refulatory response. ASHRAE Trans. 1971, 77(1), 247–262. [Google Scholar]
- Jones, B.W.; Ogawa, Y. Transient interaction between the human and the thermal environ-ment. ASHRAE Trans. 1992, 98, 189–195. [Google Scholar]
- Alireza, Z.; Mehdi, M. A new simplified model for evaluating non-uniform thermal sensation caused by wearing clothing. Build. Environ. 2010, 45, 776–783. [Google Scholar] [CrossRef] [Scilit]
- Stolwijk, J.A.J.; Hardy, J.D. Control of body temperature. In Handbook of physiology, section 9: reaction to environment agents; American Physiological Society: [M] Bethesda, MD, 1977; pp. 45–67. [Google Scholar]
- Karaki, W.; Ghaddar, N.; Ghali, K.; et al. Human thermal response with improved AVA modeling of the digits. Int. J. Therm. Sci. 2013, 67, 41–52. [Google Scholar] [CrossRef] [Scilit]
- Qiu, Y.F.; Wu, W.; Yuan, X.G.; Xiao, B.L.; Ren, Z.S. Human thermoregulation model for estamating thermal protection performance of anti-G garments. Chin. J. Mech. Eng. 2012, 25, 47–54. [Google Scholar] [CrossRef] [Scilit]
- Li, Y.; Holcombe, B.V. A two-stage sorption model of the coupled diffusion of moisture and heat in wool fabrics. Text. Res. J. 1992, 62, 211–217. [Google Scholar] [CrossRef] [Scilit]
- Li, Y.; Luo, Z.X. An improved mathematical simulation of the coupled diffusion of moisture and heat in wool fabric. Text. Res. J. 1999, 69, 760–768. [Google Scholar] [CrossRef] [Scilit]
- Li, Y.; Zhu, Q.Y. A model of coupled liquid moisture and heat transfer in porous textiles with consideration of gravity. Numer. Heat Transf. Part A 2003, 43, 510–523. [Google Scholar] [CrossRef] [Scilit]
- Wang, Z.; Li, Y.; Zhu, Q.Y. Radiation and conduction heat transfer coupled with liquid water transfer, moisture sorption and condensation in porous polymer materials. J. Appl. Polym. Sci. 2003, 89, 2780–2790. [Google Scholar] [CrossRef] [Scilit]
- Li, F.Z.; Li, Y.; Liu, Y.X.; Luo, Z.X. Numerical simulation of coupled heat and mass transfer in hygro- scopic porous materials considering the influence of atmospheric pressure. Numer. Heat Transf. Part B 2004, 45, 249–262. [Google Scholar] [CrossRef] [Scilit]
- Li, F.Z.; Li, Y. Effect of clothing material on thermal responses of the human body. Model. Simul. Mater. Sci. Eng. 2005, 13, 809–827. [Google Scholar] [CrossRef] [Scilit]
- Salloum, M.; Ghaddar, N.; Ghali, K. A new transient bioheat model of the human body and its integration to clothing models. Int. J. Therm. Sci. 2007, 46, 371–384. [Google Scholar] [CrossRef] [Scilit]
- Li, F.Z.; Li, Y. A computational analysis for effects of fiber hygroscopicity on heat and moisture transfer in textiles with PCM microcapsules. Model. Simul. Mater. Sci. Eng. 2007, 15, 223–235. [Google Scholar] [CrossRef] [Scilit]
- Yigit, A. The computer-based human thermal model. Int. Comm. Heat Mass Transf. 1998, 25, 969–977. [Google Scholar] [CrossRef] [Scilit]

© 2014 Textile Bioengineering and Informatics Society. This article is an open access article distributed under the terms and conditions of the Creative Commons Attribution (CC BY) license (https://creativecommons.org/licenses/by/4.0/).