


Abstract
The purpose of this study was to measure temperatures of cotton and polyester woven fabrics in wetting and drying process by thermocouples placed on them. It also discussed temperature distribution caused by diffusion and evaporation at different relative humidity. The measurement points of thermocouples were located at two concentric circles with radius of 3 cm and 6 cm. The temperatures were measured by covering the same fabric when a droplet of water dropped on the center of circle at 20%RH, 65%RH and 80%RH environmental moistures, respectively. The results showed that because of diffusion determined by distance, it was different of temperature changes of every point. As the center of circle, at different humidity, temperatures when reached dynamic heat balance were different. The drying process of cotton showed consistency with temperature recovery. At 20%RH, it is the shortest for temperature returning to environmental temperature because of diffusion speed caused by steam content of environment. It can be applied to performance assessment for fabrics that liquid water absorbing function is required. It also can be used for evaluation of discomfort of wet fabrics by temperature decline with the wetting.
1. Introduction
As a basic function of clothing, it is important to restrict heat loss from the body, especially in cold, rainy and some other climates. As the fabrics used in making apparel differ greatly in their moisture sorption and thermal properties, it is important to take these characteristics into account when choosing clothing for particular applications.
In practical terms, heat and moisture transfer properties of fabrics are especially significant, as they play an important role in determining the thermal comfort associated with wearing the materials. The thermal comfort of the wearer is dependent on the clothing relationship with the wearer, its activity and the environment, since garment can be an obstacle to the heat and moisture transfers [1].
Research into heat and moisture vapor transfer of textiles focuses on the equilibrium and transient conditions of moist fabrics during skin contact or fabric, and the influencing parameters, such as thickness and porosity of fabric [2,3,4,5,6,7,8,9,10,11,12,13,14,15]. Li et al. investigated on the fiber moisture sorption behavior in the sensory perception of dampness in fabric experimentally and mechanistically [2]. Plante also carried out the dampness perception trials on the influence of fiber type, fabric moisture content, and ambient conditions on the subjective assessment of dampness in fabrics [3]. Alber-Wallerstrom [16] researched on the efficiency of sweat evaporation by a continuous weighing technique. Examining on the relationship between the thickness and thermal resistance of textile fabrics, a significant reduction in sweating evaporation efficiency was found in subjects exercising in moderate, dry and humid heat. Heat transfers of underwear at low activity are mainly governed by conductive, convective and radiative heat transfer mechanisms [17]. At high activity levels or in warm conditions, evaporation becomes predominant [18]. Therefore, at high activity levels, the thermal sensation is mainly influenced by sweating rather than by skin surface temperature, since the evaporative cooling effect by the sweating allows maintaining skin temperature at a favorable level [19]. Moreover, A new test method had been developed based on the contact electrical resistance of fabric [20,21]. However, because of the diffusion characteristics of liquid water, when rain or sweat impinges on a fabric there will be temperature differences over the surface of the material, and these will have an effect on the wearer’s level of comfort. To properly understand the effects of moisture it is therefore necessary to investigate in detail the conditions that occur when a droplet of liquid comes into contact with a particular fabric.
Lyons and Vollers [22] analysed the drying process of textile materials and identified three distinct stages. The first is an initial warm-up period that may or may not be significant in the overall process. The second stage is the constant drying rate period, in which the rate of vaporization balances the rate of heat transfer and the temperature of the saturated surface remains constant. The third stage is the falling rate period, during which moisture flow to the surface is insufficient to maintain saturation and the plane of evaporation moves into the fabric. Fibres in the fabric then begin to desorb moisture until equilibrium is reached between the fabric and the surrounding environment. In order to analyze the temperature of fabric during the drying process, we try to show the relationship between the temperature and water content during the wetting and drying process.
On the basis of Seebeck Effect, Stefan Ziegler and Michal Frydrysiak [23] used conductive textile products to manufacture thermocouples and studied on the relationship between temperature differences and electromotive force differences. This work, however, was limited in its scope because it relied on thermocouples made of metal fibers and fabrics that were not suitable for wearable garments
As noted above, T-type thermocouples have been used on fabrics to allow for temperature measurements based on the theory of the Seebeck Effect. In order to discuss the water diffusion on fabric, and investigate temperature change of wetted fabric, a multipoint-thermocouple fabric had been fabricated. It could be used for on-line multipoint temperature measurement of the fabric on various conditions.
In this study, samples of intact fabric were laid over thermocouple-equipped specimens of the same material, following which the top fabric layer was wetted by the application of a droplet of water. The temperatures during wetting and drying process are measured between two fabrics by thermocouple sensors on fabric, and the relationship between temperature distribution and diffusion of water had been discussed.
2. Experimental
2.1. Manufacture of Thermocouple-equipped Fabric
Cotton and polyester woven fabrics were used to manufacture thermocouple-equipped fabrics, with basic specifications shown in Table 1.
Table 1.
Specification of fabrics.
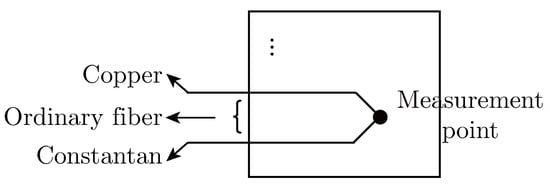
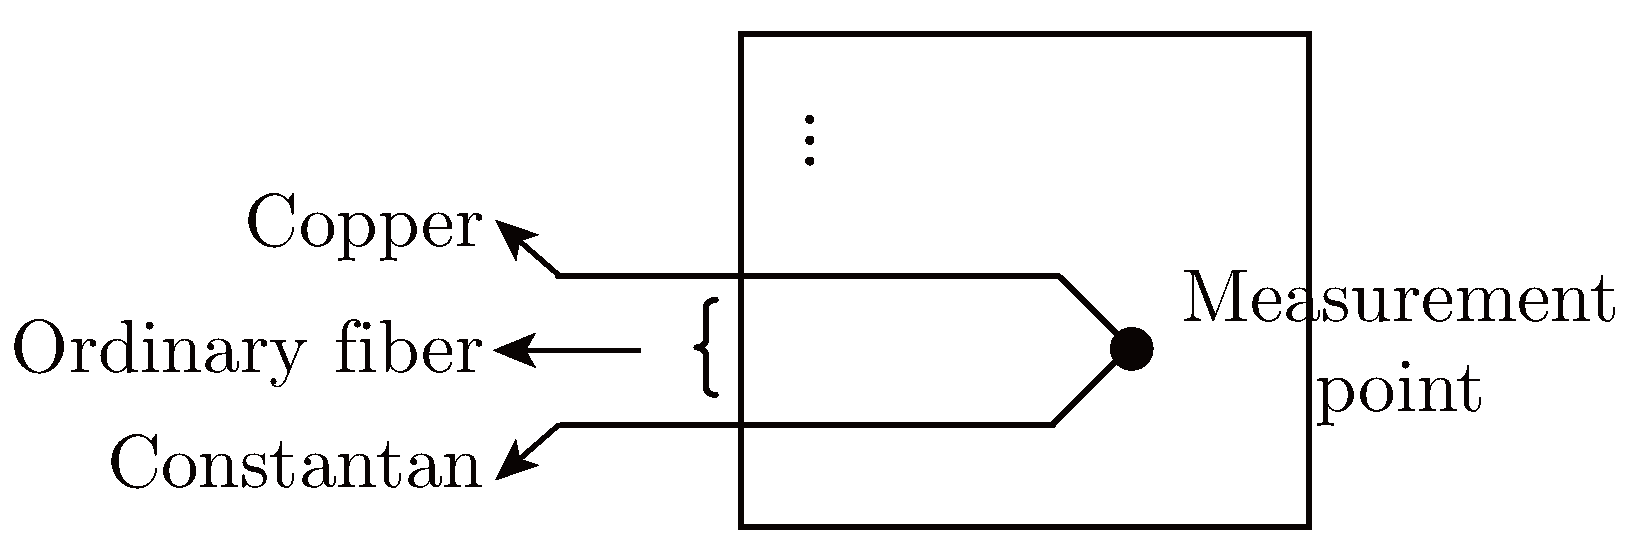
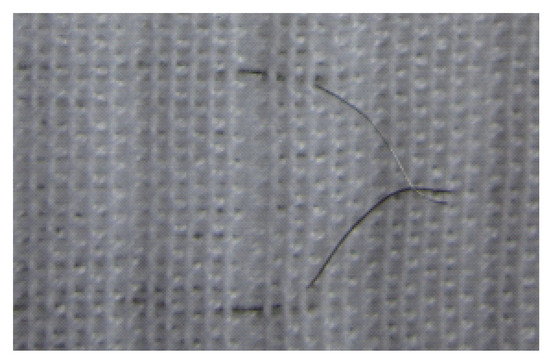
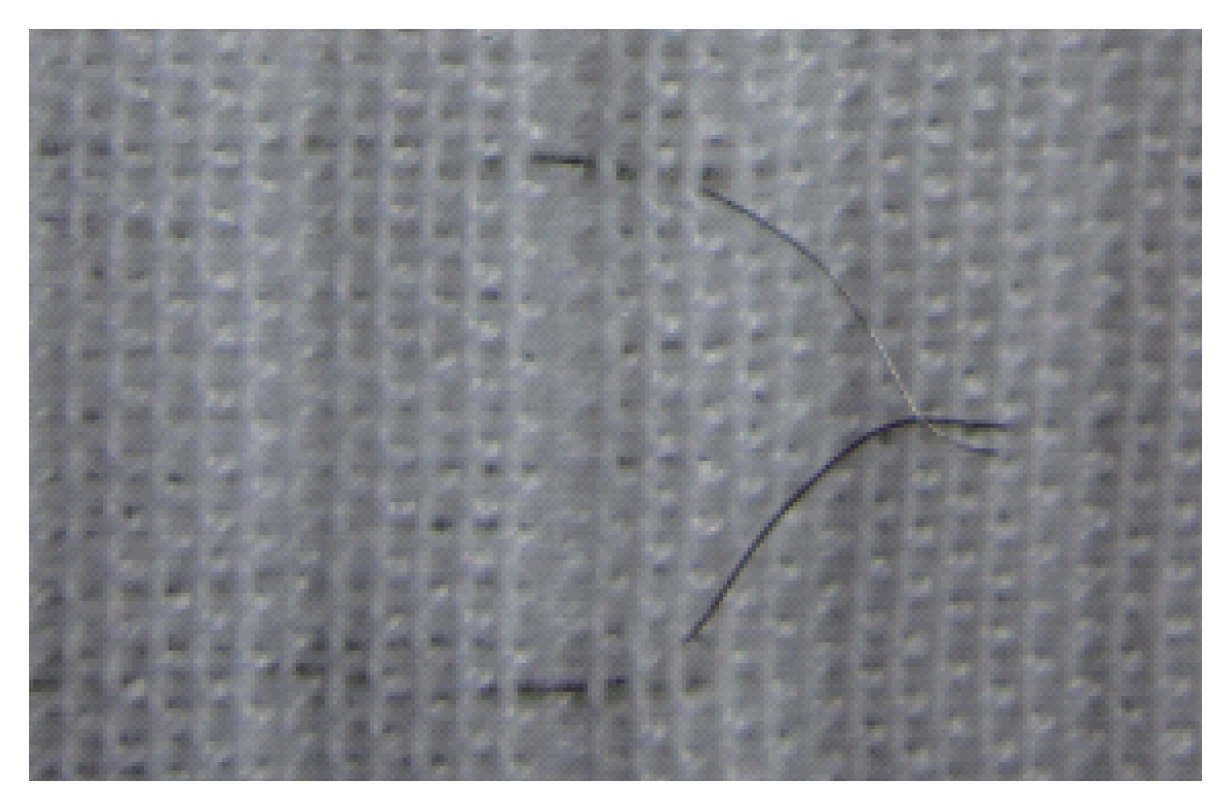
T-type thermocouples were employed for temperature sensors, using φ0.1 mm copper and constantan as element wires. The wires were first sewn into the fabric, after which the ends of each of the two element wires were welded together to form a measurement point located on the surface of fabric. This point can measure room temperature, and inner temperature between fabrics by adjusting the spatial location of measurement point. The other hand of element wires is free point for connecting with device for temperature measurement. A schematic and a photograph of the thermocouple arrangement are provided in Figure 1 and Figure 2.
Figure 1.
Basic structure of fabric thermocouples.
Figure 2.
Image of an actual fabric thermocouple.
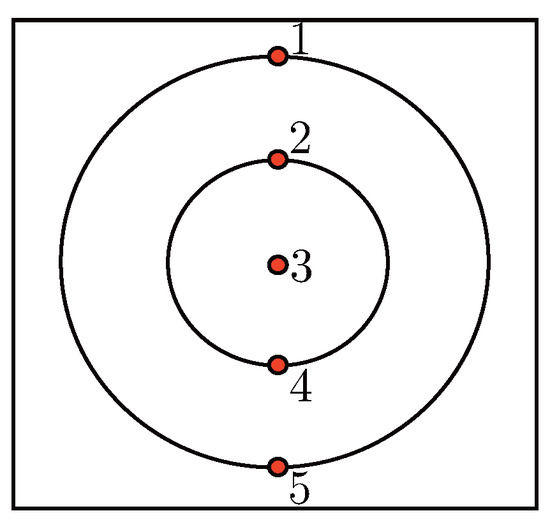
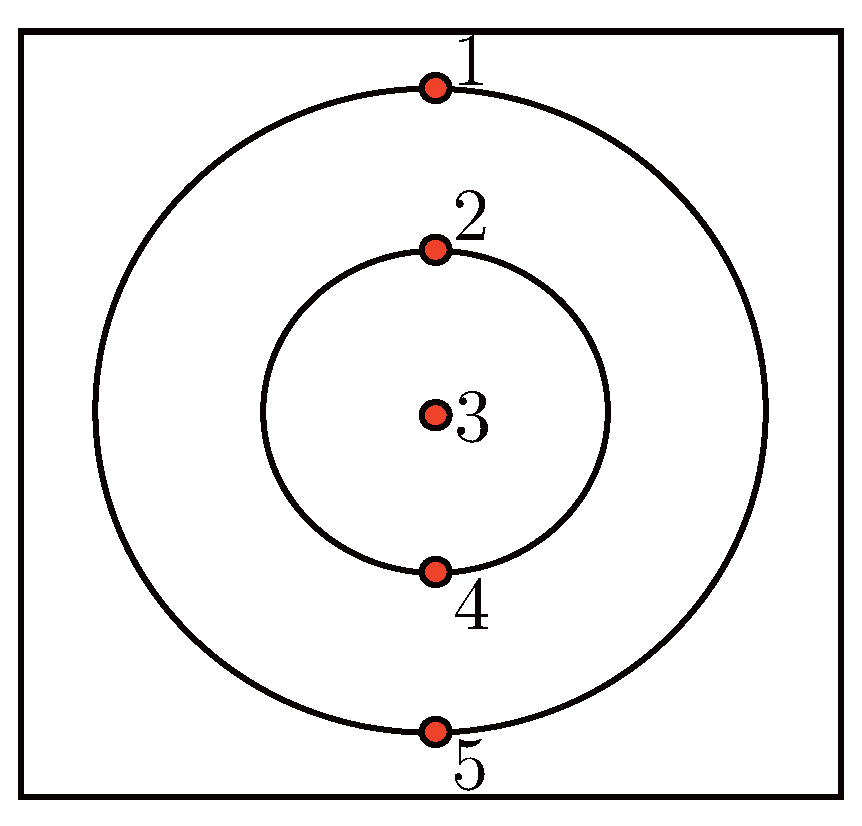
In order to measure temperature variations of fabric during wetting and drying process, it has brought up an idea of multipoint-thermocouple-equipped fabric, in which the thermocouple measurement points may be arranged to form various geometric shapes, such as circle, square. In this study, a pattern was used consisting of two concentric circles with radii of 3 and 6 cm, with the measurement points located along the warp yarns as shown in Figure 3. Alternatively, the measurement points can be located along the weft direction [24], with thermocouple element wires employed as weft yarns.
Figure 3.
Multipoint-thermocouple fabric.
2.2. Temperature Distribution Measurements
2.2.1. Validation of Fabric Thermocouples
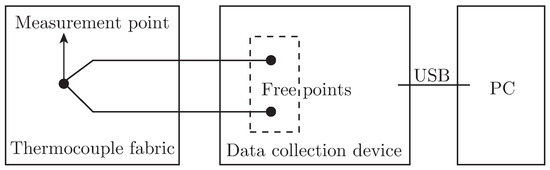
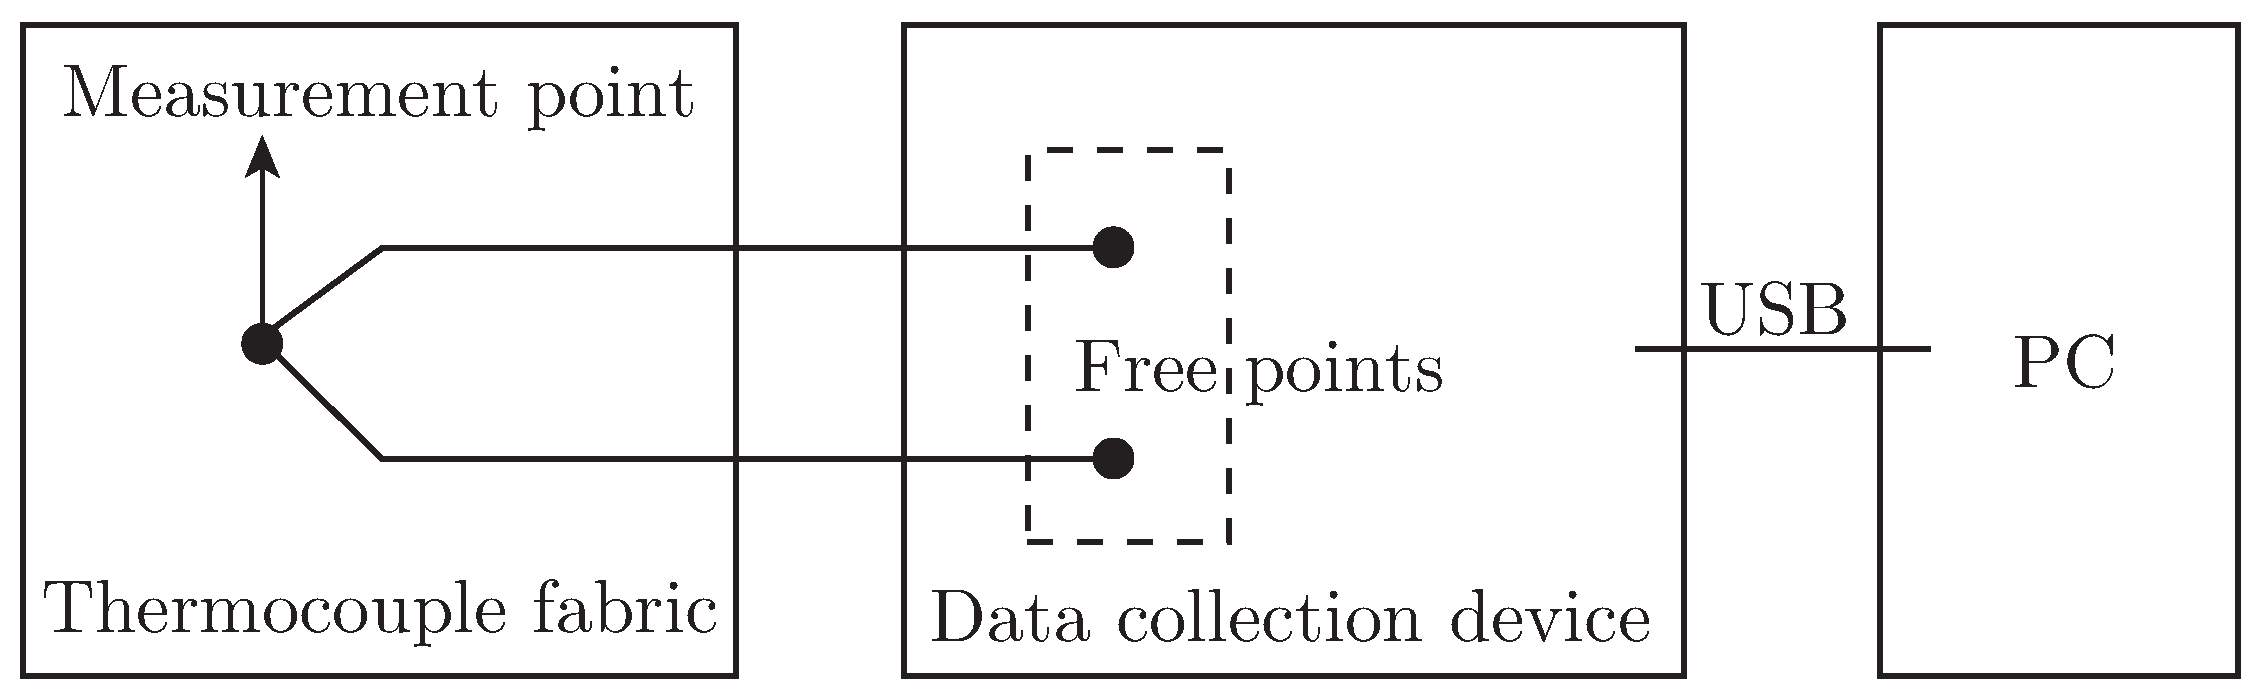
After the measurement points had been welded and the free thermocouple leads connected to a data collection device (KE 3000, Chino Co.), the system was tested by using the thermocouple-equipped fabrics to measure room temperature. These measurements were recorded at constant ambient temperature and humidity, with the thermocouple measurement points arranged such that they were not contacting the fabric. A diagram of the test configuration is shown in Figure 4. Temperature data could be collected and recorded in a sampling rate of 0.2 s−1, or 12 data points per minute automatically. In the meanwhile, in order to verify the validity of thermocouple in fabric, two commercial thermocouples were placed on the same fabric to measure room temperature and the measured temperatures were recorded by PC. The commercial thermocouple is a kind of T-type sensor (Chino Co.), made with 0.32 diameter copper and constantan element wires and were factory calibrated, such that they could be used as standard sensors for comparison purposes. During the experiment work, the 12 data points acquired over each minute were averaged to give a single temperature value, TAV E.
where, TAV En is the average temperature at n minute, m is 12.
Figure 4.
Schematic of temperature testing instrumentation.
Each temperature measurement trial was replicated three times.
2.2.2. Measurement of Temperature Distributions of Wetted Fabrics
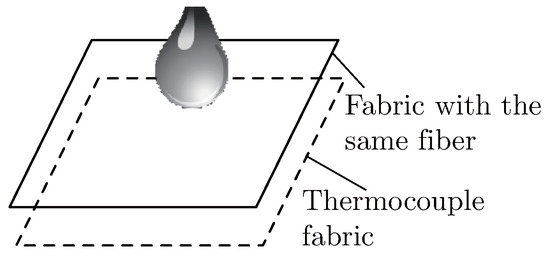
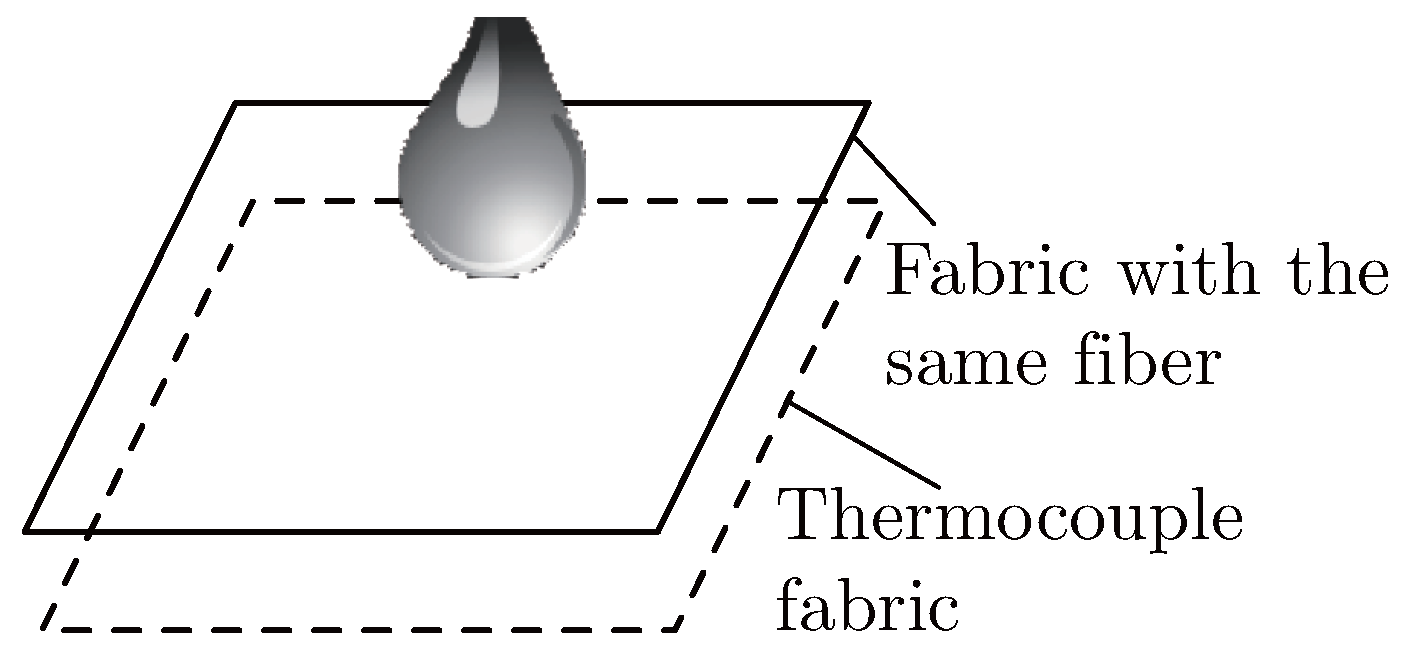
It measured temperatures by the thermocouple fabric during the wetting and drying process when water was dropped, as shown in Figure 5.
Figure 5.
Diagram of the spot test.
To investigate the liquid transmission characteristics of fabrics, and the accompanying temperature changes, the spot test [25] was employed. In this test, a sample of the thermocouple-equipped fabric (fabric 1), a sample of the same fabric without thermocouples (fabric 2) and a quantity of distilled water were all allowed to equilibrate to the ambient temperature of 20 ± 1°C for at least 24 hours. After equilibration, fabric 2 was placed on fabric 1 with the fabric directions of the two fabrics aligned. Temperature measurements from the thermocouples in fabric 1 were collected for 1 minute, after which a single drop of the distilled water (1 ml) was applied by pipette, from a height of approximately 6 mm, onto the center of the concentric circles defined by the thermocouple points (measurement point 3 in Figure 3). During these tests, the environmental parameters consisted of an ambient temperature of 20 ± 1°C, relative humidity levels of 20 ± 2, 65 ± 2 or 80 ± 2%, and an air velocity of 0 to 0.2 m/s. Table 2 shows the testing conditions applied in this experiment. Three trials were performed at each combination of test conditions.
Table 2.
Testing conditions of thermocouple-equipped fabric.
To further investigate the drying process of the two fabrics, a mass loss experiment was also performed. At an ambient temperature of 20°C, 65%RH, using the same placement protocol as with the spot test, the two fabrics were placed on the balance, and the balance readout was set to zero. A 1ml drop of distilled water was then delivered from a height of approximately 6 mm onto the center of concentric circles. The resulting mass readings were recorded as the fabric dried. Three trials were carried out.
3. Results and Discussions
3.1. Feasibility of Thermocouples on Fabric
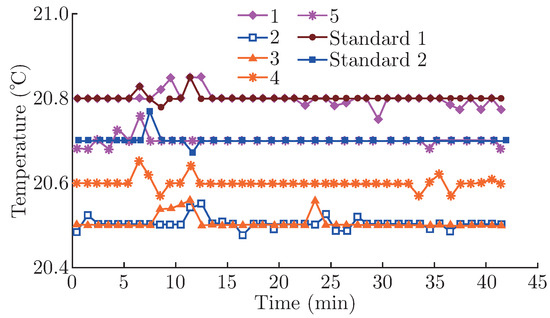
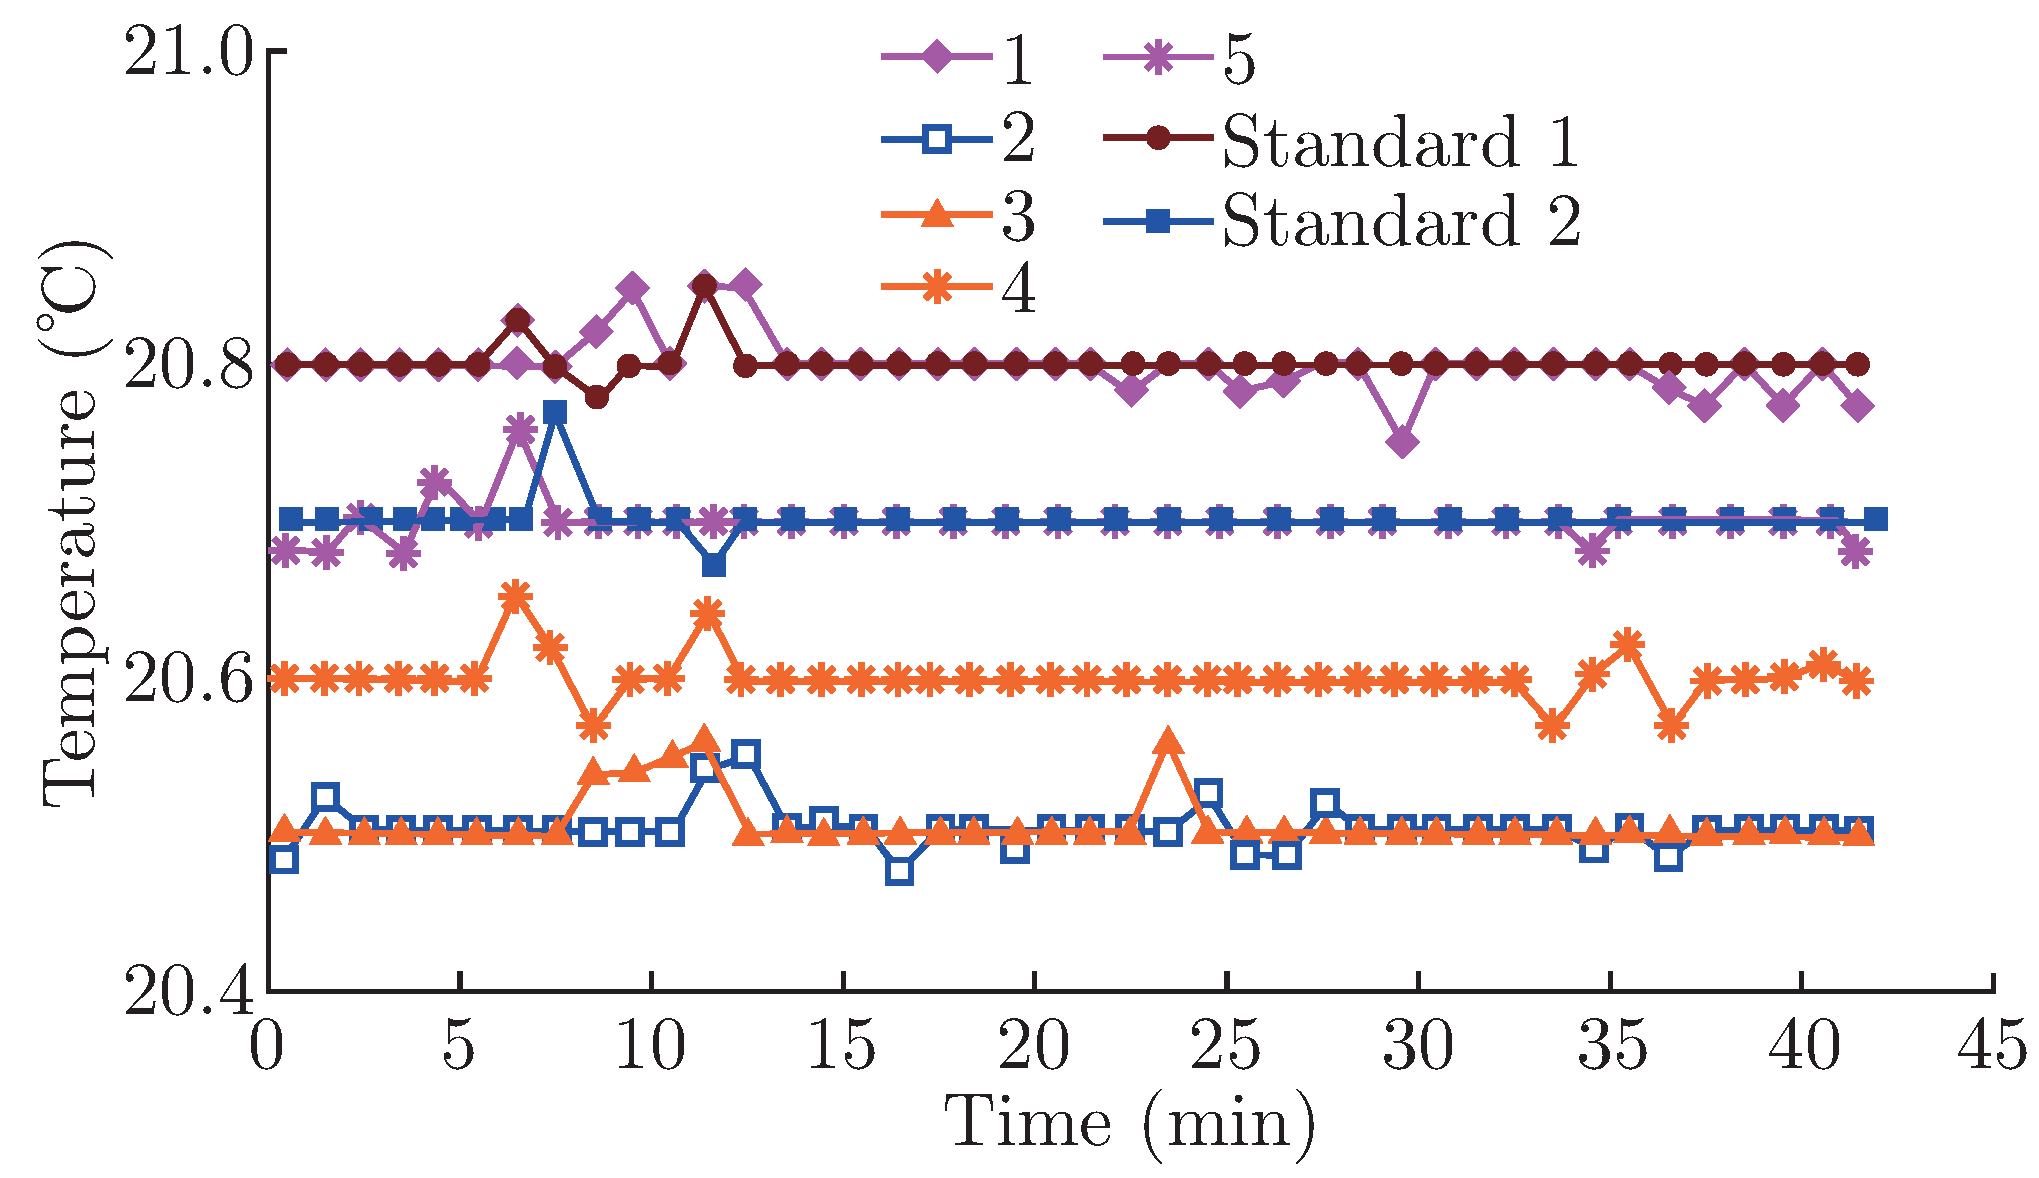
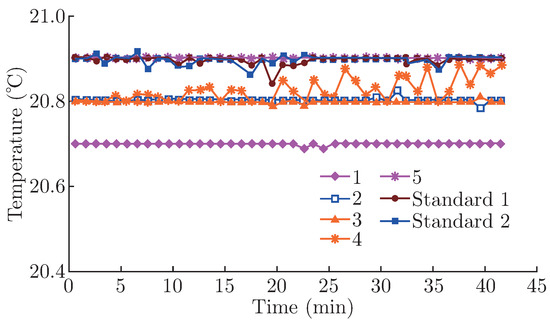
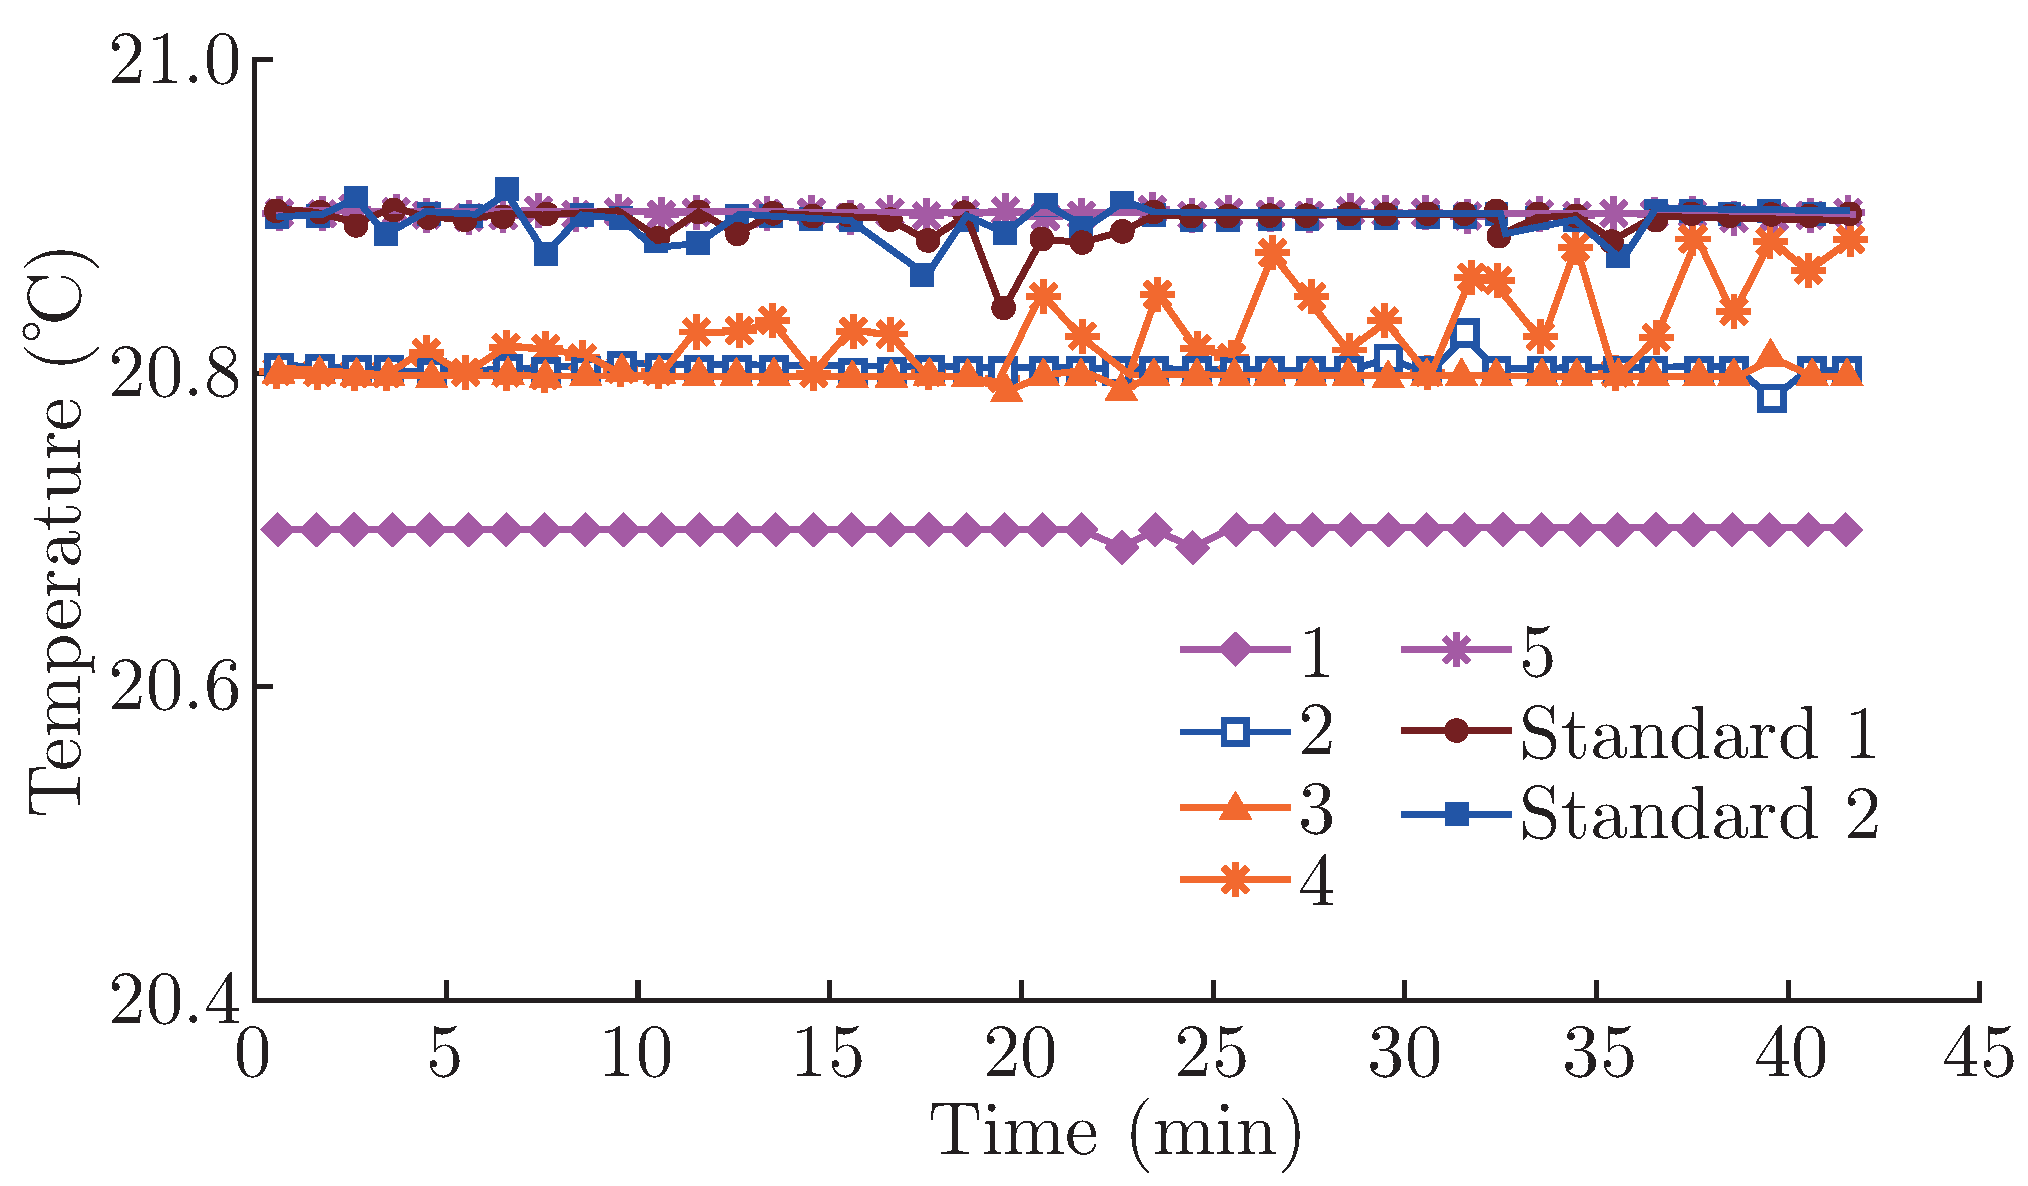
Figure 6 and Figure 7 present representative results for the ambient temperature measurements tested by thermocouple-equipped cotton and polyester fabrics, respectively. Traces 1 through 5 were recorded from the thermocouples placed into the fabrics, corresponding to the measurement points in Figure 3, while standards 1 and 2 refer to the two standard thermocouples described in Section 2.2.1. During these validation trials, the temperature variations between the fabric thermocouple measurement points and the standard thermocouples were less than 0.2°C, which is within a reasonable experimental error and so indicates that the data from the fabric thermocouples can be considered accurate.
Figure 6.
Ambient temperature measurements by cotton.
Figure 7.
Ambient temperature measurements by polyester.
Over the forty minutes of data acquisition, the measured temperatures remained reasonably steady and the average temperatures of each point on cotton and polyester fabric are about 20.6±0.2°C and 20.8±0.1°C, while the standard thermocouples recorded temperatures of approximately 20.8 and 20.9°C. The apparent difference in temperature between the two fabrics is mainly due to ambient temperature fluctuations. For each sensor, the temperature difference during the forty minutes is less than 0.1°C, satisfying the needs of tolerance of thermocouple in Japanese Industrial Standard (JIS) [26]. Moreover, the temperature differences of the thermocouples at the same moment are almost less than 0.5°C, meeting the needs of tolerance of thermocouple in JIS. Therefore, we concluded that these multipoint-thermocouple-equipped fabrics can be served for thermometry of skin, garments and microclimates and other matrices.
3.2. Temperature Changes in Wetted Fabrics
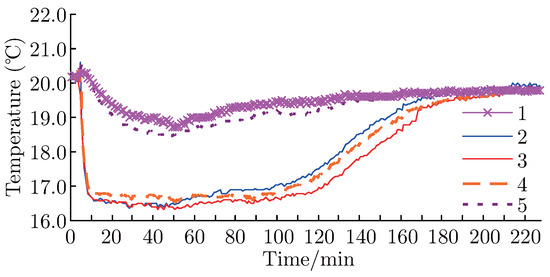
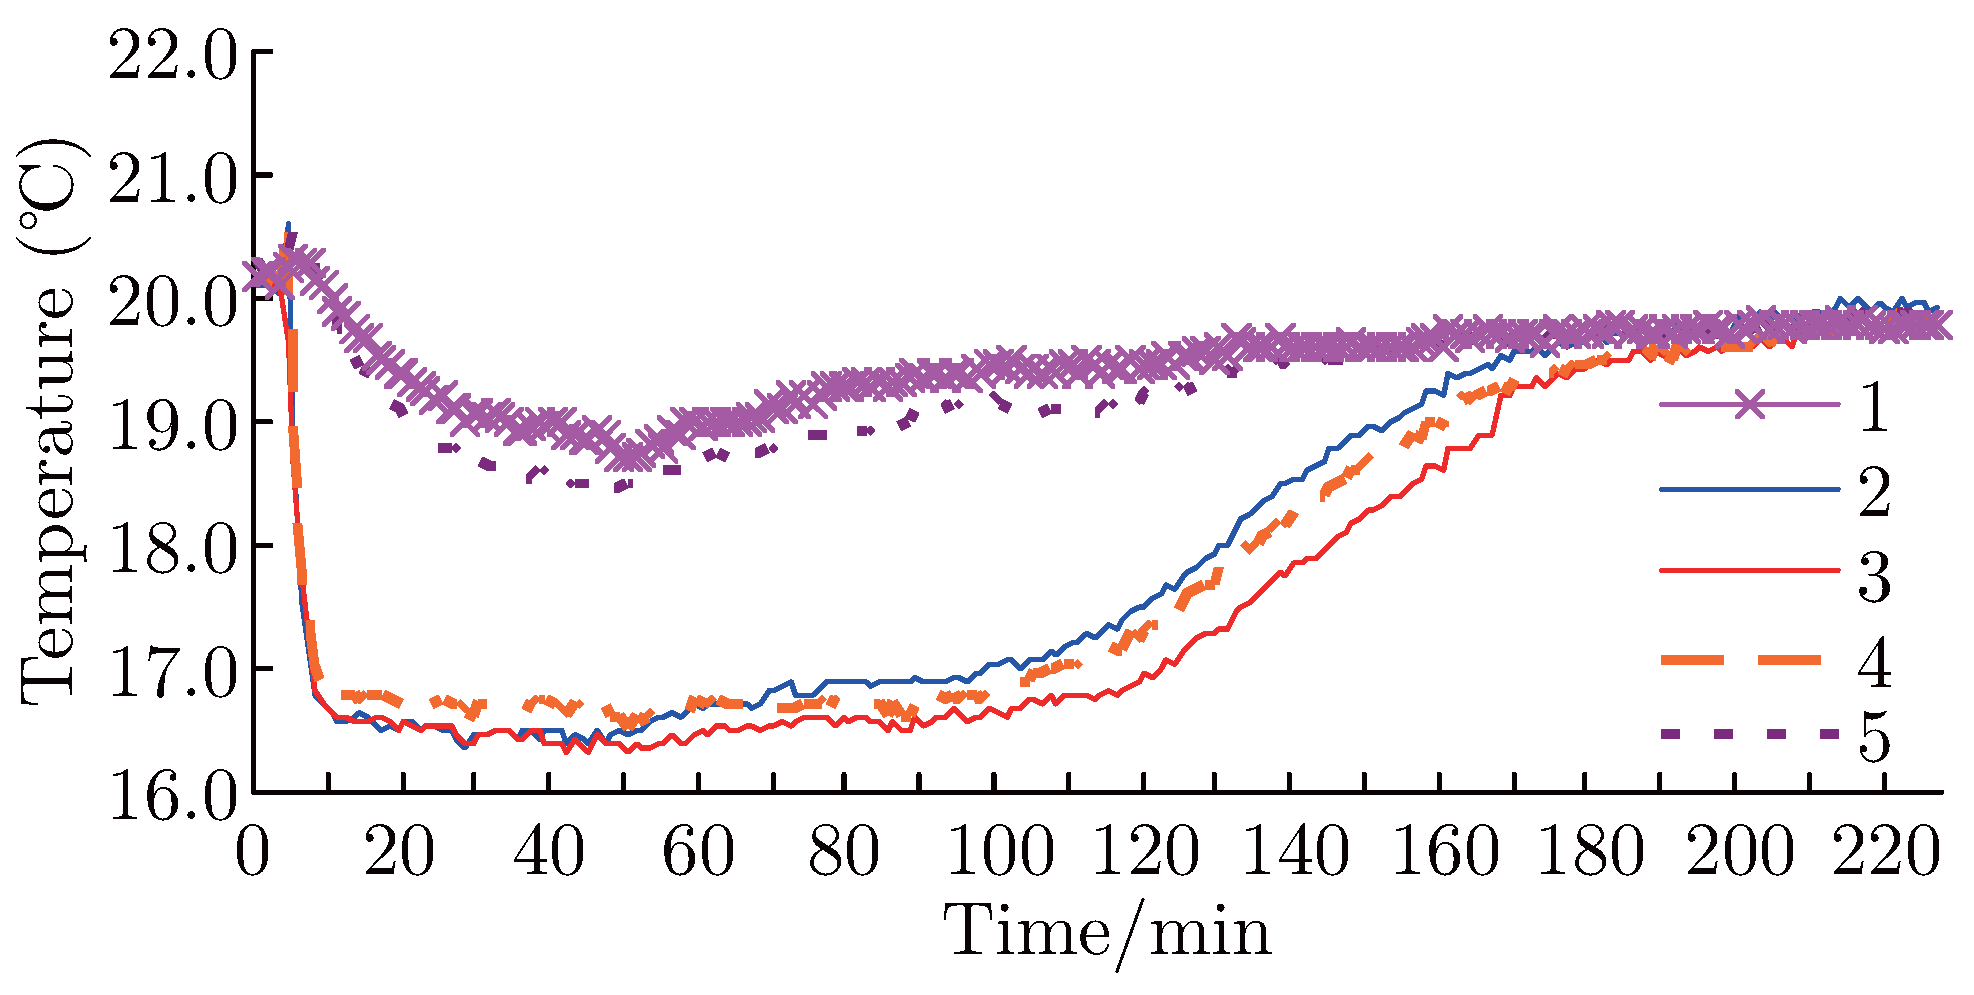
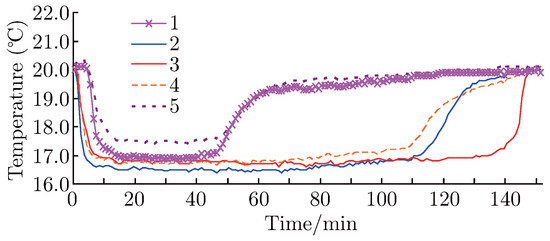
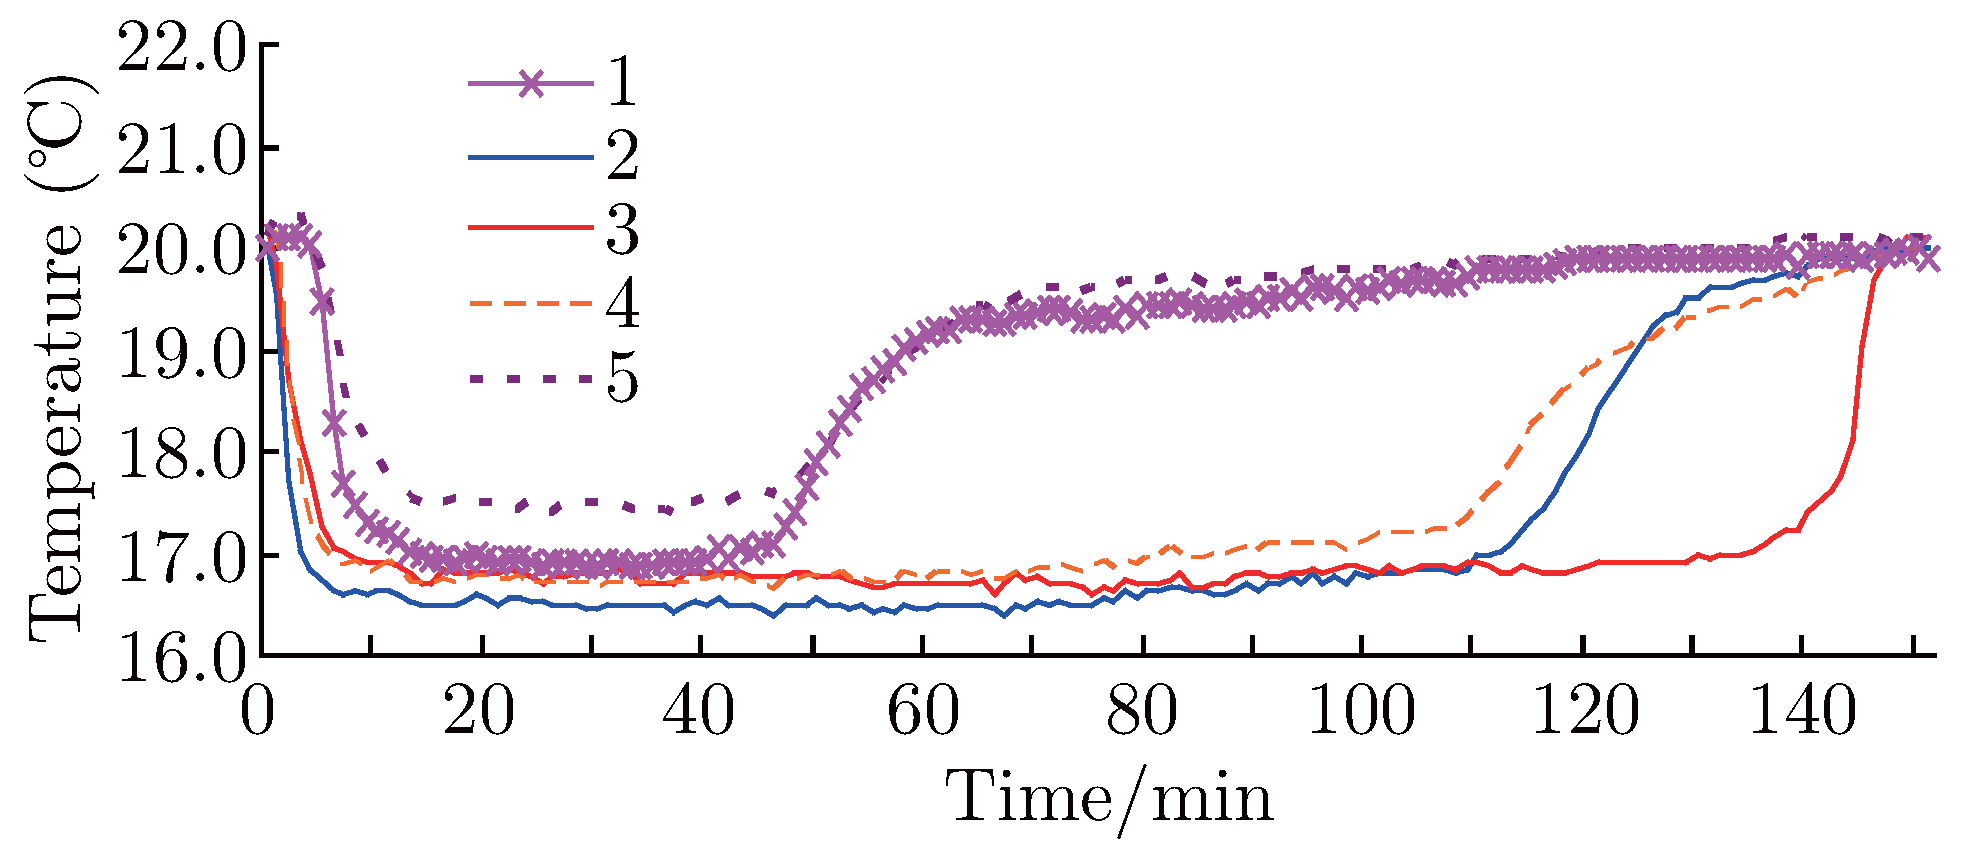
Figure 8 and Figure 9 show the representative temperature changes in cotton and polyester fabric in the wetting and drying process at 20°C, 65% RH respectively. The horizontal axis represents time, and the vertical axis is the measured temperature.
Figure 8.
Temperature of wetted cotton fabric at 65% RH.
Figure 9.
Temperature of wetted polyester fabric at 65% RH.
In the case of cotton fabric, the temperature at the point where the water is dropped immediately falls to approximately 16.5°C, a difference of about 4°C. The decrease at circumference (point 1 and 5) is just 1.5°C. On the polyester fabric, the temperature at the dropped point is almost the same with cotton fabric, although the decrease at circumference reaches to 3°C. Considering the areas over which the temperature declined, it can be deduced that at points 1 and 5 the water content of the cotton fabrics is less than that of the polyester. With the same volume of water, as hydroscopicity fiber, cotton fabric absorbs more water than the same mass of polyester fabric. Therefore, the diffusion area of polyester is wider than cotton fabric.
The points at different distances from the center of the circle show different temperature distributions. From 5 to 20 minutes, after the application of the drop, the water moves outwards from the center of circle to the outer measurement points. During this process, the water transfer speeds of each point are different; the transfer to points 1 and 5 are the slowest. In the polyester fabric, it takes about 5 minutes for points 1 and 5 to register a temperature decrease, while points 2 and 4 only take about 1 minute. Considering the two figures, it is evident that there is a slight difference between the temperatures at the equidistant points 1 and 5, which is likely because even on the same fabric sample, the two points are not exactly on the same level, and this has an effect on the liquid moisture transfer.
Differences between temperature changes of the cotton and polyester fabrics are caused by the differences of diffusion rate of the water to the thickness direction, in-plane direction and the water absorbency of two materials.
3.2.1. Temperature Changes of Wetted Fabrics at the Dropped Point
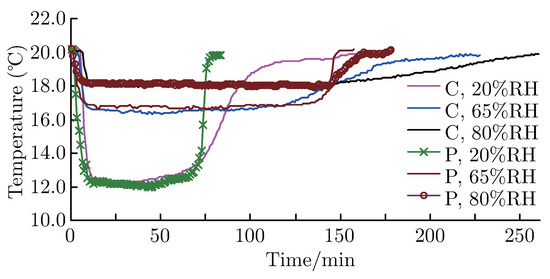
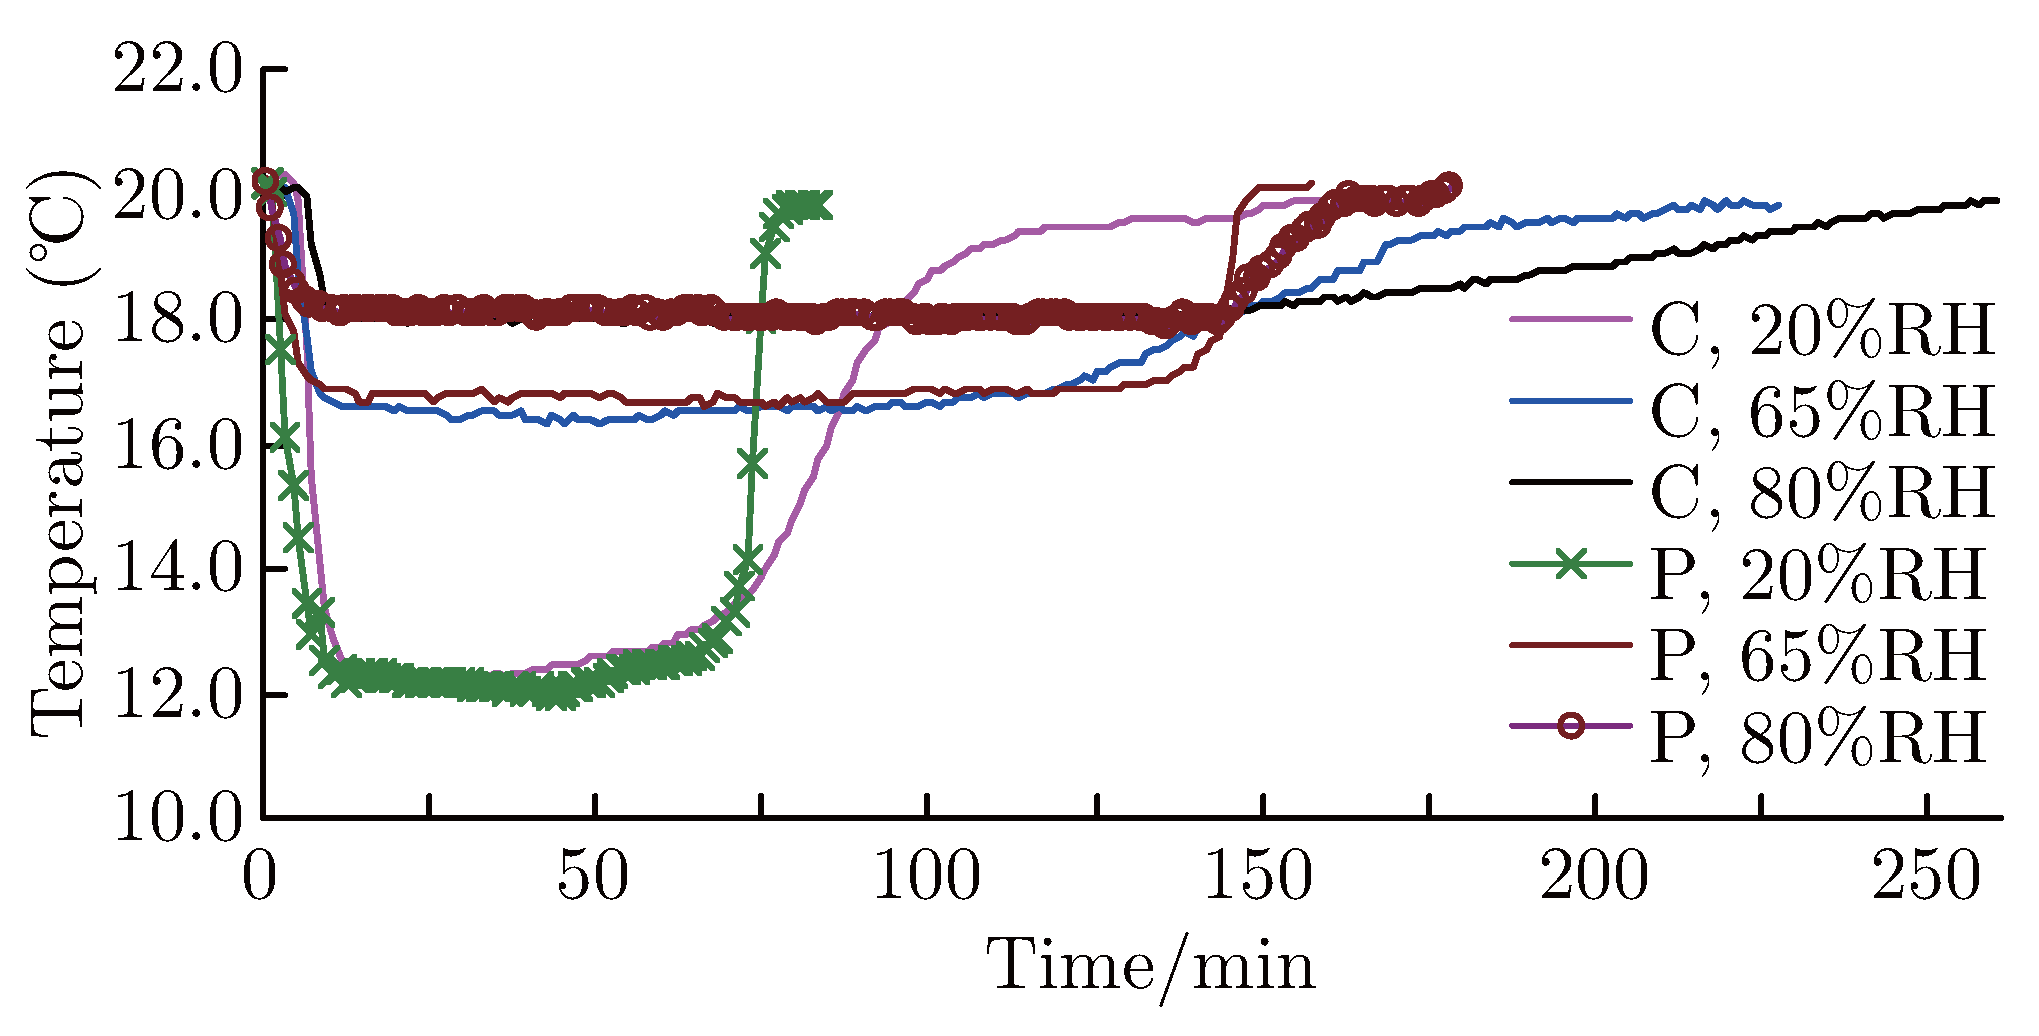
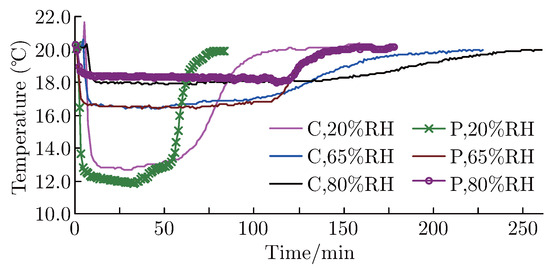
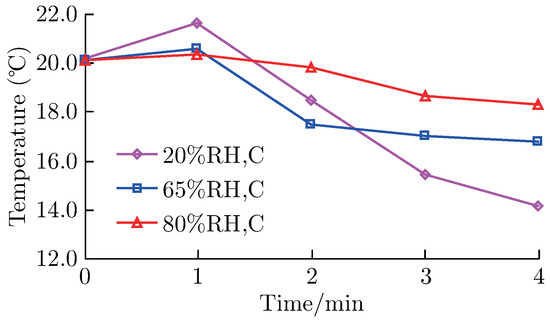
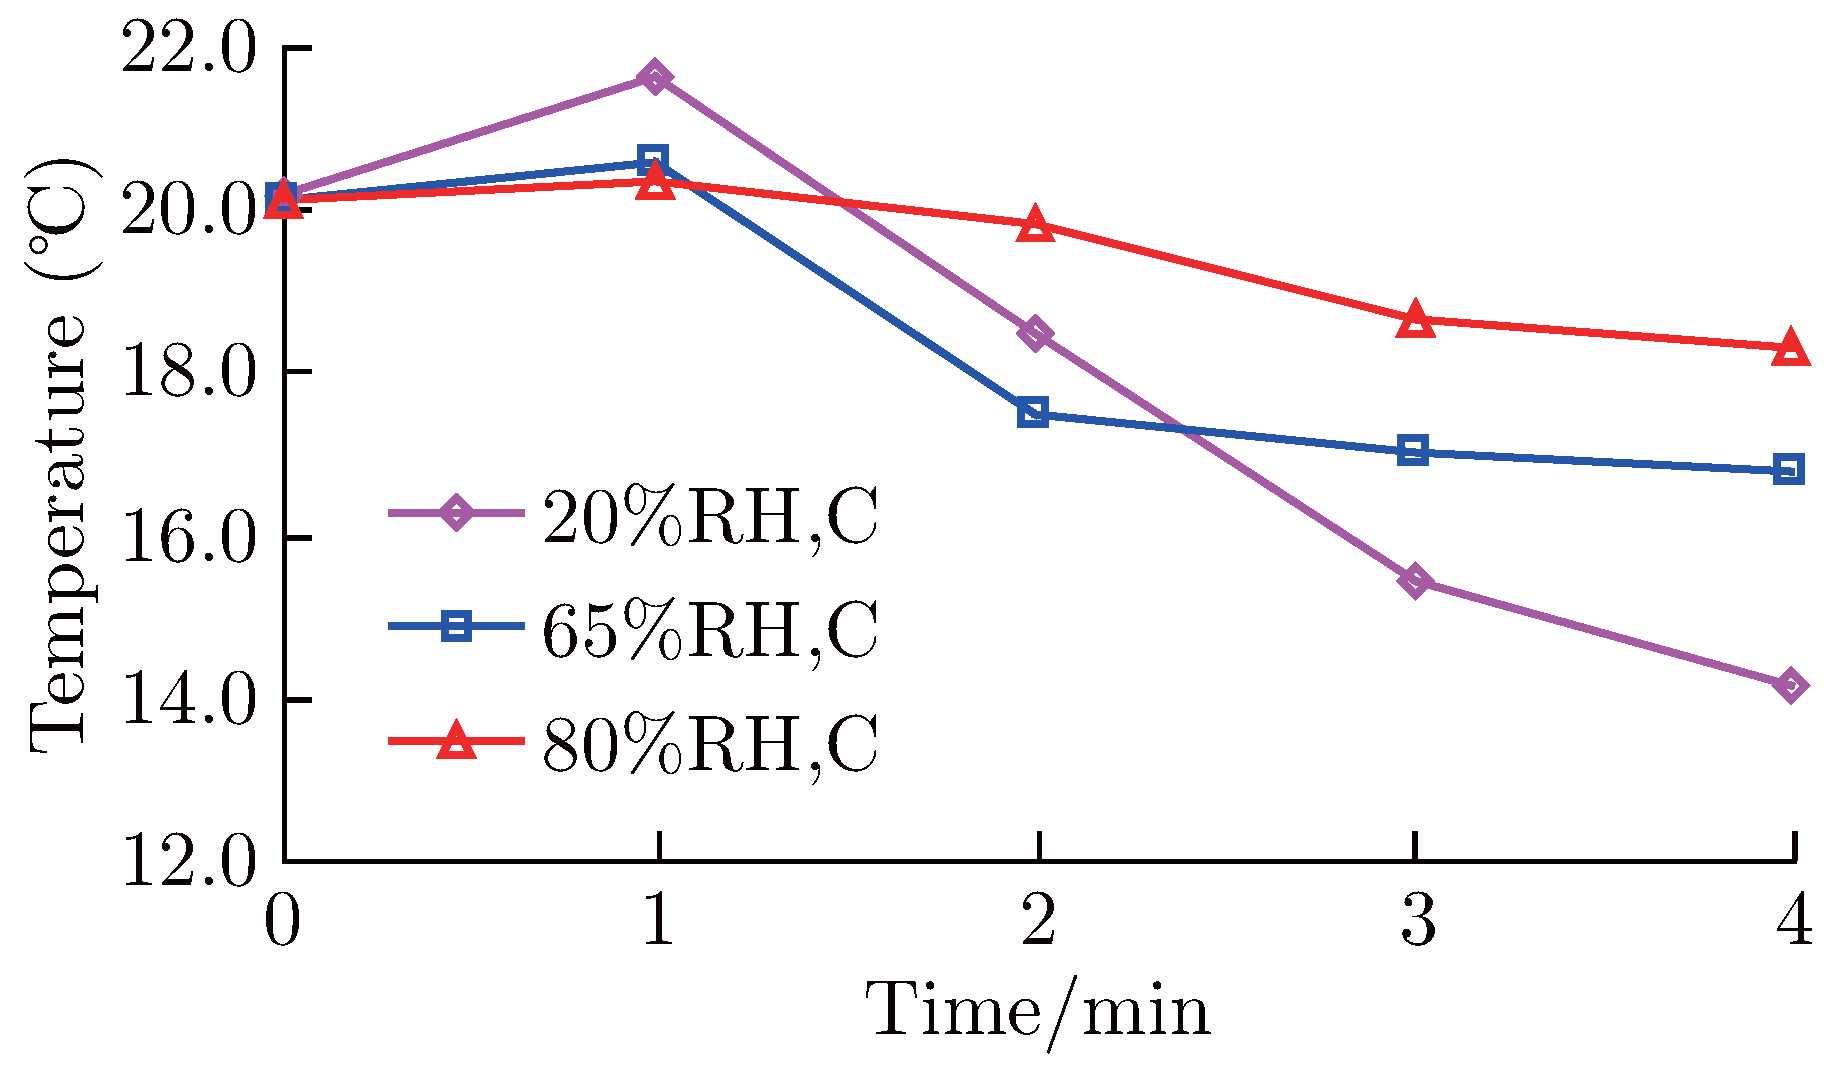
Figure 10 shows the temperature changes at the dropped point of wetted polyester and cotton fabric at different humidity levels.
Figure 10.
Temperature changes on the dropped point.
During the moisture release of the two fabrics, the changes of surface temperature are primarily due to water evaporation, which lowers the surface temperature below ambient.
From Figure 10, it can be seen that the trend of surface temperature of dropped point is nearly the following stages: Immediately after water dropping, the temperatures increase slightly, then abruptly decreases, holds steady for a long time, and at last increase back to environmental temperature.
Initially, because the fabric absorbs water, and releases absorption heat simultaneously, there is slight increase in temperature. Subsequently, the local area at which the thermocouple is situated becomes essentially saturated with water vapor, and there is a gradient between this area and the surrounding ambient atmosphere that is at a much lower relative humidity. As the water evaporates and water vapor from the fabric surface diffuses into the surrounding air, the temperature at the measurement point declines.
However, the temperature of fabric will not decrease unlimitedly, when the dynamic heat balance is achieved, which means the heat loss by evaporation of water on fabric equals to the heat gain by absorption from surroundings and the radiation and convection, the temperature of fabric will stabilize. The measured temperature can be considered the equivalent of the wet bulb temperature.
In the last stage, with the evaporation of liquid moisture, the moisture content of the dropped point decreases gradually, when the heat released by evaporation of moisture of fabric is less than the energy cumulated by fabric from absorption of vapor around the micro-climate and radiation, convection from surroundings, the surface temperature of fabric increases and reaches the equilibrium at this condition, which is the same with environmental temperature. The stage can be seemed as drying process of fabric.
In this experiment, the lowest temperature recorded during the dynamic heat balance were approximately 12.5, 16.7 and 18.0°C at 20, 65 and 80% RH respectively, which are nearly the same as the wet bulb temperatures, which are 9.3, 15.8 and 17.7°C respectively, especially at 80% RH. There is a slight difference in the lowest temperatures recorded between polyester and cotton, and this is likely because of differences in the rates of evaporation caused by the porosity of the fabrics, their yarn content and other factors. The relative humidity of the micro-climate of dropped point of fabric can be calculated by:
where R is the relative humidity (%), e is the water vapor pressure, es is the saturated water vapor pressure. Both e and es can be calculated by the following [27,28]:
where t is dry bulb temperature, 20°C; tw is wet bulb temperature; P is the atmospheric pressure (101325Pa); A is 0.000662K−1; T0 is 273.16K.
e = es(tw) − AP(t − tw)
From the equations (2) to (4), the relative humidity of the micro-climate at the adjacent dropped point of the three conditions of cotton and polyester fabric is listed in Table 3. At 20%RH, the relative humidity of polyester is 37.03%, which is about 20% higher than the humidity of environment. At 65%RH, it is about 6% higher; and at 80%, it is only about 2% greater. This is because, at higher humidity, the water vapor content in the air is so high that slows the evaporation of water on fabric surface, which leads to lower heat absorbed from fabric. As a result, the time required for the same fabric returning to room temperature is different at different humidity levels: with longer time periods required at higher ambient humidity levels.
Table 3.
The relative humidity of micro-climate at the dropped point.
Figure 10 also shows that the drying processes of the two fabrics are different, as can be deduced from the differing slopes of the temperature plots. At 65% RH, it takes about 10 minutes for polyester to return to room temperature, whereas the cotton fabric required approximately 1.5 hours. This is primarily because difference in the fabrics result in dissimilar water transfer mechanisms. There are three ways of water transfer for hydroscopic fabric: absorb into the fiber, retain in pores and as free water between fibers and yarns [29]. As hydroscopic fiber, cotton absorbs water into the fiber as well as stores it in pores and as free water. However, as non-absorbent fiber, polyester fibers do not absorb water. During the drying process, it needs a little force for the free water and water retained in pores to release to the surroundings, but water absorbed by cotton fibers is difficult to release.
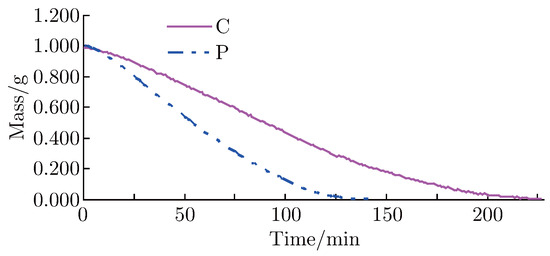
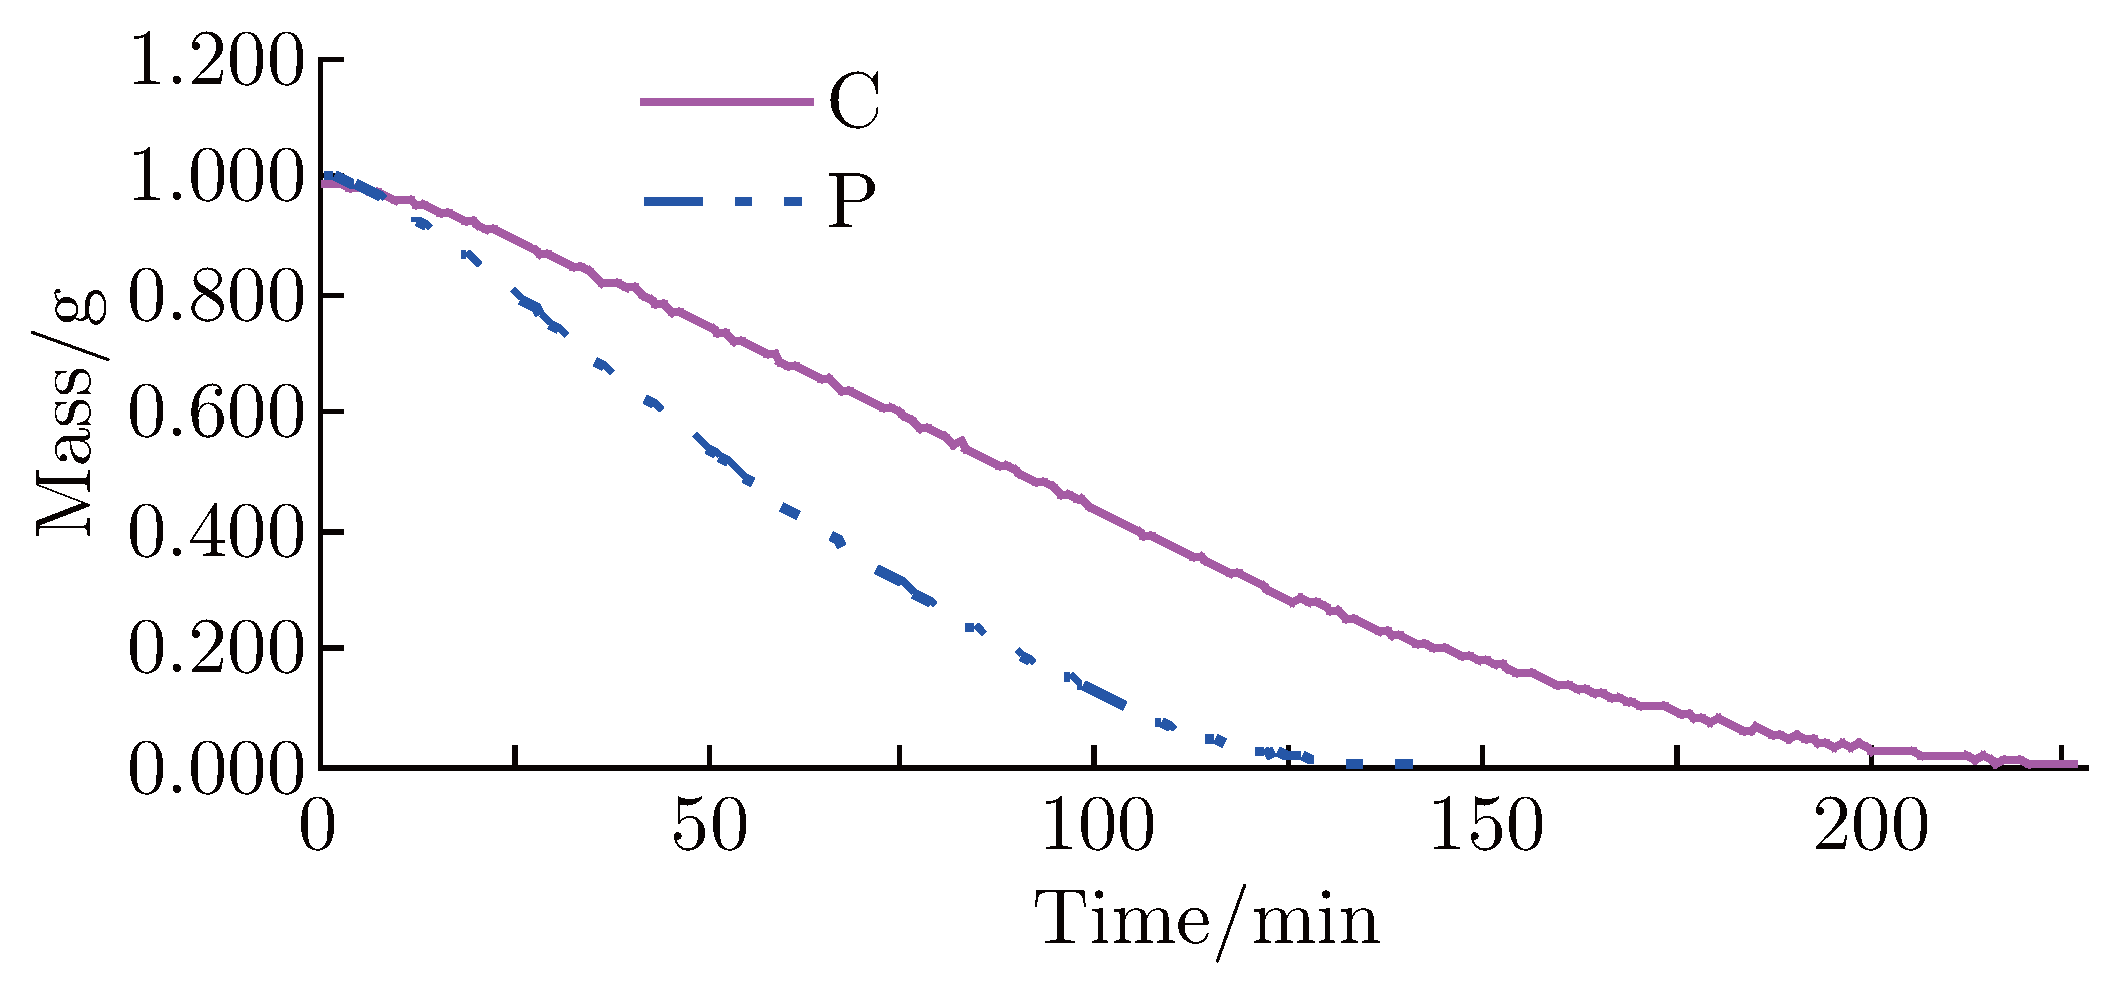
The results of mass loss measurements during the drying processes of the two fabrics are shown in Figure 11. In this figure, the horizontal axis is time and the vertical axis denotes the mass loss relative to the original mass. It is evident that polyester dries at a faster rate than cotton, which agrees with the earlier results in which the polyester fabric surface temperature returned to room temperature more quickly than the cotton.
Figure 11.
Mass loss during drying process at 65%RH.
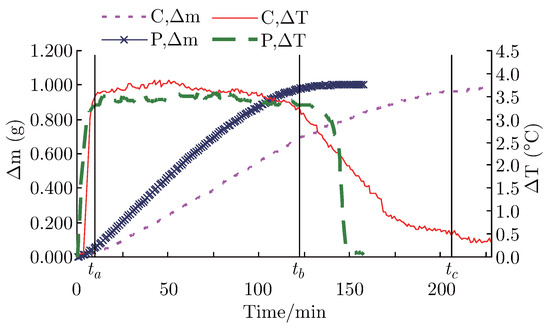
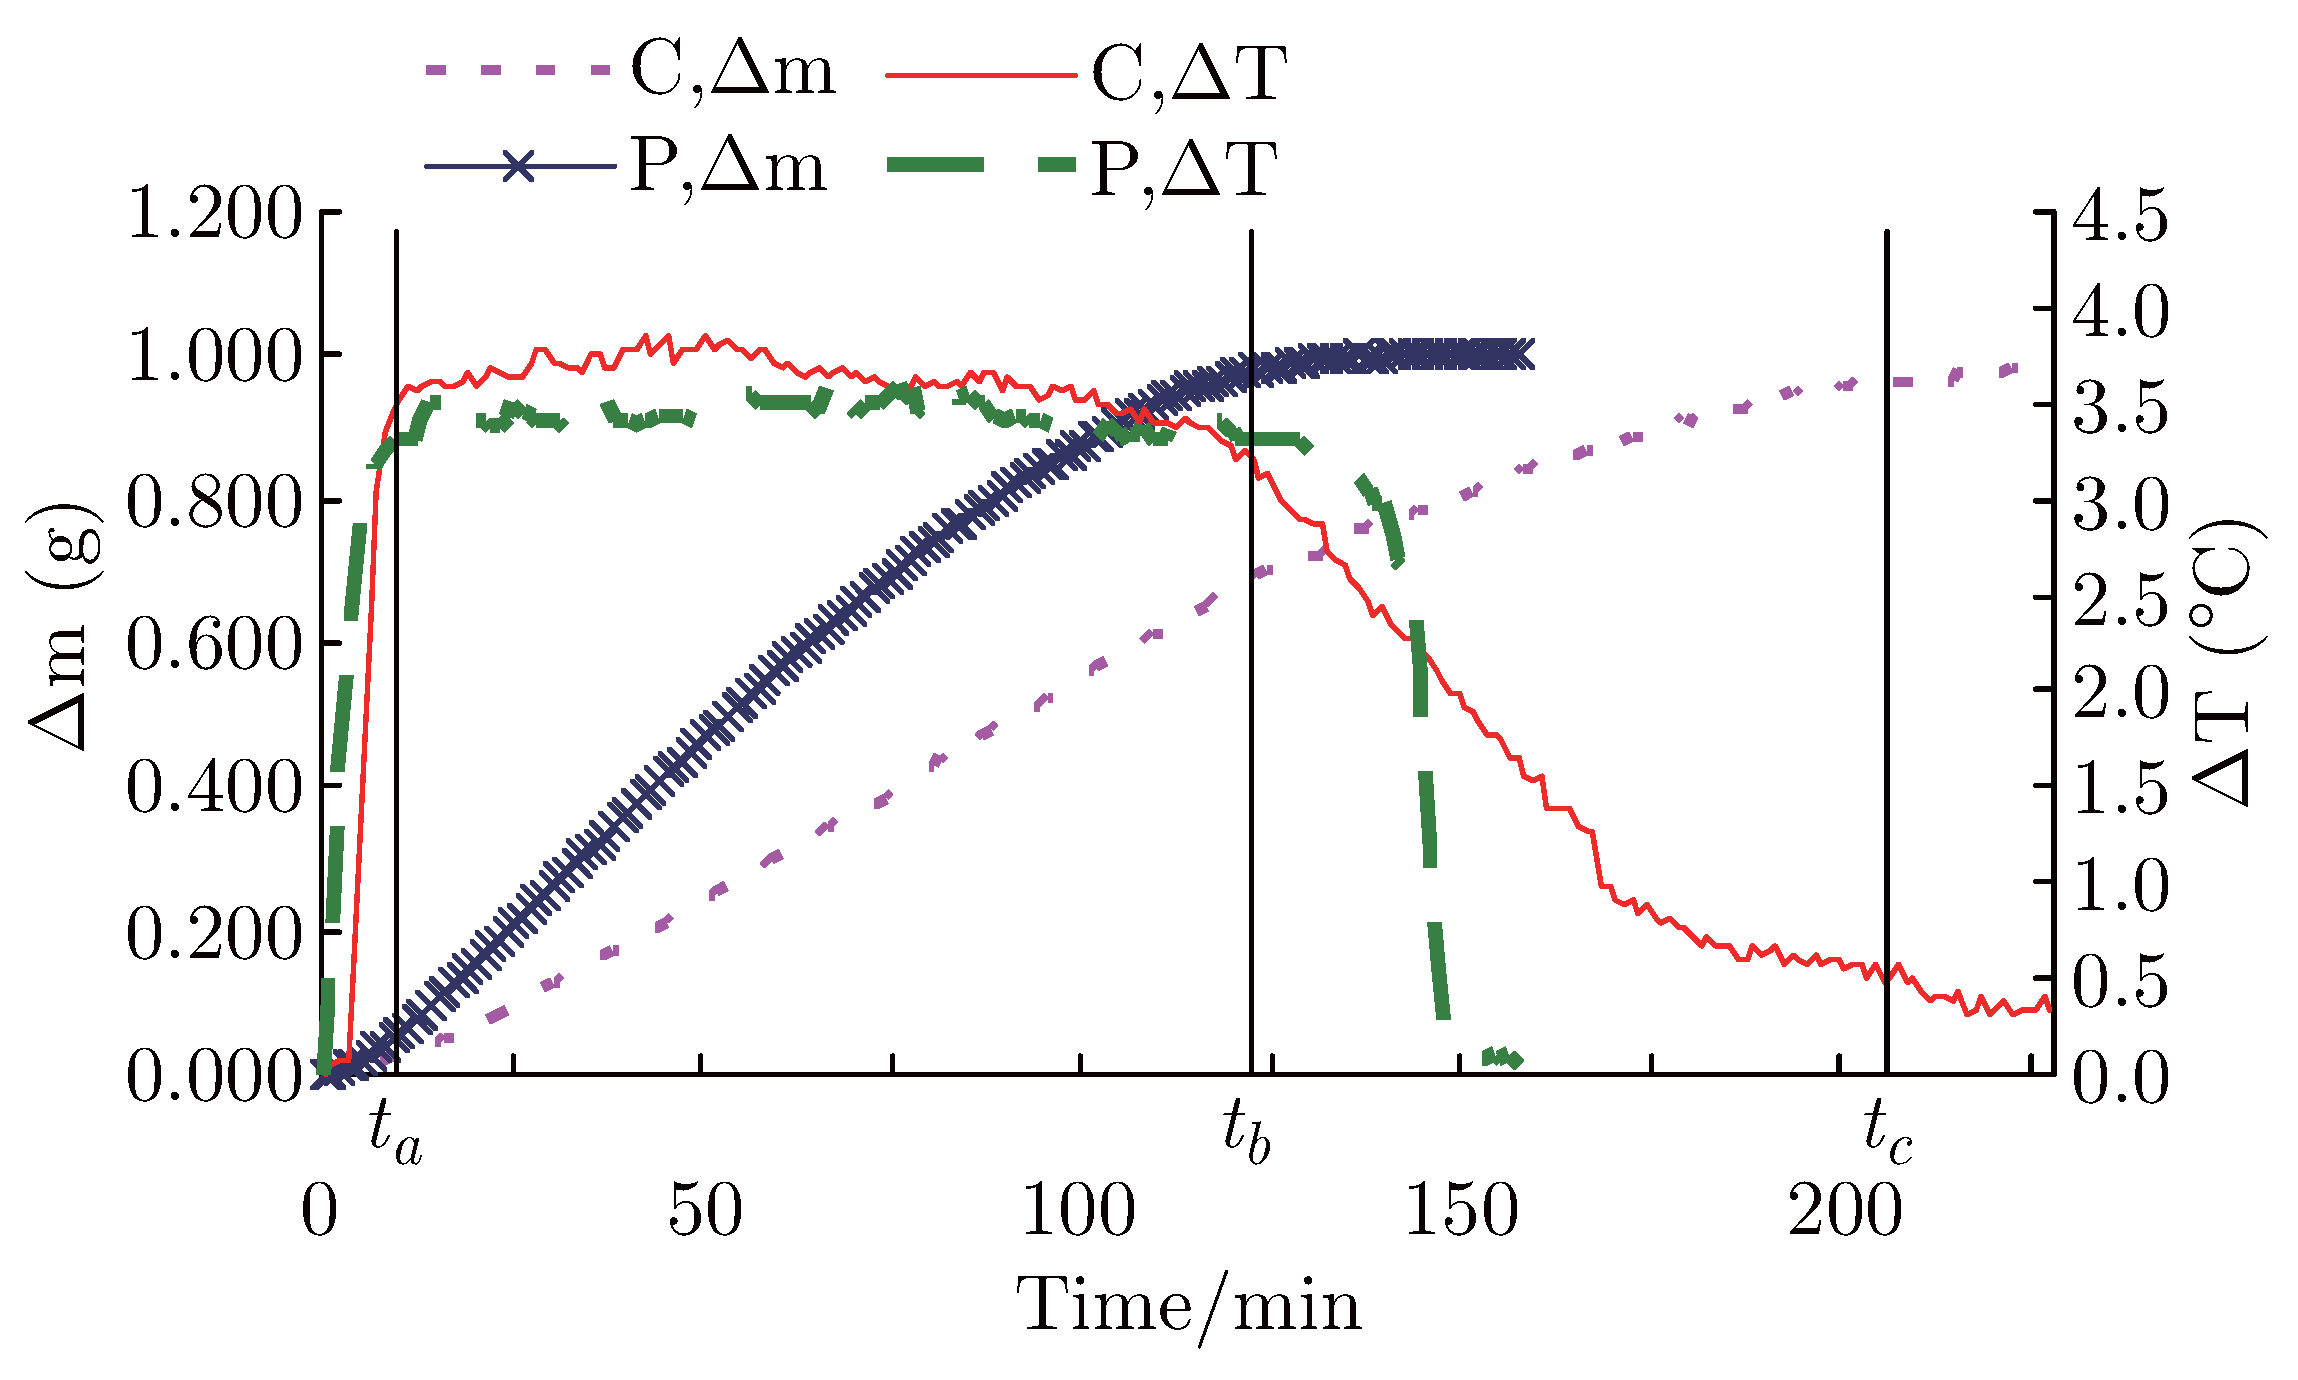
Figure 12 shows the drying process of cotton and polyester fabrics expressed by the changes of moisture mass and temperature at 65%RH. The horizontal axis represents time, and the left-hand vertical axis denotes the liquid mass difference, the right-hand vertical axis is the temperature difference. The mass and temperature difference can be calculated by:
where m0 represents the liquid mass when t is 0 min. mt is the liquid mass at the moment of time t. T0 is the original temperature. Tt is temperature at the moment of time t.
∆mt = m0 − mt
∆Tt = T0 − Tt
Figure 12.
Temperature and mass change of the two fabrics.
In the case of the cotton fabric, at the moment of ta (approximately 8 min), the dropped point has achieved dynamic heat balance, even though the mass of liquid changed very little. Between times ta and tb, it maintains a constant drying rate, with an associated mass loss of about 0.7 g. At the same time, the surface temperature of cotton fabric remains steady. From tb to tc, the temperature increases gradually and the mass loss drops, corresponding to the stage in which the drying rate decreases. After tc, the changes of temperature and mass are minimal, and the fabric reaches to equilibrium with its surroundings. The polyester fabric also shows the same tendencies as the cotton, except that the time span between tb and tc is shorter because of the faster drying of polyester.
3.2.2. Temperature Changes of Wetted Fabrics at Circumference Measurement Points
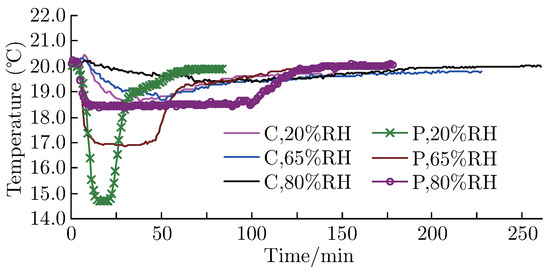
Figure 13 and Figure 14 show the temperature variations on both fabrics at measurement point 1 and 2, located on the circumference, which is 6 and 3 cm away from the center of the circle, at relative humidity of 20, 65 and 80%, respectively.
Figure 13.
Temperature change with time of point 1.
Figure 14.
Temperature change with time of point 2.
In Figure 13, during the dynamic heat balance phase, temperature of point 1 on cotton fabric is higher than that of polyester fabric at all humidity levels. As mentioned above, cotton fabric absorbs water not only in the pores; but also via its fibers, which account for the majority of the water absorption. As a result, water in pores and free water of cotton fabric is less than that in polyester fabric, and when reaches dynamic heat balance, the lowest temperature of cotton fabric is higher than that of polyester fabric.
In Figure 14, however, where measurements at point 2 are presented, both cotton and polyester achieve approximately the same temperatures during the heat balance phase under the same humidity levels. Figure 15 presents more detailed plots highlighting the slight temperature increases caused by the heat release accompanying the initial water absorption. At lower RH levels, slightly higher temperatures are obtained. This phenomenon occurs because at lower relative humidity, the drop of water is absorbed to a greater extent upon its initial application to the fabric, thus producing greater heat of wetting, which in turn increases the fabric temperature.
Figure 15.
Initial temperature increase at point 2 on cotton fabric.
4. Conclusion
In this study, the temperature variations during the wetting and drying process of cotton and polyester fabrics were measured by thermocouple sensors implanted in the fabrics.
The results provided useful information regarding temperature changes associated with the wetting and drying process. At the dropped point, the temperature was observed to drop to approximately 12.5, 16.7 and 18.0°C at 20, 65 and 80%RH respectively immediately, after which it remained stable for a relatively long time before finally returning to ambient temperature. At the circumference of the measurement circles, accompanied by liquid moisture diffusion, the associated drop in temperature was delayed and a constant temperature phase was again observed, followed by a return to ambient temperature that is achieved earlier than the dropped point. At 20°C, 65%RH, the lowest temperature of circumference points (6 cm) on polyester fabric was essentially the same as the dropped point. With cotton fabric, however, these points were approximately 2.5°C higher than the dropped point. This difference resulted from the hygroscopic nature of the cotton fabric, such that it absorbed more liquid water than the polyester, and hence its water diffusion area was not as wide and the resulting heat of evaporation was reduced. Essentially, following the application of a small amount of water, compared with polyester fabric, the cotton maintained a low temperature over a longer time period, about one and a half hours, within a narrow area. The recovery time for temperature of dropped point was longer with the increasing of the relative humidity. At 80%RH, the lowest temperature of dropped point was 17.9°C, which was essentially equal to the wet bulb temperature at this RH. With decreasing relative humidity from 80% to 20%, the difference between the lowest temperature of fabric and the associated wet bulb temperature increased, with differences of 1°C at 65%RH and 3°C at 20%RH. This is most likely because the relative humidity of micro-climate of the dropped point was higher than environmental humidity. From the relationship between temperature change and liquid mass change on cotton and polyester, it showed the three stages of drying process, each with an associated temperature change. In addition, a slight temperature increases, about 2°C was observed at the circumference point as soon as fabric was wetted, which was caused by heat of wetting.
Based on the investigation, it devised a method to analyze the performance of liquid water transfer on fabrics by measuring the associated temperature changes of fabric in the wetting and drying process following the application of water. With the help of thermocouples implanted in the fabric, both heat and moisture transfer process can be followed in real time. This technique simulates a three-dimensional, hollow fabric, in which temperature variations may be measured as a result of the distribution of temperature sensors in one of the layers. This method shows promise for the prediction of wearer discomfort levels resulting from the temperature decline associated with wetted fabrics.
Acknowledgments
This work was supported by Grant-in-Aid for Global COE Program by the Ministry of Education, Culture, Sports, Science, and Technology of Japan.
References
- Parson, K. Human thermal environments: The effects of hot, moderate and cold environments on human health, comfort and performance (Second edition); CVC Press, 2002; pp. 156–195. [Google Scholar]
- Li, Y.; Plante, A.M.; Holcombe, B.N. Fiber hygroscopicity and perceptions of dampness: Part II: Physical mechanisms. Text. Res. J. 1995, 65, 316–324. [Google Scholar]
- Plante, A.M.; Holcombe, B.V.; Stephens, L.G. Fiber hygroscopicity and perceptions of dampness: Part I: Subjective trials. Text. Res. J. 1995, 65, 293–298. [Google Scholar]
- Yasuda, T.; Miyama, M. Dynamic water vapor and heat transport through layered fabrics. Text. Res. J. 1992, 62, 227–235. [Google Scholar] [CrossRef] [Scilit]
- Le, C.V.; Tester, D.H.; Buckenham, P. Heat and moisture transfer in textile assemblies: Part II: Steaming of blended and interleaved fabric-wrapper assemblies. Text. Res. J. 1995, 65, 265–272. [Google Scholar]
- Wang, Z.; Li, Y.; Zhu, Y.Q.; Luo, Z.X. Radiation and conduction heat transfer coupled with liquid water transfer, moisture sorption, and condensation in porous polymer materials. J. Appl. Polym. Sci. 2003, 89, 2780–2790. [Google Scholar] [CrossRef] [Scilit]
- Zhou, L.Y.; Feng, X.W.; Du, Y.F.; Li, Y. Characterization of liquid moisture transport performance of wool knitted fabrics. Text. Res. J. 2007, 77, 951–956. [Google Scholar] [CrossRef] [Scilit]
- Guo, Y.P.; Li, Y.; Yao, L.; Liu, R.; Cao, X.Y.; Cao, M.L. Skin Temperature, Stratum corneum water content and transepidermal water loss distributions during running. J. Fiber Bioeng. Inform. 2011, 4, 253–266. [Google Scholar] [CrossRef] [Scilit]
- Song, W.F.; Liu, Q.; Yu, W.D. Investigation on effective heat conductivity of fibrous assemblies by fractal method. J. Fiber Bioeng. Inform. 2011, 4, 59–69. [Google Scholar] [CrossRef] [Scilit]
- Hu, D.H.; Cheng, J.X.; Zhou, X.H. A model of heat and moisture transfer through parallel pore textiles. J. Fiber Bioeng. Inform. 2011, 3, 250–255. [Google Scholar] [CrossRef] [Scilit]
- Li, Y.; Zhu, Q.Y.; Yeung, K.W. Influence of thickness and porosity on coupled heat and liquid moisture transfer in porous textiles. Text. Res. J. 2002, 72, 435–446. [Google Scholar] [CrossRef] [Scilit]
- Jiang, X.Y.; Zhou, X.H.; Weng, M.; Zheng, J.J.; Jiang, Y.X. Image processing techniques and its application in water transport through fabrics. J. Fiber Bioeng. Inform. 2010, 3, 88–93. [Google Scholar] [CrossRef] [Scilit]
- Wang, F.M.; Kalev, K.; Gao, C.S.; Ingvar, H.; George, H. Development and validation of an empirical equation to predict wet fabric skin surface temperature of thermal manikins. J. Fiber Bioeng. Inform. 2010, 3, 9–15. [Google Scholar] [CrossRef] [Scilit]
- Zhu, Q.Y.; Yang, J.; Xie, M.H. Effects of zeta potential and fiber diameter on coupled heat and liquid moisture transfer in porous polymer materials. J. Fiber Bioeng. Inform. 2010, 3, 16–21. [Google Scholar] [CrossRef] [Scilit]
- Mao, A.H.; Li, Y.; Luo, X.N.; Wang, R.M. Development of computational algorithms for clothing thermal functional simulation. J. Fiber Bioeng. Inform. 2010, 2, 259–266. [Google Scholar] [CrossRef] [Scilit]
- Alber-Wallerstrom, B.; Holmer, I. Efficiency of sweat evaporation in unacclimatized man working in a hot humid environment. Eur. J. Appl. Physiol. 1985, 54, 480–487. [Google Scholar] [CrossRef] [Scilit]
- Holcombe, B.V.; Hoschke, B.N. Dry heat transfer characteristics of underwear fabrics. Text. Res. J. 1983, 53, 368–374. [Google Scholar] [CrossRef] [Scilit]
- Watkins, D.A.; Slater, K. The moisture-vapour permeability of textile fabrics. J. Text. Inst. 1981, 72, 11–18. [Google Scholar] [CrossRef] [Scilit]
- Takako, F.; George, H. Differences in comfort perception in relation to local and whole body skin wittedness. Eur. J. Appl. Physiol. 2009, 106, 15–24. [Google Scholar] [CrossRef] [Scilit]
- Hu, J.Y.; Li, Y.; Yeung, K.W.; Wong, A.S.W.; Xu, W.L. Moisture management tester: A method to characterize fabric liquid moisture management properties. Text. Res. J. 2005, 75, 57–62. [Google Scholar] [CrossRef] [Scilit]
- Yao, B.G.; Li, Y.; Hu, J.Y.; Kwok, Y.L.; Yeung, K.W. An improved test method for characterizing the dynamic liquid moisture transfer in porous polymeric materials. Polym. Test. 2006, 25, 677–689. [Google Scholar] [CrossRef] [Scilit]
- Lyons, D.W.; Vollers, C.T. The drying of Fibrous Materials. Text. Res. J. 1971, 41, 661–668. [Google Scholar] [CrossRef] [Scilit]
- Ziegler, S.; Frydrysiak, M. Initial research into the structure and working conditions of textile thermocouples. Fibres Text. East Eur. 2009, 17, 84–88. [Google Scholar]
- Zhu, C.H.; Takatera, M. Weaving and performance study on wearable textile thermocouple fabric; International Congress on Innovative Textiles (ICONTEX): Istanbul, Turkey, 2011. [Google Scholar]
- Harnett, P.R.; Mehta, P.N. A survey and comparison of laboratory test methods for measuring wicking. Text. Res. J. 1984, 54, 471–478. [Google Scholar] [CrossRef] [Scilit]
- Japanese Standards Association (1995): JIS C1602-1995. JIS C1602-1995.
- Japanese Standards Association (1995): JIS Z8806-1995. JIS Z8806-1995.
- Nantou, Y. Sensa to kiso gijutsu; Kougaku Tosho Kabushiki Kaisha: Tokyo, Japan, 1994; p. 72. (In Japanese) [Google Scholar]
- Schneider, A.M.; Hoschke, B.N. Heat transfer through moist fabrics. Text. Res. J. 1992, 62, 63–66. [Google Scholar] [CrossRef] [Scilit]

© 2012 Textile Bioengineering and Informatics Society. This article is an open access article distributed under the terms and conditions of the Creative Commons Attribution (CC BY) license (https://creativecommons.org/licenses/by/4.0/).