


Abstract
The comfort of wearing suits, a staple of formal attire, is crucial for the human body. Studies and surveys indicate that individuals often experience discomfort and shoulder pain due to ill-fitting suits, leading to uneven pressure distribution and subsequent fatigue. Due to the increasing demands of consumers for clothing, the issue of discomfort in the shoulder area of women’s suits requires improvement. However, most research on women’s suits has focused on aesthetic aspects, with little attention given to the pressure comfort of the shoulder region. This study bridges this gap by examining pattern optimisation and pressure comfort in women’s suits. The study uses Martin’s measuring instruments and 3D scanning to gather shoulder data from young women. The goal is to understand the typical shape and structure of human shoulders. With this information, we develop a method to optimise shoulder patterns in clothing, ensuring they can be adapted to fit different shoulder types comfortably. The research identifies the relationship between the shoulder slope angles of suit patterns and human shoulder shapes, formulating an equation to link body morphology with pattern design. This study can facilitate designers’ understanding of the relationship between human shoulder morphology and clothing patterns, thereby enabling the creation of more comfortable women’s suits for consumers.
1. Introduction
In today’s fashion industry, young professional women are increasingly seeking custom-made clothes that are both stylish and comfortable. The suit, a key piece in business wear, is central to their wardrobe, helping create a professional look while boosting confidence and empowerment. However, the off-the-rack suit market often falls short in terms of fit and comfort because of the wide variety of body shapes and the limited customisation in mass-produced clothing.
This gap highlights a significant issue in the industry’s approach to suit design, especially concerning pressure distribution and overall comfort. Improving suit patterns to fit various body types and ensure comfort is a critical area of research.
1.1. Research on the Current Status of Women’s Suits Research
Zhu Wenwen [1] explored the wide application of women’s suit ensembles in diverse lifestyles and the need for improvements in tailoring, highlighting the market position of women’s suits and innovation points in sewing techniques. Han Mengge [2] discussed strategies to optimise the appearance quality of women’s striped suit ensembles in terms of fabric performance, style characteristics, structural adjustments, and technical details, and proposed solutions to reduce the impact of stripe displacement on consumer visual perception and purchase desire. Xu Jun [3] investigated university students’ aesthetic needs and preferences for the details of women’s suits, finding that fashion, leisure, and uniqueness are key considerations in the design of women’s suits. Tang Xi [4], based on the theory of Kansei engineering, evaluated consumers’ perceptual cognition of 12 types of women’s suit collars through questionnaires and data analysis, aiming to provide a reference for the design of women’s suits. Yu Cuiping [5] proposed a research scheme that combines Kansei engineering with Quantification Theory I for style design, creating a two-dimensional perceptual distribution space for women’s suits and constructing a mathematical model. The model was further validated to effectively translate human perceptual needs into design elements of women’s suits, providing a reference for the design and perceptual evaluation of women’s suit styles. Wang Sijia [6] we applied the principles of Kansei engineering to cross-analyse the factors affecting the charm value of women’s suits in terms of style, colour, and silhouette. The aim was to determine the relationship between different factors and the charm of women’s suits, providing references and suggestions for future design and production.
The demand for both the aesthetic appeal and comfort of clothing is increasingly high; however, research on women’s suits tends to focus more on appearance, with few studies addressing the issue of discomfort in the shoulder area of women’s suits.Therefore, this paper addresses shoulder pain, a common discomfort, and conducts research on pattern optimisation and pressure comfort.
1.2. The Status of Human Shoulder Morphology
In their study, Zhang Jinhua [7] and Wang Hongfu found that approximately 79.661% of the subjects had a right shoulder tilt angle distribution between 22.0° and 27.3°. Li Zhao [8] analyzed the data from body measurements and discovered that the smallest shoulder slope angle among the 64 subjects was 16.09°, while the largest shoulder slope angle was 32.8°. In “Theoretical chapter of clothing modelling,” Manjiko Miyoshi [9] mentioned that the Japanese cultural style prototype’s paper pattern had shoulder slope angle values of 22° for the front shoulder and 18° for the back shoulder. Liu Ruipu [10], in “Principles and Applications of Garment Pattern Design for Women’s Clothing,” explains that the shoulder slope is the angle formed between the end of the shoulder, the root of the neck, and the horizontal line. It is 19° for women and 21° for men. Yoshi Nakazawa [11], in his book “The Human Body and Clothing,” provides a detailed analysis of the bones and muscles of the shoulder. In his study, Jia Shuang [12] classified shoulder shapes into three types: flat shoulder type, natural shoulder type, and slipped shoulder type. These classifications were based on the shoulder slope angle, with corresponding numerical ranges of shoulder slope angle values being [3.3°, 18.09°], [18.09°, 21.39°], and [21.39°, 33.8°], respectively.
To optimise the shoulder pattern in clothing, it is essential to first understand the structure of the human shoulder. The literature on shoulder morphology has led to the classification of shoulder slopes for different shoulder types. The standard female shoulder type typically has a shoulder slope angle ranging from around 21° to 23°. My experiment will refer to the content on shoulder structure from the literature for the design and analysis of the experiment.
1.3. The Status of Pressure Comfort
Denton’s study [13] discovered that the pressure range that induces comfort falls between 1.96-3.92 kPa, while pressures between 5.88-9.8 kPa are deemed uncomfortable. In a study by Watanabe et al. [14] concluded that the lateral neck exhibited a lower pressure sensitivity threshold compared to other areas, and the areas of the shoulder sensitive to pressure were the lateral neck and shoulder points. Morooka [15] concluded that highly stretchable fabric with a low torso pressure of approximately 1 kPa has a positive effect on the human body when worn. However, the study also found that local high pressure of around 8 kPa in the shoulder and neck area negatively affects blood flow and the nervous system. Makabe et al. [16] found that the shoulder straps had a pressure of 3.12 kPa, while the lower bust and cup edge tangency ranged between 1.46-2.30 kPa. Jiao Zhennan [17] the collected data were analysed to establish a BP neural prediction model, using the measured pressure values as training data for the neural network to create a pressure prediction model. Hou Xinzhi [18], Zhang B N et al. conducted pressure tests on yoga sports bras to determine their comfort range through research [19], found that when the abdomen circumference and hip circumference of the loose quantity are −17 cm, the thigh circumference is −12 cm, and the fork is 13 cm, people who wear this kind of knitted underwear can have the most comfortable feeling. Jie Zhou and Winnie Yu [20] Established a biomechanical model for sports bras and found that wider shoulder straps are more effective in reducing the breast forces. Wang Y X, and Liu Z D [21] the article uses CLO3D and HTML5 to design a virtual clothing display system. This platform’s design provides some reference value for the apparel industry’s digital model.
Rui-Chen Lu and Guan-Di Lin [22] found that enterprises can stimulate consumers’ purchase intention by improving product quality and enriching the service experience. Tong Liu [23] discovered that functional values such as usability, quality, and uniqueness influence the consumer’s luxury product purchase intention.
We can discover that the quality of a product can influence consumers’ purchasing intentions. Therefore, it is important to address the issue of garment fit in order to solve it effectively.
While there has been previous research on overall pressure comfort, there has been a lack of detailed analysis specifically focusing on shoulder patterns based on the shape of the human body’s shoulders. The investigation has revealed that the phenomenon of discomfort in the shoulder area when wearing women’s suits is quite widespread. Wearing suits with ill-fitting shoulders can lead to uneven pressure distribution, and after prolonged compression, it can cause severe fatigue in the shoulder and neck areas [26]. Therefore, it is necessary to conduct further research on the improved design of the shoulder area for women’s suits to enhance comfort during wear.
2. Methodology
This study aims to comprehensively analyse the shoulder shape in young women and optimise it based on the pattern. To reach the research objective, we conducted a comprehensive set of experimental studies. The following are some of the methods I used in my research.
Three-dimensional body scans were conducted on 18-25-year-old unmarried female youth to obtain shoulder-related data. The collected data underwent cluster analysis, and a deep analysis was conducted on the causes of discomfort in the shoulder area when young women with three different shoulder types were wearing suits. Pattern design and body shape were identified as the two most significant factors in the study. Preliminary pattern optimisation and pre-experiments were carried out using the CLO3D virtual fitting software to establish an experimental plan. Sample garments were produced, and participants were recruited to wear them for pressure testing and comfort assessment. The analysis of the data obtained revealed the pressure comfort thresholds for different shoulder areas for various shoulder types and the relationship between shoulder type and the shoulder slope of the pattern.
2.1. Extraction of Human 3D Point Cloud Data
2.1.1. Selection of Experimental Subjects
The study population consisted of young infertile women, specifically those between the ages of 18 and 25. Additionally, participants were required to have a height within the range of 160±5 cm and a BMI between 18.5 and 23.9 (BMI calculated as weight divided by height squared in kg/m2).
2.1.2. Extraction of Shoulder Feature Variables and Their Quantitative Calculation
In this study, a detailed analysis was conducted on the point cloud model captured by the 3D body scanner, specifically focusing on shoulder morphology. The study focused on the human body above the waistline, and the origin of the coordinate system was rearranged at the centre of the human waist joint surface. The original 3D point cloud data was processed using the reverse engineering software Rapid form XOR3.
The 3D point cloud model obtained from the Vitas Smart XXL model 3D human scanner exhibited certain positions that were not successfully extracted, leading to the presence of small holes in the model. Consequently, it becomes imperative to address these gaps by employing techniques for bridging and filling in order to enhance the quality of the 3D model. Subsequently, after the completion of the 3D model, a process of smooth denoising is applied to obtain a refined point cloud data model, thereby resulting in a smoother surface model.
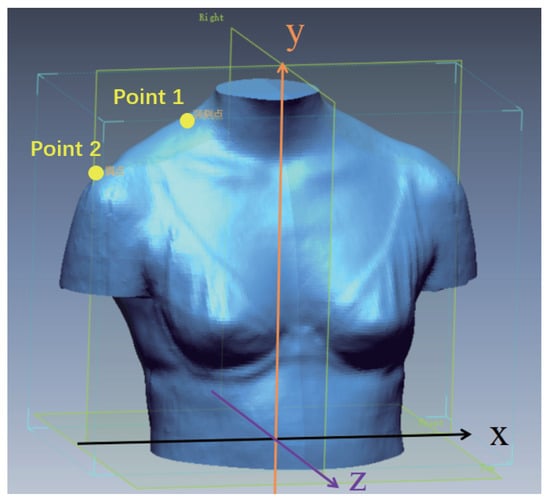
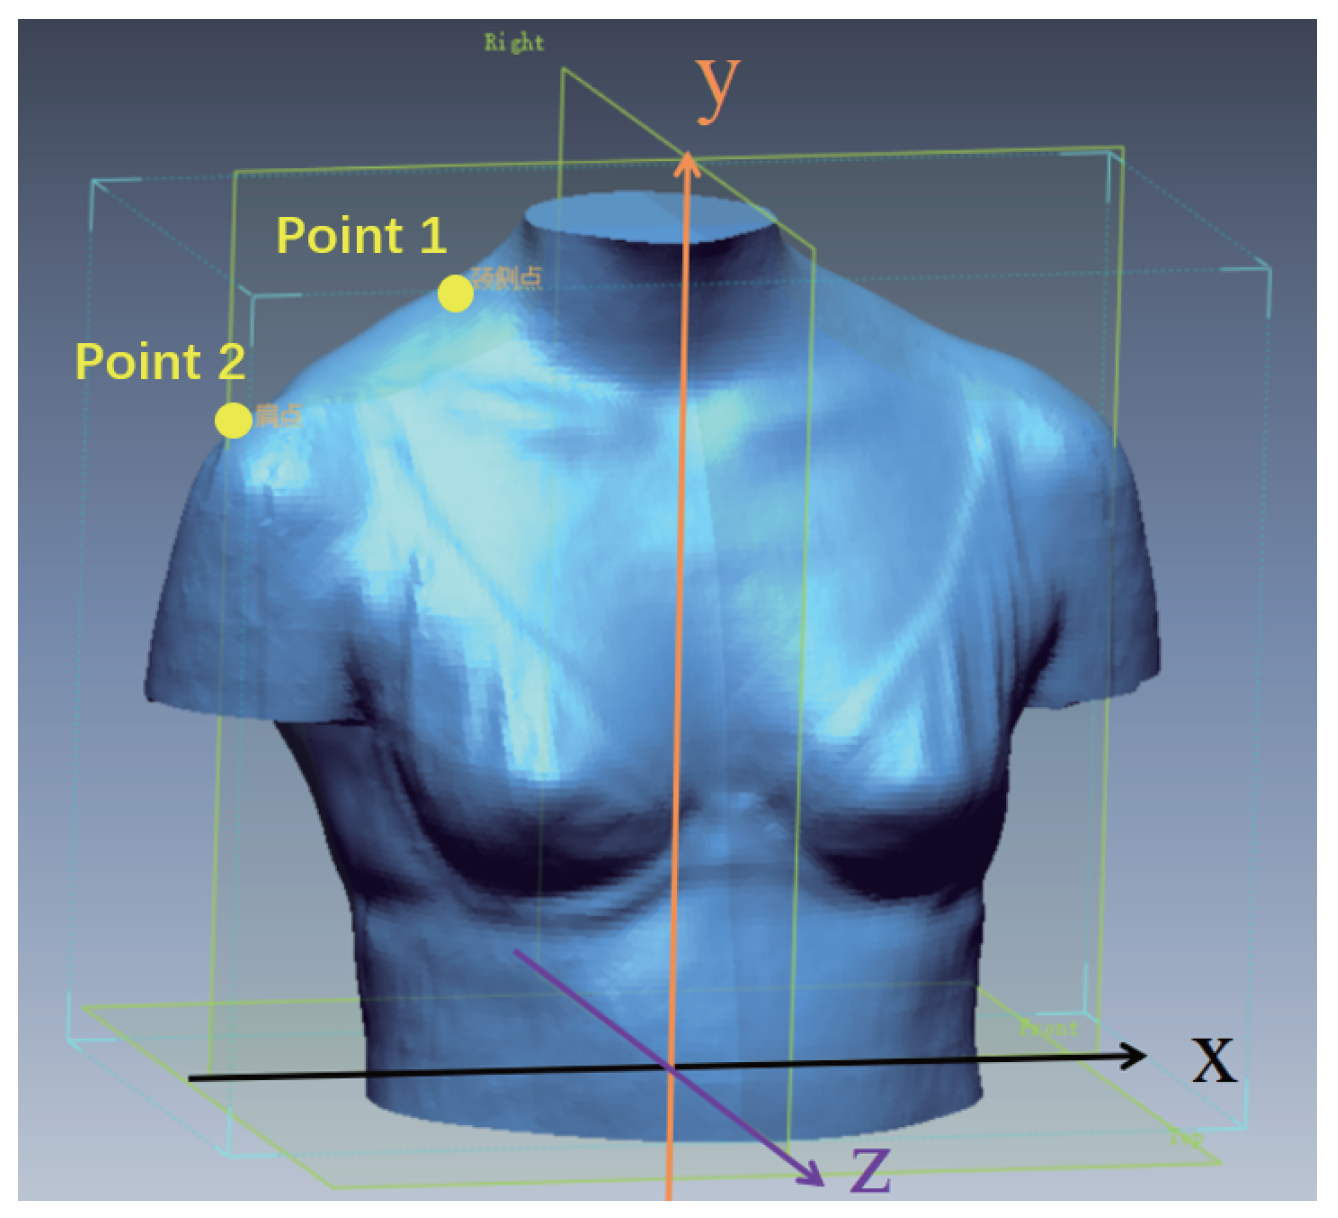
To establish a coordinate system, three axes are referred to as the x-axis (horizontal), y-axis (vertical), and z-axis (vertical), collectively known as the coordinate axes [24]. A schematic diagram illustrating the x, y, and z coordinate axes is shown in Figure 1. Point 1 and Point 2 correspond to the cervical and shoulder regions, respectively. For a comprehensive understanding, please consult Table 1, which provides detailed explanations.
Figure 1.
Schematic diagram of extracting neck and shoulder points.
Table 1.
Feature point extraction on a 3D human body.
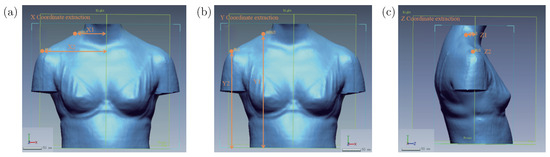
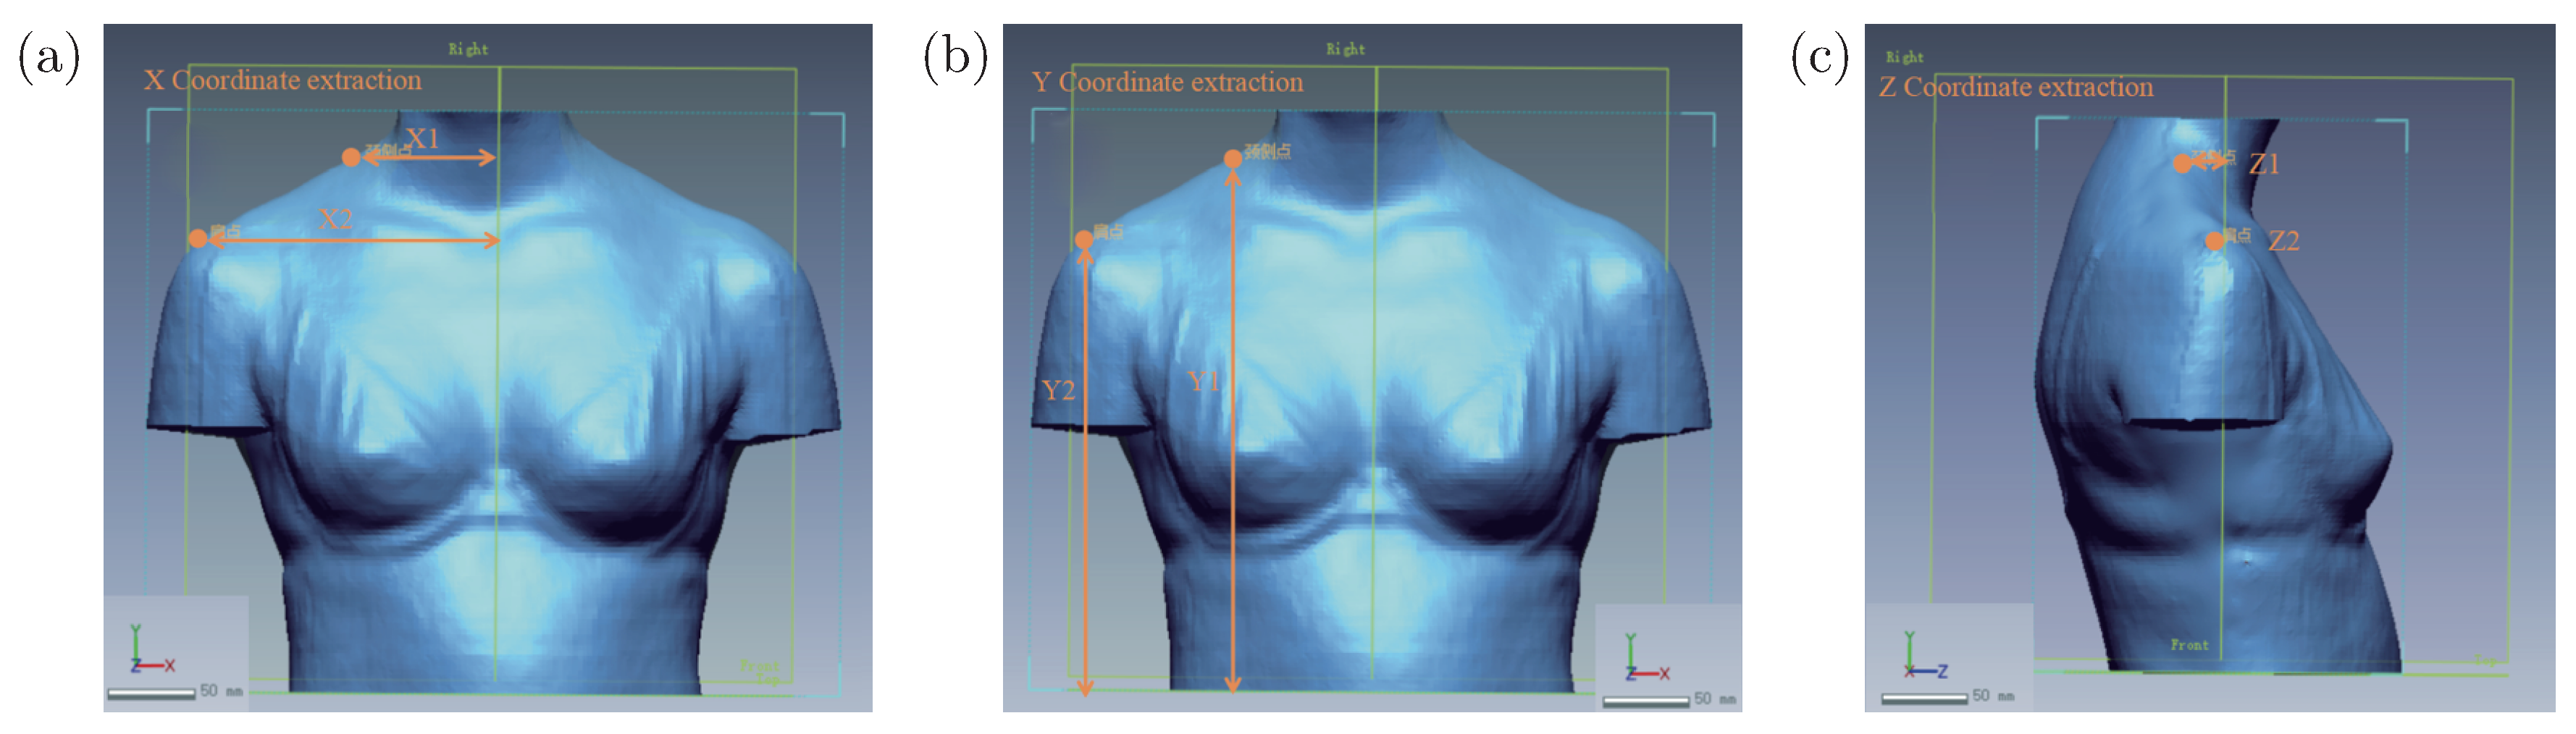
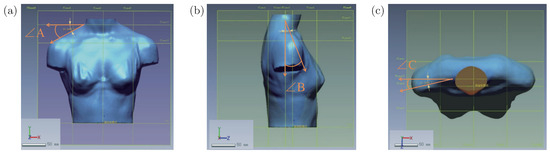
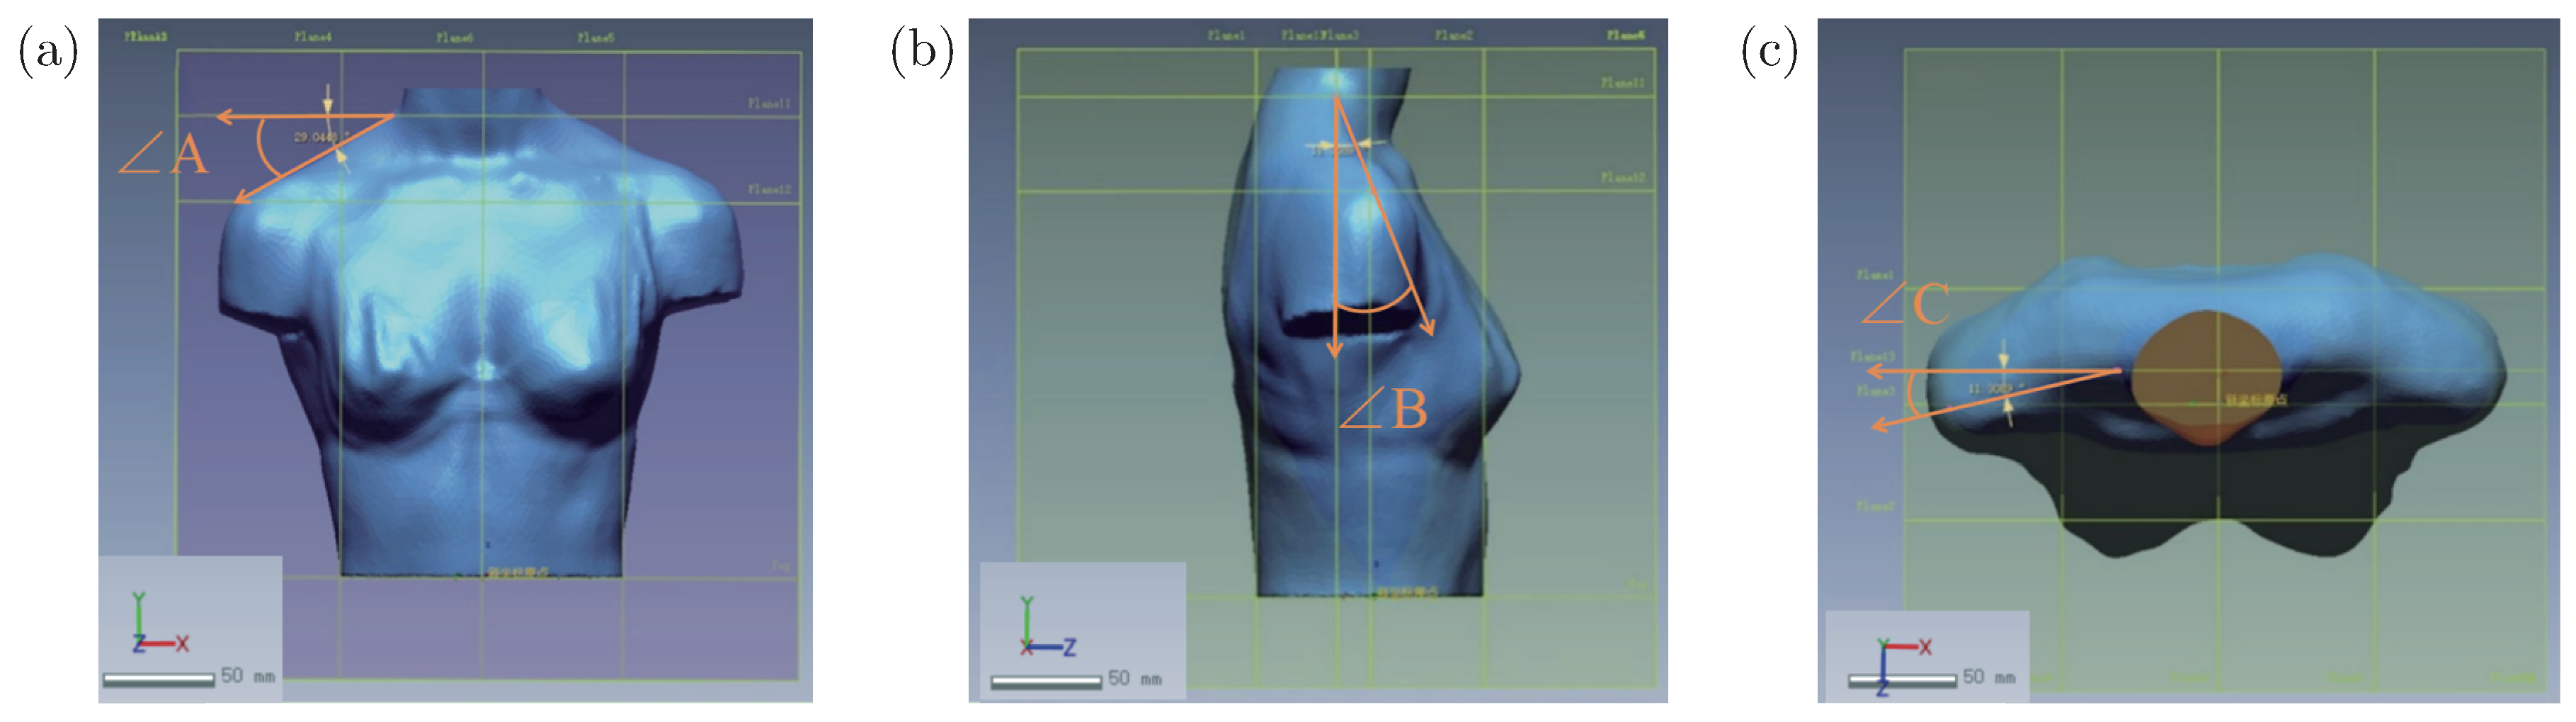
In this paper, the X, Y, and Z coordinate values of two specific feature points, the shoulder point and the lateral neck point, were extracted from a total of 198 female upper bodies, as illustrated in Figure 2. By calculating the coordinate values of the projected feature points on various planes, the shoulder slope angle values in three different planes were obtained, as shown in Figure 3. These calculated shoulder slope angle values were utilised to analyse the morphological characteristics of the shoulder within the subject population. The precise definitions of point coordinates and angles can be found in Table 2, while Table 3 presents the respective calculation formulas for angles.
Figure 2.
Extracting the (a) X, (b) Y, (c) Z coordinate.
Figure 3.
Schematic diagram of angle extraction in the (a) xoy, (b) yoz and (c) xoz planes.
Table 2.
Definition of 3-D human feature variables.
Table 3.
3D human feature variables and calculation formulae.
The main feature points of the human shoulder, including the neck and shoulder points, are extracted in a three-dimensional Cartesian coordinate system. Angle feature variables, which can effectively characterise the shape of the human shoulder, are calculated via the extracted coordinate values and triangular formulas. Table 3-3 shows that ∠A is the angle between the line connecting the shoulder point and the neck side point on the xoy plane and the coordinate axis. It is used to describe the degree of inclination of the shoulder. A larger value of ∠A indicates a shape closer to that of a shoulder, while a smaller angle corresponds to a flatter shoulder shape. The inclination of the shoulder can be further investigated based on previous literature research values and cluster analysis results.
Furthermore, ∠B and ∠C are the angles between the line connecting the shoulder and neck points on the yoz plane and the coordinate axis on the xoz plane, respectively. These angles describe the relationship between the front and rear positions of the shoulder points. A larger angle signifies an obvious trend of the shoulder leaning forward, while a smaller angle, or even negative values, represent a trend of the shoulder leaning backwards.
2.2. Sample Extraction and Optimisation
2.2.1. Two-dimensional Paper Sample Extraction of Feature Samples
The nine feature models were exported in OBJ format from Rapid form software and subsequently imported into CLO3D. In CLO3D, the basic paper shoulder model was extracted by isolating the portion above the bust line. The process of extracting the standard shoulder model is showcased, with a visual representation of the extraction process provided in Figure 4.
Figure 4.
The method for extracting and optimising shoulder fit (a, b) step 1, (a) front and (b) back slice extraction. (c) Step 2: sample correction based on the extraction (d). Step 3: The final result of the shoulder slope angle extraction. Front and back slice extraction diagram.
In CLO3D, use a 3D pen to connect the extracted shoulder points and neck side points to form the shoulder line. The sleeve hole arc, neck circumference line, front centre line, back centre line, and chest circumference line form the base sample of the front and back pieces.
In CLO3D, the shoulder points and neck side points extracted were connected using a 3D pen to create the shoulder line. This line, along with the sleeve hole arc, neck circumference line, front centre line, back centre line, and chest circumference line, formed the foundation for the front and back pieces’ base sample, as shown in Figure 4(a,b).
The pattern generated from the 3D to 2D conversion in CLO3D was then imported into Fuyi CAD software. To refine the pattern, the Japanese cultural prototype pattern-making method was consulted for guidance, resulting in the corrected base pattern for the front and back pieces. This corrected paper pattern is visualised in Figure 4(c).
In Fuyi CAD, the line between the neck side point and the shoulder point is selected as the shoulder line for the front and back pieces. The angle between the extracted shoulder line and the horizontal line of the neck side point is then used to determine the shoulder slope angle for both the front and back pieces of the sample in Figure 4(d).
2.2.2. Optimisation of Paper Patterns for Suits
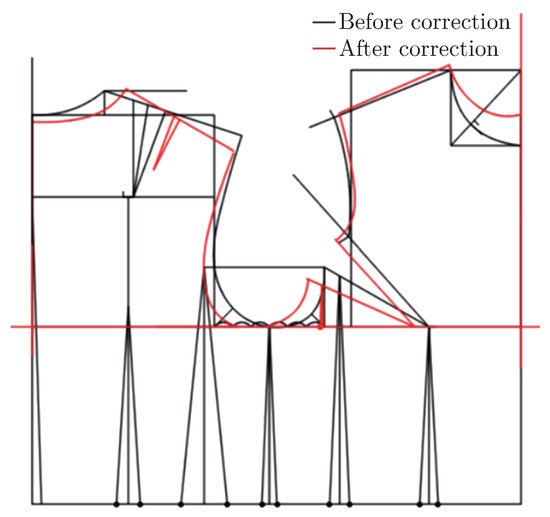
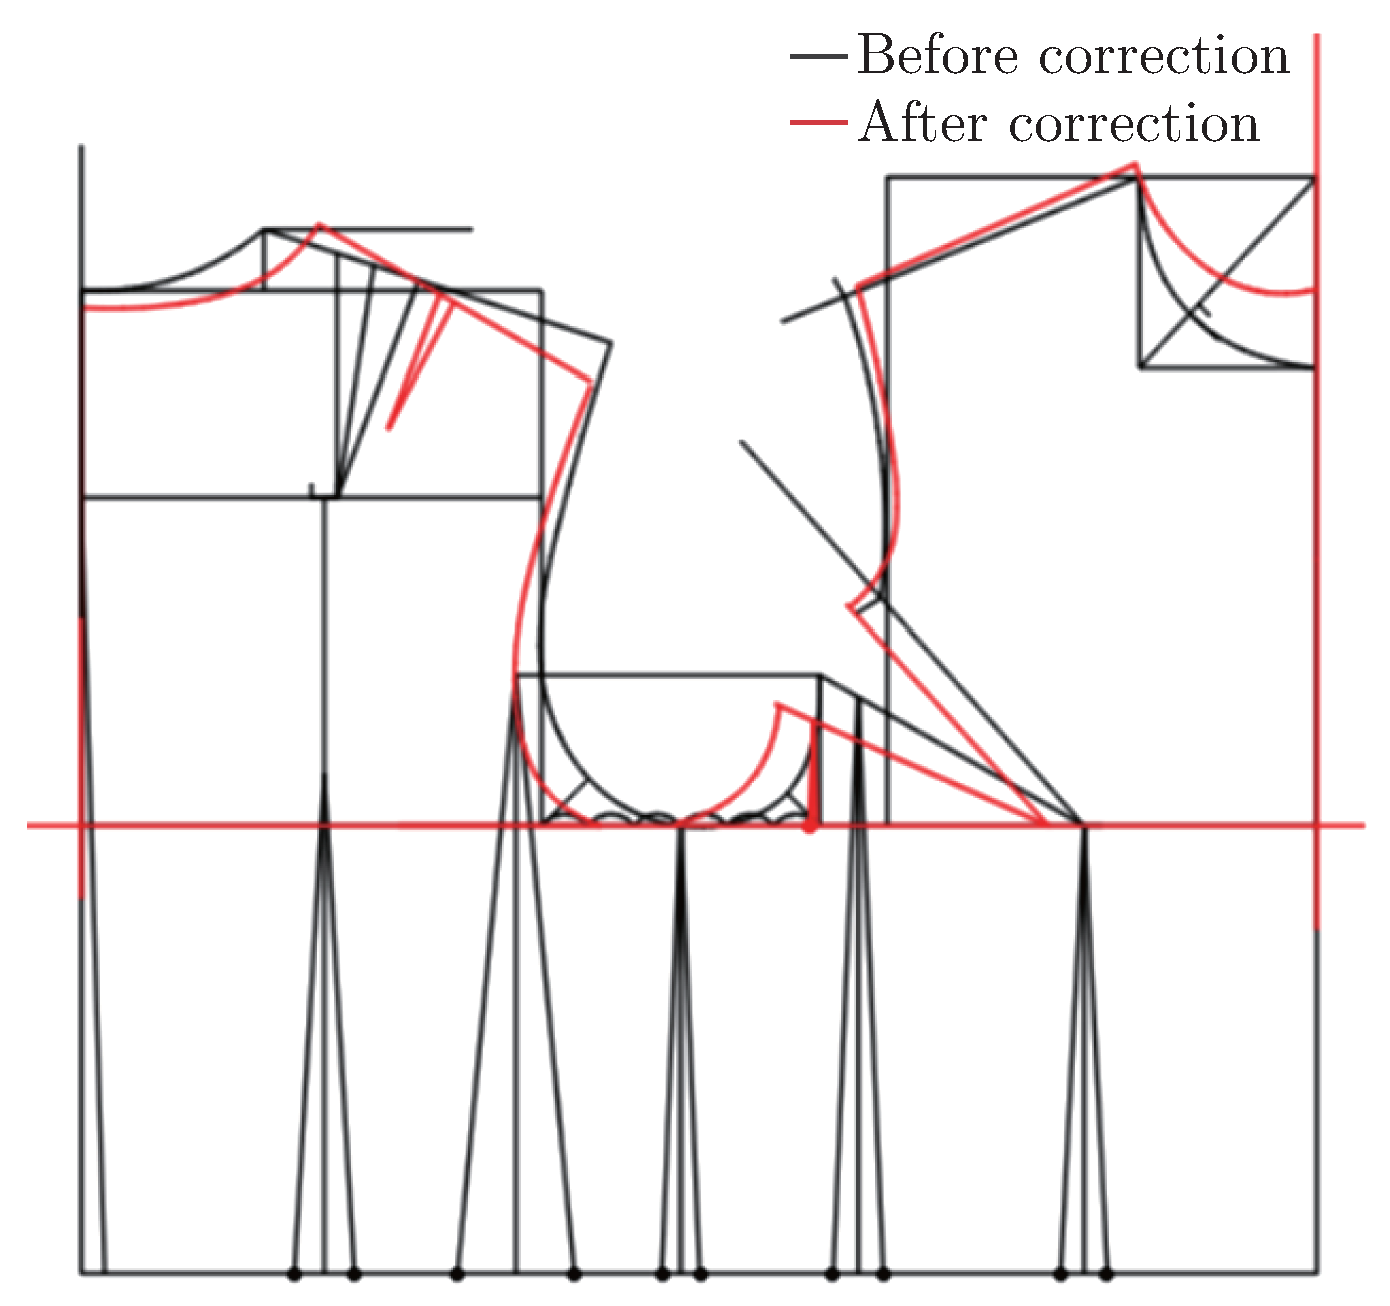
Based on the shoulder data extracted above, the suit’s paper pattern was optimised for three different shoulder type feature samples. The optimised paper samples for the women’s suits are shown in Figure 5. In the figure, the black lines represent the paper pattern of the Japanese cultural style prototype, whereas the red lines represent the extracted and optimised slip shoulder pattern.
Figure 5.
Comparison chart for structural line optimisation.
2.3. Suit Shoulder Pressure Comfort Physical Experiment
2.3.1. Grey Fabric Production
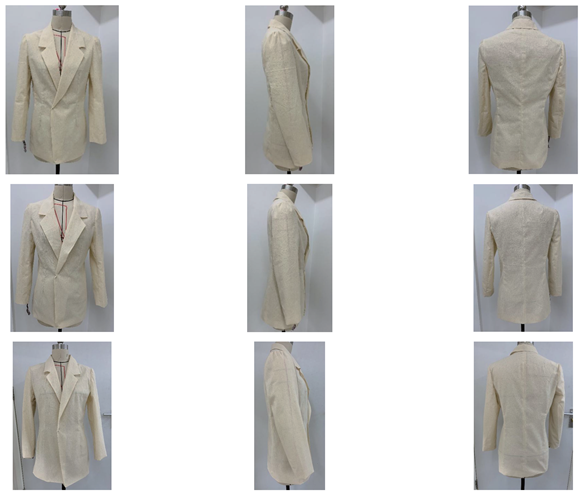
Based on the above three shoulder types, three optimised samples were produced for each shoulder type before and after optimisation.
The effect of wearing the mansard in front, side and back of the produced grey fabric is shown in Table 4.
Table 4.
The effect of wearing the mansard in front, side and back of the grey fabric.
2.3.2. Experimental Equipment
The pressure sensors are paper-thin, flexible piezoresistive sensors used for non-invasive pressure testing. They are easy to use, thin, sensitive, and cost-effective. These sensors are composed of two layers of mylar film coated with pressure-sensitive semiconductors and silver conductive material. They are capable of measuring pressure at all contact surfaces [25].
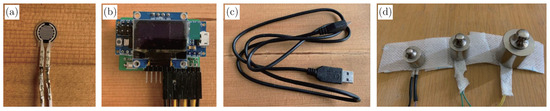
The sensor, as depicted in Figure 6(a), has a diameter of 1 mm. The main board, shown in Figure 6(b), measures 74 mm in length, 53 mm in width, and 33 mm in height. The main board can be connected to a PC using a USB connection cable, illustrated in Figure 6(c), allowing the sensor values to be read from various serial ports.
Figure 6.
Setup for the experiment (a) Sensor, (b) Main board, (c) Connection cable, (d) Sensor Calibration.
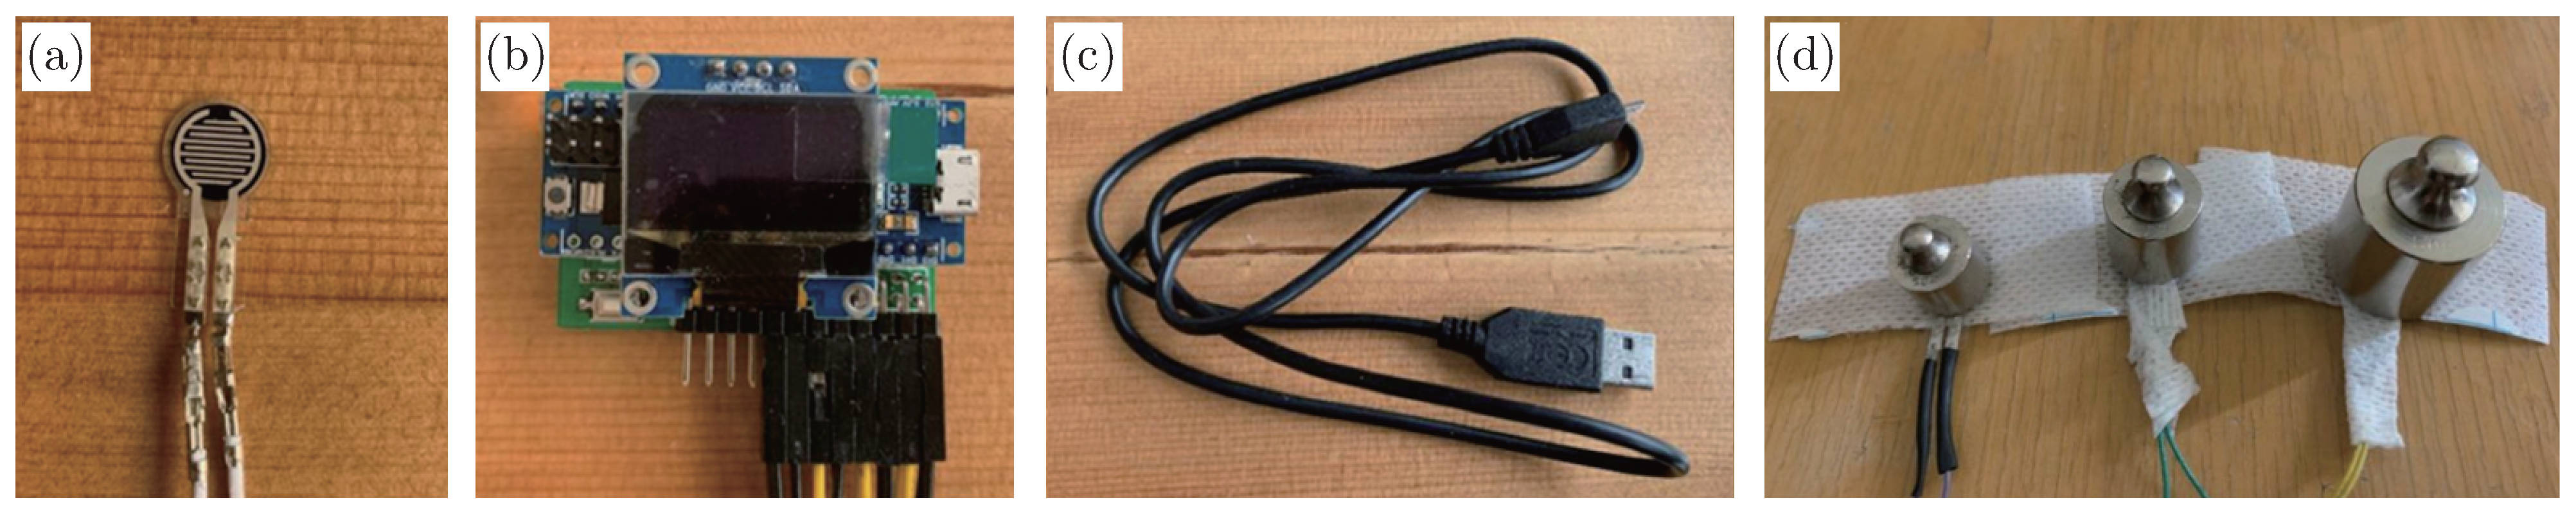
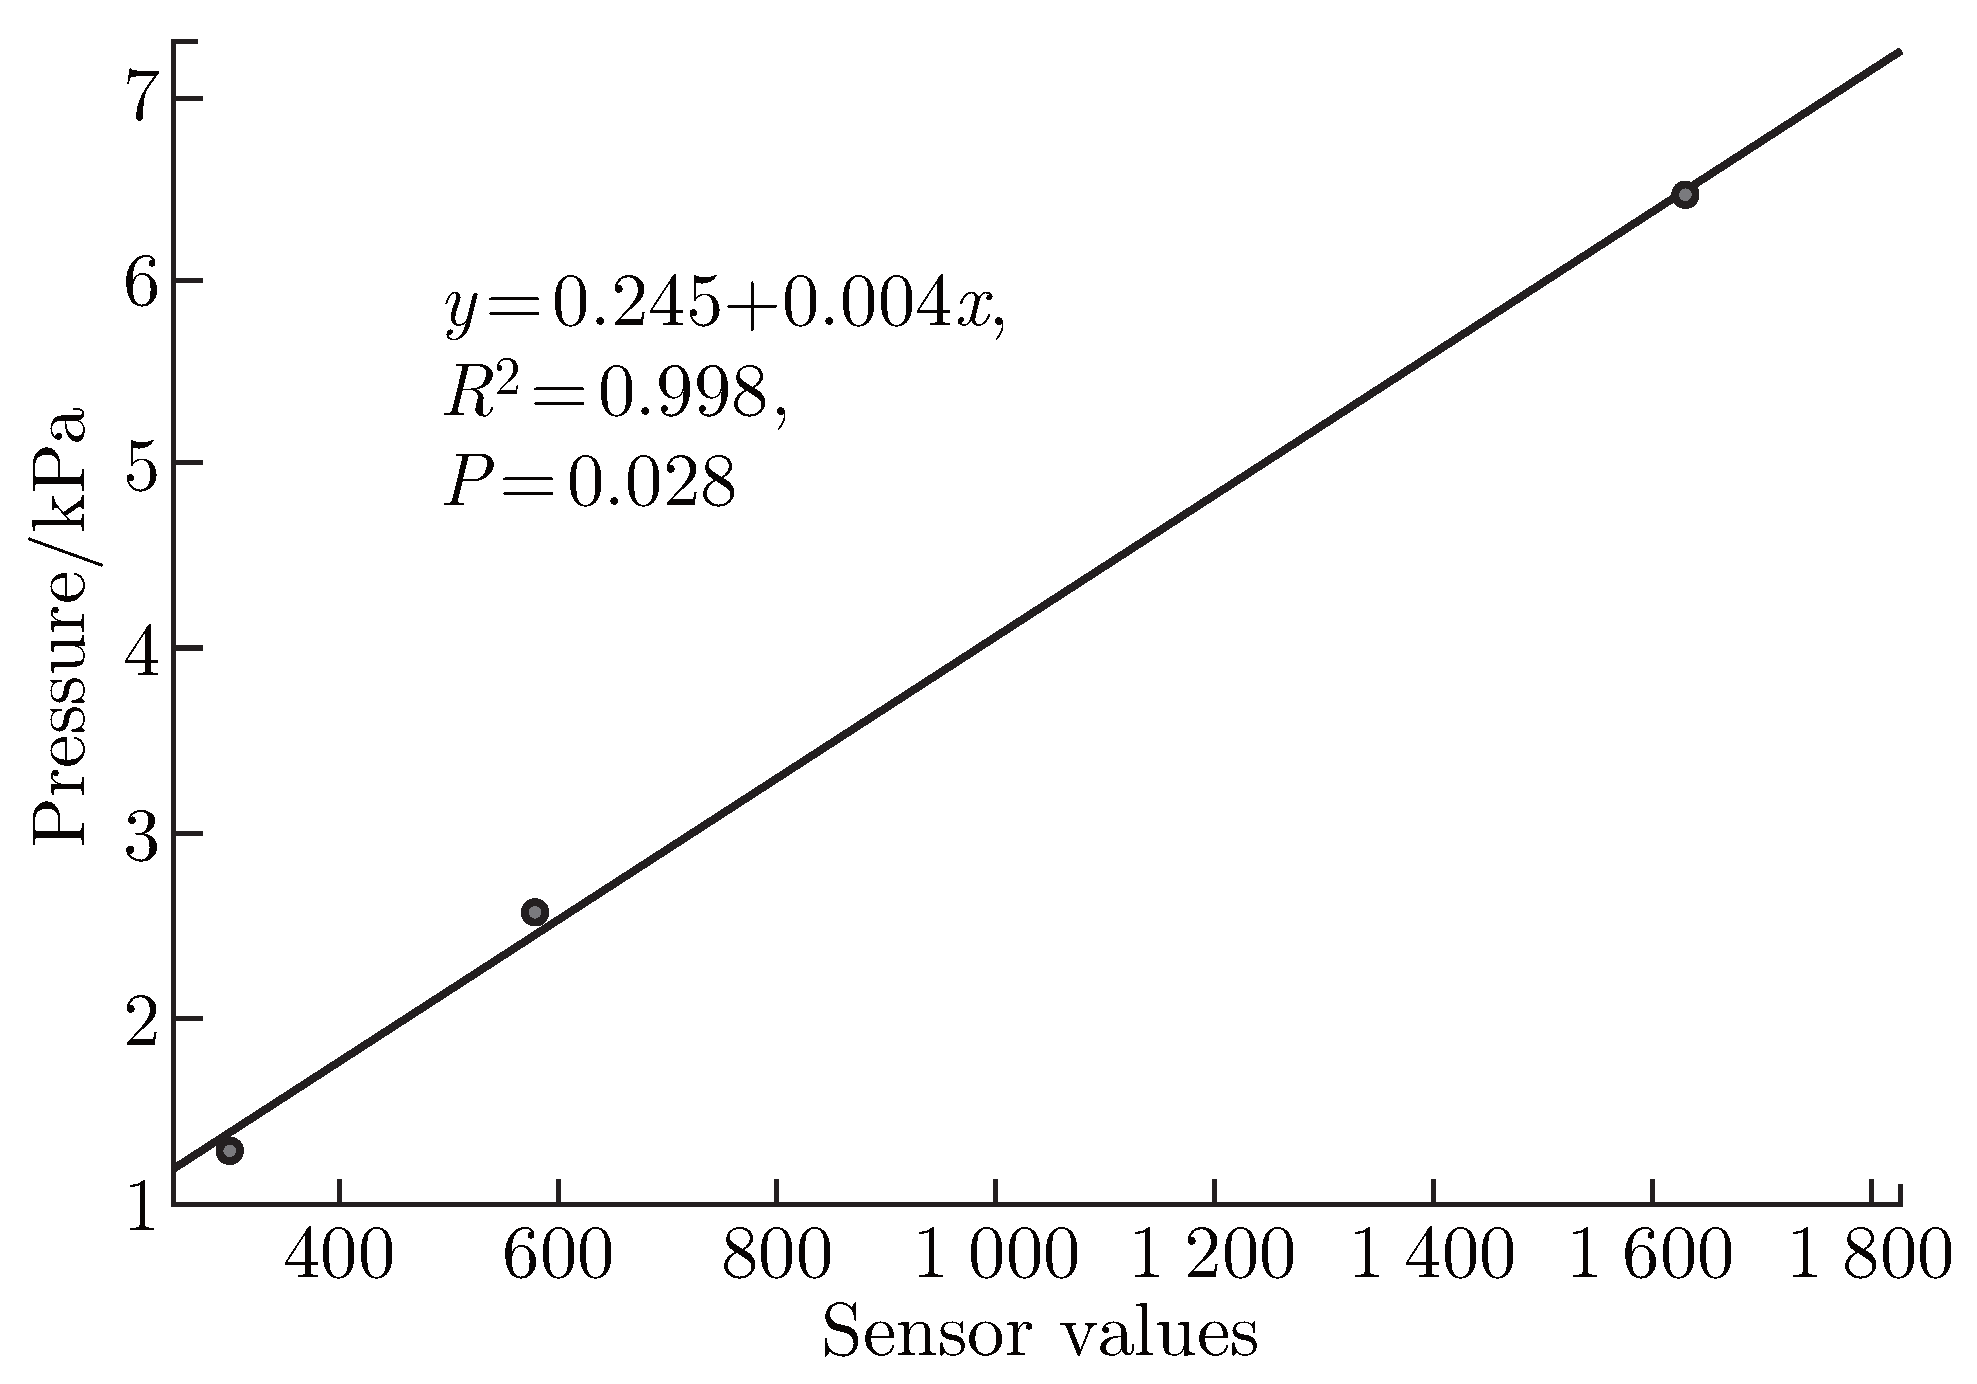
In order to obtain the corresponding pressure value based on the sensor readings, it is necessary to calibrate the sensor and perform unit conversions using different weights. The pressure linearity relationship of the sensor was tested using 10 g, 20 g, and 50 g weights, as depicted in Figure 6(d). A gasket was placed between the weight and the sensor, and the system was allowed to stabilise for a few minutes. Once the sensor readings reached a stable state, the corresponding values were recorded.
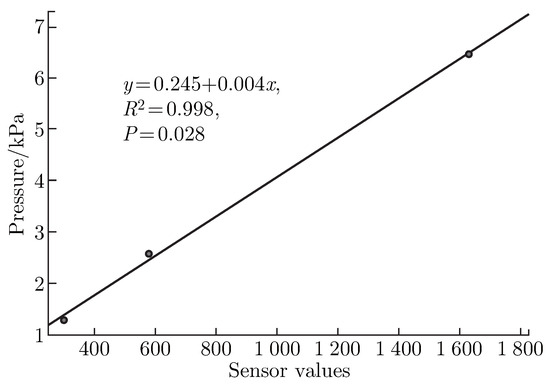
When a 10 g weight was applied, the sensor reading was found to be 300. By converting the weight of 10 g into a pressure value, considering a 1 mm diameter, the pressure was calculated as 1.292 86 kPa. Similarly, for a 20 g weight, the corresponding sensor reading was 578, which translated to a pressure value of 2.585 72 kPa with a 1 mm diameter. Furthermore, for a 50 g weight, the recorded sensor reading was 1631, resulting in a pressure value of 6.464 3 kPa with a 1 mm diameter.
The linear relationship between simulated values and pressure conversion was determined by importing the data into SPSS software. The obtained equation for this relationship is pressure value = 0.245+0.004* simulated value, as shown in Figure 7.
Figure 7.
The conversion relationship between sensor values and actual pressure values.
2.3.3. Experimental Protocol
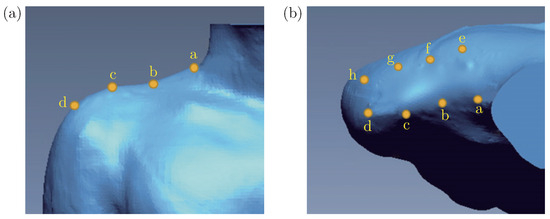
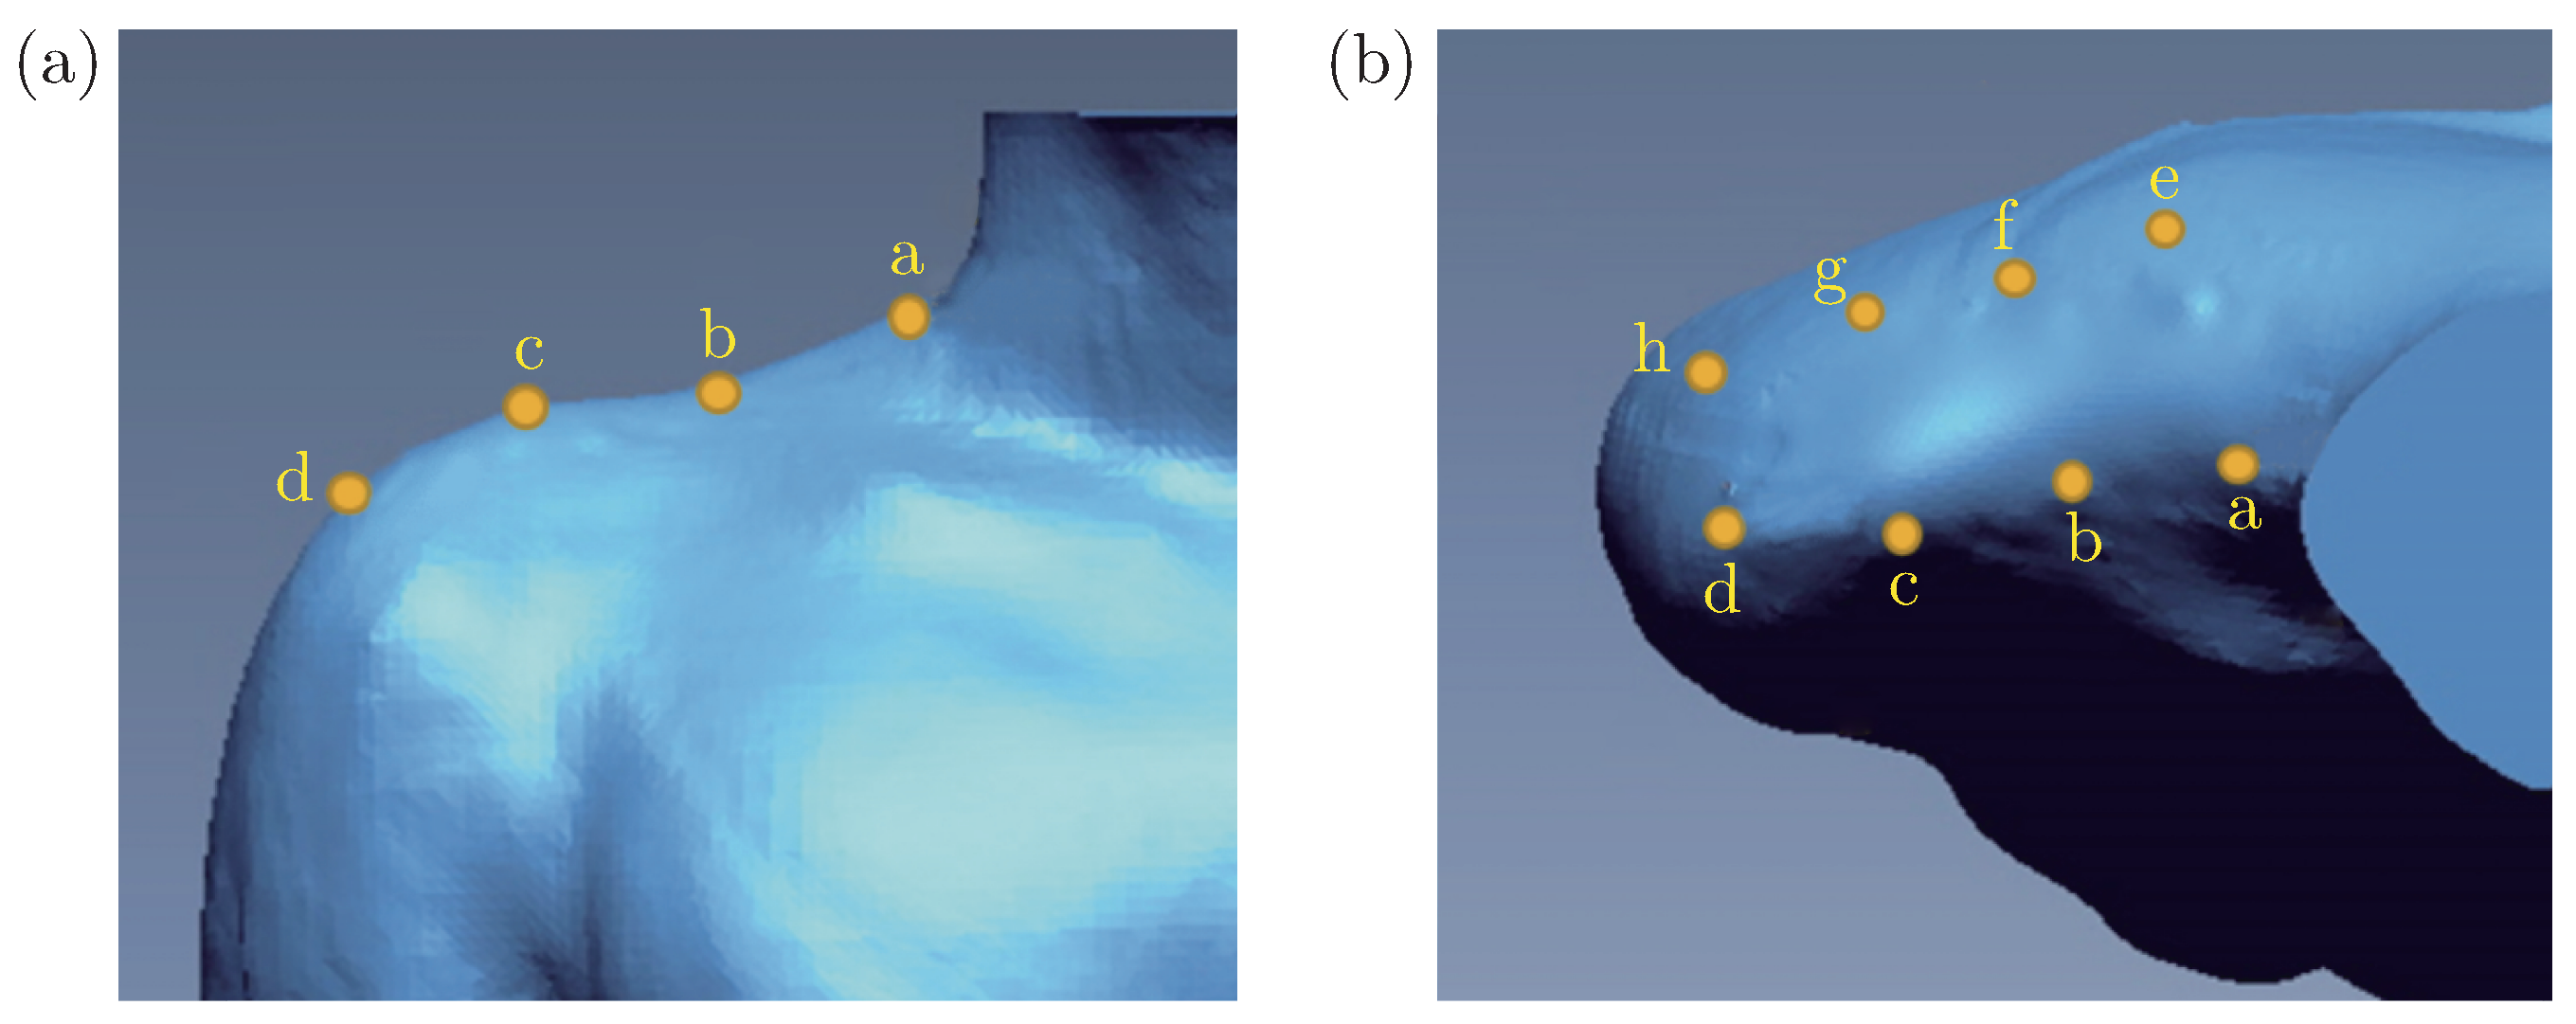
Selection of sensor locations: Eight points were chosen, consisting of four points from the lateral neck point to the shoulder point, and four points corresponding to the back of the posteriorly displaced shoulder. These points are labelled as a, b, c, d, e, f, and g, as illustrated in Figure 8.
Figure 8.
Front view and top view of the point selection of the sensor.
In this study, a total of 12 infertile young women aged between 18 and 25 years were selected. The participants were required to have a height within the range of 160±5 cm and a BMI between 18.5 and 23.9.
Firstly, two-dimensional images of the subjects’ shoulders were captured from the front and side angles. The lateral neck and shoulder points were then extracted from these images, and the angle values of the lines connecting these points to the horizontal and vertical lines were measured. The collected data was categorised to obtain information about the subjects’ shoulder shape, specifically focusing on the compression values while wearing pre- and post-optimised white sample garments.
In this paper, 12 infertile young women aged 18-25 years were selected and restricted to a height between 160±5 cm and a BMI between 18.5 and 23.9.
Initially, two-dimensional images of the subject’s shoulders were captured from frontal and lateral perspectives. From these images, the lateral neck and shoulder points were identified, and the corresponding angle values of the line connecting these points to the horizontal and vertical lines were obtained. The amassed data was then categorised to provide insight into the subject’s shoulder shape, which was further correlated with compression values associated with wearing both pre- and post-optimised white sample garments. During the garment-wearing process, the subject assumed four distinct postures, with each posture maintained for a duration of 60 seconds.
2.4. Suit Shoulder Pressure Comfort Physical Experiment
Concurrently, subjective evaluation of the three major areas of the shoulder was conducted, graded on a five-point scale. Upon completion of all four postures, the female suit-wearing experiment concluded.
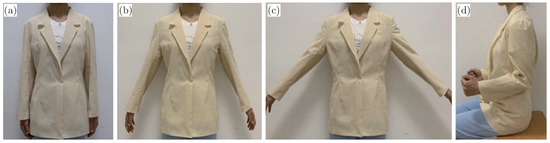
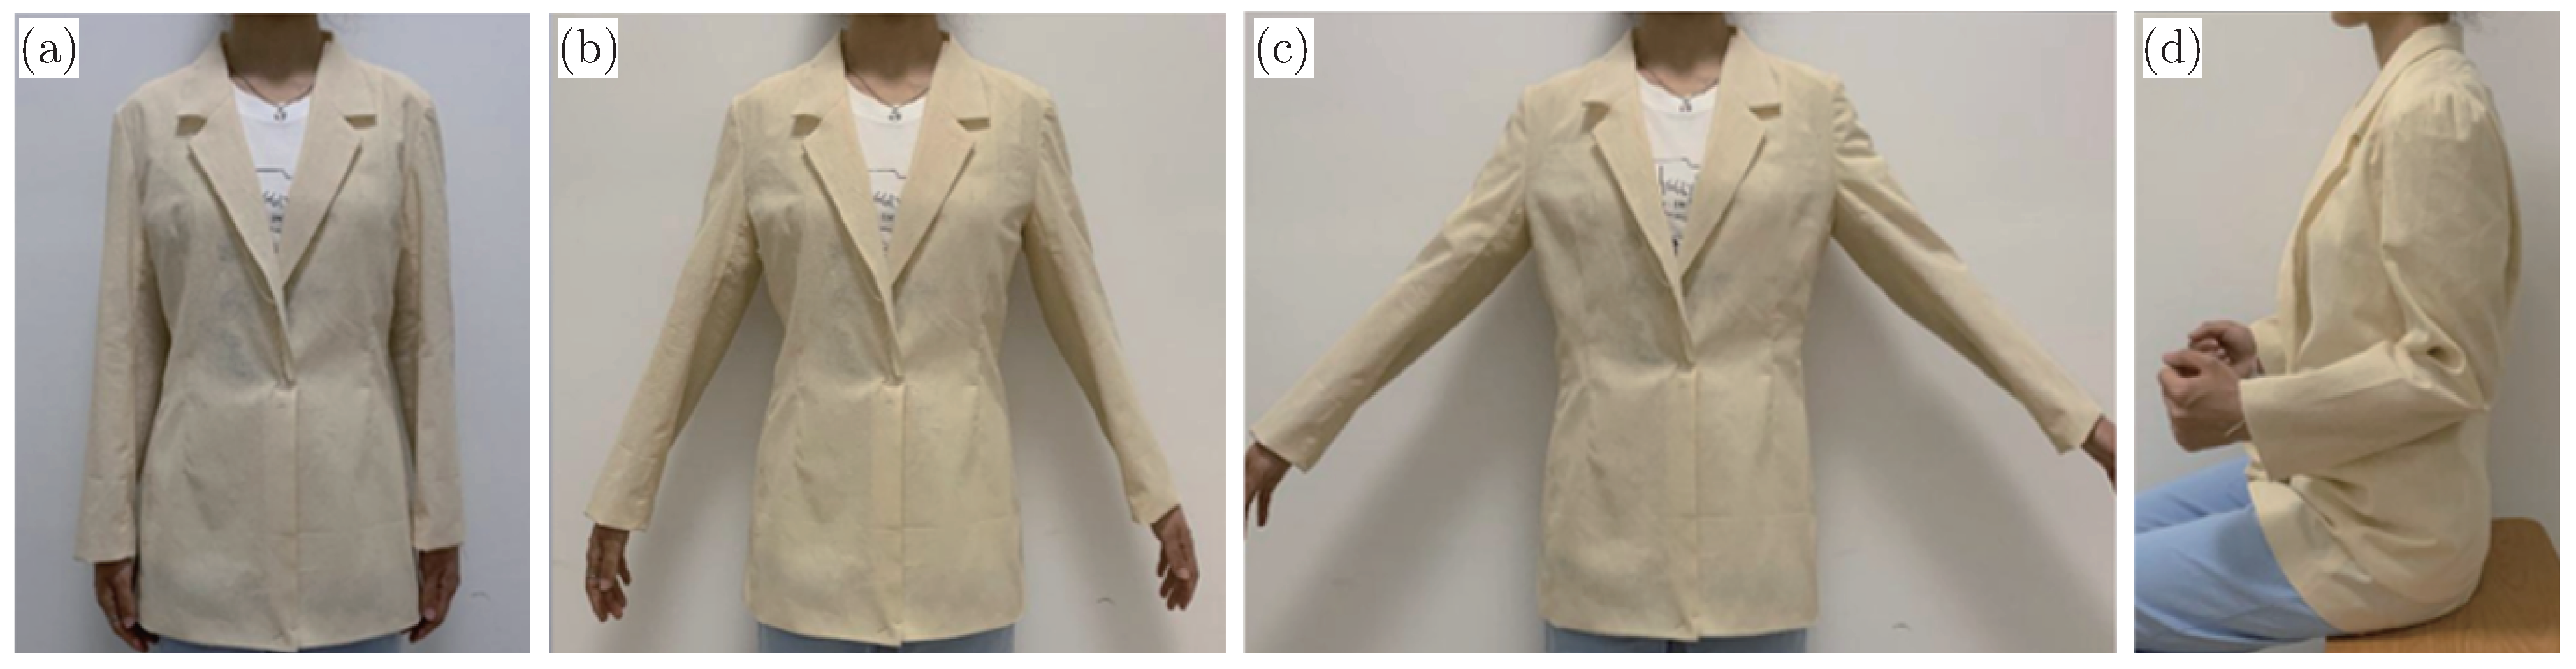
Four movements were selected according to the national standard workspace body dimensions combined with relevant literature: natural arm drop (A0), arm off body 30° (A1), arm off body 45° (A2), and seated forearm extension forward (A3), as shown in Figure 9.
Figure 9.
Diagram of the four postures (a) natural arm drop, (b) arm off body 30°, (c) arm off body 45, (d) seated forearm extension forward.
During the wearing process, the participants assumed four different postures, each of which was maintained for 60 seconds. Simultaneously, a subjective evaluation was conducted using a five-point scale (−2, −1, 0, 1, 2) to assess three major areas of the shoulder. This evaluation was carried out while the participants were in each posture. Upon completing all four postures, the wearing experiment for the female suit was concluded, as shown in Table 5.
Table 5.
Five-level scale evaluation categories and criteria.
3. Results and Discussion
3.1. Data Analysis of the Human Shoulder Form
3.1.1. Cluster Analysis
The shoulder slope angles obtained from three distinct planes, xoy, xoz, and yoz, were grouped together and examined individually.
The final shoulder slope angles in the xoz plane were observed to be concentrated at 11.18°, 4.19°, and −3.07°, with the highest proportion (100 samples) recorded at 4.19°. Analysis of the collected data reveals a prevalent tendency among the subjects in this study to lean forward, with the majority exhibiting a slight inclination towards this posture, as shown in Table 6.
Table 6.
The shoulder-slope angle clustering process in the xoy and zox planes.
3.1.2. Cross-tabulations
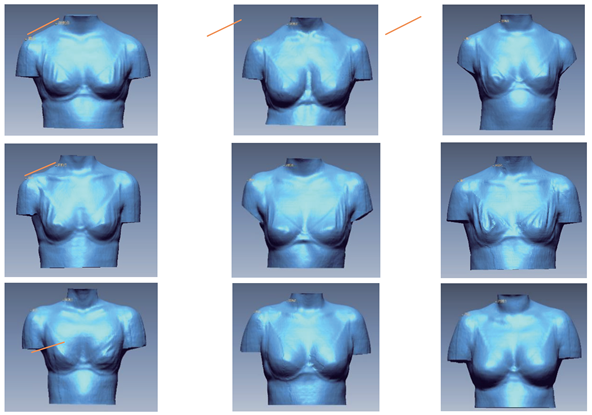
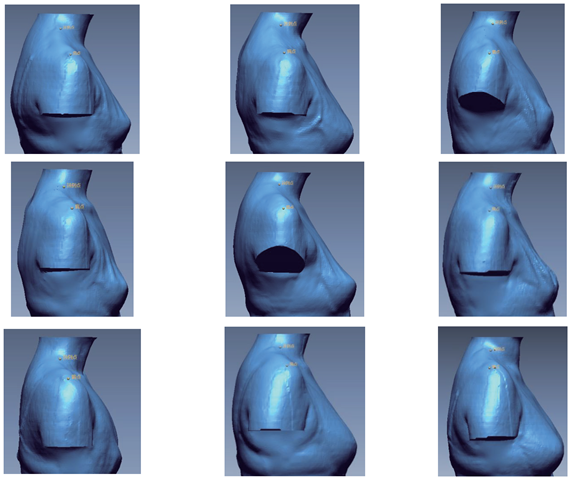
After conducting the K-means clustering, a cross-tabulation analysis was performed to determine the most extensive and representative features for the subsequent study. A total of nine feature samples were chosen for analysis using cross-tabulation. Among these samples, the more dominant ones were highlighted in yellow in Table 7. The figure depicts that the clustering centre of the overall dataset exhibits the largest median sample size, represented by the orange data. With the exception of the relatively small sample size in the white area, the feature samples from the remaining clusters serve as potential subjects for subsequent research investigations.
Table 7.
Cross tabulation of xoy and xoz, xoy and yoz.
Table 8 presents the frontal morphology of the sample. The shoulder oblique line demonstrates a predictable trend whereby a decrease in the xoy angle corresponds to a reduction in the frontal shoulder oblique angle. Notably, the orange line depicted in the lower figure of the table appears smoother.
Table 8.
Front view of clustering centres.
Table 9 illustrates the side profile shape. As the xoz angle decreases, the shoulder angle on the side undergoes a gradual decrease, followed by an increase in the opposite direction. In the accompanying figure, the orange line exhibits a higher position at the left endpoint, progressively ascending towards the right endpoint.
Table 9.
Side view of clustering centres.
3.1.3. Analysis of Two-dimensional Paper Sample Shoulder Slope Angle Data for Feature Samples
The obtained data pertains to the shoulder slope extracted from the paper sample’s nine feature samples derived from the cross-analysis.
The angle values of the xoy and xoz planes for both the front and back pieces were analysed separately, and the results are presented in Table 5. It was observed that as the angle of the xoy plane increased, the shoulder slope angle of the front piece of the paper sample decreased, while the shoulder slope angle of the back piece increased. Similarly, as the angle of the xoz plane increased, the shoulder slope angle of the front piece of the paper sample increased, while the shoulder slope angle of the back piece decreased. These findings contribute to a preliminary understanding of the relationship between the shoulder slope angles of the human body and the corresponding paper pattern angles. However, establishing a consistent linear expression for both the front and back pieces proves challenging. Therefore, a thorough analysis of the data was conducted, leading to the discovery of a consistent pattern of variation between the shoulder shape and the angles of the paper pattern, as well as the discrepancies in the paper pattern angles, as outlined in Table 10.
Table 10.
Extraction of shoulder slope angles for paper samples.
The resulting angle of the posterior paper sample is slightly larger than that of the Japanese cultural prototype, indicating that the subject’s shoulder shape is slightly more upright and exhibits a lesser degree of forward inclination.
The cumulative angles of the front and back pieces in the clustering centre exhibit a consistent trend: an increase in the shoulder slope angle in the xoy plane corresponds to an increase in the cumulative angles of both the front and back pieces of the paper sample, as shown in Table 11. This suggests that the shoulder point undergoes vertical movement in the xoy plane, influencing the cumulative angles of the front and back pieces of the paper sample. Similarly, an increase in the angle value in the xoz plane decreases the difference between the angles of the front and back pieces. This indicates that the shoulder point experiences horizontal movement in the xoz plane, consequently affecting the cumulative angles of the front and back pieces of the paper sample. Consequently, as the angle value in the xoz plane increases, the disparity between the angles of the front and back pieces of the paper sample decreases.
Table 11.
Calculated data for shoulder slope angle and angle difference.
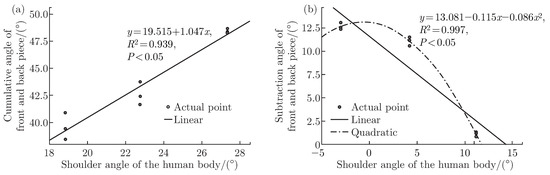
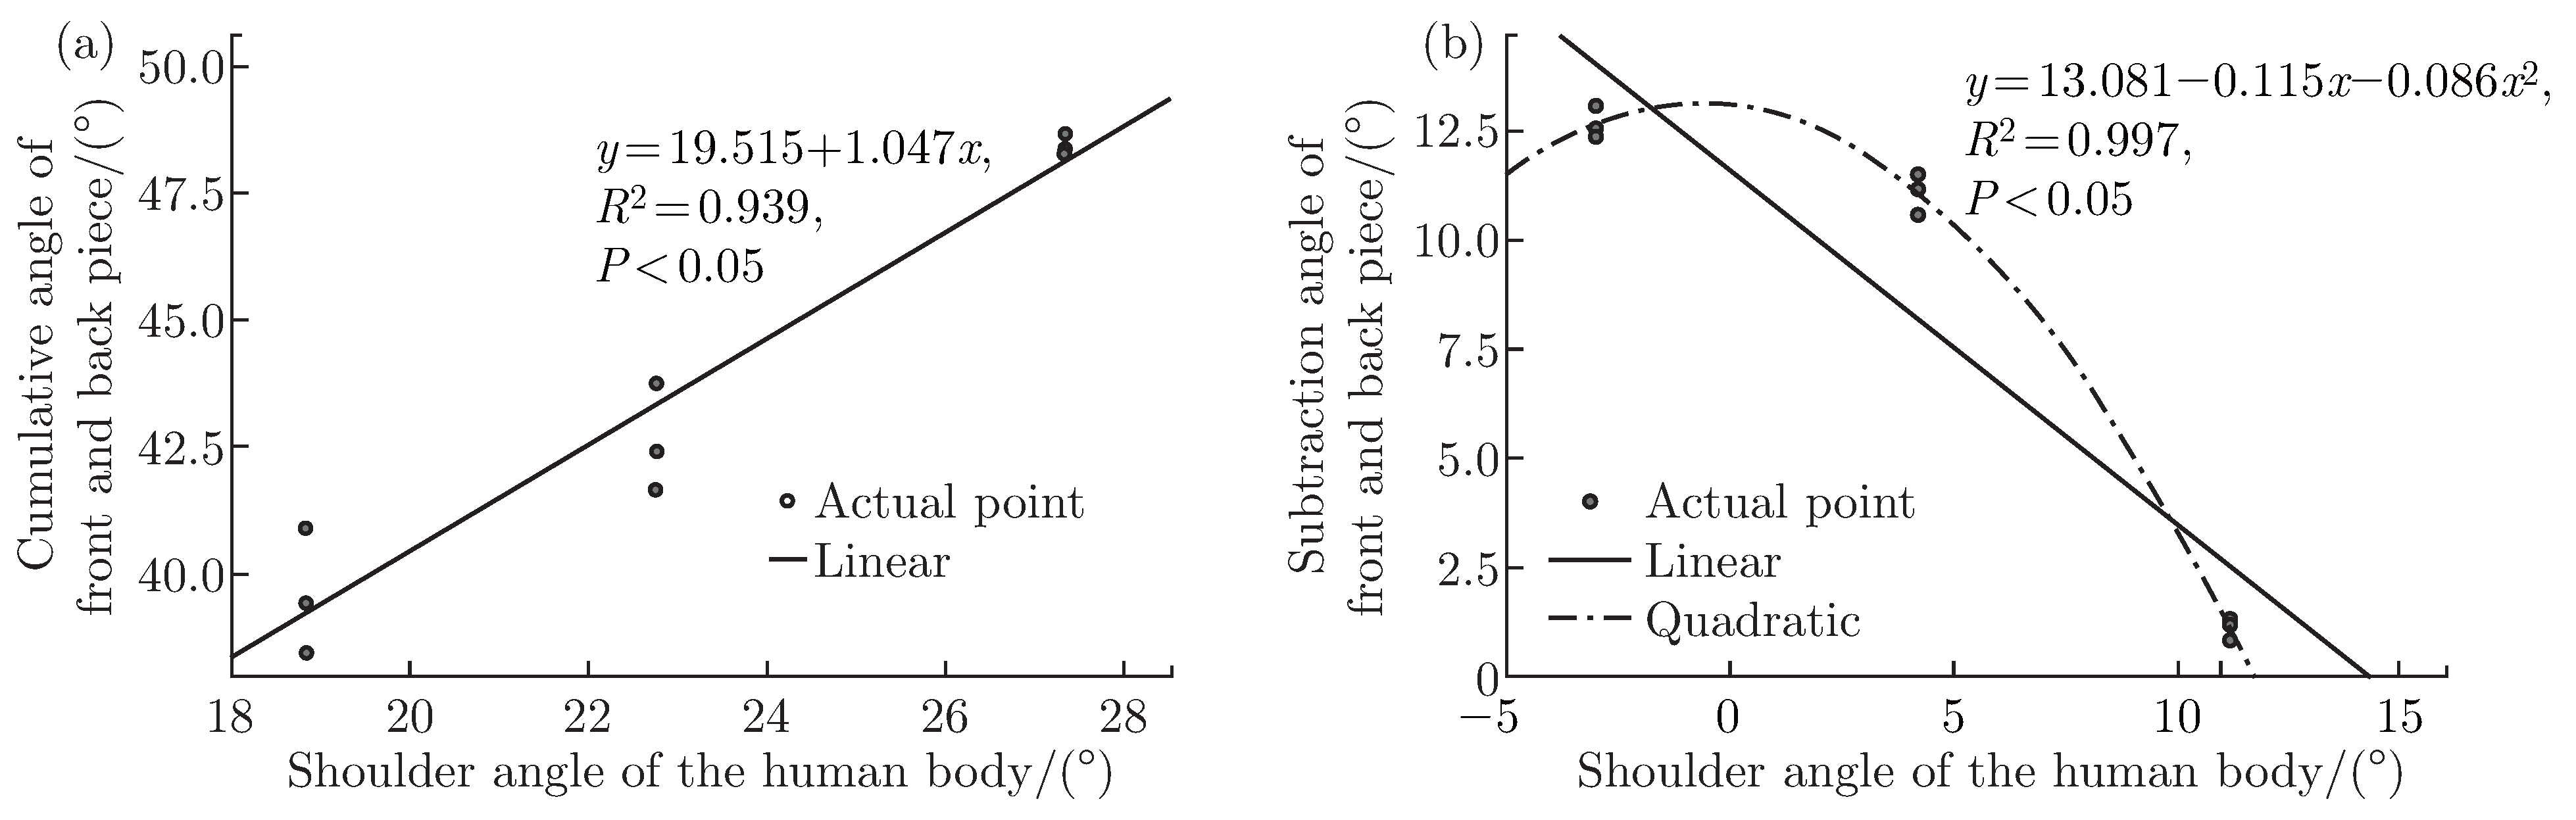
The relationship between the shoulder slope angle of the human body and the sum of the extracted shoulder slope angles of the front and back slices was modelled using linear regression in SPSS software. The linear regression equation for the scattered data was obtained as follows: paper sample angle sum = 19.515 + 1.047*xoy shoulder slope angle, with an R-squared value of 0.939. The linear relationship is visually represented in Figure 10.
Figure 10.
(a) The relationship between the Cumulative Angle of Front and Back Piece and the Shoulder angle of the human body, (b) The relationship between the Subtraction Angle of Front and Back Piece and the Shoulder angle of the human body.
By fitting the human shoulder slope angle and the difference between the extracted front and back slices of the shoulder slope angle, it was determined that the quadratic curve fit provided a better fit than the primary linear fit. The linear fit equation for the scattered data is as follows: paper sample angle difference = 11.625 - 0.811xoz shoulder slope angle. The secondary fit equation for the scattered data is as follows: paper sample angle difference = 13.081 - 0.115xoz shoulder slope angle - 0.086* (shoulder slope angle)2. The relationship between the curve fits is illustrated in Figure 10.
3.2. Virtual Experiment on Shoulder Pressure Comfort in Suits
In the CLO3D virtual fitting software, three specific feature samples (sloping shoulder, standard shoulder, and flat shoulder) were used for wearing experiments. Additionally, the compression values at critical shoulder points were measured.
Table 12.
Shoulder angle before and after optimisation of the sloping shoulder pattern.
Before optimisation, the pressure distribution of the sliding shoulder pattern aligned with the findings from preliminary research, showing a maximum pressure of 19.04 kPa at the neck side point and lower pressure values at the middle and shoulder points. After optimising the sample, the pressure at the lateral neck point is partially redistributed to the intermediate and shoulder points, reducing excessive pressure at the lateral neck point. This indicates a noticeable improvement in optimisation.
The pressure values in the CLO3D software are higher than those experienced in real-life scenarios, which could be attributed to differences in fabric properties between the simulation and actual fabric. Further investigation is necessary to delve into this matter.
Table 13.
Pressure values in the virtual centre before and after optimisation.
3.3. Actual Experiment on Shoulder Pressure Comfort in Suits
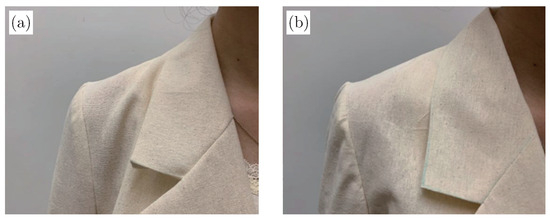
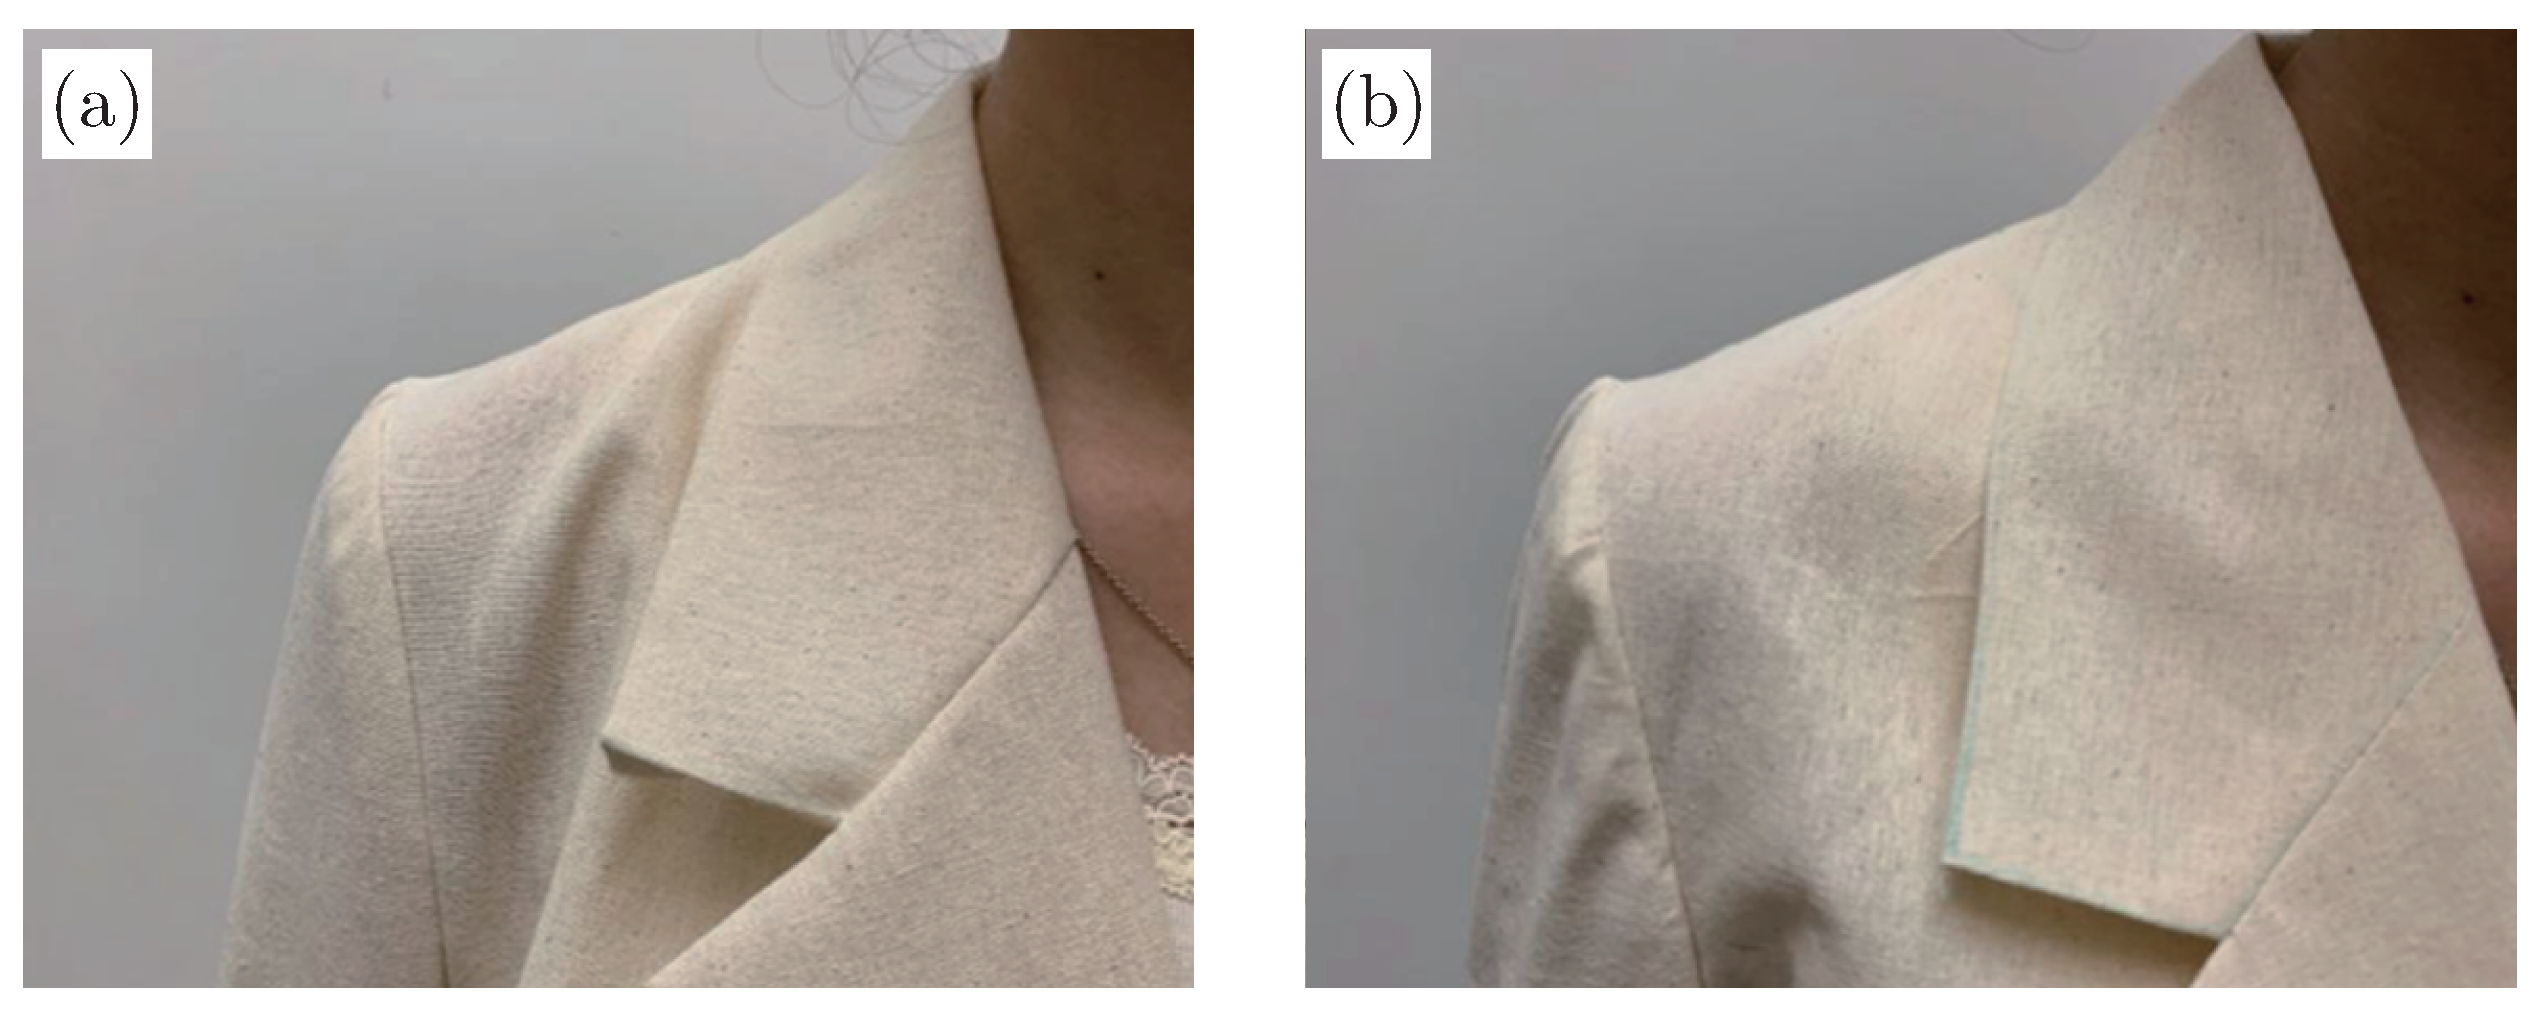
Regarding the appearance evaluation, the white sample garment exhibited sloping pleats on the shoulders before optimisation. However, these sloping pleats were noticeably reduced on the white sample after optimisation. The improvement achieved through optimisation is illustrated in Figure 11.
Figure 11.
Appearance of white billet wearing (a) before and (b) after optimisation.
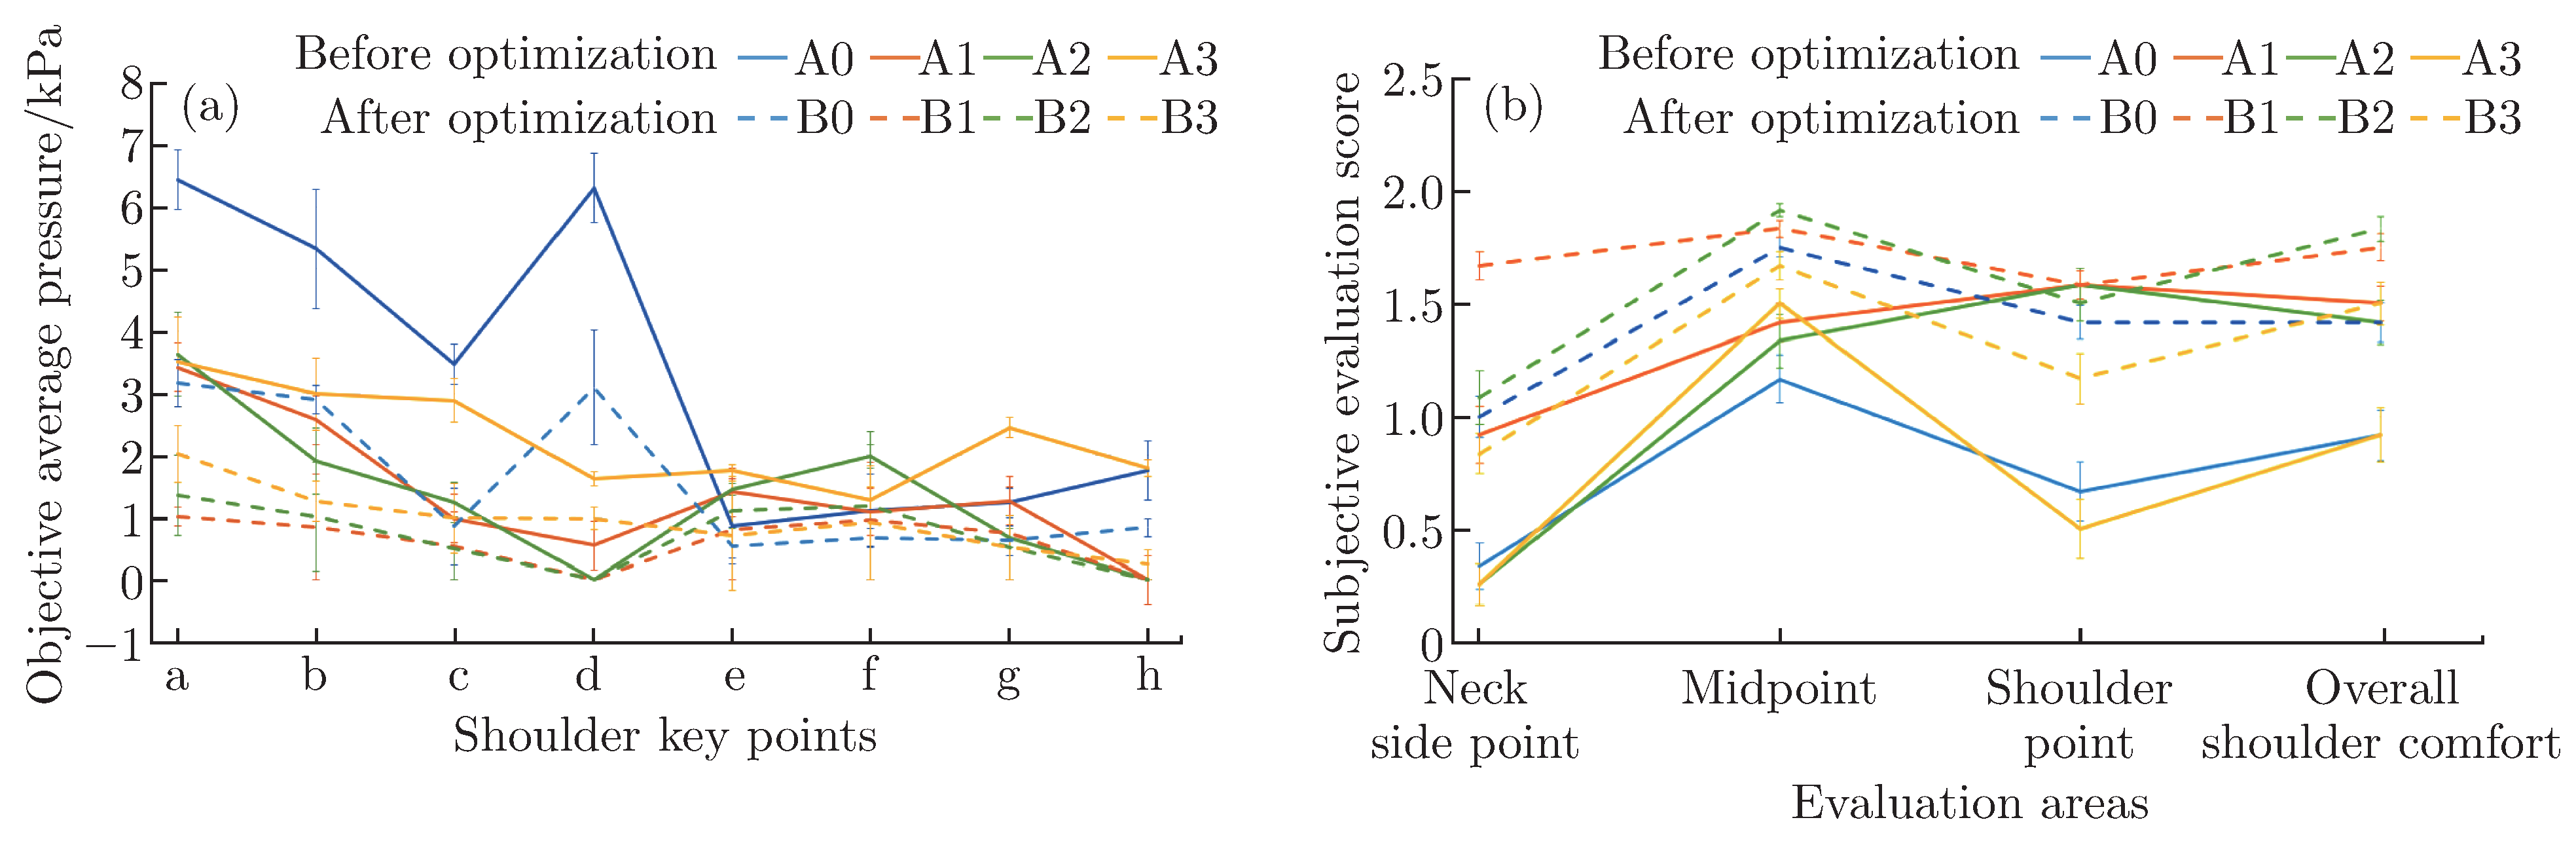
Figure 11 demonstrates that the optimised poses exhibit lower objective pressure values than pre-optimised poses. This finding validates the effectiveness of the sample optimisation. It is worth noting that the measured values are slightly lower than the actual situation due to using a single layer of white blank fabric, which does not fully replicate the actual suit simulation effect. The subjective scores of each posture after optimisation are higher than before, verifying the effectiveness of template optimisation.
3.4. Discussion
The research identifies the relationship between the shoulder slope angles of suit patterns and human shoulder shapes, formulating an equation to link body morphology with pattern design. The study aids consumers in selecting suits that fit their shoulder type comfortably. The derived equation offers tailors valuable data for creating suits tailored to young women’s body shapes. More in line with expected results. In contrast to other literature focusing on the appearance of women’s suits, this study emphasises the relationship between shoulder pattern design and body pressure comfort. By analysing the pressure comfort of different shoulder types, it offers a novel approach for young women to select suits, enabling them to purchase women’s suits with a comfortable shoulder fit. By correlating the shape of the human shoulder with the shoulder slope in the pattern design and establishing a relational formula, valuable reference data can be provided for tailors creating suits for young women.
Figure 12.
(a) The average pressure along the different sampling points (a-h). (b) The subjective evaluation of participants at each shoulder point.
Due to time constraints, the impact of fabric on the pressure of suits was not considered. Future research could select different fabrics to conduct tests on pressure comfort. Restricted by time and equipment, the number of participants recruited was insufficient, resulting in a limited sample size for validation.
The primary objective of this study was to address the issue of shoulder discomfort in women’s suits by optimising the shoulder pattern design. The results indicate that the optimised patterns have successfully improved the fit and comfort of the suits in the shoulder area. This discussion section aims to interpret these findings, compare them with existing literature, and highlight the implications for both research and practice.
The optimised shoulder patterns demonstrated a marked reduction in pressure points and an enhanced accommodation of the female shoulder’s natural slope and curvature. These findings suggest that the modifications made to the pattern design directly and positively impact wear comfort.
Our study builds upon previous research by focusing on the often-neglected aspect of comfort in women’s suit design. While many studies have concentrated on the aesthetic and structural aspects of women’s suits, our findings contribute to the understanding that comfort is a critical factor in the design process. The current study aligns with the notion that fit is a key determinant of satisfaction in clothing [6], but it extends this understanding by specifically addressing the shoulder area [14]. Watanabe explored the comfort thresholds for shoulder pressure; however, the study did not examine the pressure comfort between the human body and the garment. This research validates the pressure comfort experienced while wearing garments. Compared to studies on tight-fitting clothing [16,17,18,19,20], our research focused on the pressure effects of well-fitted garments, resulting in relatively lower pressure values.
Despite the positive outcomes, this study has its limitations. The sample size, while representative, could be expanded to include a wider range of body types and ages to further validate the generalizability of the optimised patterns. Additionally, the study focused on static comfort; future research could incorporate dynamic comfort assessments by analysing comfort during movement.
4. Conclusion
To address the shoulder discomfort associated with wearing women’s suits, this study analysed the shoulder shapes of participants and further optimised the suit patterns. The research ultimately demonstrated that the optimised patterns provided greater comfort than before optimisation. We have noticed that previous research on women’s suits has overlooked studies related to comfort. Here are five detailed research results:
(1) Analysis of the 201 collected samples revealed three distinct shoulder morphological characteristics. The xoy face shoulder slope angle for different shoulder types was concentrated at 27.33°, 22.75°, and 18.83°, while the xoz face shoulder slope angle for different shoulder types was focused around 11.18°, 4.18°, and 4.83°.
(2) A relationship between human body form and the shoulder slope angle of the paper sample was established. The following equations were derived: paper sample angle sum = 19.515 + 1.047xoy shoulder slope angle, and paper sample angle difference = 13.081 - 0.115xoz shoulder slope angle - 0.086*(shoulder slope angle)2.
(3) CLO3D simulations and physical wearing experiments confirmed the viability of panel optimisation for different shoulder shapes.
(4) This study used a thicker and heavier white-grey fabric as an experimental garment, which helped standardise the fabric’s influencing factors. However, it is important to note that compared to actual suits, the experimental garment’s overall weight is still relatively lighter, which could potentially result in lower measured pressure values.
(5) Due to time limitations, this study did not explore the effect of using different fabrics on suit pressure. Future research endeavours could consider incorporating various fabrics to investigate their impact on pressure comfort testing.
Based on the obtained results, designers can gain a deeper understanding of consumers’ shoulder shapes, which can inform the creation of more comfortable women’s suits that are better tailored to the wearer’s needs.
References
- Zhu Wenwen. A brief discussion on the sewing technology of flat head women’s suits [J]. Guide of Sci tech Magazine 2012, 81, 90.
- Han Mengge. Optimization of the appearance quality of striped women’s suits [J]. Journal of Zhejiang Textile & Fashion Vocational College 2022.
- XU Jun, GAO Lin, TAO Yanchen. Aesthetic preference for style details of women’s suits [J]. Journal of Xi’an Polytechnic University 2022, 36(6), 16–23.
- Tang Xi, Liang Jianfang. Study on the evaluation of women’s suit collar style based on kansei engineering [J]. Shandong Textile Science & Technology 2022, 63(2), 5–8.
- Yu Cuiping, Song Ying, Zhou Yang, et al. Sensory evaluation of women’s suit styles based on quantitative theory [J]. Woolen Textile Technology 2024, 52(04), 72–79.
- Wang Sijia, Wang Wei. Exploration of the charm factors of women’s suits based on sensory engineering [J]. Tianjin Textile Technology 2020, (05), 14–18.
- Zhang, J.H.; Wang, H.F. A study of women’s shoulders based on three-dimensional anthropometry [J]. Journal of Textile 2011, 32(05), 95–97. [Google Scholar]
- Nancollas H. In vitro studies of calcium phosphate crystallisation. In: Mann S, Webb J, Williams RJP, editors. Biomineralization. Chemical and biochemical perspectives. New York: VCH: 1989; 157-182.
- Li, Z. Analysis of factors related to the shoulder shape of women’s clothing [D]; Donghua University: Shanghai, 2012. [Google Scholar]
- Miyoshi M, Zheng R, Zhang H. Costume Styling. Theory [M]. Beijing: China Textile Press: 2006.
- Liu, R.P. Principles and Applications of Fashion Pattern Design: Women’s Clothing [M]; China Textile Press: Beijing, 2008. [Google Scholar]
- Yoshi, N.; Yuan, G.L. The human body and clothing: anatomy of clothing [M]; China Textile Press: Beijing, 2000. [Google Scholar]
- Jia, S. Research on the relationship between the outer contour shape of women’s suit shoulder and the structure of the pattern [D]; Wuhan Textile University: Wuhan, 2011. [Google Scholar]
- Denton, M.J. Fit, stretch and comfort [J]. Textiles 1972, (3), 12–17. [Google Scholar]
- Watanabe, R.; Nishimatsu, T.; Kanai, H. Basic consideration of influence of jacket weight on burden of shoulder [J]. Journal of Textile Engineering 2017, 63(3), 89–92. [Google Scholar] [CrossRef] [Scilit]
- Morooka, H.; Nakahashi, M. Effects of clothing pressure exerted on a trunk on heart rate, blood pressure, skin blood flow and respiratory function [J]. Sen i Kikai Gakkaishi (Journal of the Textile Machinery Society of Japan) 2009, 54(2), 57–62. [Google Scholar]
- Makabe, H.; Momota, H.; Ueda, K. A study of clothing pressure by the brassiere [J]. Journal of Japan Research Association for Textile End 2Uses 1991, 32, 416–423. [Google Scholar]
- Jiao, Z.N. Research and structural optimization of pressure comfort of fitted yoga clothing tops [D]; Shanghai University of Engineering and Technology: Shanghai, 2016. [Google Scholar]
- Hou, X.Z. Innovative design research on pressure comfort of yoga sports underwear [D]; Guangzhou University: Guangzhou, 2018. [Google Scholar]
- Zhang, B.N.; Xu, J.; Song, H.Z. Study on the Relationship of Knitted Female Underwear Pressure Comfort and Loose Quantity [J]. Journal of Fiber Bioengineering & Informatics 2016, 9(4), 223–236. [Google Scholar] [CrossRef] [Scilit]
- Yu, W. A. Study on biomechanical models of sports bra’s shoulder straps [J]. Journal of Fiber Bioengineering & Informatics 2013, 6(4), 441–451. [Google Scholar] [CrossRef] [Scilit]
- Wang, Y.X.; Liu, Z.D. Virtual clothing display platform based on CLO3D and evaluation of fit [J]. Journal of fiber bioengineering and informatics 2020, (1), 13. [Google Scholar] [CrossRef] [Scilit]
- Suo, L.; Lu, R.C.; Lin, G.D. Analysis of factors influencing consumers’ purchase intention based on perceived value in e-commerce clothing pre-sale model [J]. Journal of fiber bioengineering andinformatics 2020, (1), 13. [Google Scholar] [CrossRef] [Scilit]
- Tong, L.; Carolina, Q.R. Consumer’s functional values in luxury fashion consumption: a cross-cultural comparison between australia and China [J]. Journal of Fiber Bioengineering and Informatics 2022, 15(3), 171–184. [Google Scholar] [CrossRef] [Scilit]
- Song, G.H.; Cui, J.A. Advanced mathematics, second edition; Petroleum Industry Press, 2013. [Google Scholar]
- Xiao, X.; Li, Q.M. Research progress of clothing pressure theory and its testing method [A]. Journal of Tianjin University of Technology 2010, 29(4), 8–52. [Google Scholar]
- Pang, R.D, Cui, M.H. (2023). Research on Shoulder pressure Comfort of Suits for Young Women and Its Pattern Optimization. In Y. Li & M. Z. (Eds.), 16th Textile Bioengineering and Informatics Symposium Proceedings (TBIS 2023). Textile Bioengineering and Informatics Society Limited (TBIS). Curran Associates, Inc.



© 2025 Textile Bioengineering and Informatics Society. This article is an open access article distributed under the terms and conditions of the Creative Commons Attribution (CC BY) license (https://creativecommons.org/licenses/by/4.0/).