


Abstract
Near-field communication (NFC) is a short-distance wireless data transmission technology with potential for wearable sensors. Xu et al. (2020) developed a battery-free smart textile patch with an NFC antenna and a temperature sensor (STP-NFC) [1]. To address potential issues with the testing protocol that could affect the accuracy and precision of temperature measurement from the STP-NFC, a validation experiment was conducted at a fixed room temperature of 20 °C. This was done using a commercial IR imager to compare the results with the STP-NFC results. Results showed excellent accuracy with an average temperature of 21.50 °C and a difference of only 0.36 °C from an IR imager’s reading. The STP-NFC also had excellent precision with a small standard deviation of 0.83. Optimal performance was achieved with a 6 mm distance, a 150-second time interval, and a 4-second scanning duration for each scan. Additionally, the gage repeatability and reproducibility (R&R) study has been conducted to assess the STP-NFC measurement system’s consistency, and the STP-NFC’s reproducibility has been demonstrated. These results have implications for developing reliable wearable medical monitoring devices using NFC technology.
1. Introduction
Peter T. Lewis introduced the Internet of Things (IoT) in the 1980s. It refers to the wireless connection of operators and objects to optimise remote control and management [2]. As the IoT advances, more items are being tagged for identification, automation, monitoring, and control [3].
NFC is a promising IoT technology that has recently received significant attention for its potential use in point-of-care (POC) devices. It is a wireless data transmission method used for short distances, with a range of up to 20 centimetres and typically 10 centimetres [4]. The NFC system comprises two parts: a transmitter and a receiver. When an NFC-enabled device is brought close to an NFC tag, the tag’s antenna picks up the signal from the device and responds with its data.
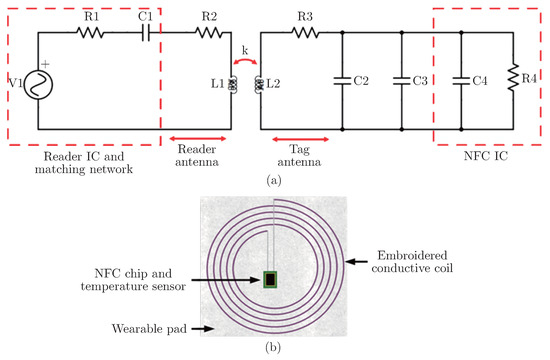
The NFC antenna can be placed on various materials, including textile materials, making it an ideal transmission method for wearable sensors. Figure 1(a) shows the structure of a typical NFC system [5].
Figure 1.
(a) Structure of NFC system [5] (b) Structure of the STP-NFC.
Equipped with NFC functionality, Xu et al. (2020) have developed an STP temperature sensor (STP-NFC) consisting of a temperature sensor chip and textile coils, shown in Figure 1(b). In the STP-NFC, the embroidered conductive coil connected to the NFC chip is both an antenna and an energy harvester. An embroidered coil is connected to an NXP NTAG NFC chip, which powers an MCU chip and a temperature sensor array using harvested energy. A smartphone with NFC can power the STP-NFC system [1]. The STP-NFC can be attached to the human body using medical tape, and the data can be easily read using a mobile phone app. Due to its small size, flexibility, and ease of use, it has the potential to be developed into a POC device for medical health care. By enabling real-time temperature tracking in various medical applications, such as patient monitoring [6], vaccine storage [7], and medication tracking [8], NFC facilitates precise and efficient temperature management, significantly leading to improved patient care and safety [9]. Meanwhile, since it utilises embroidery methods, STP-NFC can be produced in wearable and adaptable forms. Compared to traditional sensors with their drawbacks of complexity, low sensitivity, limited lifespan, and lack of compatibility with the human body, flexible sensors for wearable health monitoring have become crucial and make STP-NFC even more promising [10].
However, the accuracy and precision of temperature measurement obtained from the STP-NFC have not yet been validated, which may be influenced by various testing protocols, such as the distance between the mobile phone and the STP-NFC, the time interval between measurements, and the duration of contact during each measurement. These factors could potentially affect the performance of the temperature measurement process, yet their effects have not been confirmed.
Meanwhile, the repeatability and reproducibility of the STP-NFC have not yet been analysed. Repeatability presents the variations caused by the device, and it can be measured when a single operator repeatedly measures the same object using the same procedure under consistent conditions. On the other hand, reproducibility refers to variations caused by the measurement system, indicating the differences arising from different operators measuring the same object multiple times using the same gauge and under consistent conditions. Higher levels of repeatability and reproducibility correspond to better performance of the STP-NFC [11].
Therefore, this paper aims to address this issue by conducting a systematically designed experiment that compares the temperature measurements obtained through the STP-NFC with those obtained using an IR imager. By doing so, the study seeks to provide a reliable validation of the temperature measurement capabilities of the STP-NFC while also exploring how potential factors may influence the performance of these measurements. Moreover, it analyses the repeatability and reproducibility of the STP-NFC. This investigation explores its potential as a wearable temperature-detecting device in various fields.
2. Methodology
2.1. STP-NFC
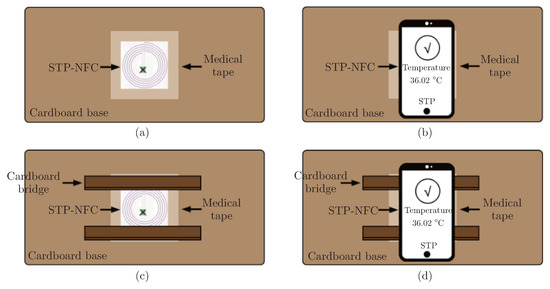
The STP-NFC was attached to the target surface with medical tape, and the STP app was used with an Android phone with NFC capabilities. The STP-NFC was scanned with the phone to read the results. If the scanning distance was larger than 0, cardboard bridges with a thickness of 2 mm were used to assist in controlling the distance between the STP-NFC and mobile phone, as shown in Figure 2.
Figure 2.
Procedure of using the STP-NFC (a) Placement of the STP-NFC on target surface when scanning distance is 0 mm; (b) Scanning the STP-NFC with mobile phone when scanning distance is 0 mm; (c) Placement of the STP-NFC on target surface with cardboard bridges; (d) Scanning the STP-NFC with a mobile phone with cardboard bridges.
2.2. IR Imager
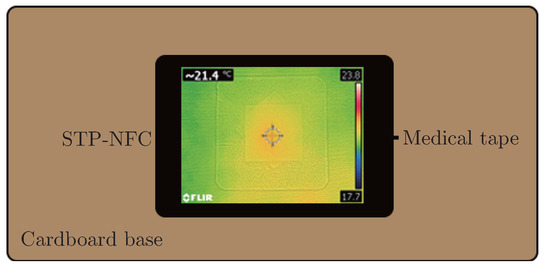
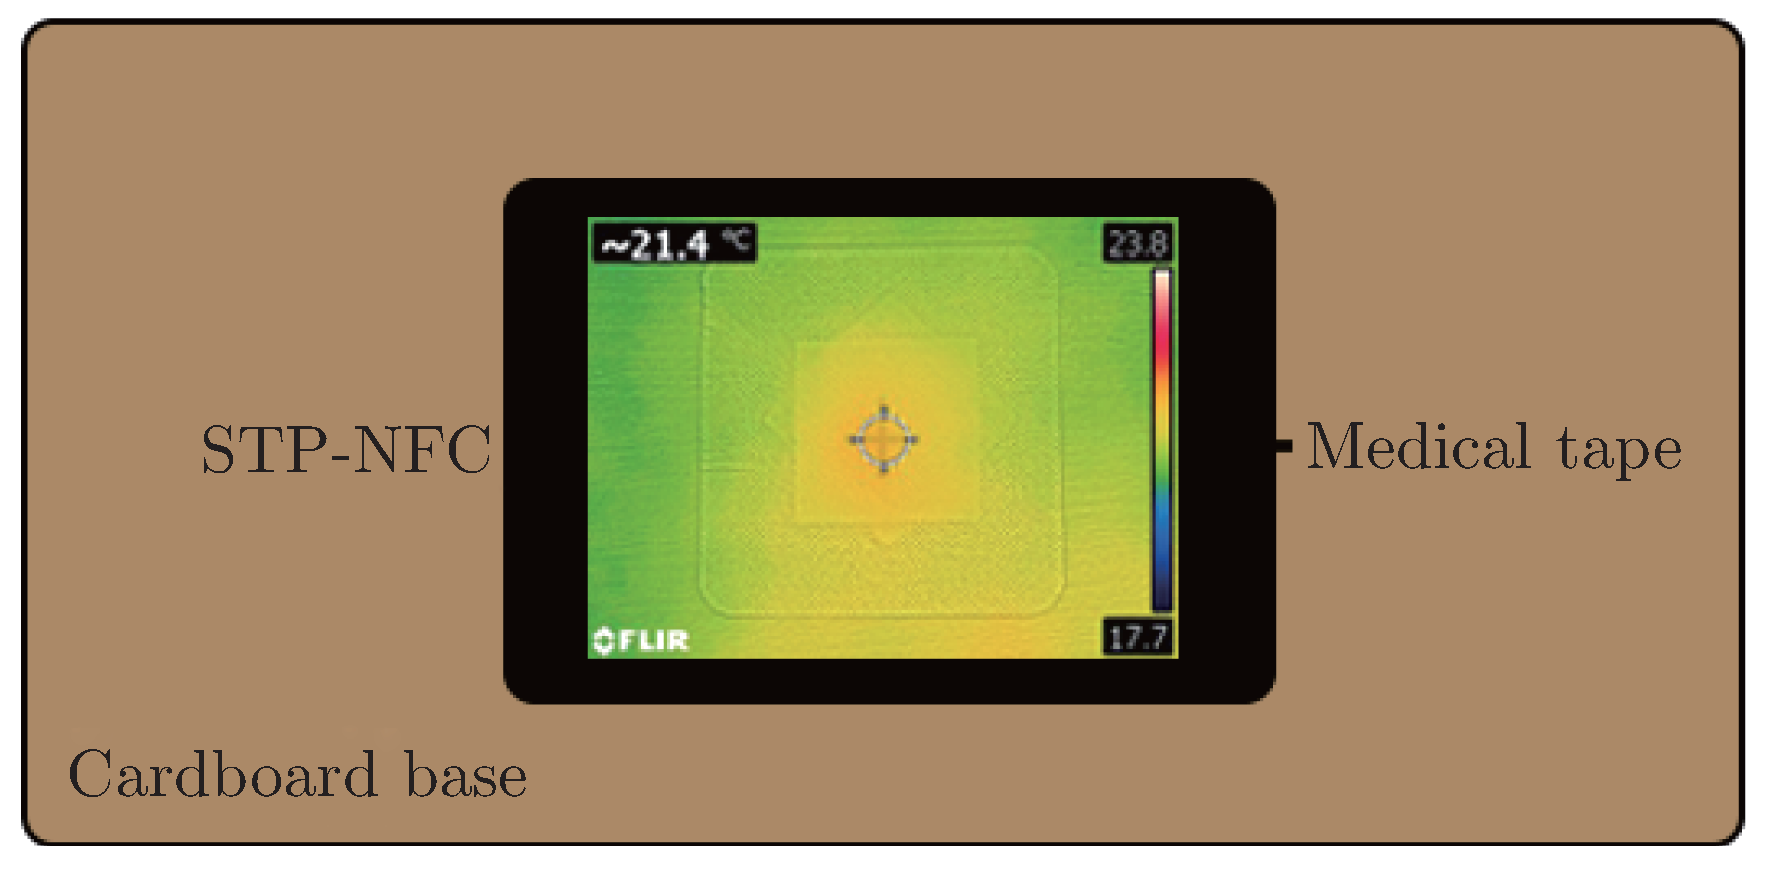
A commercial IR imager was used to validate the performance of the STP-NFC. The camera focused on the NFC chip marked with an “X” during the pre-experiment. The temperature of the focus area was recorded and shown in the top left corner of Figure 3.
Figure 3.
Procedure of using IR imager.
2.3. Experimental Design
2.3.1. Optimal Procedure Study
Before implementing STP-NFC on the human body, validating its accuracy and precision was crucial due to potential influences from NFC energy harvest and phone heat radiation. Rapid temperature measurements and avoiding prolonged phone proximity to the sensor were recommended to minimise errors, leading to the development of optimised experimental procedures. Tests were conducted to determine the optimal:
- Distance between the mobile phone and device surface
- Time interval between each scan
- Scanning duration of each scan
In this experiment, for each factor, there were five level values shown in Table 1. ‘Distance’ denoted the gap between the NFC-enabled mobile phone and the STP-NFC, ‘time interval’ represented the duration between each scanning action, and ’scanning duration’ referred to the time the phone spent scanning the STP-NFC.
Table 1.
Factor information for optimal procedure experiment.
For each setting (fixed distance, time interval and scanning duration), the scanning using a mobile phone would repeat three times. Therefore, there were a total of 5×5×5×3 = 375 scans.
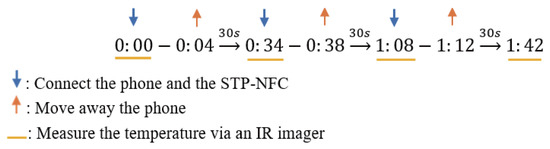
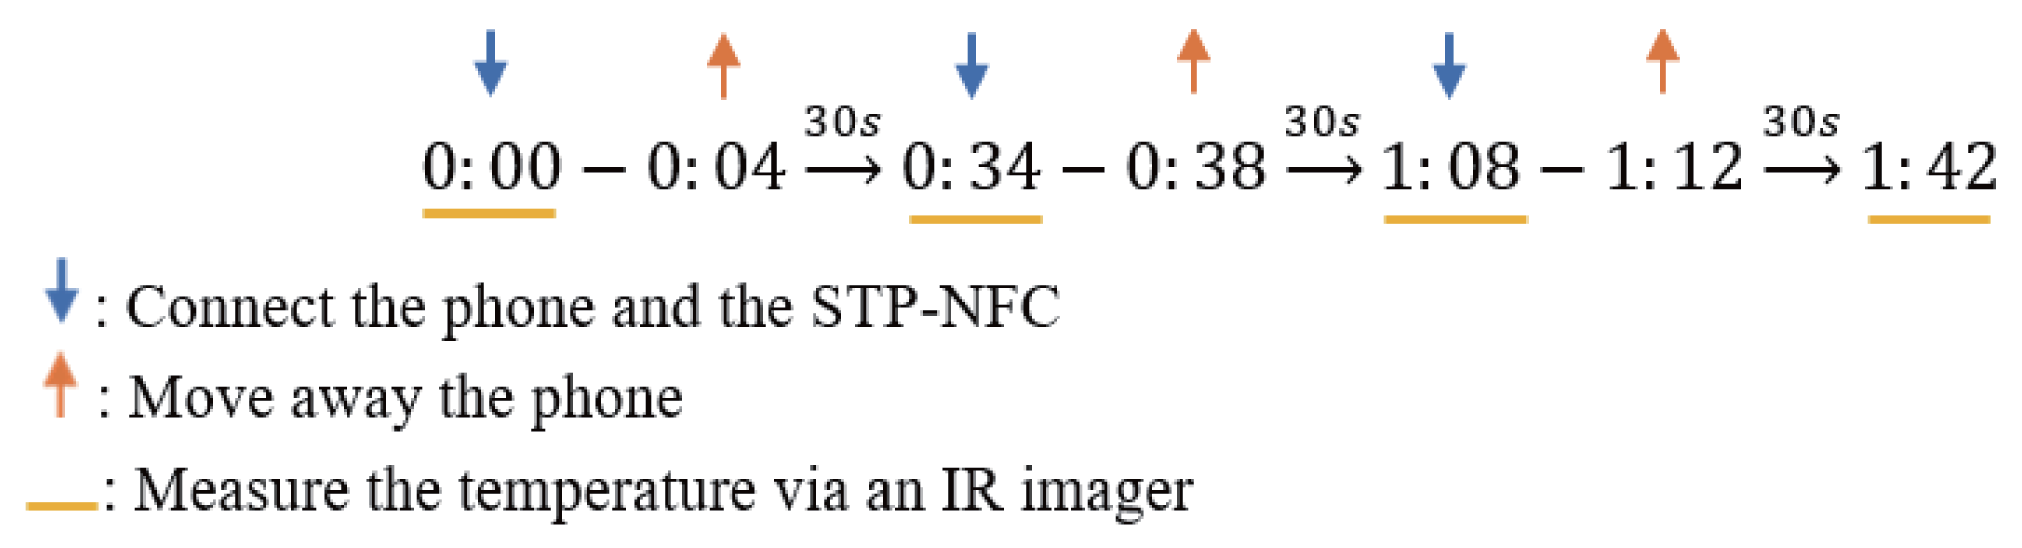
An IR imager aided in determining the temperature of the cardboard surface. Temperature results from the IR imager and the STP-NFC were compared to identify the optimal distance, time interval, and scanning duration. Figure 4 illustrates the time points for temperature measurements using the STP-NFC and IR imager.
Figure 4.
Time points for measuring temperature (30 s time interval, 4 s scanning duration).
2.3.2. Repeatability and Reproducibility Study
An R&R study was conducted following the determination of the optimal procedure for temperature measurement using the STP-NFC. This experiment involved nine STP-NFCs and five operators. Each operator independently tested each STP-NFC using the established optimal procedure. Three repeated scans were performed for each device, resulting in 9 × 5 × 3 = 135 scans, as shown in Table 2.
Table 2.
Method For R&R Study Experiment For STP-NFCs.
Meanwhile, an R&R study for the IR imager was also conducted to compare it with the R&R of the STP-NFCs. It should be noted that since there was only one IR imager, a gage R&R study for multiple operators and one device was conducted. The five operators used the single IR imager to measure the surface temperature, repeating the process three times, precisely at the same time when they were using the nine STP-NFCs to monitor the temperature. Therefore, there were 5 × 3 × 9 = 135 scans.
The results were analysed with the help of Minitab 20 and Excel. Using Minitab 20, X-bar charts and S (Standard Deviation) charts for both the STP-NFCs and the IR imager were obtained to assess the abilities of the devices and the operators to make relatively consistent measurements. Additionally, a two-way gage R&R study was conducted using the analysis of variance (ANOVA) method for the STP-NFCs’ results. This allowed for calculating the sum of squares (SS) from various sources, including parts, operators, the interaction between operators and parts, repeatability, and total variance. SS represents the variability from various sources compared to the overall mean. The relationships among these were represented in Equation (1), shown below [12]:
SSTotal = SSPart + SSOperator + SSOperator∗Part + SSRepeatability
Meanwhile, the variance components due to different sources were also obtained using Minitab 20, and their relationships were represented in Equation (2) below [13]:
where σTotal2 is the total gage R&R variance, σRepeatability2 is the component of variance due to the device, σReproducibility2 is the component of variance due to the measurement error.
As for the results from the IR imager, as mentioned before, since there was only one device, only a gage R&R study with multiple operators and one part could be conducted. In this case, the variance component of the operator can represent the reproducibility, while the variance component of the error can represent the repeatability [14]. Using the R&R results obtained from Minitab 20, the precision-to-tolerance (P/T) ratio was calculated using Equation (3) shown below [15]:
P is the precision, T is the tolerance, 6σ is the study variation (six times the standard deviation), USL is the upper specification limit, and LSL is the lower specification limit.
The tolerance band was the criterion by which the device was considered accurate and acceptable, depending on its intended use. For example, van Netten et al. (2014) suggested that the optimal cutoff diagnostic value for detecting diabetes-related foot complications was a 2.2 °C difference between contralateral spots on the feet. For this reason, the tolerance band used to determine the device’s suitability for detecting diabetes-related foot complications was set at 2.2 °C [16].
2.4. Experiment Setup
The equipment required for the experiment was as follows.
- STP-NFC
- Mobile phone (OPPO A16s) with NFC function and STP APP
- Infrared imager
- Camera holder
- Cardboard bridges (with 2mm thickness)
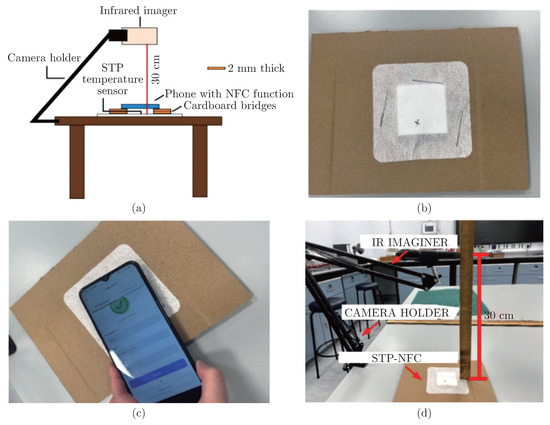
Figure 5(a) shows the setup for determining the optimum procedure, with the STP-NFC securely affixed to the cardboard surface. The NFC chip’s location was marked with an “X”, and the best contact location for the phone and STP-NFC was identified in the pre-experiment. Figure 5(b) illustrates this process with line labelling on the sticker. At this optimal location, shown in Figure 5(c), the required scanning time was no longer than 1 second, allowing the connect time to be disregarded in further experiments. An IR imager was used to determine the surface temperature of the cardboard between each measurement, as shown in Figure 5(d), with the camera fixed 30 cm above the STP-NFC and focused on the chip (x point).
Figure 5.
(a) Overall setting for determination of optimal procedure (with 4 mm distance) Experiment setup procedures; (b) The STP-NFC stuck on the cardboard, with labelled chip (x) and optimum phone position (line boundaries); (c) The phone connected to the NFC chip at the optimum location; (d) IR imager setting.
2.5. Experimental Testing Procedure
After setting up and conducting the pre-experiment, the experiment was processed as outlined below:
- The first step was determining how the distance between the mobile phone and the STP-NFC surface influenced the temperature measurement results: 0 mm, 2 mm, 4 mm, 6 mm, and 8 mm. Each distance was repeated three times.
- The second step was determining how the scanning time duration influenced the temperature measurement results: 2 s, 4 s, 6 s, 8 s, and 10 s. Each time duration was repeated three times.
- The third step was to determine how the time interval between each scan influenced the temperature measurement results: 30 s, 60 s, 90 s, 120 s, and 150 s. Each time interval was repeated three times.
The experiment was conducted in the Textile Testing Laboratory at the University of Manchester, with a controlled room temperature of 20 °C. During each scanning, the mobile phone was positioned at the optimal location identified in the pre-experiment, and readings were recorded from the STP APP and the IR camera. At the end of each scanning duration, the phone was moved away from the STP-NFC, and subsequent scanning was repeated based on the designated time points introduced in Chapter 2.3.1.
2.6. Data Analysis
The experimental results were systematically analysed using interval plots, ANOVA, Pareto charts, interaction plots, main effect plots, surface plots, estimation for paired differences, and pairwise Pearson correlations, all constructed through the design of experiment (DOE) method in Minitab 21 software. The X and S charts for STP-NFCs and IR imager results were plotted. The gage R&R study (ANOVA method) was conducted using the gage study feature for STP-NFCs in Minitab 21 software. Two-way ANOVA tables with interaction, variance components tables, and gage evaluation tables were presented and discussed. A gage R&R study with multiple operators and one part was conducted for the IR imager, and the corresponding variance components were provided.
3. Results
3.1. Optimal Procedure
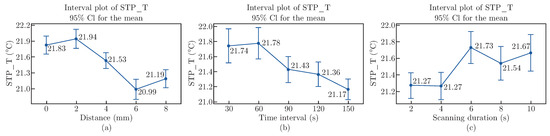
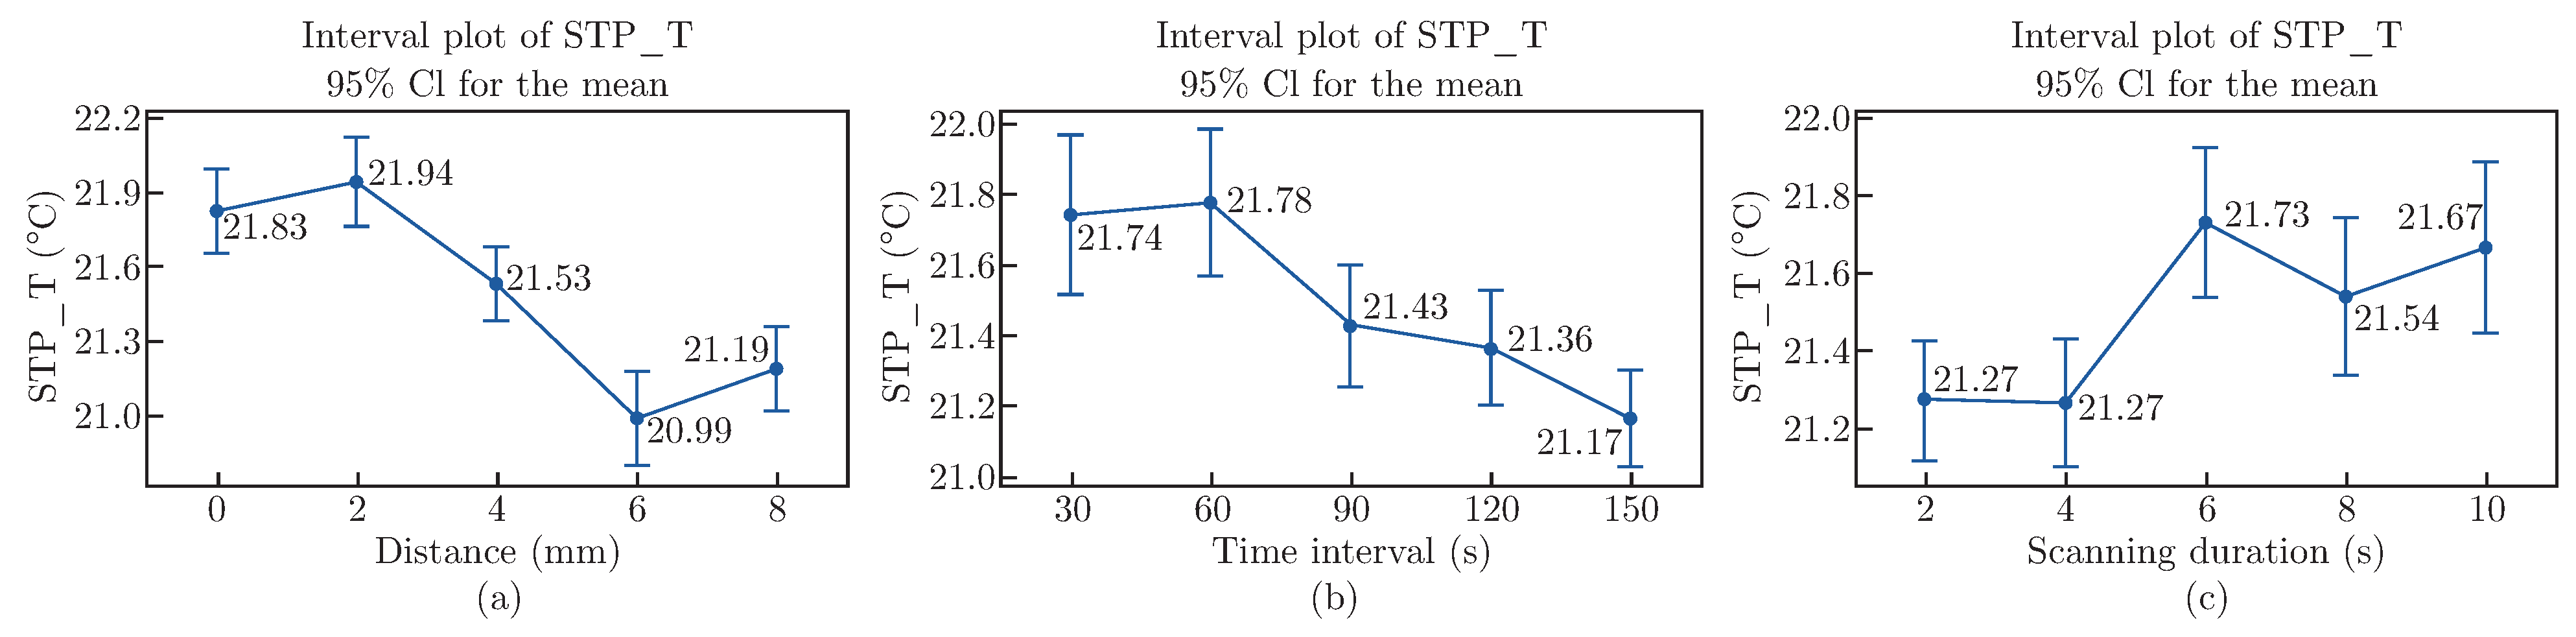
This experiment focuses on three factors: distance, time interval, and scanning duration. Each factor comprises five levels, with each situation being scanned three times. Consequently, there are a total of 375 results. These outcomes are presented in interval plots with the STP-NFC temperature results on the y-axis and different factors (distance in mm, time interval in seconds, and scanning duration in seconds) displayed on the x-axis, shown in Figure 6 [17]. Error bars are also incorporated in the plots. The deviations in STP-NFC results for each factor generally remain within 1 °C, indicating high precision. Additionally, the presence of short error bars indicates a significant level of consistency and reliability among all data points.
Figure 6.
(a) Interval plot of STP_T with distance (mm) on the x-axis, (b) Interval plot of STP_T with time interval (s) on the x-axis, and (c) Interval plot of STP_T with scanning duration (s) on the x-axis.
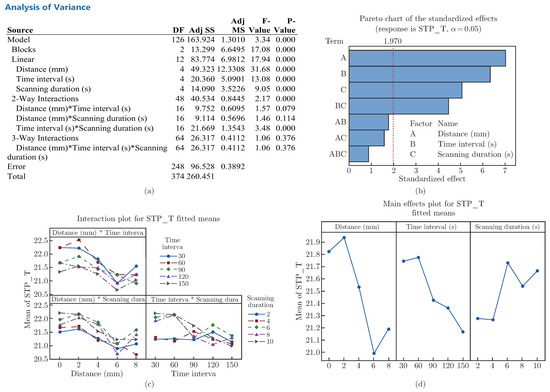
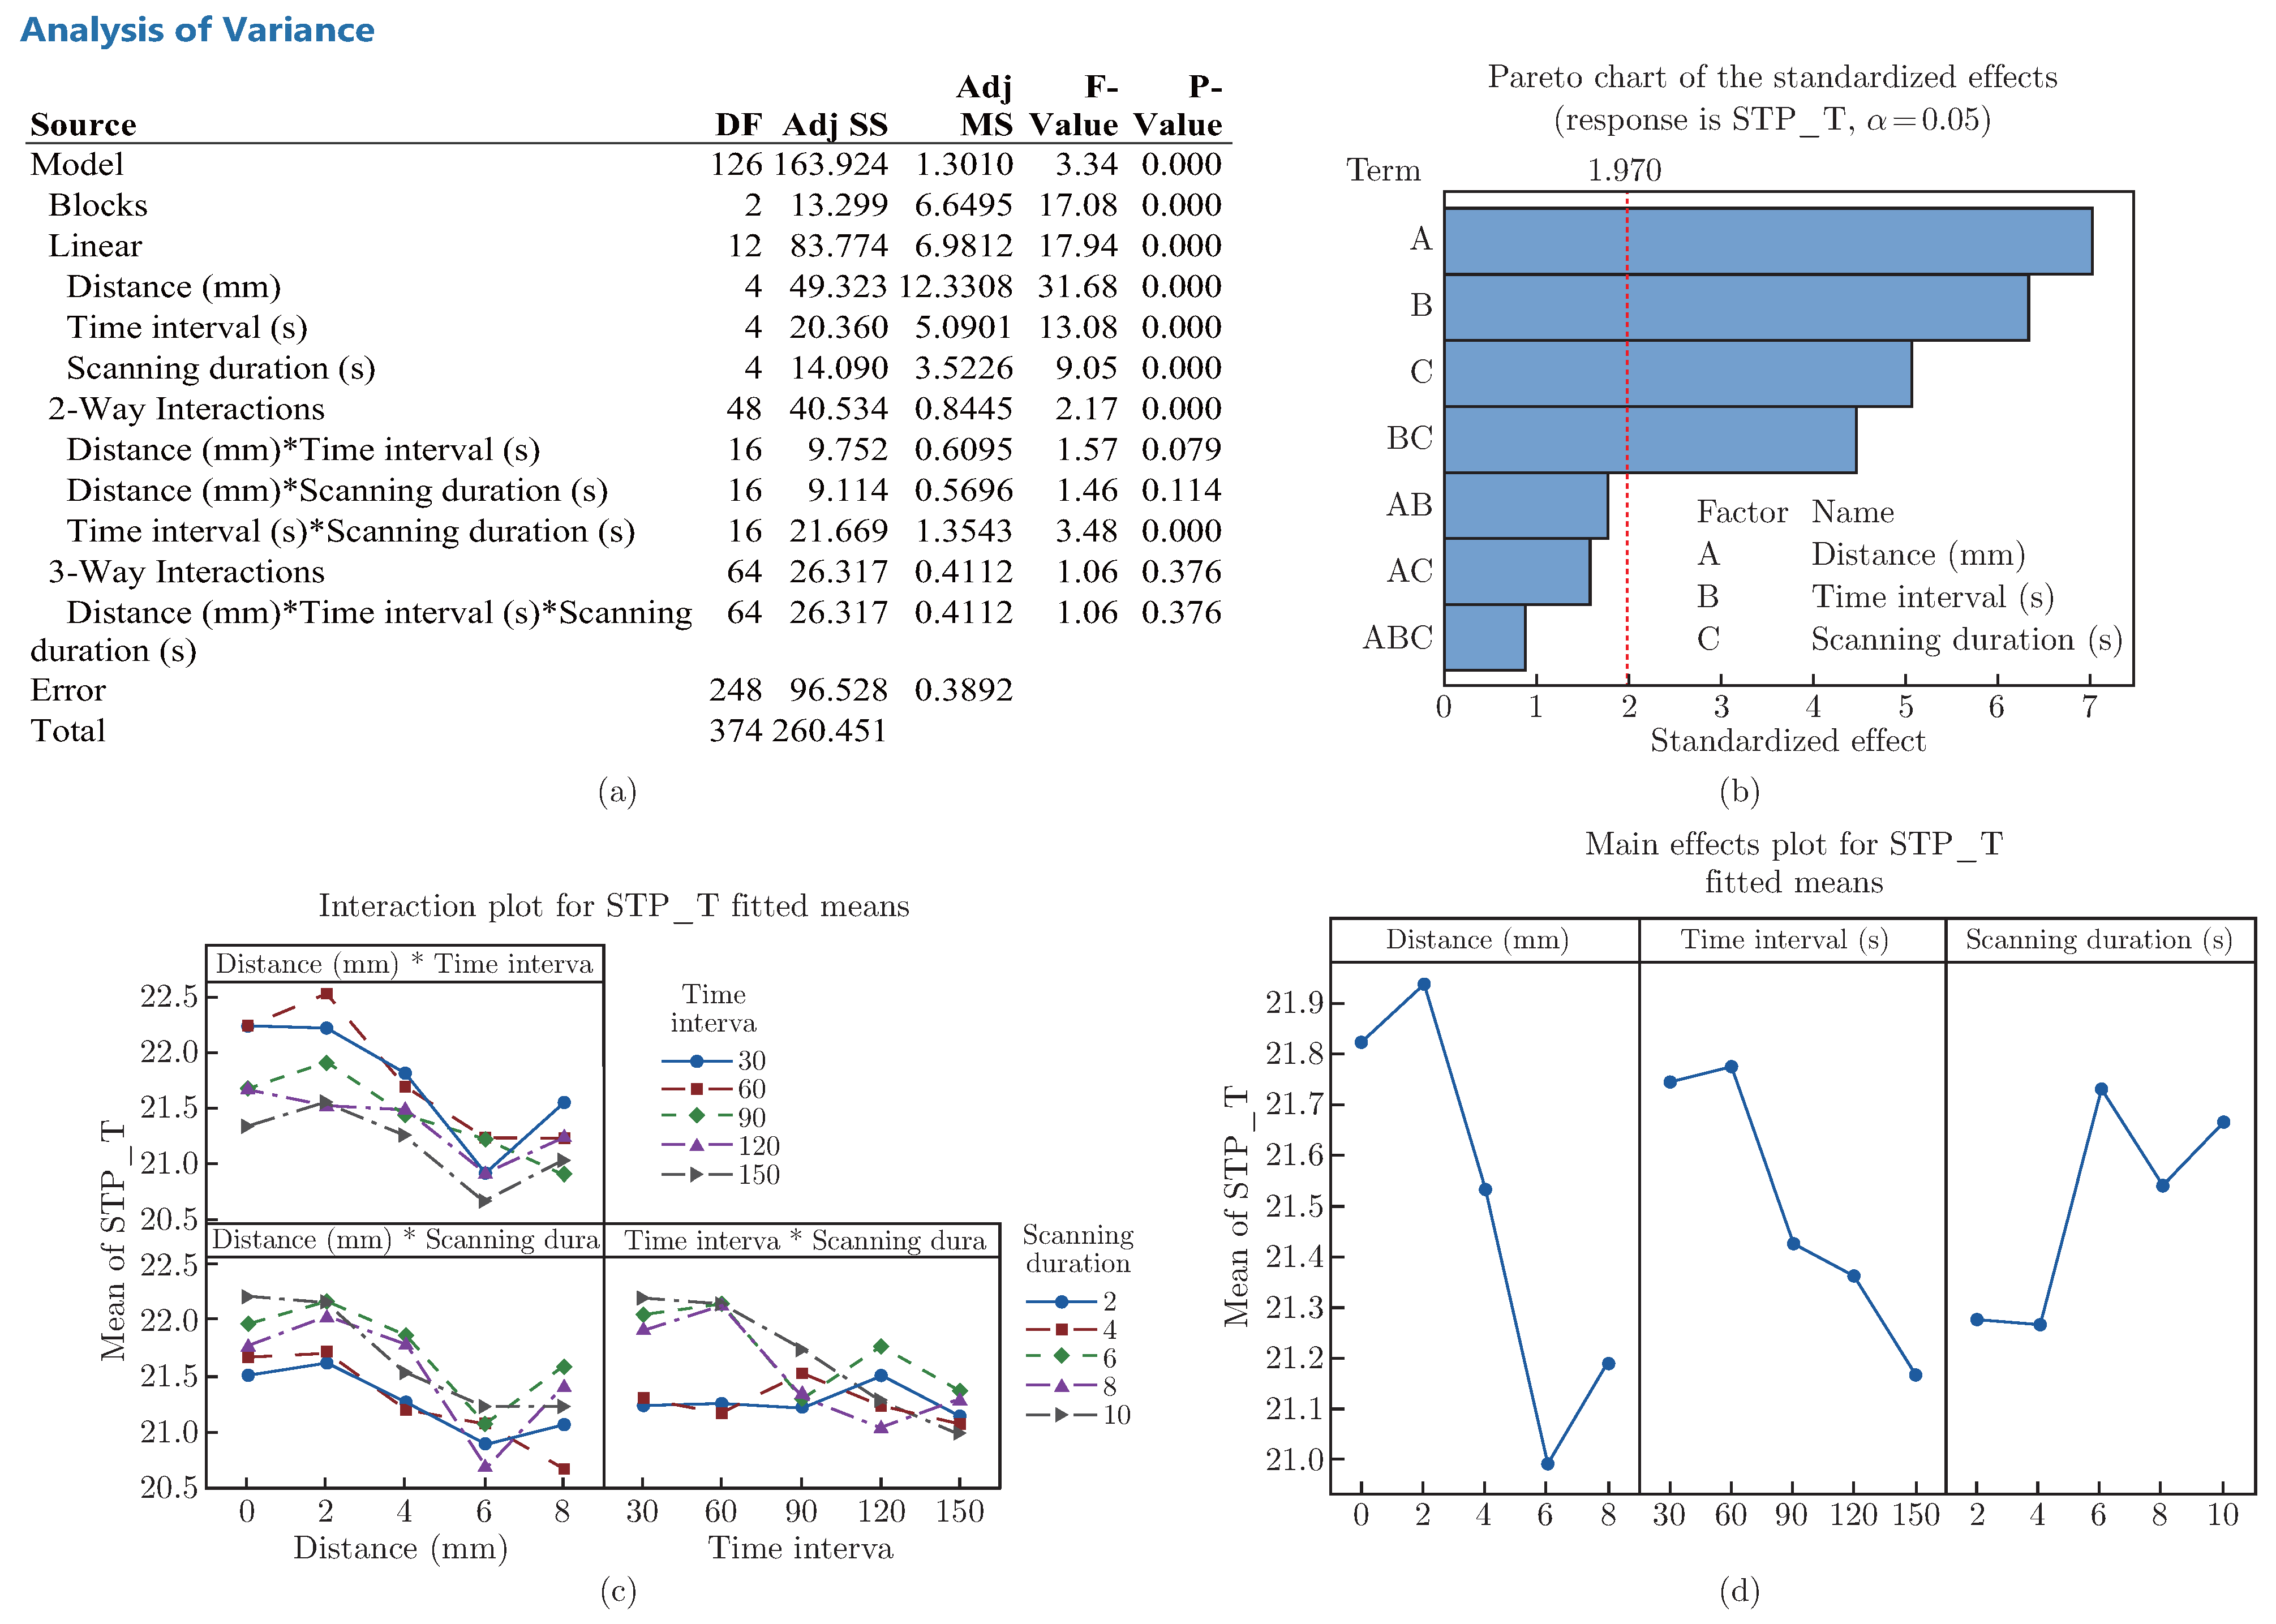
Based on the ANOVA model summary, the STP-NFC results exhibit a standard error of regression (S) of 0.62 and a coefficient of determination (R-sq) of 62.94%. These values indicate a relatively good fit to the developed model, showcasing the STP-NFC’s overall reliability. Furthermore, most P-values for the distance (< 0.001), time interval (< 0.001), and scanning duration (< 0.001) factors, as seen in Figure 7(a), suggest highly reliable results, supporting the previous suggestions.
Figure 7.
(a) Analysis of Variance table; (b) Pareto chart of the standardised effects, the response is the STP-NFC results (STP_T); (c) Interaction plot for the STP-NFC results (STP_T); (d) Main effects plot for the STP-NFC results (STP_T).
Figure 7(b) shows that all the factors significantly affect the STP-NFC temperature. Distance has the greatest effect, followed by time interval and scanning duration. Figure 7(c) presents the Pareto chart of the standardised effect for the STP-T results, which presents the standardised effects as t-statistics in descending order from the largest to the smallest effect, and it highlights bars that cross the reference line to indicate their statistical significance. These standardised effects serve as a means to test the null hypothesis that the effect size is zero [18]. Figure 7(d) illustrates that the time interval and scanning duration combination affects the STP-NFC temperature. Generally, the mean STP-NFC temperature value decreases as distance and/or time interval increase. Conversely, with an increase in scanning duration, the mean temperature value of the STP-NFC results increases. Results closer to the constant room temperature of 20 °C indicate more accurate STP-NFC performance. Based on the STP-NFC results, the optimal procedure is a 6 mm distance, 150s time interval, and 4 s contact time.
The results of the IR imager also show similar trending compared with the STP-NFC results; details can be provided in the support materials requested.
3.2. Gage R&R Study
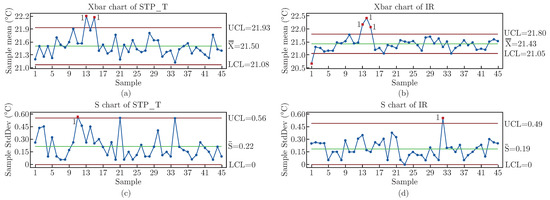
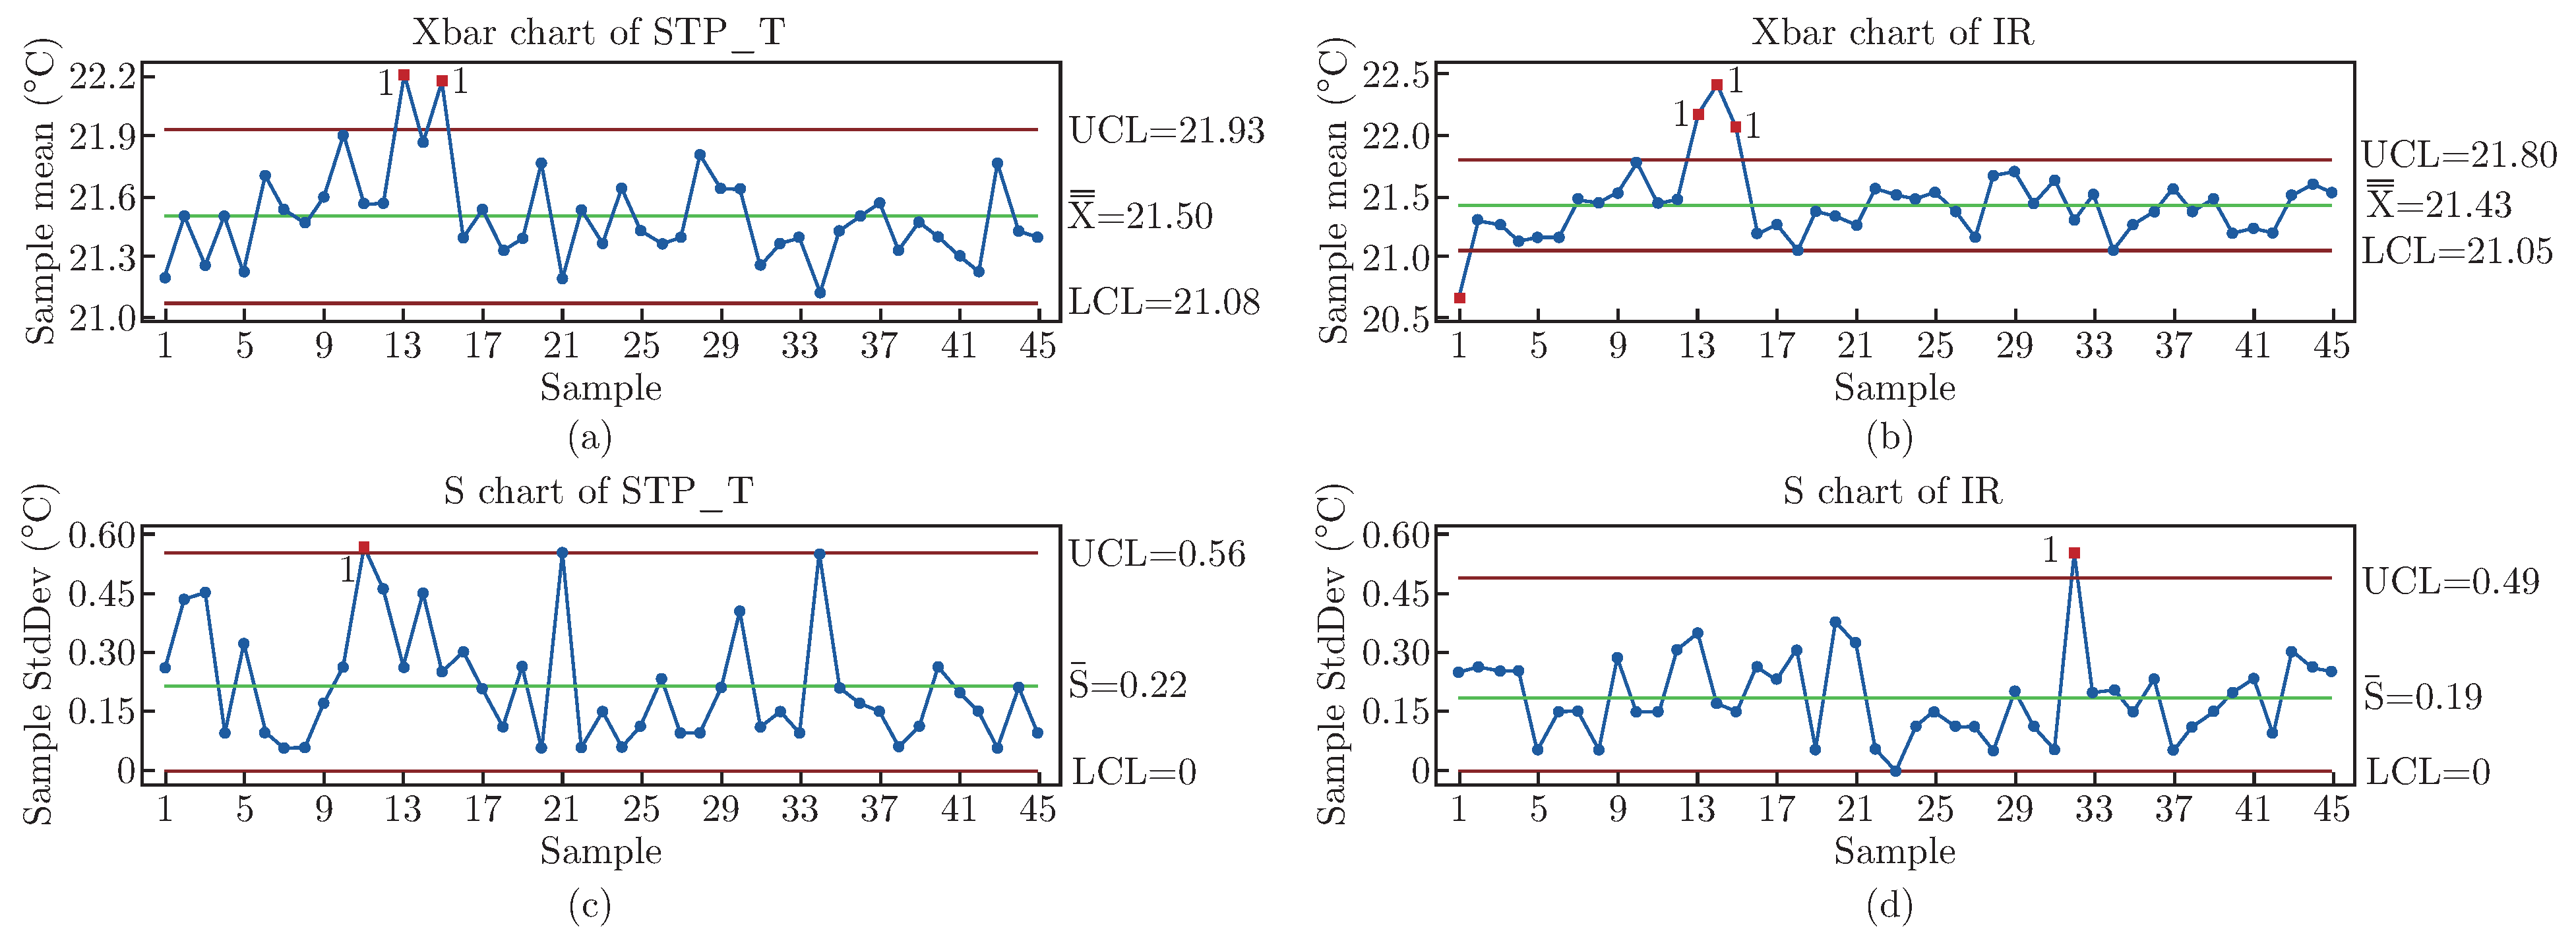
The gage R&R study involves five individual operators and utilises nine STP-NFCs and one IR imager, with each configuration being repeated three times, resulting in a total of 135 scans each. The results, including the STP-NFC and IR imager data, are plotted in X-bar and S charts, as shown in Figure 8.
Figure 8.
X charts and S charts (a) X chart of STP_T; (b) X chart of IR; (c) S chart of STP_T; (d) S chart of IR.
The X-bar chart illustrates the average measurement values over time, identifying any shifts or trends in the mean value [19]. The centrelines of the charts present the overall process averages, demonstrating a significant similarity between the STP-NFCs (21.50 °C) and the IR imager (21.43 °C), with a mere 0.07 °C of variability. Control limits are determined based on the process variability, set at three times S by default. Most of the points scatter around the centreline, within the established limits. For the STP-NFCs, only two results exceed the upper control limit (UCL), while the IR imager has three points above the UCL in the initial results and one below the lower control limit (LCL). These findings emphasise the stability of the STP-NFCs and the IR imager, highlighting consistent temperature measurements across 45 subgroups.
Meanwhile, the S charts track the variability within the subgroups, assisting in monitoring changes in process variability [20]. The centrelines of these charts are established based on the average S, revealing comparable values for the STP-NFCs and the IR imager (0.22 °C and 0.19 °C, respectively). Control limits are defined by subgroup variability. These charts reveal a maximum variation of around 0.5 °C, suggesting significant stability in the temperature monitoring using STP-NFCs. Notably, only one point slightly exceeds the UCL in both the STP-NFCs and the IR imager datasets, further confirming the STP-NFC’s comparable stability to the IR imager.
Incorporating the gage R&R study, the two-way ANOVA table with interaction is provided in Table 3. SS assists in comparing the variance caused by different sources. A higher SS value indicates higher variance, which is unwilling. It is evident that SSRepeatability has an undesirably high value of 6.80. Meanwhile, SSOperator, which represents the reproducibility as it is significantly influenced by the operators, maintains a relatively low and preferable value of around 2.60. This suggests that the STP-NFCs exhibit better reproducibility compared to repeatability.
Table 3.
Two-Way ANOVA table with interaction for STP-NFC results.
Meanwhile, this table also indicates that notable differences exist in the F ratios and that the associated P values vary between different sources of variation. Generally, a significantly high F ratio with a relatively low p-value demonstrates that the factor significantly impacts the outcome variable. This suggests that the observed distinctions between groups are unlikely to result from chance alone. In Table 3, it is evident that the operator factor possesses the highest F ratio (9.95) and an almost negligible p-value (close to 0.000), underscoring the significant influence of this factor. For parts, although the F ratio is comparatively lower than that of operators, and the p-value is around 0.006, which is higher than the operators, there is still a noticeable significance. This indicates that the variance is mostly stemming from the factor itself. However, when these two factors interact, the F ratio presents a substantial reduction, accompanied by a p-value of 0.674, exceeding the 0.005 threshold, implying that the observed differences could potentially be attributed to random occurrences.
Table 4 presents the gage evaluation for the STP-NFC results, showing all sources maintain low standard deviations, none of them exceed 0.33. The table also presents the study variations, representing the total variability introduced by the measurement system, including both repeatability and reproducibility. Ideally, these variations should remain within six times the standard deviation of the true item values [21]. All the study variations fall within an acceptable range, staying below a threshold of 2. However, the percentage of study variation is undesirably high for the total gage R&R and repeatability categories. Conversely, it is significantly lower for reproducibility, which suggests good reproducibility. This indicates that different operators achieve similar results when following the same procedure, thereby offering reliable measurements.
Table 4.
Gage evaluation for STP-NFC results.
4. Discussion
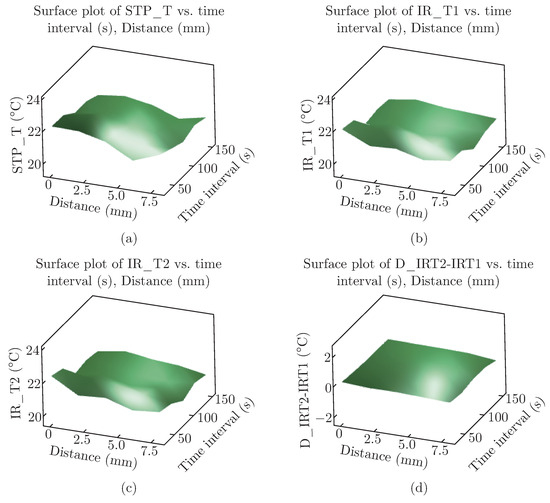
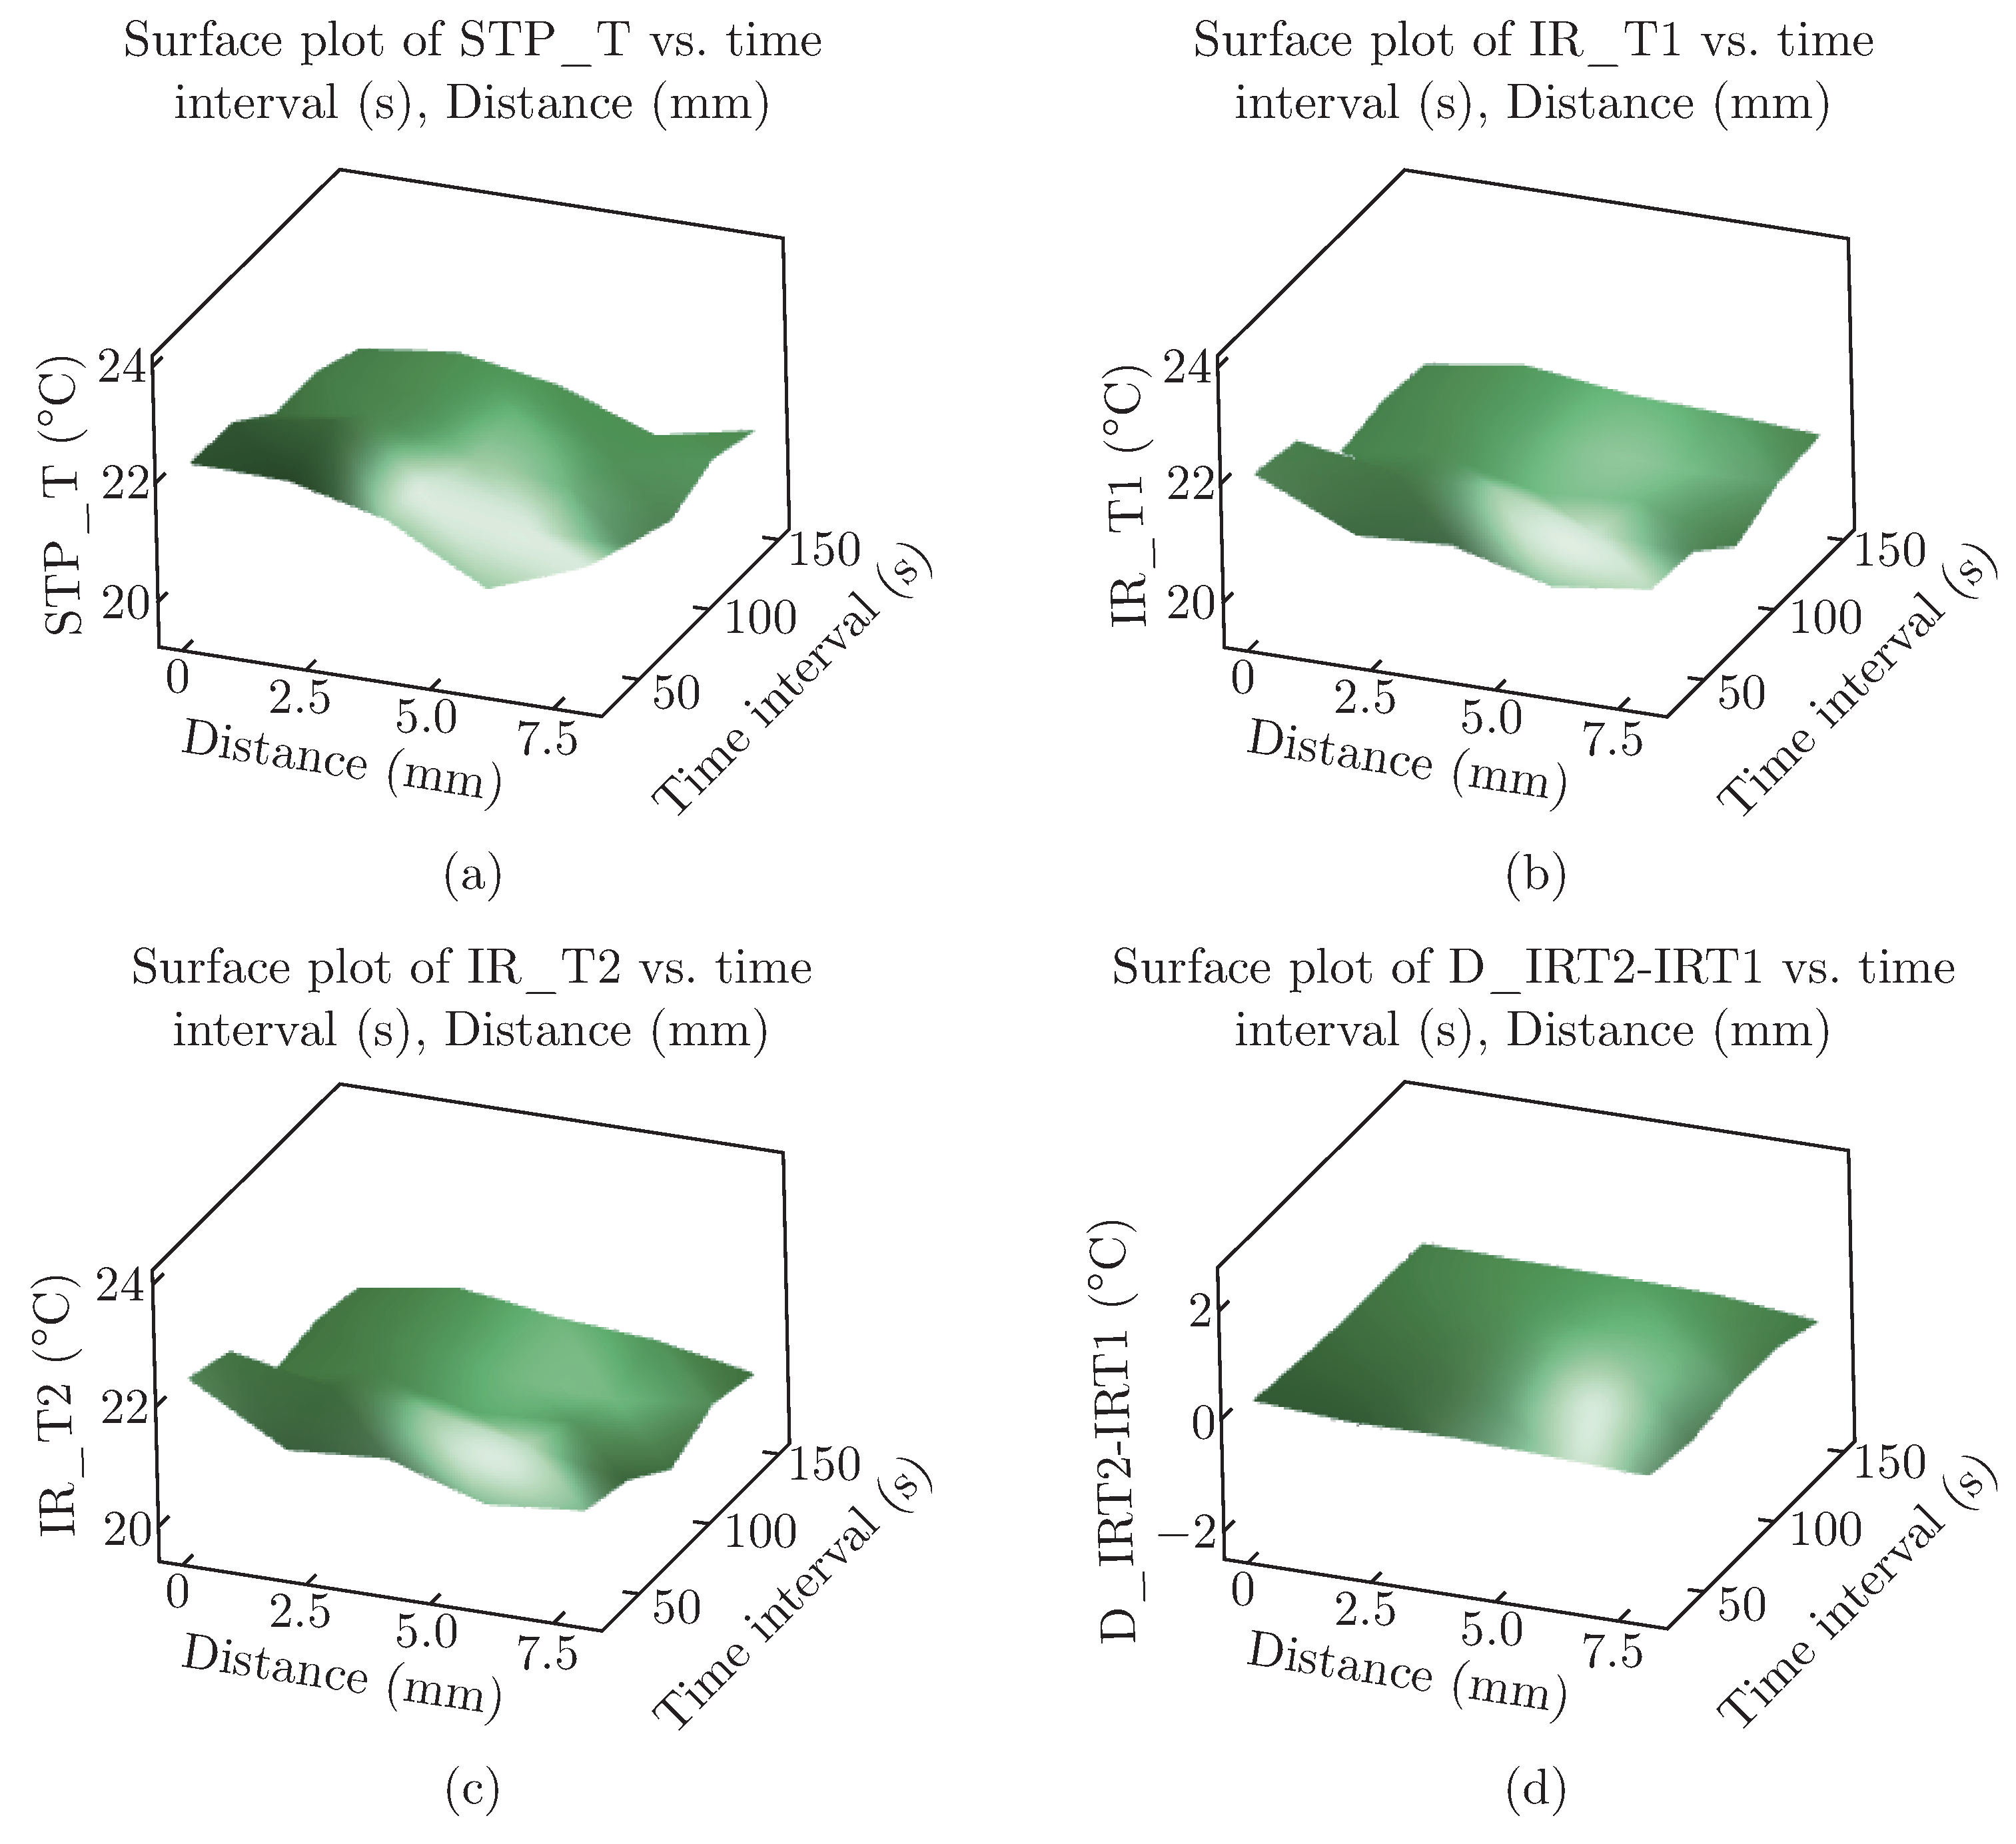
The surface plots illustrate how the mean temperature values of the STP-NFC change with variations in distance and time intervals. The results demonstrate that distance and time intervals substantially impact the STP-NFC and IR temperature measurements, supporting the earlier conclusions. However, the effect on the IR temperature difference is less significant, as depicted in Figure 9. This suggests that the STP-NFC process does not considerably affect the surface temperature and will not introduce significant errors during measurement.
Figure 9.
Surface Plot of (a) STP-NFC results (STP_T) vs Distance (mm) vs Time interval (s); (b) Initial IR temperature results (IR_T1) vs Distance (mm) vs Time interval (s); (c) Final IR temperature results (IR_T2) vs Distance (mm) vs Time interval (s); (d) IR temperature results difference (D_IRT2-IRT1) vs. Distance (mm) vs Time interval (s).
During the paired comparison, the STP-NFC is found to be accurate with acceptable variation, as can be seen in Table 5. The difference between the mean values of the STP-NFC and initial IR temperature results is only 0.36 °C, while the difference with final IR temperature results is 0.29 °C, as shown in Table 5. Additionally, the standard deviation for the STP-NFC ranges from 0.6 to 0.8, which suggests a significant level of precision.
Table 5.
Estimation for paired difference.
Further analysis of Table 5 shows that the pair difference mean values for the initial and final IR temperatures are very small, with only a difference of 0.08 °C. This indicates that the STP-NFC’s performance remains relatively stable during continuous measurements, and its usage does not significantly affect the surface temperature.
When a low p-value and a high correlation coefficient are observed, it typically suggests a strong and significant relationship between the variables being compared. In Table 6, the high correlation observed between the STP-NFC results and the IR temperature results ranging from 0.5 to 0.6 and the low p-value further support the high accuracy of the STP-NFC, as they exhibit similar changing trends. Additionally, the high correlation between the initial and final IR temperature results (0.67) and the low p-value further suggests that using the STP-NFC does not significantly affect the sample surface temperature.
Table 6.
Pairwise pearson correlations.
This validation experiment proves that the STP-NFC exhibits a similarly reliable performance as a commercial IR camera, affirming its effectiveness and suitability for temperature monitoring applications. Additionally, it offers advantages over traditional IR cameras, including portability [22], real-time data transfer [23], lower power consumption [24], ease of use [25], and direct contact sensing [26], making them ideal for wearable health monitoring and targeted temperature measurements, such as fever screening [27], infection control [28], neonatal care [29], sports medicine [30], thermographic breast screening [31], etc.
Table 7 displays the variance components for both STP-NFC and IR imager results. According to the guideline, if the % contribution of a variance component exceeds 9%, the measurement system is considered unacceptable and requires improvement [32]. Ideally, the majority source of variance should originate from differences between parts, referred to as part-to-part variance, rather than from the R&R of the measurement system. In this research, the STP-NFC demonstrates a significant proportion of variance arising from total gage R&R, indicating the urgent need for system enhancements [11]. For the STP-NFC, repeatability is the principal contributor to variance, much higher than the influence of reproducibility substantially. This indicates a better reproducibility than repeatability, suggesting that different operators, following identical procedures and operating under the same conditions, will likely achieve consistent results with the STP-NFC.
Table 7.
Variance components for STP-NFC results and IR Imager results.
Table 8 presents the standard deviation, study variance, and P/T ratio for STP-NFC and IR imager results. The data shows that the STP-NFC and the IR imager maintain small standard deviations across all sources, indicating that measurements remain relatively stable for total gage R&R, repeatability, and reproducibility. Meanwhile, the STP-NFC performs better than the IR imager, particularly regarding reproducibility, further confirming the previous variance components analysis.
Table 8.
Standard deviation, study variance, and P/T ratio for STP-NFC results and IR Imager results.
However, while the STP-NFC exhibits promising performance, it faces challenges when high-precision temperature monitoring is required, and the tolerance band is narrow. For instance, in distinguishing differences between contralateral spots on feet for detecting diabetes-related foot complications, a temperature variance of 2.2 °C is utilised as the threshold. Under such strict criteria, the P/T ratio results are somewhat unsatisfactory. Ideally, a lower P/T ratio indicates superior performance and values exceeding 30% are inadequate. Thus, the current data suggests neither method fully satisfies the requirements, revealing an area for enhancement.
Nevertheless, when comparing the STP-NFC and the IR imager, it becomes apparent that the former performs significantly better, especially regarding reproducibility. With a reproducibility P/T ratio nearing 30%, the STP-NFC demonstrates the substantial potential to evolve into a reliable tool for monitoring diabetes-related foot complications, pending further development and improvement.
5. Conclusion
A validation experiment has been conducted on an existing STP-NFC. It has been demonstrated to have high accuracy and precision compared to a commercial IR camera. The performance of the STP-NFC is significantly affected by the distance and time interval between the mobile phone and the device surface, with the scanning duration also having a noticeable effect. Optimal results were achieved with a 6 mm distance, 150s time interval, and 4s contact time. Moreover, STP-NFC did not significantly affect the object’s surface temperature, indicating that it does not introduce intolerable errors during measurement. Furthermore, in the gage study, STP-NFC exhibits an overall performance that surpasses the IR imager’s, especially in its reproducibility. These findings have significant implications for developing wearable medical monitoring devices that utilise NFC technology.
References
- Xu, L.; et al. Characterization and Modeling of Embroidered NFC Coil Antennas for Wearable Applications. IEEE Sens. J. 2020, 20, 14501–14513. [Google Scholar] [CrossRef] [Scilit]
- Suresh, P.; Daniel, J.; Parthasarathy, V.; Scholar, P. A state of the art review on the Internet of Things (IoT) History, Technology and fields of deployment, 2014. Available online: https://fardapaper.ir/ mohavaha/uploads/2018/02/Fardapaper-A-state-of-the-art-review-on-the-Internet-of-Things-IoThistory-technology-and-fields-of-deployment.pdf.
- Madakam, S.; Ramaswamy, R.; Tripathi, S. Internet of Things (IoT): A Literature Review. J. Comput. Commun. 2015, 03, 164–173. [Google Scholar] [CrossRef]
- R. Want, Near field communication. IEEE Pervasive Comput. 2011, 10, 4–7. [Google Scholar] [CrossRef] [Scilit]
- Kang, S.G.; Song, M.S.; Kim, J.W.; Lee, J.W.; Kim, J. Near-Field Communication in Biomedical Applications. Sensors 2021, 21, 703. [Google Scholar] [CrossRef] [Scilit]
- B. R. & Y. Li, Designing Wearable Electronic Textiles to Detect Early Signs of Neurological Injury and Disease: A Review, Journal of Fiber Bioengineering and Informatics, vol. 14, no. 3, pp. 189-198, Jun. 2021. [CrossRef] [Scilit]
- Ou, C.M.; Tu, J.F. The WSN and 3G/NFC embedded into IoV (Internet-of-Vehicle) fulfil cold chain logistics. Microsyst. Technol. 2017, 24, 3977–3983. [Google Scholar] [CrossRef] [Scilit]
- Escobedo, P.; Bhattacharjee, M.; Nikbakhtnasrabadi, F.; Dahiya, R. Smart Bandage With Wireless Strain and Temperature Sensors and Batteryless NFC Tag. IEEE Internet Things J. 2021, 8, 5093–5100. [Google Scholar] [CrossRef] [Scilit]
- Sethia, D.; Gupta, D.; Mittal, T.; Arora, U.; Saran, H. NFC-based secure mobile healthcare system, IEEE Xplore, 2014. Available online: https://ieeexplore.ieee.org/document/6734919 (accessed on 15 April 2021).
- Shang, L.H. Research Progress of Graphene-based Flexible Sensor in Wearable Health Monitoring. J. Fiber Bioeng. Inform. 2019, 12, 179–192. [Google Scholar] [CrossRef] [Scilit]
- Minitab, Interpret the key results for Crossed Gage R&R Study, support.minitab.com. 2023. Available online: https://support.minitab.com/en-us/minitab/21/help-and-how-to/quality-and-process-improvement/measurement-system-analysis/how-to/gage-study/crossed-gage-r-r-study/interpret-the-results/key-results/.
- Minitab, All statistics and graphs for Crossed Gage R&R Study, support.minitab.com. 2023. Available online: https://support.minitab.com/en-us/minitab/21/help-and-how-to/quality-and-process-improvement/measurement-system-analysis/how-to/gage-study/crossed-gage-r-r-study/interpret-the-results/all-statistics-and-graphs/ (accessed on 22 August 2023).
- Montgomery, D.C. Introduction to statistical quality control, 6th ed.; John Wiley & Sons, Inc: Hoboken, NJ, 2009. [Google Scholar]
- Minitab, Perform a gage R&R study with multiple operators and one part, support.minitab.com. 2023. Available online: https://support.minitab.com/en-us/minitab/21/help-and-how-to/quality-and-process-impr-ovement/measurement-system-analysis/supporting-topics/gage-r-r-analyses/perform-gage-r-r-with-multiple-operators-and-one-part/ (accessed on 7 September 2023).
- D. Wheeler, What is the Precision to Tolerance Ratio? And does it define a good measurement system? 2012. Available online: https://www.spcpress.com/pdf/DJW244.pdf.
- van Netten, J.J.; Prijs, M.; van Baal, J.G.; Liu, C.; van der Heijden, F.; Bus, S.A. Diagnostic Values for Skin Temperature Assessment to Detect Diabetes-Related Foot Complications. Diabetes Technol. Ther. 2014, 16, 714–721. [Google Scholar] [CrossRef] [Scilit]
- T. Kou and Y. Li, Factors In°uencing the Accuracy and Precision of NFC-based Temperature Monitoring Device, A Pilot Study, Journal of Fiber Bioengineering and Informatics, 2023, doi: https://doi.org/10.3993/tbis.
- Minitab, Effects Plots for Analyze Factorial Design, support.minitab.com. 2023. Available online: https://support. minitab.com/en-us/minitab/21/help-and-how-to/statistical-modeling/doe/how-to/factorial/analyze-factorial-design/interpret-the-results/all-statistics-and-graphs/effects-plots/#pareto-chart (accessed on 3 August 2023).
- Minitab, Overview for Xbar Chart, support.minitab.com. 2023. Available online: https://support.minitab.com/enus/minitab/21/help-and-how-to/quality-and-process-improvement/control-charts/how-to/variables-charts-for-subgroups/xbar-chart/before-you-start/overview/ (accessed on Aug. 21 2023).
- Minitab, S chart, support.minitab.com. 2023. Available online: https://support.minitab.com/en-us/minitab/21/hel p-and-how-to/quality-and-process-improvement/control-charts/how-to/variables-charts-for-subgr oups/i-mr-r-s-chart/methods-and-formulas/s-chart/ (accessed on 21 August 2023).
- Minitab, What is a gage repeatability and reproducibility (R&R) study? support.minitab.com. 2023. Available online: https://support.minitab.com/en-us/minitab/21/help-and-how-to/quality-and-process-improvement/measurement-system-analysis/supporting-topics/gage-r-r-analyses/what-is-a-gage-r-r-study/.
- Y. Kifle, J. Jacob Wikner, Johan Zötterman, L. Rydén, and S. Farnebo, NFC Powered Implantable Temperature Sensor, 2019 41st Annual International Conference of the IEEE Engineering in Medicine and Biology Society (EMBC), Jul. 2019. [CrossRef] [Scilit]
- A. Dehennis, M. Mailand, D. Grice, S. Getzlaff, and Colvin Arthur E, A near-field-communication (NFC) enabled wireless fluorimeter for fully implantable biosensing applications, 2013 IEEE International Solid-State Circuits Conference Digest of Technical Papers, Mar. 2013. [CrossRef] [Scilit]
- M. Hillukkala, Mikko Heiskanen, and Arto Ylisaukko-oja, Practical Implementations of Passive and Semi-passive NFC Enabled Sensors, 2009 First International Workshop on Near Field Communication, Feb. 2009. [CrossRef] [Scilit]
- Nogues, E.; Mackowiack, N.; Hamdoun, A.; Latrach, M. NFC/RFID sensor Tag for Wireless Temperature Monitoring in a Cold Chain. E3S Web Conf. 2022, 351, 0103801038. [Google Scholar] [CrossRef] [Scilit]
- Y. Kifle, J. Jacob Wikner, Johan Zötterman, L. Rydén, and S. Farnebo, NFC Powered Implantable Temperature Sensor, 2019 41st Annual International Conference of the IEEE Engineering in Medicine and Biology Society (EMBC), Jul. 2019. [CrossRef] [Scilit]
- NHS Choices, How do I take someone’s temperature? NHS, 2019. Available online: https://www.nhs.uk/commonhealth-questions/accidents-first-aid-and-treatments/how-do-i-take-someones-temperature/.
- Kalore, N.V.; Maheshwari, A.V.; Sharma, A.; Cheng, E.Y.; Gioe, T.J. Is There a Preferred Articulating Spacer Technique for Infected Knee Arthroplasty?: A Preliminary Study. Clin. Orthop. Relat. Res. 2012, 470, 228–235. [Google Scholar] [CrossRef] [Scilit]
- I. de and M. Eduardo, Development of NFC TAG for temperature sensing of premature newborns in neonatal incubators, 2017 2nd International Symposium on Instrumentation Systems, Circuits and Transducers (INSCIT), Aug. 2017. [CrossRef] [Scilit]
- Wang, Z. Zhou, Y. Li, and J. Zhang, An Efficient Sports Navigation Method Based on NFC Technology, 2020 International Conference on Intelligent Transportation, Big Data & Smart City (ICITBS), Jan. 2020. [CrossRef] [Scilit]
- F. Ghaemi, Luqman Chuah Abdullah, Hanieh Kargarzadeh, M. M. Abdi, Nur, and M. Abbasian, Comparative Study of the Electrochemical, Biomedical, and Thermal Properties of Natural and Synthetic Nanomaterials, vol. 13, no. 1, Apr. 2018,. [CrossRef] [Scilit]
- Minitab, Is my measurement system acceptable? support.minitab.com, 2023. Available online: https://support.mini tab.com/en-us/minitab/21/help-and-how-to/quality-and-process-improvement/measurement-syst em-analysis/supporting-topics/gage-r-r-analyses/is-my-measurement-system-acceptable/.

© 2023 Textile Bioengineering and Informatics Society. This article is an open access article distributed under the terms and conditions of the Creative Commons Attribution (CC BY) license (https://creativecommons.org/licenses/by/4.0/).