


Abstract
The Ti6Al4V alloy is widely used for biomedical implants, but the long-term stability of its surface in physiological environments can be improved by applying phosphate conversion coatings. In this study, three multicomponent coatings—Zn-Zr-Mg, Mg-Zn-Zr, and Zr-Zn-Mg—deposited on Ti64 were investigated to examine the influence of exposure time, coating composition, and immersion medium on electrochemical behaviour. The samples were immersed for 30, 60 and 90 days in Ringer’s solution, DPBS and EBSS, and their electrochemical stability was assessed using electrochemical impedance spectroscopy and equivalent circuit modelling. The results showed a trend that depended on both the layer composition and the test environment, with no steady decrease in impedance over time. After 90 days, the coated specimens retained low-frequency impedance moduli on the order of 104–105 Ω·cm2, depending on coating composition and immersion medium. In Ringer’s solution, the highest 90-day response was obtained for Zr-Zn-Mg, with |Z| at 0.01 Hz of approximately 4 × 10⁴ Ω·cm2, compared with approximately 3 × 10⁴ Ω·cm2 for uncoated Ti64. In DPBS, Zn-Zr-Mg and Mg-Zn-Zr reached approximately 1·105 Ω·cm2, whereas in EBSS, Zr-Zn-Mg reached approximately 1.5 × 10⁵ Ω·cm2, compared with approximately 5 × 10⁴ Ω·cm2 for Ti64. These quantitative differences confirm that the long-term response depends strongly on both coating composition and electrolyte chemistry, with Zr-Zn-Mg showing the highest 90-day impedance in Ringer’s solution and EBSS, while Zn-Zr-Mg and Mg-Zn-Zr reached the highest values in DPBS.
1. Introduction
Advances in modern implantology involve the use of a wide range of biomaterials to replace, support, and secure biological structures that have been damaged by trauma, degenerative processes, or bone loss [1,2,3,4]. Recent literature highlights numerous avenues for developing materials for implantology, including biodegradable alloys, composite materials produced by additive manufacturing, high-entropy alloys, and bioactive coatings. These approaches aim to improve osseointegration, corrosion resistance, biocompatibility, and infection prevention [5,6,7]. Among metallic biomaterials, titanium and its alloys play an important role due to their favourable combination of mechanical properties [6], corrosion resistance [8] and biocompatibility [9].
Of all the titanium alloys, Ti–6Al–4V is one of the most commonly used for orthopaedic and dental implants [10,11,12], owing to its high mechanical strength, low mass, and good stability in physiological environments [13,14]. The main applications include rods, components for joint prostheses, plates and screws for bone fixation, and abutments and connecting elements used in dental implantology. As early as 1998, Long and Rack [12] orthopaedic applications. However, Ti6Al4V also has a number of limitations, including high stiffness associated with the stress-shielding effect, the relatively bioinert surface, potential biological effects from the release of Al and V, and susceptibility to degradation in certain aggressive environments [15,16,17].
Modern manufacturing technologies, including additive manufacturing, enable control over the geometry and porosity of Ti6Al4V implants, helping to optimise their mechanical properties and reduce the stress shielding effect [16,17]. However, optimising the implant geometry alone is insufficient in the absence of an implant–tissue interface with suitable properties.
Although Ti6Al4V is considered a biocompatible biomaterial, its natural surface is relatively bioinert. The thin passive film of TiO2 provides effective protection against corrosion, but does not always promote rapid osseointegration and does not confer sufficient antibacterial activity [8]. For this reason, modifying the surface is one of the main approaches being pursued to improve the performance of Ti6Al4V implants. Kumar and Singh highlighted the fact that surface properties can influence the alloy’s wear, corrosion behaviour, wetting and bioactivity [16].
In recent years, numerous types of coatings have been investigated for the functionalisation of Ti6Al4V surfaces. Nikolova et al. produced nanostructured TiO2/Cu coatings with good adhesion, stable electrochemical behaviour and enhanced antibacterial activity [18]. Furthermore, the Ag-CaP-ZrO2 composite coatings analysed by Aissi et al. exhibited superior corrosion resistance compared with both the uncoated surface and the layer consisting solely of calcium phosphate [19]. Other approaches, based on hydroxyapatite, hydrogels or TiN-Cu coatings, have demonstrated the potential to simultaneously improve the biological response, antibacterial properties and mechanical behaviour of the surface [20,21].
Regardless of the method used, the performance of a bioactive layer depends on its chemical composition, morphology, roughness, hydrophilicity and stability in the physiological environment. The incorporation of elements such as Ca, phosphates and Mg can promote cell adhesion, osteogenic differentiation and the formation of a mineralised matrix; however, the final effect depends on the structural and chemical characteristics of the coating [22,23]. Chemical and topographical modifications of the surface can thus help improve the interaction between the implant and bone tissue [24].
Of the various methods of chemical surface functionalisation, chemical conversion phosphating enables the in situ formation of phosphate coatings directly on the metal substrate. The process is based on reactions between the alloy surface and the phosphate species and metal ions present in the conversion solution [22,25]. As the layer forms directly on the substrate surface, chemical conversion can help achieve a strong bond between the coating and the alloy. Depending on the composition of the bath, phosphate phases with bioactive potential may form, and the electrochemical and biological properties of the coating can be adjusted by introducing ions such as Zn, Mg, Sr, or other metal cations [25,26].
Zhao et al. [27] produced Sr-Zn-P coatings on titanium by chemical conversion and reported both an improvement in the osteogenic response and a reduction in the corrosion current density compared with the uncoated substrate. Similarly, Liu et al. prepared in situ layers of scholzite on Ti6Al4V and commercially pure titanium, demonstrating favourable electrochemical behaviour in a 0.9% NaCl solution, as well as improved cell adhesion, proliferation and differentiation [28]. These results highlight the importance of the chemical composition and the phases formed on the stability and functionality of phosphate layers.
In the case of multi-component coatings, Zn, Mg and Zr may make complementary contributions to the electrochemical and biological behaviour of the surface. Thus, the introduction of Zr can enhance the chemical and electrochemical stability of the coating, with the effect depending on the nature of the phases formed, the thickness, the porosity and the method of preparation [29]. Mg is of particular interest due to its biological role and its potential to form bioactive phosphate phases. Li et al. obtained, by chemical conversion, a layer of magnesium phosphate, predominantly newberyite, whose density and continuity had a favourable influence on the electrochemical behaviour of titanium [30]. Furthermore, Zn can contribute to both the electrochemical stability of coatings and the surface’s biological and antibacterial responses through the formation of phases such as hopeite and other Zn-containing phosphates [31,32]. However, the effect of each element depends on the layer’s overall composition and structure, so their influence must be analysed within the context of the multicomponent system rather than in isolation.
Although the literature highlights the beneficial effects of Zn, Mg, and Zr on the electrochemical and biological behaviour of titanium-based surfaces, information on the long-term stability of multicomponent phosphate conversion coatings containing all three elements remains limited. Furthermore, most studies examine electrochemical behaviour in a single test environment and over relatively short periods, even though solution composition can significantly influence layer behaviour and the layer–substrate interface. Comparing the same coatings in physiological environments with different compositions can thus provide further information regarding their stability and changes in electrochemical mechanisms over time.
In this context, the present study analyses the long-term electrochemical behaviour of phosphate conversion coatings based on Zn, Mg, and Zr deposited on a Ti6Al4V alloy, by varying the relative proportions of these elements. Three compositions—Zn-Zr-Mg, Mg-Zn-Zr and Zr-Zn-Mg—were investigated after 30, 60 and 90 days of immersion in Ringer’s solution, Dulbecco’s Phosphate-Buffered Saline (DPBS) and Earle’s Balanced Salts Solution (EBSS). The use of the three media within the same experimental framework was intended to allow direct comparison of the coating response to different physiological electrolyte chemistries. Electrochemical stability was assessed using electrochemical impedance spectroscopy, and the behaviour of processes occurring within the layer and at the interface was analysed by correlating Nyquist and Bode plots with equivalent electrical circuits. By simultaneously comparing the composition of the layer, the immersion medium, and the exposure time, the study aims to identify the factors governing the maintenance of barrier properties and changes in the electrochemical response under simulated physiological conditions.
2. Materials and Methods
2.1. Materials
This study analyses the influence of immersion time on three types of Zn-Zr-Mg-based phosphate conversion coatings deposited on the Ti6Al4V (Ti64) alloy (AEM Metal, Sizen Limited, Changsha, China) and exposed to three different corrosive environments. The origin and chemical composition of the alloy used as the substrate were previously reported in [33].
The phosphate layers were produced by chemical conversion, following the experimental procedure described in [33]. The three phosphating solutions had the same basic composition; the difference lay in the proportion of metal ions (Zn, Zr, Mg) introduced into the solution. Thus, depending on which ion was present in the greatest quantity, the coated samples were labelled as follows:
- Zn-Zr-Mg—layer obtained using the solution containing the highest amount of Zn;
- Mg-Zn-Zr—layer obtained using the solution containing the highest amount of Mg;
- Zr-Zn-Mg—layer obtained using the solution containing the highest amount of Zr;
To compare the results, the uncoated Ti64 alloy specimens were subjected to the same immersion conditions and tested in each of the three analysed media. For each coating type and immersion medium, separate specimens were assigned to the 30-, 60-, and 90-day exposure periods. All specimens were immersed simultaneously and removed from the corresponding solution at the designated time.
2.2. Methods
To assess long-term corrosion behaviour, three corrosion media were used: Ringer’s solution (B. Braun Melsungen AG, Melsungen, Germany), modified Dulbecco’s Phosphate-Buffered Saline without CaCl2 and MgCl2 (DPBS) (Sigma-Aldrich, Merck KGaA, Darmstadt, Germany), and Earle’s Balanced Salts Solution (EBSS) (Sigma-Aldrich, Merck KGaA, Darmstadt, Germany). For each specimen type and medium, separate specimens were used for the 30-, 60-, and 90-day intervals.
The pH of each solution was measured before the samples were introduced and 90 days after immersion using a Thermo Scientific Eutech pH 5+ portable pH (Eutech Instruments Pte Ltd., Singapore) metre fitted with an ATC probe and a 0–14 pH range. The initial values and those determined after 90 days are presented in Table 1.
Table 1.
pH values of the corrosion media before the samples were introduced and after 90 days of immersion.
The electrochemical behaviour of the specimens was evaluated by electrochemical impedance spectroscopy (EIS) using an OrigaFlex OGF + 01A EIS potentiostat (Origalys ElectroChem SAS, Rillieux-la-Pape, France) in a conventional three-electrode configuration. The coated or uncoated Ti6Al4V specimen served as the working electrode, a calomel electrode was used as the reference electrode, and a platinum electrode as the counter electrode. The exposed surface area of the sample during the measurements was 0.283 cm2. The measurements were preceded by a 60 min OCP stabilisation period. A sinusoidal perturbation with an amplitude of 10 mV was applied around the stabilised open-circuit potential (OCP) over a frequency range from 100 kHz to 0.01 Hz, with 10 points per decade.
The EIS data were plotted as Nyquist plots, showing the relationship between the imaginary component of the impedance and the real component (−Zi = f(Zr)), and as Bode plots, showing the logarithm of the impedance modulus and the phase angle as a function of frequency.
The fitting of the experimental data and the selection of equivalent electrical circuits were carried out using the programme ZSimWin 3.22 software (EChem Software, Ann Arbor, MI, USA). The choice of the appropriate circuit for each system was based on the agreement between the calculated response and the experimental Nyquist and Bode diagrams, on the relative error values of the adjusted parameters, and on the physical significance of the circuit elements. The value of the fitting error (χ2) was used as an additional parameter to assess the quality of the fit, without serving as the sole selection criterion. Circuits with poorly defined parameters or with values lacking physical significance were not selected, even if they exhibited lower values of χ2. For the data fitting, the weighting was based on the impedance modulus. In the equivalent circuits, Rs represents the electrolyte resistance, R denotes the resistive contribution of the corresponding electrochemical process, C represents an ideal capacitive response, and Q denotes a constant-phase element (CPE) used to describe non-ideal capacitive behaviour and a distribution of relaxation times. The CPE exponent n ranges between 0 and 1, with values approaching 1 indicating behaviour closer to that of an ideal capacitor. A Warburg element (W) was included only when required to reproduce a distinct low-frequency mass-transport contribution. Its presence was not interpreted as evidence of exclusively diffusion-controlled corrosion or of a specific transport pathway. The experimental and fitted Nyquist and Bode responses for all investigated coating/medium/time combinations are provided in the Supplementary File.
Following each immersion period, the coated specimens were examined by scanning electron microscopy (SEM) to assess the post-immersion surface morphology. Backscattered-electron (BSE) micrographs were acquired using a scanning electron microscope CIQTEK SEM3200 (CIQTEK Co., Ltd., Hefei, China) equipped with a BSE detector, operated at an accelerating voltage of 30 kV. Representative micrographs were collected at 500× magnification for all coating/medium/time combinations to allow direct comparison of the surface morphology. The SEM examination focused on the preservation of the crystalline morphology, coating continuity, local cracks or discontinuities, and the occurrence of surface deposits after immersion. For comparison, the SEM morphology of the as-prepared coatings before immersion is available in our previous study [34].
3. Results and Discussion
3.1. Results Obtained in Ringer’s Solution
3.1.1. Ti64/Ringer at 30, 60 and 90 Days
As shown in Figure 1a, 30 days after immersion in Ringer’s solution, the Ti64 sample exhibits an incomplete capacitive arc that increases at low frequencies. The maximum value of the real component (Zr) is approximately 17 kΩ·cm2, whilst that of the imaginary component (−Zi) is approximately 28 kΩ·cm2. After 60 days, there is a significant change, with the spectrum shifting towards higher impedance values, reaching approximately 34 kΩ·cm2 for Zr and 60 kΩ·cm2. This increase compared with the 30-day mark indicates an improvement in the surface’s electrochemical resistance. In the case of uncoated Ti64, this trend may be associated with a change in or stabilisation of the TiO2 passive layer. At 90 days, the impedance decreases, with the spectrum similar in scale to that at 30 days, but with lower values of approximately 14 kΩ·cm2 and 24 kΩ·cm2.
Figure 1.
Diagrams specific to Ti64/Ringer system: (a) Nyquist; (b) Bode (The black lines are plotted using the left axis. The blue lines are plotted using the right axis).
Furthermore, analysing Figure 1b, it can be seen that after 60 days, the value of the logarithm of the impedance modulus (log|Z|) at low frequencies is approximately 4.8, compared with the other two values at 30 and 90 days, which is consistent with the observations at Nyquist. As for the phase angle, the value for the sample tested after 60 days is approximately −80°. Such a response is characteristic of capacitive behaviour and may be associated with a more stable passive layer. At 30 and 90 days, the phase curves are more complex, with changes observed in the low- to mid-frequency range, suggesting an electrochemical response that reflects multiple processes.
For the Ti64 specimen immersed in Ringer’s solution for 30 days, the Nyquist plot shows a capacitive response characteristic of a passivated alloy; this behaviour can be associated with the equivalent circuit R(QR)(QR), shown in Figure 2. This behaviour can be attributed to the presence of a non-uniform passive layer, which consists of a more hydrated outer zone and a more compact inner component in contact with the metal substrate.
Figure 2.
R(QR)(QR) equivalent circuit.
The interpretation of the passive film as a duplex structure is consistent with EIS models reported for titanium and its alloys in physiological environments. Pan et al. [34] described the passive film as comprising a compact inner layer that acts as a barrier and a more porous outer region, whilst Assis and Costa [35] identified two time constants associated with the porous and barrier regions in long-term immersion tests of Ti64 and other titanium alloys.
The parameter values obtained (Table 2) indicate a significant resistive contribution from the passive layer. Consequently, the total resistance associated with the electrochemical response (R1 + R2) is 1.92 × 10⁵ Ω·cm2, showing that Ti64 develops a protective layer in Ringer’s solution within the first 30 days. The values of the exponents n1 and n2 are close to 1, indicating predominantly capacitive behaviour, though not ideal. This may be due to the inhomogeneity of the passive layer’s surface.
Table 2.
Equivalent circuit element values for Ti64/Ringer system.
For the sample tested at 60 days, the chosen equivalent circuit is R(QR) from Figure 3, indicating a more homogeneous electrochemical response. Thus, the behaviour of the sample at 60 days is governed primarily by the properties of the passive layer, with no clear separation of two distinct processes. The resistance value, which is almost double that shown in Table 2, indicates that Ti64 exhibits more effective protection after 60 days in Ringer’s medium. Furthermore, the exponent n is close to 1, indicating behaviour that is nearly ideal capacitive, although a certain deviation persists, which may be associated with the actual inhomogeneity of the passive film.
Figure 3.
R(QR) equivalent circuit.
For the sample tested at 90 days, two characteristic processes are more clearly distinguishable in the Bode plot, which supports the use of the R(Q(R(CR))) circuit shown in Figure 4. These can be associated with a process related to the surface layer and a second process associated with the inner region of the passive film and charge transfer at the Ti64/solution interface.
Figure 4.
R(Q(R(CR))) equivalent circuit.
The lower value of n1 at 90 days indicates a more dispersed and non-ideal passive response compared with that observed at 60 days. This change is accompanied by a decrease in the overall impedance and by the appearance of two distinguishable electrochemical contributions in the Bode response. These results indicate a modification of the passive film and of the Ti64/solution interfacial response during prolonged immersion. The EIS data do not, however, distinguish whether this behaviour originates from localised loss of passive-film integrity or from a more general modification of the passive layer. A time-dependent trend in the passive response of Ti64 has also been reported in other simulated physiological media. Tamilselvi et al. [36] used EIS to demonstrate the time-dependent behaviour of the passive film on Ti64 ELI in SBF, with the response being described by one or two time constants, depending on the immersion period. Furthermore, Alves et al. [37] They observed variations in the resistance of the passive layer of Ti64 as a function of exposure time in Hank’s solution, confirming the dynamic nature of the alloy–physiological medium interface.
3.1.2. Zn-Zr-Mg/Ringer at 30, 60 and 90 Days
Figure 5a shows the Nyquist plots for the Zn-Zr-Mg sample immersed in Ringer’s solution for 30, 60 and 90 days. Thus, at 30 days, the sample exhibits the broadest response, with values at the low-frequency limit of approximately 34 kΩ·cm2 for Zr and 51 kΩ·cm2 for −Zi. After 60 days, the curve flattens out significantly, down to a Zr of approximately 18 kΩ·cm2 and for −Zi of 31 kΩ·cm2. However, the curve remains relatively steep, suggesting that a significant capacitive contribution persists. Consequently, the reduction in the spectrum’s amplitude does not necessarily imply a loss of the layer’s protective properties, but rather indicates a change in the electrochemical response compared with that observed after 30 days. At 90 days, the behaviour changes again; Zr increases compared with 60 days, to approximately 26 kΩ·cm2, whilst −Zi reaches 25 kΩ·cm2. The lower ratio between Zr and −Zi suggests a change in the processes that control the response to low frequencies.
Figure 5.
Diagrams specific to Zn-Zr-Mg/Ringer system: (a) Nyquist; (b) Bode (The black lines are plotted using the left axis. The blue lines are plotted using the right axis).
At the same time, Figure 5b shows the Bode plots for the Zn-Zr-Mg/Ringer system. It can thus be seen that the logarithm of the impedance modulus at low frequencies is highest for the sample tested at 30 days, indicating that the system offers the greatest resistance to electrochemical processes. By 60 days, however, this value decreases significantly, reducing the protective response of the layer. At 90 days, the values remain lower than at 30 days, with the curve also differing from that at 60 days. Thus, the coating does not undergo linear degradation over time, but rather a change in the interface response during immersion. The shape of the phase curves suggests that the response is not controlled by a single process. This behaviour may be associated with the simultaneous contributions of the phosphate layer and the processes occurring at the layer/substrate interface in contact with the corrosive environment.
The equivalent circuit for the Zn-Zr-Mg/Ringer system at 30 days is R(QR)(CR) (Figure 6). The presence of the two branches, QR and CR, supports the observations from the Bode plot.
Figure 6.
R(QR)(CR) equivalent circuit.
The first branch has an exponent n that is far from 1, which indicates a non-ideal capacitive response, consistent with the heterogeneity of the phosphate layer obtained by chemical conversion. The second branch has a resistance that is more than an order of magnitude higher (Table 3). This may be associated with processes occurring at the layer/substrate interface. The total resistance at 30 days is approximately 5.75 × 10⁵ Ω·cm2.
Table 3.
Equivalent circuit element values for Zn-Zr-Mg/Ringer.
At 60 days, the equivalent circuit is R(QR)(QR), Figure 2, where the first branch (Q1R1) is specific to the outer region of the layer, which is more inhomogeneous and more exposed to the solution, whilst the second branch (Q2R2) represents the response of the inner region and the interface with the substrate. The fact that both processes are described by the CPE suggests that, after 60 days, the heterogeneity is no longer limited to the outer zone alone, but affects the entire electrochemical system. Furthermore, the decrease in R2 suggests a reduction in the resistive contribution associated with the coating/interfacial region.
The 90-day Bode plot shows a broad region of maximum phase associated with a dominant capacitive process, a deviation at low frequencies, and the need for a diffusion term to capture the low-frequency response. Thus, the equivalent circuit is R(Q(R(Q(RW)))), Figure 7, where Q1R1 represents the response of the outer layer, whilst (Q2(R2W)) represents the response of the inner region/layer-substrate interface, where the process is accompanied by diffusion limitations. The low-frequency deviation and the requirement for a Warburg element indicate that mass transport contributes to the electrochemical response at this stage.
Figure 7.
R(Q(R(Q(RW)))) equivalent circuit.
The decrease in n1 indicates a more dispersed and non-ideal electrochemical response at 90 days. Together with the lower resistance values, this suggests a modification of the coating/interfacial response during prolonged immersion. The introduction of the Warburg element indicates that mass transport contributes to the low-frequency response.
The SEM images show that the Zn-Zr-Mg layer retains its crystalline nature after 30, 60 and 90 days of immersion in Ringer’s solution (Figure 8). In all three cases, the same general morphology is observed, consisting of fine crystalline regions and lamellar or plate-like formations. The differences between the micrographs mainly reflect the local non-uniformity of the layer and the fact that different samples and areas were analysed at each time interval; they cannot be interpreted as a change in crystal size. After 90 days, the layer remains well defined, with no extensive areas of detachment. Localised, approximately circular agglomerates with a morphology distinct from the surrounding crystalline layer are also visible, particularly in the 90-day micrograph. Their appearance may be associated with surface deposits formed during immersion.
Figure 8.
SEM micrographs of the Zn-Zr-Mg phosphate conversion coating after immersion in Ringer’s solution for (a) 30 days, (b) 60 days, and (c) 90 days. Magnification: 500×.
Overall, prolonged immersion produces detectable changes at both morphological and electrochemical levels: SEM reveals the appearance of distinct localised surface deposits, while EIS shows a simultaneous modification of the low-frequency response, including a transport contribution at 90 days.
3.1.3. Mg-Zn-Zr/Ringer at 30, 60 and 90 Days
The Nyquist plots for the Mg-Zn-Zr/Ringer system are shown in Figure 9a. Over a 30-day period, the curve reaches its maximum, with Zr reaching approximately 62 kΩ·cm2 and −Zi is approximately 73 kΩ·cm2, with the arc being incomplete, indicating a capacitive response with high impedance. By contrast, at 60 days, the shape of the curve is very different. Up to the region where Zr equals 20–25 kΩ·cm2, it behaves similarly to that at 30 days, then the component −Zi rises sharply, whilst Zr changes very little, after which the curve shifts to the right again. This change in curvature makes it difficult to select the equivalent circuit. At 90 days, both Zr and −Zi are approximately 22 kΩ·cm2, with impedance significantly reduced.
Figure 9.
Diagrams specific to Mg-Zn-Zr/Ringer system: (a) Nyquist; (b) Bode (The black lines are plotted using the left axis. The blue lines are plotted using the right axis).
With regard to the Bode plots (Figure 9b), log|Z| at low frequencies is higher at 30 and 60 days than at 90 days. Therefore, the decrease in the layer’s barrier effect is most noticeable after 90 days. As regards the phase at 30 and 90 days, regions are observed that suggest the presence of several electrochemical processes that are not resolved in the measured frequency domain. At 60 days, the phase response appears altered in the low-frequency region, corresponding to the change in curvature observed on the Nyquist plot.
Thus, at 30 days, the impedance is high, with a non-ideal capacitive response involving overlapping processes, whilst at 90 days, log |Z| decreases significantly, although the response remains capacitive and non-ideal.
For the Mg-Zn-Zr/Ringer system at 30 days, the equivalent circuit is R(QR)(CR) (Figure 5), with the same topology as that of the Zn-Zr-Mg/Ringer system at 30 days. It exhibits two superimposed electrochemical contributions, the first being non-ideal, as reflected by the value of n1 (Table 4), consistent with the non-uniform nature of the phosphate layer, and the second exhibiting a value of R2 greater than R1, indicating that the slow process contributes significantly to the protective response of the layer.
Table 4.
Equivalent circuit element values for Mg-Zn-Zr/Ringer system.
The experimental curve at 60 days differs from that at 30 days, in which the R(QR)(CR) circuit does not reproduce the unusual change in direction; however, it is considered the most appropriate for describing the processes taking place. The Nyquist and Bode diagrams suggest that the system is undergoing an electrochemical transition, with overlapping processes that are not fully resolved within the measured range. The selected circuit adequately described most of the frequency domain, but deviations persisted at low frequencies, indicating the presence of slow processes not fully resolved by the model used. At this stage, the capacitive and diffusive contributions overlap, but diffusion is not yet sufficiently well developed for W to be determined reliably.
In contrast to the 60-day system, the equivalent circuit R(Q(RW)) for the 90-day system better describes both the Nyquist and Bode plots (Figure 10). The presence of the Warburg element suggests a mass-transport/diffusion contribution at low frequencies. The value of n (Table 4) indicates that the system retains a pronounced but non-ideal capacitive character, consistent with the heterogeneity of the layer after prolonged exposure. At the same time, the low resistance value supports the findings from the Nyquist and Bode plots, with a clear reduction in the barrier effect after 90 days.
Figure 10.
R(Q(RW)) equivalent circuit.
Thus, at 30 days, the sample exhibits an effective barrier, whilst at 60 days an intermediate stage is observed, which, by 90 days, leads to a reduction in impedance and a contribution to transport at low frequencies; prolonged exposure results in a gradual change in the layer’s electrochemical response.
The SEM images show that the Mg-Zn-Zr layer retains its crystalline morphology after 30 and 60 days of immersion in Ringer’s solution, with alternating regions of fine crystals and lamellar or plate-like formations (Figure 11). At 60 days, a localised dark region is visible, which may indicate a local alteration of the coating. At 90 days, the crystalline structure is still well defined, but the cracks and discontinuities between the crystalline aggregates become more evident, with no extensive detachment of the layer observed.
Figure 11.
SEM micrographs of the Mg-Zn-Zr phosphate conversion coating after immersion in Ringer’s solution for (a) 30 days, (b) 60 days, and (c) 90 days. Magnification: 500×.
These observations explain the EIS results, which show a clear reduction in impedance at 90 days and the emergence of a Warburg-type contribution at low frequencies. In this case, the electrochemical changes are also accompanied by a locally more discontinuous surface, indicating that prolonged exposure affects the layer’s response, without, however, leading to its generalised loss.
3.1.4. Zr-Zn-Mg/Ringer at 30, 60 and 90 Days
The Nyquist plot (Figure 12a) for the Zr-Zn-Mg/Ringer system shows the highest impedance at 30 days, with the curve reaching approximately 90 kΩ·cm2 for Zr and 100 kΩ·cm2 for −Zi, indicating the barrier effect of the layer. After 60 days, the impedance values decrease significantly to approximately 26 kΩ·cm2 for Zr and 31 kΩ·cm2 for −Zi. The values are close to those recorded at 90 days; the real component increases slightly to 33 kΩ·cm2, whilst the imaginary component decreases to approximately 25 kΩ·cm2.
Figure 12.
Diagrams specific to Zr-Zn-Mg/Ringer system: (a) Nyquist; (b) Bode (The black lines are plotted using the left axis. The blue lines are plotted using the right axis).
With regard to the Bode plots (Figure 12b), the distribution of electrochemical processes changes over time. Thus, at 30 days, the log |Z| at low frequencies is highest, consistent with the observations from the Nyquist plot. In this case, the phase curve suggests the superposition of processes with similar time constants, a characteristic of a phosphate layer obtained by chemical conversion. Although at 60 and 90 days, log |Z| at low frequencies decreases, the values between the two remain of similar magnitude. However, the phase curve differs from that at 60 days, indicating that the system does not return to the same electrochemical state.
For all measured periods, the chosen equivalent circuit is R(Q(R(CR))), as shown in Figure 4. The values of R1 and R2 for the sample tested at 30 days (Table 5) are consistent with the Nyquist plot. Furthermore, the exponent n indicates non-ideal capacitive behaviour, consistent with the layer’s heterogeneous nature. At 60 days, the values of Q and C increase, whilst the value of n decreases significantly, indicating increased heterogeneity and a change in the dielectric/interfacial properties of the layer. Furthermore, the value of R1 decreases, supporting a reduction in the barrier effect and an increase in non-ideal behaviour, in line with observations from Nyquist and Bode.
Table 5.
Equivalent circuit element values for Zr-Zn-Mg/Ringer system.
The decrease in the value of R1 90 days after immersion indicates a progressive reduction in the corrosion resistance of the phosphate coating. Furthermore, the increase in C indicates a change in the capacitive/interfacial response after prolonged immersion.
The Zr-Zn-Mg layer retains its crystalline nature at all three immersion intervals in Ringer’s solution (Figure 13). The surfaces analysed exhibit the same general morphology, with finely crystalline regions alternating with more developed lamellar and plate-like formations. The differences between the micrographs mainly reflect the local non-uniformity of the layer and the fact that different samples and areas were examined at each time interval. Even after 90 days, the layer remains well-defined, with no extensive areas of detachment or exposure of the substrate.
Figure 13.
SEM micrographs of the Zr-Zn-Mg phosphate conversion coating after immersion in Ringer’s solution for (a) 30 days, (b) 60 days, and (c) 90 days. Magnification: 500×.
The EIS response supports the idea that the layer remains present, but its electrochemical properties change during immersion. For all three time intervals, the data were described by the same equivalent circuit, R(Q(R(CR))), suggesting that the general nature of the interfacial response does not change fundamentally. The impedance is higher at 30 days, decreases at 60 days and remains lower after 90 days. At the same time, the SEM images do not show extensive loss of the coating. The changes observed by EIS thus appear to reflect changes in the properties of the coating and its interaction with the electrolyte rather than generalised morphological degradation.
3.2. Results Obtained in DPBS Solution
3.2.1. Ti64/DPBS at 30, 60 and 90 Days
The 30-day Nyquist plot (Figure 14a) for the Ti64/DPBS system shows a capacitive curve, with the real component reaching approximately 25 kΩ·cm2 and the imaginary component approximately 39 kΩ·cm2, indicating a passive surface response. At 60 days, the curve changes significantly, showing an increase in Zr to 43 kΩ·cm2 and a decrease of −Zi to 25 kΩ·cm2. Although the overall impedance remains relatively similar at 30 and 60 days, a significant decrease occurs at 90 days, with Zr reaching 9 kΩ·cm2 and −Zi is 19 kΩ·cm2. Thus, it can be observed that the alloy’s impedance response decreases significantly 90 days after immersion in DPBS.
Figure 14.
Diagrams specific to Ti64/DPBS system: (a) Nyquist; (b) Bode (The black lines are plotted using the left axis. The blue lines are plotted using the right axis).
Log |Z| at low frequencies at 60 days shows the highest value, according to the Bode plot (Figure 14b). Analysing the phase angle as well, it can be seen that at 30 days there is a passive response with at least two overlapping contributions, whilst at 60 days a change in the distribution of the electrochemical processes is observed. However, at 90 days, a significant decrease in log |Z| is observed, indicating a reduction in the electrochemical response of the passive layer after prolonged exposure.
The equivalent circuit that best describes the processes occurring after 30 days for the Ti64/DPBS system is R(QR)(QR) (Figure 2). In this case, the first branch is associated with the response of the passive layer, whilst the second branch can be attributed to the processes occurring at the layer/substrate interface. Table 6 shows that the two resistances are relatively high, indicating that the alloy exhibits stable passive behaviour after 30 days.
Table 6.
Equivalent circuit element values for Ti64/DPBS system.
At 60 days, the electrochemical contributions change, with the circuit that best describes them being R(Q(R(CR))), Figure 4. The values of Q and n in Table 6 have changed very little compared with those at 30 days, suggesting that the response associated with the passive layer remains relatively stable. In contrast, a change occurs in the slow process, where an ideal capacitive response appears. Thus, the results suggest a reorganisation of the interfacial response at 60 days.
At 90 days, the equivalent circuit suggests two coupled electrochemical contributions, given by R(Q(R(QR))), Figure 15. Although the values of the first branch remain close to those at 30 and 60 days, respectively, the resistance R2 decreases significantly, suggesting that the internal process becomes much less resistive, indicating a decrease in the protective nature of the layer/substrate region after prolonged exposure.
Figure 15.
R(Q(R(QR))) equivalent circuit.
The passive behaviour of Ti64 in phosphate-buffered media has also been reported in the specialist literature. Bai et al. [38] used electrochemical methods to demonstrate the formation of a stable passive layer on Ti64 in phosphate-buffered saline, whilst also showing that the electrochemical properties are sensitive to the microstructural characteristics of the alloy. In this study, the changes observed over the course of immersion further indicate that the response of the passive film in the phosphate medium is dynamic and cannot be characterised solely by a single measurement at a given exposure interval.
3.2.2. Zn-Zr-Mg/DPBS at 30, 60 and 90 Days
In the Zn-Zr-Mg/DPBS system, the Nyquist plots (Figure 16a) show that the impedance does not increase monotonically with immersion time. The responses at 30 and 60 days are relatively close, with a slight reduction at 60 days, whereas a pronounced increase is observed after 90 days. At this stage, the real component reaches approximately 89 kΩ·cm2 at 90 days. At the same time, the value of −Zi increases from 25 kΩ·cm2 to 53 kΩ·cm2. The Bode plots (Figure 16b) show the same trend, with similar low-frequency impedance levels at 30 and 60 days followed by a marked increase at 90 days. Thus, the main change in DPBS occurs between 60 and 90 days rather than as a continuous increase throughout the entire immersion period.
Figure 16.
Diagrams specific to Zn-Zr-Mg/DPBS system: (a) Nyquist; (b) Bode (The black lines are plotted using the left axis. The blue lines are plotted using the right axis).
The equivalent circuit for the samples tested at 30 and 60 days, respectively, is R(QR)(CR), whilst at 90 days it becomes R(Q(R(CR))), indicating a clear reorganisation of the electrochemical response. The data in Table 7 show that, for the first contribution, the values of Q and n at 30 and 60 days are similar, but the value of C increases, indicating a moderate reduction in the protective response of the slower process. The high R2 value at 90 days indicates an increased resistive contribution from the slower interfacial process.
Table 7.
Equivalent circuit element values Zn-Zr-Mg/DPBS system.
In the case of the Zn-Zr-Mg sample exposed in DPBS, the differences between the images obtained at 30, 60 and 90 days are local rather than structural (Figure 17). In all three cases, there are both regions with fine crystals and more developed lamellar or plate-like formations. The differences between the micrographs are mainly local and reflect the non-uniformity of the coating, given that different samples and areas were analysed for each time interval. Even after 90 days, the coating remains well-defined, with no signs of extensive delamination or obvious exposure of the substrate.
Figure 17.
SEM micrographs of the Zn-Zr-Mg phosphate conversion coating after immersion in DPBS for (a) 30 days, (b) 60 days, and (c) 90 days. Magnification: 500×.
In contrast to the relatively minor morphological variations, the EIS response changes more markedly over time. The impedance at 30 and 60 days is similar, with a slight reduction at 60 days, followed by a marked increase after 90 days. Also at 90 days, the equivalent circuit changes from R(QR)(CR) to R(Q(R(CR))). Thus, the increase in impedance following prolonged exposure is not accompanied by any major morphological change visible under SEM, suggesting that the change in the electrochemical response is primarily linked to the evolution of the interfacial properties of the layer–electrolyte system.
3.2.3. Mg-Zn-Zr/DPBS at 30, 60 and 90 Days
The behaviour of the Mg-Zn-Zr sample during the immersion period shows a different trend from that of the previous sample. The Nyquist plots (Figure 18a) show a high impedance at 30 days, followed by a significant decrease at 60 days. However, at 90 days, it increases again to approximately 90 kΩ·cm2 for Zr and 53 kΩ·cm2 for −Zi. However, at 90 days, it increases again to approximately 90 kΩ·cm2 for Zr and 53 kΩ·cm2 for −Zi. At the same time, the shape of the 90-day Nyquist plot differs from that of the 30-day plot, as the electrochemical response is different.
Figure 18.
Diagrams specific to Mg-Zn-Zr/DPBS system: (a) Nyquist; (b) Bode (The black lines are plotted using the left axis. The blue lines are plotted using the right axis).
The Bode plots (Figure 18b) confirm the previous observations, showing that log |Z| at low frequencies is high at 30 days, then decreases at 60 days and returns to the initial value at 90 days. However, the phase curve is completely different from that at 30 days, confirming that the system does not return to its previous electrochemical state.
For the sample tested at 30 days, the corresponding equivalent circuit is R(Q(R(CR))) (Figure 4), where two coupled contributions are observed. Meanwhile, an analysis of the values in Table 8 shows that at 30 days, the layer exhibits the most pronounced barrier effect. At 60 and 90 days, compared with 30 days, the processes are best described by the equivalent circuit (R(Q(R(C(RW))))), Figure 19, in which the Warburg element must be introduced to account for the low-frequency processes. Thus, taking into account the values in Table 8, it can be seen that after 60 days, the dispersive nature of the response increases and a mass transport contribution appears at low frequencies, accompanied by a reduction in the barrier effect.
Table 8.
Equivalent circuit element values Mg-Zn-Zr/DPBS system.
Figure 19.
R(Q(R(C(RW))))) equivalent circuit.
Although the overall impedance increases significantly at 90 days, the general mechanism does not revert to that observed at 30 days; rather, the W component must be maintained, whilst n remains very small. Thus, the increase in resistance associated with the slow process suggests the development of a more resistive interfacial state, without the system reverting to its initial electrochemical behaviour at 30 days.
In the Mg-Zn-Zr sample, the surface observed after 30 days consists largely of fine crystals arranged in aggregates with different orientations, amongst which more developed lamellar formations are also present (Figure 20a). After 60 days, plate-like and lamellar structures are more clearly predominant in the analysed field, and the surface takes on a more uneven appearance (Figure 20b). The most obvious difference appears after 90 days, when, in addition to the crystalline structure characteristic of the layer, a compact zone is present locally, with higher contrast and numerous cracks (Figure 20c). This formation may indicate a local alteration of the surface or the formation of deposits during immersion.
Figure 20.
SEM micrographs of the Mg-Zn-Zr phosphate conversion coating after immersion in DPBS for (a) 30 days, (b) 60 days, and (c) 90 days. Magnification: 500×.
The EIS behaviour is also non-uniform: the impedance is high at 30 days, falls sharply at 60 days and rises again after 90 days, without the system returning to its initial electrochemical state. At 60 and 90 days, the low-frequency response requires a Warburg-type contribution. In this case, the partial recovery of impedance at 90 days coincides with the appearance of a clear local morphological change, suggesting that the surface and the electrochemical response continue to evolve during prolonged exposure.
3.2.4. Zr-Zn-Mg/DPBS at 30, 60 and 90 Days
For the Zr-Zn-Mg samples immersed in DPBS solution, the Nyquist plots (Figure 21a) show a similar electrochemical response at 30 and 60 days, indicating only a limited change in interfacial characteristics over this period. At 90 days, the spectrum broadens considerably towards higher real and imaginary impedance values, indicating an increase in the system’s overall resistance and the development of superior anti-corrosion behaviour.
Figure 21.
Diagrams specific to Zr-Zn-Mg/DPBS system: (a) Nyquist; (b) Bode (The black lines are plotted using the left axis. The blue lines are plotted using the right axis).
The Bode plots (Figure 21b) show that the 90-day curve exhibits the highest impedance modulus at low frequencies, confirming that the best corrosion protection is achieved at 90 days. The phase angle curves indicate that at 30 and 60 days, the behaviour is dominated by two partially overlapping interfacial processes, whilst at 90 days, the change in the phase-angle response indicates a different distribution of electrochemical processes compared with the earlier immersion periods.
At 30 days, the equivalent circuit is R(Q(R(Q(RW)))), as shown in Figure 7, with the layer governed by both interfacial processes and diffusion, resulting in electrolyte penetration and ionic transport through the layer. At 60 days, the processes are characterised by a different circuit, namely R(Q(R(CR))) (Figure 4), with the behaviour less dominated by diffusion and more by barrier processes and charge transfer. The increase in resistance (Table 9) compared with 30 days suggests a strengthening of the layer’s protective effect.
Table 9.
Equivalent circuit element values for Zr-Zn-Mg/DPBS system.
At 90 days, in the R(C(R(QR)))(CR) circuit (Figure 22), the response is more complex and suggests the presence of distinct processes associated with the layer and the metal/layer/medium interface.
Figure 22.
R(C(R(QR)))(CR) equivalent circuit.
Thus, at 90 days, the system exhibits the greatest resistance to electrochemical processes, and the dominant resistance is already on the order of 105 Ω·cm2 (Table 10), indicating superior protection compared with 30 and 60 days. Overall, this indicates a non-monotonic evolution of the system, characterised by a change in the electrochemical mechanism and a marked increase in impedance after 90 days.
Table 10.
Equivalent circuit element values Zr-Zn-Mg/DPBS system for 90 days.
The SEM images (Figure 23) show that the Zr-Zn-Mg layer retains its crystalline nature after 30, 60 and 90 days of immersion in DPBS. At all three time points, finely crystalline regions are present, alongside well-defined lamellar and plate-like structures. Their distribution varies locally across the surface, but the overall morphology of the layer remains similar throughout the entire period analysed. Some local agglomerations with a different appearance to the crystalline matrix are also observed. After 90 days, the layer remains well-defined, with no extensive areas of detachment or significant exposure of the substrate.
Figure 23.
SEM micrographs of the Zr-Zn-Mg phosphate conversion coating after immersion in DPBS for (a) 30 days, (b) 60 days, and (c) 90 days. Magnification: 500×.
However, the EIS response reveals clear changes during immersion. At 30 days, a Warburg-type contribution appears at low frequencies, which is no longer necessary at 60 days, and after 90 days the impedance increases significantly and the response is described by the circuit R(C(R(QR)))(CR). In this case, the electrochemical changes are more evident than those observed in the surface morphology.
3.3. Results Obtained in EBSS
3.3.1. Ti64/EBSS at 30, 60 and 90 Days
The behaviour of the Ti64 alloy differs from that observed in Ringer’s solution and DPBS. Thus, the Nyquist plots (Figure 24a) show that at 30 days, the spectrum reaches approximately 24 kΩ·cm2 for the real component and approximately 39 kΩ·cm2 for the imaginary component, with the latter corresponding to a predominantly capacitive response of the passive layer. After 60 days, the value of Zr doubles, whilst that of −Z remains roughly the same. However, the curve changes shape, becoming less steep, indicating a relative increase in the resistive distribution. At 90 days, the values of the two components are equal, specifically 36 kΩ·cm2, which is higher than at 30 days. At the same time, the shape of the spectrum changes, with its curvature altering.
Figure 24.
Diagrams specific to Ti64/EBSS system: (a) Nyquist; (b) Bode (The black lines are plotted using the left axis. The blue lines are plotted using the right axis).
The Bode plots (Figure 24b) are consistent with the Nyquist plots; thus, the highest value of log |Z| at low frequencies is found in the 60-day test sample, followed by the 90-day sample, whilst the lowest value is found in the 30-day sample. As regards the phase curves, they reach similar values in the intermediate frequency range. This suggests that the passive layer retains its predominantly capacitive response throughout the immersion process. However, differences are observed at low frequencies, indicating a change in the contribution of the slow process associated with the layer/substrate interface; this evolution may be linked to changes in the properties of the passive film and the interfacial region during immersion.
For the Ti64 alloy immersed in EBSS, the values of the equivalent circuit parameters indicate that the electrochemical response changes with increasing exposure time. At 30 days, the R(QR)(QR) circuit, Figure 2, showed a dominant resistive contribution of 2.55 × 10⁵ Ω·cm2 (Table 11), whilst the values of n indicate non-ideal capacitive behaviour of the passive layer. After 60 days, the spectrum was described by an R(QR)(CR) circuit, Figure 6, whilst retaining a predominantly capacitive character. At 90 days, the equivalent circuit used is R(Q(R(CR))) (Figure 4), with higher values for R1 and R2 (Table 11) than at 60 days.
Table 11.
Equivalent circuit element values for Ti64/EBSS system.
These results, together with the |Z| values at low frequencies, show that the electrochemical response of the passive film does not evolve monotonically: the impedance increases up to 60 days, then decreases moderately at 90 days, whilst remaining above the level observed after 30 days. The change in circuit topology also indicates a reorganisation of the contributions from the passive film and the interfacial region during immersion.
3.3.2. Zn-Zr-Mg/EBSS at 30, 60 and 90 Days
The 30-day Nyquist plot (Figure 25a) shows the longest curve, with the real component reaching approximately 90 kΩ·cm2, whilst the imaginary component reaches 130 kΩ·cm2. These values indicate that the layer exhibits a significant barrier effect at this stage. Subsequently, at 60 days, the spectral width decreases by more than half, with both components at approximately 25 kΩ·cm2. However, the response improves at 90 days, although the values are lower than at 30 days. The fact that the shape of the spectrum at 90 days differs from that at 30 days suggests that the increase in impedance between 60 and 90 days is associated with changes in the processes controlling the electrochemical response, not merely with the return of the layer’s original properties.
Figure 25.
Diagrams specific to Zn-Zr-Mg/EBSS system: (a) Nyquist; (b) Bode (The black lines are plotted using the left axis. The blue lines are plotted using the right axis.).
As regards the value of |Z| observed in the Bode plot (Figure 25b), the order is the same. The sample tested at 30 days shows the highest value of log |Z| (~5.2), whilst the one at 60 days has the lowest value (~4.5). The phase curves also show significant changes over time. Broad, asymmetric profiles can be observed, with peaks indicating the superposition of several electrochemical contributions. The concomitant changes in the phase angle profile suggest that this increase does not represent a simple return to the initial state but is associated with a redistribution of the electrochemical processes that contribute to the response of the layer and the interface.
The equivalent circuits corresponding to the three samples are R(Q(R(CR))), Figure 4, for 30 days, R(QR)(CR), Figure 6, for 60 days, and R(Q(R(Q(RW)))), Figure 7, for 90 days. Consequently, the test’s response behaviour changes every 30 days. Furthermore, an analysis of the values in Table 12 shows that they are consistent with the observations by Nyquist and Bode, with the highest resistances, R1 and R2, corresponding to the sample tested at 30 days. The increase in n indicates that the corresponding capacitive response becomes less dispersed and approaches more closely an ideal capacitive behaviour. As regards the sample tested at 60 days, the combination of decreasing resistances and increasing capacitive parameters may indicate a change in the barrier properties of the layer, with a greater contribution from the electrolyte/interfacial region to the EIS response.
Table 12.
Equivalent circuit element values for Zn-Zr-Mg/EBSS system.
Although at 90 days, Nyquist and Bode showed that the probe impedance increased compared with that at 60 days, the main internal resistance (R2) remained close to that at 60 days. Consequently, the increase in overall impedance at 90 days cannot be explained simply by an increase in barrier resistance. The change in circuit topology and the presence of the Warburg element suggest that the low-frequency response is also influenced by transport processes at this stage. Consequently, the behaviour observed at 90 days can be interpreted as a reorganisation of the electrochemical response of the layer–interface system, rather than a return to the initial state.
The SEM (Figure 26) and EIS results together describe the evolution of the Zn–Zr–Mg layer during immersion in EBSS. The crystalline morphology is preserved throughout the entire period analysed, with no extensive detachment, whilst the electrochemical response changes with exposure time. Impedance is high at 30 days, decreases at 60 days and increases again at 90 days, and at the latter time point a Warburg-type contribution also appears at low frequencies. These results indicate that, although the overall morphological integrity of the layer is maintained, its electrochemical properties and its interaction with the EBSS medium evolve over the course of immersion.
Figure 26.
SEM micrographs of the Zn-Zr-Mg phosphate conversion coating after immersion in EBSS for (a) 30 days, (b) 60 days, and (c) 90 days. Magnification: 500×.
3.3.3. Mg-Zn-Zr/EBSS at 30, 60 and 90 Days
For the Mg-Zn-Zr/EBSS system, the Nyquist plots (Figure 27a) show lower impedance values at 30 days compared with the Zn-Zr-Mg/EBSS system, with a value of approximately 78 kΩ·cm2 for Zr and 126 kΩ·cm2 for −Zi. As time passes, the values of the two components decrease, reaching 55 kΩ·cm2 for Zr and 32 kΩ·cm2 for −Zi. This trend indicates a gradual decline in the impedance response, accompanied by a marked change in the system’s electrochemical behaviour at 90 days. The Bode plots (Figure 27b) show a moderate difference between the impedance modules. At the same time, the phase curves at 30 and 60 days are relatively similar in shape, with broad and non-ideal responses, suggesting the superposition of several electrochemical contributions. At 90 days, the phase profile changes much more distinctly, particularly at low frequencies. The angle becomes less negative in this region, consistent with the shape of the Nyquist spectrum and a relatively more pronounced resistive contribution. Consequently, over 30 to 60 days, there appears to be primarily a reduction in the response amplitude, without a radical change in its shape. At 90 days, however, the decrease in impedance is accompanied by a change in the distribution of the electrochemical processes.
Figure 27.
Diagrams specific to Mg-Zn-Zr/EBSS system: (a) Nyquist; (b) Bode (The black lines are plotted using the left axis. The blue lines are plotted using the right axis).
At 30 days, the system’s behaviour is best described by the R(QR)(CR) circuit, Figure 6. The data in Table 13 show that the value of R2 is highest at 30 days, whilst the value of n is lowest. Therefore, even though the protection is high, the first contribution’s response is highly suboptimal, indicating a wide distribution of time constants. At 60 and 90 days, the corresponding circuit is R(Q(R(CR))) (Figure 4). Compared with 30 days, the value of R2 decreases by approximately 22%, in line with the reduction in impedance observed in the Nyquist plot. However, as n increases, the decrease in impedance from 30 to 60 days is not associated with an increase in non-ideality. On the contrary, the CPE response approaches ideal capacitive behaviour. The main changes are a reduction in the resistive contribution and a change in the coupling mode of the processes.
Table 13.
Equivalent circuit element values Mg-Zn-Zr/EBSS system.
Comparing 60 and 90 days, it can be seen that at 90 days, R1 increases, whilst R2 decreases significantly. At the same time, the capacitance (C) increases quite significantly. The change in parameter values indicate a substantial modification of the internal/interfacial electrochemical response at 90 days.
The SEM images show that the Mg-Zn-Zr layer retains its crystalline nature after 30, 60 and 90 days of immersion in EBSS (Figure 28). The surface consists of fine crystalline regions interspersed with lamellar and plate-like structures; this morphology is present at all three time points. After 60 days, some cracks and discontinuities between the crystalline aggregates become visible in places, and these persist even after 90 days. However, the coating remains well-defined on the surface, with no extensive delamination. The appearance of local discontinuities in the SEM images, together with the progressive reduction in impedance, indicates a change in the coating’s properties and its interfacial response during immersion, without any widespread loss of the coating.
Figure 28.
SEM micrographs of the Mg-Zn-Zr phosphate conversion coating after immersion in EBSS for (a) 30 days, (b) 60 days, and (c) 90 days. Magnification: 500×.
3.3.4. Zr-Zn-Mg/EBSS at 30, 60 and 90 Days
At 30 and 90 days, the Nyquist plots (Figure 29a) show higher impedance values than at 60 days. Thus, the value of the real component changes from 85 kΩ·cm2 to 27 kΩ·cm2 at 60 days and to 137 kΩ·cm2 at 90 days. At the same time, the imaginary component has values of 124 kΩ·cm2 at 30 days, 21 kΩ·cm2 at 60 days, and 68 kΩ·cm2 at 90 days. At 30 days, the curve indicates a more pronounced capacitive response, whilst at 90 days, the curve shows a greater resistive contribution.
Figure 29.
Diagrams specific to Zr-Zn-Mg/EBSS system: (a) Nyquist; (b) Bode (The black lines are plotted using the left axis. The blue lines are plotted using the right axis).
The Bode plots (Figure 29b) confirm the previous observations. In terms of impedance amplitude, the system loses much of its protective response after 60 days, and by 90 days, the impedance returns to approximately the same order of magnitude as at 30 days. The phase angle profiles differ markedly between the three time intervals and exhibit several changes in slope. At 30 days, the response is predominantly capacitive over a wide range, consistent with the very steep Nyquist spectrum. This stage corresponds to a high-impedance layer with a significant capacitive contribution. At 60 days, the phase curve changes significantly, accompanied by a reduction in the impedance modulus by almost one order of magnitude compared with 30 days. The more complex phase profile suggests that, in this stage, several relaxation processes are more clearly separated. And at 90 days, the impedance returns to values close to those at 30 days, but the phase profile is completely different. Particularly in the low-frequency range, the response does not replicate the behaviour seen at 30 days.
At 30 days, the circuit used is R(Q(R(CR))) (Figure 4). According to Table 14, the resistance values are very high, which is fully consistent with the Nyquist and Bode plots. However, the value of n is relatively small, indicating non-ideal capacitive behaviour. Thus, the layer is resistive, but there is a distributed response. Consequently, the chosen circuit suggests that the internal response represented by CR is coupled to the layer’s overall response.
Table 14.
Equivalent circuit element values Zr-Zn-Mg/EBSS system.
As can also be seen in the Bode plot, at 60 days the response becomes more complex, characterised by a circuit with three constants, R(QR)(QR)(QR), Figure 30.
Figure 30.
R(QR)(QR)(QR) equivalent circuit.
This suggests that the response arises from several overlapping relaxation processes. Looking at the values of the exponents n in Table 15, it can be seen that they are closer to 1 than those at 30 days. Consequently, the decrease in impedance at 60 days cannot be explained simply by an increase in heterogeneity. The system becomes less resistive, but each identified process exhibits a relatively well-defined capacitive character.
Table 15.
Equivalent circuit element values for Zr-Zn-Mg/EBSS system for 60 days.
After 90 days, the impedance rises again to values close to those observed at 30 days, but the response is described by the circuit R(Q(RW)), Figure 10. Thus, Table 14 shows that the resistance value associated with the main process increases compared with that at 60 days (Table 15). At the same time, the value of n is higher than that at 30 and 60 days, respectively, indicating a predominantly capacitive response that is closer to the ideal. Consequently, the recovery of impedance after 90 days does not represent a return of the system to the state observed after 30 days. The change in the circuit and the emergence of the Warburg contribution indicate that, at this stage, the low-frequency response is also influenced by transport processes, confirming the existence of distinct electrochemical states during immersion.
In EBSS, the surface of the Zr-Zn-Mg sample remains covered by crystalline structures across all three analysed intervals (Figure 31). In all three intervals, finely crystalline regions are present, alongside lamellar and plate-like formations, distributed unevenly across the surface. No extensive areas of delamination or substrate exposure are observed, and the general appearance of the layer remains well defined throughout the entire period analysed.
Figure 31.
SEM micrographs of the Zr-Zn-Mg phosphate conversion coating after immersion in EBSS for (a) 30 days, (b) 60 days, and (c) 90 days. Magnification: 500×.
In line with the SEM observations, the EIS results indicate a trend that is clearly dependent on the immersion time. The impedance is high at 30 days, decreases significantly at 60 days and rises again at 90 days, reaching values similar in order of magnitude to the initial ones. At the same time, the equivalent circuit changes successively from R(Q(R(CR))) at 30 days, to R(QR)(QR)(QR) at 60 days, and to R(Q(RW)) after 90 days. Thus, the maintenance of a well-defined crystalline surface is accompanied by significant changes in the electrochemical response, indicating that exposure in EBSS leads to different interfacial states throughout the immersion process.
3.4. A Comparative Analysis of the Effect of Immersion Time on Electrochemical Behaviour
3.4.1. Comparison of Samples in Corrosive Environment
Ringer’s Solution
A comparison between the uncoated Ti64 and the three coated samples highlights significant differences in both impedance levels and the evolution of the electrochemical response over time. After 30 days of immersion, all three conversion layers exhibited broader Nyquist spectra than the uncoated substrate. Consequently, the general order of the electrochemical response can be:
Zr-Zn-Mg > Mg-Zn-Zr > Zn-Zr-Mg > Ti64
The order of the samples changed after 60 days. Consequently, Ti64 shows a marked increase in impedance, whilst Zn-Zr-Mg and Zr-Zn-Mg show a clear reduction.
After 90 days, the situation once again becomes more favourable for the coated samples compared with the uncoated substrate. From the experimental spectra, all three coated samples exhibit higher low-frequency impedances than Ti64. The approximate order is:
Zr-Zn-Mg > Zn-Zr-Mg > Mg-Zn-Zr > Ti64
The results thus show that all coatings outperform Ti64 at 30 days and retain this advantage even after 90 days, whilst the Zr-Zn-Mg coating exhibits the most stable long-term behaviour in this environment.
The DPBS Solution
In DPBS, the differences between samples are more strongly dependent on immersion time than in Ringer’s solution. Thus, after 30 days, the highest impedance is observed for Mg-Zn-Zr. At the same time, Ti64 exhibits a lower response, but one that remains higher than that observed for Zn-Zr-Mg and is close to or higher than that of Zr-Zn-Mg at this stage. Consequently, at 30 days, the mere presence of the conversion layer does not automatically guarantee a higher impedance than that of the titanium alloy’s natural passive film. The effect, therefore, depends significantly on the coating’s composition.
In the case of the Mg-Zn-Zr sample, the decrease between 30 and 60 days is much more pronounced. The results indicate both a reduction in the barrier effect and the emergence of a transport contribution at low frequencies. At 60 days, of the four systems, Ti64 exhibits one of the highest impedance responses. This situation differs from that observed after 30 days for Mg-Zn-Zr and shows that the natural passive film can temporarily become highly effective in DPBS.
At 90 days, Zn-Zr-Mg and Mg-Zn-Zr exhibit very broad Nyquist spectra with high impedance modulus, whilst Zr-Zn-Mg also remains well above Ti64.
The comparison after 90 days thus indicates a clear advantage of all coatings over Ti64. Zn-Zr-Mg and Mg-Zn-Zr exhibit the highest overall impedances, Zr-Zn-Mg is also at a high level, and Ti64 shows the greatest reduction in electrochemical response. It is noteworthy that this differentiation occurs in an environment where the pH remains almost constant. Starting at 7.3, after 90 days, the values range from 7.18 to 7.23 across all samples. Thus, the very large variations in impedance cannot be explained by significant changes in the solution’s overall pH. More likely, they reflect the specific interactions between the ionic composition of DPBS and each layer type, as well as the evolution of the interface during immersion.
The EBSS
In EBSS, after 30 days, the three coatings show a very marked advantage over Ti64, whilst the differences between them are relatively small compared with the difference relative to the uncoated substrate. The three coatings exhibit similar performance at the start of exposure; however, the equivalent circuits show that they are not electrochemically identical.
After 60 days, the behaviour of the samples diverges significantly. Mg-Zn-Zr retains the highest response amongst the coated layers, with an impedance modulus of approximately 105 Ω·cm2, and remains higher than that of Ti64. In contrast, Zn-Zr-Mg and Zr-Zn-Mg show much more pronounced decreases at 60 days.
After 90 days, the order of the samples changes again. Zr-Zn-Mg exhibits the highest impedance, exceeding that of the other systems, whilst the impedance of the Mg-Zn-Zr sample decreases progressively up to 90 days. At 90 days, all three layers continue to exhibit an impedance response superior to that of uncoated Ti64. The approximate order is the same as that in Ringer, namely
Zr-Zn-Mg > Zn-Zr-Mg > Mg-Zn-Zr > Ti64
3.4.2. The Influence of the Immersion Medium and Variations in pH
A comparison of the electrochemical behaviour of the same samples in Ringer’s, DPBS and EBSSs highlights that the evolution of the layers is determined not solely by immersion time or composition, but also by the nature of the medium. Differences are observed both in the Nyquist plot spectra and in the log |Z| values at low frequencies, as well as in the modification of the equivalent circuits required to describe the electrochemical response. Furthermore, the three solutions exhibited markedly different pH behaviours after 90 days: Ringer’s solution showed slight acidification, DPBS maintained values close to the initial values, and EBSS became alkaline across all samples.
For the uncovered specimen, differences between the averages are already observable after 30 days. Thus, in Ringer’s solution, the Nyquist response is lower, whilst in DPBS and EBSS the spectra are broader, indicating a greater contribution from the passive layer formed on the alloy’s surface. After 90 days, the difference between the means is even more evident, with Ti64 exhibiting the lowest response in DPBS. Although the values are higher in Ringer, they are lower than those obtained in EBSS. Thus, following prolonged exposure, EBSS favours the highest impedance response of the uncoated substrate, whilst DPBS leads to the most pronounced reduction.
The effect of the medium is even more pronounced for Zn-Zr-Mg. After 30 days, the layer exhibits the highest impedance in EBSS, indicating a highly resistive response. In Ringer’s solution, the impedance is lower, whilst in DPBS, the response at 30 days is the lowest of the three media. Consequently, during the initial period, EBSS is the medium in which the Zn-Zr-Mg coating exhibits the most pronounced barrier effect. After 60 days, the differences between the three solutions diminish, but the mechanisms remain distinct. In EBSS, resistance values decrease significantly. At 90 days, the behaviour of the Zn-Zr-Mg layer becomes almost the opposite of that observed at the start of exposure. In Ringer’s solution, impedance remains relatively low, whilst in EBSS, impedance increases again compared with the 60-day mark. In DPBS, by contrast, impedance increases very sharply. Thus, for Zn-Zr-Mg, DPBS yields the most favourable response after 90 days, EBSS occupies an intermediate position, and Ringer causes the most pronounced reduction in the long-term impedance response.
For Mg-Zn-Zr, the differences between the media are also significant. At 30 days, the highest impedances are observed in EBSS and DPBS, whilst Ringer shows a slightly lower response. After 60 days, EBSS maintains the highest response for Mg-Zn-Zr. In DPBS, the impedance decreases significantly, whilst in Ringer’s solution, the spectrum at 60 days exhibits a distinctive shape in the low-frequency region, and the selected model does not perfectly reproduce this region. After 90 days, DPBS and EBSS again result in significantly higher impedances than Ringer’s solution. In DPBS, Mg-Zn-Zr recovers a significant portion of the impedance lost at 60 days, although the Warburg circuit persists, indicating that the system does not return to the state observed at 30 days. Thus, for this composition, DPBS provides the most favourable response after 90 days, EBSS maintains an intermediate level, whilst Ringer results in the most pronounced reduction in protection.
Zr-Zn-Mg exhibits the most pronounced dependence on the medium. After 30 days, the layer has a very high impedance in both Ringer’s solution and EBSS, whilst in DPBS the response is considerably lower. After 60 days, the differences between the media diminish, and the impedance decreases in all three solutions. At 90 days, the differences become very large once again. In Ringer’s solution, Zr-Zn-Mg exhibits a much lower impedance than at 30 days. In DPBS, the impedance increases considerably, whilst in EBSS, the response is the highest of the three media. Thus, for Zr-Zn-Mg, the ranking by overall impedance after 90 days is EBSS, followed by DPBS and Ringer.
The differences between the three media are also reflected in the pH values measured after 90 days. In Ringer’s solution, the initial pH of 7.4 decreases to 7.33 for Ti64, 6.99 for Zn-Zr-Mg, 7.04 for Mg-Zn-Zr and 7.24 for Zr-Zn-Mg. The most pronounced acidification thus occurs in the presence of the Zn-Zr-Mg layer. In DPBS, starting from a pH of 7.3, the final values fall within a very narrow range, between 7.18 and 7.23. This stability indicates that the medium maintains its buffering capacity throughout the entire period analysed. In contrast, in EBSS, the behaviour is completely different: the pH rises from 7.4 to 8.73 for Ti64 and to 8.50–8.53 for all three coated samples.
The alkaline shift observed in EBSS is likely to influence the equilibrium of phosphate species in solution and at the coating–electrolyte interface. As the pH increases, phosphate species become progressively more deprotonated, which can increase the tendency of calcium-phosphate phases to precipitate when their ionic activity product approaches or exceeds the corresponding solubility product. Under these conditions, the formation of calcium-phosphate deposits, including hydroxyapatite-related phases, becomes more favourable and may contribute to changes in the interfacial response of the coatings during prolonged immersion. At the same time, the very similar final pH values measured for the three coated samples, despite their clearly different EIS responses, indicate that alkalisation alone does not govern the electrochemical behaviour. The response therefore remains strongly dependent on the coating composition and on its interaction with the ionic species present in EBSS [39,40,41].
These results show that the variation in pH and the change in impedance are not directly proportional. In DPBS, for example, the final pH is nearly identical across all samples, although the EIS responses after 90 days differ markedly. Similarly, in EBSS, the three coatings exhibit virtually the same final pH (8.50–8.53), but their impedances and equivalent circuits differ significantly. Consequently, the overall pH of the solution cannot, on its own, explain the differences in electrochemical behaviour. The observed response reflects the combined influence of electrolyte chemistry, coating composition and the evolution of the coating–electrolyte interface during immersion.
The influence of electrolyte composition on the Ti64 response was also highlighted by Rahimi et al. [42], who observed significant differences in the behaviour of the alloy in PBS, Hank’s solution and NaCl, with the highest corrosion resistance being reported in the phosphate medium. The authors demonstrated that phosphate and calcium species can alter the electrochemical interactions within the oxide layer. This result supports the view that the differences observed here between Ringer’s solution, DPBS and EBSS should be interpreted in relation to the ionic composition of the medium and not solely in terms of pH variation.
Overall, a comparison of the results shows that Ringer’s solution is the medium in which the protective effect of the coatings diminishes most noticeably in the long term, even though all three layers remain intact after 90 days on uncoated Ti64. DPBS favours a different trend, characterised by several coatings, with an increase in impedance between 60 and 90 days, with minimal variation in pH. EBSS produces the greatest changes in pH, but maintains or develops very high impedance responses for some compositions; the case of Zr-Zn-Mg is the most evident, with this sample exhibiting the highest impedance in EBSS after 90 days amongst the three media. The results thus confirm that the long-term performance of the coatings is not an exclusive property of the coating composition, but rather the result of the interaction between the coating composition, exposure time and the chemistry of the immersion medium.
3.4.3. The Influence of the Chemical Composition of the Layer
A comparison of the three conversion layers shows that the relative proportions of Zn, Mg, and Zr influence not only the impedance level but also how the electrochemical response evolves during immersion. The differences between the samples become more evident as the exposure time increases, indicating that the effect of composition should not be assessed solely on the basis of initial performance. A coating that exhibits high impedance after 30 days is not necessarily the one that best maintains its protective properties after 90 days. Furthermore, the same composition may exhibit markedly different behaviour in Ringer’s solution, DPBS, and EBSS, highlighting the interaction between the chemistry of the coating and that of the immersion medium.
For Zn-Zr-Mg, a higher Zn content is associated with a favourable initial electrochemical response but with stability that is highly dependent on the immersion medium. In Ringer’s solution, the barrier effect gradually diminishes, and after prolonged exposure, transport contributions at low frequencies emerge, indicating a change in how the layer interacts with the electrolyte. In DPBS, the same composition exhibits more favourable long-term behaviour, with impedance increasing after 90 days and a reorganisation of the interfacial response, without the emergence of a dominant diffusion contribution. In EBSS, the layer exhibits very good behaviour initially, followed by a significant decline at 60 days and a partial recovery at 90 days, albeit in an electrochemical state different from the initial one. Overall, the higher Zn content appears to favour a pronounced initial barrier effect, but the stability of this effect is sensitive to the environmental composition.
For Mg-Zn-Zr, the higher proportion of Mg leads to more variable behaviour over time and greater sensitivity to the immersion medium. In Ringer’s solution, the coating exhibits a marked reduction in its barrier effect after prolonged exposure, and the response at 90 days is influenced by transport processes. In DPBS, the behaviour is more complex: impedance drops sharply at an intermediate stage, but rises again after prolonged exposure, without the system returning to its initial state. In EBSS, the trend is toward a progressive decline in barrier properties, particularly due to changes in the internal/interfacial region. Thus, a higher proportion of Mg does not appear to offer the best long-term stability in Ringer’s solution or EBSS, but may lead to a favourable response in DPBS, indicating a pronounced dependence on the chemistry of the electrolyte. The sensitivity of this composition to the immersion medium may also be linked to how Mg influences the formation and microstructure of the phosphate phases. Li et al. [30] have shown that, for magnesium phosphate coatings predominantly based on newberyite and obtained by chemical conversion on titanium, the continuity and density of the coating significantly influence its electrochemical behaviour, with more compact coatings exhibiting higher corrosion resistance.
For Zr-Zn-Mg, the higher proportion of Zr is associated with the most favourable long-term protective response in Ringer and EBSS. In Ringer, although the impedance decreases over time, the general pattern of the electrochemical response is maintained, suggesting more stable behaviour of the system than in the other two compositions. In EBSS, the coating exhibits a significant decline at 60 days, followed by a strong recovery at 90 days; however, this recovery is accompanied by a change in the mechanism and the emergence of a transport contribution. In DPBS, the advantage of the Zr-rich composition is less evident, as the other two coatings also develop very high impedance responses following prolonged exposure. Overall, a higher proportion of Zr appears to favour the long-term stability of the coating, particularly in Ringer and EBSS, although this effect cannot be considered universal across all environments.
The more favourable behaviour of the layer with a higher Zr content is consistent with previously obtained results for Zn–Zr and Zn–Mg phosphate coatings deposited on Ti64. In that study [33], the introduction of Zr favoured the formation of a more compact structure, whilst Mg was associated with the development of acicular crystals and more pronounced intergranular zones. The layers containing Zr also exhibited superior electrochemical behaviour in Ringer’s and Dulbecco’s solutions. These results may explain, at least in part, the greater stability currently observed for the Zr-Zn-Mg composition, without, however, implying that the effect of Zr is independent of the other constituents of the layer.
3.4.4. The Influence of Immersion Time on Electrochemical Stability
The immersion time clearly influenced the electrochemical behaviour of both the uncoated Ti64 alloy and the three conversion layers. However, the evolution was not monotonous and cannot be described as a simple progressive decrease in protection. Depending on the composition of the layer and the immersion medium, periods of impedance reduction, relatively stable response intervals, and, in some cases, subsequent increases in impedance following prolonged exposure were observed. Simultaneous changes in the Nyquist and Bode plots show that time affects not only the intensity of the electrochemical response but also the relative contributions of the processes occurring within the layer and at the interface with the substrate.
In the early stages of immersion, most of the coatings exhibited a pronounced barrier effect, superior to that of the uncoated alloy. As the exposure time increased, prolonged contact with the electrolyte altered the resistive-capacitive response of the coatings. For some samples, this manifested as a reduction in impedance and an increase in the capacitive contribution, a behaviour that may be associated with changes in the layer’s dielectric properties and a greater contribution from internal regions to the electrochemical response. In other cases, the intermediate immersion period was characterised by several relaxation processes or by a more pronounced separation of these processes in the Bode plots.
Following prolonged exposure, the behaviour of the samples became even more dependent on the coating–medium system. In Ringer’s solution, the response of most coatings indicated a reduction in the initial barrier effect, although all coated samples continued to exhibit more favourable behaviour than uncoated Ti64. In DPBS, an increase in impedance was observed for several compositions after the intermediate immersion period, suggesting that the evolution of the coating is not irreversibly directed towards a loss of protection. In EBSS, the behaviour varied from one composition to another: some coatings exhibited a progressive decline in barrier properties, whilst others recovered a significant portion of their impedance response following prolonged exposure.
The time-dependent nature of the Ti64/biological environment interface has also been observed in studies involving prolonged immersion. Höhn and Virtanen [43] highlighted changes in the surface film and the formation of Ca–P compounds during long-term exposure to DMEM, whilst Matykina et al. [44] reported changes in the electrochemical behaviour of Ti64 coatings over periods of up to eight weeks in simulated physiological environments. These results support the need to evaluate the coatings at multiple time points, as the interface condition may change substantially during immersion.
The changes in the equivalent circuits with immersion time support this interpretation. The fact that the same topology is maintained for certain samples indicates that the general electrochemical mechanism remains the same, even though the parameter values change. In other cases, the transition from circuits with two time constants to models with multiple relaxation processes or a Warburg element shows that the electrochemical response becomes governed by different combinations of processes. The emergence of a transport contribution at low frequencies following prolonged exposure should not automatically be interpreted as a complete loss of protection, as in some situations, this coexists with high overall impedance. Rather, the presence of this element indicates a change in the mechanism by which the layer and the interface interact with the environment.
A key finding of the study is that similar impedance values observed at different times do not always correspond to the same electrochemical state. In several cases, the response after prolonged exposure returned to a level comparable to the initial value, yet the shapes of the Bode and Nyquist plots and the selected equivalent circuit differed. For this reason, an increase in impedance following an intermediate decrease should not be described as a simple ‘recovery’ of the layer. The data rather indicate a reorganisation of the response of the layer and the interface, possibly as a result of ongoing interactions with species present in the immersion medium.
Overall, immersion time must be considered a factor that influences both changes in barrier properties and the evolution of electrochemical mechanisms. The long-term behaviour of the layers is not the result of uniform degradation, but of successive, environment-dependent processes, which may include changes in capacitive behaviour, the redistribution of time constants and the emergence of transport contributions. This evolution explains why assessing a layer’s stability based solely on a single immersion interval can yield incomplete conclusions about its performance in physiological environments.
3.4.5. The Evolution of Electrochemical Mechanisms During Immersion
An analysis of the equivalent circuits used to describe EIS spectra highlights that the electrochemical mechanisms do not remain constant throughout the immersion period. Depending on the composition of the layer and the exposure environment, the response evolves from predominantly resistive-capacitive behaviour towards more complex configurations, characterised by the superposition of several time constants or by the emergence of contributions associated with mass transport. This evolution is consistent with the changes observed simultaneously in the Nyquist and Bode plots and indicates a progressive transformation in how the electrolyte interacts with the conversion layer and the layer–substrate interface.
In the initial stages of immersion, most of the samples studied were described by circuits comprising two resistive-capacitive contributions, of the form R(QR)(CR) or R(Q(R(CR))). These models are consistent with the presence of a response associated with the conversion layer and a slower process involving the layer’s inner region and its interface with the substrate. The use of the CPE in place of an ideal capacitance reflects the non-uniform nature of the electrochemical response, determined by the distribution of the layer’s local properties. The difference between circuits with distinct branches and those with nested branches also indicates that the identified processes are not always independent but may be electrochemically coupled.
The use of two time constants to characterise passive titanium-based surfaces is also reported for Ti64 in simulated physiological environments. Tamilselvi et al. [36] They attributed the EIS response with two time constants to the complex structure of the passive film formed on the alloy in SBF. In the case of the conversion layers analysed here, however, the attribution of each contribution must be carried out with caution, as the phosphate coating introduces an additional interfacial structure relative to uncoated Ti64.
As the immersion time was extended, the same circuit topology could be maintained for some samples, suggesting that the general electrochemical mechanism was preserved, even though the relative contributions of the various components changed. This behaviour is characteristic of a progressive evolution of the layer, without the emergence of any fundamentally new process within the investigated frequency range. In other situations, however, the spectra in the intermediate frequency ranges required the introduction of additional QR-type contributions. The emergence of multiple time constants may be associated with the development of distinct electrochemical regions within the layer and at the interface, or with a clearer separation of processes which, at the start of exposure, were superimposed within the same frequency response.
Circuits containing three resistive-capacitive contributions best illustrate this increase in complexity. In such cases, it is not necessary for each branch to be attributed to a completely separate physical structure. More cautiously, they may be regarded as manifestations of several overlapping relaxation processes with different time constants. The shape of the Bode plots supports this interpretation, with plateaus and changes in slope across different frequency ranges. Consequently, the increase in the number of circuit elements should not be interpreted as direct evidence of the formation of a specific number of layers or phases, but rather as a reflection of the increased complexity of the electrochemical response.
Following prolonged exposure, it becomes necessary to introduce a Warburg term for many systems. Its presence indicates that mass transport contributes to the low-frequency behaviour and suggests that ionic species’ access to the system’s active regions is beginning to influence the measured response. However, this contribution should not automatically be equated with an exclusively diffusive control of the corrosion process, nor with the complete loss of the coating’s protective character. In some cases, the Warburg term appears alongside a still-high overall impedance, indicating that mass transport becomes a component of the mechanism without eliminating the coating’s resistive contribution.
A similar interpretation was used by Garcia-Cabezón et al. [45] for PEO coatings on Ti64, where the Warburg term introduced into the EIS model was associated with a transport contribution in the electrolyte or through the coating. The authors also highlighted changes in the electrochemical response following prolonged exposure for up to 90 days. In the present study, the appearance of W is interpreted in the same way, as a transport contribution at low frequencies, without implying that the corrosion process is controlled exclusively by diffusion.
An important point is that changes in the equivalent circuit over time do not always follow a progression from simple to complex. For certain samples, following an intermediate stage characterised by several relaxation processes, the response at 90 days can be represented by a circuit with fewer elements but including a Warburg contribution. This simplification does not indicate a return to the initial state. Rather, it shows that, following prolonged exposure, certain processes can no longer be separated individually in the EIS spectrum, or that another mechanism becomes dominant in the analysed frequency range.
The differences between Ringer, DPBS and EBSS also confirm that the evolution of the mechanisms is controlled by the layer–environment interaction. In Ringer, for several coated samples, prolonged exposure leads to the emergence of transport contributions and a reduction in the initial barrier character. In DPBS, a reorganisation of the response is more frequently observed after the intermediate period, with some samples exhibiting high impedance at 90 days, but via circuits different from the initial ones. In EBSS, the behaviour is more dependent on the layer composition, with both progressive decreases in the barrier effect and impedance recoveries associated with new electrochemical mechanisms observed.
Overall, the behaviour of the equivalent circuits indicates that the interaction between the layer and the physiological environment is dynamic. During immersion, the response may shift from predominantly capacitive and resistive behaviour to one characterised by multiple relaxation processes and transport contributions. For this reason, the interpretation of electrochemical stability must be based on the simultaneous analysis of Nyquist and Bode plots, circuit parameters, and feature robustness. Changes in the electrochemical mechanism thus serve as a complementary indicator to overall impedance and allow differentiation of states that, although they may exhibit similar impedance levels, result from different layer–electrolyte interactions.
4. Conclusions
The study showed that the electrochemical stability of phosphate conversion coatings on Ti64 depends simultaneously on the coating composition, the immersion medium, and the exposure duration. All three coatings generally exhibited a superior impedance response compared with the uncoated substrate, but the behaviour over time differed for each system.
The Zr-Zn-Mg coating exhibited the best long-term maintenance of its protective behaviour in Ringer’s solution and EBSS, whilst in DPBS, the Zn-Zr-Mg and Mg-Zn-Zr coatings developed favourable responses following prolonged exposure. The results thus confirm that no single optimal composition can be identified independently of the application environment.
The immersion time did not result in a monotonic degradation of the layers. For some samples, intermediate decreases in impedance were observed, followed by increases at 90 days; however, the modification of the equivalent circuits showed that these increases do not necessarily represent a return to the initial electrochemical state.
The evolution of equivalent circuits has highlighted the transition from predominantly resistive-capacitive responses to systems with multiple relaxation processes and, in some cases, the emergence of mass transport contributions. Consequently, the performance of coatings must be assessed by correlating the overall impedance with the shape of the Nyquist and Bode diagrams and with the parameters of the equivalent circuits.
The pH values confirmed distinct behaviours of the three media, with minimal variation in DPBS, slight acidification in Ringer’s solution, and pronounced alkalisation in EBSS. However, the electrochemical differences between the samples could not be explained solely by variations in pH, highlighting the decisive role of the interaction between layer composition and the chemistry of the immersion medium.
Supplementary Materials
The following supporting information can be downloaded at https://www.mdpi.com/article/10.3390/surfaces9040090/s1, Figure S1: (a) Nyquist diagram; (b) Bode diagram for Ti64/Ringer system 30 days; Figure S2: (a) Nyquist diagram; (b) Bode diagram for Ti64/Ringer system 60 days, Figure S3: (a) Nyquist diagram; (b) Bode diagram for Ti64/Ringer system 90 days; Figure S4: (a) Nyquist diagram; (b) Bode diagram for Ti64/DPBS system 30 days; Figure S5: (a) Nyquist diagram; (b) Bode diagram for Ti64/DPBS system 60 days, Figure S6: (a) Nyquist diagram; (b) Bode diagram for Ti64/DPBS system 90 days; Figure S7: (a) Nyquist diagram; (b) Bode diagram for Ti64/EBSS system 30 days; Figure S8: (a) Nyquist diagram; (b) Bode diagram for Ti64/EBSS system 60 days; Figure S9: (a) Nyquist diagram; (b) Bode diagram for Ti64/EBSS system 90 days; Figure S10: (a) Nyquist diagram; (b) Bode diagram for Zn-Zr-Mg/Ringer system 30 days; Figure S11: (a) Nyquist diagram; (b) Bode diagram for Zn-Zr-Mg/Ringer system 60 days; Figure S12: (a) Nyquist diagram; (b) Bode diagram Zn-Zr-Mg/Ringer system 90 days; Figure S13: (a) Nyquist diagram; (b) Bode diagram for Zn-Zr-Mg/DPBS system 30 days, Figure S14: (a) Nyquist diagram; (b) Bode diagram for Zn-Zr-Mg/DPBS system 60 days; Figure S15: (a) Nyquist diagram; (b) Bode diagram for Zn-Zr-Mg/DPBS system 90 days; Figure S16: (a) Nyquist diagram; (b) Bode diagram for Zn-Zr-Mg/EBSS system 30 days; Figure S17: (a) Nyquist diagram; (b) Bode diagram for Zn-Zr-Mg/EBSS system 60 days; Figure S18: (a) Nyquist diagram; (b) Bode diagram for Zn-Zr-Mg/EBSS system 90 days; Figure S19: (a) Nyquist diagram; (b) Bode diagram for Mg-Zn-Zr/Ringer system 30 days; Figure S20: (a) Nyquist diagram; (b) Bode diagram for Mg-Zn-Zr/Ringer system 60 days; Figure S21: (a) Nyquist diagram; (b) Bode diagram Mg-Zn-Zr/Ringer system 90 days; Figure S22: (a) Nyquist diagram; (b) Bode diagram for Mg-Zn-Zr/DPBS system 30 days; Figure S23: (a) Nyquist diagram; (b) Bode diagram for Mg-Zn-Zr/DPBS system 60 days; Figure S24: (a) Nyquist diagram; (b) Bode diagram for Mg-Zn-Zr/DPBS system 90 days; Figure S25: (a) Nyquist diagram; (b) Bode diagram for Mg-Zn-Zr/EBSS system 30 days; Figure S26: (a) Nyquist diagram; (b) Bode diagram for Mg-Zn-Zr/EBSS system 60 days; Figure S27: (a) Nyquist diagram; (b) Bode diagram for Mg-Zn-Zr/EBSS system 90 days; Figure S28: (a) Nyquist diagram; (b) Bode diagram for Zr-Zn-Mg/Ringer system 30 days; Figure S29: (a) Nyquist diagram; (b) Bode diagram for Zr-Zn-Mg/Ringer system 60 days; Figure S30: (a) Nyquist diagram; (b) Bode diagram Zr-Zn-Mg/Ringer system 90 days; Figure S31: (a) Nyquist diagram; (b) Bode diagram for Zr-Zn-Mg/DPBS system 30 days; Figure S32: (a) Nyquist diagram; (b) Bode diagram for Zr-Zn-Mg/DPBS system 60 days; Figure S33: (a) Nyquist diagram; (b) Bode diagram for Zr-Zn-Mg/DPBS system 90 days; Figure S34: (a) Nyquist diagram; (b) Bode diagram for Zr-Zn-Mg/EBSS system 30 days; Figure S35: (a) Nyquist diagram; (b) Bode diagram for Zr-Zn-Mg/EBSS system 60 days; Figure S36: (a) Nyquist diagram; (b) Bode diagram for Zr-Zn-Mg/EBSS system 90 days.
Author Contributions
Conceptualization, writing and investigation, data curation, project administration, D.-P.B.-N.; data curation, validation and writing—reviewing and editing, N.-M.L.; methodology, investigation, editing, M.P.; methodology, investigation, data curation and validation, N.C.; writing an original draft, and scientific supervision, C.B. All authors have read and agreed to the published version of the manuscript.
Funding
This work was supported by a grant of the Ministry of Research, Innovation and Digitalization, CNCS-UEFISCDI, project number PN-IV-P2-2.1-TE-2023-1086.
Data Availability Statement
The raw data supporting the conclusions of this article will be made available by the authors on request.
Acknowledgments
During the preparation of this manuscript, the authors used ChatGPT (OpenAI GPT-5.6 Sol) to assist with language refinement, readability, and organisation of the text. All scientific interpretations, experimental data, and conclusions were reviewed and validated by the authors, who take full responsibility for the content of the manuscript.
Conflicts of Interest
The authors declare no conflicts of interest.
References
- Cooper, L.F. A Role for Surface Topography in Creating and Maintaining Bone at Titanium Endosseous Implants. J. Prosthet. Dent. 2000, 84, 522–534. [Google Scholar] [CrossRef] [Scilit] [PubMed]
- Cochran, D.L.; Hermann, J.S.; Schenk, R.K.; Higginbottom, F.L.; Buser, D. Biologic Width Around Titanium Implants. A Histometric Analysis of the Implanto-Gingival Junction Around Unloaded and Loaded Nonsubmerged Implants in the Canine Mandible. J. Periodontol. 1997, 68, 186–197. [Google Scholar] [CrossRef] [Scilit] [PubMed]
- Maher, N.; Mahmood, A.; Fareed, M.A.; Kumar, N.; Rokaya, D.; Zafar, M.S. An Updated Review and Recent Advancements in Carbon-Based Bioactive Coatings for Dental Implant Applications. J. Adv. Res. 2025, 72, 265–286, Correction in J. Adv. Res. 2025, 73, 769. [Google Scholar] [CrossRef] [Scilit]
- S, A.D.; P, S.P.A.; Naveen, J.; Khan, T.; Khahro, S.H. Advancement in Biomedical Implant Materials—A Mini Review. Front. Bioeng. Biotechnol. 2024, 12, 1400918. [Google Scholar] [CrossRef] [Scilit] [PubMed]
- Bhatnagar, D.; Gautam, S.; Sonowal, L.; Bhinder, S.S.; Ghosh, S.; Pati, F. Enhancing Bone Implants: Magnesium-Doped Hydroxyapatite for Stronger, Bioactive, and Biocompatible Applications. ACS Appl. Bio Mater. 2024, 7, 2272–2282. [Google Scholar] [CrossRef] [Scilit] [PubMed]
- Slama, H.; Tayyaba, Q.; Kadiri, M.; Hermawan, H. Electrochemical Evaluation of New Ti-Based High-Entropy Alloys in Artificial Saliva with Fluoride: Implications for Dental Implant Applications. Materials 2025, 18, 2973. [Google Scholar] [CrossRef] [Scilit] [PubMed]
- Binobaid, A.; Guner, A.; Camilleri, J.; Jiménez, A.; Essa, K. A 3D Printed Ultra-Short Dental Implant Based on Lattice Structures and ZIRCONIA/Ca2SiO4 Combination. J. Mech. Behav. Biomed. Mater. 2024, 155, 106559. [Google Scholar] [CrossRef] [Scilit]
- Shahmohammadi, M.; Sun, Y.; Yuan, J.C.C.; Mathew, M.T.; Sukotjo, C.; Takoudis, C.G. In Vitro Corrosion Behavior of Coated Ti6Al4V with TiO2, ZrO2, and TiO2/ZrO2 Mixed Nanofilms Using Atomic Layer Deposition for Dental Implants. Surf. Coat. Technol. 2022, 444, 128686. [Google Scholar] [CrossRef] [Scilit]
- Wang, S.; Zhao, X.; Hsu, Y.; He, Y.; Wang, F.; Yang, F.; Yan, F.; Xia, D.; Liu, Y. Surface Modification of Titanium Implants with Mg-Containing Coatings to Promote Osseointegration. Acta Biomater. 2023, 169, 19–44. [Google Scholar] [CrossRef] [Scilit] [PubMed]
- Singh, A.K.; Malik, A.; Mali, H.S. Surface Modification of Ti6Al4V Screws Using HA-Mixed EDCLT for Applications of Dental Implants. J. Braz. Soc. Mech. Sci. Eng. 2024, 46, 450. [Google Scholar] [CrossRef] [Scilit]
- Bahçepinar, A.İ.; Aydin, İ. Investigation of In Vitro Corrosion and Wear Properties of Biomedical Coatings Applied to Ti6Al4V Alloy Manufactured by Selective Laser Melting. Crystals 2025, 15, 316. [Google Scholar] [CrossRef] [Scilit]
- Long, M.; Rack, H.J. Titanium Alloys in Total Joint Replacement—A Materials Science Perspective. Biomaterials 1998, 19, 1621–1639. [Google Scholar] [CrossRef] [Scilit] [PubMed]
- Bocchetta, P.; Chen, L.Y.; Tardelli, J.D.C.; Dos Reis, A.C.; Almeraya-Calderón, F.; Leo, P. Passive Layers and Corrosion Resistance of Biomedical Ti-6Al-4V and β-Ti Alloys. Coatings 2021, 11, 487. [Google Scholar] [CrossRef] [Scilit]
- Niinomi, M. Mechanical Biocompatibilities of Titanium Alloys for Biomedical Applications. J. Mech. Behav. Biomed. Mater. 2008, 1, 30–42. [Google Scholar] [CrossRef] [Scilit] [PubMed]
- Dias Corpa Tardelli, J.; Lima da Costa Valente, M.; Theodoro de Oliveira, T.; Cândido dos Reis, A. Influence of Chemical Composition on Cell Viability on Titanium Surfaces: A Systematic Review. J. Prosthet. Dent. 2021, 125, 421–425. [Google Scholar] [CrossRef] [Scilit] [PubMed]
- Kumar, A.; Singh, G. Surface Modification of Ti6Al4V Alloy via Advanced Coatings: Mechanical, Tribological, Corrosion, Wetting, and Biocompatibility Studies. J. Alloys Compd. 2024, 989, 174418. [Google Scholar] [CrossRef] [Scilit]
- Singh, S.; Roy, R.; Kumar Meena, V.; Vashisth, P.; Kalyanasundaram, D. Nanotextured and Drug Loaded Neovius Ti6Al4V ELI Scaffolds with Osteogenesis and Anti-Cancer Potential. Mater. Des. 2024, 237, 112570. [Google Scholar] [CrossRef] [Scilit]
- Nikolova, M.P.; Handzhiyski, Y.; Dimitrova, T.V.; Andreeva, A.; Valkov, S.; Ormanova, M.; Apostolova, M.D. Biological Response and Antimicrobial Behaviour of Sputtered TiO2/Cu Coatings Deposited on Ti6Al4V Alloy. Coatings 2025, 15, 1341. [Google Scholar] [CrossRef] [Scilit]
- Aissi, M.; Er-ramly, A.; Merzouk, N. Electrochemical Evaluation of Ag–CaP–ZrO2 Composite Coatings on Ti6Al4V for Enhanced Corrosion Resistance in Dental Implants. Prosthesis 2025, 7, 141. [Google Scholar] [CrossRef] [Scilit]
- Sun, F.; Huang, Q.; Wang, H.; Tian, S.; Li, X.; Qiao, C.; Zhao, B.; Lin, Z. Application of Antibacterial and Wear-Resistant TiN-Cu Coating on Dental Implant Screws. Vacuum 2026, 252, 115464. [Google Scholar] [CrossRef] [Scilit]
- Andrade del Olmo, J.; Pérez-Álvarez, L.; Sáez Martínez, V.; Benito Cid, S.; Ruiz-Rubio, L.; Pérez González, R.; Vilas-Vilela, J.L.; Alonso, J.M. Multifunctional Antibacterial Chitosan-Based Hydrogel Coatings on Ti6Al4V Biomaterial for Biomedical Implant Applications. Int. J. Biol. Macromol. 2023, 231, 123328. [Google Scholar] [CrossRef] [Scilit] [PubMed]
- Han, X.; Ma, J.; Tian, A.; Wang, Y.; Li, Y.; Dong, B.; Tong, X.; Ma, X. Surface Modification Techniques of Titanium and Titanium Alloys for Biomedical Orthopaedics Applications: A Review. Colloids Surf. B Biointerfaces 2023, 227, 113339. [Google Scholar] [CrossRef] [Scilit] [PubMed]
- Li, J.; Zheng, Y.; Yu, Z.; Kankala, R.K.; Lin, Q.; Shi, J.; Chen, C.; Luo, K.; Chen, A.; Zhong, Q. Surface-Modified Titanium and Titanium-Based Alloys for Improved Osteogenesis: A Critical Review. Heliyon 2024, 10, e23779. [Google Scholar] [CrossRef] [Scilit] [PubMed]
- Stich, T.; Alagboso, F.; Křenek, T.; Kovářík, T.; Alt, V.; Docheva, D. Implant-Bone-Interface: Reviewing the Impact of Titanium Surface Modifications on Osteogenic Processes in Vitro and in Vivo. Bioeng. Transl. Med. 2021, 7, e10239. [Google Scholar] [CrossRef] [Scilit] [PubMed]
- Burduhos-Nergis, D.P.; Cimpoesu, N.; Epure, E.L.; Istrate, B.; Burduhos-Nergis, D.D.; Bejinariu, C. Ca–Zn Phosphate Conversion Coatings Deposited on Ti6Al4V for Medical Applications. Coatings 2023, 13, 1029. [Google Scholar] [CrossRef] [Scilit]
- Liu, B.; Yu, W.-L.; Xiao, G.-Y.; Chen, C.-Z.; Lu, Y.-P. Comparative Investigation of Hydroxyapatite Coatings Formed on Titanium via Phosphate Chemical Conversion. Surf. Coat. Technol. 2021, 413, 127093. [Google Scholar] [CrossRef] [Scilit]
- Zhao, D.W.; Liu, C.; Zuo, K.Q.; Su, P.; Li, L.B.; Xiao, G.Y.; Cheng, L. Strontium-Zinc Phosphate Chemical Conversion Coating Improves the Osseointegration of Titanium Implants by Regulating Macrophage Polarization. Chem. Eng. J. 2021, 408, 127362. [Google Scholar] [CrossRef] [Scilit]
- Liu, B.; Shi, X.-M.; Xiao, G.-Y.; Lu, Y.-P. In-Situ Preparation of Scholzite Conversion Coatings on Titanium and Ti-6Al-4V for Biomedical Applications. Colloids Surf. B Biointerfaces 2017, 153, 291–299. [Google Scholar] [CrossRef] [Scilit] [PubMed]
- Lee, B.A.; Kim, H.J.; Xuan, Y.Z.; Park, Y.J.; Chung, H.J.; Kim, Y.J. Osteoblastic Behavior to Zirconium Coating on Ti-6Al-4V Alloy. J. Adv. Prosthodont. 2014, 6, 512–520. [Google Scholar] [CrossRef] [Scilit] [PubMed]
- Li, Y.B.; Lu, Y.P.; Du, C.M.; Zuo, K.Q.; Wang, Y.Y.; Tang, K.L.; Xiao, G.Y. Effect of Reaction Temperature on the Microstructure and Properties of Magnesium Phosphate Chemical Conversion Coatings on Titanium. Molecules 2023, 28, 4495. [Google Scholar] [CrossRef] [Scilit] [PubMed]
- Guo, Y.Y.; Liu, B.; Hu, B.B.; Xiao, G.Y.; Wu, Y.P.; Sun, P.F.; Zhang, X.L.; Jia, Y.H.; Lu, Y.P. Antibacterial Activity and Increased Osteoblast Cell Functions of Zinc Calcium Phosphate Chemical Conversion on Titanium. Surf. Coat. Technol. 2016, 294, 131–138. [Google Scholar] [CrossRef] [Scilit]
- Du, C.; Zuo, K.; Ma, Z.; Zhao, M.; Li, Y.; Tian, S.; Lu, Y.; Xiao, G. Effect of Substrates Performance on the Microstructure and Properties of Phosphate Chemical Conversion Coatings on Metal Surfaces. Molecules 2022, 27, 6434. [Google Scholar] [CrossRef] [Scilit] [PubMed]
- Burduhos-Nergis, D.P.; Munteanu, C.; Acasandrei, M.A.; Epure, E.L.; Cimpoesu, N.; Bejinariu, C.; Sandu, A.V.; Burduhos-Nergis, D.D. Micromorphology and Properties of Novel Phosphate Conversion Coatings Based on Zinc-Magnesium and Zinc-Zirconium Deposited on Ti6Al4V. Surf. Interfaces 2025, 76, 107884. [Google Scholar] [CrossRef] [Scilit]
- Burduhos-Nergis, D.-P.; Lohan, N.-M.; Matcovschi, E.; Badarau, G.; Bejinariu, C.; Benchea, M.; Lupu, F.-C.; Cimpoesu, N. Microstructure, Adhesion and Tribomechanical Performance of Zn–Mg–Ca- and Zn–Zr-Based Phosphate Conversion Coatings on Ti6Al4V Alloy. Materials 2026, 19, 4058. [Google Scholar] [CrossRef] [Scilit] [PubMed]
- Assis, S.L.; Costa, I. Electrochemical Evaluation of Ti-13Nb-13Zr, Ti-6Al-4V and Ti-6Al-7Nb Alloys for Biomedical Application by Long-Term Immersion Tests. Mater. Corros. 2007, 58, 329–333. [Google Scholar] [CrossRef] [Scilit]
- Tamilselvi, S.; Raman, V.; Rajendran, N. Corrosion Behaviour of Ti–6Al–7Nb and Ti–6Al–4V ELI Alloys in the Simulated Body Fluid Solution by Electrochemical Impedance Spectroscopy. Electrochim. Acta 2006, 52, 839–846. [Google Scholar] [CrossRef] [Scilit]
- Alves, V.A.; Reis, R.Q.; Santos, I.C.B.; Souza, D.G.; Gonçalves, T.d.F.; Pereira-da-Silva, M.A.; Rossi, A.; da Silva, L.A. In Situ Impedance Spectroscopy Study of the Electrochemical Corrosion of Ti and Ti–6Al–4V in Simulated Body Fluid at 25 °C and 37 °C. Corros. Sci. 2009, 51, 2473–2482. [Google Scholar] [CrossRef] [Scilit]
- Bai, Y.; Gai, X.; Li, S.; Zhang, L.C.; Liu, Y.; Hao, Y.; Zhang, X.; Yang, R.; Gao, Y. Improved Corrosion Behaviour of Electron Beam Melted Ti-6Al–4V Alloy in Phosphate Buffered Saline. Corros. Sci. 2017, 123, 289–296. [Google Scholar] [CrossRef] [Scilit]
- Tas, A.C. The Use of Physiological Solutions or Media in Calcium Phosphate Synthesis and Processing. Acta Biomater. 2014, 10, 1771–1792. [Google Scholar] [CrossRef] [Scilit] [PubMed]
- Lu, X.; Leng, Y. Theoretical Analysis of Calcium Phosphate Precipitation in Simulated Body Fluid. Biomaterials 2005, 26, 1097–1108. [Google Scholar] [CrossRef] [Scilit] [PubMed]
- Inskeep, W.P.; Silvertooth, J.C. Kinetics of Hydroxyapatite Precipitation at pH 7.4 to 8.4. Geochim. Cosmochim. Acta 1988, 52, 1883–1893. [Google Scholar] [CrossRef] [Scilit]
- Rahimi, E.; Offoiach, R.; Baert, K.; Terryn, H.; Lekka, M.; Fedrizzi, L. Role of Phosphate, Calcium Species and Hydrogen Peroxide on Albumin Protein Adsorption on Surface Oxide of Ti6Al4V Alloy. Materialia 2021, 15, 100988. [Google Scholar] [CrossRef] [Scilit]
- Höhn, S.; Virtanen, S. Effect of Inflammatory Conditions and H2O2 on Bare and Coated Ti–6Al–4V Surfaces: Corrosion Behavior, Metal Ion Release and Ca-P Formation under Long-Term Immersion in DMEM. Appl. Surf. Sci. 2015, 357, 101–111. [Google Scholar] [CrossRef] [Scilit]
- Matykina, E.; Arrabal, R.; Mingo, B.; Mohedano, M.; Pardo, A.; Merino, M.C. In Vitro Corrosion Performance of PEO Coated Ti and Ti6Al4V Used for Dental and Orthopaedic Implants. Surf. Coat. Technol. 2016, 307, 1255–1264. [Google Scholar] [CrossRef] [Scilit]
- Garcia-Cabezón, C.; Rodríguez-Méndez, M.L.; Borrás, V.A.; Bayón, R.; Salvo-Comino, C.; Garcia-Hernandez, C.; Martin-Pedrosa, F. Improvements in Tribological and Anticorrosion Performance of Porous Ti-6Al-4V via PEO Coating. Friction 2021, 9, 1303–1318. [Google Scholar] [CrossRef] [Scilit]
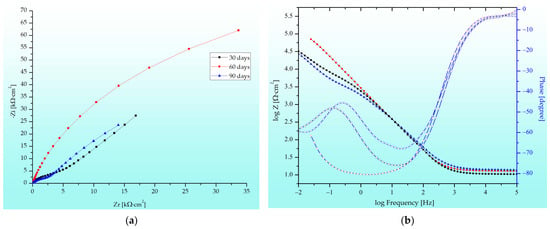
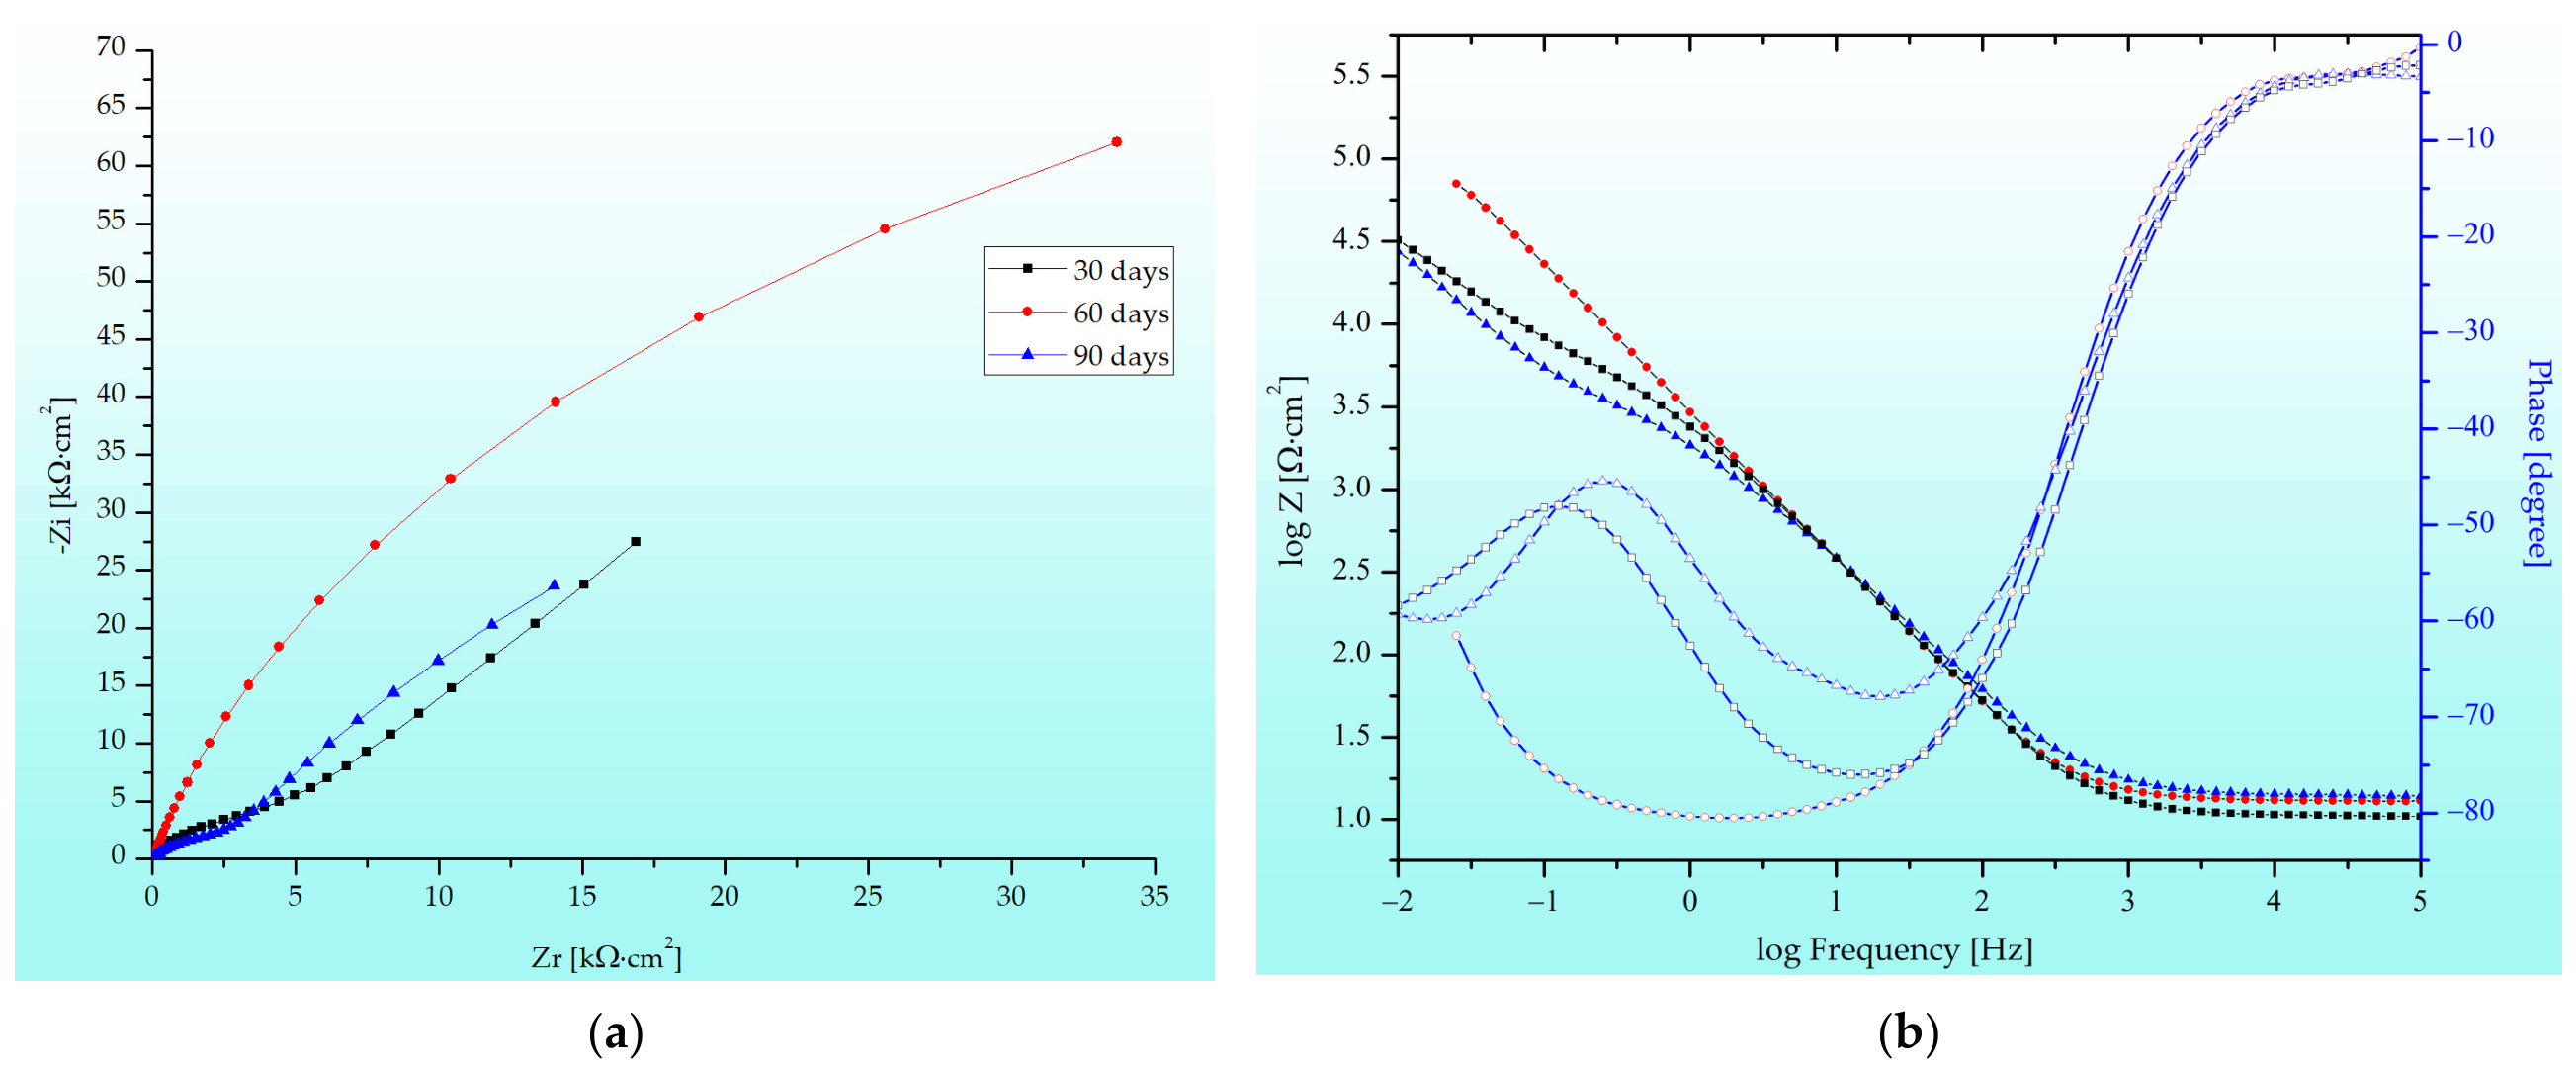
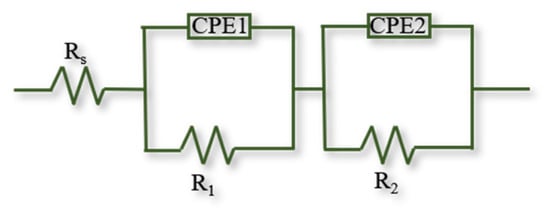
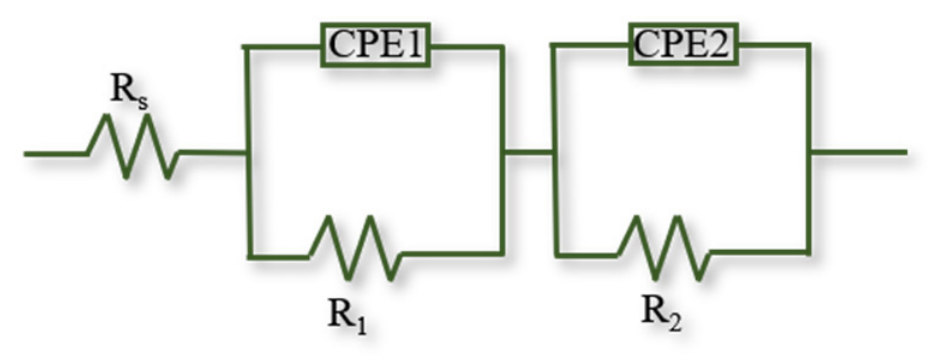
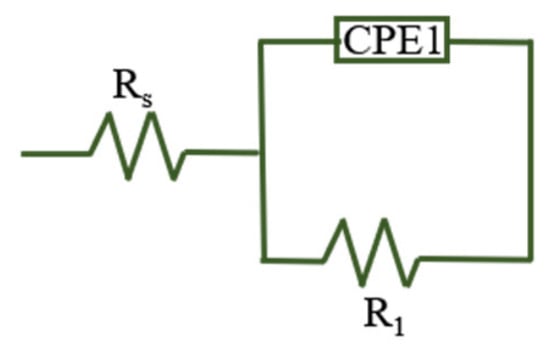
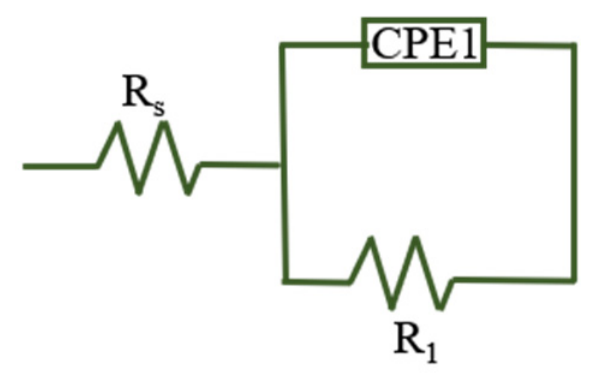
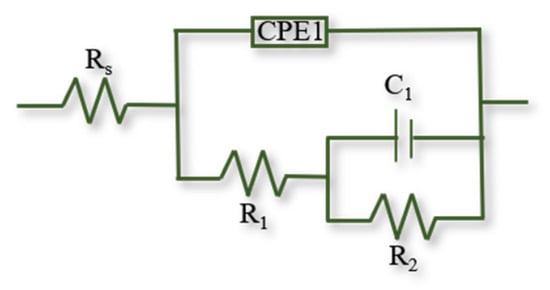
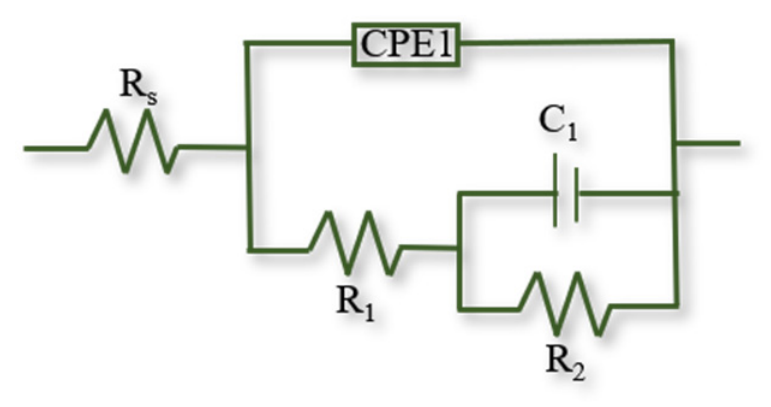
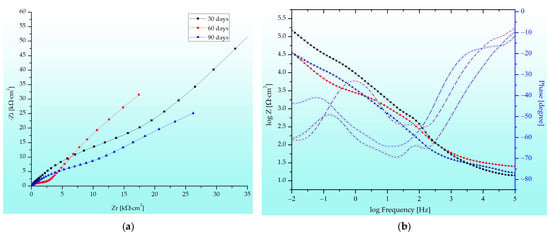
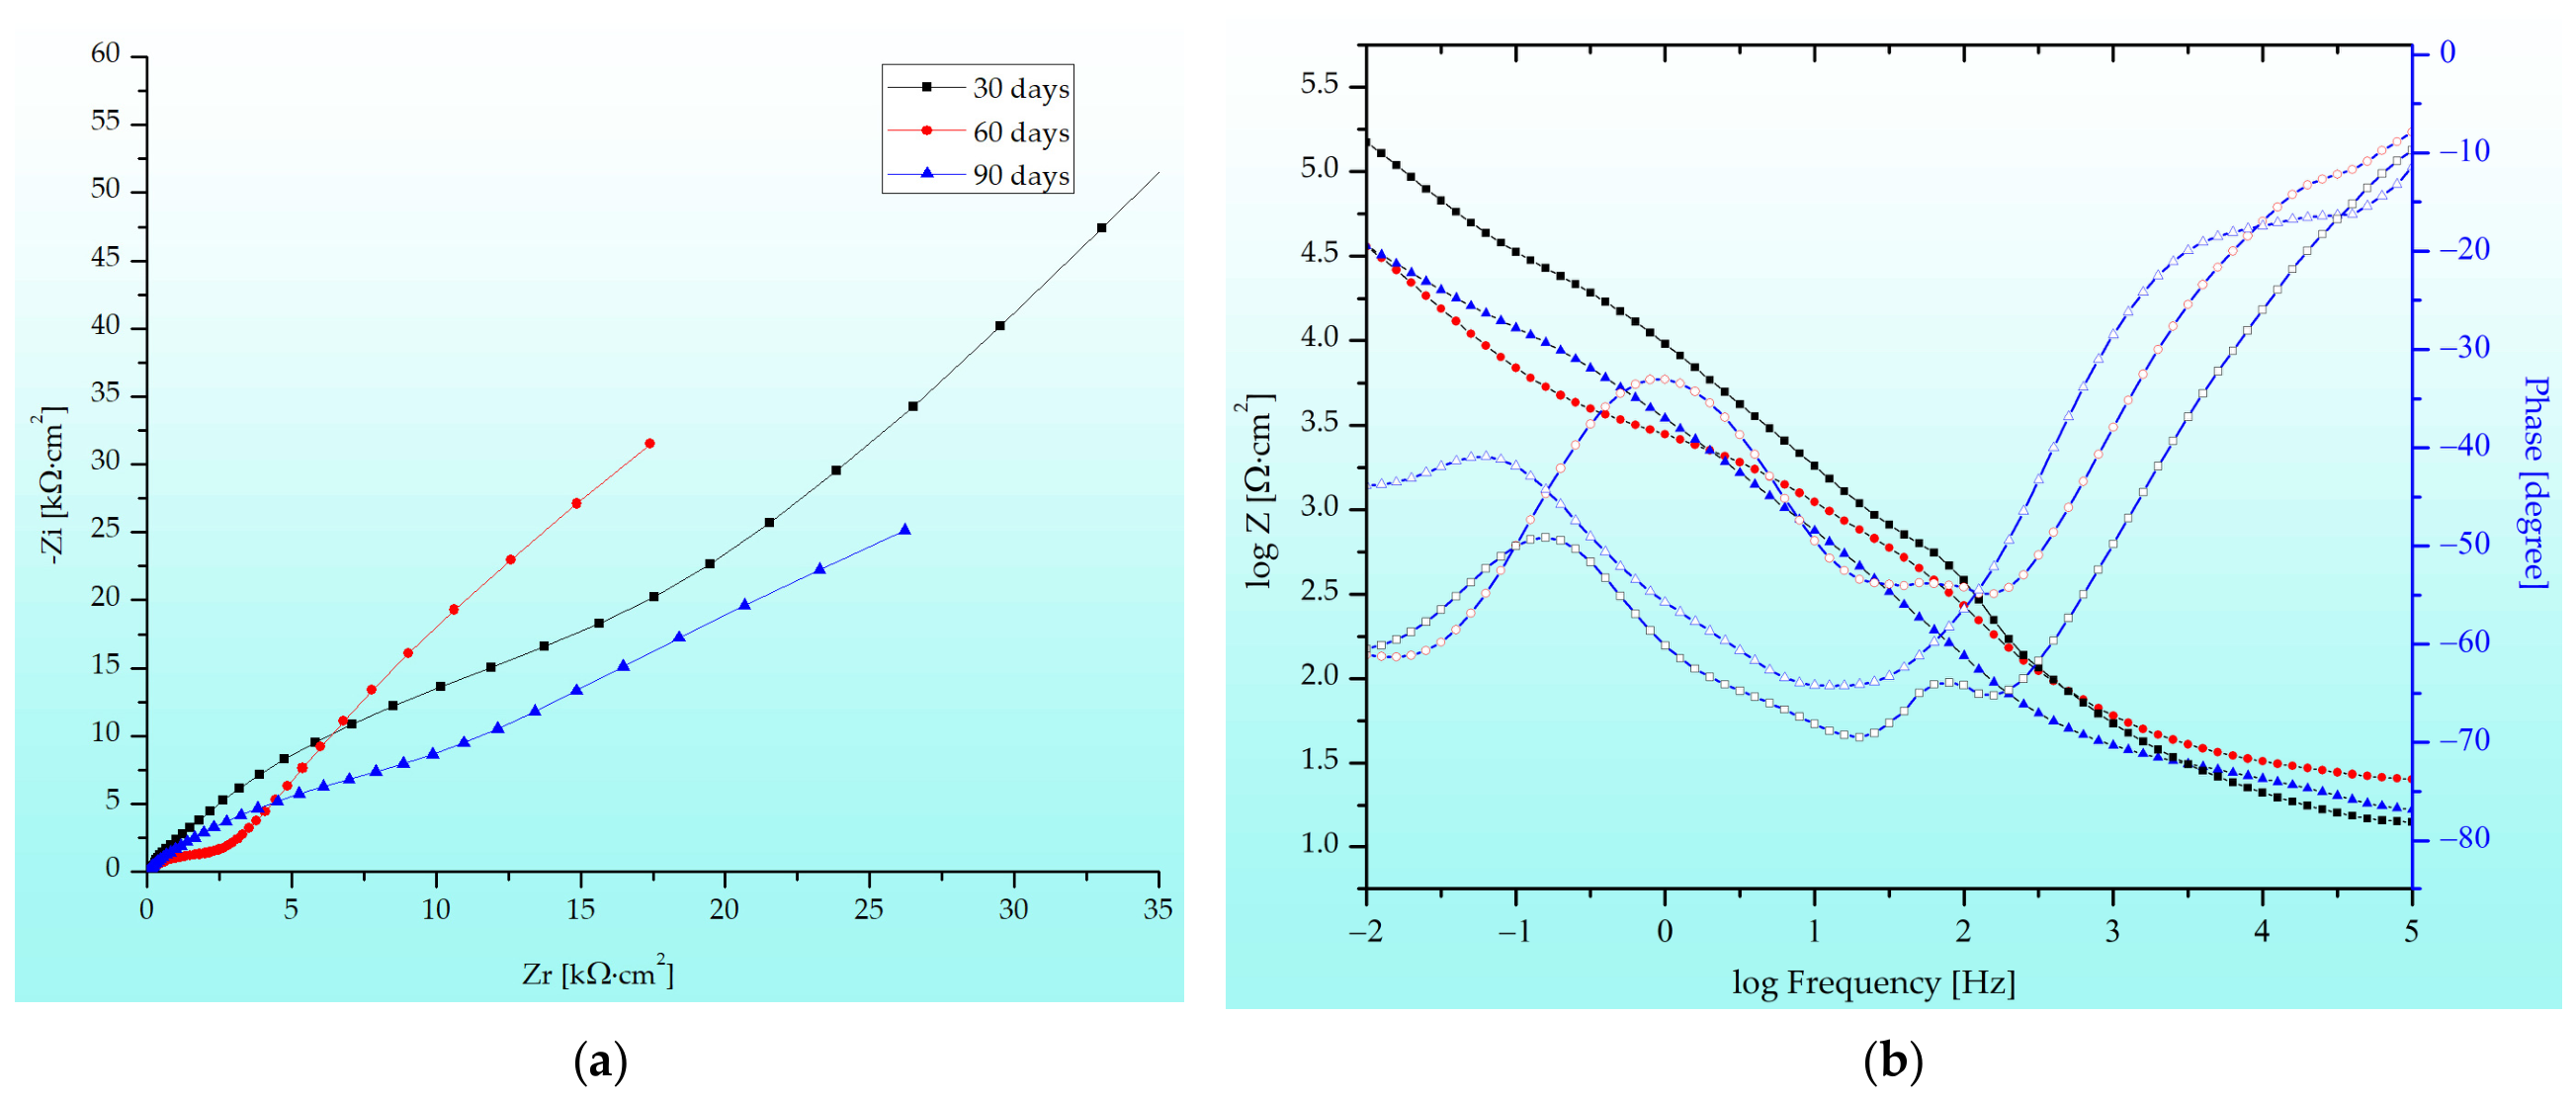
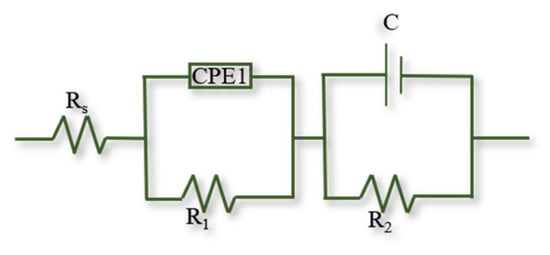
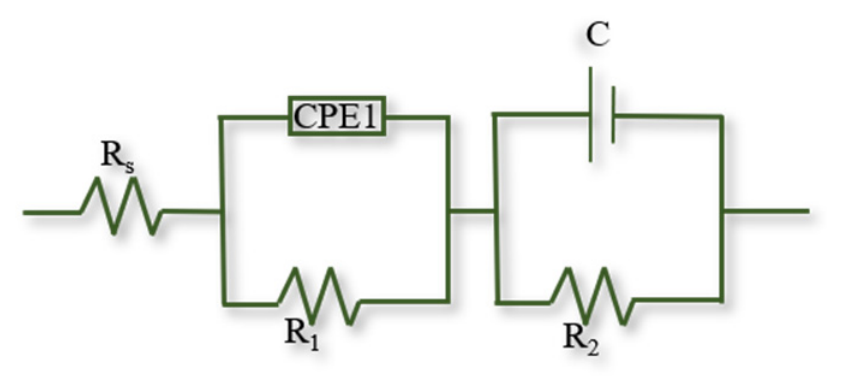
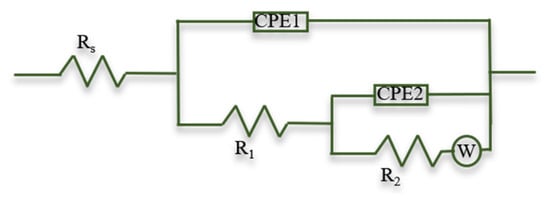
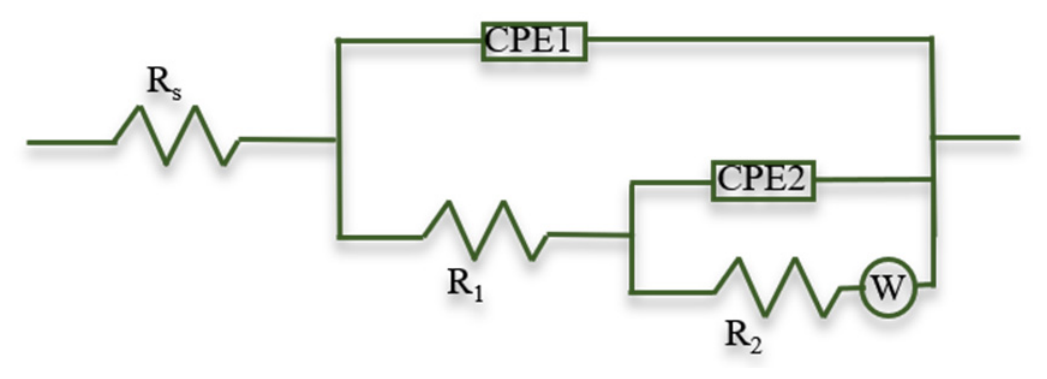
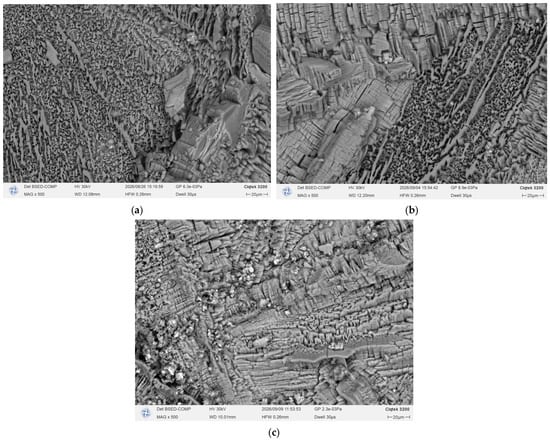
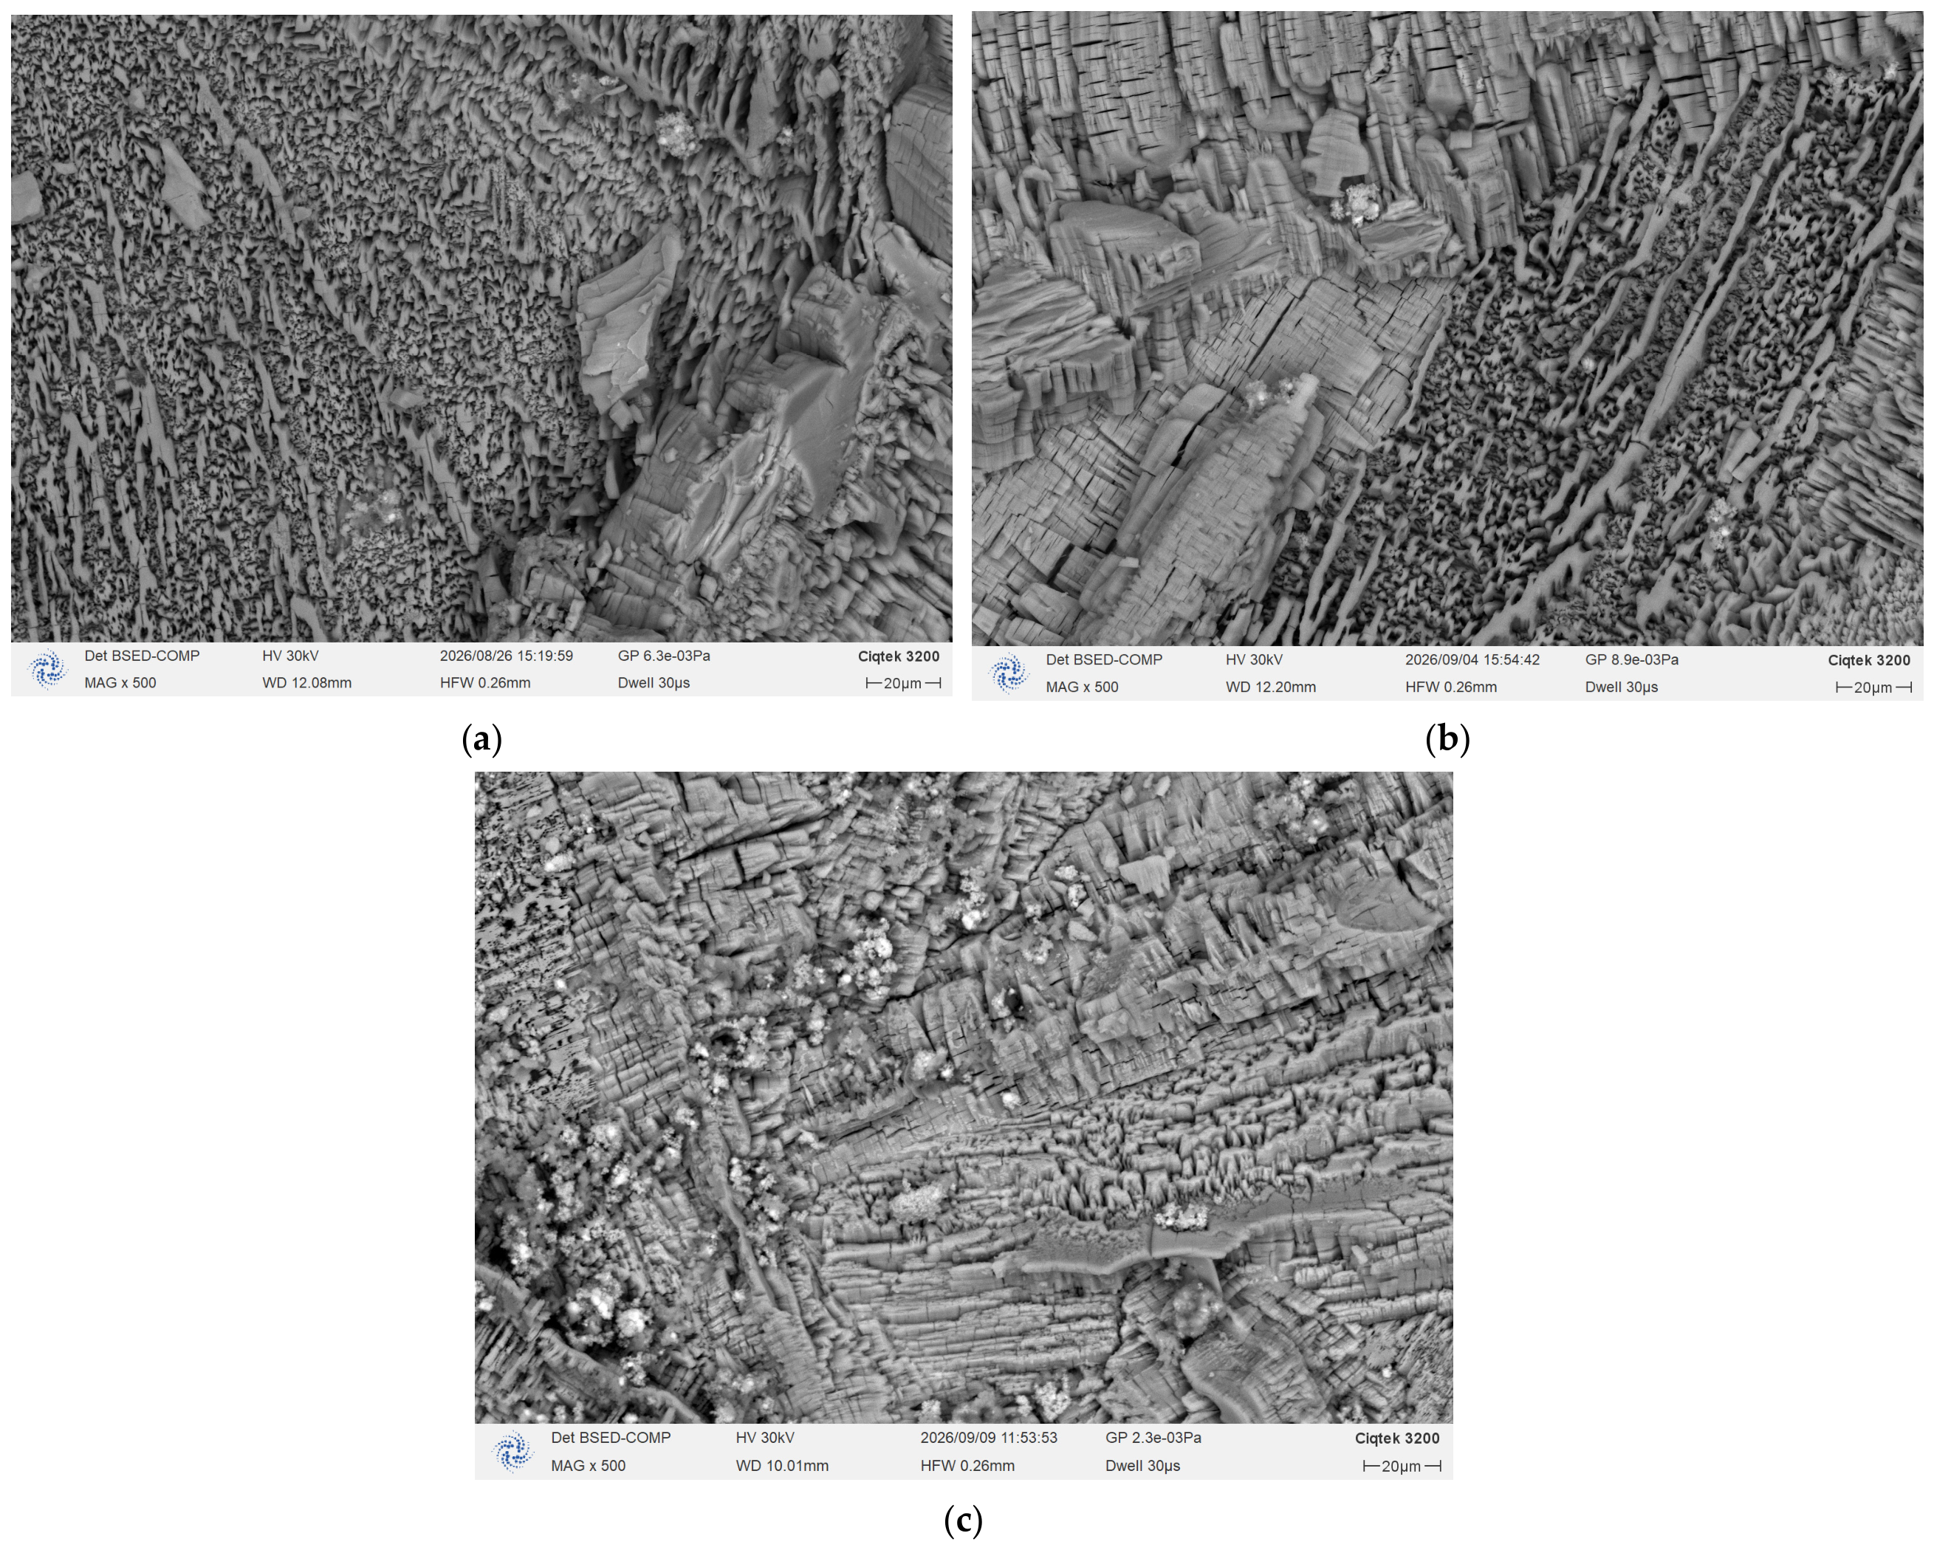
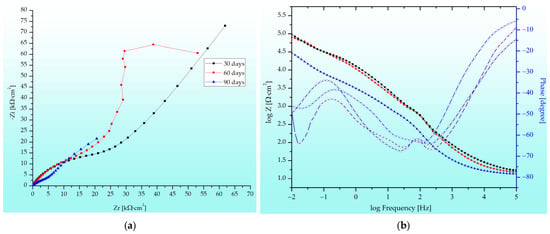
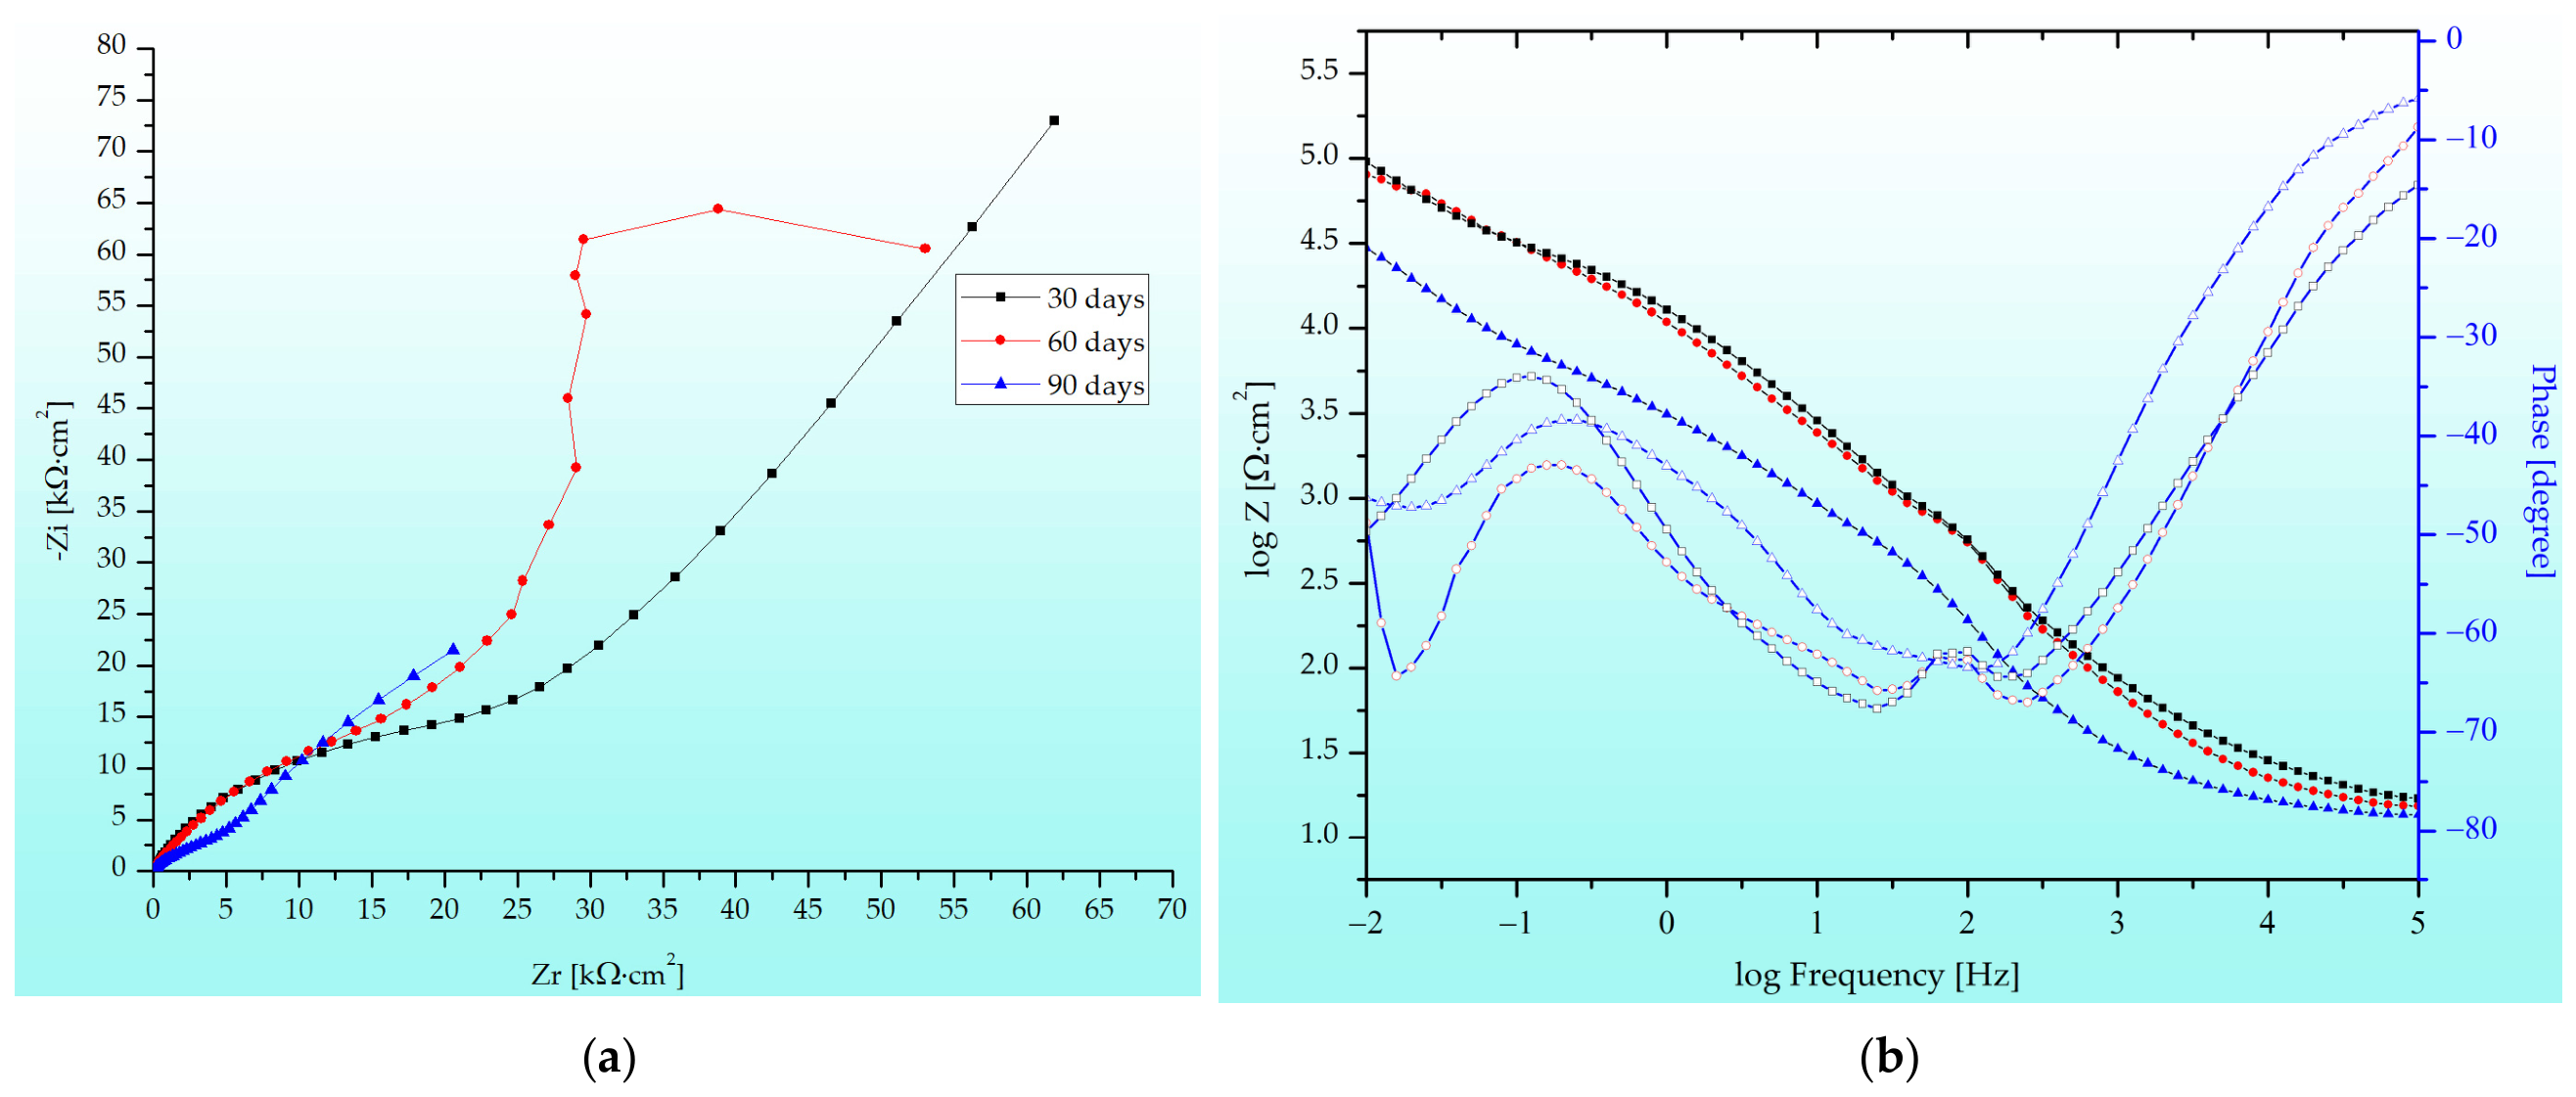
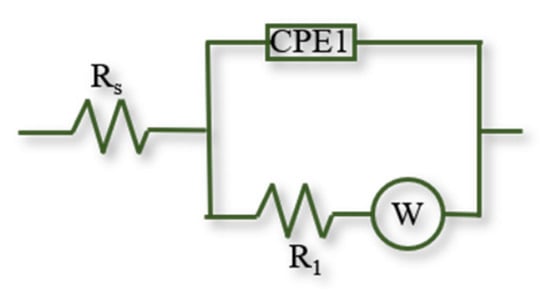
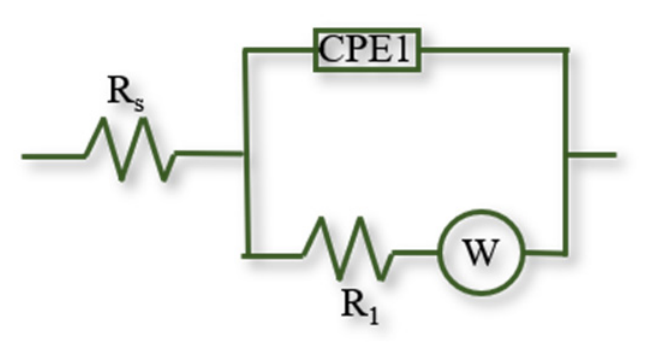
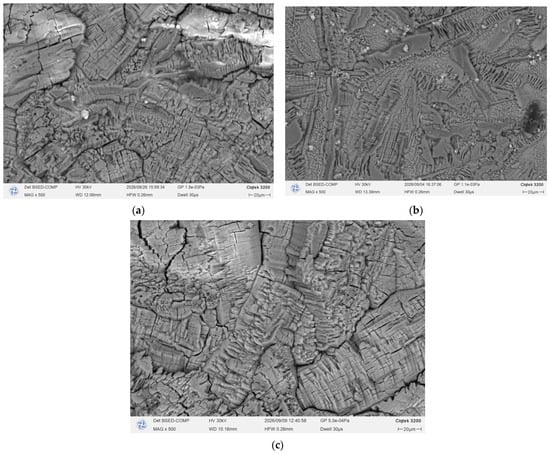
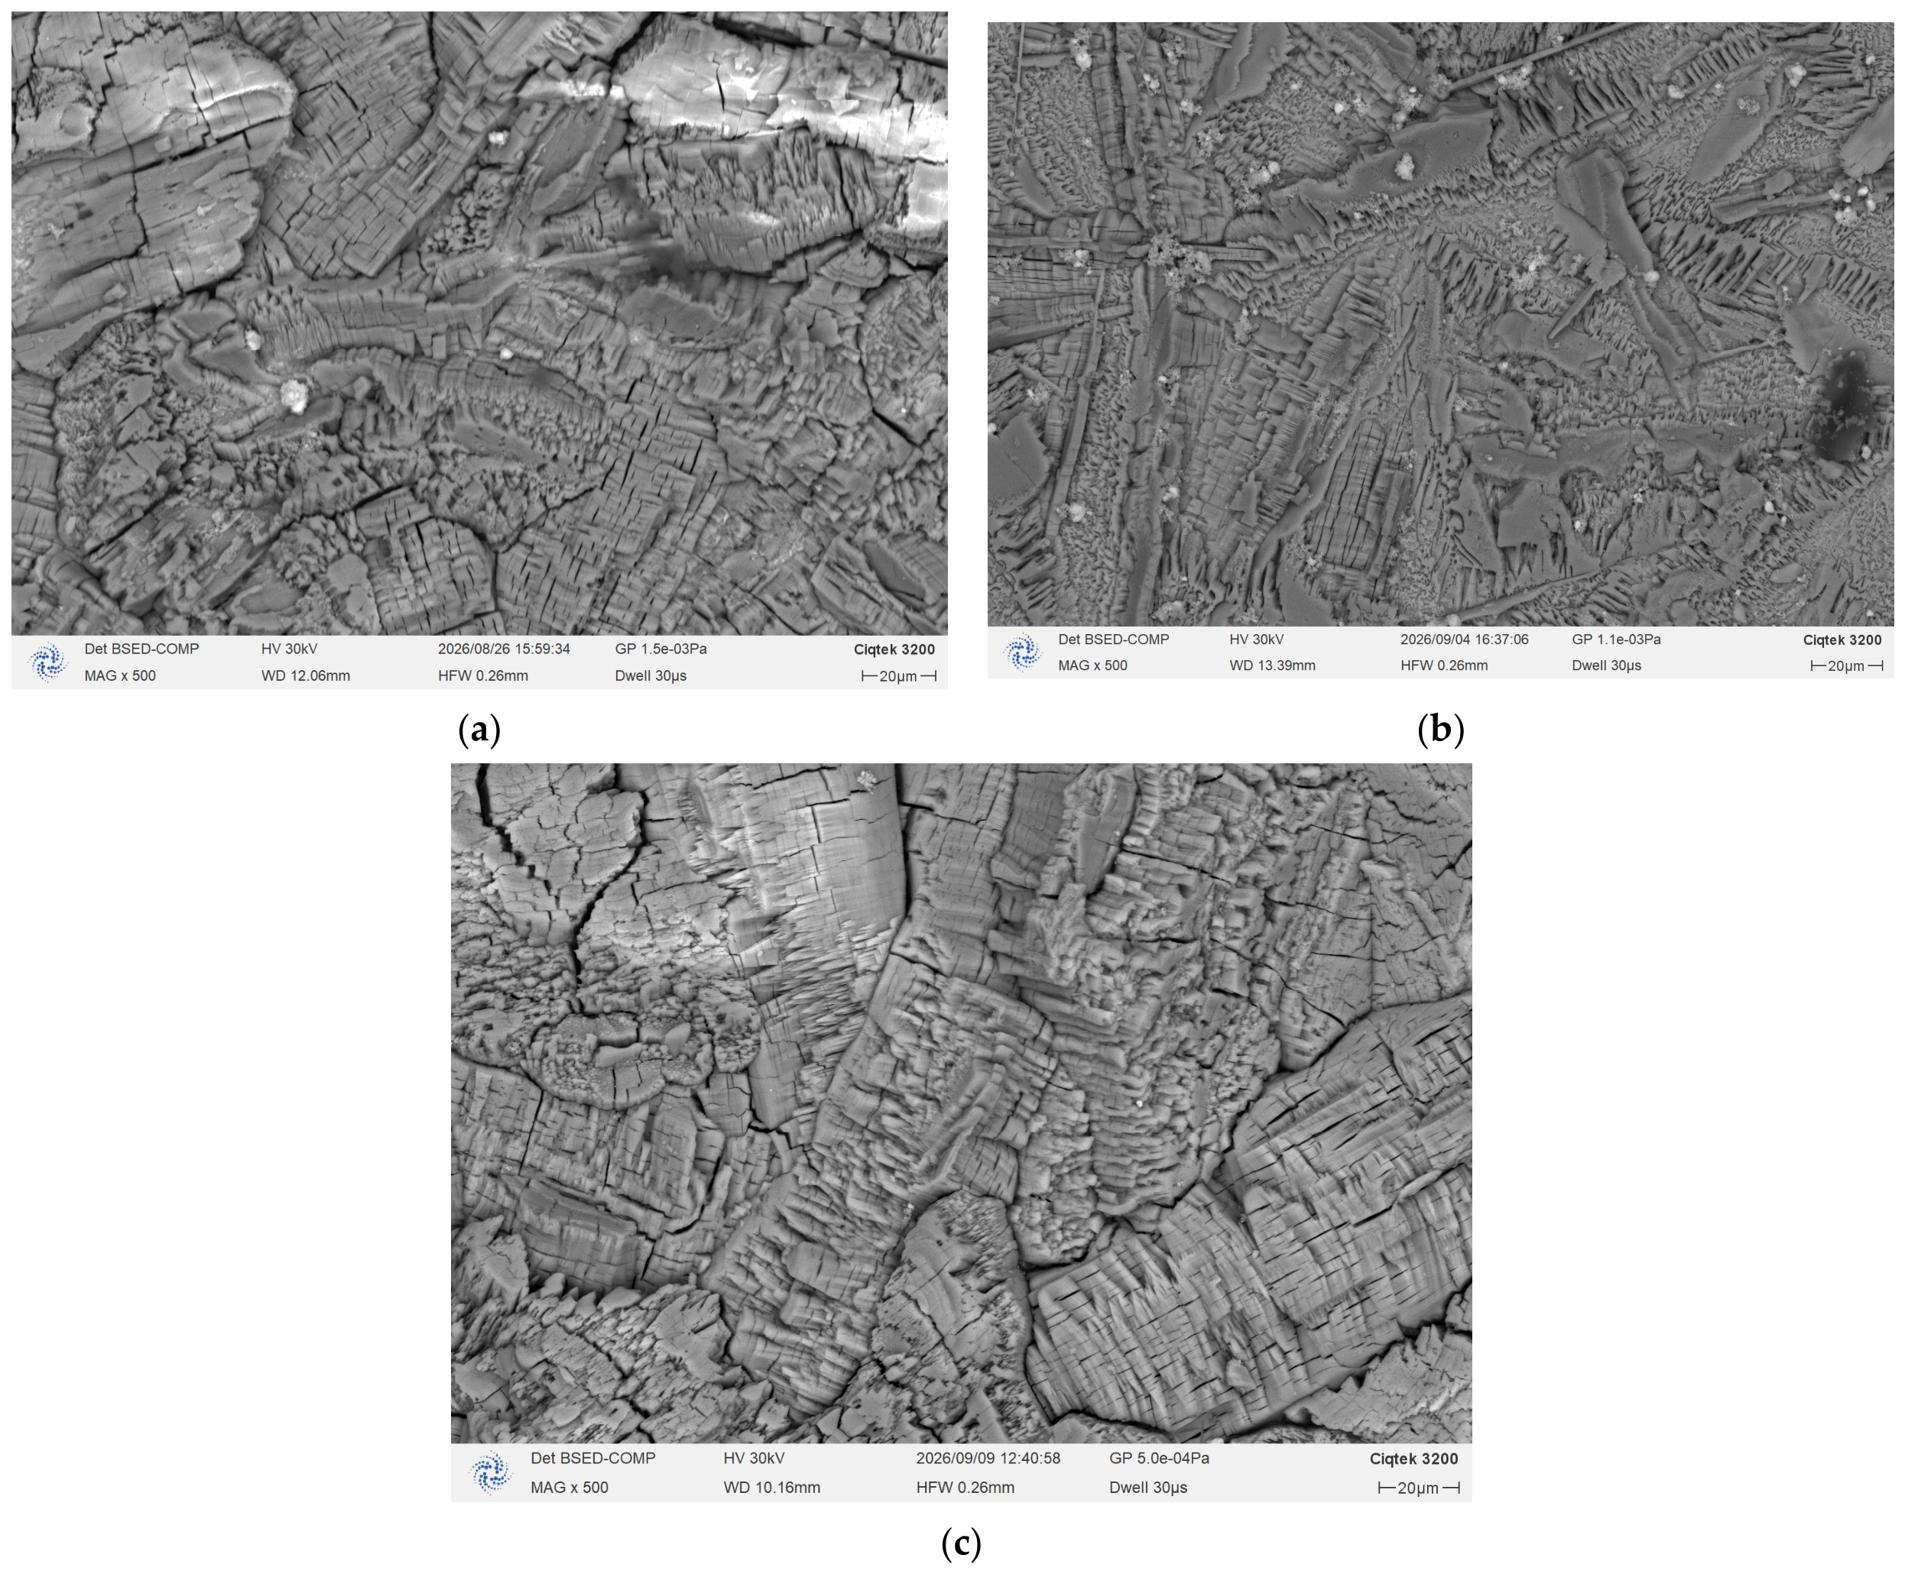
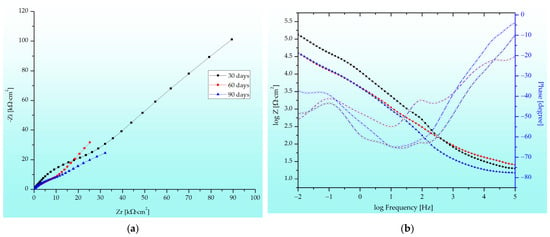
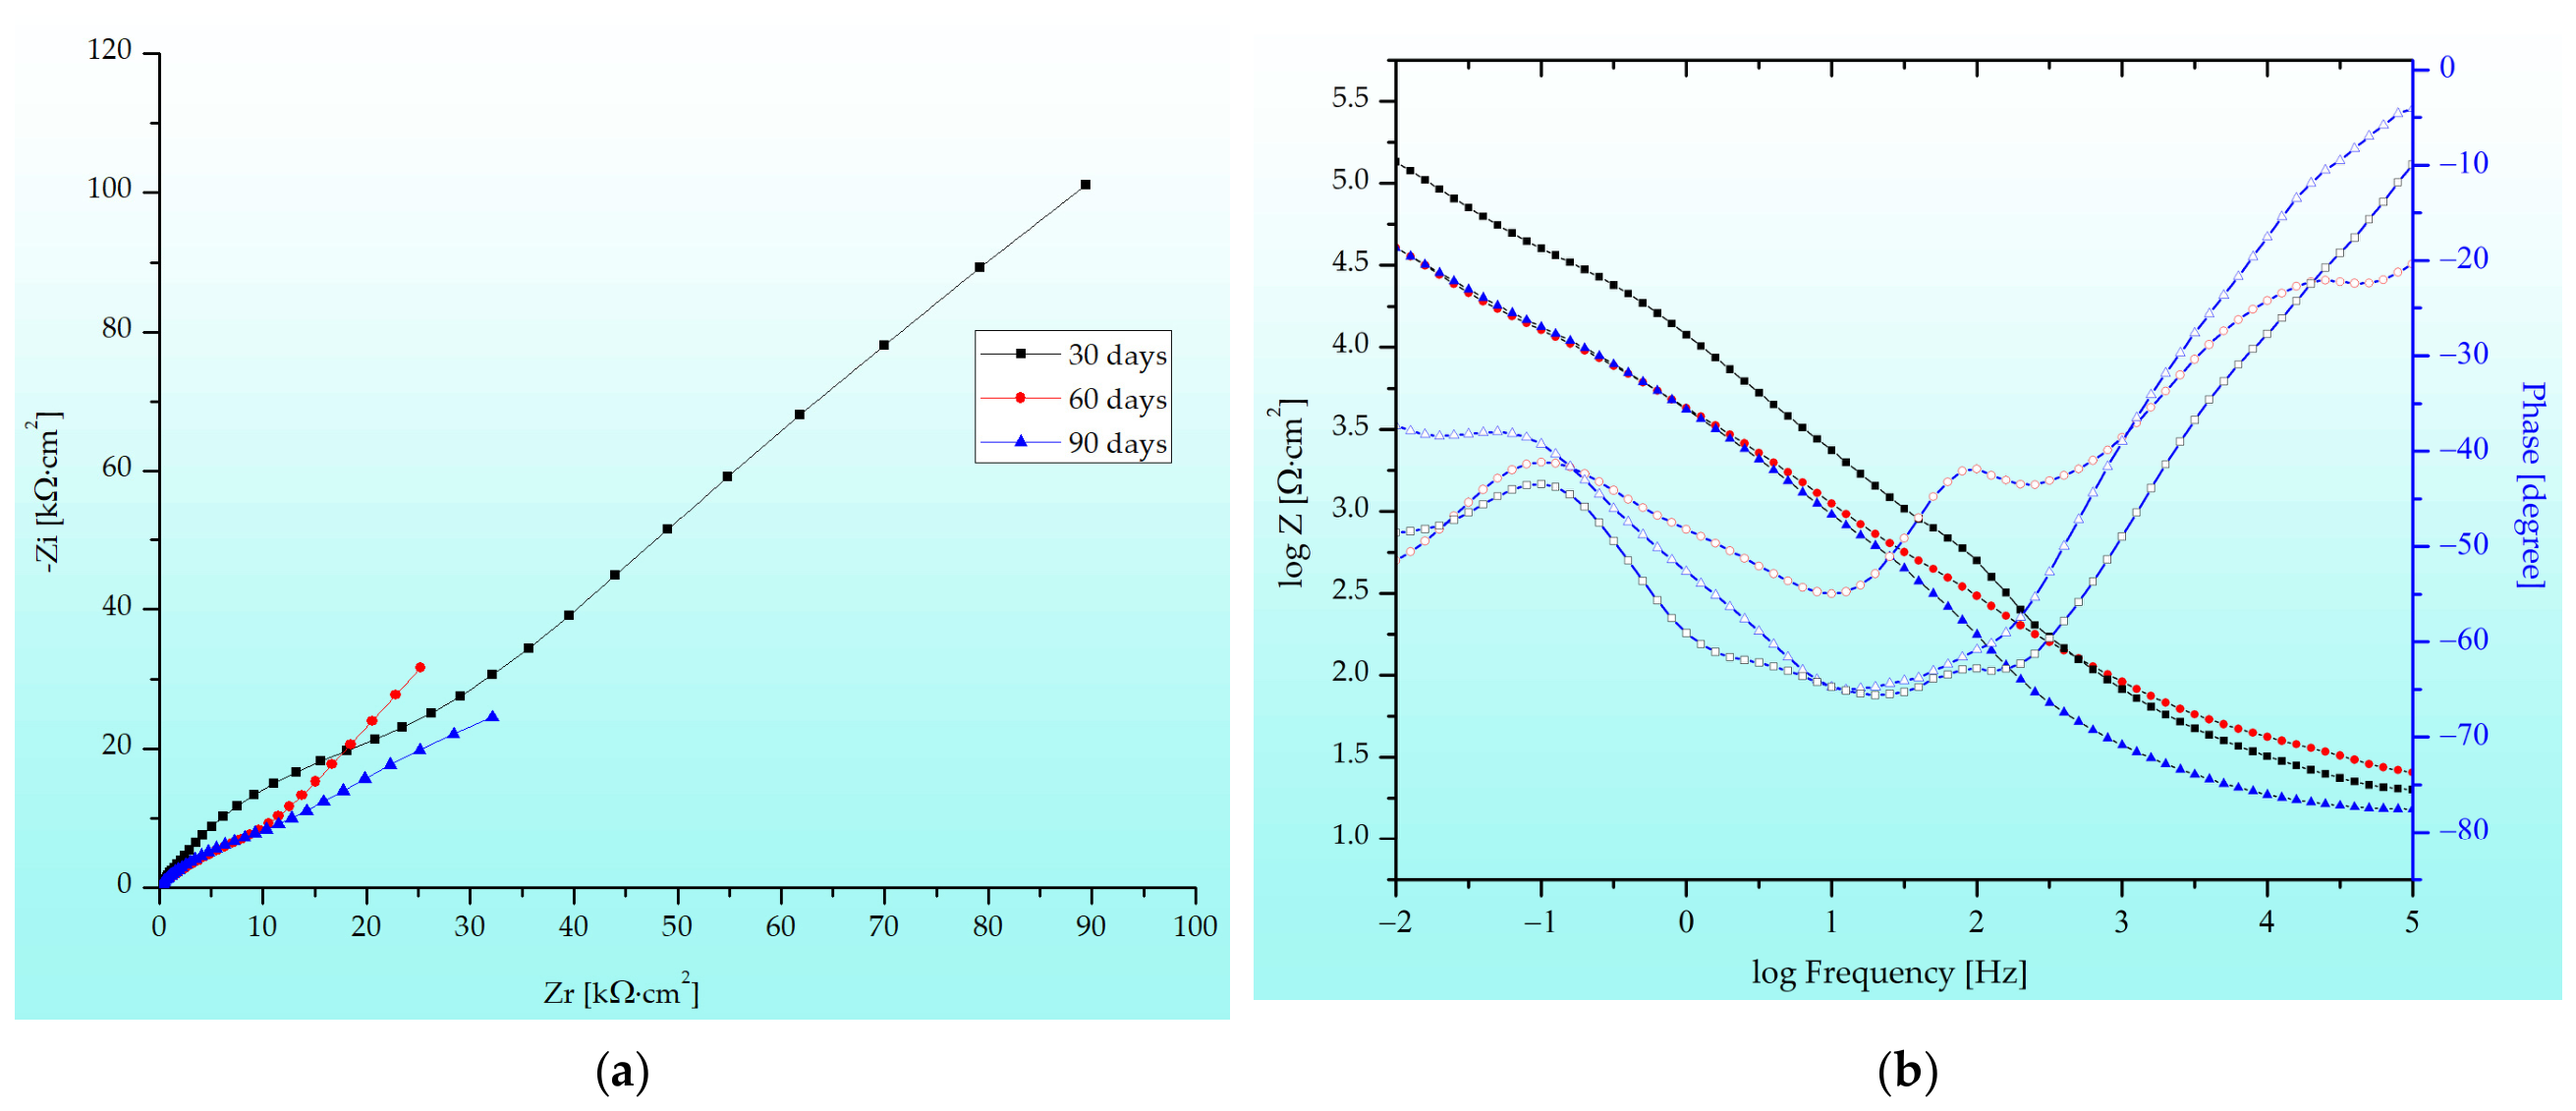
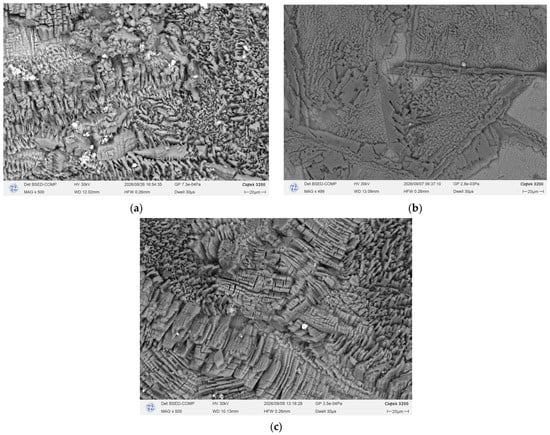
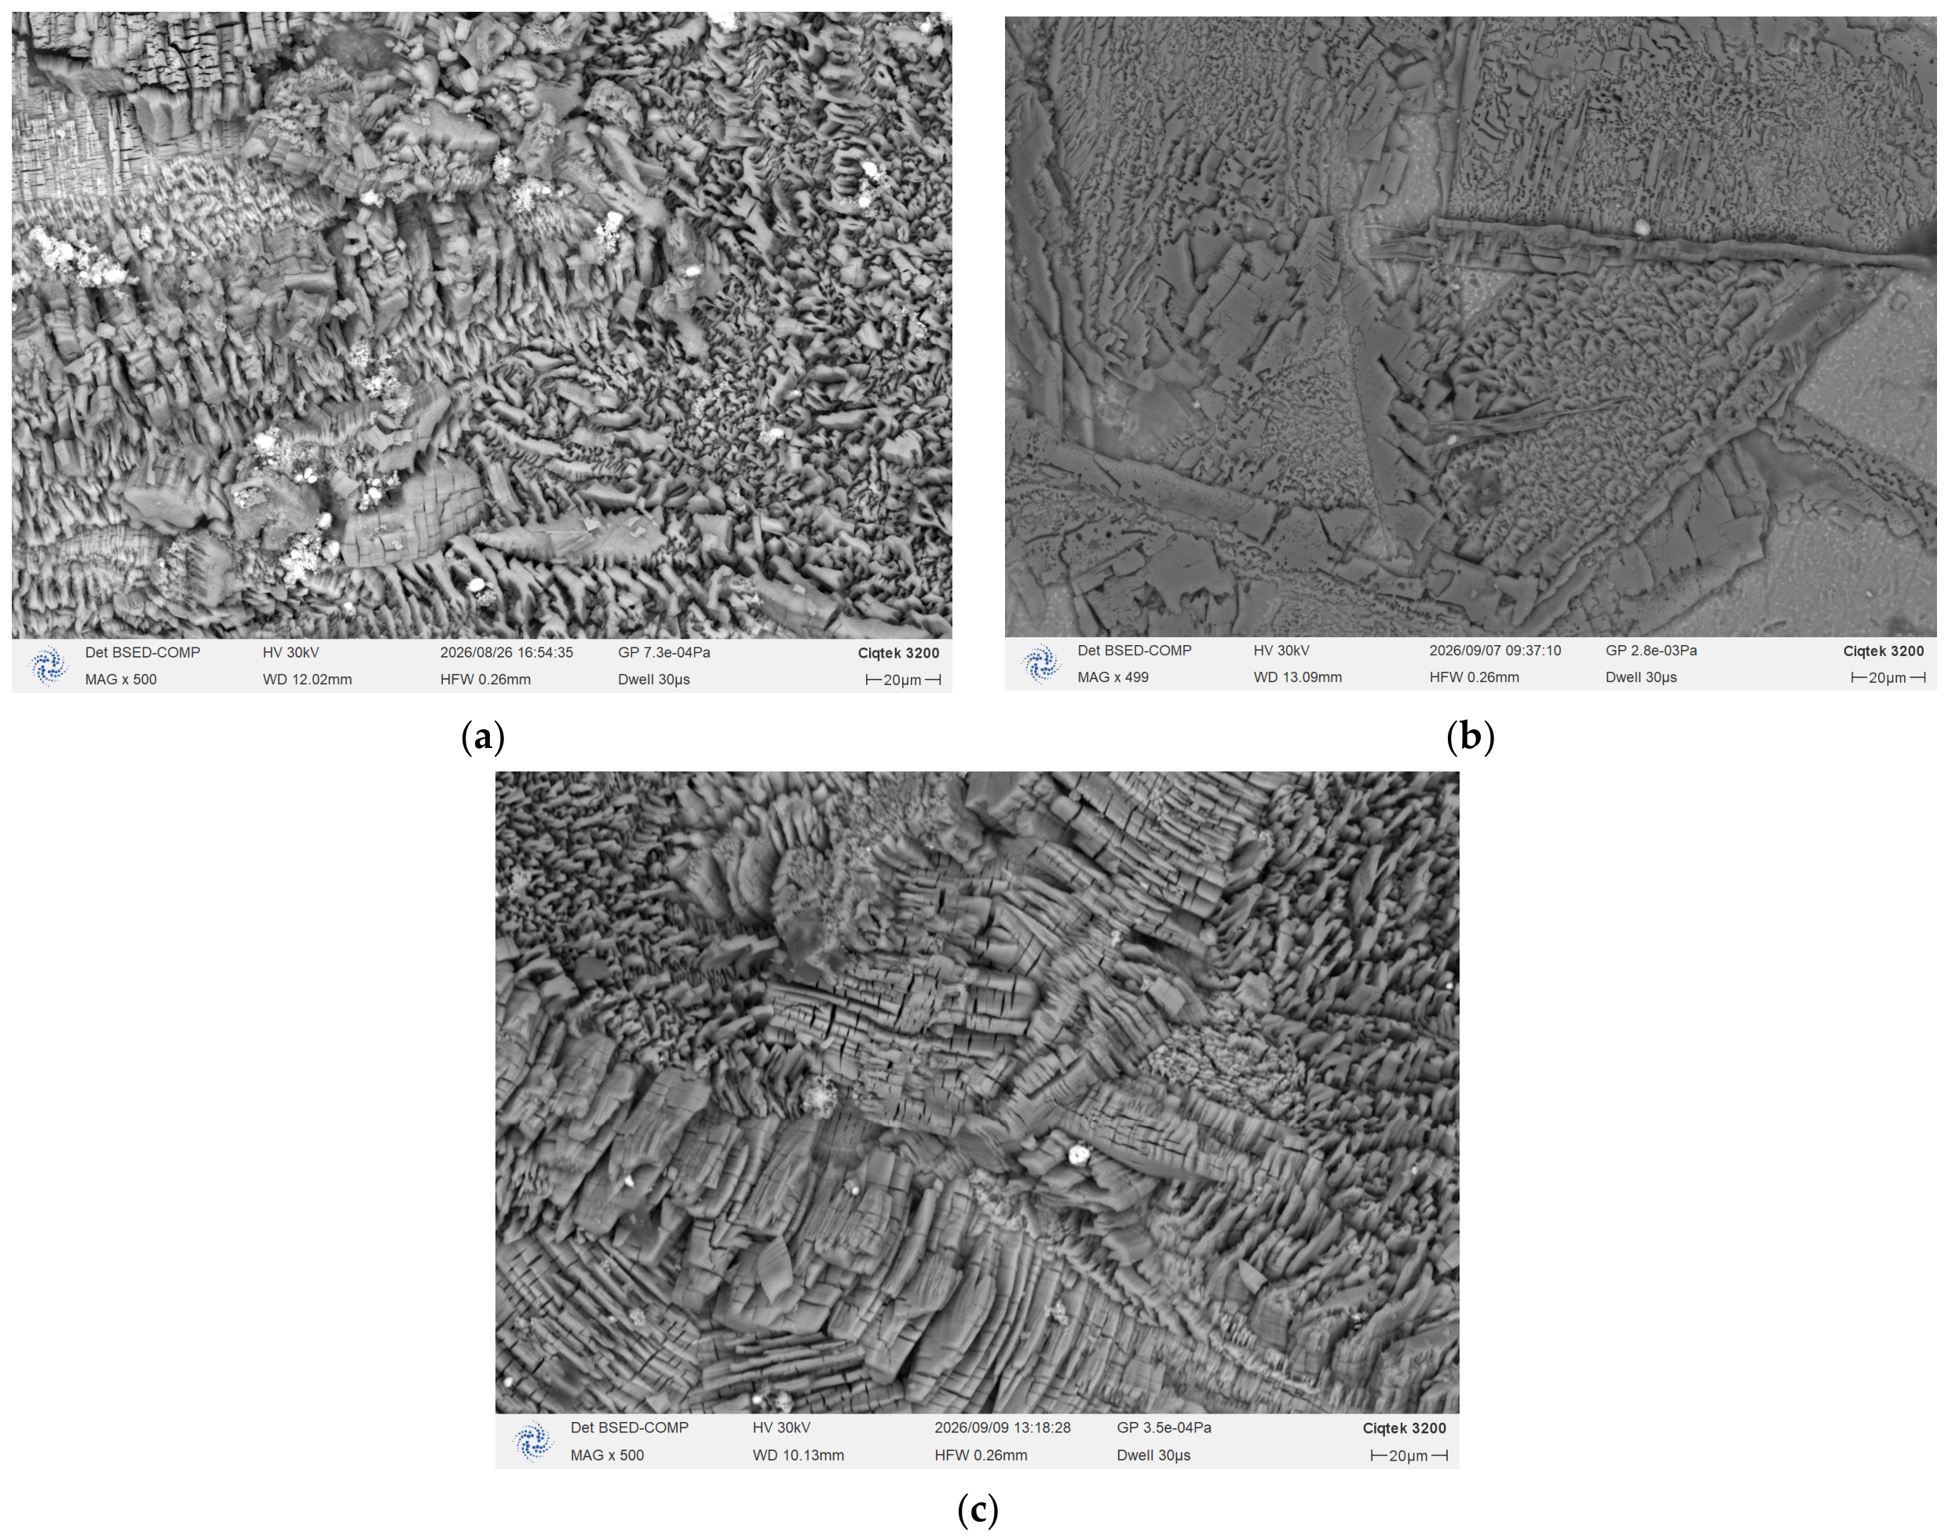
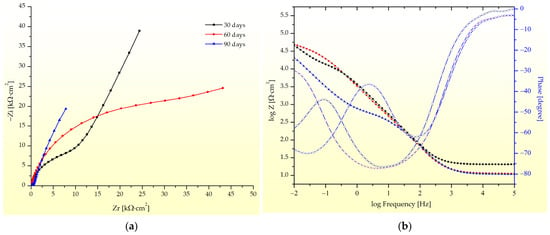
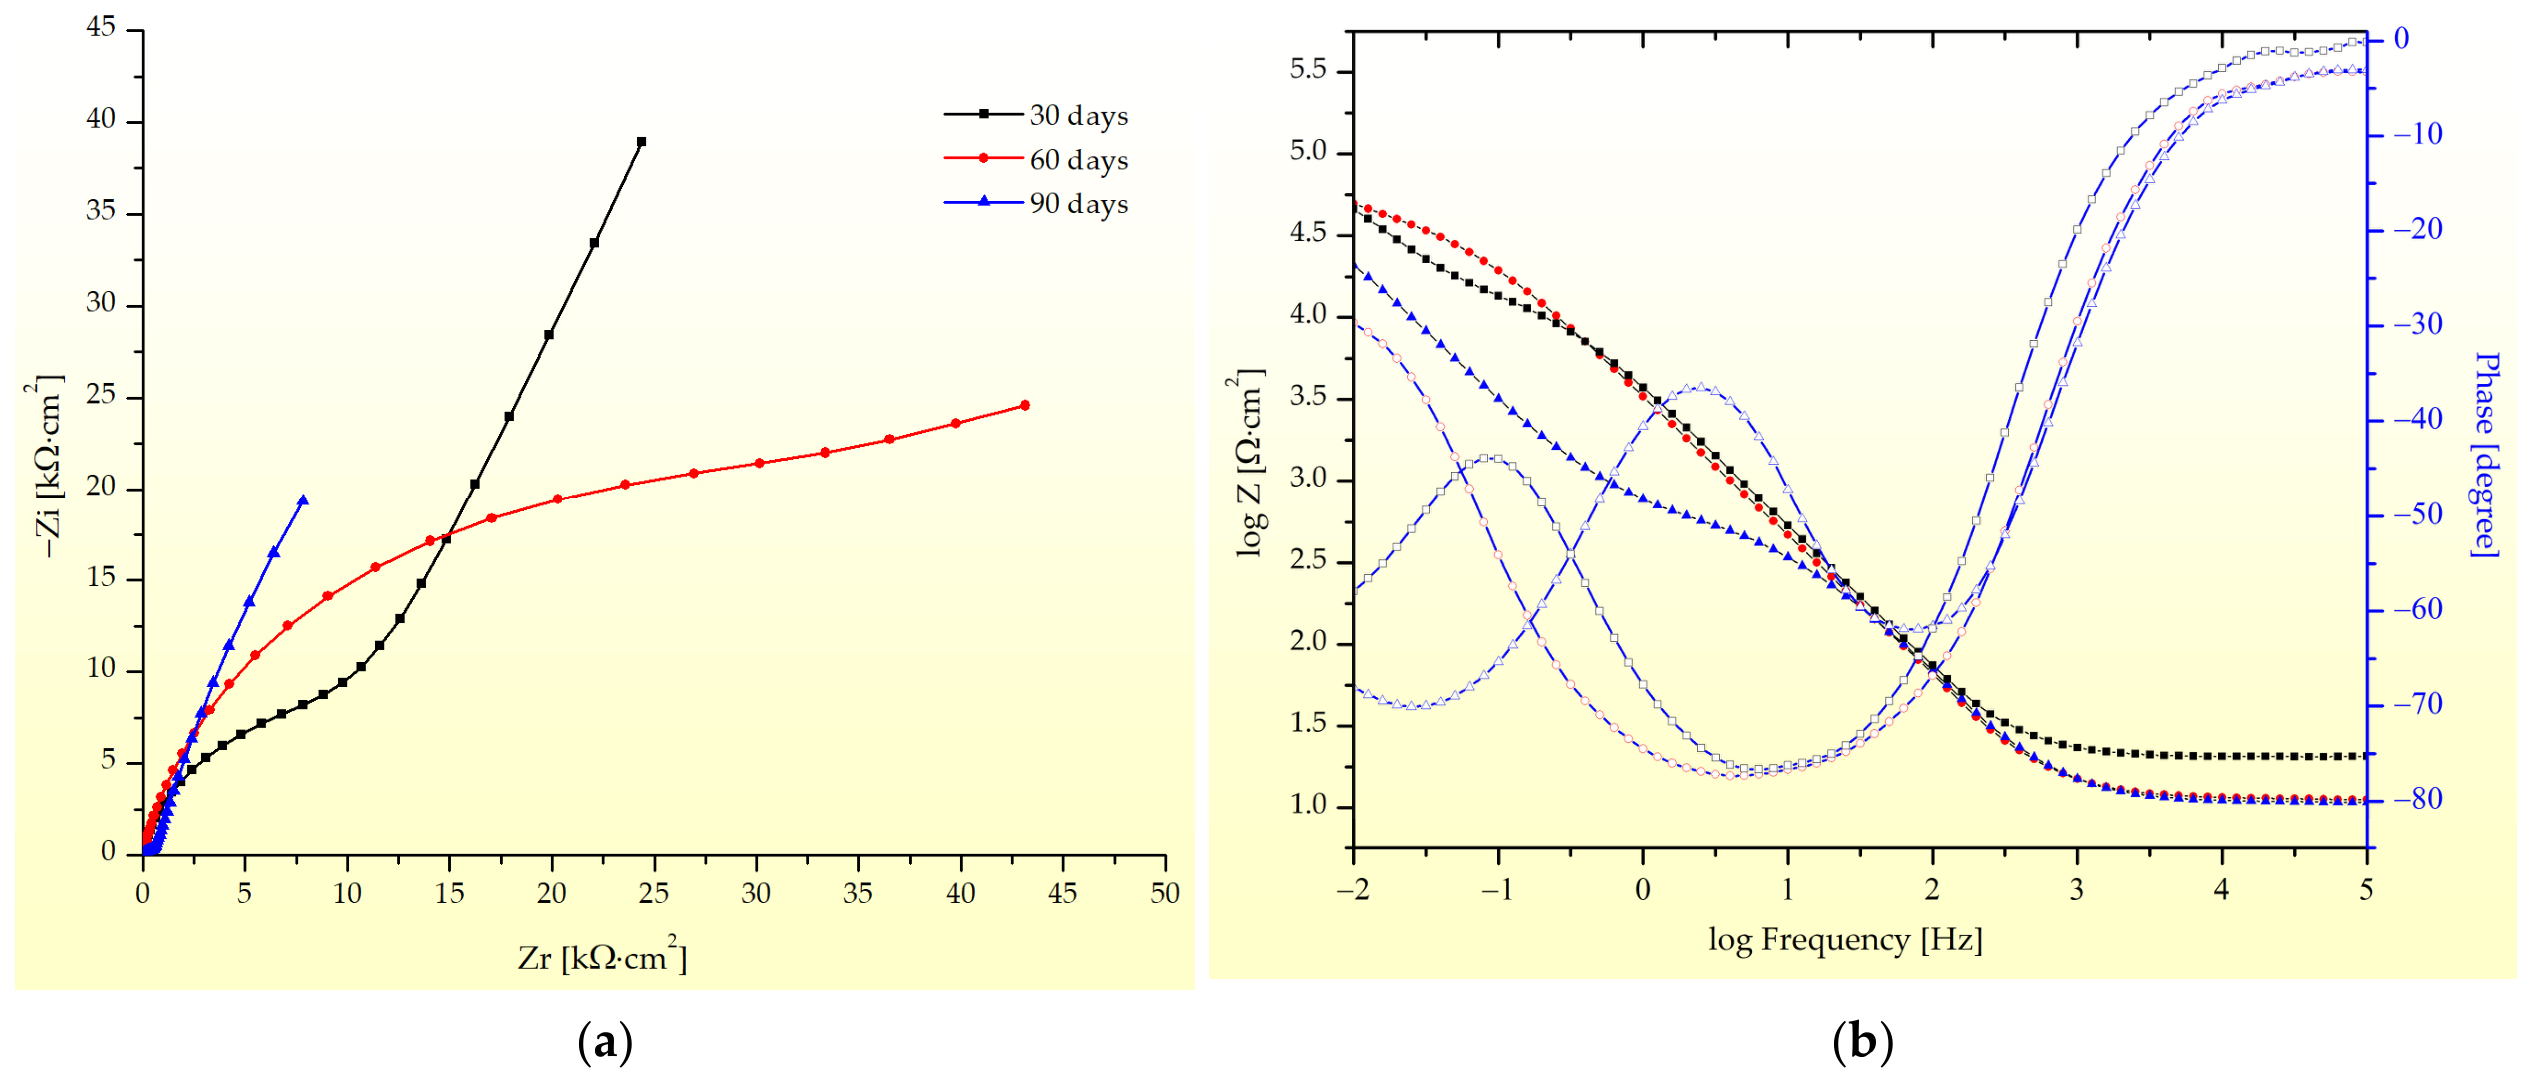
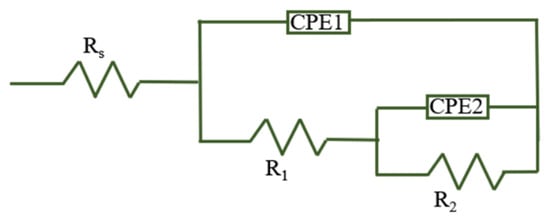
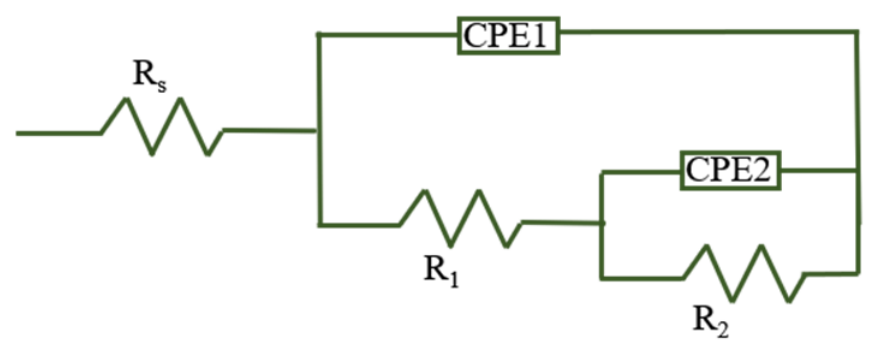
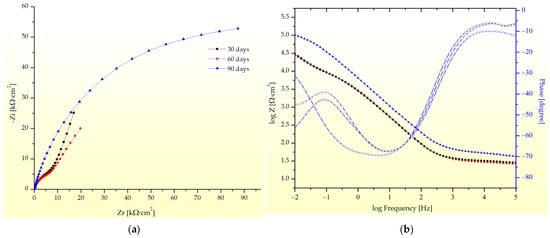
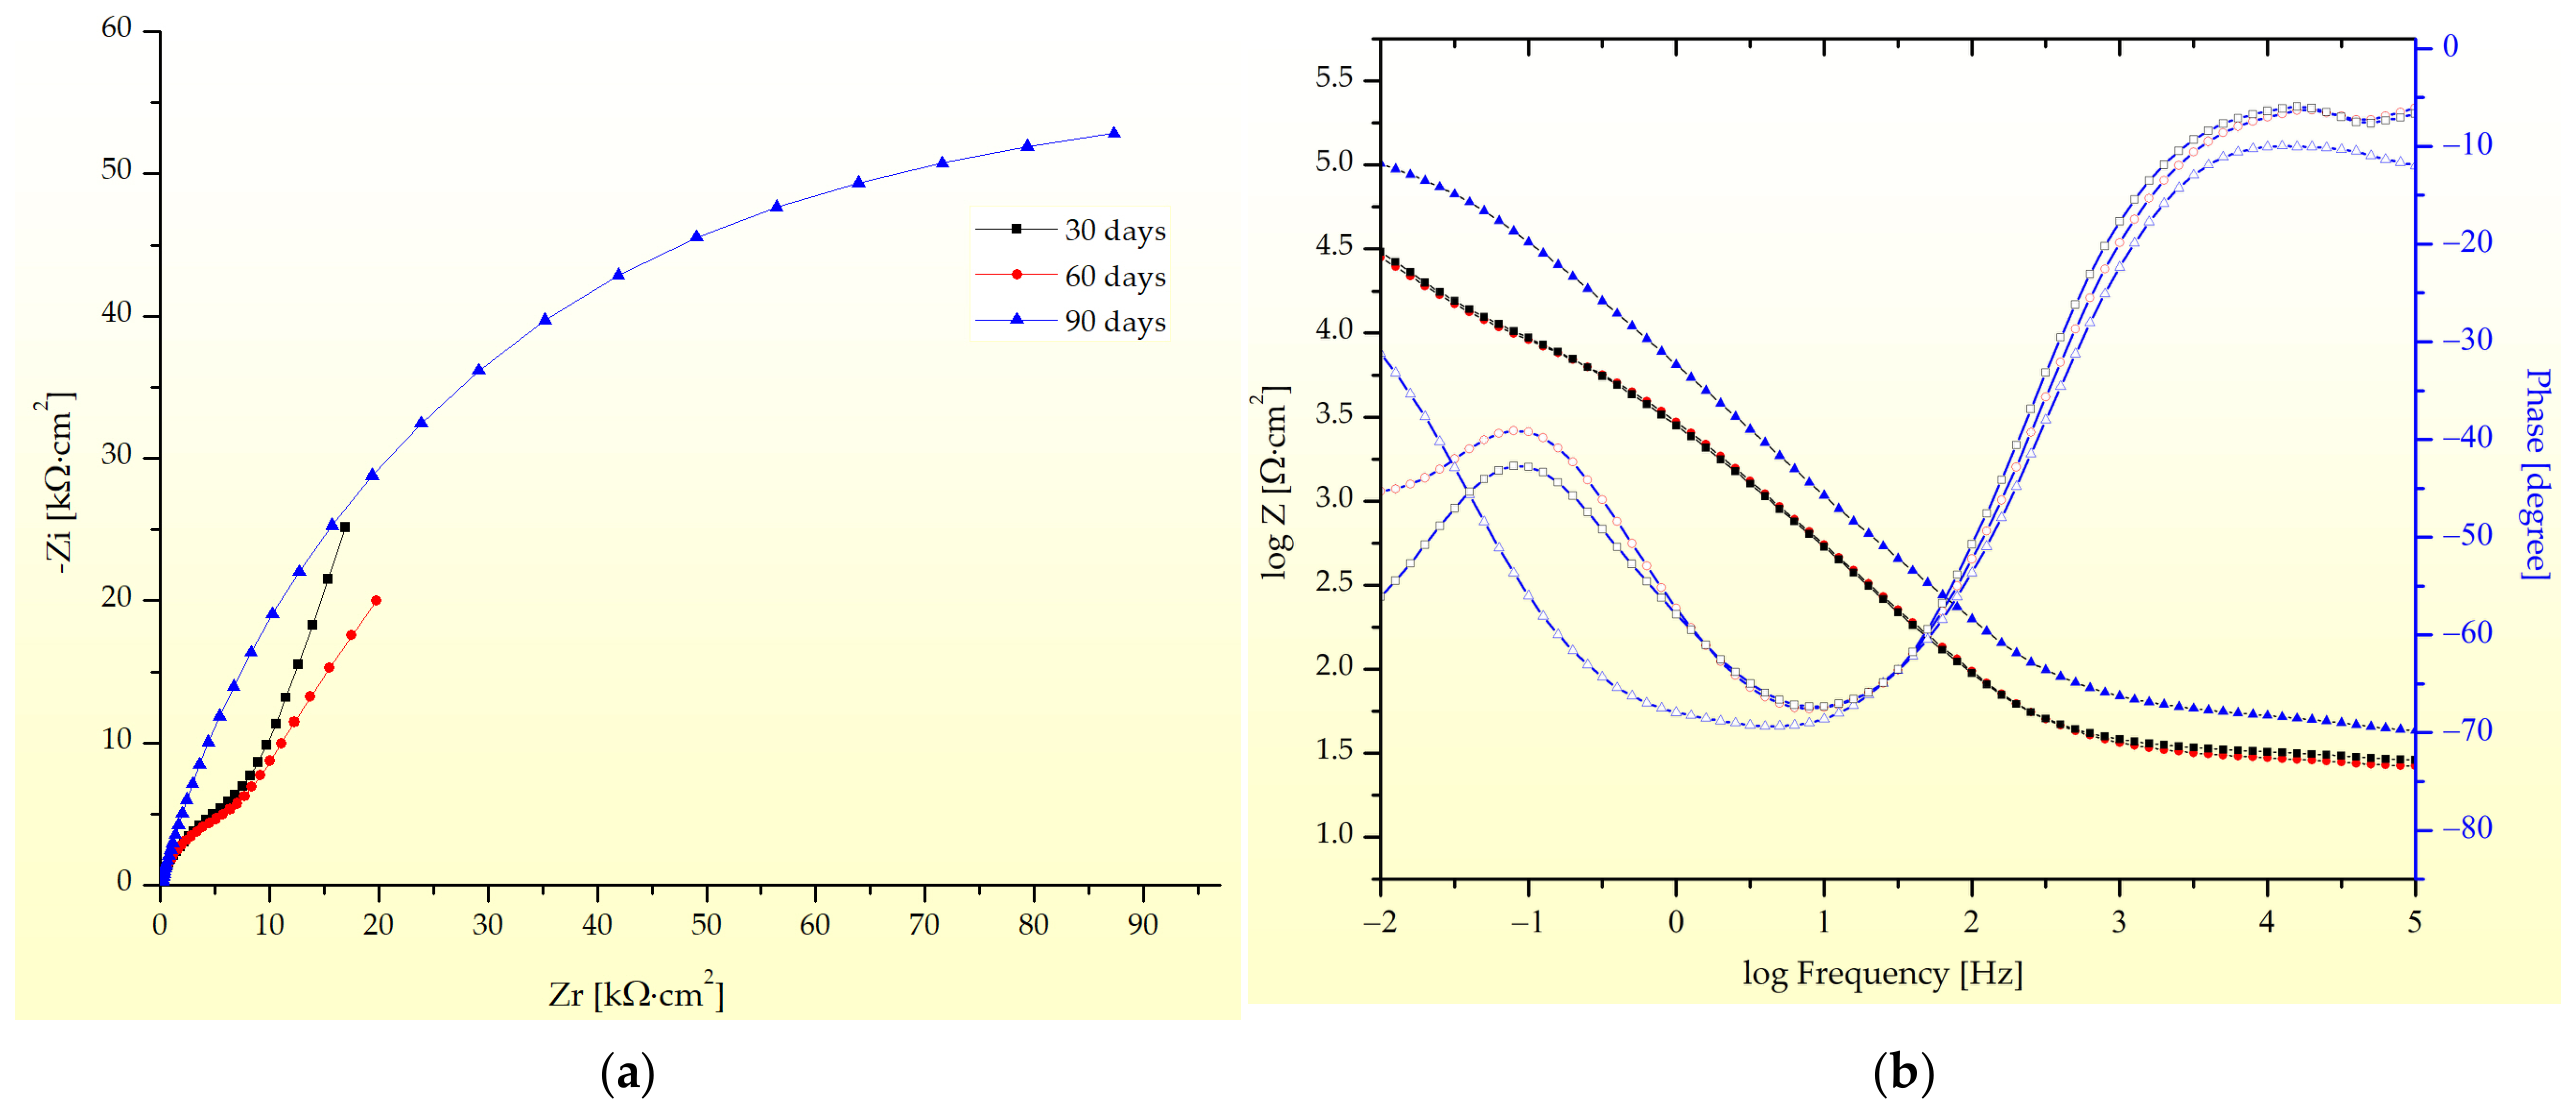
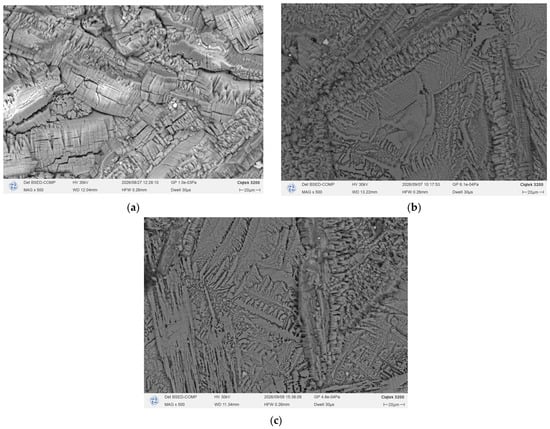
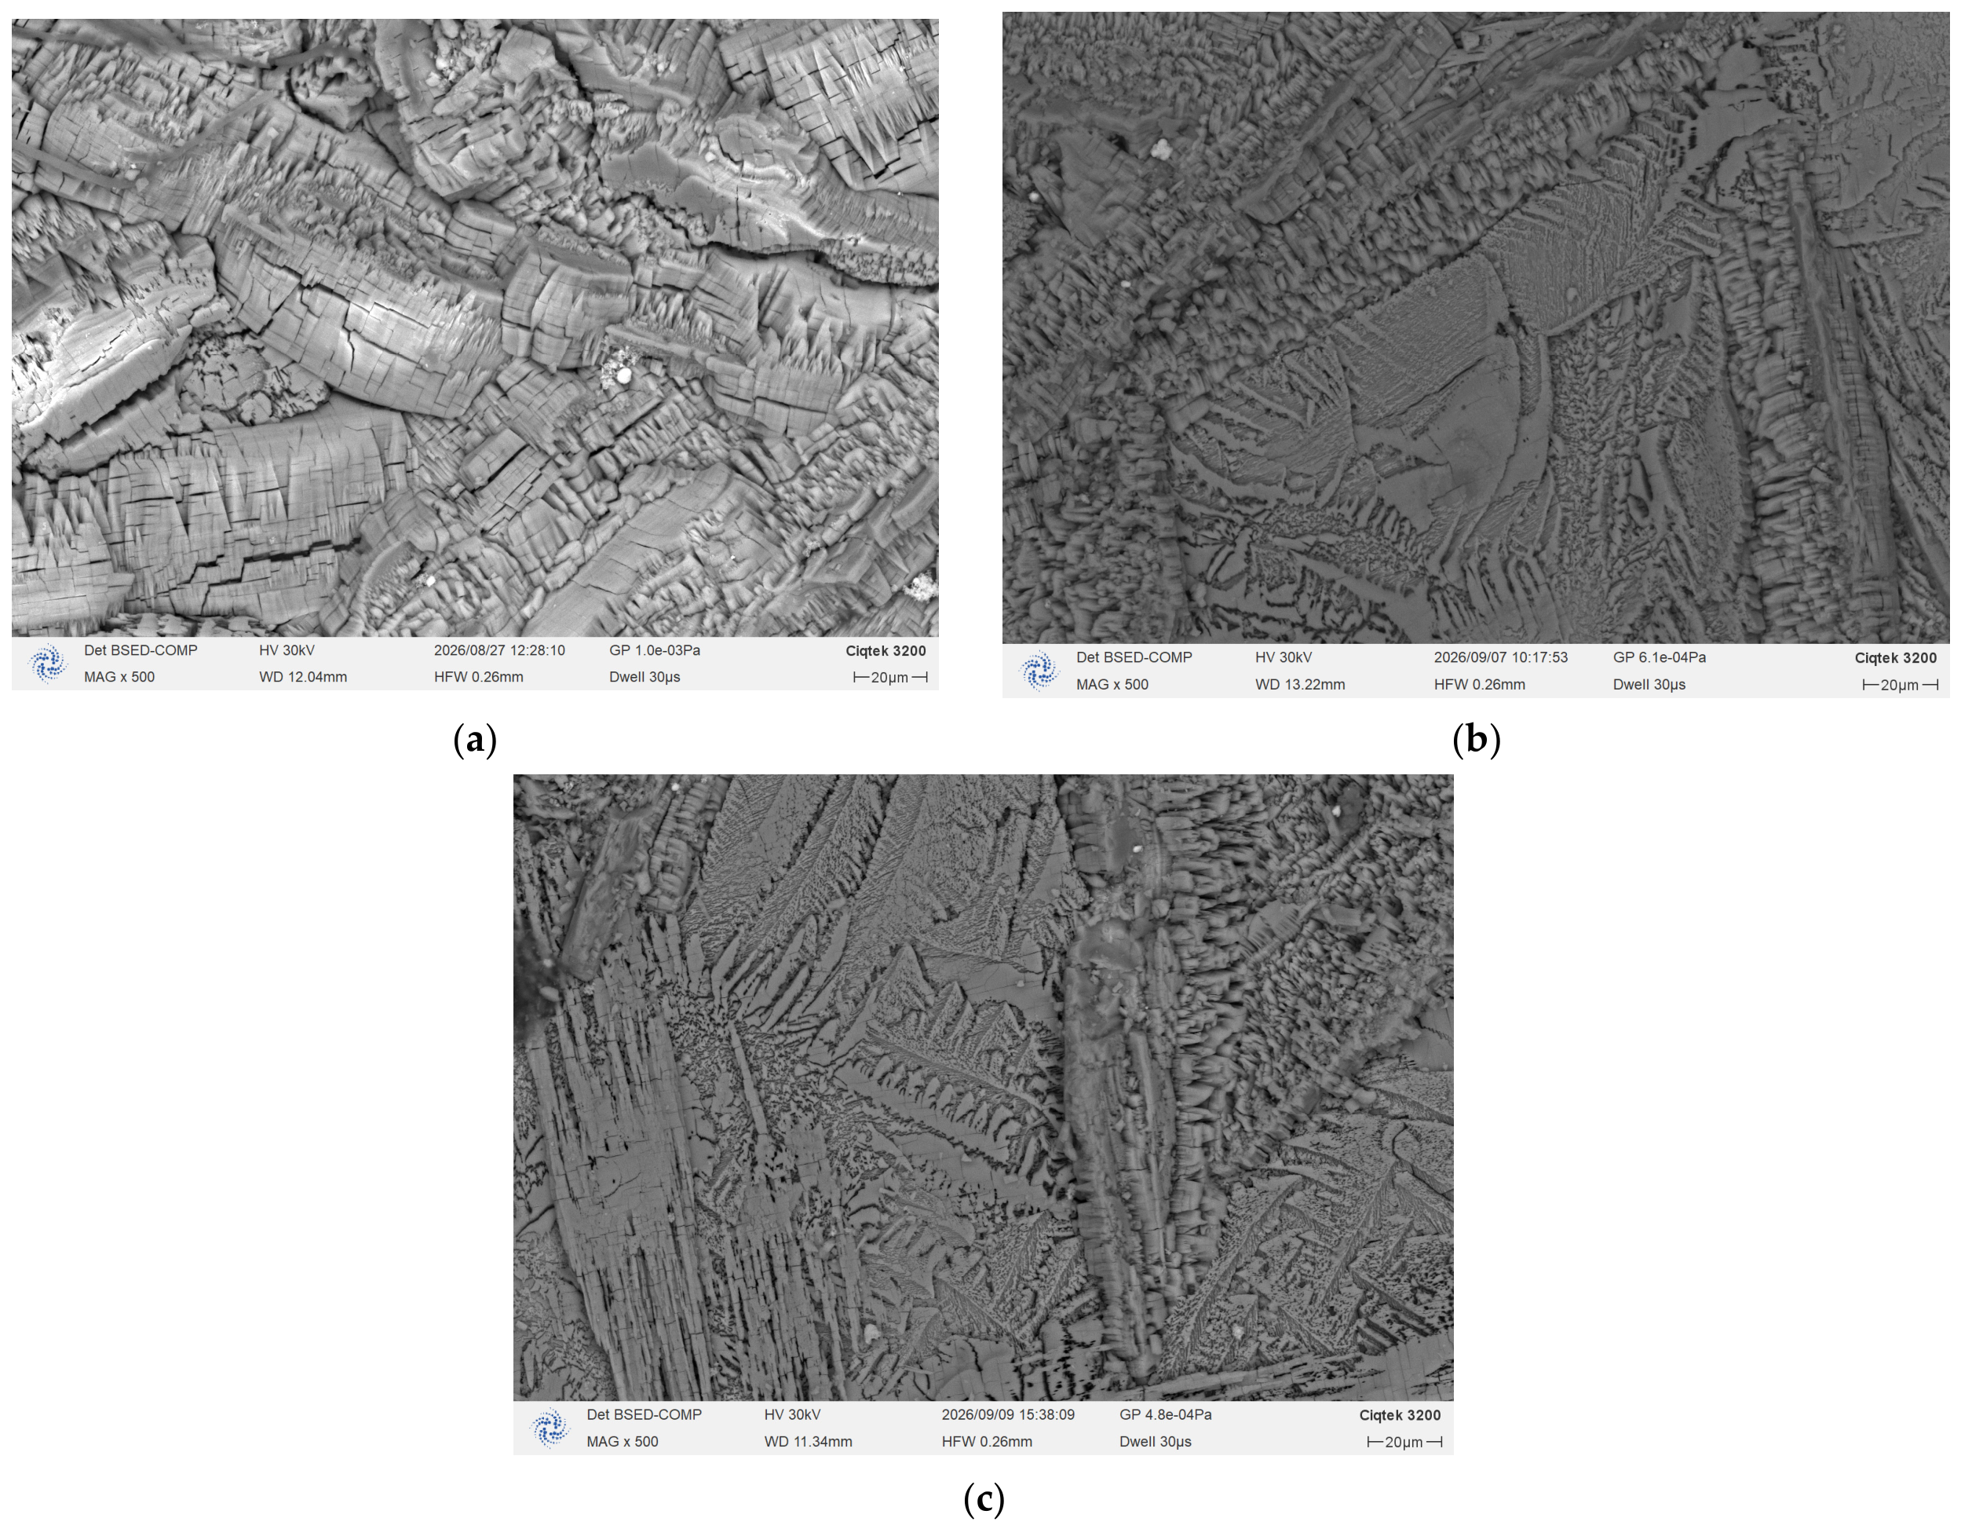
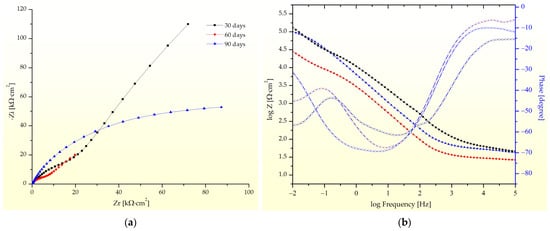
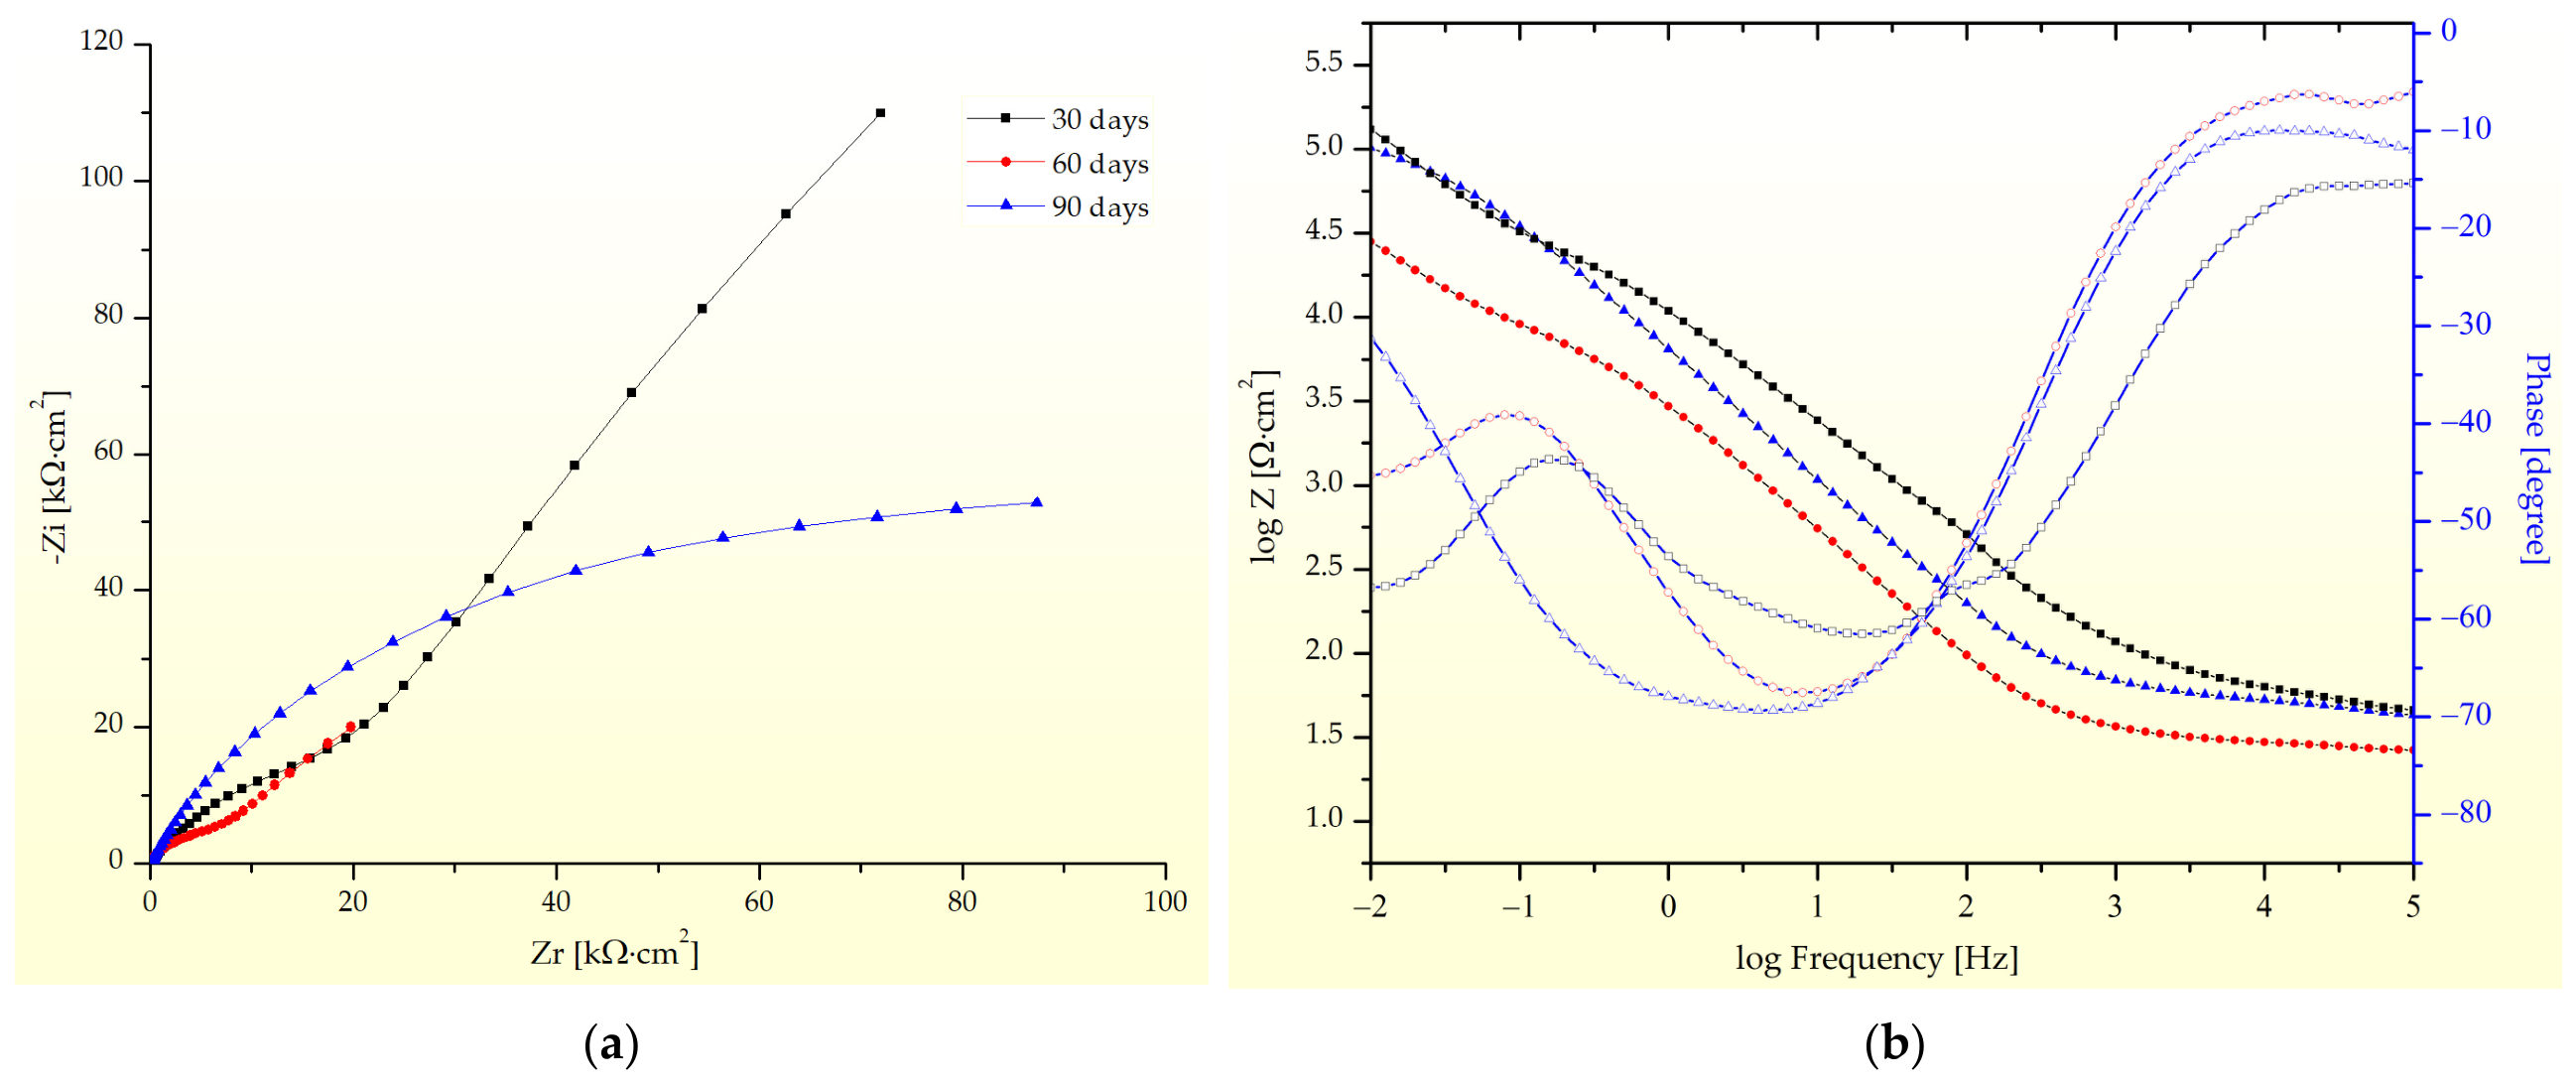
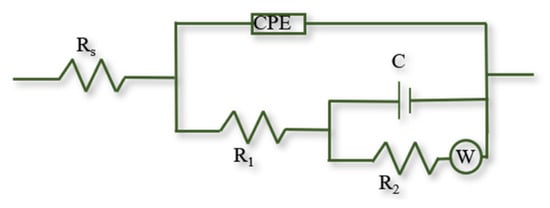
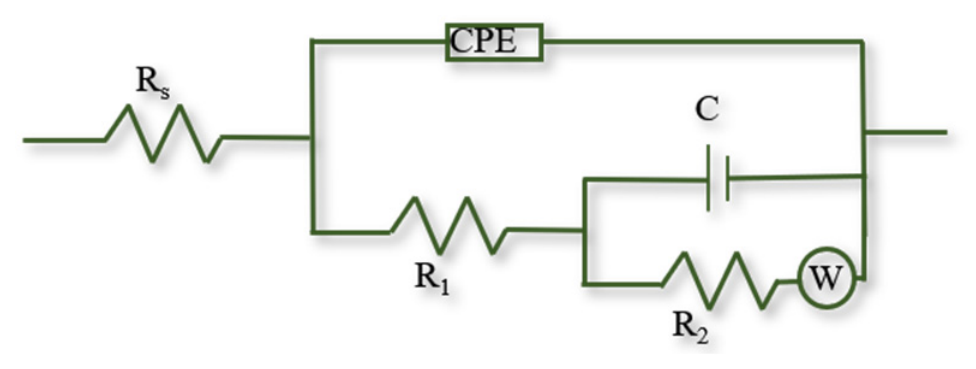
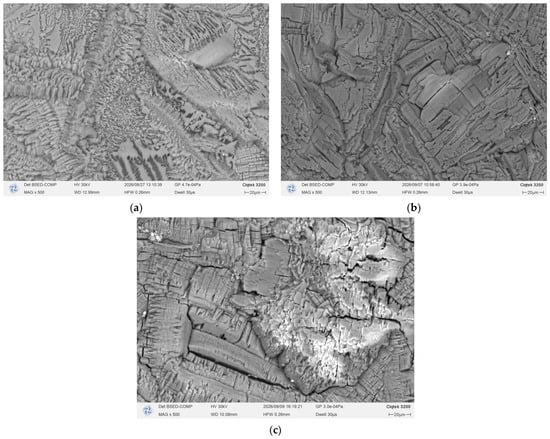
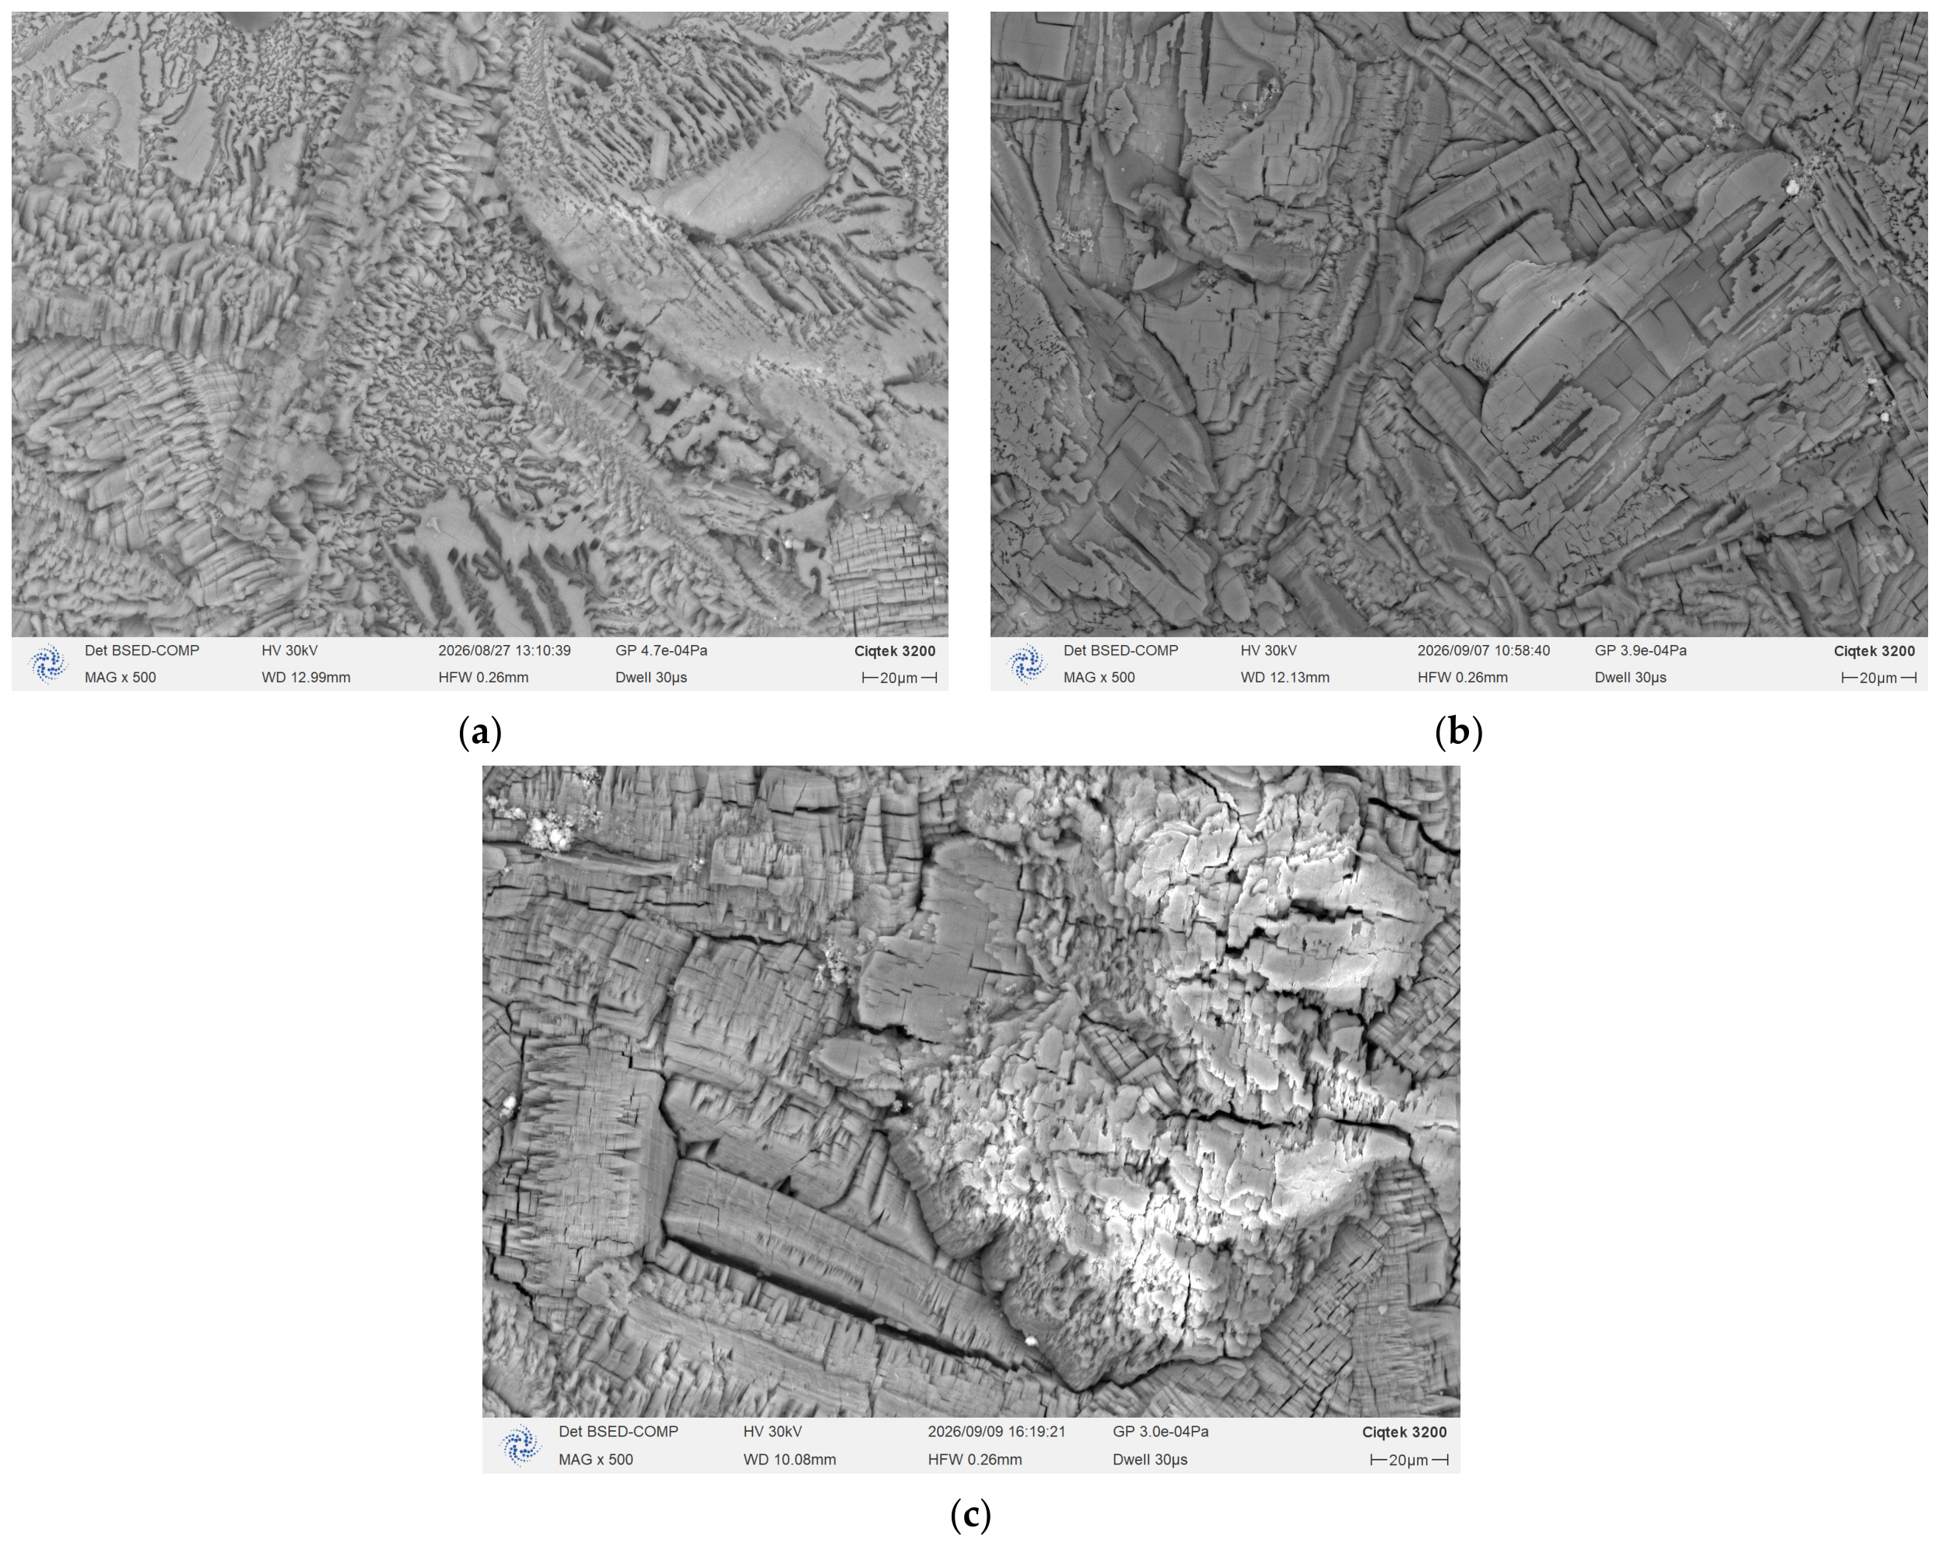
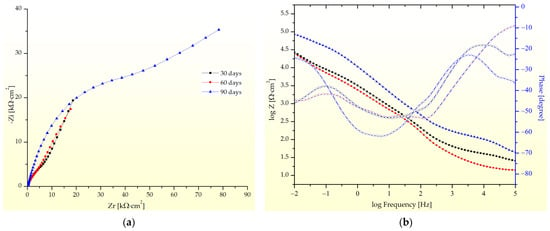
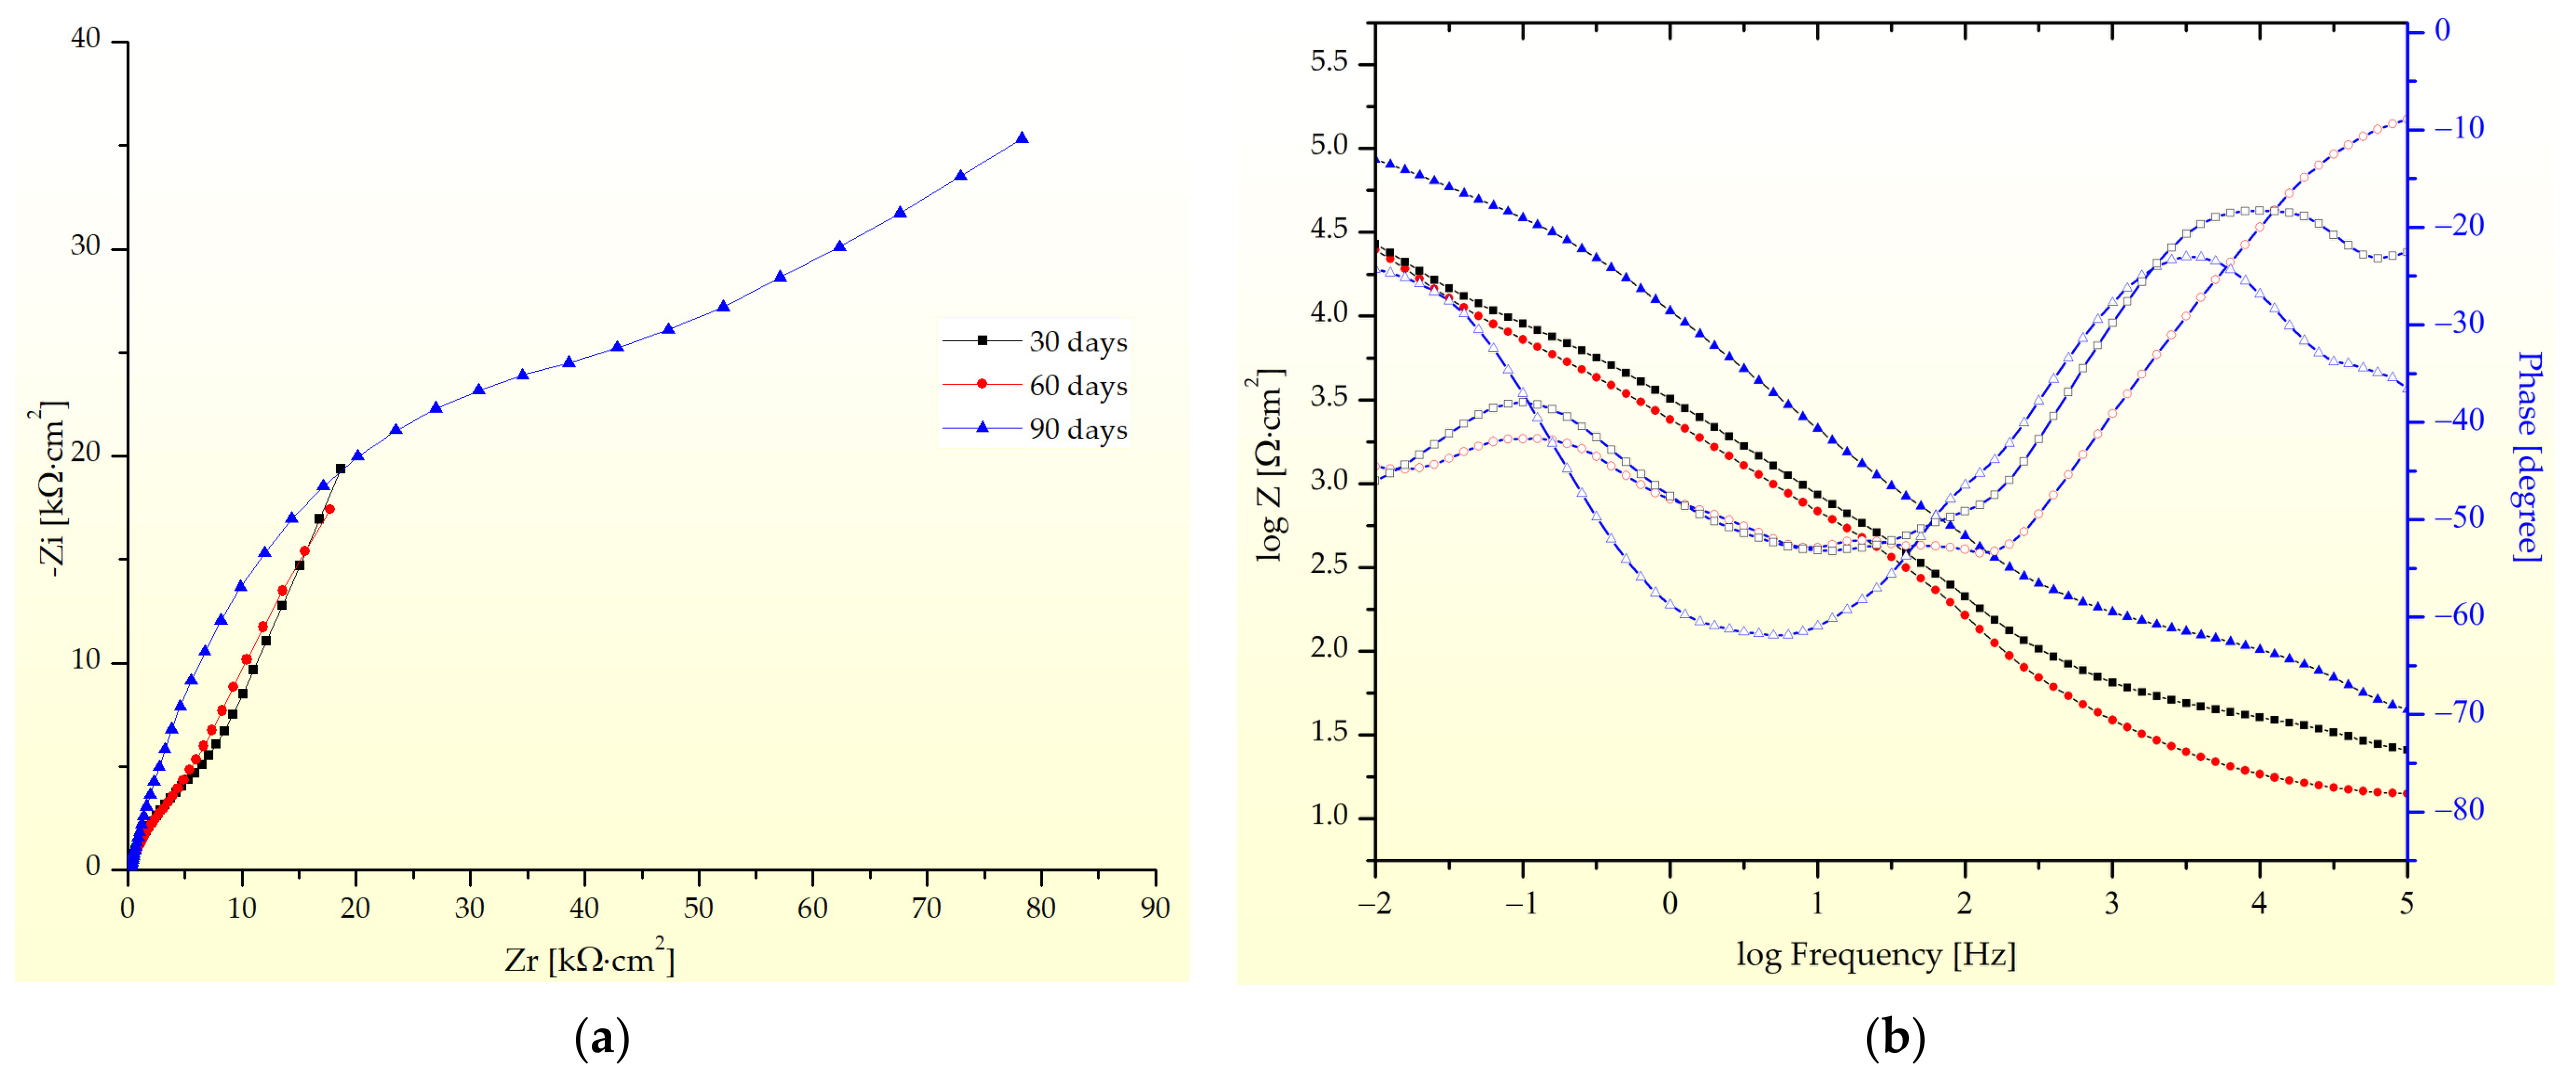
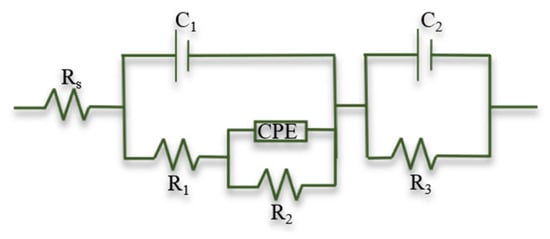
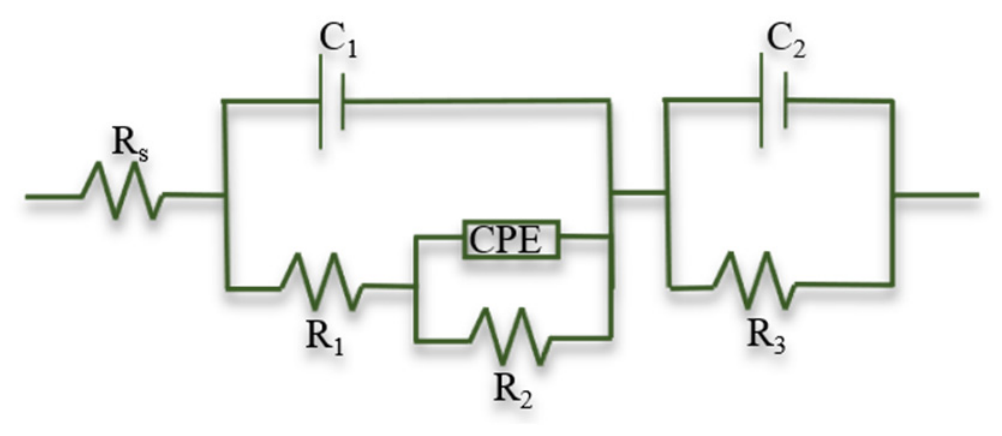
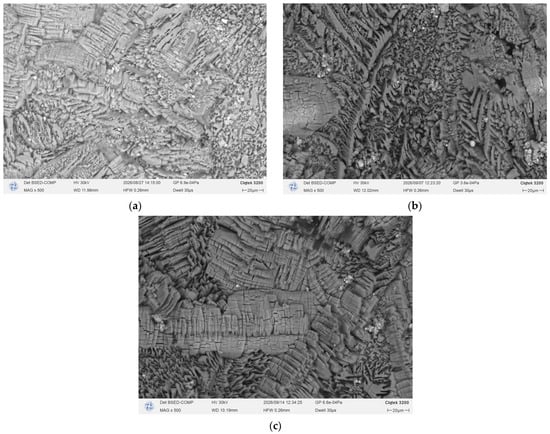
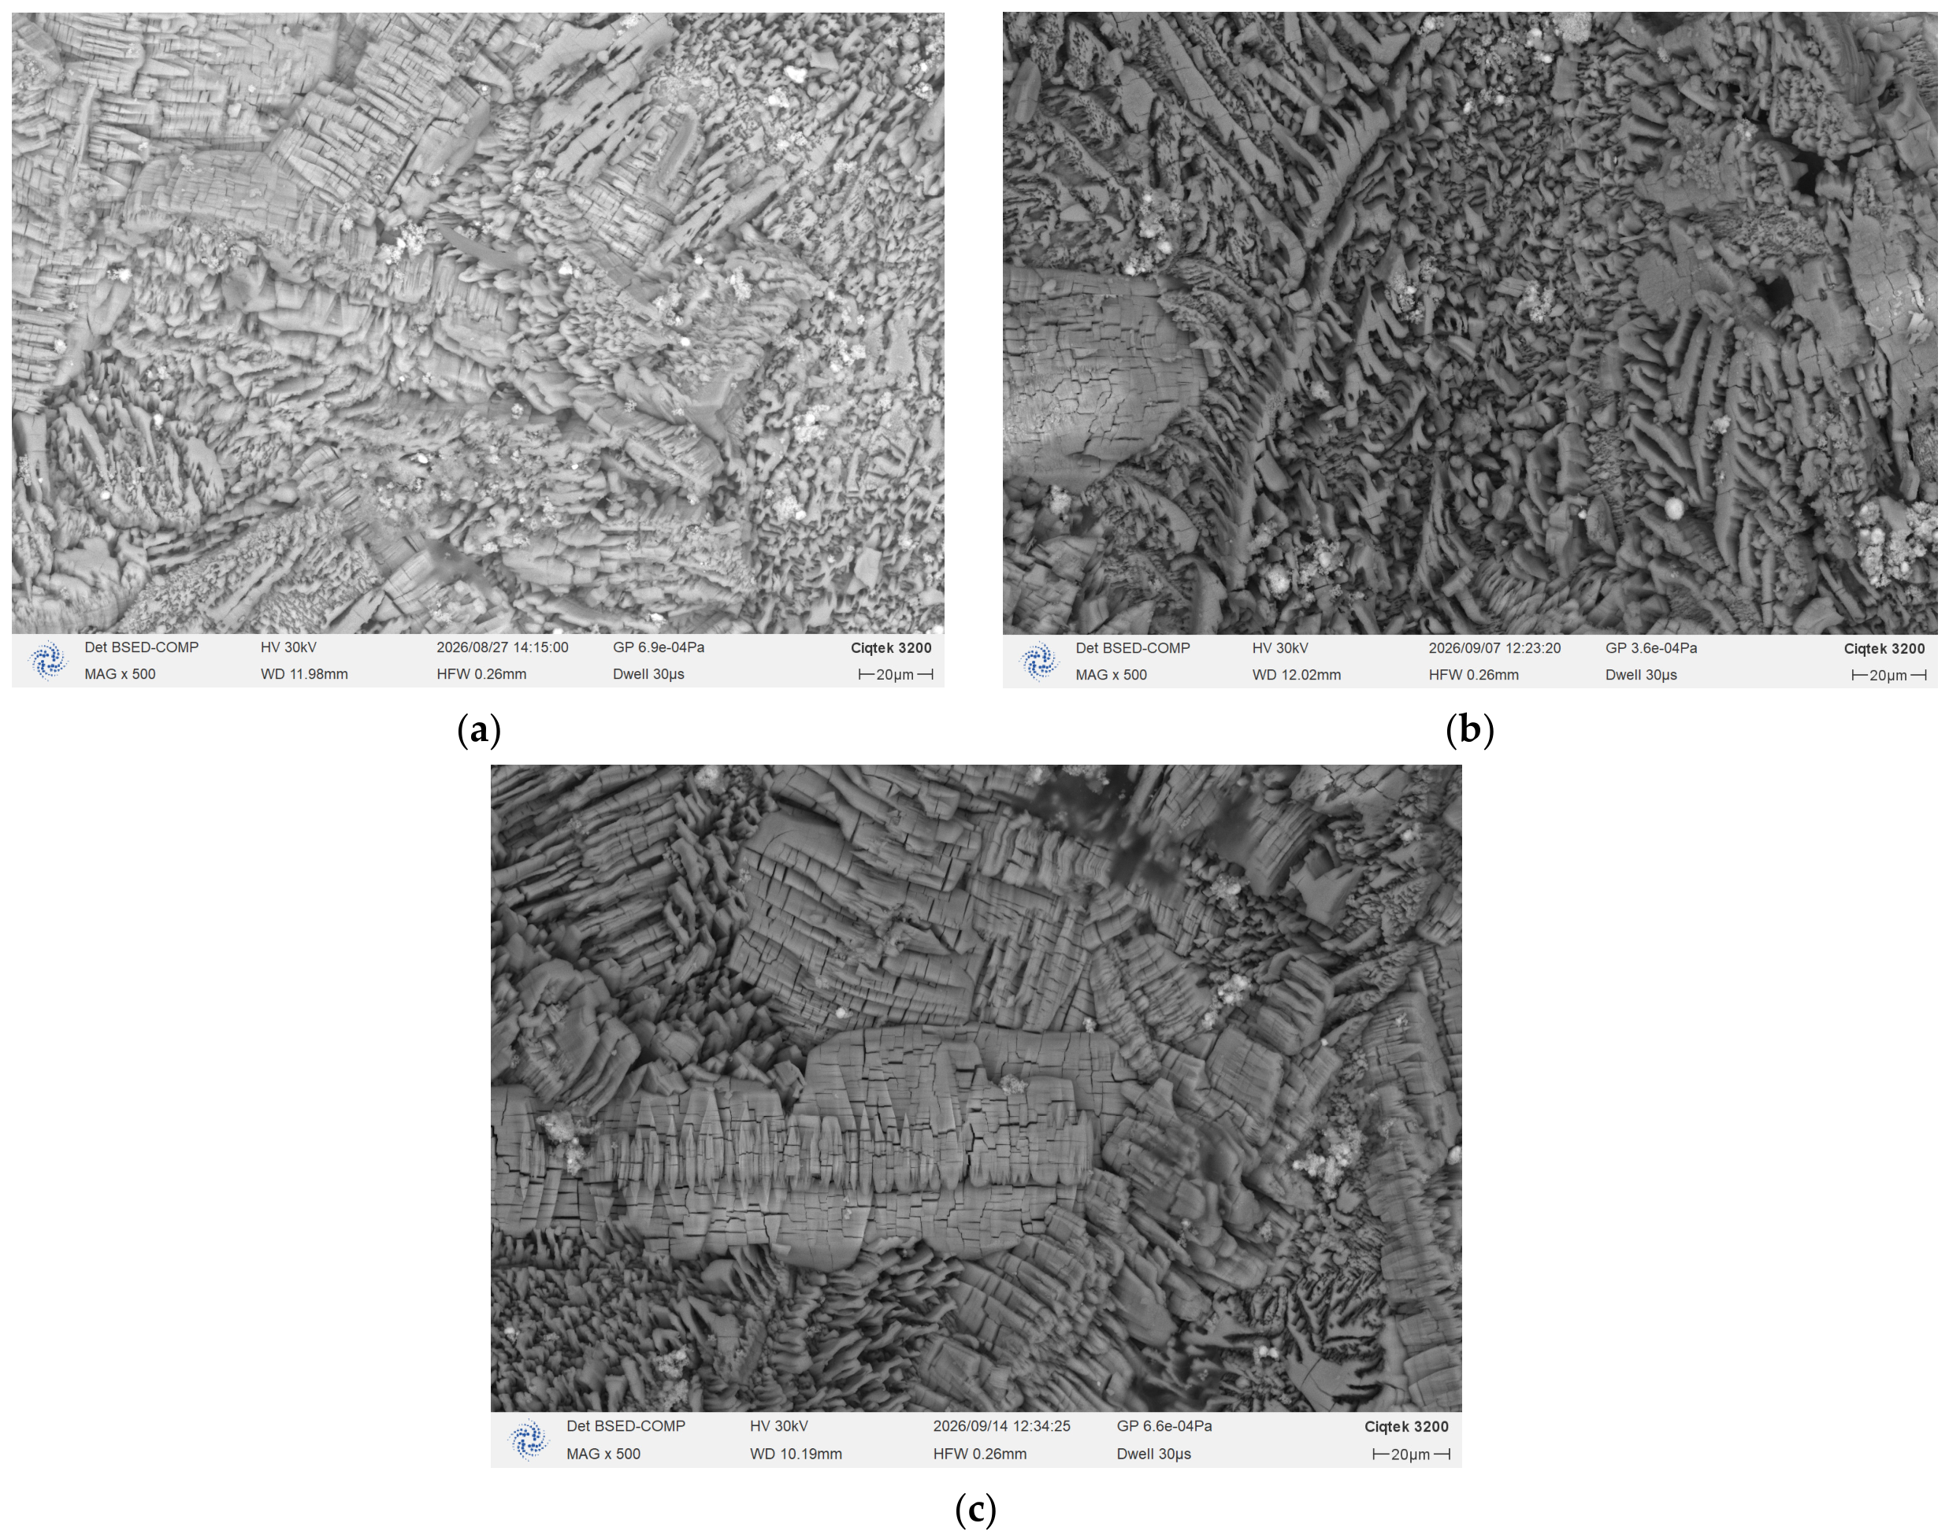
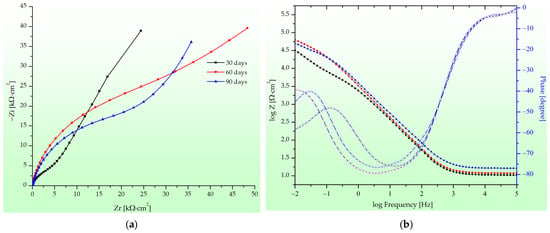
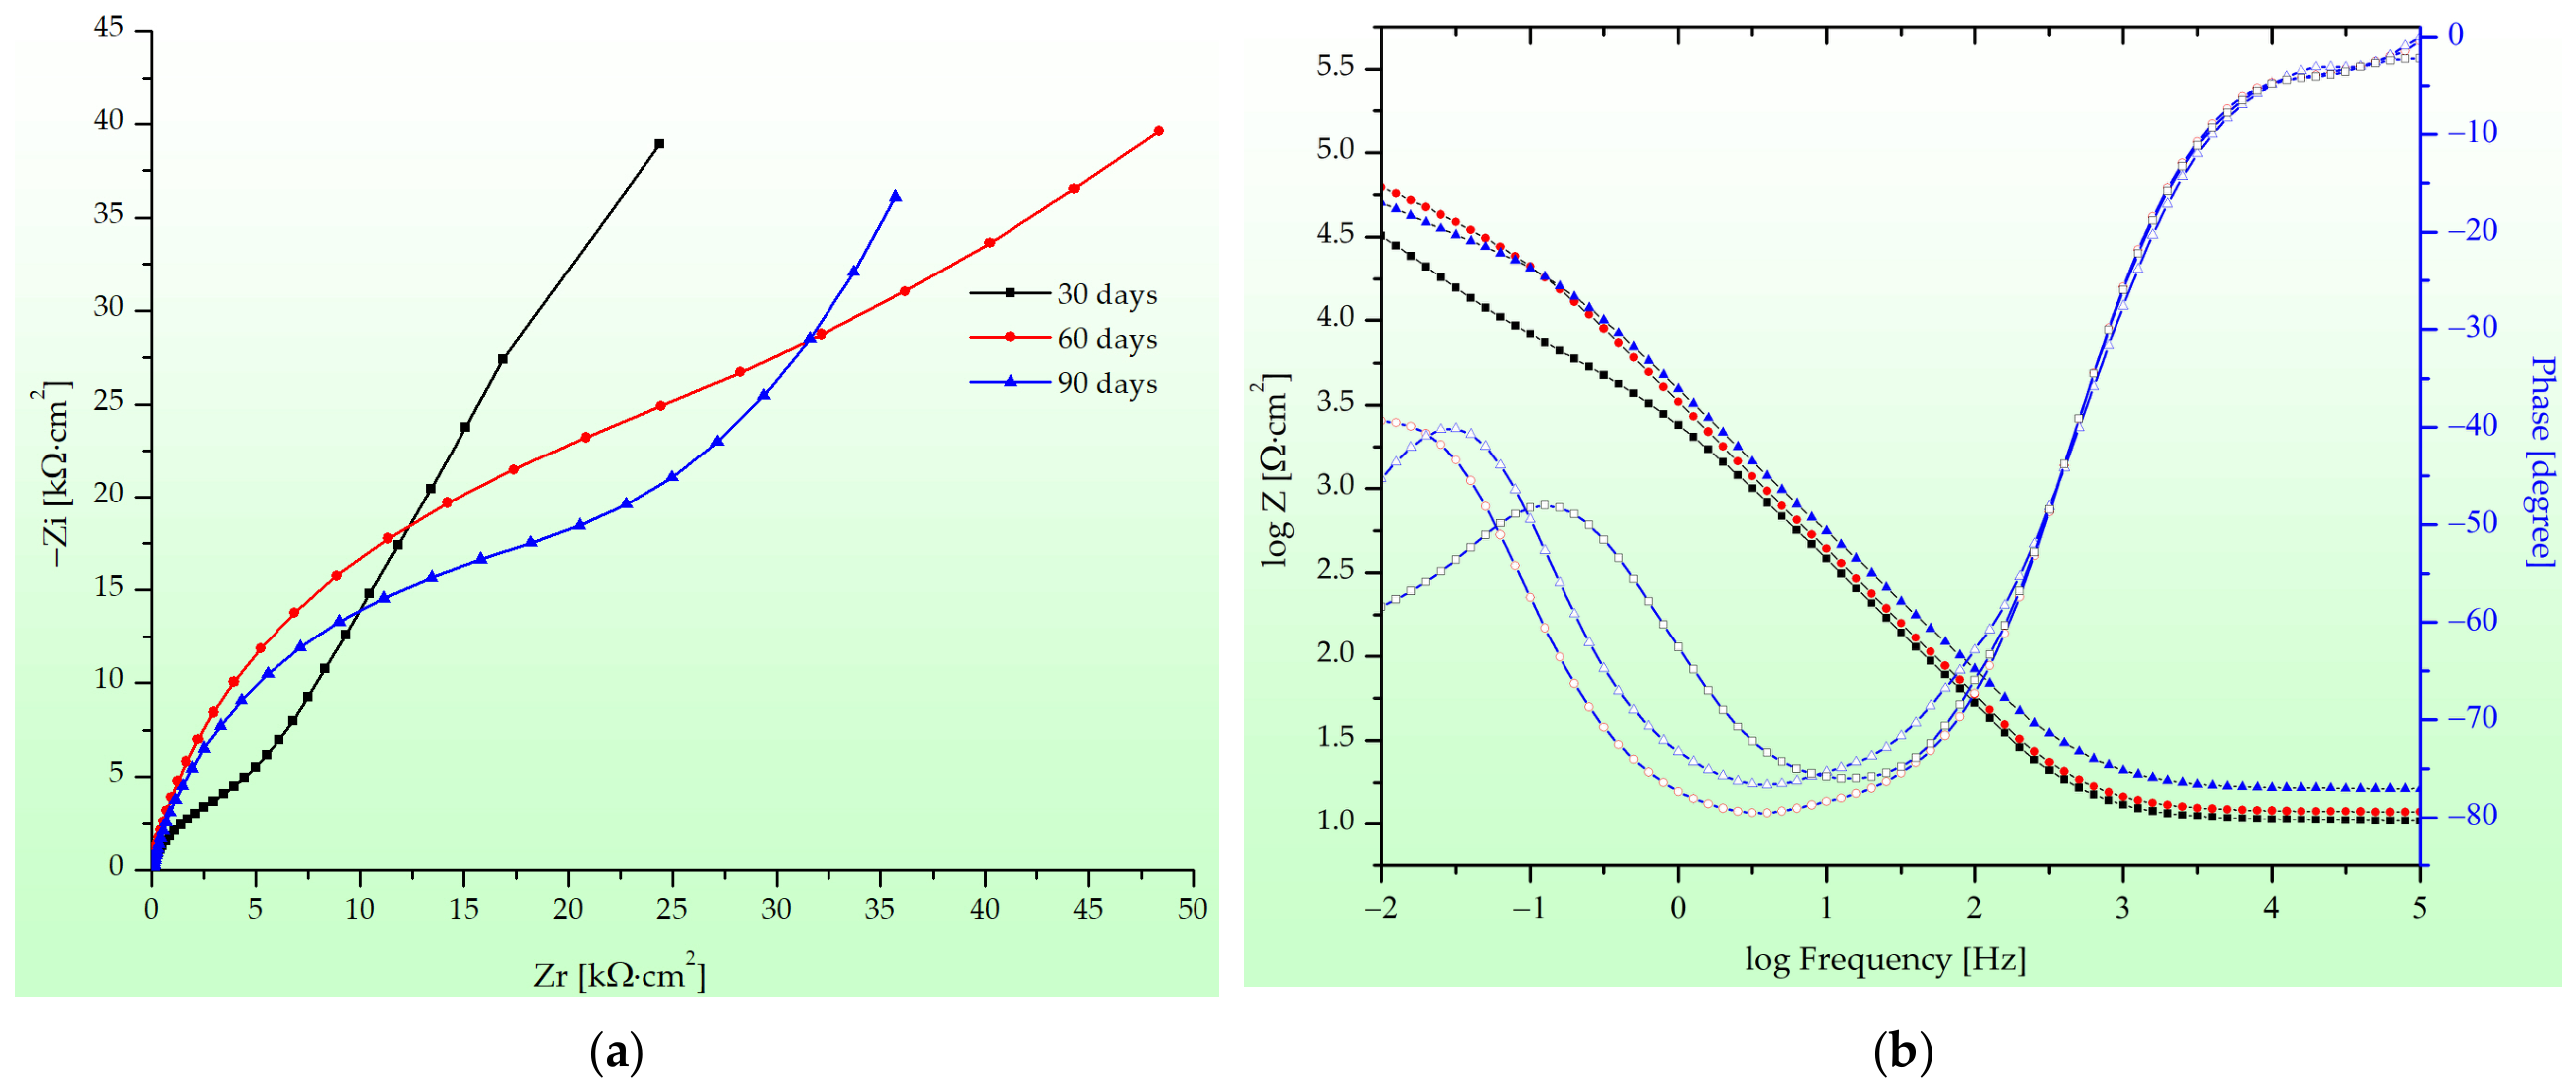
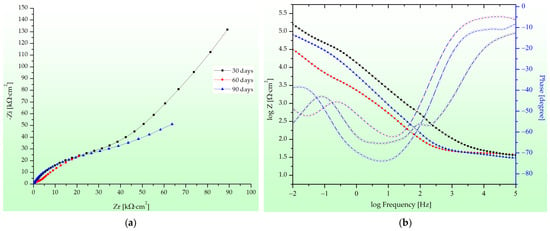
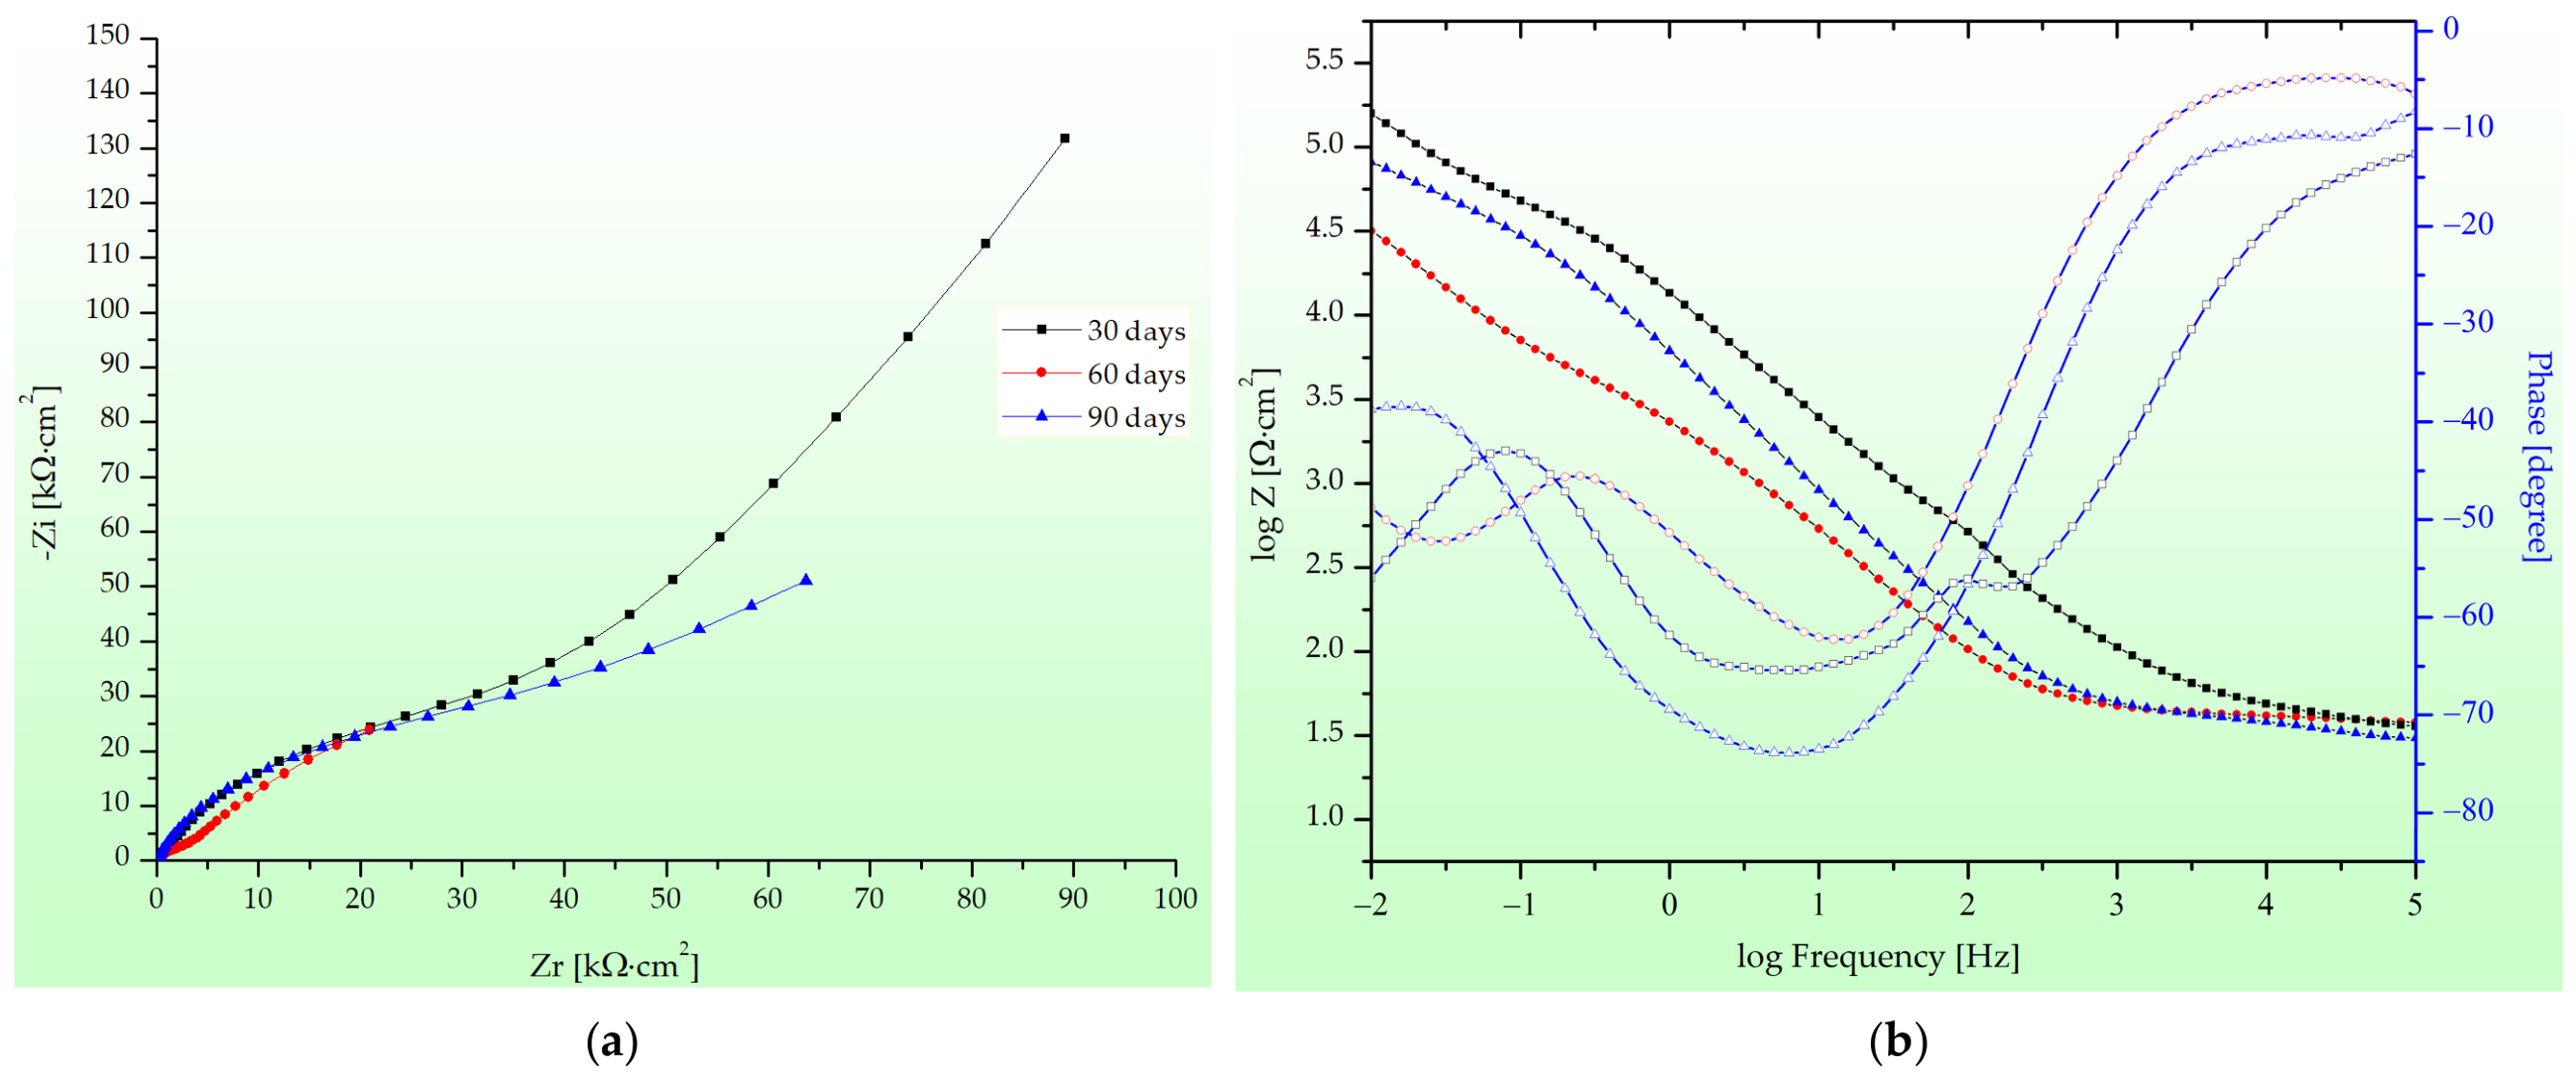
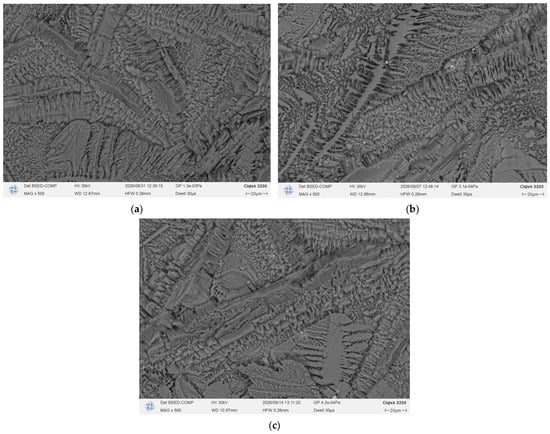
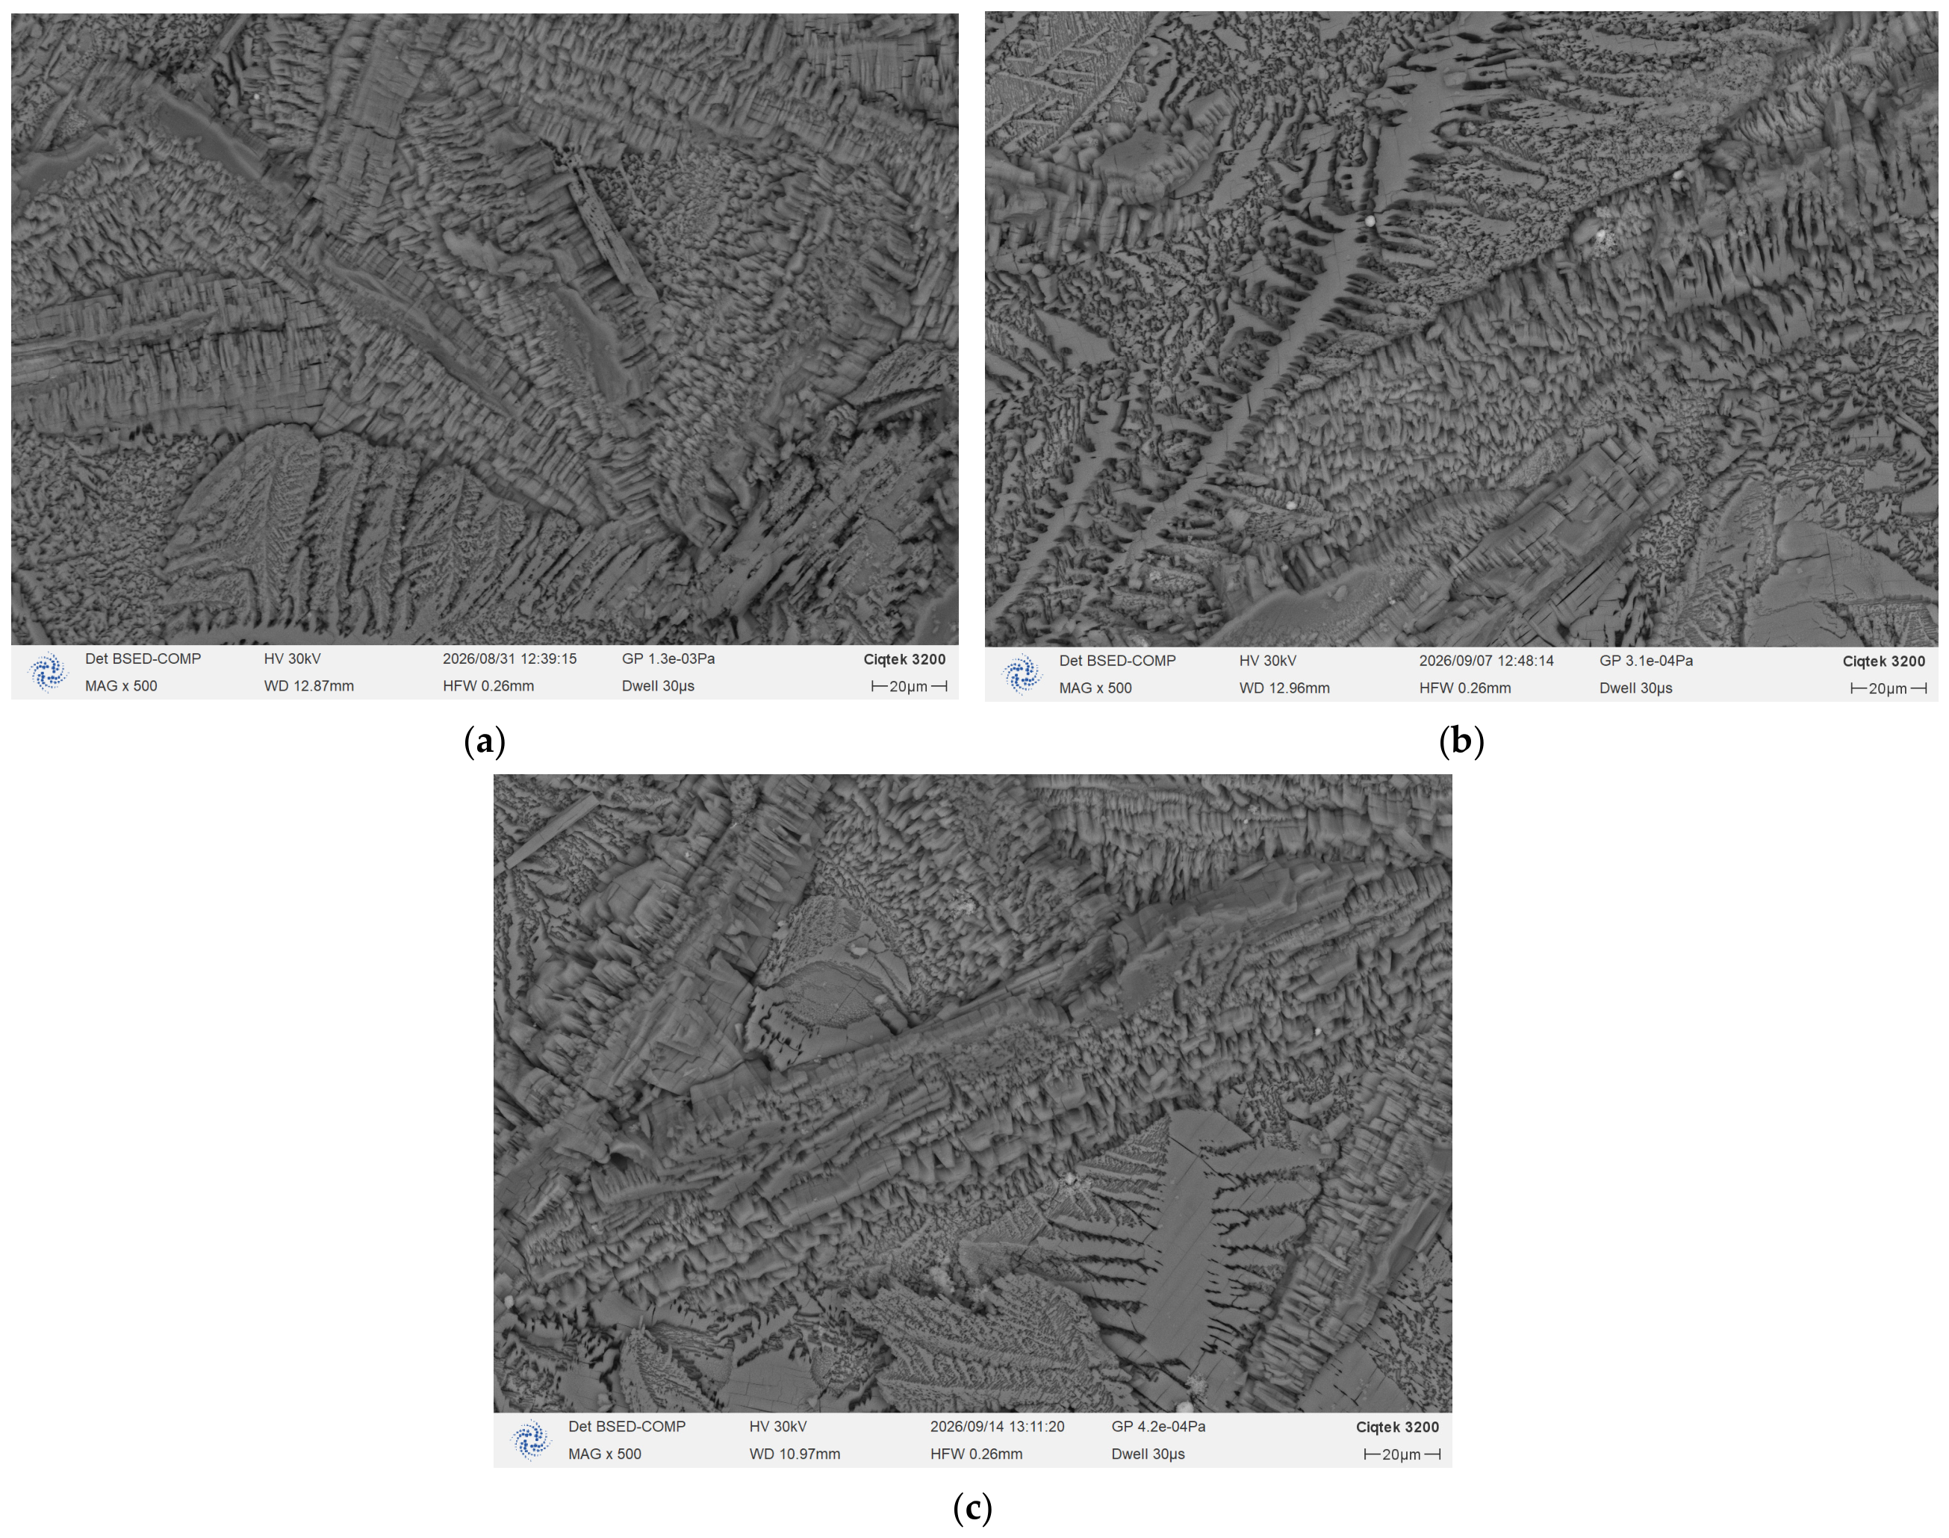
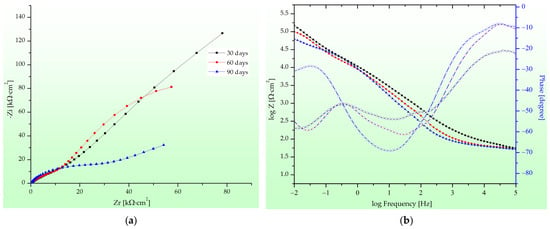
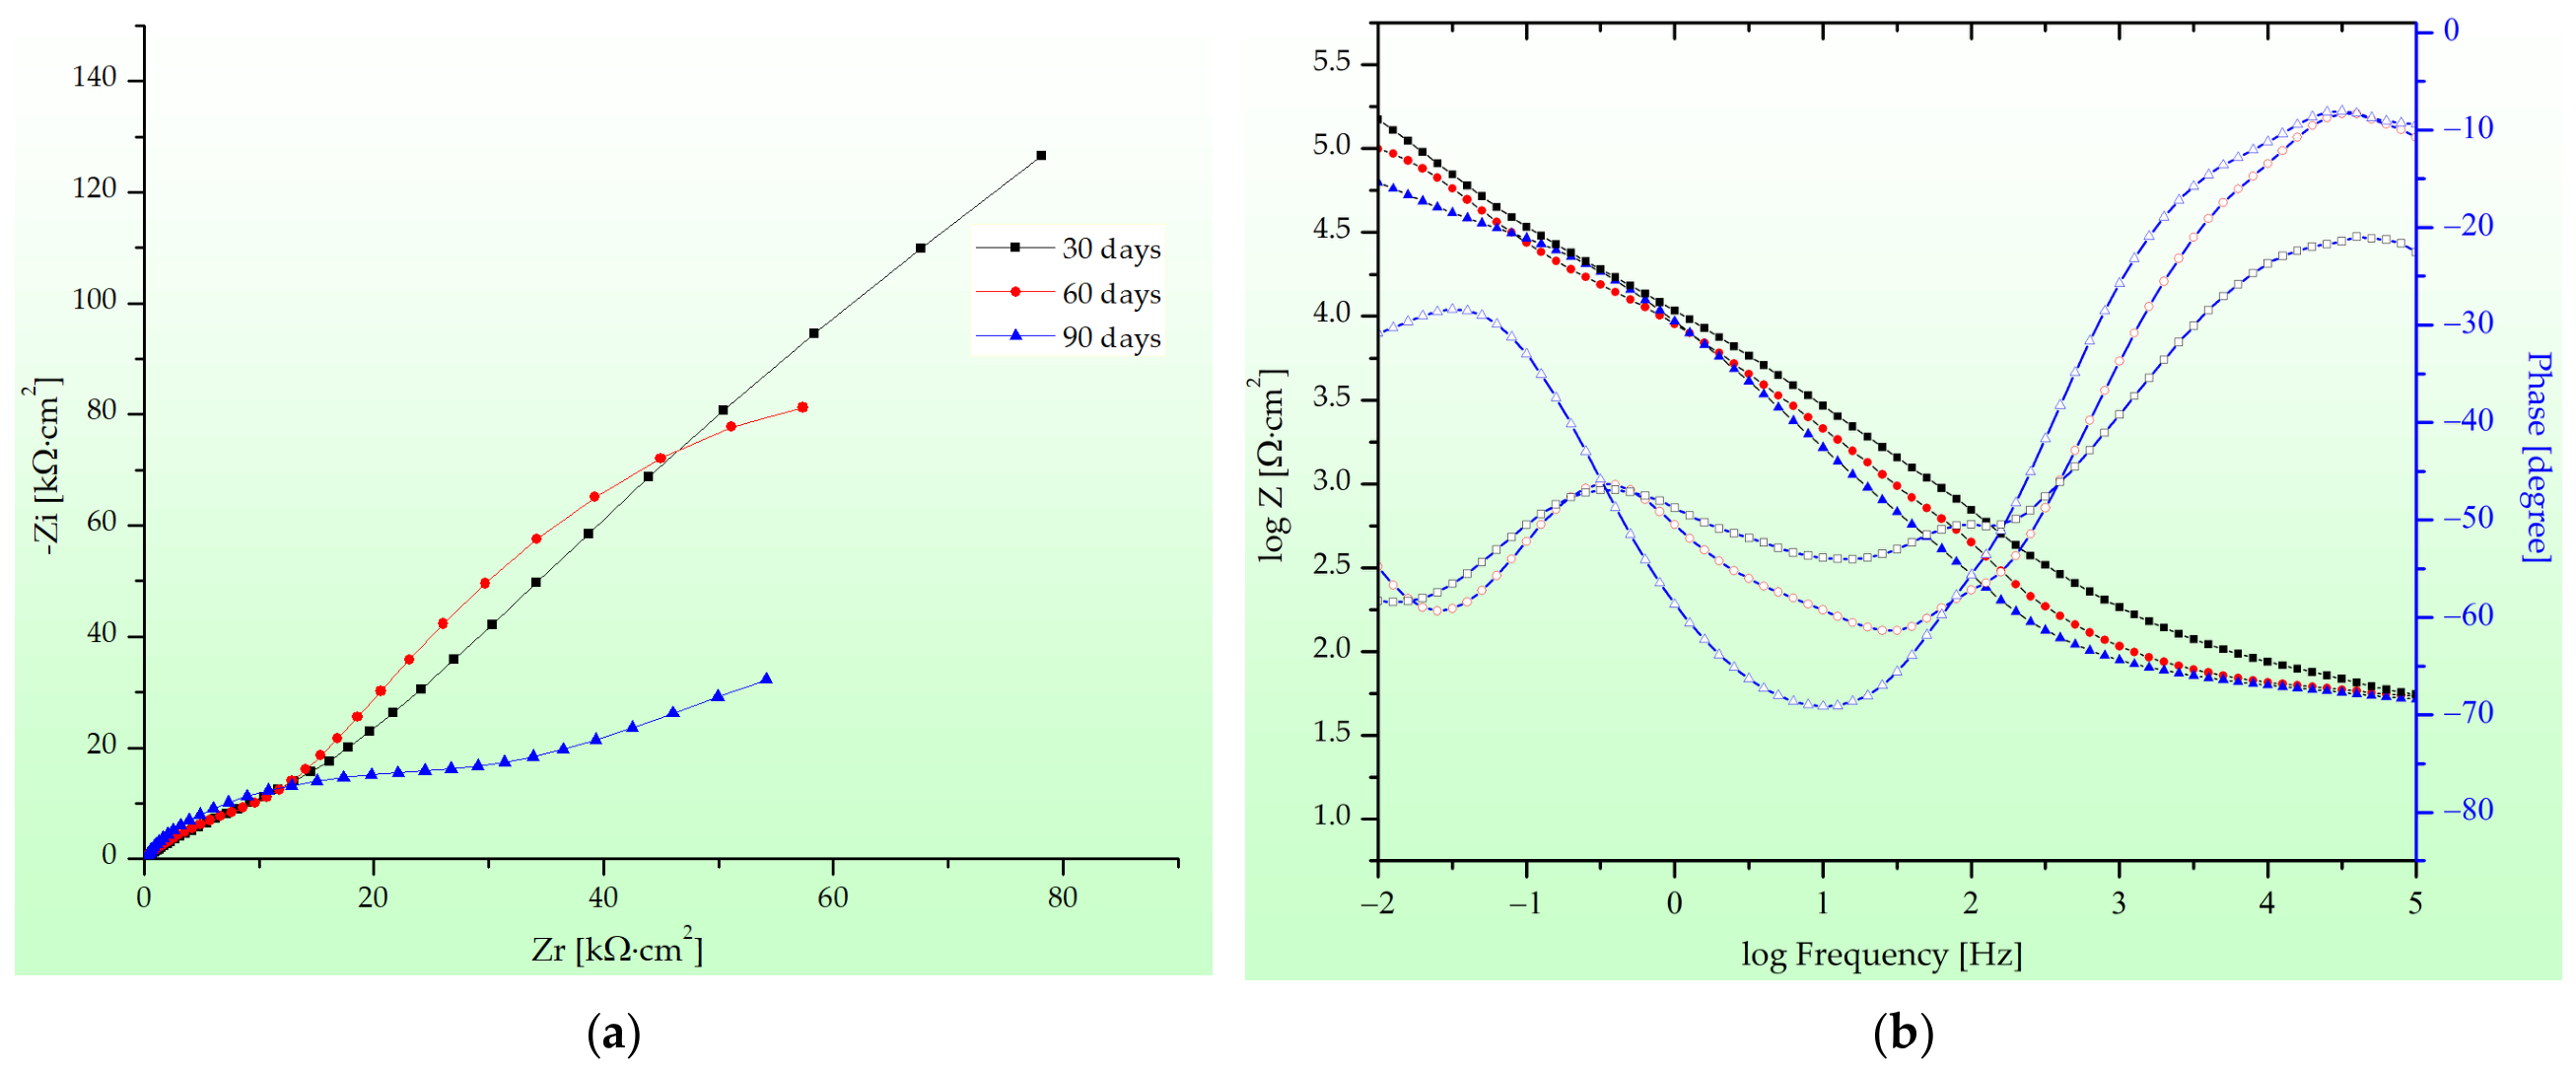
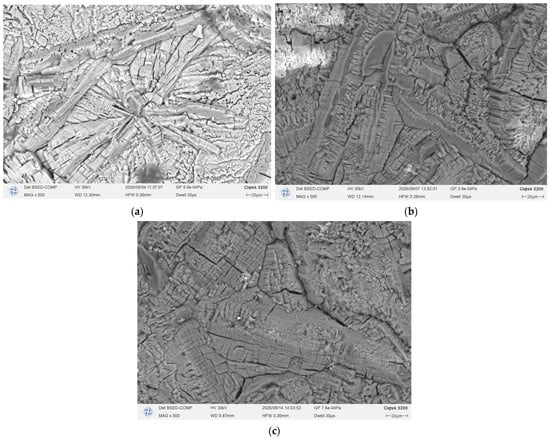
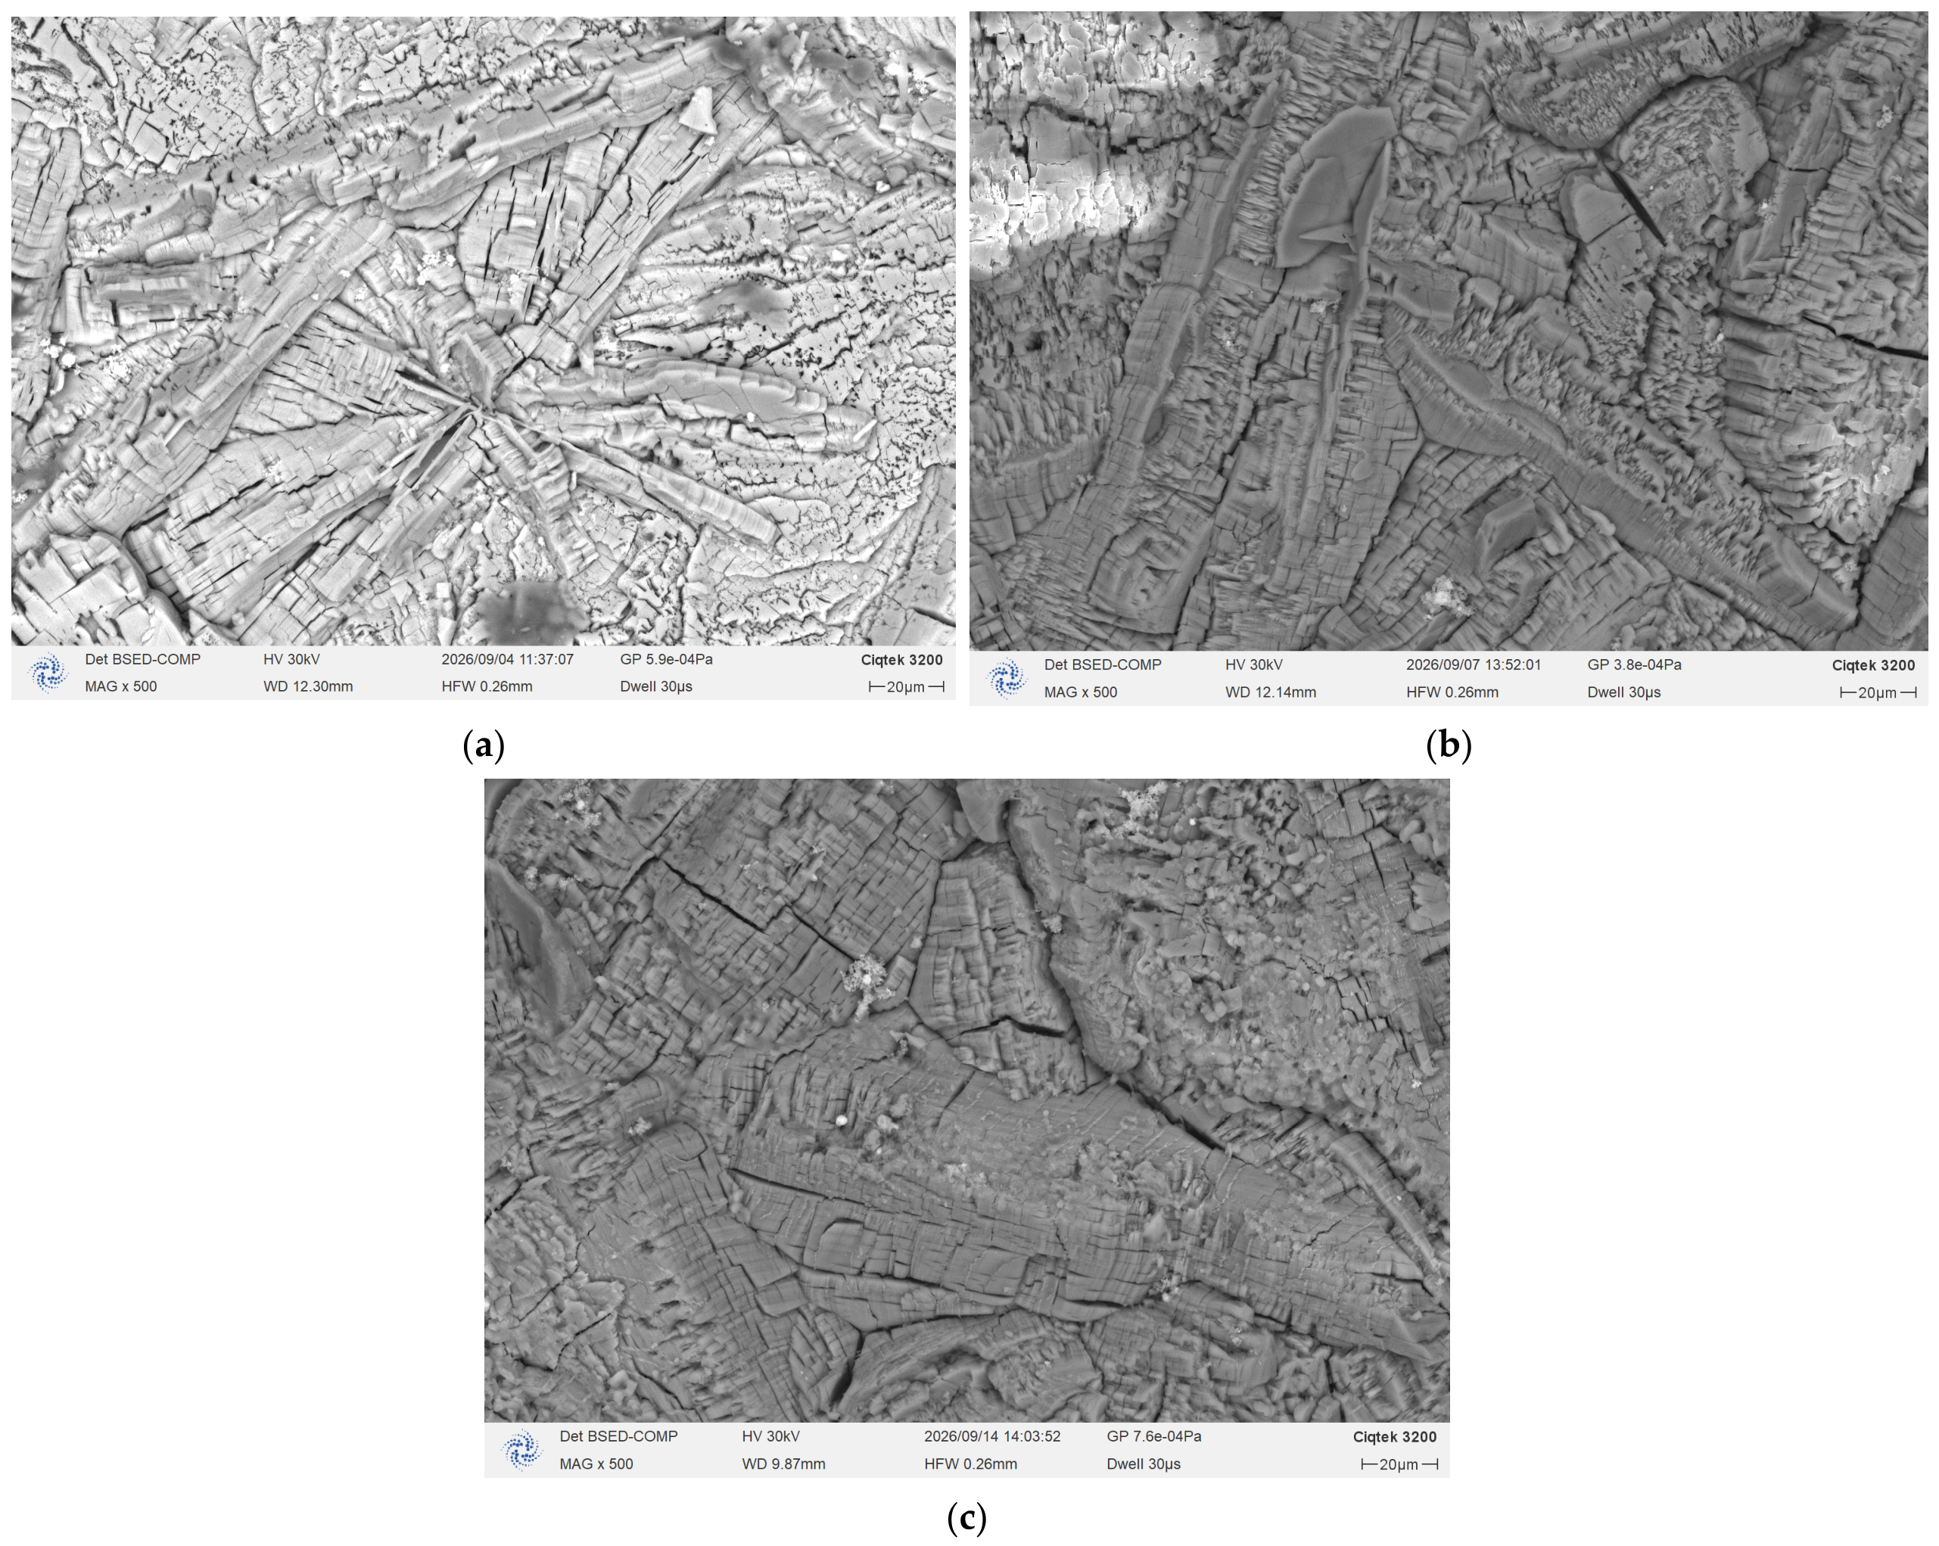
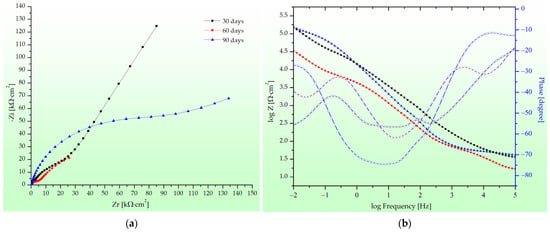
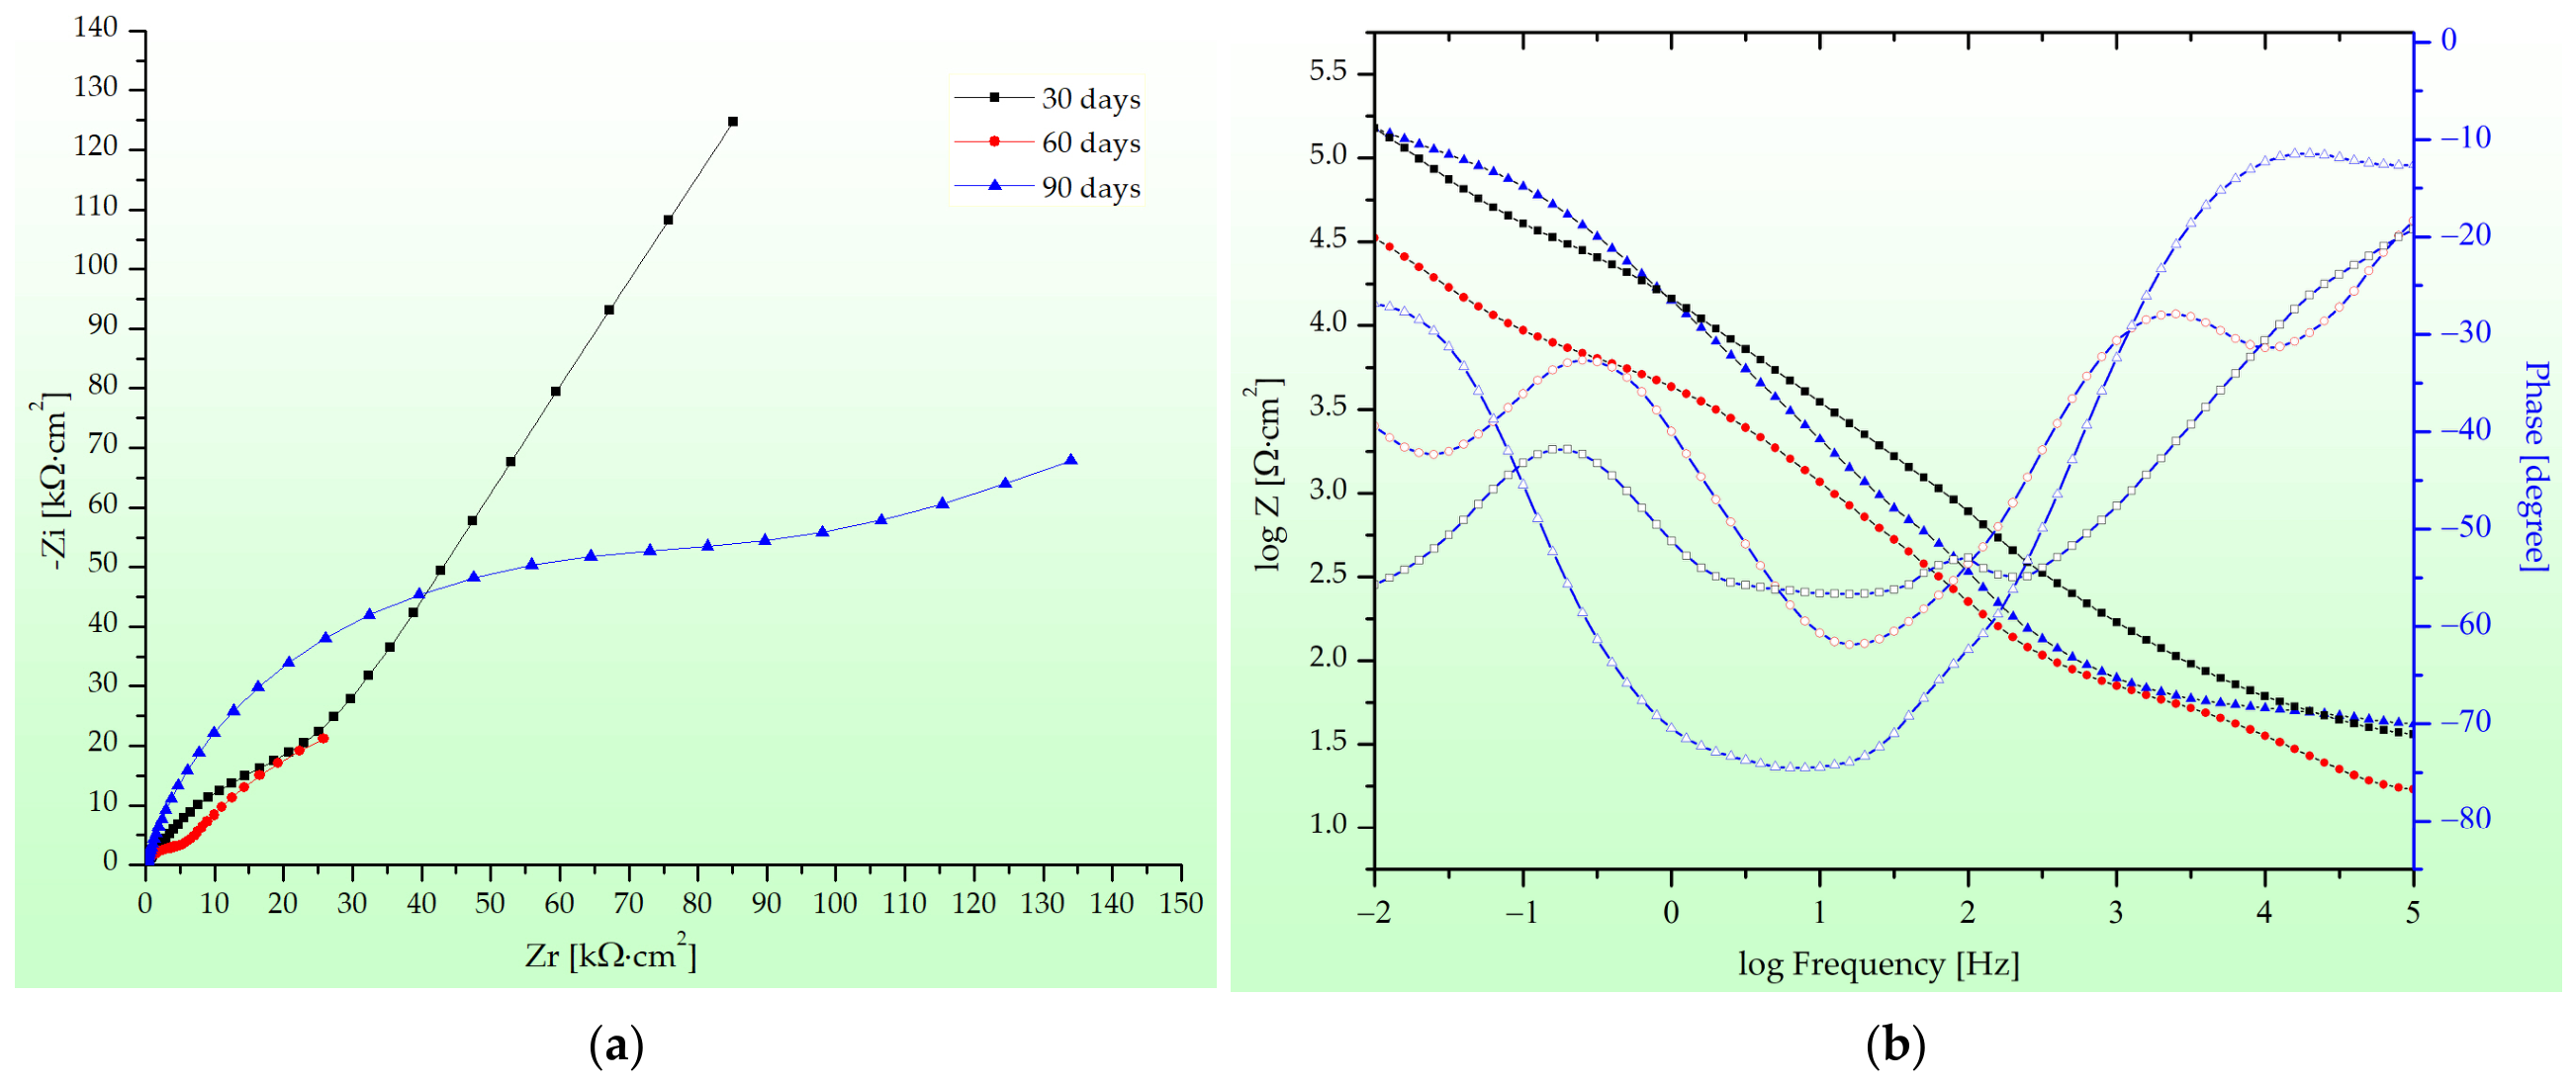
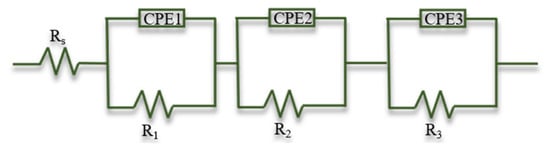
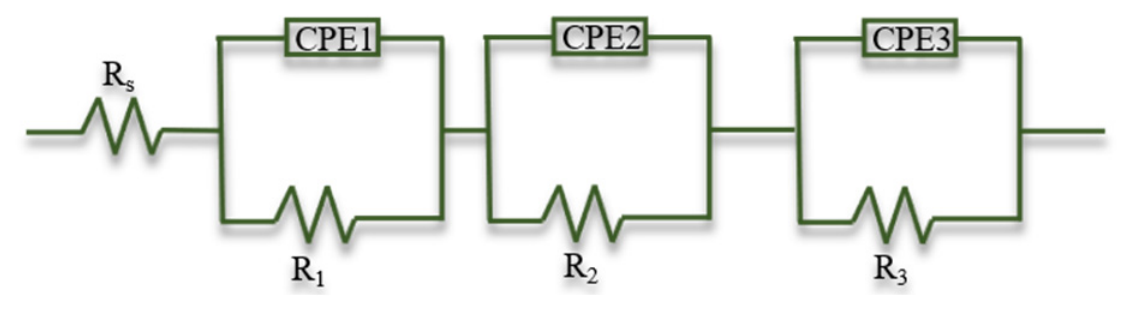
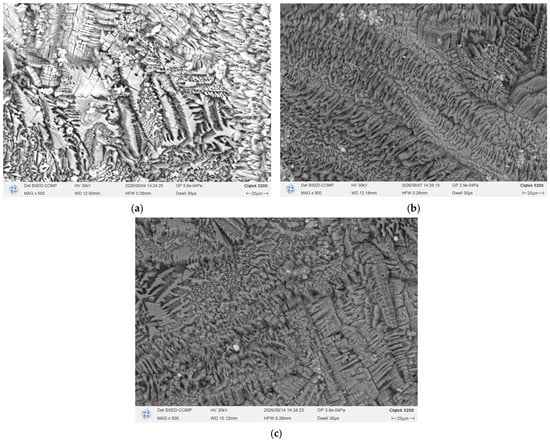
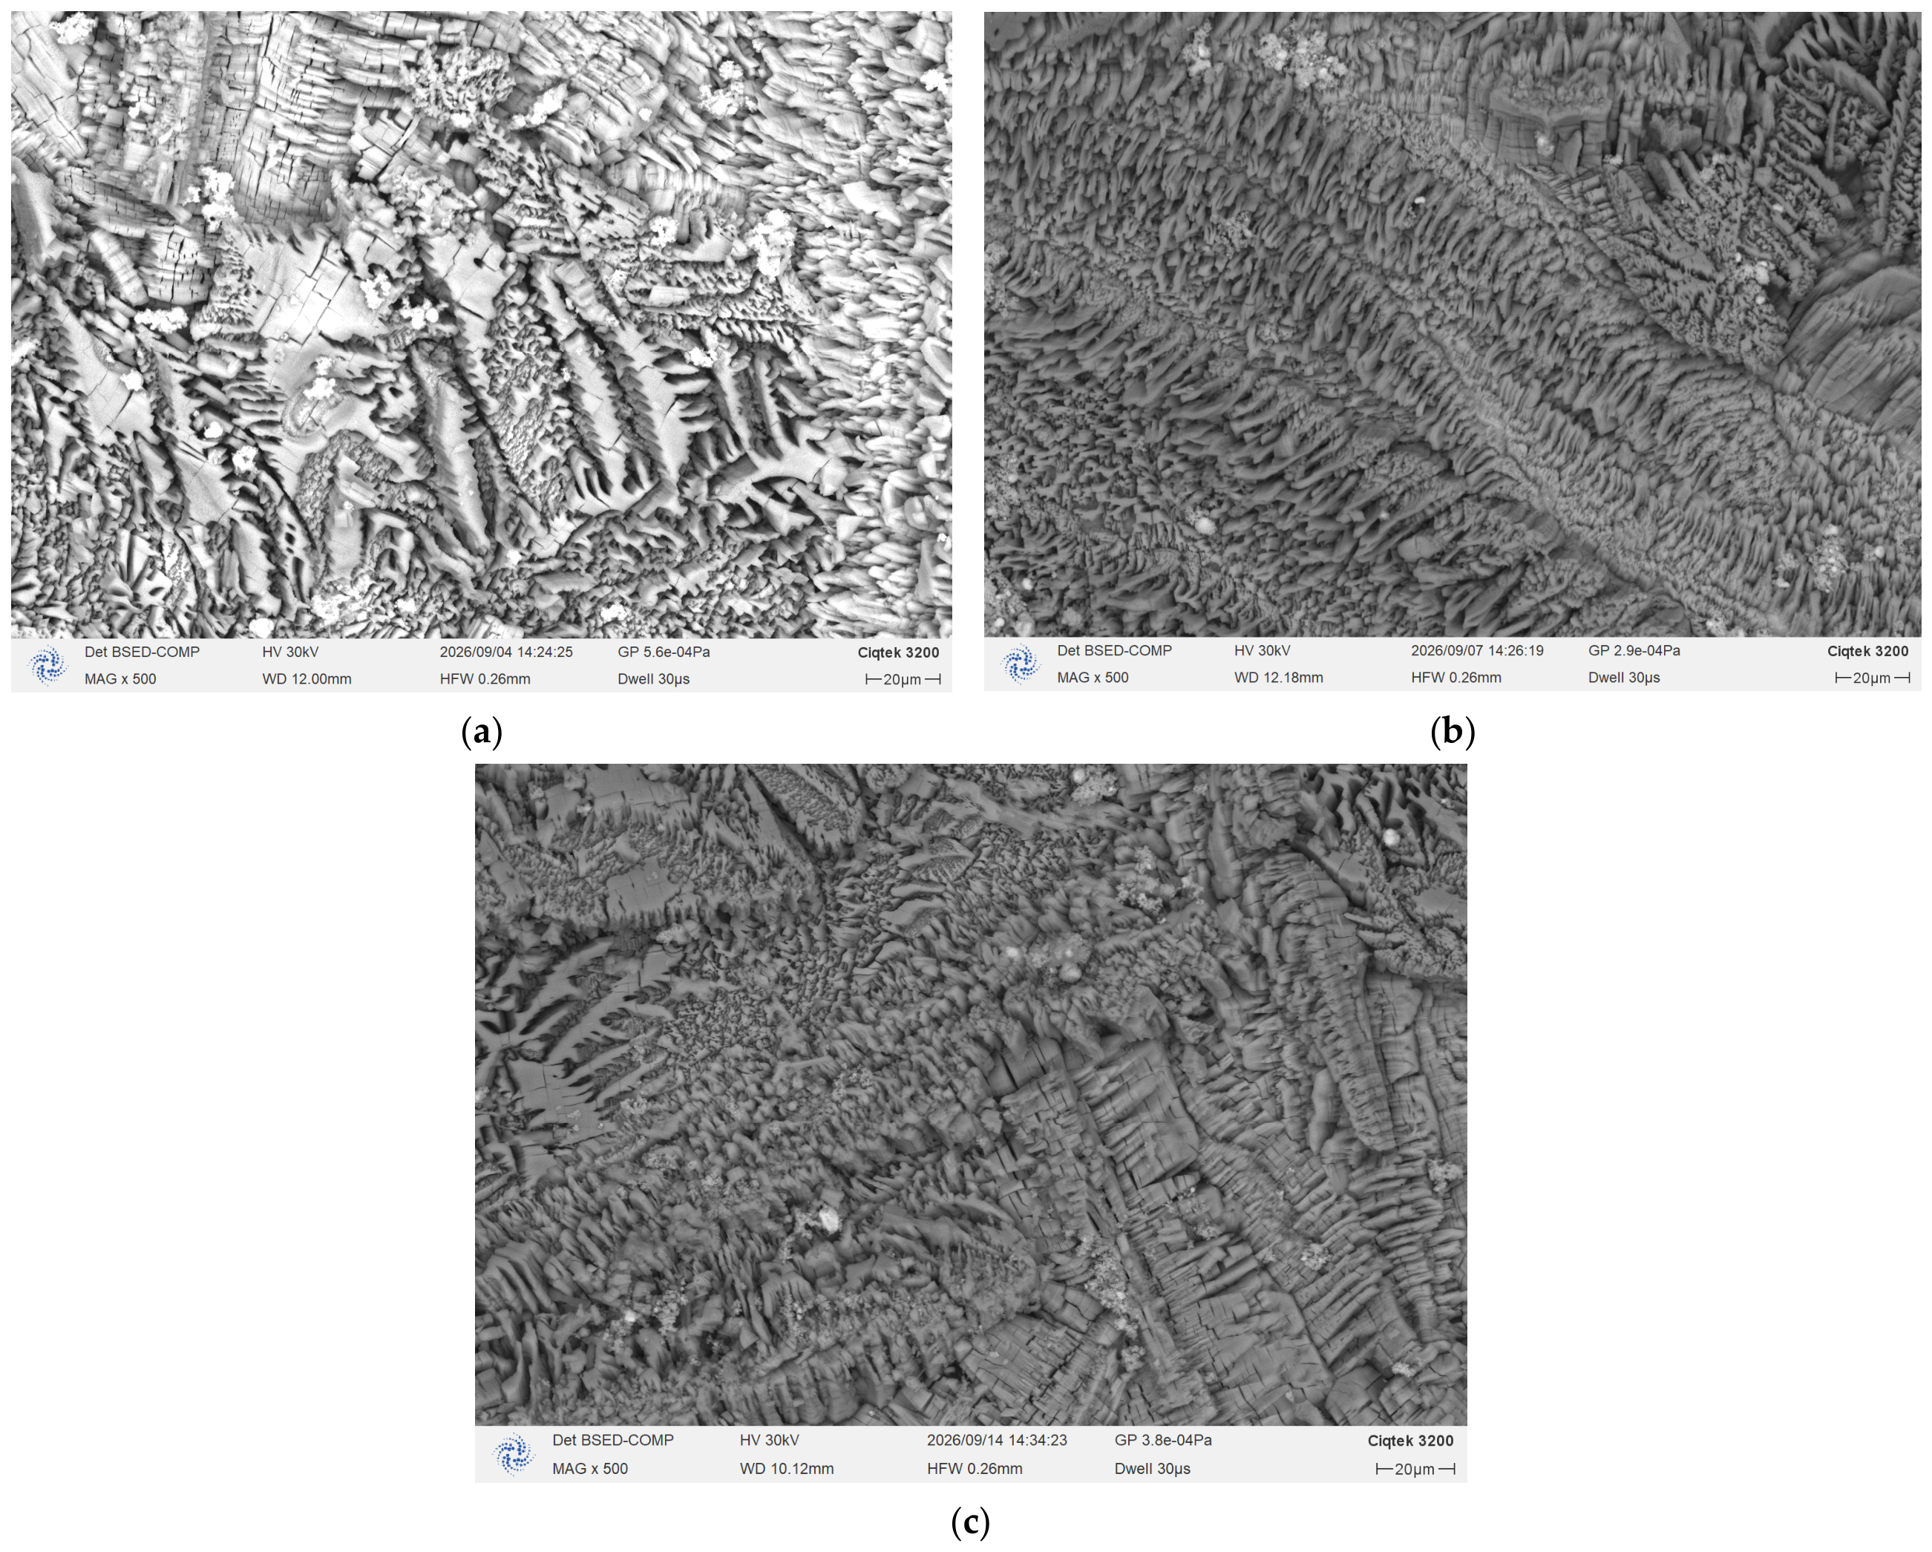

Disclaimer/Publisher’s Note: The statements, opinions and data contained in all publications are solely those of the individual author(s) and contributor(s) and not of MDPI and/or the editor(s). MDPI and/or the editor(s) disclaim responsibility for any injury to people or property resulting from any ideas, methods, instructions or products referred to in the content. |
© 2026 by the authors. Licensee MDPI, Basel, Switzerland. This article is an open access article distributed under the terms and conditions of the Creative Commons Attribution (CC BY) license.