


Abstract
Unmanned aerial vehicles (UAVs, or drones) carrying thermal-infrared (TIR) and multispectral (MS) sensors have become established instruments of archaeological prospection. Both are indirect, surface-proxy methods: they record radiance emitted or reflected by the ground surface or the plant canopy, and reach buried features only through the anomalies those features induce at the surface. This systematic review, reported in accordance with PRISMA 2020, maps that literature. Scopus, OpenAlex, Semantic Scholar and Google Scholar were searched on 27 July 2026 with a single Boolean string and no filters (590 records); an exploratory track using two large-language-model (LLM)-assisted deep-research assistants (Claude, Anthropic; ChatGPT, OpenAI) returned 168 further records. After deduplication, 380 unique records were screened by one reviewer and 22 further publications were added through citation searching; 132 publications, corresponding to 122 distinct research projects, were included. Sensor deployment is governed by surface regime: thermal-only studies operate on bare or arid surfaces in 47.6% of cases against 5.2% for multispectral-only studies (p < 0.001), confirming that two physically distinct detection pathways coexist in this literature. Thermal instruments identifiable as radiometric are the majority from 2017 onward, at 73–80% of determinable cases; 77.2% of multispectral studies (88.6% of those for which the array is identifiable) fly red-edge-capable hardware. Ground-geophysical integration increased from 0% in 2013–2016 to 5.9% in 2017–2020 and 26.4% in 2021–2026; the increase between the latter two periods was significant (Fisher’s exact test, p = 0.012). Reporting completeness, however, does not improve (mean 1.82, 2.68, 2.30 of 4; p = 0.029), and reporting of acquisition month falls from 64.7% in 2017–2020 to 31.0% in 2021–2026 (χ2 = 10.15, p = 0.0014). Platforms migrated to factory-integrated systems, with DJI (Da-Jiang Innovations, Shenzhen, China) equipping 59% of identified platforms. A minimal reporting standard is proposed.
1. Introduction
Archaeological aerial prospection with passive optical and thermal sensors is an indirect, surface-proxy technique, and the distinction is not pedantic: it determines what the resulting imagery can and cannot be made to say. Buried features modify the moisture retention, bulk density, nutrient status and thermal properties of the soil column above them. Where those modifications propagate as far as the surface, or as far as the root zone of an overlying crop, they produce measurable contrasts at the surface: differences in soil moisture and colour, in apparent surface temperature, in canopy vigour and in spectral reflectance, conventionally described as soil, moisture, thermal and crop marks [1,2]. TIR and MS sensors record only that surface expression. They do not penetrate the soil column, they do not image subsurface architecture, and they do not, on their own, return the depth, thickness or construction of the feature that generated the anomaly. What TIR and MS deliver is a spatially continuous, high-resolution map of surface proxies, from which the presence and planimetric geometry of buried features may be inferred, and against which those inferences must subsequently be tested; how often the corpus reviewed here performs that test is quantified in Section 4.8. The distinction between the two pathways is developed in Section 2 and governs the use of the term detection throughout this review. For most of the twentieth century these proxies were pursued with panchromatic photography from manned aircraft. Two parallel technological trajectories have transformed this practice in the last decade: the miniaturisation of thermal-infrared (TIR) and multispectral (MS) imaging sensors, and the commercial maturation of small unmanned aerial vehicles (UAVs), which together brought sub-decimetre, user-scheduled, beyond-visible imaging within the operational and financial reach of a broader range of archaeological projects [3].
The literature that documents this transformation is now substantial but fragmented. Existing syntheses either embrace the whole century of airborne and spaceborne remote sensing for cultural heritage [4], survey UAS-based archaeology across all sensor families up to 2020 [3], or provide short panoramic overviews [5]. Existing reviews have not yet combined an exclusive focus on UAV-based TIR/MS archaeology with post-2020 coverage and a systematic analysis of platform configuration, acquisition timing, surface context, and processing practices.
This paper addresses that gap through a systematic review of 132 publications (2013–2026), corresponding to 122 distinct research projects. Six research questions structure the analysis: (RQ1) How are thermal and multispectral drone applications distributed geographically? (RQ2) Which sensor typologies have been employed? (RQ3) Which platform typologies have been employed, distinguishing custom-built from commercial aircraft and manufacturer-integrated from user-adapted payloads? (RQ4) How are publications distributed over time? (RQ5) How did the diffusion of commercially integrated UAV systems coincide with changes in archaeological adoption? (RQ6) Which vegetation contexts have been investigated, and with what implications for detectability? Three further documentary axes form part of the same synthesis and were defined at the outset rather than introduced post hoc: the seasonal timing of acquisitions, the post-processing workflows applied to TIR/MS data, and the concentration of the field around a small number of research groups. They are extracted, coded and reported on the same footing as RQ1–RQ6. Two of these axes, the geography of application and the platform record, describe the literature rather than the method, and their inclusion in a methodological review requires a justification: in a technique whose barrier to entry is instrumental as much as intellectual, the distribution of platforms is partly constitutive of the methodological state of the art. Which instruments are flown determines which radiometric operations are possible, as Section 4.4 demonstrates quantitatively; which laboratories are active determines which processing traditions propagate and which alternatives are never tested. The bibliometric axes are therefore reported as evidence about the epistemic structure of the field, and their methodological consequences are drawn out in Section 5.1, Section 5.2 and Section 5.4. The primary object of the review remains what the corpus documents about detection mechanisms, instruments, acquisition conditions, integration with complementary methods, and processing.
2. Background: From Airborne Pioneers to Unmanned Systems
Aerial archaeological prospection has never observed buried features. It observes their surface expression, and the distinction, which the discipline’s founding vocabulary already encodes, deserves to be stated explicitly at the outset of any review of its instrumentation, because everything that follows about detectability depends on it.
The categories established in the interwar period—shadow marks, soil marks, crop marks, and later moisture and thermal marks—are all names for surface phenomena, not for archaeological features [1,2]. A crop mark is a difference in the height, colour, density or senescence of a standing crop; a soil mark is a difference in the colour or texture of a ploughed surface; a thermal mark is a difference in apparent surface temperature. Each is a photographable property of the ground or of the vegetation growing on it, and each shares with the buried feature that ultimately produces it a relation of inference rather than of depiction. That relation is also conditional and transient: the crop mark that Crawford photographed over a ditch in a dry June is not a property of the ditch but of a particular conjunction of ditch, soil, crop, cultivar, growth stage, antecedent rainfall and evaporative demand, and it may be absent over the same feature in an adjacent field, in an adjacent season, or in the same field a fortnight later.
Nothing in the transition from panchromatic film to multispectral and thermal-infrared imaging alters this premise; what changes is the range of proxies accessible. A multispectral array measures radiance reflected by the topmost soil aggregates or by the plant canopy, extending the observable set into the near-infrared and, in the red-edge region, into the part of the spectrum where the physiological response of stressed vegetation is steepest. A thermal camera measures longwave radiance emitted by the same surface, from an emitting layer of the order of tens of micrometres, and thereby makes accessible a mark class that photographic emulsion could not record at all. Both instruments extend the proxy set. Neither penetrates the soil column, and neither converts an inference into an observation.
The technique reviewed here is, in its entirety, a surface-proxy technique. Two consequences follow, and they are treated as premises of the synthesis presented below. First, detection is an inference rather than an observation, and the term is used accordingly throughout this review. Detection denotes the identification, in UAV-acquired thermal or multispectral imagery, of a surface anomaly whose geometry, dimensions, orientation or spatial patterning is archaeologically interpretable. That an anomaly so identified corresponds to a buried feature is a hypothesis, not a result. It is a hypothesis with a strong prior when the anomaly is rectilinear, when it repeats at a regular interval, or when it coheres with a known site plan; an alignment of positive crop marks intersecting at right angles is not plausibly a soil-texture artefact, but it remains one, and it is testable only by evidence external to the imagery: excavation, subsurface measurement on the ground, the distribution of surface finds, documented stratigraphy, or historical cartography and earlier aerial photography. How frequently the corpus reviewed here supplies such external evidence is quantified in Section 4.8 and the answer bears directly on how its aggregate claims should be read.
Second, depth is not directly retrievable from the radiometric signal. Neither reflectance nor apparent surface temperature carries an unambiguous depth term, and the planimetric geometry that aerial imagery renders so well has no vertical counterpart. Thermal data constitute the marginal case and should be stated precisely rather than dismissed: the amplitude and the phase lag of the diurnal surface-temperature wave are modulated by the depth and thermal properties of a buried contrast, and Périsset and Tabbagh [6] demonstrated that this dependence is in principle invertible. But such inversion is a model-based estimate requiring independent knowledge of the soil’s thermal properties and of the surface boundary conditions, and it is bounded by the diurnal damping depth, which for typical soil thermal diffusivities of 0.2–1.5 × 10⁻⁶ m2 s−1 lies between roughly 0.07 and 0.20 m. Features lying appreciably below that depth influence surface temperature only through the annual wave, or through moisture redistribution within the profile, or not at all. No study in the present corpus performs a formal depth inversion, and none reports the depth of its target as a result of the survey rather than as prior knowledge.
The physical foundations of archaeological aerial prospection rest on three distinct, if related, mechanisms, and distinguishing them is a precondition for interpreting the results reviewed in this paper. The first mechanism concerns bare or sparsely vegetated soils: buried structures possess a thermal inertia different from that of the surrounding soil matrix, so that the two materials heat and cool at different rates across the diurnal cycle. Building on airborne experiments of the 1960s–1970s, Périsset and Tabbagh [6] modelled this behaviour, showing that the resulting surface-temperature anomaly is not constant but reaches a maximum, and periodically reverses sign, at specific points of the diurnal cycle, principles that still govern the timing of thermal flights today. A methodologically important distinction, largely orthogonal to sensor generation, is that between radiometric and non-radiometric thermal cameras: the former assign a calibrated apparent-temperature value to every pixel, permitting quantitative comparison across flights, seasons and studies, while the latter, common in early low-cost thermal modules, output an uncalibrated relative contrast map that can reveal an anomaly within a single image but cannot support multitemporal or cross-site comparison. Thomas [7] offers the most direct assessment of this transition, evaluating the archaeological impact of the newer generation of affordable radiometric FLIR sensors (FLIR Systems, Wilsonville, OR, USA).
Where vegetation cover is present, two further, mechanistically distinct pathways operate side by side and are frequently conflated in the literature. The first is thermal and physiological: buried features alter the moisture and nutrient regime of the root zone above them, which in turn affects the transpiration rate, and therefore the canopy temperature, of the crop growing above the feature; the resulting thermal contrast is an evapotranspiration signal, not a soil thermal-inertia signal, and is governed by plant physiology and phenology as much as by the physics of heat storage in the ground. This pathway has been formalised most explicitly for cultivated cereal fields through evapotranspiration modelling aimed at identifying the optimal acquisition window across the growing season [8]. The second pathway is reflectance-based and multispectral rather than thermal: moisture and nutrient stress alter leaf pigment concentration, cell structure and canopy density, which changes the proportion of incident light reflected in the visible, red-edge and near-infrared bands and is captured as a contrast in vegetation indices. The reflectance-based rationale was established well before the drone era, first with infrared-sensitive film and then with consumer cameras from which the internal infrared-blocking filter had been removed and replaced with a dedicated dye filter, so-called NIR-modified cameras [2,9]. These modified cameras remain in use in the corpus reviewed here, but they differ substantially from the calibrated multispectral arrays, such as the Parrot Sequoia (Parrot, Paris, France) or MicaSense RedEdge (MicaSense, Seattle, WA, USA) families, that came to dominate the field from the mid-2010s: a modified consumer camera records a single broad, uncalibrated band that includes part of the near-infrared spectrum, adequate for basic vegetation-index contrast but not for quantitative or cross-study comparison, whereas a calibrated array records several narrow, radiometrically corrected bands, typically referenced against an onboard or ground irradiance sensor, enabling reproducible index values across flights and, in principle, across studies.
Because the terminology in this literature is not standardised, two recurring terms require definition. Natural substrate denotes soil or sediment whose fabric, texture, organic-matter content and hydraulic properties result from pedogenetic and geomorphic processes alone, unmodified by human deposition beyond ordinary tillage. Anthropogenic deposit, or occupation layer, denotes sediment owing its existence, composition or structure to human activity at the place where it now lies: accumulated occupation debris, demolition and construction residues, ashy and organic waste, deliberate levelling and make-up layers, and their post-depositional transformations [10,11]. These are stratigraphic rather than pedological categories, and they are not equivalent to the Anthrosols and Technosols of formal soil taxonomy, which are defined by diagnostic horizon properties and by minimum thickness thresholds that most archaeological occupation deposits do not meet [12]. This review therefore uses anthropogenic deposit in the archaeological-stratigraphic sense, irrespective of thickness, and no publication in the corpus is sufficiently explicit about the pedology of its study area to permit the two vocabularies to be reconciled—an omission that belongs to the documentary deficit analysed in Section 4.11. In the specific case of the Cheptsa-basin programme discussed below, the target is an occupation layer of this kind: a ploughed-in anthropogenic deposit whose relief has been destroyed, whose moisture-retention and thermal-inertia signature nevertheless differs statistically from that of the surrounding natural substrate, and which is consequently detectable as a texture rather than as an outline.
A further analytical category identified in the reviewed literature concerns the statistical texture of anthropogenic occupation deposits rather than discrete buried architecture. Where a site has been levelled by ploughing and its relief destroyed, the anthropogenic soil retains a moisture-retention and thermal-inertia signature that differs from the surrounding natural substrate, and this can be resolved statistically rather than visually. The systematic exploration of this pathway is the specific contribution of the Udmurt group at the medieval Cheptsa-basin fortified settlements [13,14,15], and it is methodologically distinct from both the bare-soil thermal-inertia model of Périsset and Tabbagh and the crop-mark models discussed above.
Against this physical background, the first unmanned platforms carrying thermal sensors for archaeological purposes appear in the record from 2013. Poirier, Hautefeuille and Calastrenc [16] flew an automated octocopter carrying an FLIR T620 camera over medieval sites in south-western France, while Brumana et al. [17] combined geometric and thermal UAV survey at Isola Comacina; Casana, Kantner, Wiewel and Cothren [18] used a CineStar 8 octocopter (Freefly Systems, Woodinville, WA, USA) carrying an adapted FLIR Tau 2 640 to produce orthorectified thermal mosaics of buried architecture at the Chaco-era Blue J community, New Mexico. Over the following years, acquisition and processing workflows were extended and formalised across a wider range of environments [19], the radiometric performance of newly available low-cost FLIR sensors was assessed directly [7], and a number of studies began to compare thermal against multispectral sensitivity on the same archaeological targets, rather than treating the two as interchangeable proxies for the same phenomenon [20,21,22].
From around 2020, a subset of studies combines thermal-infrared and multispectral sensors, and in some cases RGB photogrammetry and microtopographic survey, within single or successive flights over the same target [23,24,25]. It is worth stating precisely how representative this design is of the corpus as a whole, since the claim is easily overstated: studies combining thermal and multispectral sensors account for 29 of 132 publications (22%) across the full 2013–2026 corpus, and its share across the three periods adopted throughout this review rises from 18.2% in 2013–2016 to 29.4% in 2017–2020 before declining to 19.5% in 2021–2026, so that the recent growth in absolute numbers of multisensor studies does not represent a sustained increase in their relative weight. Multitemporal acquisition, understood as repeated flights across different months, seasons or growth stages on the same target, is documented in 30 of the 132 publications (22.7%), becoming a substantial, although still minority, component of the methodological repertoire.
Quantitative anchors for the pre-2020 record are provided by the meta-analysis of Adamopoulos and Rinaudo [3]: among 75 UAS-based archaeological studies analysed, 31 employed TIR cameras and 26 multispectral cameras; the senseFly eBee (senseFly, Cheseaux-sur-Lausanne, Switzerland) was reported as the single most used platform, at least 70% of platforms were ready-to-fly commercial products, the Parrot Sequoia was the most recurrent MS camera and FLIR dominated the TIR segment. The present review extends this picture to 2026 with an exclusive TIR/MS focus and, unlike previous syntheses, grounds its platform analysis in full-text extraction at the individual-publication level.
3. Materials and Methods
3.1. Protocol, Reporting Standard and Review Type
This systematic descriptive review was reported in accordance with the PRISMA 2020 statement [26], with items relating exclusively to effect estimation and meta-analysis treated as not applicable. PRISMA is a reporting guideline rather than a method by which a review is materially conducted, and the wording adopted here reflects that distinction. Three adaptations should be stated explicitly at the outset. First, the review is descriptive and bibliometric rather than effect-estimating: the corpus reports heterogeneous, non-commensurable outcomes (detected anomalies, index contrasts, apparent-temperature differences) and no pooled effect size is computed, so PRISMA items concerning meta-analytic synthesis, heterogeneity statistics and certainty-of-evidence grading are not applicable. Second, no formal risk-of-bias instrument exists for methodological remote-sensing case studies; the appraisal actually performed is a reporting-completeness assessment, described in Section 3.7, whose results are themselves among the principal findings of the review (Section 4.11 and Section 5.5). Third, no formal assessment of publication or selective-reporting bias was conducted, because the review synthesises heterogeneous methodological descriptors rather than comparable outcomes; the predominance of successful detection reports is accordingly discussed as a possible reporting bias in Section 5.5 rather than quantified formally, and no certainty-of-evidence grading was undertaken for the same reason. The review was not registered and no protocol was prospectively deposited; the procedures reported here document the methods implemented during the review, and no amendments to a registered protocol therefore occurred. The complete review procedures, including the Boolean strings, the platform-specific adaptations, the screening rules and the extraction schema, are documented in this section and provided as Supplementary Materials. The deterministic search is documented to support reproducibility, although results may vary as database coverage and indexing evolve.
3.2. Search Strategy: Sources, Queries and Execution Dates
The corpus was assembled by merging two complementary retrieval tracks. The first, deterministic track consists of structured queries on four bibliographic platforms: Scopus, OpenAlex, Semantic Scholar and Google Scholar, the last harvested through Publish or Perish version 8 [27]. All four queries implement one and the same conceptual Boolean string, adapted only in syntax to the field-query architecture of each platform:
(“archaeology” OR “archaeological prospection” OR “archaeological survey” OR “landscape archaeology”) AND (“thermal” OR “thermography” OR “multispectral”) AND (“UAV” OR “UAVs” OR “UAS” OR “drone” OR “drones”).
The exact strings as submitted, the fields interrogated, the filters applied and the number of records returned are given in Table 1; the strings are reproduced verbatim, without editorial normalisation of quotation marks or spacing, and are also released in machine-readable form, together with the deduplication and automated-filtering code, as Supplementary Files S1 and S3. No date, language, subject-area or document-type filter was applied at query level: chronological, linguistic and typological restrictions were imposed downstream, at the screening stage, so that the effect of each restriction on the corpus could be quantified rather than absorbed silently into the search. The deliberate absence of a language filter mitigates the anglophone bias that affects most bibliometric exercises in this field, a limitation explicitly acknowledged by Luo et al. [4].
Table 1.
Search protocol: platform-specific implementation of the common Boolean string, fields interrogated, filters, execution date and yield. Note: The asterisk (*) denotes a word-stem wildcard in the submitted query strings; for example, archaeolog* represents terms beginning with archaeolog. It is part of the query syntax, not a footnote marker.
The second track employed the advanced “deep research” functions of two large-language-model (LLM) assistants, Claude (Anthropic, Opus 5) and ChatGPT (OpenAI, GPT-5.5), each of which was issued the same natural-language prompt: “Conduct an online search of everything published on the use of drones with thermal and multispectral sensors in archaeology, in all languages and in any journal, book or digital archive.” Claude returned 95 records and ChatGPT 73 for a track total of 168. Because LLM-based assistants are known to return inaccurate or fabricated citations, every LLM-retrieved record considered for inclusion was verified by the author against publisher or repository metadata (DOI resolution, journal landing pages, institutional repositories) before admission to the corpus; records whose bibliographic details could not be fully confirmed were either corrected from the original source or excluded. Thirty-eight records were exclusive to this track after cross-track deduplication (Table 2). Of the 132 publications finally included, 33 (25.0%) carry annotation provenance from the LLM track, and 24 of these 33 (73%) date from 2020 or earlier, that is from the segment in which the curated indexes are least complete. The four quantities involved—records returned by the assistants, records exclusive to the track after deduplication, track-exclusive records surviving screening, and included publications carrying LLM annotation provenance—are distinct and are reported separately in Table 2 and in Supplementary File S2.
Table 2.
Yield and exclusive contribution of the six retrieval sources (raw yield 758 records; 380 unique after deduplication). Track-level unique records were calculated after deduplicating the combined sources within each track and comparing them against the other track, while DOI percentages were weighted over all records retrieved rather than averaged from individual-source values.
The complete LLM outputs, including returned citations, URLs, verification status, corrections, and exclusion reasons, are archived as Supplementary Materials.
3.3. Source Performance, Overlap and Deduplication
The two retrieval tracks returned 758 records in total: 590 from the four bibliographic platforms (Scopus 86, OpenAlex 172, Semantic Scholar 135, Google Scholar 197) and 168 from the two large-language-model assistants (Claude 95, ChatGPT 73).
Deduplication proceeded in two ordered passes over the merged pool: exact match on normalised digital object identifiers (252 duplicates removed), exact match on normalised titles after case-folding, punctuation stripping and whitespace collapse (120 removed) and a guarded fuzzy pass on normalised titles (6 removed). A total of 378 duplicates were eliminated, that is 49.9% of everything retrieved, leaving 380 unique records. The DOI pass alone accounts for 66.7% of all duplicate removals, a direct consequence of the improved DOI coverage of the present exports. Table 2 reports the yield of each source.
The subsequent attrition, documented in full in Figure 1, can be summarised here because its shape is itself informative. The automated filter removed 80 of the 380 unique records (21.1%): 15 records (3.9% of the deduplicated pool) carried the term “review” or “meta-analysis” in the title, and 65 (17.1%) contained no term with the stem archaeolog* or archeolog* in the title or abstract. Manual assessment then proceeded in two stages. Twenty-six further records were excluded on bibliographic metadata alone, without retrieving the full text: these are items of the grey literature—unpublished theses, unpublished conference abstracts and posters, and development-led archaeology reports, that is all material not having undergone documented peer review—whose status is established from the publication venue and requires no reading of the study itself. The full texts of the remaining 274 reports were sought, all were retrieved, and all were read; 164 were excluded at that stage, each with an individually recorded reason drawn from a thirteen-term controlled vocabulary and reported in Table S2. Exclusions decided on metadata are therefore reported at the screening stage of Figure 1 and only the 274 reports actually read are counted as assessed for eligibility. The pipeline as a whole is therefore strongly selective, retaining 110 of the 758 records retrieved through this track (14.5%); the three exclusion counts and the studies included from the track sum to the deduplicated pool (80 + 26 + 164 + 110 = 380). A further 22 publications were identified through the author’s reference library and citation searching and assessed against the same eligibility criteria, giving the final corpus of 132.
Figure 1.
Flow of records through the review, following the PRISMA 2020 flow diagram. Screening, retrieval and eligibility are reported as separate stages, and exclusions are given with their reasons at each stage. The asterisk (*) in archaeolog* and archeolog* denotes a word stem and any following characters, not a footnote marker.
Two features of this attrition profile have methodological consequences beyond the present review. First, the grey literature and other non-peer-reviewed material accounts for 26 of the 190 manual exclusions (13.7%) and could not have been removed by any automated rule operating on bibliographic metadata, since unpublished theses, conference posters and development-led reports are not systematically flagged as such in any of the six sources. Second, the “review” criterion removed 60 records across all screening stages (15 by the automated title rule and 45 on assessment), that is 15.8% of the deduplicated pool, but this figure should not be read as a count of syntheses devoted to the present subject. The criterion operates independently of the archaeological-relevance filter, and the Boolean string deliberately spans three broad concept blocks; the 86 accordingly include a substantial number of reviews and meta-analyses whose subject matter touches this one only marginally, among them precision agriculture, unmanned platforms in general, and remote sensing within and beyond archaeology. What the figure measures is the breadth of the thematic neighbourhood the search string traverses, not the density of synthetic coverage of thermal and multispectral drone archaeology. Read in that light it corroborates rather than qualifies the premise set out in Section 1: a string spanning archaeology, thermal and multispectral sensing and unmanned platforms returns a considerable body of review literature, of which only a handful of items [3,4,5] address the intersection of all three, and none is confined to it.
Three features of Table 2 have methodological consequences. First, no single platform is sufficient: Scopus alone would have retrieved 86 of the 380 unique records, that is 22.6% of the deduplicated pool, and would have contributed only 13 records not found elsewhere. Google Scholar, by contrast, supplied 137 exclusive records, 69.5% of its own yield, overwhelmingly non-English, conference and monographic material of exactly the kind that curated indexes omit. A Scopus-only search, the default in much of the bibliometric practice, would therefore have produced a systematically anglophone and journal-biased picture of this field. Second, DOI coverage varies widely across sources (95.3% in Scopus against 23.9% in Google Scholar), which is why deduplication could not rely on DOI alone and required the title-based pass described above. Third, the LLM track, though not reproducible in the strict sense, contributed 38 records that no bibliographic platform returned, 22.6% of its raw yield, concentrated in the pre-2021 and non-English segment where the database track is weakest; it functioned in practice as a recall-enhancing complement rather than as an independent search, and its yield had to be paid for at the screening stage, since 29 of those 38 records were subsequently excluded, 17 of them by the automated rules alone. Three quantities are distinguished throughout and should not be conflated: records returned by the assistants (n = 168), records exclusive to the track after cross-track deduplication (n = 38), and included publications carrying any LLM-track provenance (n = 60), of which only 9 were retrievable through the LLM track alone.
These figures describe the deduplicated pool. Because provenance was also logged for every record that survived screening, the complementary question can be answered: what each source contributed not to the search but to the corpus (Table S3). Gross and useful yield diverge sharply. Google Scholar returned the largest raw yield (197 records) and by far the most source-exclusive ones (137), but at low precision; Scopus returned 86 records and carried 54 of them through to inclusion, the highest conversion rate of any source. Across the 132 included publications, OpenAlex accounts for 75 (56.8%), Semantic Scholar 69 (52.3%), Google Scholar 55 (41.7%) and Scopus 54 (40.9%), with a mean of 2.89 sources per included record. The anglophone and journal-biased picture that a Scopus-only design would have produced can now be quantified rather than asserted: Scopus retrieved 53 of the 109 anglophone publications but only 1 of the 23 non-anglophone ones, and 6 of the 37 conference papers against 47 of the 92 journal articles. Fifty included publications (37.9%) were reachable through bibliographic databases alone, 9 (6.8%) through the LLM track alone and 22 (16.7%) through citation searching alone. Excluding the nine LLM-only records leaves every sensor, platform and period distribution within 1.7 percentage points of its full-corpus value and the mean reporting-completeness score essentially unchanged (2.36 against 2.38); the largest single shift is the Italian share of study countries, from 32.6% to 29.3%. Retrieval provenance therefore governed what reached screening, not what passed it: every record, whatever its track, was assessed against the criteria in Table 3 by the same procedure.
Table 3.
Eligibility criteria for the review corpus.
3.4. Eligibility Criteria
Studies were included when they satisfied all criteria in Table 3. Reviews and meta-analyses were used as the framing literature but excluded from the quantitative corpus, as was all material lacking documented peer review; the same applies to studies employing hyperspectral sensors exclusively, to forensic and purely agronomic applications, and to acquisitions from manned aircraft, kites or terrestrial platforms. Hyperspectral acquisitions were excluded as a primary sensor class, not as a subject. The exclusion is scope-defining rather than evaluative: hyperspectral payloads are not yet part of the commercially standardised drone market whose consequences this review examines, and their analytical tradition—continuum removal, spectral unmixing, library matching—differs sufficiently from broadband multispectral practice that combining the two would have produced a corpus without a common processing vocabulary. Hyperspectral data nonetheless appear within the corpus as a complementary modality in five publications (3.8%; Section 4.8).
3.5. Screening Procedure and Study Selection
The merged pool was screened in two stages. In the first, automated stage, records were excluded when the term “review” appeared in the title or in the index keywords, and when no term with the stem archaeolog* or archeolog* occurred in the title, abstract or keywords. The second, manual stage was itself conducted in two steps. Records whose non-peer-reviewed status was established from the publication venue—unpublished theses, unpublished conference abstracts and posters, and development-led archaeology reports—were excluded on bibliographic metadata alone, without retrieving the full text (n = 26). The full texts of the remaining 274 reports were then sought and, in every case, retrieved and read; 164 were excluded after reading, each with an individually recorded reason. This track yielded 110 publications; a further 22, identified through the author’s reference library and citation searching and assessed against the same criteria, complete the final corpus of 132 publications, corresponding to 122 distinct research projects. Table S2 documents every excluded record with its screening stage, the automated rule applied where relevant, the exclusion reason and an explanatory note, so that the counts in Figure 1 can be verified directly. Figure 1 presents the flow of records through the review.
All automated filtering, title and abstract screening, full-text eligibility assessment and final inclusion decisions were performed by a single reviewer (GC), working non-independently; no second reviewer duplicated any stage, and inter-rater agreement could therefore not be computed. The automated stage consisted exclusively of deterministic keyword rules applied to bibliographic metadata and did not employ a machine-learning classifier. Records removed by these rules were retained in the exclusion register together with the applicable exclusion criterion; the register of all excluded records, with a controlled-vocabulary exclusion reason and an explanatory note for each, is released as Supplementary Table S2.
3.6. Classification and Full-Text Data Extraction
Each publication was catalogued with: publication year; language; document type; country or region of the study area; sensor class (thermal-only, multispectral-only, or both, with hyperspectral acquisitions assimilated to the multispectral family when accompanying TIR or MS); site name and cultural context; vegetation context; exact platform and sensor configuration, coded as custom-built, commercial platform with user-adapted third-party sensor, or commercial platform with factory-integrated payload; month or months of acquisition; chronology of the detected features; and post-processing techniques applied. Platform, sensor, month and processing data were extracted from the full texts wherever the full text was accessible. The exact aircraft and payload were established for 122 of the 132 publications (92.4%), the country of the study area for 126 (95.5%), the vegetation context for 106 (80.3%), the acquisition timing for 68 (51.5%), a specific acquisition month for 53 (40.2%) and the post-processing chain for 30 (22.7%); the residual records are flagged as not reported in the corpus file and are reported as such in every table below rather than being silently dropped from denominators.
Finally, each record was checked for research-level duplication: ten publications were flagged as presenting substantially the same research already published elsewhere in the corpus, typically preliminary conference papers later expanded into journal articles, or thematic representations of a single long-running field project. All quantitative analyses below are reported at the publication level (n = 132); where the distinction matters, the number of distinct research projects (n = 122) is given alongside.
Data were extracted by a single reviewer (GC) from the full text of each included publication into a predefined CSV-based extraction form. Where a variable was absent or ambiguous it was coded as “not reported” or “unverified” rather than inferred; values were not reconstructed from figures, from other publications by the same team, or from project websites unless the source publication stated them explicitly. Study authors were not contacted to retrieve missing information. Four publications authored by the reviewer are included in the corpus; they were assessed with the same predefined eligibility, extraction and reporting-completeness criteria applied to all other records and are explicitly identified in Supplementary Table S1. No effect outcome was predefined, because the review maps methodological and bibliographic characteristics rather than intervention effects. Operational definitions of the coded categories—distinct research project, substantially the same research, multisensor study, multitemporal acquisition, the vegetation classes, factory-integrated system, user-adapted commercial platform, documented processing workflow and identifiable research group—are given in the extraction codebook released as Supplementary File S1.
3.7. Reporting-Completeness Appraisal
No validated instrument exists for appraising the internal validity of methodological case studies in aerial remote sensing, and importing a clinical risk-of-bias tool would produce a spurious impression of rigour. What can be appraised, and what materially determines whether a study is usable by others, is the completeness with which it reports the parameters that govern the signal it claims to detect. Each record was therefore scored for the presence or absence of four fields: platform and sensor model; date of acquisition at month resolution or finer; vegetation cover; and the post-processing chain applied. The aggregate results of this appraisal are reported in Section 4.11 and discussed in Section 5.5, where they are treated as a finding about the state of the discipline rather than as a filter on the corpus: no study was excluded on grounds of incomplete reporting, since doing so would have removed precisely the evidence on which the argument of Section 5.5 rests.
No formal study-level risk-of-bias assessment was conducted, because the review does not estimate intervention effects and no validated domain-specific instrument was identified for the heterogeneous methodological case studies included. Reporting completeness and internal validity are distinct properties: a study may report every parameter and still rest on a weak design, and a sparsely documented publication may nonetheless report valid results. The reporting-completeness appraisal should therefore not be read as a measure of internal validity. The four-field appraisal is a reduced subset of the standard proposed in Section 5.5, restricted to the fields that could be coded consistently across the whole historical corpus; per-publication results are released in Supplementary Table S1 alongside the aggregate percentages reported here.
3.8. Data Synthesis and Presentation
Analyses are primarily descriptive. A limited set of inferential tests was additionally computed for a small number of comparisons, all of them post hoc: they were not prespecified, were formulated after the corpus was closed, and are reported as exploratory and hypothesis-generating rather than confirmatory. Fisher’s exact test was used for two-by-two categorical associations, which in this corpus routinely involve small cell counts; Pearson’s chi-square test for reporting rates across the three periods, with Yates’s continuity correction applied to two-by-two tables and with minimum expected frequencies stated wherever they fall below five; the Kruskal–Wallis test for differences in the reporting-completeness score across periods; and the Mann–Whitney U test for differences in that score between publication types. All tests are two-sided; exact p-values are reported, and odds ratios are given with Haldane–Anscombe corrected 95% confidence intervals. The conventional threshold of α = 0.05 is used for descriptive purposes only. No correction for multiple comparisons was applied to the values reported in the text, because the tests are exploratory and were not designed as a family; Holm-adjusted p-values for the full set of comparisons are supplied in Table S4 so that readers can assess the effect of such a correction, and the two findings on which the argument of this review depends—the decline in reporting of acquisition month and the association between sensor class and surface regime—remain significant under it. Tests were computed with SciPy 1.17.1 under Python 3.12. Counts and percentages were computed at publication level (n = 132); project-level counts (n = 122) were used as a sensitivity comparison for the temporal series only, and the two series are reported together in Figure 2. Publications reporting study areas in more than one country were counted once for each country represented, so that country counts sum to more than the number of publications; acquisition campaigns spanning several months were counted once for each month reported, so that month-mentions likewise exceed the number of studies. Percentages for variables with missing information are given over the subset for which the variable could be established, and the denominator is stated explicitly in the text and in every table and figure caption; the complete-corpus denominator (n = 132) is used wherever the missing fraction is itself the quantity of interest.
Figure 2.
Upper panel: Annual distribution of the 132 publications by sensor class. Lower panel: Comparison between publication counts and distinct-project counts after removal of ten publications reporting previously presented research.
The three periods 2013–2016, 2017–2020 and 2021–2026 are conventional four-year blocks aligned to the release chronology of the sensor and platform generations described in Section 2, the last block being six years because it extends to the closing date of the search; period means are computed over the nominal number of years in each block. Percentages are rounded to one decimal place where the denominator is the full corpus and to the nearest integer where they describe subsets smaller than 100; counts are never rounded. The ten publications flagged as reporting research already presented elsewhere were retained in all publication-level analyses and removed only from the project-level series. The flag records a relation between publications, not a judgement about them. A conference contribution and the journal article that later develops it are distinct scholarly products, differing in length, in the state of the analysis and often in the data available at the time of writing, and both are treated here as full members of the corpus. The project-level series exists solely so that the growth curve in Figure 2 is not inflated by the same fieldwork appearing twice; no other analysis in this review uses it. Values coded “not reported” were never imputed and never silently dropped from denominators.
No effect-size pooling, meta-analysis, heterogeneity testing or meta-regression was undertaken. Deduplication, automated screening and all descriptive statistics, tables and figures were produced with Python 3.12 (pandas 3.0.2, matplotlib 3.10, NumPy 2.4.4. and SciPy 1.17.1); thefuzz 0.22 was used only to identify candidate publication pairs for research-level duplication, and all candidate pairs were subsequently assessed manually; coastlines and country boundaries in Figure 3 derive from the GSHHG and GMT datasets distributed with the basemap toolkit (basemap 2.0). The analytical code is released as Supplementary File S3, which regenerates the corpus-derived descriptive statistics, tables and figures and validates the values reported below against Table S1; the PRISMA-flow counts are regenerated separately from Table S2, and the manually coded categories for complementary datasets and post-processing workflows are documented rather than independently reconstructed.
Figure 3.
Global distribution of study areas by country (bubble area proportional to the number of studies; multi-country studies counted once per country; n = 126 studies with an identifiable country location, out of 132; 6 studies with only continental or regional scope are not mapped). Lower panel: detail of the European and Mediterranean cluster.
The limitations of this review, of the search design, of the corpus it produced and of the analyses performed on it are set out in Section 6, after the Discussion.
4. Results
4.1. Publication Types and Languages in the Corpus
The final corpus comprises 132 publications, of which 92 are journal articles (69.7%) and 37 are conference papers (28.0%); for the remaining three (2.3%) the publication venue recorded in the source metadata is insufficient to establish the document type. Digital object identifiers are available for 107 records (81.1%). English is the language of 109 publications; the remainder comprise 14 Italian, 3 Spanish, 3 Russian, 2 French and 1 Chinese contribution. Ten publications report research also presented elsewhere within the corpus, most commonly a conference contribution and a subsequent journal treatment of the same fieldwork. All ten are retained in full in every publication-level analysis reported below; the flag serves only to construct a second series in which each research project is counted once (n = 122), used as a sensitivity comparison for the temporal distribution in Figure 2. Six of the ten are conference papers and four are journal articles.
4.2. Temporal Distribution (RQ4)
Figure 2, in the upper section, shows the annual distribution of the 132 publications by sensor class. From two pioneering studies in 2013 the corpus rises to a first consolidation in 2018–2023 (nine to fourteen publications per year) and to a pronounced peak of 24 publications in 2024, before the partial years 2025 (14) and 2026 (14). Aggregated by period, mean annual output grows from 2.8 publications per year in 2013–2016, to 8.5 in 2017–2020, and to 14.5 in 2021–2026 (87 publications in six years, of which the last two are incompletely indexed). The 2024 peak deserves a specific caveat: seventeen of its twenty-four publications are multispectral-only, and five appeared in a single Italian proceedings volume devoted to the 3rd International Conference of Aerial Archaeology (“Le città invisibili”. Remote e Proximal Sensing in Archeologia: metodologie non invasive per lo studio della città antica, Lecce, 19–21 May 2022; published in three volumes [28,29,30]), a source-concentration effect that contributes substantially to the 2024 peak, although the broader increase remains visible when these five contributions are excluded. At the research-project level (n = 122) the trajectory is smoother but substantially identical (Figure 2, below).
4.3. Geographic Distribution (RQ1)
Italy is by far the most frequently represented country, appearing in 43 publications—three times the number recorded for Spain (14) and more than four times that of the United States (10). These are publication counts by country of the study area, not counts of distinct sites: several publications report on the same site, most conspicuously Veii. A second group comprises Greece, Russia and the United Kingdom (six studies each), followed by France, the Czech Republic and Cyprus (five each), and Romania, Turkey, Peru, and the Netherlands (three each) (Figure 3). Multi-country studies were counted once for each country represented. A country-level location could be established for 126 of the 132 publications, while the remaining studies reported only a broader continental or regional scope. This distribution broadly reflects the pattern identified for all-sensor UAS archaeology up to 2020 [3] and appears to be shaped both by the density of archaeological landscapes and by the presence of established methodological research groups. Italy’s prominence is particularly associated with repeated multispectral and thermal investigations at Veii, where several teams have surveyed the same Etruscan landscape using different platforms and analytical approaches [31,32,33,34,35,36,37,38,39,40].
Outside the principal European and North American concentrations, UAV-based thermal and multispectral applications encompass a wide variety of archaeological, climatic, and environmental settings. In East and Central Asia, the corpus includes Eastern Zhou walled cities in China [41], Bronze Age khirigsuurs and other funerary landscapes in the Altai and Siberian steppe [42,43], medieval fortified settlements affected by ploughing in Udmurtia [13,14,15], and archaeological landscapes in Mongolia [44]. The humid tropical context is represented by multispectral prospection at Sungai Batu in Malaysia’s Bujang Valley, where Green- and NIR-band responses were evaluated under oil-palm cover [45]. Other Asian and Middle Eastern applications include Yamnaya kurgan landscapes in Bulgaria [46], sensor-comparison experiments in North Macedonia [47], and an Iron Age copper-production site in Oman [48].
The American case studies are similarly diverse. They include the integration of UAV multispectral imagery with satellite and terrain data at the Tiwanaku World Heritage Site in Bolivia [49], geospatial mapping of pre-Hispanic settlements in central Mexico [50], Chimú raised-field agriculture [51], damaged geoglyphs on the northern Peruvian coast [52], and buried structures at Pachacamac [53]. Additional applications concern freshwater-discharge plumes associated with settlement on Rapa Nui [54] and Yup’ik heritage landscapes in subarctic Alaska [55]. Northern and Atlantic European environments are represented by thermal investigation under Ireland’s temperate climatic conditions [56], non-invasive surveys of pastoral mountain settlements in Møre and Romsdal, Norway [57], and the monitoring of Arctic and Greenlandic archaeological sites [58,59]. Cretan urbanism at Gortyn provides a further Mediterranean application outside the principal Italian concentration [60].
Russia shares the fourth-ranked position with Greece. Its representation is partly attributable to the multilingual retrieval strategy: the three Udmurt studies were published in Russian-language or Russian-edited venues and were not retrieved by the English-language Scopus query used in this review. This case illustrates how database and language choices can influence the apparent geography of a methodological literature.
The geographic distribution is cross-tabulated against period and sensor class, and the collaborative links between countries are examined, in Section 4.10.
4.4. Sensor Typology (RQ2)
Multispectral-only applications constitute the largest class of the corpus (72 publications, 55%), followed by thermal-only applications (31, 23%) and by studies deploying both sensor families (29, 22%) (Figure 4). Within the multispectral class, three technological generations coexist. NIR-modified consumer cameras characterise the earliest studies (Canon PowerShot (Canon, Tokyo, Japan) and Olympus (Olympus, Tokyo, Japan) bodies modified by the research teams, in continuity with the pre-drone tradition of Verhoeven [9]). Dedicated calibrated multicamera arrays (Parrot Sequoia and Sequoia+, AIRINOV multiSPEC 4C (AIRINOV, Paris, France), MicaSense RedEdge and Altum, Sentera 6X and agx710 (Sentera, Saint Paul, MN, USA), Tetracam ADC Micro and MCA 6 (Tetracam, Chatsworth, CA, USA)) become dominant from 2016. Manufacturer-integrated solutions (DJI P4 Multispectral, DJI Mavic 3M) follow from late 2019 onwards. The thermal class is dominated by FLIR uncooled LWIR microbolometers across the whole period: adapted Tau 2 640 and T620 cores in the pioneering studies, the Vue Pro and Vue Pro R generation assessed by Thomas [7], Lepton modules on experimental builds, the senseFly thermoMAP on fixed wings, and integrated Zenmuse XT, XT2 and H20T gimbals together with DJI Mavic-embedded cameras in the current stage; the Optris PI 450 (Optris, Berlin, Germany) is the only substantial non-FLIR occurrence. Within this TIR/MS-defined corpus, HSI appears only occasionally as a companion sensor.
Figure 4.
Sensor-class composition of the corpus (n = 132).
Sensor class alone does not determine what a study can measure. Two instrument-level properties do, and both can be established for this corpus from the sensor models recorded in the extraction file, since they are documented specifications of the instruments rather than claims made by the authors (Table 4).
Table 4.
Instrument-level characteristics of the sensors deployed in the corpus, derived from the sensor models recorded in the extraction file (Table S1). Panel (a): radiometric class of the thermal instrument for the 60 publications deploying a thermal sensor. Panel (b): band configuration of the multispectral array for the 101 publications deploying a multispectral sensor. Studies deploying both sensor families appear in both panels.
The first is the radiometric class of the thermal instrument. A radiometric camera assigns a calibrated apparent-temperature value to every pixel, permitting comparison across flights, seasons and studies; a non-radiometric instrument returns an uncalibrated relative-contrast map, which may reveal an anomaly within a single frame but cannot support multitemporal or cross-site comparison, and whose automatic gain control will in general vary the mapping between digital number and radiance across a mosaic [7]. Of the 60 publications deploying a thermal sensor, the instrument is a documented radiometric model in 35 (58.3%) and a non-radiometric core in 14 (23.3%); in the remaining 11 (18.3%) the radiometric status could not be determined, because no instrument was named in nine cases and, in two, only the sensor family was given, without the version designation on which radiometric status depends. Among the studies for which the status is determinable, the radiometric share rises sharply from 1 of 4 in 2013–2016 to 12 of 15 (80.0%) in 2017–2020, and stands at 22 of 30 (73.3%) in 2021–2026: the transition to calibrated instrumentation was effectively complete by the end of the second period and has since plateaued rather than continued.
The transition therefore tracks the market availability of low-cost radiometric cores and their integration into commercial thermal payloads, rather than any explicit methodological argument advanced within the archaeological literature: no publication in the corpus justifies its choice of a radiometric over a non-radiometric instrument on the grounds of the comparisons it intends to make. The transition follows a product cycle, and it stops where the product cycle stops.
The second is the band configuration of the multispectral array. Of the 101 publications deploying a multispectral sensor, 39 (38.6%) used a four-band calibrated array including a red-edge channel, 29 (28.7%) a five-band calibrated array, and 10 (9.9%) a six-band or configurable array. Ten publications (9.9%) used a modified consumer camera or another configuration without a calibrated red-edge channel, while the array could not be established in 13 cases (12.9%). Red-edge-capable hardware is therefore in the hands of 78 publications, 77.2% of the multispectral corpus and 88.6% of those for which the array is identifiable—a considerably higher proportion than the literature’s analytical output would suggest. Since only 30 publications (22.7%) document any processing chain, it cannot be established from the published record whether the red-edge channel was exploited or merely acquired. Two limits of this analysis should be stated. It classifies instruments, not what the publications report: the radiometric status of the thermal camera is stated by the authors in a small minority of cases, and band centres and bandwidths are almost never given, so both properties had to be inferred from manufacturer specifications for the model named. Where the model itself is not named, nothing can be inferred, which is why 15.0% of thermal and 10.9% of multispectral studies remain unclassified. And the classification is silent on the parameters that determine whether a radiometric value is meaningful in practice—the emissivity applied, the treatment of sensor warm-up drift and non-uniformity correction, the presence of a reflectance calibration panel or downwelling irradiance sensor, the time of day of acquisition. Those parameters are absent from the great majority of the publications reviewed and could not be extracted for any systematic fraction of the corpus. Their absence is not a limitation of this review but its principal finding, and it is the reason those fields occupy the mandatory tier of the reporting standard proposed in Section 5.5.
4.5. Platform Typology (RQ3): An Empirical Record
The full-text extraction campaign established the exact aircraft and payload for 122 of the 132 publications (Table 5; Figure 5). Three findings stand out. First, custom-built aircraft, which account for 2 of the 11 studies of the pioneering period (CineStar 8, self-built octocopters carrying adapted FLIR cores or modified Olympus and Canon bodies) and for 3 of 34 in 2017–2020, collapse to a single occurrence among the 87 studies of 2021–2026. Second, the transitional configuration, a commercial ready-to-fly platform carrying a user-mounted third-party sensor (AscTec Falcon 8 (Ascending Technologies, Krailling, Germany) + FLIR Tau 640, Microdrones MD4-200 (Microdrones, Siegen, Germany) + modified Canon PowerShot, QuestUAV (QuestUAV, Amble, UK) + Tetracam, DJI Phantom 4 + Parrot Sequoia or Sentera 6X, 3DR Solo (3D Robotics, Berkeley, CA, USA) + FLIR Vue Pro R), is the backbone of the middle period (23 of 34 studies in 2017–2020) and remains substantial thereafter (34 of 87). Third, factory-integrated systems, in which radiometric TIR and calibrated MS sensors are embedded, co-registered and supported by turnkey processing chains (senseFly eBee with thermoMAP or multiSPEC payloads, DJI P4 Multispectral, Mavic 2 Enterprise Advanced, Mavic 3M and 3T, Matrice with Zenmuse gimbals), grow from 2 of 11 studies (18%) in 2013–2016 and 6 of 34 (18%) in 2017–2020 to 46 of 87 (53%) in 2021–2026. Across the whole corpus, DJI products account for 72 of the 122 identified platforms (59%), far ahead of any other manufacturer; senseFly, in second place, is now a discontinued brand.
Table 5.
Platform and payload configurations by period: empirical counts from full-text extraction (n = 132; ten records for which the configuration could not be established).
Figure 5.
Platform configurations by period (empirical counts from full-text extraction).
4.6. Surface and Vegetation Context (RQ6)
Among the 106 publications for which a vegetation context could be established, cultivated fields, overwhelmingly cereals, dominate with 49 studies (46% of specified contexts), followed by grassland and pasture (26), desert and arid surfaces (9), bare-soil and excavation contexts (6), Mediterranean shrub and woodland (5), tundra and Arctic vegetation (3), wetland, coastal and submerged contexts (3), mixed or otherwise unclassifiable contexts (3) and steppe (2) (Figure 6). Twenty-six records (19.7%) do not specify the vegetation cover at all, an omission with direct consequences for the interpretability of their results, since the same sensor over the same buried feature produces radically different contrasts under a wheat canopy, a matted sward and bare tilled soil. The overall picture is nonetheless clear: cultivated fields constitute the largest single context, indicating a strong preference for conditions in which crop physiology can enhance archaeological contrast.
Figure 6.
Surface and vegetation contexts investigated (n = 106 publications with a specified context, out of 132).
The distribution of surface contexts is not independent of the sensor deployed, and the association is strong enough to be reported as a finding in its own right. Restricting the analysis to the 100 publications whose surface context is both reported and unambiguously classifiable as vegetated or as bare and arid, thermal-only studies operate on bare or arid ground in 10 of 21 cases (47.6%), whereas multispectral-only studies do so in 3 of 58 (5.2%); studies deploying both sensors fall in between, at 2 of 21 (9.5%). The association is highly significant (Fisher’s exact test, thermal-only versus multispectral-only: odds ratio 16.7, p = 4.4 × 10⁻⁵; any thermal versus multispectral-only: odds ratio 7.3, p = 0.0016).
This is the empirical signature of the two mechanisms distinguished in Section 2. Thermal survey is deployed far more frequently than multispectral-only survey where the governing physics is soil thermal inertia—desert and arid surfaces (8 of the 31 thermal-only studies), bare-soil and excavation surfaces, sparsely vegetated ground—and the archaeological contrast arises from differential heat storage in the ground itself. Multispectral survey is deployed almost exclusively over vegetation, where the contrast is mediated by plant physiology. Among the 21 multisensor studies with an unambiguously classifiable surface context, 19 (90.5%) were conducted in vegetated settings, and the thermal channel is therefore operating in the evapotranspiration regime rather than the thermal-inertia regime, whatever the acquisition protocol adopted.
The methodological consequence is that the recurrent debate in this literature over the optimal time of day for thermal acquisition is, at least in part, not a single question. Over bare or sparsely vegetated ground the contrast is driven by differential heat storage and maximises near the extremes of the diurnal wave, reversing sign at the crossover points [6]; over a closed canopy it is a latent-heat signal that maximises when evaporative demand is high and soil water limiting, that is in the middle hours of the day [8]. These are different clocks, and much of the apparent contradiction between pre-dawn and midday recommendations resolves once the two regimes are separated by surface condition rather than debated as one. The corpus establishes that the two regimes are in fact used by different sub-communities; it cannot test the timing question quantitatively, because time of day is reported by too few publications to support any analysis, and even the month of acquisition is available for only 22 of the 60 thermal studies.
One further design variable is associated with sensor class. Multitemporal acquisition, repeated flights across different months, seasons or growth stages on the same target, is documented in 30 publications (22.7%), but it is unevenly distributed: 12 of the 29 multisensor studies (41.4%) are multitemporal, against 12 of 72 multispectral-only studies (16.7%) and 6 of 31 thermal-only studies (19.4%) (Fisher’s exact test, multisensor versus multispectral-only: p = 0.018). Studies that invest in two sensor families also tend to invest in repeated acquisition, which suggests that multisensor design in this corpus is generally a deliberate methodological choice rather than an opportunistic use of whatever payload was available. Multitemporal design does not, however, increase over time: it appears in 0 of 11 studies in 2013–2016, 10 of 34 (29.4%) in 2017–2020 and 20 of 87 (23.0%) in 2021–2026.
4.7. Acquisition Timing
Sixty-eight publications (51.5%) report information on the timing of acquisition, and 53 of these name at least one specific month; the remaining 15 indicate only a season, a systematic year-round campaign or an unspecified multi-month programme. Because the phenological meaning of a calendar month reverses between hemispheres, the two groups are reported separately (Figure 7). The corpus is heavily asymmetric in this respect: 50 of the 53 records that name a month describe study areas in the northern hemisphere, two are austral (Peru and Bolivia) and one equatorial (Malaysia). Among the northern-hemisphere studies the 76 month-mentions cluster markedly in late spring and early summer: May is the most frequent month (20 mentions), followed by June (12), July (11), September (8), August (8), April (6) and October (5), with March and November (2 each) and February and December (1 each) at the margins. May to July alone accounts for 43 of the 76 mentions (57%), and April to July for 49 (64%). Thirty studies (22.7% of the corpus) acquired data across more than one month, season or growth stage.
Figure 7.
Reported acquisition months, distinguished by hemisphere. Upper panel: northern-hemisphere studies (50 publications, 76 month-mentions; multi-month campaigns counted once per month), with the boreal stress-sensitive window shaded; the grey column groups the 15 records indicating only a season, a year-round systematic campaign or an unspecified multi-month programme. Lower panel: the three records from southern-hemisphere and equatorial study areas, plotted on the calendar-month axis, with open circles marking the phenologically equivalent boreal month (calendar month + 6) for the two austral cases.
This distribution matches the phenological logic of crop-mark formation, since moisture-stress contrasts peak between ear emergence and ripening in Mediterranean and temperate cereal calendars, and it matches the evapotranspiration-based timing models proposed for thermal prospection on cultivated fields [8]. The three non-boreal records are too few to test that logic independently, but they are not inconsistent with it. The single austral study on cultivated ground (Bolivia) flew in October, that is austral mid-spring, the phenological equivalent of April in the northern calendar and therefore the leading edge of the same stress-sensitive window; the second austral study (Peru) flew in September over a desert site at Pachacamac, where the operative mechanism is soil thermal inertia rather than crop physiology and the cereal calendar does not apply; and the equatorial study (Malaysia, March, oil-palm canopy) operates outside a marked seasonal cycle altogether. The wider point is methodological rather than substantive: a pooled monthly histogram covering both hemispheres would have added these records to the boreal autumn tail while they in fact occupy austral spring, and any future synthesis with a less Eurocentric corpus will have to convert calendar months to phenological position before aggregating them.
The corollary is documentary: 64 publications (48.5%) do not state when the data were obtained, an omission that severely limits cross-study comparison in a technique whose signal is intrinsically transient. Reporting of the time of day, which for thermal acquisitions is at least as consequential as the month, is rarer still, and the growth stage of the crop, which is what the month is a proxy for, is almost never given.
4.8. Integration with Complementary Datasets
Before considering what the corpus does with its data analytically, it is worth establishing what other data it brings to bear. Sixty-eight publications (51.5%) integrate at least one modality beyond the thermal or multispectral acquisition itself (Table 6). RGB photogrammetry is the most frequent companion (31 publications, 23.5%), followed by ground-based geophysical survey (25, 18.9%), airborne or terrestrial LiDAR (24, 18.2%), satellite imagery (9, 6.8%) and hyperspectral acquisition (5, 3.8%).
Table 6.
Integration with complementary datasets across the corpus (n = 132), by period and by sensor class. Counts derive from the additional modalities field of the extraction file (Table S1); twenty publications report more than one complementary modality, so column totals exceed the number of integrating studies and row percentages do not sum to 100. Percentages are computed on the denominator of the relevant period or sensor class.
The geophysical figure carries particular weight, because it is the only variable in this corpus that approximates independent subsurface verification. Magnetometry, ground-penetrating radar and electrical resistivity interrogate the soil volume directly, and their presence in a study means that a surface anomaly detected from the air has been tested against a measurement of the subsurface rather than left as an inference (Section 2). Its trajectory is the clearest sign of methodological maturation in the corpus: geophysical integration appears in none of the 11 publications of 2013–2016, in 2 of 34 (5.9%) in 2017–2020, and in 23 of 87 (26.4%) in 2021–2026 (Fisher’s exact test, 2017–2020 versus 2021–2026: p = 0.012). It is also unevenly distributed by sensor class, being reported in 15 of 72 multispectral-only studies, 8 of 31 thermal-only studies and only 2 of 29 multisensor studies.
Two qualifications apply. First, 18.9% is an upper bound on independent corroboration and not a measure of it: the extraction records that a geophysical dataset was used, not that it was used to test the aerial anomalies, and in some studies the two datasets are presented side by side without cross-validation. Whether a detected anomaly was independently confirmed, by what means, and with what outcome, is not systematically recoverable from this literature, and the review does not claim to quantify it. Second, and by the same token, the majority of the corpus—81.1%—presents anomalies interpreted as archaeological without any accompanying subsurface measurement. Given that thermal and multispectral survey are indirect proxy techniques (Section 2), this is the single most consequential structural feature of the evidence base assembled here.
4.9. Post-Processing Workflows
Only 30 publications (22.7%) document their post-processing chain beyond generic orthomosaicking and the computation of standard vegetation indices for multispectral data (Table 7). Where reported, the toolkit remains dominated by classical image enhancement and by comparatively simple inferential statistics: statistical testing and separability assessment appear in 10 studies, Principal Component Analysis in 9, false-colour and true-colour composites in 8, machine-learning classification and clustering (Random Forest, supervised classification, k-means, weak learners, and in two cases deep learning) in 6, histogram and radiometric enhancement in 3, and Intensity–Hue–Saturation or equivalent colour-space transforms in 3, with single occurrences of low-pass filtering, Spectral Angle Mapper and pan-multispectral image fusion.
Table 7.
Post-processing techniques reported in the corpus (30 publications documenting their workflow; multiple techniques per study possible).
Two observations follow. The number of studies applying machine learning and the appearance of deep-learning classification and dedicated thermal-mosaic filtering algorithms indicate that the analytical repertoire is beginning to expand. But the proportion of the corpus that documents any processing chain at all remains below one quarter, and the modal reported workflow is still a false-colour composite followed by visual inspection. The picture is one of methodological conservatism at the processing stage, in sharp contrast with the rapid hardware turnover documented in Section 4.5, and of a reporting deficit that currently prevents any meta-analytical assessment of which processing chains actually maximise archaeological detectability.
4.10. Authorship Concentration and Principal Research Groups
A systematic review of a methodological literature should state not only what has been published but by whom, because in a field whose barrier to entry is instrumental as much as intellectual, the geography of publication is largely the geography of laboratories. Eleven identifiable research groups account for 50 of the 132 publications (37.9%) of the corpus (Table 8). None is dominant on its own, but together they define the methodological agenda, and each is associated with a recognisable combination of study region, sensor preference and analytical approach.
Table 8.
Principal research groups in the corpus, ranked by number of publications (n = 50, 37.9% of the corpus). Group membership is defined by recurrent co-authorship and shared institutional affiliation; individual authors may appear in more than one collaboration.
Two figures should not be confused. The 37.9% reported here is the share of the corpus produced by eleven identifiable research groups; it is not a national share. Italy, the most frequently represented country, accounts for 43 of 132 publications (32.6%), and the two quantities measure different properties: one indexes the concentration of production in a small number of laboratories, the other the geographic distribution of study areas. Group membership is moreover defined by recurrent co-authorship and shared affiliation, and individual authors may belong to more than one collaboration, so the figure is an estimate of concentration rather than an exact count of institutional provenance. The three most productive clusters account for 23 publications, 17.4% of the corpus; the eleven identified groups for 50 (37.9%); and the remaining 82 publications (62.1%) form a long tail in which the modal contribution is a single paper.
The largest single cluster is Italian and concentrated on the Etruscan plateau of Veii. Filippo Materazzi, alone or with Marco Pacifici, authors nine publications between 2017 and 2025, moving from an early photogrammetric and multispectral identification at Gravisca [61] through the systematic vegetation-index survey of the pre-Roman city [32] to a decade-scale methodological retrospective [36] and finally to the deliberate sowing of a barley plot in order to engineer crop-mark visibility [38]. This trajectory, from opportunistic detection to controlled agronomic experiment, is the clearest instance in the corpus of a group closing the loop between archaeological prospection and agronomy, and it is the reason Italy’s numerical primacy is not merely a publication artefact.
The most internationally distributed cluster is North American: the Spatial Archaeometry Lab at Dartmouth, directed by Jesse Casana, with Austin Chad Hill, Elise Jakoby Laugier, Carolin Ferwerda and collaborators, contributes eight publications between 2014 and 2026. This group effectively founded drone-based archaeological thermography with the Blue J study [18], codified it into a transferable protocol [19], and has since exported it across an unusually wide range of environments: tallgrass prairie in Illinois [62], the Great Plains [63], a New England Shaker village under multitemporal TIR and NIR [23], northeastern Iraq [64], ancestral agricultural landscapes at Picuris Pueblo [65] and Iron Age Oman [48]. Its unusual reach is partly structural rather than merely scientific: the NSF-funded SPARC programme makes the lab’s equipment and expertise available to external projects through competitive peer review, so that a single methodological tradition propagates into field projects that would otherwise have no access to calibrated thermal instrumentation.
Three further clusters are defined by a specific analytical problem rather than by a region. At the Cyprus University of Technology, the group around Athos Agapiou and, earlier, Kyriacos Themistocleous (six publications, 2014–2024) has progressively narrowed its focus from general UAS feasibility studies to a single well-posed question, the automated detection of surface ceramic scatters, addressed successively with deep learning [66], with a comparison of pixel-based machine-learning classifiers [67] and with weak learners [68]. At the Udmurt Federal Research Centre in Izhevsk, Igor Zhurbin and Anna Zlobina, with Rubleva and Shaura, contribute three publications between 2024 and 2026 that are methodologically distinct from everything else in the corpus: working on medieval Cheptsa-basin fortified settlements whose relief has been destroyed by ploughing, they target the internal structure of the occupation layer itself rather than discrete buried architecture, and they do so through image filtering for thermal mosaic construction [13] and statistical analysis of thermal data [14,15]. Theirs is the most explicitly signal-processing-oriented programme in the corpus, and it is a direct extension of two decades of geophysical work by the same laboratory on the same sites. At the Aristotle University of Thessaloniki, Dimitris Kaimaris (five publications, 2021–2026) works on the fusion of RGB and multispectral UAS data and on PCA-based enhancement for mark detection in Greek urban and peri-urban contexts.
The remaining clusters are more conventionally regional. In France, the Archéodrone line of Nicolas Poirier, Florent Hautefeuille and Carine Calastrenc (four publications, 2013–2020) opened the field and later extended thermography to high-mountain terrain [69]. In Scotland, the collaboration between Historic Environment Scotland and the University of Edinburgh (Cowley, Nichol, Wade, Moriarty and James; four publications, 2017–2020) is distinctive for embedding UAV work within the practice of a national survey body and for its explicit multitemporal crop-stress designs. In Spain, the Zaragoza group of Paula Uribe, Jorge Angás and Fernando Pérez-Cabello (three publications, 2015–2021) produced one of the few genuinely comparative TIR-versus-MS assessments on the same targets [20]. In Italy, alongside Veii, the CNR-ISPC laboratory at Potenza (Abate, Masini, Lasaponara, Sileo) integrates UAV multispectral data with geophysics and satellite series across southern Italian landscapes, and the Politecnico di Milano group (Brumana, Barazzetti, Oreni, Previtali) produced two of the earliest thermal UAV papers in the corpus. At the University of Amsterdam, Jitte Waagen’s 4D Research Lab contributes the corpus’s most rigorous comparative night-time thermography experiment [24] and an empirical assessment of UAS deployment on active excavations [70].
Concentration of output and integration of the community are distinct properties, and the corpus separates them sharply. The 132 publications were written by 386 distinct authors, a mean of 3.78 per publication, linked by 961 co-authorship relations (Figure 8a). That network does not resolve into a connected core with a periphery, as mature methodological fields typically do; it resolves into 75 disconnected components, of which the largest comprises 22 authors, 5.7% of the total, and network density is 0.0129. Read at the level of publications rather than of persons, that is, joining two publications when they share at least one author, the picture is the same: 135 links, 75 components, a largest component of 9 publications (6.8%), and 54 publications (40.9%) that share no author with any other work in the corpus.
Figure 8.
Collaboration structure of the corpus. (a) Co-authorship network of the 386 authors of the 132 included publications, with 961 co-authorship links. Node area is proportional to the number of publications in the corpus; node colour indicates the author’s predominant sensor class; edge thickness indicates the number of shared publications. Components are laid out separately rather than in a single force-directed field, since the network resolves into 75 disconnected components and no giant component exists: the largest comprises 22 authors, 5.7% of the total. Labels identify the most productive author of each component contributing three or more publications. (b) Distribution of publications per author. Author names were normalised to surname plus first initial; homonymy at that level of resolution was checked manually against affiliations.
The productivity distribution is correspondingly skewed (Figure 8b): 322 authors (83.4%) contribute a single publication, 41 (10.6%) two, and 23 (5.9%) three or more. Two further properties of the link structure are worth recording. Collaboration is overwhelmingly intra-national: only 30 of the 135 publication-level links join studies with no country of investigation in common. It is not, however, sensor-bound: 67 links join publications of different sensor classes, so teams do move between thermal and multispectral work even where they do not move between each other.
The eleven groups identified above therefore account for 37.9% of the output without forming a connected community. The field is concentrated at its centre and atomised at its periphery at the same time, and the two facts are not in conflict: they describe a literature produced by a small number of stable laboratories that do not co-publish, surrounded by a large number of authors who contribute once and do not return.
The same fragmentation is visible on the geographic axis. Joining two countries of investigation whenever a single author contributes to publications in both, the 31 countries represented in the corpus are linked by five relations only, forming two small groups (Italy with Greece, Cyprus, the Netherlands and North Macedonia, and the United States with Oman) while 26 countries are connected to no other (Figure 9a). Thirty-two authors have worked in more than one country, but in almost every case the second country is either unattributed or reached through a single expedition rather than through a standing partnership. International collaboration, in this literature, is close to absent. Cross-tabulating the geographic distribution against period and sensor class makes two further patterns explicit (Figure 9b,c). The first is that national output is not a stable quantity but a matter of laboratory lifecycles: Italy rises from 2 publications in 2013–2016 to 35 in 2021–2026, while France, the Czech Republic and the United Kingdom, each active in the first two periods, contribute 0, 0 and 1 publication respectively in the third. The growth of the field is therefore less an accumulation of national traditions than a succession of them. The second is that those traditions are methodologically distinct. Italian and Spanish work is predominantly multispectral (27 of 43 and 11 of 14 studies), Turkish and Peruvian work exclusively thermal (3 of 3 in both cases), and the United States and France lean thermal. Read together with the association between sensor class and surface regime established in Section 4.6, this is intelligible as an environmental signature rather than a national preference: the countries whose corpus is thermal are those whose study areas are arid or sparsely vegetated. It nonetheless means that a reader consulting this literature for methodological guidance will encounter a body of practice whose composition depends substantially on where the studies happen to have been carried out.
Figure 9.
Geographic relations within the corpus. (a) Countries of investigation joined whenever a single author contributes to publications in both: 31 countries, 5 links, 26 countries connected to none. Node area is proportional to the number of studies conducted in that country; link width to the number of author-sharing publication pairs. (b) Studies by country and period, twelve most represented countries. (c) Studies by country and sensor class, same countries. Multi-country studies are counted once per country, so panel totals exceed 132; the four studies whose country could not be established are omitted.
4.11. Reporting Completeness Across the Corpus
The four-field appraisal described in Section 3.7—platform and sensor model, acquisition month, vegetation cover, post-processing chain—can be aggregated into a completeness score from 0 to 4 for every publication in the corpus (Table 9). The mean score is 2.36. Thirteen publications (9.8%) report all four fields; 49 (37.1%) report three; 47 (35.6%) report two; 18 (13.6%) report one; and 5 (3.8%) report none. Field by field, the platform and sensor are identifiable in 122 publications (92.4%), the vegetation context in 106 (80.3%), the acquisition month in 53 (40.2%) and the processing chain in 30 (22.7%).
Table 9.
Reporting completeness across the corpus (n = 132). Each publication is scored 0–4 on the presence of four fields necessary to reconstruct the conditions of the survey, as defined in Section 3.7. Panel (a): distribution of the completeness score, overall and by period. Panel (b): reporting rate of each field by period.
The central result concerns the trajectory. Completeness does not improve as the technique matures: the mean score rises from 1.82 in 2013–2016 to 2.68 in 2017–2020 and then falls to 2.30 in 2021–2026 (Kruskal–Wallis H = 7.05, df = 2, p = 0.029). The decline is driven by a single field. Reporting of the acquisition month rises from 36.4% to 64.7% and then falls to 31.0% (χ2 = 11.61, df = 2, p = 0.0030); the fall between the last two periods is significant on its own (χ2 = 10.15, df = 1, p = 0.0014). Reporting of the vegetation context follows a similar, weaker pattern (63.6%, 88.2%, 79.3%). Only two fields improve monotonically, and both are trivially recoverable: the platform and sensor model (81.8%, 94.1%, 93.1%), which is normally stated because it is a purchase rather than a measurement, and the processing chain (0%, 20.6%, 26.4%), which remains undocumented in nearly three publications out of four.
This pattern is difficult to read as anything other than a consequence of instrumental convenience. The period in which reporting of acquisition timing collapses is exactly the period in which factory-integrated commercial platforms come to equip the majority of studies (Section 4.5) and the volume of output rises most steeply. Where the flight has become an operation that can be scheduled at short notice with a consumer-grade aircraft, the date on which it was flown appears to be treated as an incidental of fieldwork rather than as a parameter of the measurement. That inference is not directly testable with these data, but the association is not in doubt, and its consequence is: acquisition timing is the parameter on which the physical interpretability of both detection pathways most directly depends (Section 2 and Section 4.6), and it is the parameter whose documentation has deteriorated most.
Two further associations are worth stating. Journal articles are substantially better documented than conference papers (mean 2.55 against 1.86; Mann–Whitney U = 2318.5, p = 3.7 × 10⁻⁴), which is expected given length constraints but which also means that the conference literature—28.0% of this corpus, and the venue where a good deal of national-language work appears—is systematically the less usable fraction. And completeness varies by language of publication: English-language studies average 2.50 (n = 109), against 1.57 for Italian (n = 14) and 1.33 for Russian (n = 3), with the remaining languages too sparse to interpret. The multilingual segment that this review went to some lengths to retrieve (Section 3.3 and Section 5.2) is therefore also the segment whose methodological content is hardest to extract, and both facts should be read together: the field’s non-anglophone literature is under-retrieved by conventional review protocols and under-documented when retrieved.
5. Discussion
5.1. Was Archaeological Adoption Associated with the Diffusion of Accessible Commercial UAV Systems? (RQ5)
The completed platform dataset allows a descriptive comparison between publication growth and changes in platform configuration. Three descriptive patterns are consistent with this interpretation: the shift in platform configuration, the concentration around DJI products, and the concurrent increase in publication output. First, the configuration shift: custom-built aircraft virtually disappear (2 of 11, then 3 of 34, then 1 of 87 across the three periods), while factory-integrated systems rise from 18% to 53% of studies, precisely across the release window of the Parrot Sequoia and FLIR Vue Pro R (2016), the DJI P4 Multispectral (announced 24 September 2019) and the integrated thermal Mavic generation (2021–2022). Second, the brand concentration: a single manufacturer, DJI, equips 59% of all identified platforms, and the multispectral surge of the 2020s rides overwhelmingly on the P4 Multispectral and the Mavic 3M. Third, the output curve itself: mean annual production rises more than five-fold between the custom era and the integrated era.
Correlation still cannot be fully isolated from concurrent drivers: the maturation of structure-from-motion photogrammetry, the consolidation of a research community, the appearance of journal special issues and dedicated proceedings volumes, and the normalisation of drone regulation such as the EU 2019/947 framework all operate over the same window. Ease of use also has a documented epistemic cost, since integrated consumer systems constrain radiometric control, band configuration and acquisition timing [7,8,71], and a single-vendor concentration of this magnitude carries an obvious fragility: the discontinuation of senseFly, the second-ranked manufacturer in this corpus, is a reminder that methodological continuity in this field currently depends on the commercial decisions of a very small number of firms, and that export-control or procurement restrictions on one manufacturer would affect a majority of the discipline’s installed base. With these caveats, RQ5 can now be answered affirmatively: the observed temporal association is consistent with the interpretation that market accessibility acted as an enabling factor; however, the design does not isolate its contribution from concurrent changes in software, regulation, funding, and research networks.
5.2. Geography, Laboratories and the Shape of the Discipline
The geographic core of the discipline (Italy, Iberia, the British Isles, central Europe, Greece and Cyprus, the United States) maps onto the historical strongholds of aerial archaeology and onto cereal-dominated agrarian landscapes where crop-mark formation is most reliable. But Section 4.3 and Section 4.10 shows that the map of countries is to a substantial degree a map of laboratories: eleven groups account for 37.9% of all publications, and the national rankings appear to be strongly associated with the presence of stable, instrumented research groups. Italy’s primacy (43 publications) rests on the coexistence of at least four such groups, on the Veii laboratory where several teams have flown TIR/MS missions over the same Etruscan city, and on the 2024 proceedings volume “Le città invisibili”, which concentrated a season of Italian urban non-invasive research into a single source. All three phenomena illustrate why this review distinguishes publications (132) from distinct research projects (122): ten publications, concentrated in the Veii and Teglio clusters, republish or preliminarily announce research fully presented elsewhere. Counting projects rather than papers moderates the 2024 peak and the Italian share without changing the ranking.
The corollary is that the periphery of this map is not necessarily a periphery of archaeological interest but of instrumental capacity, and that where capacity exists the method establishes itself quickly. The post-2020 record (China, the steppe belt, Udmurtia, Mongolia, Arabia, the Andes, the Arctic, Crete, and now also South-East Asia and Mesoamerica) indicates that the method travels where institutional and technical capacity supports access to suitable UAV and sensor systems; the Chinese case is emblematic, with a national research infrastructure (CAS-AIR) producing UAV thermal-plus-hyperspectral casework in national-language journals with bilingual abstracts [41], and the Udmurt case is equally so, with a long-established geophysical laboratory extending its existing analytical repertoire to a new sensor. The retrieval statistics of this review make the point quantitatively rather than rhetorically: Google Scholar contributed 137 records not retrievable from any of the three curated indexes, 69.5% of its own yield, and the LLM-assisted track contributed 38 records that were exclusive to it after cross-track deduplication, of which 33 are carried by publications in the final corpus, concentrated in the pre-2021 and non-English segment. It is in precisely those fractions that the Russian, Chinese, Italian and Spanish-language literature sits. Reviews restricted to English-language, Scopus-indexed sources do not merely under-count this field; they mis-describe its geography and, with it, its intellectual structure.
The retrieval analysis in Section 3.3 shows that this geographic picture is itself contingent on the search design: a single-database strategy would have recovered almost none of the non-anglophone segment on which the argument of this section rests.
5.3. Vegetation, Timing and the Physics of Detectability (RQ6)
The dominance of cultivated cereal fields (46% of specified contexts) is physically motivated: cereals exhibit the steep, phenology-dependent moisture sensitivity on which both reflectance-based crop marks and evapotranspiration-mediated thermal anomalies depend. The acquisition calendar (Section 4.7) is broadly consistent with phenological conditions expected to enhance crop-mark visibility: the May–July concentration matches the stress-sensitive window between ear emergence and ripening, and the explicit modelling of evapotranspiration windows for flight scheduling on wheat [8] formalises what the corpus shows. The field is also beginning to close the loop with agronomy in the opposite direction, purposely sowing crops in order to maximise crop-mark visibility [38].
Grassland and pasture, the second context with 26 studies, remains the recognised hard case, with matted swards damping both spectral and thermal contrasts; arid, bare-soil and excavation contexts favour thermal-inertia signals in continuity with the bare-soil theory of Périsset and Tabbagh [6]. The three tundra and Arctic studies and the three wetland, coastal and submerged studies are too few to support generalisation, but they are methodologically interesting precisely because they operate outside the crop-physiology regime that underwrites most of the corpus, and they are the contexts in which the reporting of surface conditions matters most and is currently least standardised. The Udmurt programme identifies a further regime that the vegetation-centred taxonomy of this review captures only imperfectly: ploughed-out sites where neither relief nor crop response is available, and where the target of detection is the statistical texture of the anthropogenic soil itself.
5.4. Concentration, Replication and the Risk of Methodological Monoculture
The concentration documented in Section 4.10 has an ambivalent significance. On the positive side, stable groups are what produce protocols rather than one-off demonstrations: the four most productive clusters are precisely those that have published explicitly methodological papers (Casana et al. [19]; Materazzi [36]; Thomas [7] in the same tradition; Zlobina et al. [14]), and it is difficult to see how a transferable practice could emerge from isolated case studies alone. On the negative side, a field in which eleven laboratories generate more than a third of the evidence base may be vulnerable to methodological monoculture. No study in the corpus explicitly attempts to reproduce another group’s results on a comparable target; therefore, shared assumptions and software defaults remain largely untested. The structural amplifier here is instrument access, and the SPARC programme is the clearest example of how it works in both directions: it widens participation, and it simultaneously propagates a single methodological tradition. Deliberate cross-group replication, of the kind the comparative designs of Agudo et al. [20] and Waagen et al. [24] approach but do not quite constitute, should therefore be considered a high research priority.
Three consequences for representativeness follow, and they qualify every aggregate figure reported above. The corpus is a sample of practice weighted by publication propensity, not a census. Groups with stable funding and an explicit methodological programme publish more per unit of fieldwork than teams deploying the same instruments as one component of an excavation and reporting them in a site monograph or an unpublished technical annex. The corpus therefore over-represents methodologically self-conscious work and under-represents routine application, which is precisely where the documentary deficit quantified in Section 4.11 is likely to be most severe. The completeness figures reported there should be read as an upper bound on the reporting quality of the field.
Aggregate statistics are correlated within groups. When eleven laboratories generate 37.9% of the evidence, a sensor preference, a processing convention or a software default adopted by one productive group enters the corpus statistics as if independently replicated. The dominance of DJI platforms, the prevalence of PCA and false-colour composites among the reported workflows, and the May–July acquisition concentration are all subject to this effect to an unquantified degree. Formal correction is not possible at this corpus size; the project-level series (n = 122) reported alongside the publication-level series in Figure 2 provides a partial sensitivity check, and it moderates the 2024 peak and the Italian share without altering any ranking.
Geographic and methodological concentration are the same phenomenon on two axes. The national ranking tracks the distribution of instrumented, institutionally stable teams more closely than the distribution of buried heritage (Section 5.2), and those teams are the same eleven groups. Concentration is therefore not an artefact of the retrieval strategy that broader searching would correct—the multilingual and grey-adjacent segments recovered by the Google Scholar and LLM tracks enlarge the periphery without displacing the core, and Section 4.11 shows that those segments are also the least completely documented. The corrective is a change in research practice, not in review protocol: cross-group replication, shared benchmark datasets, and the reporting standard of Section 5.5.
The collaboration structure documented in Section 4.10 supplies the mechanism behind this. Cross-group replication is not merely absent from the corpus as a practice; the network within which it would occur does not exist, since the eleven productive laboratories occupy separate components and 83.4% of authors appear only once. A methodological monoculture is the expected outcome of a field in which the productive units do not intersect, and it is why the corrective proposed in Section 5.5, shared benchmark datasets and a common reporting standard, is a matter of infrastructure rather than of exhortation.
5.5. Processing Workflows and the Reporting Deficit
The limitations of the review process itself, set out in Section 6—single-reviewer screening and extraction, the non-reproducibility of the LLM-assisted track, indexing lag for 2025–2026 and the citation-ranked cap on Google Scholar retrieval—should be borne in mind when reading what follows. The divergence between instrumentation and analysis is the most consequential finding of this review. Three sensor generations have passed through the corpus in a decade while the documented processing repertoire has not moved beyond classical enhancement. The consequence is an inability to accumulate: most studies report successful detections, but incomplete acquisition and processing metadata prevent robust comparison of the relative performance of different workflows.
Comparability fails for a specific reason. Two studies reporting that a vegetation index revealed a buried enclosure are not comparable when one flew a calibrated array over wheat at ear emergence after a dry fortnight and the other an uncalibrated modified camera over autumn stubble: the index is a joint function of all those conditions and of none singly. The heavier cost falls on negative evidence. Where acquisition conditions go unstated, a failure to detect cannot be distinguished from a flight in the wrong window, so null results are difficult to interpret when acquisition conditions are insufficiently reported, which may also contribute to publication bias toward successful detections—and a literature composed almost entirely of successes inflates the apparent reliability of the method.
Table 10 sets out a minimal reporting standard addressed to that failure. Implementation requires no new infrastructure: the mandatory rows cost an author one supplementary table, reviewers can treat them as they treat a missing scale bar, and the fields map onto existing geospatial metadata practice, so they can be deposited with the imagery in any repository issuing persistent identifiers. The corpus released here is populated with these fields wherever they proved recoverable, and serves both as a seed dataset and as a measure of how much is now unrecoverable. The four-field completeness appraisal represents a reduced subset of the proposed standard that could be coded consistently across the historical corpus.
Table 10.
Proposed minimal reporting standard for thermal and multispectral drone surveys in archaeology. Mandatory fields are those without which a study cannot be compared with another; recommended fields materially improve interpretation but are not preconditions for comparison. The complete standard, including all recommended fields and the full rationale column, is released as Supplementary File S1; where journal layout requires it, this table may be set in landscape orientation or moved to the Supplementary Materials without loss.
5.6. Open Issues and Research Agenda
Five problems emerge from this corpus as unresolved rather than merely under-reported, and they define a research agenda that is methodological rather than instrumental.
The first concerns the timing of thermal acquisition, which is not one question but two. Section 4.6 establishes empirically what Section 2 sets out physically: thermal survey is deployed on bare or arid ground in 47.6% of thermal-only studies against 5.2% of multispectral-only studies, and the two contexts engage different physics—thermal inertia and differential heat storage in the first case, latent heat flux and canopy transpiration in the second. Recommendations for pre-dawn and for midday acquisition are therefore not necessarily in conflict, since they may be addressed to different regimes; much of the apparent contradiction in this literature dissolves once the two are separated by surface condition rather than debated as a single problem. The corpus cannot take the matter further, because time of day is reported by too few studies to permit any analysis and even the month of acquisition is available for only 22 of the 60 thermal studies. Settling it would require a deliberately designed experiment rather than the accumulation of further case studies: paired acquisitions across the full diurnal cycle over the same target, repeated under bare and vegetated conditions, with soil moisture and meteorological data recorded alongside. Such a design would establish not merely which hour is optimal but under which surface regime the question is being asked, which is the distinction the literature currently lacks.
The second concerns phenology, and specifically the inadequacy of the calendar month as a description of it. The May–July concentration documented in Section 4.7 is consistent with the stress-sensitive window of temperate and Mediterranean cereals, but the same month corresponds to different growth stages across latitudes, sowing regimes, cultivars and years, and reverses its meaning between hemispheres; and the variable is deteriorating rather than improving as a reported quantity (Section 4.11). The remedy is unusually cheap. Reporting the growth stage on a standard scale instead of, or alongside, the flight date would make acquisitions comparable across sites and years at no cost to the author beyond a single field observation, and would allow the field to accumulate evidence about the sensitivity window itself rather than about the calendar. Multitemporal designs would gain correspondingly: sampling defined growth stages rather than convenient dates converts a sequence of flights into an experiment. The third concerns the reproducibility of the spectral indices on which multispectral interpretation rests, and which this corpus does not establish. Red-edge-capable hardware is deployed in 77.2% of multispectral studies, and in 88.6% of those for which the array can be identified (Section 4.4), yet only 22.7% document any processing chain, so it cannot be determined from the published record whether the red-edge channel was exploited or merely acquired. More consequentially, no study in the corpus computes the same index on the same target with two different sensors, or reports how sensitive its detection is to the choice of index. Whether an archaeological contrast reported through one index would also be reported through a spectrally independent one is therefore unknown for essentially every study reviewed here. Two practices would change this, and neither requires new instrumentation: treating concordance across spectrally independent indices as a condition of reporting a detection rather than as an optional refinement, and publishing reflectance-calibrated band data alongside the derived index products, so that a result computed with one index can be recomputed by others with another.
The fourth concerns the gap between data integration, which is advancing, and analysis, which is not. Integration with complementary datasets is now the majority case at 51.5%, and integration with ground-based subsurface measurement has risen from none of the earliest studies to more than a quarter of the most recent (Section 4.8). Analytical methods have not kept pace. Machine or deep learning appears in six publications, and where deployed it addresses surface artefact detection and thermal-mosaic filtering rather than the harder and more valuable problem of discriminating archaeological anomalies from agronomic and pedological ones. Three obstacles here are structural rather than technical: there are no benchmark datasets with independently verified ground truth, the class imbalance intrinsic to archaeological detection is severe, and published negative examples, the material on which a classifier would learn to reject false positives, are almost entirely absent. Progress depends less on algorithmic sophistication than on the construction of open, corroborated datasets that several groups can train and test against, and on a shift in what studies report: false-positive rates measured against ground truth, rather than successful detections alone.
The fifth underlies all of the above. Because the chain from buried feature to recorded radiance is conditional at every link, a documented non-detection under fully specified conditions constrains the technique as informatively as a detection does, since it delimits the circumstances under which the method fails, which is precisely what a practitioner planning a survey most needs to know. A literature composed almost entirely of successes cannot supply that constraint, and it inflates the apparent reliability of the method for anyone reading it as a guide to practice. Correcting this is partly an editorial responsibility, since well-documented negative results must be publishable before they can be published; but it is also within the reach of individual authors, who could at minimum report, within otherwise positive studies, the areas surveyed in which nothing was detected and the conditions under which those areas were flown. The reporting standard proposed in Section 5.5 is designed to make such statements interpretable, and it is in this sense that the standard is not a bureaucratic addition to publication but a precondition for the field to learn from its own failures.
6. Limitations of the Review
The findings reported above are conditioned by the design of the search, by the composition of the corpus it produced, and by the nature of the analyses performed on it. The limitations are set out here in that order.
6.1. Database Selection and the Place of Scopus
Four bibliographic platforms were interrogated (Scopus, OpenAlex, Semantic Scholar and Google Scholar) rather than the single indexed database on which reviews in this field are commonly built. Because retrieval provenance was recorded for every record, the consequences of that decision can be stated rather than assumed (Table S3). Scopus retrieved 54 of the 132 included publications, 40.9% of the corpus, and its coverage is strongly stratified: 53 of the 109 anglophone publications but only 1 of the 23 non-anglophone ones, and 6 of the 37 conference papers against 47 of the 92 journal articles. A Scopus-only design would therefore have returned a corpus of 54 records, systematically depleted of precisely the regional and conference literature that Section 4.11 and Section 5.4 identify as methodologically distinct, and it would have produced a more anglophone, more journal-centred and almost certainly more flattering picture of the field’s reporting practices. OpenAlex contributed most to the included corpus (75 publications, 56.8%), Google Scholar returned the largest raw yield and the most source-exclusive records but at low precision, and Scopus achieved the highest conversion rate from retrieval to inclusion. No single platform characterises the field; the mean included record was returned by 2.89 sources.
Web of Science was not searched, and this is a genuine gap. Its overlap with Scopus is substantial but not complete, particularly for conference proceedings in the engineering and remote-sensing literature, and its inclusion would probably have added a small number of records. The decision reflected access constraints rather than a methodological judgement, and it is recorded here as a limitation.
6.2. Grey Literature
No restriction on publication type was imposed at the search stage, and the corpus includes 37 conference papers (28.0%), which are analysed on the same footing as journal articles throughout. The grey literature proper, however, is under-represented, and for two distinct reasons. The first is retrieval: technical reports, contract archaeology assessments, master’s and doctoral theses and internal project documentation are indexed inconsistently or not at all by the four platforms searched, and the exploratory LLM track, which surfaced some of this material, was not systematic enough to correct the imbalance. The second is eligibility: 47 records were excluded because they were reports or theses whose full text could not be verified, conference abstracts without extractable data, editorial or aggregate records, or items whose bibliographic metadata were insufficient to assess. Those exclusions were necessary—a review cannot extract from a document it cannot read—but they are not neutral, because unpublished and semi-published technical documentation is where routine, non-demonstrative application of these techniques is most likely to be recorded. The corpus therefore over-represents methodologically self-conscious work and under-represents routine practice, and since Section 4.11 shows that reporting completeness is lowest in the least formal segment of the literature, the completeness figures reported in this review should be read as an upper bound on the field as a whole.
6.3. Language
No language restriction was applied at any stage. The corpus includes 109 publications in English and 23 in five other languages—Italian (14), Spanish (3), Russian (3), French (2) and Chinese (1)—all screened and extracted in the original, with machine translation used only as a reading aid and every extracted value verified against the source text. Retrieval of that segment nonetheless remains incomplete, and in a way the corpus itself makes visible. Scopus returned only one of the 23 non-anglophone records; the segment was recovered chiefly through Google Scholar, through citation searching and through the LLM-assisted track, none of which offers systematic coverage of any of the national literature. Regional traditions that publish in languages the search string does not reach idiomatically—the string was Boolean and English—will be under-recovered in proportion to how distinctively they name their objects, and the absence from the corpus of, for instance, Japanese, Korean and Arabic-language work should be read as a property of the search rather than as evidence about those traditions. A second, subtler asymmetry follows. Non-anglophone publications in this corpus have systematically lower reporting-completeness scores (Section 4.11), which means that the segment the review worked hardest to recover is also the one from which least methodological information could be extracted. Both facts should be held together: the corpus under-retrieves non-anglophone work, and where it succeeds, that work is harder to synthesise.
6.4. The Search String and the Retrieval Tracks
The requirement that archaeolog* appear in the title, abstract or keywords is a deliberate precision-for-recall trade-off, and it will have excluded publications describing archaeological targets in other terms (cultural heritage, ancient landscapes, buried structures). Citation searching was retained partly to mitigate this, and its yield gives a partial measure of the shortfall: 22 included publications (16.7%) were reachable by no database query. Google Scholar returns at most the thousand most-cited records for any query and ranks by citation count, which biases its contribution towards older work. And although the deterministic track is fully re-executable, the LLM-assisted track is not reproducible in the strict sense, since the outputs of large-language-model systems are non-deterministic and change with model versions; this is mitigated by the four-platform database track, by full disclosure of the prompts and by independent verification of every LLM-retrieved record against its original source, and its practical weight is bounded: 9 of the 132 included publications (6.8%) were retrievable through that track alone, and excluding them leaves every sensor, platform and period distribution within 1.7 percentage points of its full-corpus value.
6.5. Temporal Coverage and Dependence Within the Corpus
The years 2025–2026 are structurally under-represented because of indexing lag, so the apparent decline after the 2024 peak should not be read as a downturn in output. Screening and extraction were carried out by a single reviewer, without duplicate screening or formal inter-rater assessment; the extraction file is deposited in full so that individual decisions can be audited, but the absence of a second reviewer remains a limitation of the standard kind. Aggregate statistics are moreover correlated within research groups: when eleven laboratories produce 37.9% of the evidence, a sensor preference or a processing convention adopted by one productive group enters the corpus as though independently replicated. The project-level series (n = 122) offers a partial sensitivity check and moderates the 2024 peak and the Italian share without altering any ranking, but no formal correction is possible at this corpus size.
6.6. Analyses Performed on the Corpus
Three constraints apply to the analyses themselves. First, the sensor classification of Section 4.4 classifies instruments rather than what publications report: the radiometric status of a thermal camera is stated explicitly by a small minority of authors, and band centres and bandwidths almost never, so both properties were inferred from manufacturer specifications for the model named, and nothing could be inferred where the model itself is not named. Second, the inferential tests reported in this review are post hoc and exploratory rather than prespecified, and no correction for multiple comparisons is applied to the values quoted in the text; Holm-adjusted values are supplied in Table S4, under which the association between sensor class and surface regime and the decline in reporting of acquisition month both remain significant, while three further comparisons do not and are accordingly presented as descriptive trends.
Third, citation-based mapping of the corpus was considered and deliberately not attempted. Citation counts and citing–cited relations are indexed asymmetrically across the publication types and languages represented here: the 37 conference papers and the 23 non-anglophone publications are covered partially or not at all by the major citation indices, and the 87 publications of 2021–2026 have had insufficient time to accumulate citations. A citation network built on this corpus would therefore have rendered the segment the search design was constructed to recover as an absence of influence rather than an absence of indexing, and would have imposed a spurious temporal gradient on the period containing two-thirds of the evidence. The collaboration structure reported in Section 4.10 and in Figure 8 and Figure 9 is offered instead, as a relational description that the deposited data support in full.
6.7. What the Corpus Can and Cannot Establish
Finally, and inherent in the object rather than in the method, the corpus reports surface anomalies interpreted as archaeological, not verified subsurface features. Because UAV-borne thermal and multispectral survey is an indirect proxy technique (Section 2), the reliability of any individual detection depends on corroboration external to the imagery, and the closest available proxy for such corroboration (integration with ground-based geophysical survey) is present in 25 publications (18.9%) and records only that a geophysical dataset was acquired, not that it was used to test the aerial anomalies. This review therefore synthesises what has been reported, not what has been archaeologically confirmed.
7. Conclusions
Between 2013 and 2026 the use of thermal and multispectral sensors on unmanned platforms moved from experimental use toward increasingly established application in archaeological prospection. Output grew more than five-fold; the platform base migrated almost completely away from custom-built prototypes toward commercial systems, with factory-integrated configurations becoming the largest single category in 2021–2026 (46/87; 52.9%); the sensor base consolidated around uncooled LWIR microbolometers and calibrated or integrated multispectral arrays; and the geography of application, still centred on Mediterranean and Atlantic Europe and on North America, extended measurably into Asia, the Americas and the polar margins.
The platform record shows a strong temporal association between publication growth and the diffusion of factory-integrated commercial systems. It does not by itself establish the direction of causation, and concurrent developments—the maturation of structure-from-motion photogrammetry, the consolidation of research communities, the regularisation of drone legislation—plausibly contributed. The association nonetheless carries two costs visible in the corpus: integrated consumer systems constrain radiometric control and acquisition timing, and a single-vendor dependence of this magnitude makes methodological continuity contingent on commercial decisions taken outside the discipline.
Production also remains concentrated. Eleven research groups account for more than a third of the corpus, and the ranking of countries follows the distribution of instrumented, institutionally stable teams more closely than the distribution of buried heritage. That concentration has been productive, since it is these groups that have converted single demonstrations into transferable protocols, but it has not produced independent replication: no study in the corpus sets out to reproduce another group’s result on a comparable target.
The principal gaps, however, are documentary rather than technological, and they are not closing. Three publications in four do not describe their processing chain; nearly half do not state when the data were acquired; and the aggregate completeness of reporting does not improve across the three periods but falls back in the most recent one, with reporting of acquisition timing halving between 2017–2020 and 2021–2026. The deterioration coincides with the period in which factory-integrated commercial platforms came to equip the majority of studies and output rose most steeply, which suggests that the operational ease that expanded the field has also loosened the discipline of recording the conditions under which its measurements were made. Reporting the date and time of acquisition, the agronomic and surface conditions that govern the appearance of archaeological traces, and the processing actually applied would make results transparent, comparable and reproducible, at a cost to authors of a single supplementary table.
The underlying sensor technology is increasingly operational, but methodological standardisation and reporting remain insufficient. The instrumental basis of the method can now be regarded as established; what is not yet established is the shared body of procedure that would allow it to be taught, applied and assessed consistently. Consolidating what this review has assembled—acquisition planning, phenological timing, platform and sensor selection, processing and validation—into a theoretical and practical manual is probably the step that separates a technique that works from a discipline that can be transmitted.
One caveat frames all of the above. UAV-borne thermal and multispectral imaging remains an indirect technique: it maps surface proxies at high spatial resolution and at a cadence the archaeologist controls, and in doing so it has become the most efficient reconnaissance instrument available for large cultivated landscapes. It does not image the subsurface, and its outputs are hypotheses about buried features rather than records of them. The corpus shows the field beginning to act on that distinction—integration with ground geophysics has risen from zero to more than a quarter of recent studies—and its proper place is accordingly in an integrated workflow whose reconnaissance stage is aerial and whose verification stage is not. The value of the reporting standard proposed here lies in making the reconnaissance stage auditable enough for that integration to be reproducible.
Future studies should report complete acquisition and processing metadata, publish reusable workflows where possible, and validate remotely detected anomalies against independent archaeological evidence. These measures would improve comparability and support the transition from isolated demonstrations to reproducible archaeological practice.
Supplementary Materials
The following supporting information can be downloaded at: https://www.mdpi.com/article/10.3390/heritage9100429/s1: Table S1, complete classified corpus of the 132 included publications and 122 distinct research projects, with full citation, DOI or URL, year, document type, language, retrieval provenance, country in standardised form with subnational region and identifiability flags, site and cultural context, platform, sensor, sensor class (as recorded and as a three-level controlled variable with additional modalities), acquisition timing, vegetation or surface context (as recorded and as a controlled class), processing chain, research-duplication flag, reviewer-authorship flag and per-publication reporting-completeness fields; controlled fields and column headings are provided in English, while values transcribed from the source records are preserved in the corresponding “as recorded” columns (CSV); Table S2, register of the 270 records excluded during automated screening, metadata assessment and full-text eligibility assessment, with record identifier, full citation, DOI or URL, retrieval source, screening stage, automated rule applied, eligibility decision, controlled-vocabulary exclusion reason and explanatory note, together with a reconciliation sheet reproducing the PRISMA flow (CSV and XLSX); Table S3, retrieval provenance of the 132 included publications. Reports what each of the six retrieval sources contributed to the corpus that survived screening, complementing Table 2, which reports gross yield at the retrieval stage; Table S4, the eleven inferential tests reported in the review, with effect sizes and both unadjusted and Holm-adjusted p-values; File S1, platform-specific search strategies as executed, screening rules, screening log and data-extraction codebook with the operational definitions of all coded categories (PDF); File S2, complete outputs of the LLM-assisted searches, including returned citations, URLs, verification status, corrections and exclusion reasons (CSV); File S3, analytical code used to generate the descriptive statistics, tables and figures (Python).
Funding
This research received no external funding.
Data Availability Statement
The full classified corpus (132 records with bibliographic metadata, sensor class, exact platform and sensor configuration, study area, cultural context, vegetation context, acquisition month, post-processing techniques, research-duplication flags and annotation provenance) and the complete research outputs are provided as Supplementary Materials (Table S1). The analytical code that regenerates the corpus-derived descriptive statistics, tables and figures, together with a validation report checking each regenerated value against the values reported here, is provided as Supplementary File S3.
Acknowledgments
During the preparation of this manuscript, the author used Claude (Anthropic, Opus 5) and ChatGPT (OpenAI, GPT-5.5), as described in the Section 3, to support supplementary literature discovery. ChatGPT (OpenAI, GPT-5.5) was also used for English-language correction and editorial refinement, while OpenAI’s image-generation tool was used to produce the graphical abstract. These tools were accessed in July–August 2026 through the versions available in their respective online interfaces at the time of use. The author reviewed, verified, and edited all outputs and takes full responsibility for the content of this publication.
Conflicts of Interest
The author declares no conflicts of interest.
References
- Scollar, I.; Tabbagh, A.; Hesse, A.; Herzog, I. Archaeological Prospecting and Remote Sensing; Cambridge University Press: Cambridge, UK, 1990. [Google Scholar]
- Verhoeven, G. Near-Infrared Aerial Crop Mark Archaeology: From its Historical Use to Current Digital Implementations. J. Archaeol. Method Theory 2012, 19, 132–160. [Google Scholar] [CrossRef] [Scilit]
- Adamopoulos, E.; Rinaudo, F. UAS-Based Archaeological Remote Sensing: Review, Meta-Analysis and State-of-the-Art. Drones 2020, 4, 46. [Google Scholar] [CrossRef] [Scilit]
- Luo, L.; Wang, X.; Guo, H.; Lasaponara, R.; Zong, X.; Masini, N.; Wang, G.; Shi, P.; Khatteli, H.; Chen, F.; et al. Airborne and spaceborne remote sensing for archaeological and cultural heritage applications: A review of the century (1907–2017). Remote Sens. Environ. 2019, 232, 111280. [Google Scholar] [CrossRef] [Scilit]
- Kaimaris, D. Aerial Remote Sensing Archaeology—A Short Review and Applications. Land 2024, 13, 997. [Google Scholar] [CrossRef] [Scilit]
- Périsset, M.C.; Tabbagh, A. Interpretation of thermal prospection on bare Soils. Archaeometry 1981, 23, 169–187. [Google Scholar] [CrossRef] [Scilit]
- Thomas, H. Some like it hot: The impact of next generation FLIR Systems thermal cameras on archaeological thermography. Archaeol. Prospect. 2018, 25, 81–87. [Google Scholar] [CrossRef] [Scilit]
- Ciccone, G. Thermal Analysis of Evapotranspiration in Cultivated Fields for the Detection of Archaeological Anomalies. Archaeol. Prospect. 2024, 31, 217–231. [Google Scholar] [CrossRef] [Scilit]
- Verhoeven, G. Imaging the invisible using modified digital still cameras for straightforward and low-cost archaeological near-infrared photography. J. Archaeol. Sci. 2008, 35, 3087–3100. [Google Scholar] [CrossRef] [Scilit]
- Nicosia, C.; Stoops, G. (Eds.) Archaeological Soil and Sediment Micromorphology; Wiley-Blackwell: Chichester, UK, 2017. [Google Scholar]
- Karkanas, P.; Goldberg, P. Reconstructing Archaeological Sites: Understanding the Geoarchaeological Matrix; Wiley-Blackwell: Chichester, UK, 2018. [Google Scholar]
- IUSS Working Group WRB. World Reference Base for Soil Resources, 4th ed.; International Union of Soil Sciences: Vienna, Austria, 2022. [Google Scholar]
- Zlobina, A.G.; Rubleva, E.A.; Zhurbin, I.V. Image filtering at constructing archaeological sites thermal images’ mosaic. Geod. Cartogr. 2024, 1013, 45–55. [Google Scholar] [CrossRef] [Scilit]
- Zlobina, A.G.; Zhurbin, I.V.; Shaura, A.S.; Rubleva, E.A. Algorithm of Statistical Analysis of Thermal Imaging Data for Assessing the Structure of the Occupation Layer of Archaeological Sites. Optoelectron. Instrum. Data Process. 2025, 61, 93–102. [Google Scholar] [CrossRef] [Scilit]
- Zhurbin, I.V.; Zlobina, A.G. The Occupation Layer of the Idnakar Fortified Settlement, Udmurtia (9th–13th Centuries), Based on Thermal Imaging and Multispectral Survey Data. Archaeol. Ethnol. Anthropol. Eurasia 2026, 54, 111–119. [Google Scholar] [CrossRef] [Scilit]
- Poirier, N.; Hautefeuille, F.; Calastrenc, C. Low Altitude Thermal Survey by Means of an Automated Unmanned Aerial Vehicle for the Detection of Archaeological Buried Structures. Archaeol. Prospect. 2013, 20, 303–307. [Google Scholar] [CrossRef] [Scilit]
- Brumana, R.; Oreni, D.; Van Hecke, L.; Barazzetti, L.; Previtali, M.; Roncoroni, F.; Valente, R. Combined Geometric and Thermal Analysis from UAV Platforms for Archaeological Heritage Documentation. ISPRS Ann. Photogramm. Remote Sens. Spat. Inf. Sci. 2013, II-5/W1, 49–54. [Google Scholar] [CrossRef] [Scilit]
- Casana, J.; Kantner, J.; Wiewel, A.; Cothren, J. Archaeological aerial thermography: A case study at the Chaco-era Blue J community, New Mexico. J. Archaeol. Sci. 2014, 45, 207–219. [Google Scholar] [CrossRef] [Scilit]
- Casana, J.; Wiewel, A.; Cool, A.; Hill, A.C.; Fisher, K.D.; Laugier, E.J. Archaeological Aerial Thermography in Theory and Practice. Adv. Archaeol. Pract. 2017, 5, 310–327. [Google Scholar] [CrossRef] [Scilit]
- Agudo, P.U.; Pajas, J.A.; Pérez-Cabello, F.; Redón, J.V.; Lebrón, B.E. The Potential of Drones and Sensors to Enhance Detection of Archaeological Cropmarks: A Comparative Study Between Multi-Spectral and Thermal Imagery. Drones 2018, 2, 29. [Google Scholar] [CrossRef] [Scilit]
- Šedina, J.; Housarová, E.; Raeva, P. Using RPAS for the detection of archaeological objects using multispectral and thermal imaging. Eur. J. Remote Sens. 2019, 52, 182–191. [Google Scholar] [CrossRef] [Scilit]
- Salgado Carmona, J.Á.; Quirós, E.; Mayoral, V.; Charro, C. Assessing the potential of multispectral and thermal UAV imagery from archaeological sites. A case study from the Iron Age hillfort of Villasviejas del Tamuja (Cáceres, Spain). J. Archaeol. Sci. Rep. 2020, 31, 102312. [Google Scholar] [CrossRef] [Scilit]
- Hill, A.C.; Laugier, E.J.; Casana, J. Archaeological Remote Sensing Using Multi-Temporal, Drone-Acquired Thermal and Near Infrared (NIR) Imagery: A Case Study at the Enfield Shaker Village, New Hampshire. Remote Sens. 2020, 12, 690. [Google Scholar] [CrossRef] [Scilit]
- Waagen, J.; Sánchez, J.G.; van der Heiden, M.; Kuiters, A.; Lulof, P. In the Heat of the Night: Comparative Assessment of Drone Thermography at the Archaeological Sites of Acquarossa, Italy, and Siegerswoude, The Netherlands. Drones 2022, 6, 165. [Google Scholar] [CrossRef] [Scilit]
- Ciccone, G. Investigating archaeological remains at Stracciacappe, Rome: Comparing traditional sources with UAV-based multispectral, thermal and microtopographic analysis. Drone Syst. Appl. 2024, 12, 1–16. [Google Scholar] [CrossRef] [Scilit]
- Page, M.J.; McKenzie, J.E.; Bossuyt, P.M.; Boutron, I.; Hoffmann, T.C.; Mulrow, C.D.; Shamseer, L.; Tetzlaff, J.M.; Akl, E.A.; Brennan, S.E.; et al. The PRISMA 2020 statement: An updated guideline for reporting systematic reviews. BMJ 2021, 372, n71. [Google Scholar] [CrossRef] [Scilit] [PubMed]
- Harzing, A.-W. Publish or Perish. 2007. Available online: https://harzing.com/resources/publish-or-perish (accessed on 28 July 2026).
- Ceraudo, G.; Ferrari, V.; Scardozzi, G. (Eds.) Le città invisibili. Remote e Proximal Sensing in Archeologia. Metodologie non invasive per lo studio della città antica. Atti del Terzo Convegno Internazionale, Lecce 19–21 maggio 2022. Casi di studio all’estero. In Archeologia Aerea; Claudio Grenzi Editore: Foggia, Italy, 2023; Volume 16. [Google Scholar]
- Ceraudo, G.; Ferrari, V.; Scardozzi, G. (Eds.) Le città invisibili. Remote e Proximal Sensing in Archeologia. Metodologie non invasive per lo studio della città antica. Atti del Terzo Convegno Internazionale, Lecce 19–21 maggio 2022. Casi di studio in Italia settentrionale e centrale. In Archeologia Aerea; Claudio Grenzi Editore: Foggia, Italy, 2024; Volume 17. [Google Scholar]
- Ceraudo, G.; Ferrari, V.; Scardozzi, G. (Eds.) Le città invisibili. Remote e Proximal Sensing in Archeologia. Metodologie non invasive per lo studio della città antica. Atti del Terzo Convegno Internazionale, Lecce 19–21 maggio 2022. Casi di studio in Italia meridionale e isole. In Archeologia Aerea; Claudio Grenzi Editore: Foggia, Italy, 2024; Volume 18. [Google Scholar]
- Ebanista, L.; Jaia, A.M.; Pompili, A. Integrazione di un sensore Sentera 6X a bordo di un drone Phantom 4. Una sperimentazione in campo archeologico. GEOmedia 2021, 25, 30–36. Available online: https://www.geomediaonline.it/report1/396-integrazione-di-un-sensore-sentera-6x-a-bordo-di-un-drone-phantom-4-una-sperimentazione-in-campo-archeologico (accessed on 28 July 2026).
- Materazzi, F.; Pacifici, M. Archaeological crop marks detection through drone multispectral remote sensing and vegetation indices: A new approach tested on the Italian pre-Roman city of Veii. J. Archaeol. Sci. Rep. 2022, 41, 103235. [Google Scholar] [CrossRef] [Scilit]
- Materazzi, F.; Pacifici, M. Multispectral Remote Sensing Using Drones. An Innovative Approach to Investigating the Urban Landscape of Veii. In Experiencing the Landscape in Antiquity 2; Cristilli, A., De Luca, F., Di Luca, G., Gonfloni, A., Eds.; BAR S3107; BAR Publishing: Oxford, UK, 2022; pp. 197–205. [Google Scholar]
- Materazzi, F.; Pacifici, M. Veio rivelata. Un’analisi integrata della città antica alla luce dei nuovi dati ottenuti da telerilevamento multispettrale da drone. In Archeologia Aerea; Ceraudo, G., Ferrari, V., Scardozzi, G., Eds.; Claudio Grenzi Editore: Foggia, Italy, 2024; Volume 17, pp. 218–226. [Google Scholar]
- Materazzi, F. How Far Down? Interdisciplinary Discussions and Multimodal Investigations to Understand the Potential of Multispectral Remote Sensing. Proceedings 2024, 96, 12. [Google Scholar] [CrossRef] [Scilit]
- Materazzi, F. Un approccio agronomico al remote sensing da drone per lo studio delle evidenze archeologiche sepolte. Il metodo e i casi studio a dieci anni dalle prime acquisizioni. In Archeologia Aerea; Ceraudo, G., Ferrari, V., Scardozzi, G., Eds.; Claudio Grenzi Editore: Foggia, Italy, 2024; Volume 17, pp. 210–217. [Google Scholar]
- Materazzi, F.; Pacifici, M. Remote Sensing multispettrale e termico da drone. Una nuova prospettiva per la ricostruzione del paesaggio funerario a Veio. In Landscape 4: Una Sintesi di Elementi Diacronici. Pianificazione e Mondo Antico: Tra i Dogmi del Passato e le Interpretazioni Recenti; D’Alessio, G., De Nisi, S., Felici, C., Gangale Risoleo, D., Pesce, S., Raimondo, I., Eds.; Archaeopress Publishing: Bicester, UK, 2025; pp. 263–277. [Google Scholar]
- Materazzi, F. Sowing, Monitoring, Detecting: A Possible Solution to Improve the Visibility of Cropmarks in Cultivated Fields. J. Imaging 2025, 11, 71. [Google Scholar] [CrossRef] [Scilit] [PubMed]
- Ciccone, G. Un’indagine di archeologia aerea a bassa quota sul Pianoro di Veio. Un anno di voli con drone multispettrale. In Archeologia Aerea; Ceraudo, G., Ferrari, V., Scardozzi, G., Eds.; Claudio Grenzi Editore: Foggia, Italy, 2024; Volume 17, pp. 182–189. [Google Scholar]
- Ebanista, L.; Jaia, A.M. Telerilevamento di prossimità: Acquisizione ed elaborazione di immagini multispettrali. In Archeologia Aerea; Ceraudo, G., Ferrari, V., Scardozzi, G., Eds.; Claudio Grenzi Editore: Foggia, Italy, 2024; Volume 17, pp. 70–82. [Google Scholar]
- Shu, H.; Fang, J.; Lu, P.; Gu, W.; Wang, X.; Zhang, X.; Liu, X.; Ding, L. Research on fine recognition of site spatial archaeology based on multisource high-resolution data. Remote Sens. Land Resour. 2021, 33, 162–171. [Google Scholar] [CrossRef]
- Krupochkin, E.P.; Papin, D.V. Khirgisuurs of Yustyd: Multispectral Imagery, Experience of Using UAVs for Complex Study. Theory Pract. Archaeol. Res. 2021, 33, 209–220. [Google Scholar] [CrossRef] [Scilit]
- Blochin, J.K.; Pavlovskaia, E.A.; Sadykov, T.R.; Caspari, G. Remotely Sensing the Invisible—Thermal and Magnetic Survey Data Integration for Landscape Archaeology. Remote Sens. 2023, 15, 4992. [Google Scholar] [CrossRef] [Scilit]
- Heimermann, P.; Lang, M.; Reichert, S.; Munkhbayar, L.; Bemmann, J. A Multisensor Remote Sensing Approach to Archaeological Prospection: Integrating UAV and Google Earth Data in the Bayan Gol Valley, Mongolia. Archaeol. Prospect. 2026, 33, 109–130. [Google Scholar] [CrossRef] [Scilit]
- Roslan, S.A.; Yakub, F.; Saidin, M.; Rashid, M.Z.A.; Kasim, J.A. Selecting the Optimal Spectral Band for Humid-Tropical Archaeological Prospection in Bujang Valley: A Band-Sum Normalization of SPOT and UAV Imagery at Sungai Batu. Archaeol. Prospect. 2026, 33, 339–354. [Google Scholar] [CrossRef] [Scilit]
- Paukkonen, N.; Skorna, H.; Wilkes, F.; Dimitrov, S.; Alexandrov, S.; Slavchev, V.; Heyd, V. Recovering the disappearing Yamnaya kurgan landscape of northeastern Bulgaria by multi-method remote sensing. Remote Sens. Appl. Soc. Environ. 2025, 40, 101789. [Google Scholar] [CrossRef] [Scilit]
- Kaimaris, D. Utilization of Different Sensors in UAV for the Detection and Optimal Visual Observation of the Marks Over Buried Ancient Remains. Sci. Cult. 2022, 8, 129–145. [Google Scholar]
- Paulsen, P.; Ferwerda, C.; Lehner, J.W.; Harrower, M.J.; Zaribaf, A.; Creamer, P.; Casana, J. Drone-based thermal imaging of subsurface architecture: Methodological insights and discoveries at Iron Age Raki (Oman). J. Archaeol. Sci. Rep. 2026, 69, 105569. [Google Scholar] [CrossRef] [Scilit]
- Pérez González, M.E.; Gallego Revilla, J.I. A new environmental and spatial approach to the Tiwanaku World Heritage site (Bolivia) using remote sensing (UAV and satellite images). Geoarchaeology 2020, 35, 416–429. [Google Scholar] [CrossRef] [Scilit]
- Miranda-Gómez, R.; Cabadas-Báez, H.V.; Antonio-Némiga, X.; Dávila-Hernández, N. Geospatial integration in mapping pre-Hispanic settlements within Aztec empire limits. Virtual Archaeol. Rev. 2022, 13, 49–65. [Google Scholar] [CrossRef] [Scilit]
- Price, S. Water, salt, and heat in raised field agriculture: Using hydrologic modeling and thermal imagery to investigate soil drainage and temperature dynamics. Archaeol. Anthropol. Sci. 2024, 16, 180. [Google Scholar] [CrossRef] [Scilit]
- Sanchez Borjas, A.E.; Ghezzi Solis, I.A. Estudio preliminar en la utilización de cámara térmica en el registro de geoglifos dañados en la costa norte del Perú: Artículo. Práctica Arqueol. 2025, 8, 64–81. [Google Scholar] [CrossRef]
- Van Dongen, A.; Eeckhout, P.; Lo Buglio, D. CROSSED EXPERIMENTATIONS OF LOW-ALTITUDE SURVEYS FOR THE DETECTION OF BURIED STRUCTURES. Int. Arch. Photogramm. Remote Sens. Spat. Inf. Sci. 2022, XLVI-2-W1-2022, 505–512. [Google Scholar] [CrossRef] [Scilit]
- DiNapoli, R.J.; Lipo, C.P.; de Smet, T.S.; Hunt, T.L. Thermal Imaging Shows Submarine Groundwater Discharge Plumes Associated with Ancient Settlements on Rapa Nui (Easter Island, Chile). Remote Sens. 2021, 13, 2531. [Google Scholar] [CrossRef] [Scilit]
- Lim, J.S.; Gleason, S.; Williams, M.; Linares Matás, G.J.; Marsden, D.; Jones, W. UAV-Based Remote Sensing for Managing Alaskan Native Heritage Landscapes in the Yukon-Kuskokwim Delta. Remote Sens. 2022, 14, 728. [Google Scholar] [CrossRef] [Scilit]
- Roche, L. Examining the potential application of Unmanned Aerial Vehicle (UAV)-based thermal imaging as a subset of archaeological remote sensing within Ireland’s climatic conditions. J. Ir. Archaeol. 2023, 32, 71–94. Available online: https://www.jstor.org/stable/27390090 (accessed on 28 July 2026).
- Dahle, K.; Solem, D.Ø.E.; Gran, M.M.; Stamnes, A.A. Making the Invisible Visible: The Applicability and Potential of Non-Invasive Methods in Pastoral Mountain Landscapes—New Results from Aerial Surveys and Geophysical Prospection at Shielings Across Møre and Romsdal, Norway. Remote Sens. 2025, 17, 1281. [Google Scholar] [CrossRef] [Scilit]
- Walker, S. Low-altitude aerial thermography for the archaeological investigation of arctic landscapes. J. Archaeol. Sci. 2020, 117, 105126. [Google Scholar] [CrossRef] [Scilit]
- Hollesen, J.; Jepsen, M.S.; Harmsen, H. The Application of RGB, Multispectral, and Thermal Imagery to Document and Monitor Archaeological Sites in the Arctic: A Case Study from South Greenland. Drones 2023, 7, 115. [Google Scholar] [CrossRef] [Scilit]
- Jaia, A.; Ebanista, L. Rilevamenti aerei multisensore per lo studio dell’urbanistica di Gortina di Creta. Archeol. E Calc. 2026, 15, 325–342. [Google Scholar] [CrossRef]
- Fiorini, L.; Materazzi, F. Un Iseion a Gravisca? Fotogrammetria, telerilevamento multispettrale da APR e dati archeologici per una possibile identificazione. In FOLD&R FastiOnLine Documents & Research; No. 396; AIAC: Roma, Italy, 2017; pp. 1–23. [Google Scholar]
- McLeester, M.; Casana, J.; Schurr, M.R.; Hill, A.C.; Wheeler, J.H. Detecting prehistoric landscape features using thermal, multispectral, and historical imagery analysis at Midewin National Tallgrass Prairie, Illinois. J. Archaeol. Sci. Rep. 2018, 21, 450–459. [Google Scholar] [CrossRef] [Scilit]
- Casana, J.; Laugier, E.J.; Hill, A.C.; Blakeslee, D. A Council Circle at Etzanoa? Multi-sensor Drone Survey at an Ancestral Wichita Settlement in Southeastern Kansas. Am. Antiq. 2020, 85, 761–780. [Google Scholar] [CrossRef] [Scilit]
- Laugier, E.J.; Casana, J. Integrating Satellite, UAV, and Ground-Based Remote Sensing in Archaeology: An Exploration of Pre-Modern Land Use in Northeastern Iraq. Remote Sens. 2021, 13, 5119. [Google Scholar] [CrossRef] [Scilit]
- Casana, J.; Fowles, S.; Montgomery, L.M.; Mermejo, R.; Ferwerda, C.; Hill, A.C.; Adler, M. Multi-sensor drone survey of ancestral agricultural landscapes at Picuris Pueblo, New Mexico. J. Archaeol. Sci. 2023, 157, 105837. [Google Scholar] [CrossRef] [Scilit]
- Agapiou, A.; Vionis, A.; Papantoniou, G. Detection of Archaeological Surface Ceramics Using Deep Learning Image-Based Methods and Very High-Resolution UAV Imageries. Land 2021, 10, 1365. [Google Scholar] [CrossRef] [Scilit]
- Argyrou, A.; Agapiou, A.; Papakonstantinou, A.; Alexakis, D.D. Comparison of Machine Learning Pixel-Based Classifiers for Detecting Archaeological Ceramics. Drones 2023, 7, 578. [Google Scholar] [CrossRef] [Scilit]
- Argyrou, A.; Agapiou, A. Archaeological Surface Ceramics Detection Using Low Altitude Images Based on Weak Learners. In Proceedings of the IGARSS 2024—2024 IEEE International Geoscience and Remote Sensing Symposium 2024; IEEE: New York, NY, USA, 2024; pp. 3380–3383. [Google Scholar] [CrossRef] [Scilit]
- Calastrenc, C.; Baleux, F.; Poirier, N.; Rendu, C. Thermographie aéroportée par drone. Nouvelle procédure pour la détection archéologique en haute montagne. ArchéoSciences 2020, 44, 81–96. [Google Scholar] [CrossRef] [Scilit]
- Waagen, J.; Van Hilst, A. Drones over excavations–Enhancing the archaeologist’s eyes. An empirical case study into the deployment of UAS remote sensing as a research tool for archaeological excavation, in Veldhoven, the Netherlands. J. Archaeol. Sci. Rep. 2025, 62, 105043. [Google Scholar] [CrossRef] [Scilit]
- Ciccone, G. Droni commerciali con sensori termici e multispettrali per il telerilevamento archeologico a bassa quota. In Atti del Convegno Una Quantum 2021. Nuove Tecnologie Open Source per la Gestione dei Beni, Delle Attività Culturali e del Turismo; 16–17 Dicembre 2021 Sala della Fortuna, Museo Nazionale Etrusco Villa Giulia, Roma; Rosati, P., Casadei, E., Eds.; Edizioni Archeoares: Roma, Italy, 2022; pp. 63–82. [Google Scholar]
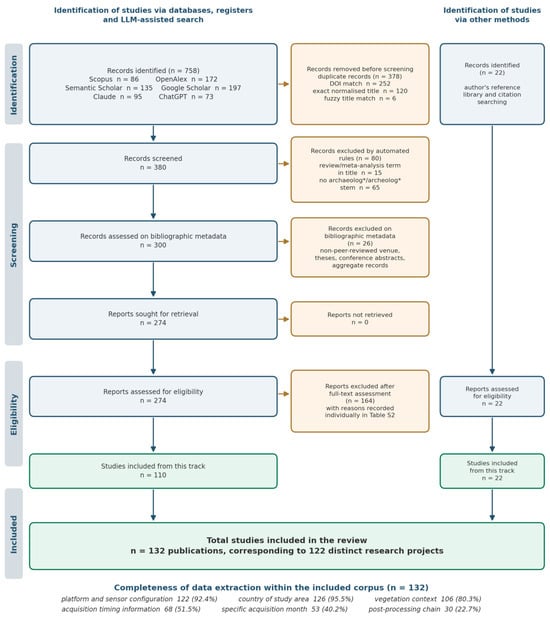
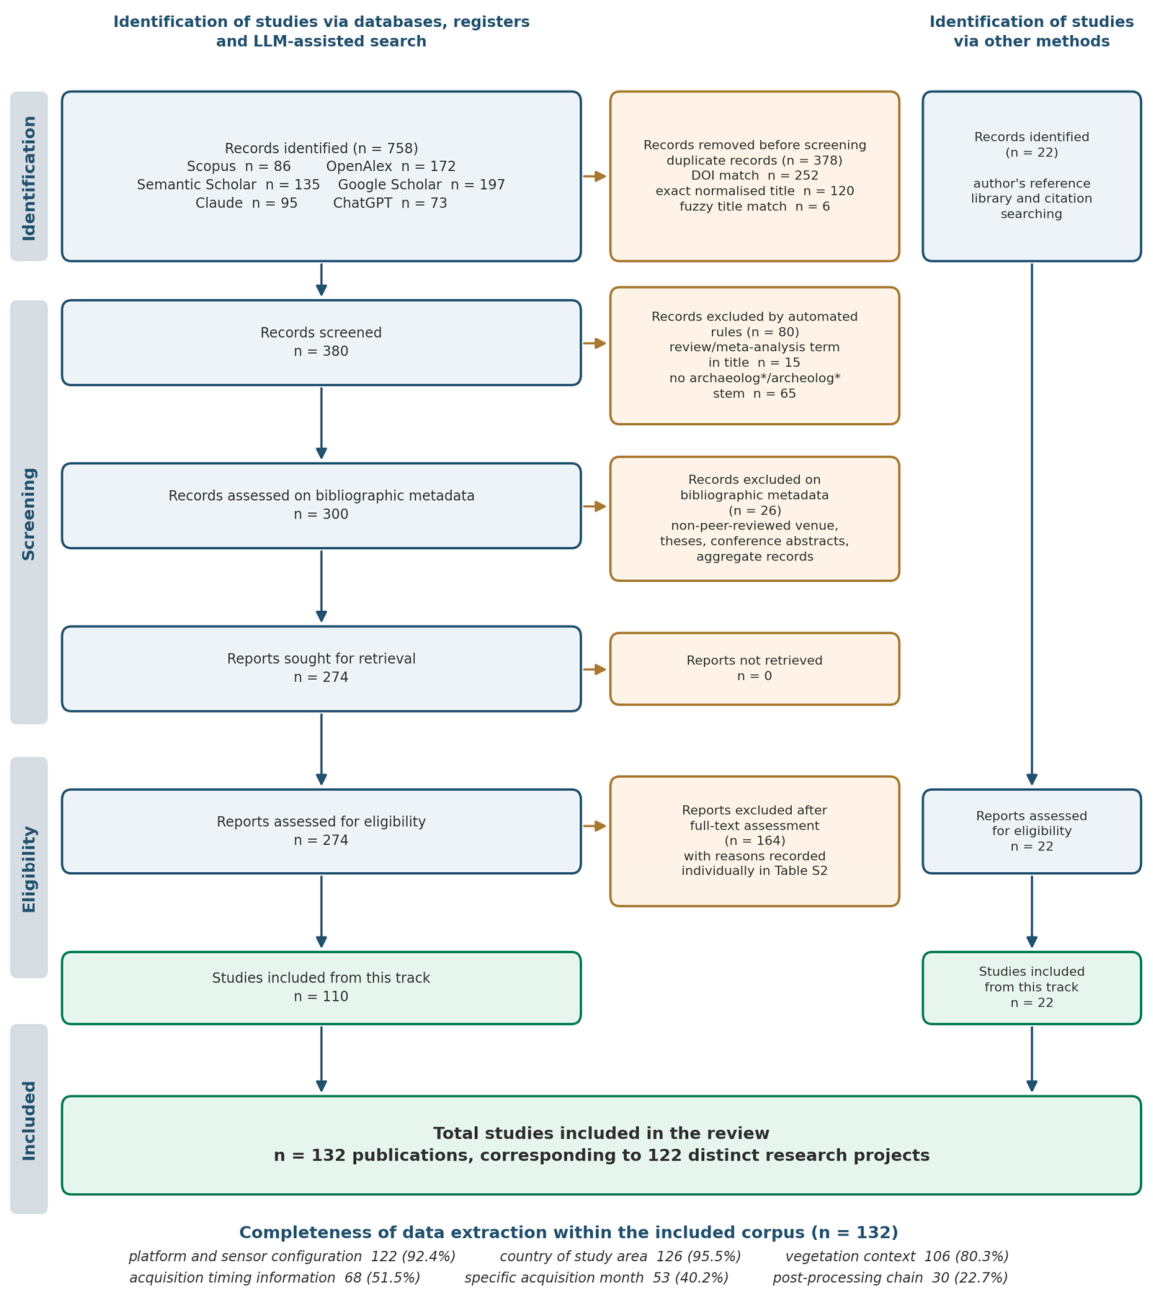
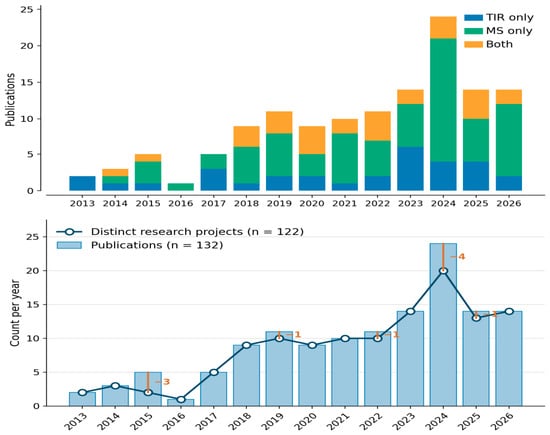
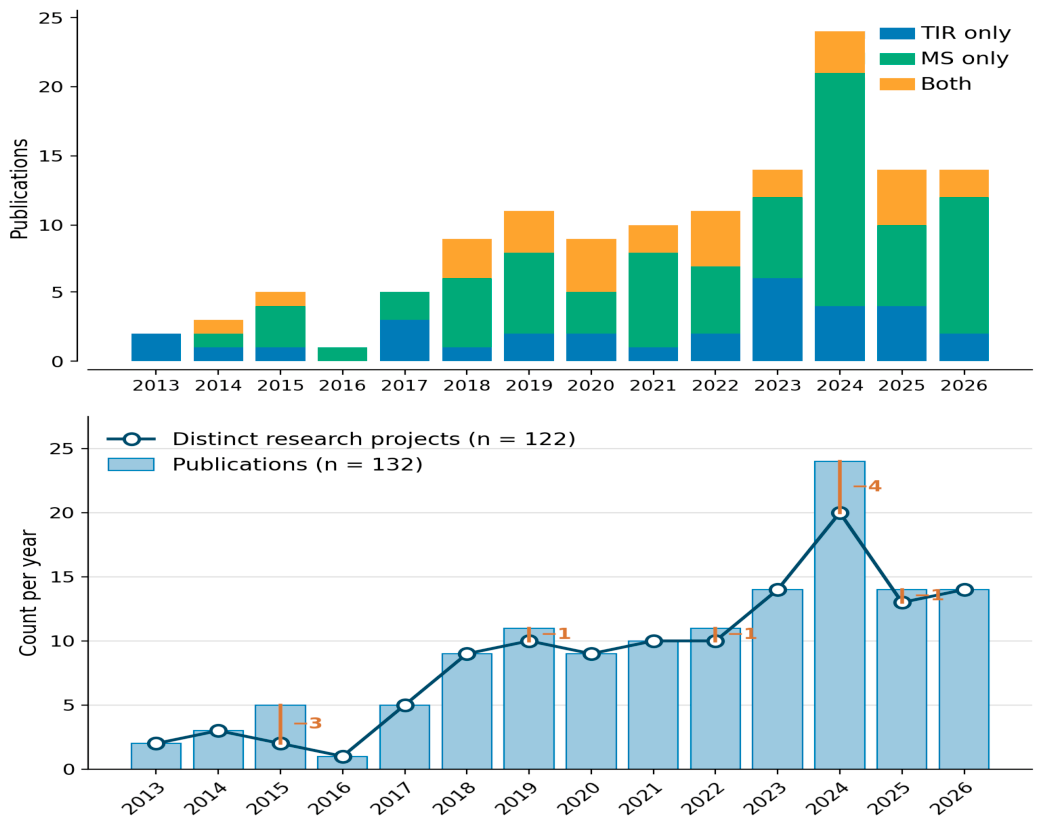
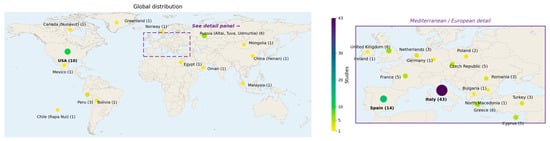
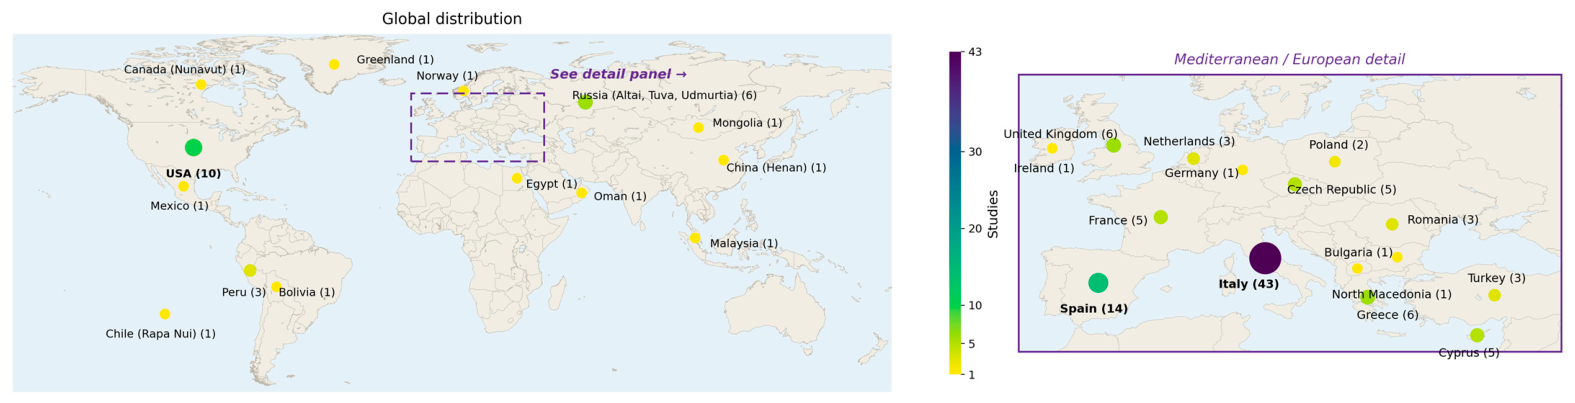
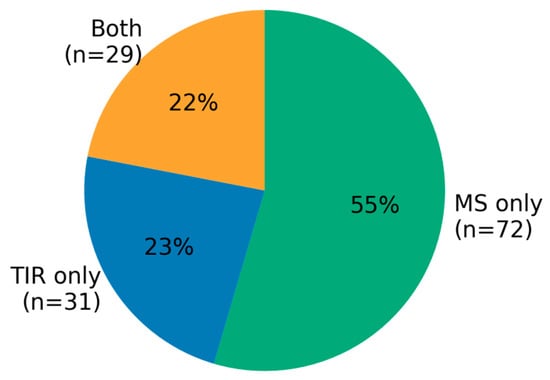
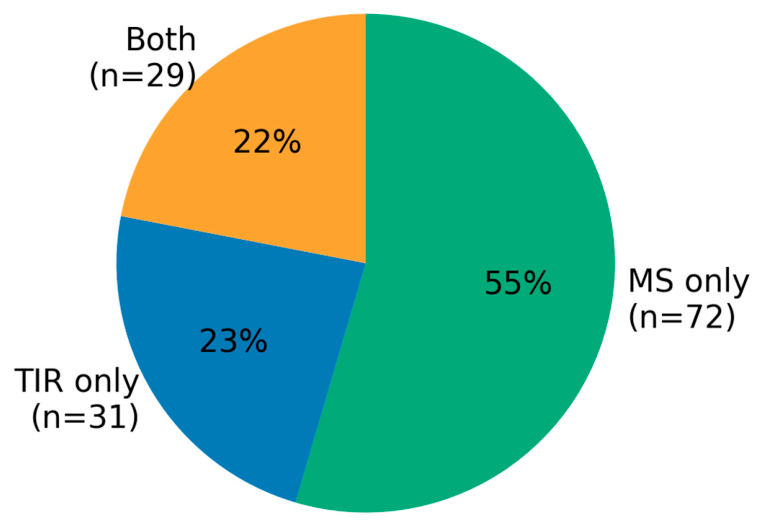
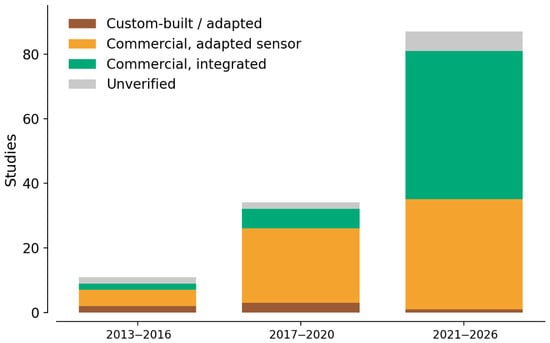
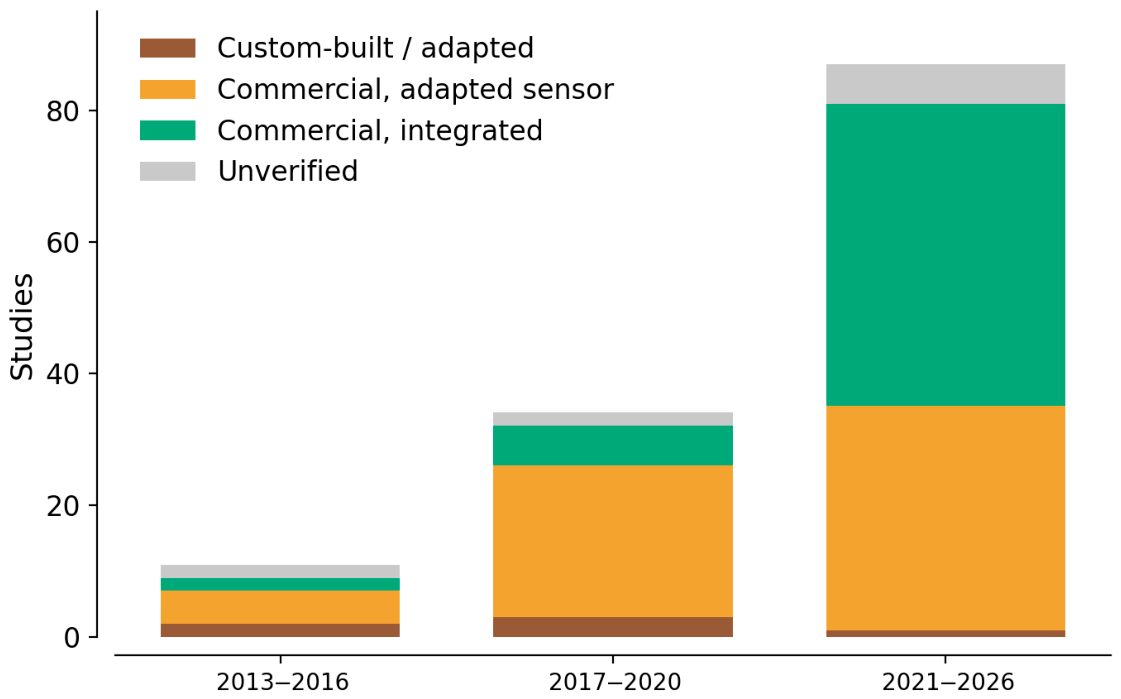
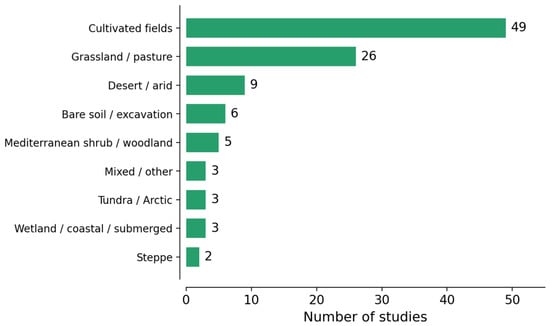
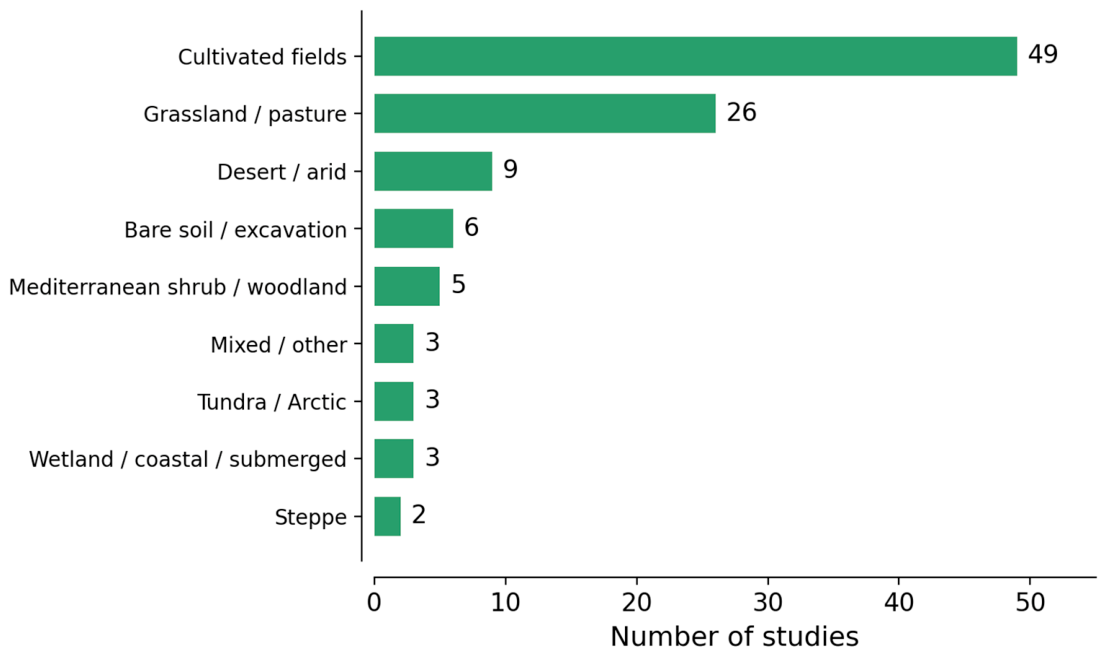
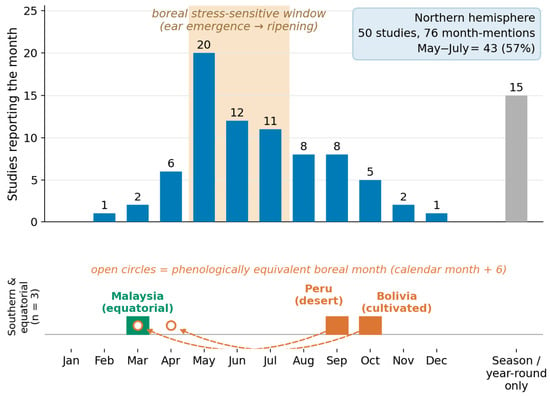
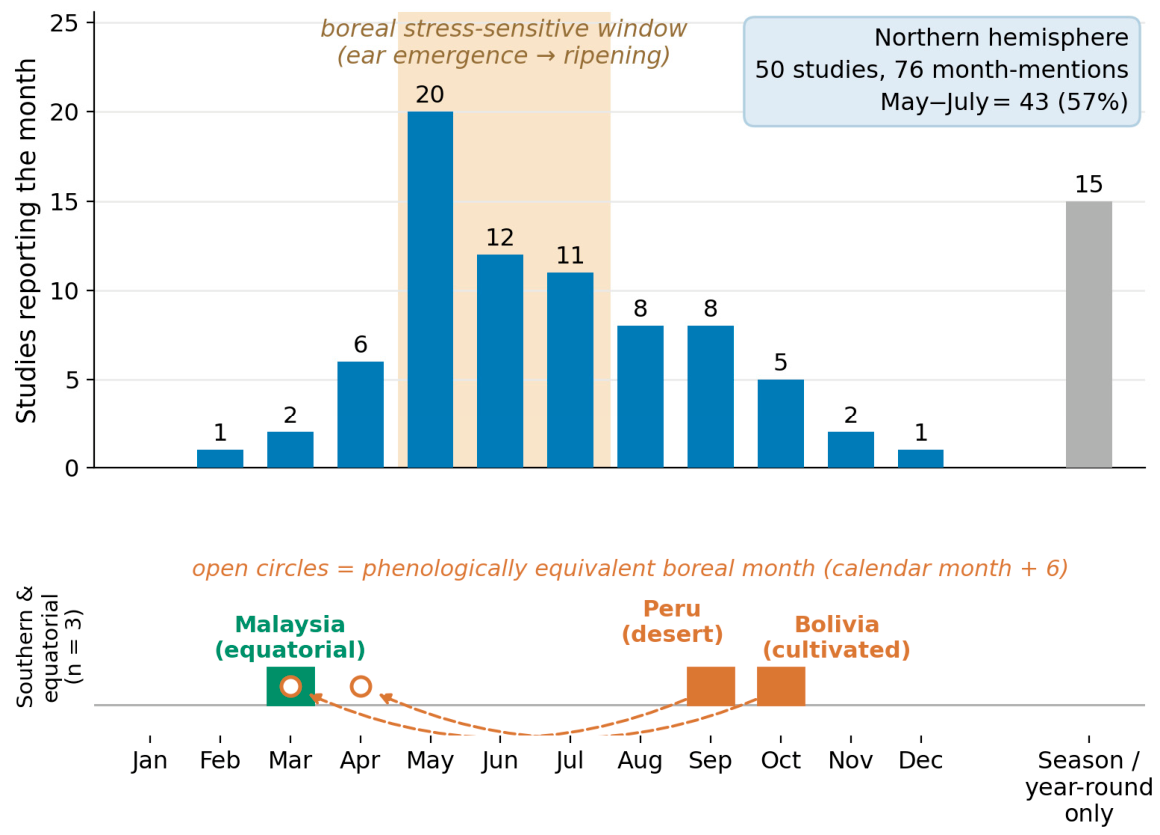
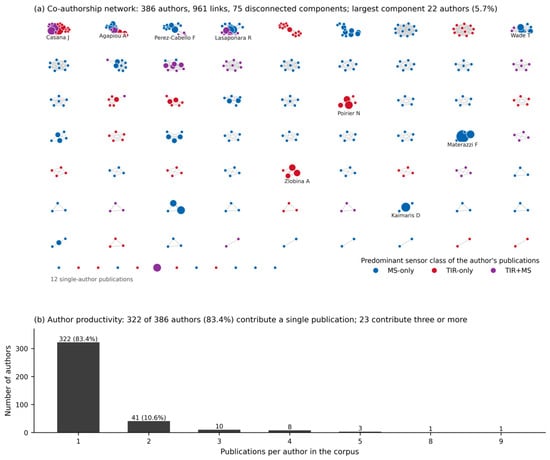
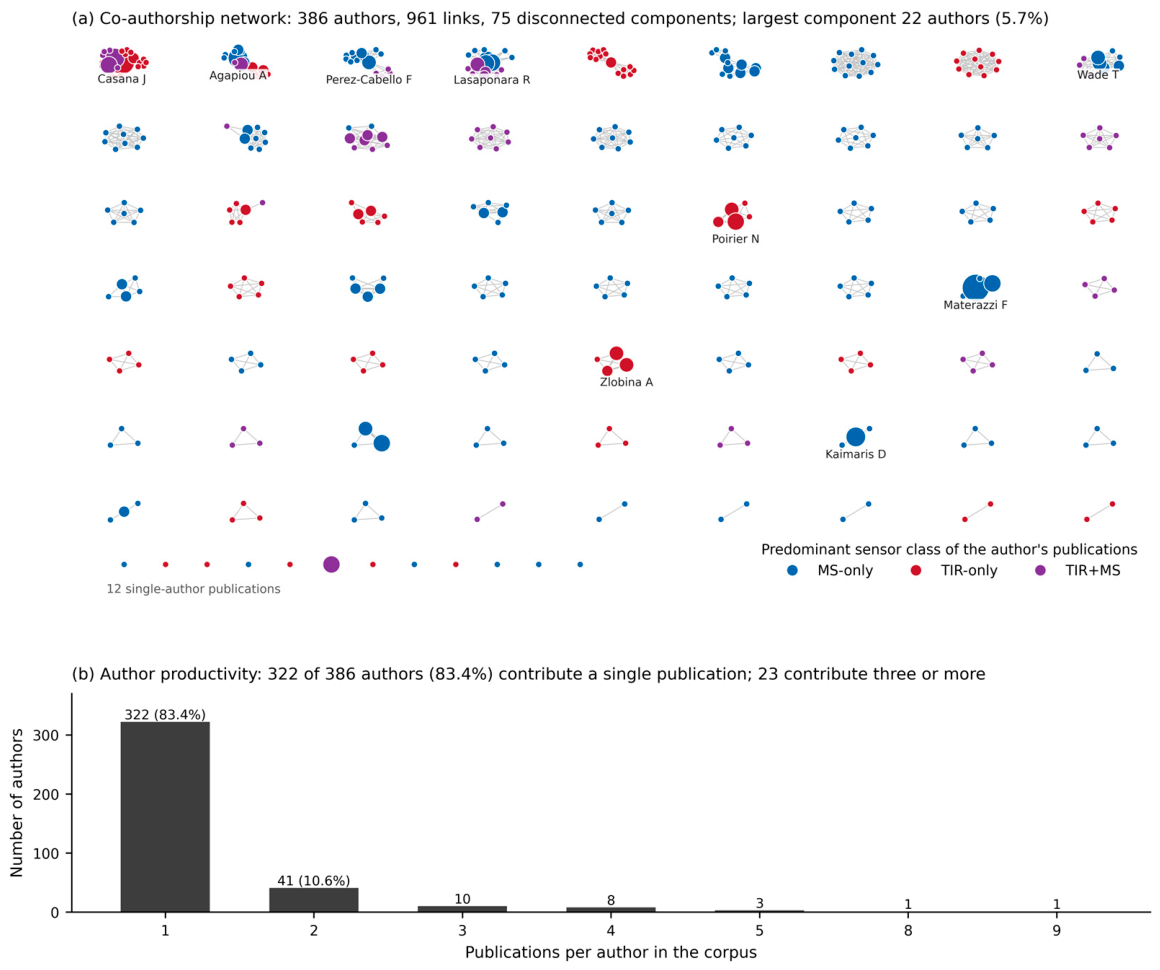
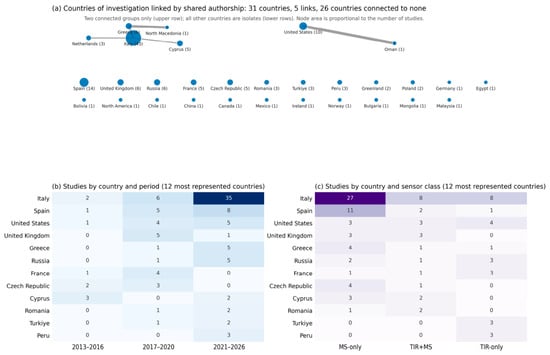
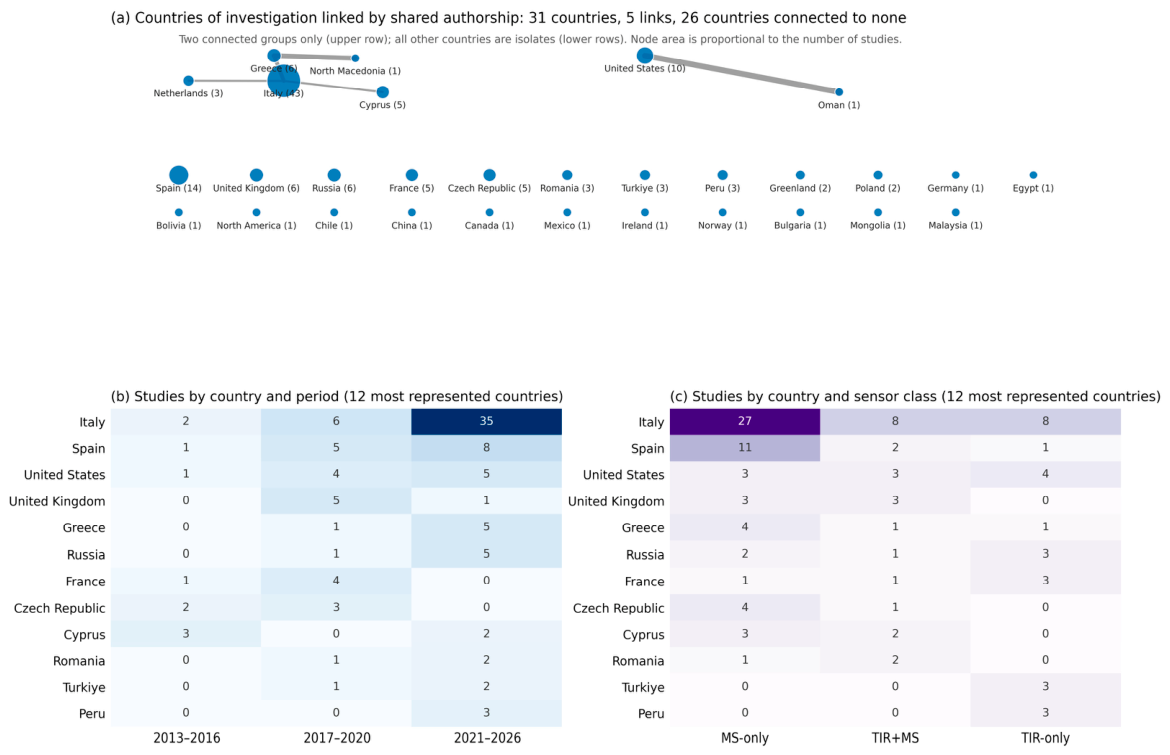

Disclaimer/Publisher’s Note: The statements, opinions and data contained in all publications are solely those of the individual author(s) and contributor(s) and not of MDPI and/or the editor(s). MDPI and/or the editor(s) disclaim responsibility for any injury to people or property resulting from any ideas, methods, instructions or products referred to in the content. |
© 2026 by the author. Licensee MDPI, Basel, Switzerland. This article is an open access article distributed under the terms and conditions of the Creative Commons Attribution (CC BY) license.