


Highlights
What are the main findings?
- In a WRF simulation for spring 2025 (26 March–4 April), the Dagestan summits are 2–3 times drier (PWV 2.8–4.3 mm) than the western Caucasus observatories (≈9.3 mm).
- ERA5 reproduces the temporal behavior of PWV (r = 0.80–0.88) but, owing to its smoothed orography, overestimates PWV over ridges and underestimates it in valleys. Linear regression removes only 17–29% of the bias at the summits.
What are the implications of the main findings?
- PWV estimates and astroweather forecasts calibrated for one Caucasus site cannot be transferred to another without local recalibration. Dzhufudag is a candidate site for the ESMT telescope, pending multi-season verification.
- Reanalysis-based screening of high-mountain sites requires a terrain-height correction or mesoscale downscaling with a grid spacing of about 3 km.
Abstract
Ground-based millimeter and submillimeter astronomy requires detailed astroweather and astroclimatic studies of potential sites in mountain regions. Using the mesoscale WRF model, validated against data from three upper-air stations, we examined the spatiotemporal distribution of precipitable water vapor (PWV), effective height of water vapor, wind field and cloudiness over the Caucasus region for the period from 26 March to 4 April 2025. Three operating observatories—SAO RAS, GAS GAO and Peak Terskol as well as three mountain summits in Dagestan, namely Dzhufudag, Kurapdag and Shunudag, promising for millimeter and submillimeter observations—were considered. The sites fall into two groups differing in the variability in PWV: a western group with values of 9.3 ± 1.9 mm at SAO RAS and GAS GAO (coefficient of variation 20–21%) and an eastern group (Dagestan) with a drier atmosphere ranging from 2.8 ± 1.2 to 4.3 ± 1.6 mm (36–42%). Given the similar values of effective height, the key factors driving the contrast in moisture content are the heights of sites, synoptic advection, and the specific pattern of airflows around local topographic features. The averaged PWV field is strongly shaped by orography: ranging from 4–8 mm along the high-mountain part of the Caucasus Range to 16–20 mm over the lowlands. On the night of 1–2 April 2025, when the regional minimum was observed, PWV fell by 3.7 and 2.7 mm in the western and the eastern group, the contrast between the sectors rose from a factor of 2.1 to a factor of 3.8, and the effective height dropped to 1497 and 1338 m. The driest site, Kurapdag, proved to be the windiest: the mean night-time wind speed there reaches 6.8 m/s against 1.8 m/s at SAO RAS. The comparison with the ERA5 reanalysis showed that the area-mean PWV over the 1 km domain is 10.6 mm in ERA5 and 9.3–9.6 mm in WRF. ERA5 reproduces the temporal behavior of PWV (r = 0.80–0.88), but owing to its smoothed orography it overestimates PWV over the ridges and underestimates it in the valleys. The differences between the WRF domains are largest on passing from a grid spacing of 9 km to 3 km. A linear regression between the ERA5 and WRF fields removes only 17–29% of the discrepancy at the summits, so that recalculating the reanalysis PWV to the summit level requires methods that explicitly account for the difference in terrain height.
1. Introduction
Water vapor is one of the most important greenhouse gases present in the troposphere. It plays a fundamental role in the hydrological cycle, in the radiation balance of the Earth, in the general circulation of the atmosphere and, in particular, in the development of convective systems associated with extreme precipitation [1], the amount of which increases as global warming proceeds. Its distribution in space and time is controlled by atmospheric circulation on a variety of scales, from the microscale to the synoptic scale, which makes its observation by means of conventional meteorological networks a particularly difficult task.
Astronomical observations in the millimeter and submillimeter ranges of the spectrum are limited by the state of the Earth’s atmosphere. One of the principal gases attenuating radiation in the atmosphere is water vapor. The quantitative characteristic of the moisture content of the atmosphere is precipitable water vapor (PWV). PWV is the integrated water vapor content of a vertical atmospheric column expressed as an equivalent layer of liquid water (mm). This quantity determines the transparency of the atmosphere in the infrared, millimeter and submillimeter wavelength ranges [2]. Consequently, the amount of PWV and its variations are regarded as an important indicator of the suitability of a site for the deployment of ground-based millimeter and submillimeter telescopes, along with the number of clear nights, atmospheric stability and the characteristics of optical turbulence [3,4].
Current approaches for the determination of PWV include the use of GNSS observations [5], satellite sounding products (for example, MODIS, AIRS, Sentinel-3) [6,7], assimilated data (ERA5 and MERRA-2) [8,9], and also direct radiometric measurements [10,11]. Each of these methods has limitations in spatial or in temporal resolution, which are especially pronounced in mountainous areas.
The Weather Research and Forecasting (WRF) model [12] has come into wide use for studying the spatiotemporal distribution of PWV. The use of the WRF model makes it possible to reconstruct spatial distributions of PWV with a horizontal resolution finer than 1 km and to estimate their variability in time [13,14,15].
For the Caucasus region, the task of estimating the spatiotemporal distribution of PWV has acquired particular relevance in connection with the implementation of the Eurasian Submillimeter Telescopes (ESMT) project [16] and the development of ground-based millimeter and subterahertz astronomy [10,17,18,19]. In a number of studies [10,18,20,21,22,23], astroclimatic zoning of the region was performed and the main spatial and intra-annual regularities of the PWV distribution were revealed; long-term series of meteorological data are also used to characterize other mountain observatories [24]. According to expedition radiometric measurements [25,26,27], ERA5 reanalysis data (including the analysis of calibrated data) and GNSS observations, the eastern part of the North Caucasus is characterized by a drier and more transparent atmosphere than the western part. At the same time, these estimates rely either on point measurements limited in time and space or on reanalysis data whose horizontal resolution (about 31 km for ERA5 [8]) does not allow the orography of individual summits to be described. The combination of direct absorption measurements [28,29] with mesoscale WRF modeling [30], which makes it possible to overcome this limitation, was previously applied to Peak Khulugaisha in the Eastern Sayan Mountains. The operating astronomical observatories of the Caucasus include the Special Astrophysical Observatory of the Russian Academy of Sciences (SAO RAS), the Kislovodsk Mountain Astronomical Station of the Central (Pulkovo) Astronomical Observatory of the Russian Academy of Sciences (GAS GAO) and the Peak Terskol Observatory; the Dzhufudag, Kurapdag and Shunudag summits in Dagestan are regarded as prospective sites.
In the high mountains of Dagestan, where the candidate summits rise to 3000–3550 m, the reanalysis levels lie well below the summits, and the reanalysis total column water vapor refers to a thicker and moister column. Therefore, in order to pass from reanalysis fields to PWV estimates at particular summits, it appears necessary to establish the relationship between the large-scale and mesoscale distributions of this quantity. In fact, the task reduces to the parameterization of the PWV field by combining reanalysis data with models describing the local variations in this quantity.
In addition to PWV, the vertical distribution of water vapor is characterized by the effective height of water vapor Heff, i.e., the height at which the water vapor content of the overlying atmospheric column decreases by a factor of e (Section 2.4). This quantity can be used as an indicator of the optical depth of the atmosphere above a site [31].
The aim of the present work is the parameterization of the large-scale PWV field over the Caucasus using the mesoscale WRF model for its recalculation from the ERA5 reanalysis data, as well as refining the spatiotemporal distributions of PWV and Heff and comparing the astroweather conditions at the operating and prospective sites. The analysis is based on a ten-day simulation of the transitional spring season (from 26 March to 4 April 2025). Thus, the conclusions apply only to this season and are considered the first step towards a comprehensive assessment.
2. Materials and Methods
2.1. Study Area and Observation Sites
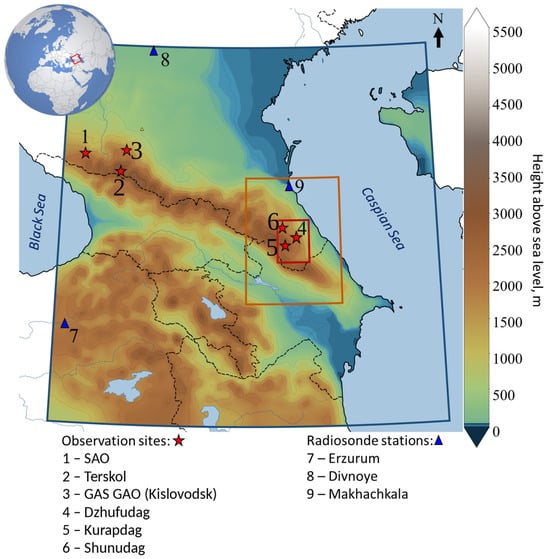
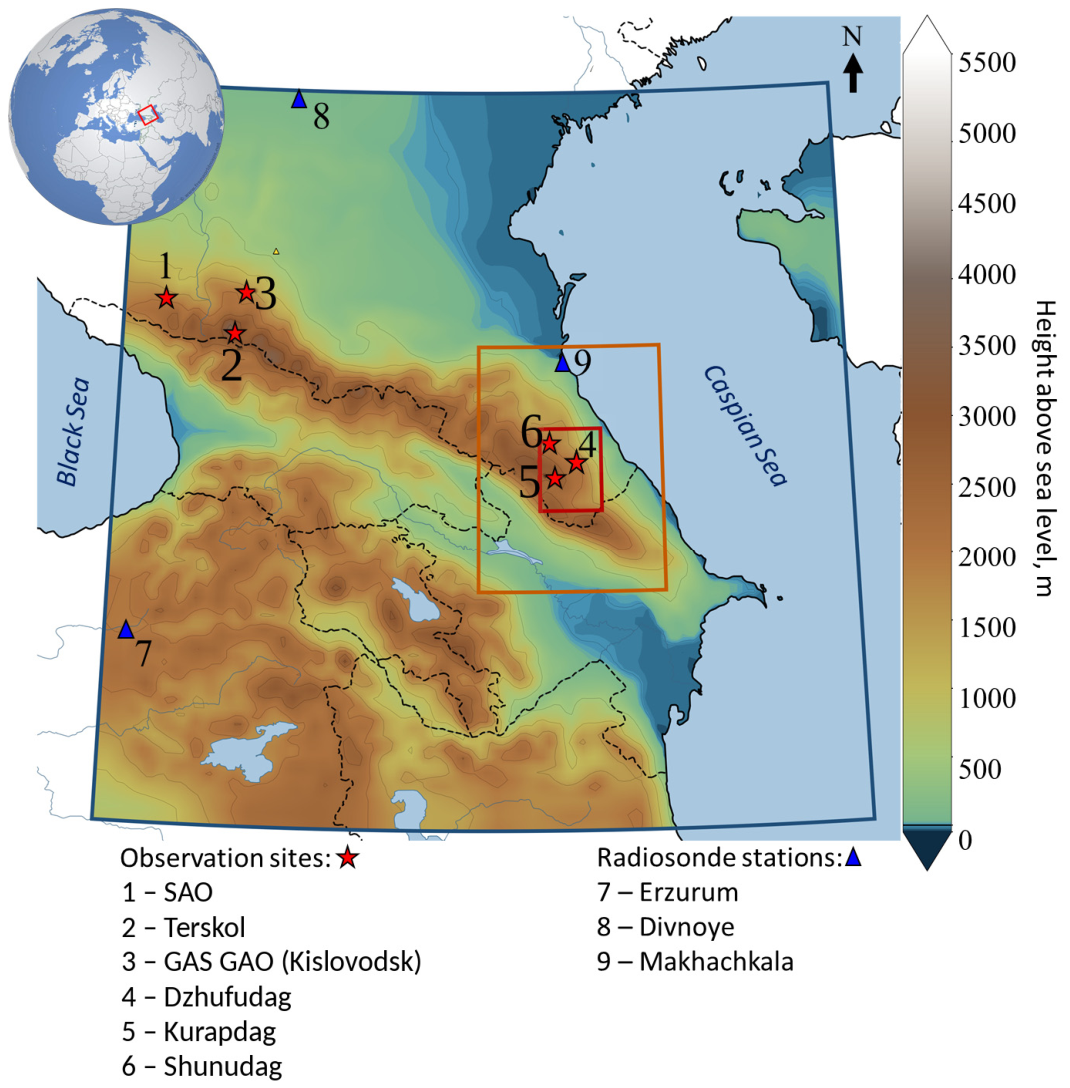
The Caucasus extends from north-west to south-east between the Black Sea and the Caspian Sea. The Caucasus Range forms a pronounced orographic barrier from 3000 to 5000 m in height. This substantially affects the regional circulation of the atmosphere and the spatial distribution of moisture. In the present study, six sites were considered as observation points: SAO, Terskol, GAS GAO, Dzhufudag, Kurapdag and Shunudag. These locations and the coordinates of sites are given in Figure 1 and in Table 1.
Figure 1.
Study area: terrain (color, height above sea level) and boundaries of the WRF domains d01 (9 km, blue frame), d02 (3 km, orange frame) and d03 (1 km, red frame). Stars denote the astronomical sites (1—SAO, 2—Peak Terskol, 3—GAS GAO, 4—Dzhufudag, 5—Kurapdag, 6—Shunudag), and triangles denote the upper-air stations (7—Erzurum, 8—Divnoye, 9—Makhachkala). The inset shows the location of the study area.
Table 1.
Coordinates and altitudes of the reference stations.
The SAO and GAS GAO sites are located in the western part of chosen region at comparable altitudes (a.s.l.) (Table 1). Terskol is situated in the central part, in the area of Mount Elbrus, at the altitude of 3127 m a.s.l. The Dzhufudag, Kurapdag and Shunudag sites are located in the eastern part of region on the spurs of the Main Caucasus Range. Dzhufudag can be considered a promising site for deploying a millimeter/submillimeter telescope within the Eurasian Submillimeter Telescopes (ESMT) project [16].
The Greater Caucasus extends for more than 1100 km from the Black Sea coast to the Caspian Sea coast. The western part of the region is open to the inflow of moist air masses from the Black Sea and the eastern Mediterranean, whereas the eastern part is remote from these moisture sources, shielded from the westerly transport by mountain ridges and has a more continental and arid climate: the annual precipitation varies from 4000 mm on the south-western slopes of the Greater Caucasus to 200 mm on the eastern plains. The sites of the western group are located on the northern slope of the Greater Caucasus: SAO and GAS GAO at comparable altitudes of about 2100 m, and Peak Terskol in its central part, in the Elbrus area, at an altitude of 3127 m. The summits of the eastern group are located on the spurs of the Main Caucasus Range in southern Dagestan, 55–85 km from the Caspian Sea coast. The distance between the sites of the western and eastern groups is 410–540 km.
2.2. Parameterization and WRF Model Simulations
Numerical simulation of the three-dimensional fields of meteorological variables over the chosen area was performed using the mesoscale non-hydrostatic Weather Research and Forecasting (WRF) model, version 4.5.1 (NCAR, Boulder, CO, USA) [12]. The simulation was carried out for the period from 26 March to 4 April 2025. The choice of this period was governed by two circumstances. First, early spring is a transitional season between the winter minimum and the summer maximum of the moisture content in the atmosphere over the North Caucasus. According to [23,32], the median PWV value over the region increases from 3–4 mm in February to more than 10 mm in the summer months, and it is precisely in March–April that the moisture regime changes from favorable for infrared observations (PWV < 5 mm) to satisfactory (5–10 mm). The selected interval therefore reflects the averaged conditions of the region in the transitional season. Second, during the simulation period pronounced synoptic transitions with alternating dry continental and moist air masses were observed over the study area. This provided both minima and maxima in the PWV variations, which is necessary for assessing the applicability of the model in determining PWV under the conditions of the Caucasus. At the same time, a ten-day spring simulation cannot represent the annual cycle of moisture content and wind over the region. All quantitative estimates obtained below (PWV levels, coefficients of variation, site ranking, values of the effective height and the wind regime) are therefore valid only for the spring transitional season.
The computational area consisted of three mutually nested domains (Figure 1). The horizontal resolution of domains d01, d02 and d03 was 9, 3 and 1 km, respectively. The outer domain d01 covered the entire study area, including the six sites under consideration. The vertical grid contained 77 staggered η-levels, that is, 76 mass levels on which the prognostic variables are carried, with the upper boundary of the computation at 20 hPa. Operational analysis data of the Global Forecast System (GFS) global model with a spatial resolution of 0.25° × 0.25° [33] were used as initial and boundary conditions.
Taking into account the specific features of the meteorological data and of the terrain within the study area, we used the physical process parameterization schemes listed in Table 2. The choice of this combination of schemes was substantiated and applied in [30,34,35] for mountainous areas with complex orography and is retained in the present study in order to ensure continuity of the results and comparability of the estimates.
Table 2.
Physical process parameterization schemes of the WRF model.
In refs. [30,34,35], the physical process parameterization schemes were selected on the basis of a comparison of the simulated vertical profiles with radiosonde data. The choice of the Yonsei University (YSU) scheme [36] is determined by its non-local closure, which takes into account the entrainment of the mixed layer at its upper boundary. It has been established that it is precisely this scheme that most adequately reproduces the local circulation of air, including mountain–valley flows [34,35], which under the strongly dissected relief of the Caucasus govern the distribution of water vapor in the lower layer of the atmosphere.
The Revised MM5 similarity surface-layer scheme [37], based on Monin–Obukhov similarity theory, contains refined similarity functions, which ensures the description of the surface layer over the entire range of thermal stability, including conditions of strong stable stratification, under which the earlier formulation reached the limiting values of the friction velocity and of the integral similarity functions. In ref. [37], the scheme was tested jointly with the YSU scheme under conditions of complex terrain and showed an improvement in the reproduction of the diurnal amplitude of near-surface meteorological variables, primarily of the air temperature at a height of 2 m.
The Thompson microphysics scheme [38] predicts the mixing ratios of cloud water, rain, cloud ice, snow and graupel, as well as the number concentration of cloud ice particles. The snow size distribution is specified as depending simultaneously on the ice water content and on temperature, and the density of the snow particles is inversely proportional to their diameter. Allowance for these features is important for high-mountain conditions with mixed-phase cloudiness.
The Kain–Fritsch cumulus convection scheme [39] is a parameterization based on the mass flux, with an entraining–detraining plume model and a closure in terms of the convective available potential energy. It is applied to domains whose grid spacing exceeds the scale of the explicit resolution of convection: as the author of the scheme notes, at a grid spacing of the order of 1–10 km, the scales represented by conventional convection parameterizations become inconsistent with the processes resolved by the model grid [39].
The transfer of shortwave radiation is computed by the Dudhia scheme [40], and that of longwave radiation by the Rapid Radiative Transfer Model (RRTM) [41]; this pair of schemes provides acceptable accuracy of the radiation balance at moderate computational cost and is traditionally applied jointly. The RUC LSM [42], which has nine computational levels in the soil layer down to 3 m and an improved description of albedo, was adopted as the land surface model.
2.3. Calculation of PWV
PWV at each grid node was calculated by integrating the humidity over the pressure profile p according to the relation:
where p0 is the surface pressure, Pa; ptop is the pressure at the upper boundary of the model, Pa; q is the specific humidity, kg/kg; g is the acceleration due to gravity, taken to be constant and equal to the standard value of 9.80665 m/s2. The water vapor mixing ratio r (the QVAPOR variable of the WRF output) was used instead of the specific humidity; the relative difference between these quantities, (r − q)/q = r, does not exceed 0.4–0.8% under the conditions of the region and can therefore be neglected. The integration was performed over all 76 mass levels of the model, from the surface to the upper boundary. PWV calculated by Equation (1) has the dimension of kg/m2 and is numerically equal to the depth of the liquid water layer in millimeters, since a column mass of 1 kg/m2 corresponds to a water layer 1 mm thick at a density of 1000 kg/m3.
2.4. Effective Height of Water Vapor Heff
To assess the suitability of conditions for astronomical observations, it is important to determine the effective height of water vapor (Heff). In contrast to the water vapor scale height Hw, which describes the decrease in absolute humidity with height [43], Heff characterizes the decrease in the water vapor content of the entire overlying atmospheric column [30] and is defined by the relation:
where PWVz is the water vapor content of the atmospheric column above level z, mm; PWV0 is the water vapor content of the column above the lowest computational level of the model z0, mm; Δz is the thickness of the layer above z0, m. The level z is chosen from the condition PWVz = PWV0/e, i.e., Heff is the height above z0 at which the water vapor content of the overlying column decreases by a factor of e.
2.5. Calculation of NWR
In order to reveal the relationship between the moisture content of the atmosphere and the near-surface wind regime, the nonparametric wind regression (NWR) method was used [44,45]. The method makes it possible to establish at which wind directions and speeds increased or reduced PWV values are observed at a site, and thus to identify the directions of advection of moist and dry air masses. Unlike averaging over direction sectors, NWR provides a continuous estimate smoothed simultaneously in wind direction and speed. The calculations were performed with the polarPlot function of the openair package (R language; R Foundation for Statistical Computing, Vienna, Austria) using Gaussian smoothing kernels. The PWV estimate for direction θ and speed u is calculated by Equations (3) and (4):
where E(C|θ, u) is the conditional mean PWV for wind direction θ and speed u, i.e., the smoothed PWV estimate for the given combination of direction and speed, mm; Ci is the PWV value at the i-th time, mm; Wi and Ui are the wind direction (deg) and speed (m/s) at the same time; N is the number of times; K1 and K2 are the smoothing kernels in wind direction and speed, respectively. Both kernels have the Gaussian form (4) and differ only in their bandwidth, σ in direction and h in speed; the argument x in (4) is (θ − Wi)/σ or (u − Ui)/h. The default parameter values of the openair package were used: σ = 5° and h = 1.5 m/s. The analysis was performed separately for each site using the night-time hours (20:00–04:00 local time, UTC+3) of the nine nights of the simulation period (N = 72, i.e., eight hourly values per night). With such a sample size, the NWR fields characterize the relationship between PWV and wind qualitatively, and the estimates for rarely observed combinations of wind direction and speed (at the periphery of the polar plots) are the least reliable.
2.6. Cross-Scale Comparison of the ERA5 and WRF PWV Fields
To establish the relationship between the large-scale and local mesoscale PWV fields, the hourly PWV fields calculated by Equation (1) in each of the three domains and the total column water vapor from the ERA5 reanalysis with a spatial resolution of 0.25° [8] for the same period were used (205 hourly outputs; the first 12 h of the simulation were excluded as the model spin-up period).
The ERA5 fields and the fields of the outer WRF domains were interpolated bilinearly to the nodes of the finer grid. For a quantitative comparison of the fields, the ratio of the period-mean PWV values, the mean bias, the root-mean-square error (RMSE) and the Pearson correlation coefficient (r) were calculated at each land node from the series of N hourly values:
where xi is the PWV from ERA5 or from the coarser WRF domain and yi is the PWV in the finer domain at the same time, in mm. The bias characterizes the systematic overestimation (bias > 0) or underestimation (bias < 0) of PWV in the coarser field. RMSE describes the total discrepancy between the fields and includes both the systematic and the random components. The correlation coefficient characterizes the consistency of the temporal behavior of PWV irrespective of its level. The same metrics were also calculated for the pooled sample of all nodes and times.
3. Results and Discussion
3.1. Validation of the WRF Model Against Radiosonde Data
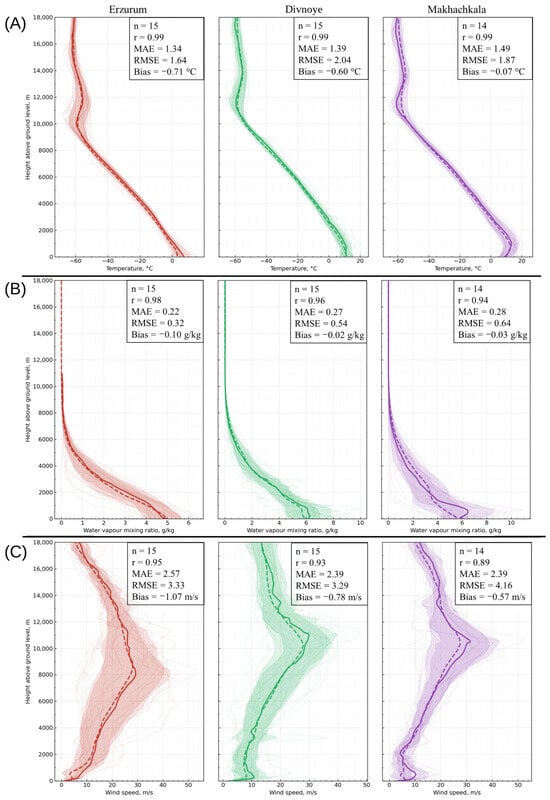
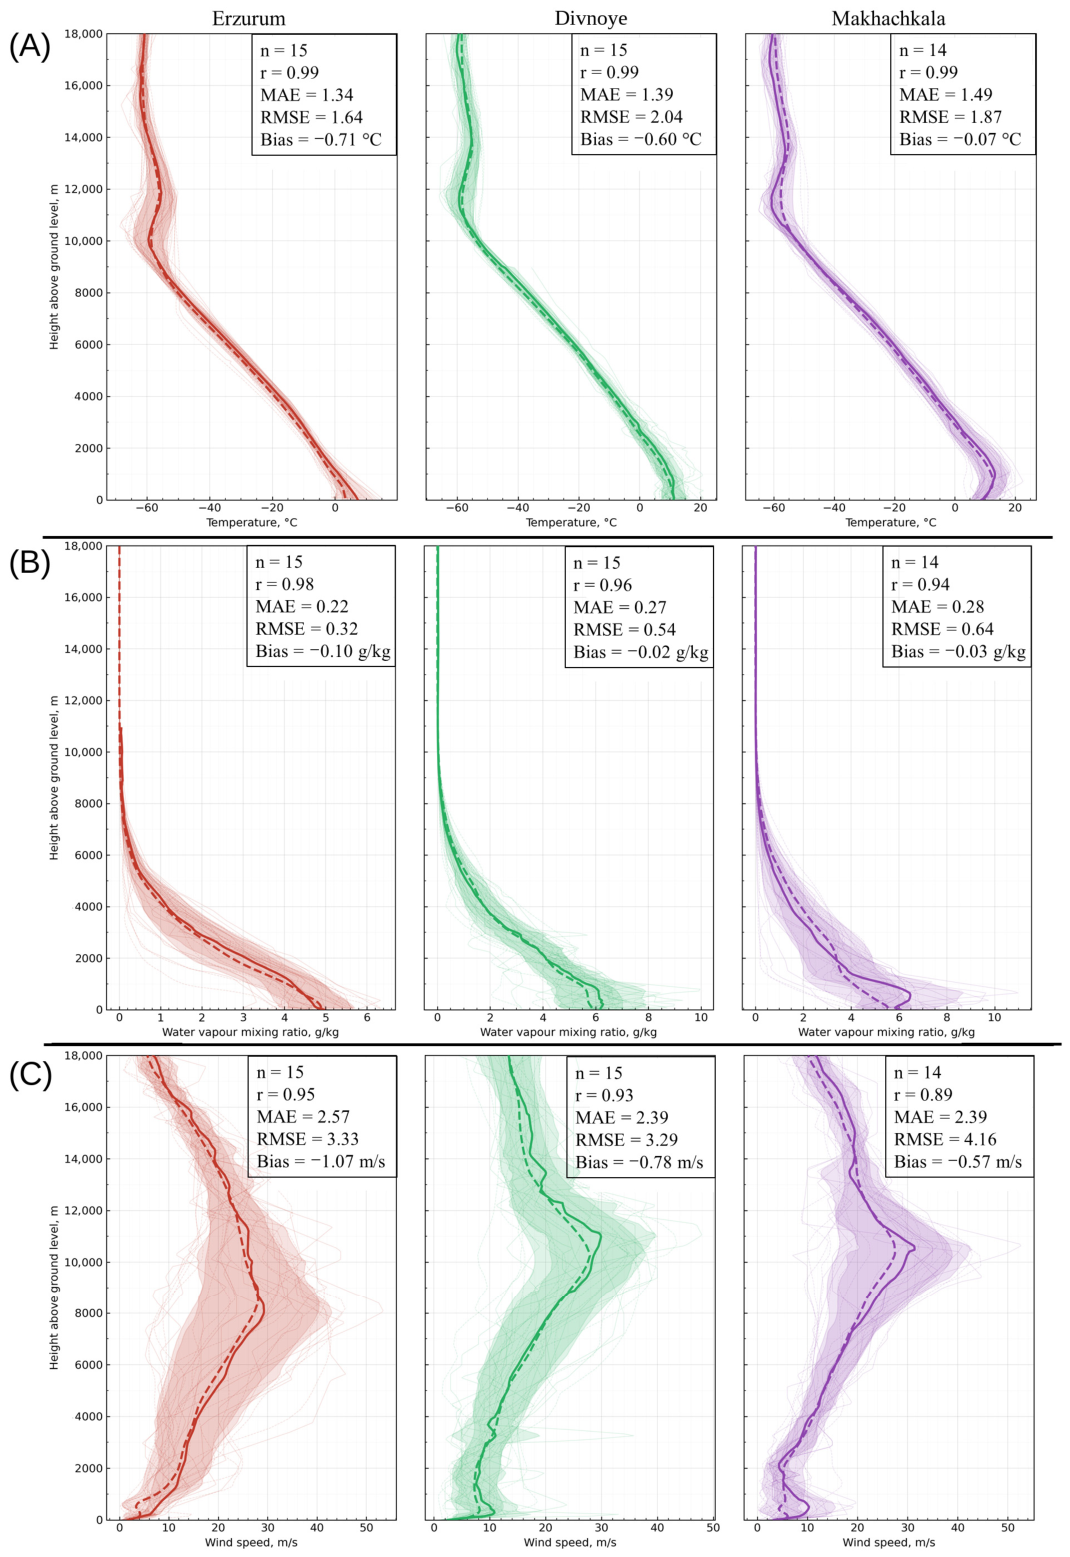
The accuracy with which the WRF model reproduces the vertical profiles of temperature, water vapor mixing ratio and wind speed magnitude was assessed against data from three upper-air stations located within the study domain: Erzurum (39.93° N, 41.23° E, 1861 m above sea level), Divnoye (45.92° N, 43.34° E, 87 m) and Makhachkala (43.01° N, 47.47° E, 2 m). The comparison was performed for all radiosonde launch times over the reference period 26 March–4 April 2025. The upper-air stations were selected on the basis of their position relative to the astronomical sites under study and of the availability of continuous sounding series over the simulation period (Figure 2).
Figure 2.
Vertical profiles of (A) air temperature, (B) water vapor mixing ratio and (C) wind speed magnitude from the Erzurum, Divnoye and Makhachkala upper-air stations and from the WRF simulation for the period from 26 March to 4 April 2025. Thick solid lines are the mean radiosonde profiles, thick dashed lines are the mean WRF profiles and thin lines are individual profiles. The boxes give the number of compared launches n, the Pearson correlation coefficient r, MAE, RMSE and the bias.
In all cases, r is the Pearson correlation coefficient characterizing the consistency of the shape of the simulated and observed profiles. Since a high correlation is compatible both with a substantial systematic bias and with large random deviations, the quality of the reproduction of the profiles was assessed jointly from r, the bias, RMSE and the mean absolute error (MAE).
As demonstrated in Figure 2A, the best agreement is observed for the air temperature profiles. At all upper-air stations the correlation coefficient amounted to r = 0.99, which reflects an adequate model reproduction of the vertical temperature gradient. The root-mean-square error (RMSE) varied in the range from 1.64 to 2.04 °C, and the mean absolute error (MAE) from 1.34 to 1.49 °C. The systematic error (bias) indicates an underestimation of the model temperature by 0.6–0.7 °C for the Erzurum and Divnoye stations. The largest deviation is concentrated in the atmospheric boundary layer (up to 1.5–2 km) and in the tropopause (10–12 km). In the free troposphere the discrepancies are not substantial, and the model reproduces the actual values with an adequate degree of reliability.
The water vapor mixing ratio, like temperature, is reproduced with a high degree of reliability. The correlation coefficient equals 0.98, 0.96 and 0.94 for the Erzurum, Divnoye and Makhachkala stations, respectively (Figure 2B). RMSE varied in the range from 0.32 to 0.64 g/kg, and the mean absolute error in the range from 0.22 to 0.28 g/kg. The systematic error is negative at all stations and varied in the range from −0.10 to −0.02 g/kg; the main contribution to the error is made by the lower, most moisture-saturated layer from 0 to 4 km. The small values of the humidity errors are of fundamental importance, since it is precisely this parameter that determines the quality of the subsequent model estimates of PWV in the atmosphere.
The largest discrepancies between the simulated values and the upper-air station data were noted for the wind speed magnitude (Figure 2C), which is typical of mesoscale modeling over complex terrain. The Pearson correlation coefficient is 0.89–0.95, i.e., the shape of the vertical wind speed profile is reproduced well. However, a high correlation does not imply a small error: RMSE reaches 3.29–4.16 m/s and MAE 2.39–2.57 m/s, and the bias is negative at all stations (from −1.07 to −0.57 m/s). Thus, with the parameterization schemes used, the model underestimates the wind speed on average, the largest discrepancy occurring in the region of the tropospheric jet stream (8–12 km).
In addition to the profiles, PWV calculated from the radiosonde data was compared with the WRF PWV at the nearest grid node for each launch time (00 and 12 UTC). For 44 synchronous pairs at the three stations, r = 0.93, the bias is −0.8 mm and RMSE is 2.1 mm; two launches at Makhachkala (12 UTC on 30 March and 00 UTC on 1 April), at which the radiosonde PWV differs sharply from the adjacent launches, were excluded (with all 46 pairs, r = 0.75 and RMSE = 4.0 mm). The model also reproduces abrupt changes in the moisture content: at Erzurum, during the passage of the dry air mass, the radiosonde PWV decreased from 13.1 mm (00 UTC on 31 March) to 7.1 and 6.1 mm (00 and 12 UTC on 1 April) and recovered to 14.7 mm by 00 UTC on 2 April, whereas WRF gives 12.3, 6.2, 4.7 and 12.5 mm at the same times.
3.2. Temporal Variability in PWV
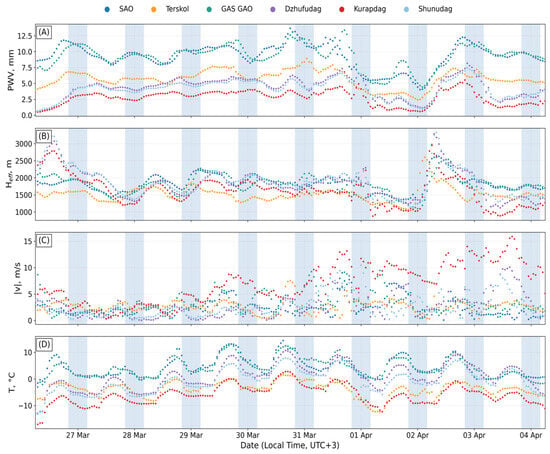
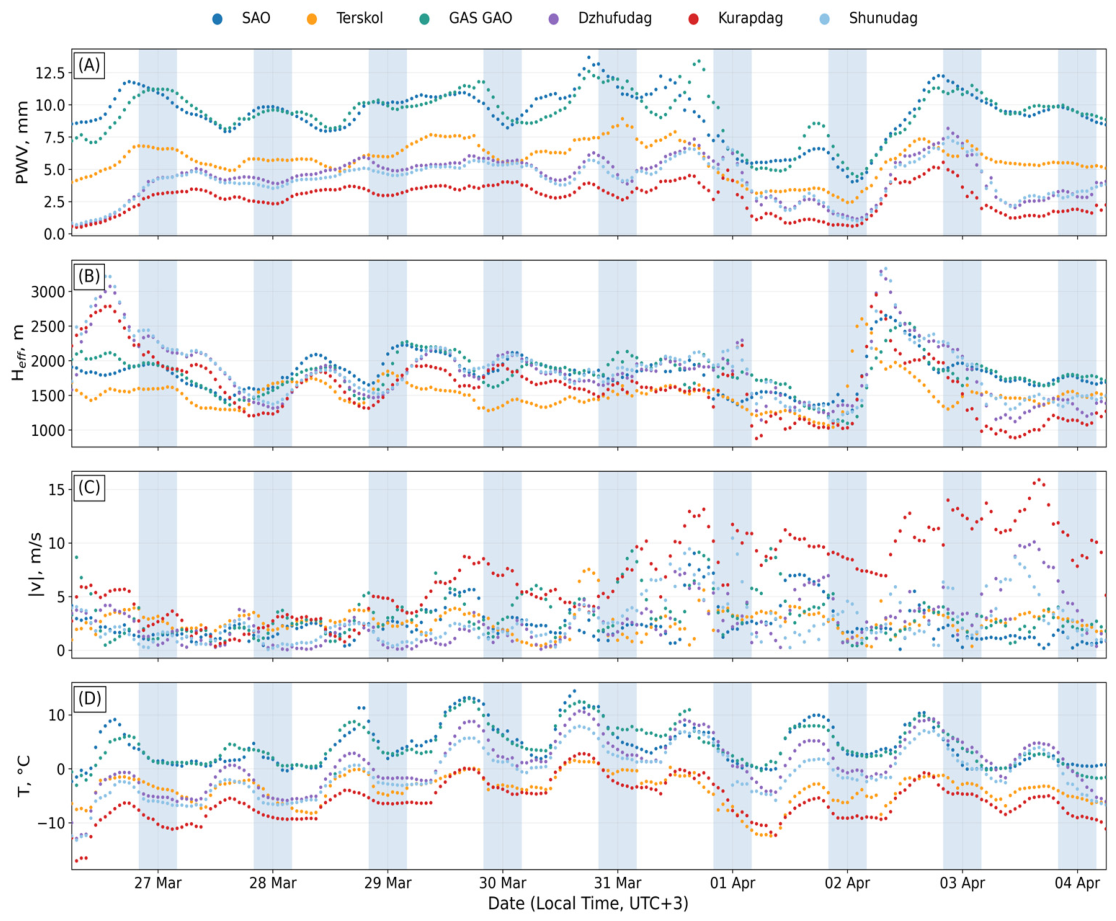
Figure 3 shows the temporal variability in the hourly mean values of PWV, Heff, wind speed and air temperature at the selected sites in the Caucasus region. It can be seen from the plot that the highest mean PWV values are characteristic of the sites located in the western part of the region. Hereafter, the PWV values at the sites were obtained at the nearest node of domain d01 and reduced from the model terrain height to the actual site elevation using the effective height of water vapor Heff defined by Equation (2). The mean PWV content at the SAO and GAS GAO stations over the simulation period amounted to 9.3 ± 1.9 mm (mean ± σ), with coefficients of variation of 20 and 21%, respectively. The mean PWV content at Peak Terskol, located farther to the east (Figure 1), is lower by a factor of 1.6 (5.7 ± 1.3 mm), which is associated with the greater altitude of the site above sea level (3127 m). The sites located in the east of the region are characterized by a lower level of PWV but by a greater non-uniformity of the data. The coefficient of variation varied in the range from 36 to 42%. The mean PWV value amounted to 4.3 ± 1.6 mm at the Dzhufudag site, 4.1 ± 1.5 mm at Shunudag and 2.8 ± 1.2 mm at Kurapdag. The diurnal variation in PWV is weakly pronounced. The difference between the mean daytime and night-time values does not exceed 0.6 mm (for SAO), and for the majority of the sites it lies in the range from 0.1 to 0.4 mm.
Figure 3.
Hourly values of (A) PWV reduced to the actual site elevations (see text); (B) the effective height of water vapor Heff; (C) the wind speed magnitude at a height of 10 m; (D) air temperature at the SAO, Terskol, GAS GAO, Dzhufudag, Kurapdag and Shunudag sites from WRF domain d01 for 26 March–4 April 2025. The night-time intervals (20:00–04:00 local time, UTC+3) are shaded.
The structure of the temporal variability of PWV at the sites is non-uniform. Analysis of Figure 3A makes it possible to distinguish two groups: the western group (SAO, Terskol, GAS GAO) and the eastern group (Dzhufudag, Kurapdag, Shunudag). The correlation coefficient for the western group is on average r = 0.86, and for the eastern group r = 0.96. The consistency of the PWV variations between the groups is substantially lower (r = 0.59), which indicates the existence of different pathways of water vapor supply to the western and to the eastern sector of the Caucasus. In spite of this, a regional PWV minimum is observed simultaneously at all sites on 1 April. The fact that this phenomenon encompasses both the western and the eastern sites indicates its synoptic scale, and it is caused by the advection of a dry air mass from the southerly direction. This is confirmed by the radiosonde data at the Erzurum station, located 400 km to the south-west of the study region (Figure 1). On 1 April at 15:00 local time (UTC+3), the PWV level at this station decreased to 6–7 mm, the decrease occurring earlier than at the Caucasian sites. This indicates advective transport of the air mass from the southerly direction.
In contrast to PWV, the effective height of water vapor (Figure 3B) varied between the sites within a narrow range. The mean values varied from 1500 to 1900 m. The smallest Heff value was obtained for Peak Terskol (1518 ± 225 m) and the largest for Peak Shunudag (1877 ± 432 m). The lowest values of the effective height were noted on 1 April, on the day of the regional PWV minimum. When the moist air mass returned on 2 April, Heff, in contrast, reached a maximum (2000–2380 m, with individual values up to 3330 m).
Analysis of the wind speed field at a height of 10 m reveals that one site stands out sharply. The estimates given here were obtained over all computation times; the values averaged over the night-time hours only are given in Section 3.4. At the majority of the sites, the mean speed is similar and varies within the limits from 2.6 to 3.2 m/s. The lowest wind speed was recorded at SAO: 2.37 ± 1.69 m/s. The highest wind speed was noted at the Kurapdag site: 6.98 ± 3.76 m/s, with individual values up to 15.9 m/s, which is associated with the formation of intense orographic air currents as the flow passes around the mountains. This is an important observation, since the site with the lowest mean PWV value proves to be simultaneously the windiest: in fact, for this site it is the physical features of the formation of a local area with low PWV values against a background of strong near-surface winds that are of interest.
The above values of the wind speed at a height of 10 m are model estimates. According to the comparison with the radiosonde data (Section 3.1), WRF underestimates the wind speed on average (bias from −1.07 to −0.57 m/s), and the largest discrepancies in the profiles occur in the boundary layer up to 1.5–2 km. However, the simulated wind speed values near the Earth’s surface should not be considered as actual wind speed values at weather stations. They are used only for relative comparison of weather stations with each other. If we assume that the systematic error of the model is the same for all weather stations, then such a comparison makes it possible to identify the windiest location in the region under study, while the absolute wind load on the instrument must be determined based on on-site measurement results.
3.3. Analysis of the Sources of PWV by the NWR Method
In order to reveal the role of the wind regime in the variation in PWV, the nonparametric wind regression (NWR) method described in Section 2.5 was used. This made it possible to distinguish, for each site, the characteristic directions of water vapor advection into the lower layer of the atmosphere during the night-time periods of 26 March–4 April 2025.
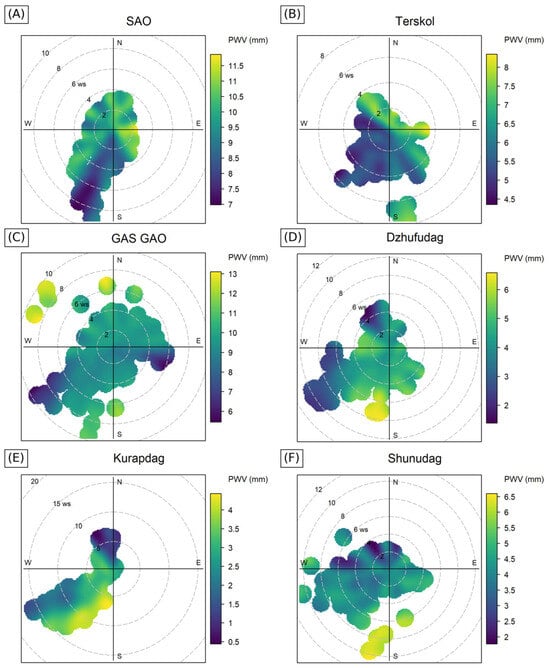
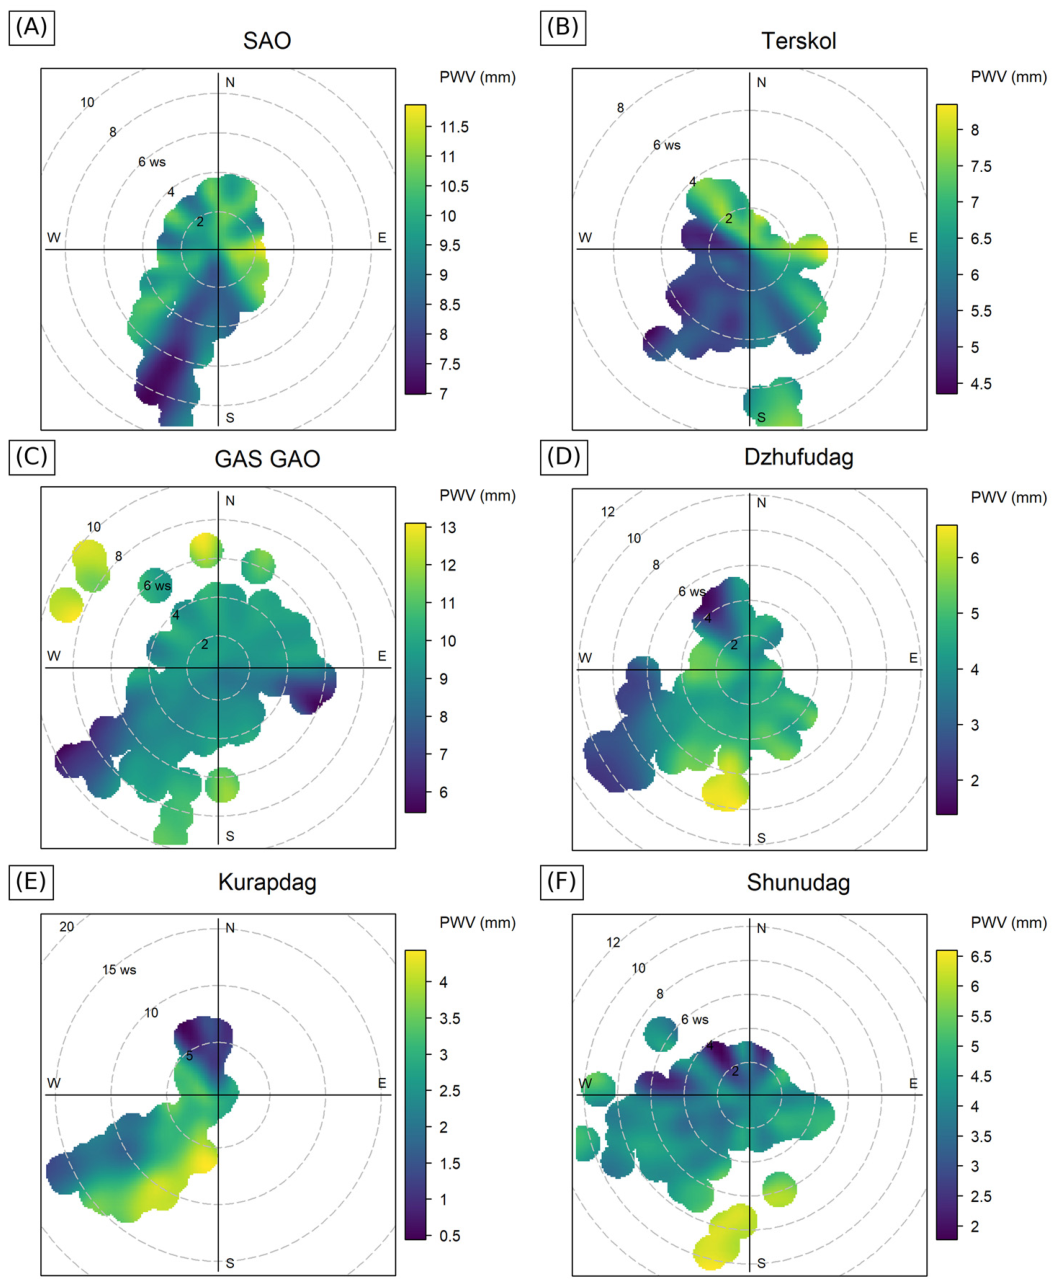
For SAO, the highest PWV values (11–11.6 mm) were recorded under winds of easterly direction with a speed of 2–3 m/s. The lowest PWV levels, in contrast, were noted under winds of the south-westerly sector. At the same time, as can be seen from Figure 4A, an inverse dependence of PWV on the wind speed magnitude can be traced.
Figure 4.
NWR polar plots of PWV for the sites (A) SAO; (B) Terskol; (C) GAS GAO; (D) Dzhufudag; (E) Kurapdag; (F) Shunudag for the night-time hours (20:00–04:00 local time, UTC+3) of 26 March–4 April 2025. The polar angle is the direction from which the wind blows; the radius is the wind speed at a height of 10 m, m/s (ws); the color is the smoothed PWV value, mm. The color scales differ between the sites.
A similar distribution pattern is observed at the Terskol site (Figure 4B). Higher PWV values are noted under winds of the northerly and easterly sectors, with a maximum under an easterly wind of 2–4 m/s, which corresponds to an inflow of moister air masses under conditions of a weak baric field. When winds of the south-westerly sector arise, the PWV values decrease, which is consistent with the regional character of the south-westerly advective transport also noted at the other sites of the western group.
GAS GAO is characterized by a more uniform distribution. PWV maxima are noted under strong winds of north-westerly direction (with speeds from 6 to 10 m/s); such cases, however, are isolated. At GAS GAO the lowest PWV values were recorded under strong south-westerly winds exceeding 6 m/s (Figure 4C). This is associated with the large-scale synoptic advection of a dry air mass.
A different pattern is traced at the sites of the eastern group (Figure 4D–F). The highest PWV values at Dzhufudag, Kurapdag and Shunudag are associated with winds of the south-westerly sector and amount to 4–6 mm, i.e., they are close to the values observed at the western sites under the same wind direction, where they correspond to minima (Figure 4A–C). Thus, the south-westerly transport is accompanied by PWV anomalies of opposite sign relative to the background of the two sectors: negative in the west, where the background moisture content is higher, and positive in the east, where it is lower. It may be assumed that this is related to the different transport pathways: the air reaches the western sites after crossing the Main Caucasus Range, whereas it reaches the eastern sites over Transcaucasia. The physical mechanism behind this difference appears to be related to the orographic transformation of the air mass. On its way to the western locations, the southwestern flow crosses the Main Caucasus Range, as a result of which part of the moisture falls as precipitation on the windward southern slopes, where the annual precipitation total reaches a regional maximum, while the descending motion on the leeward side leads to additional drying of the air. The same flow reaches the eastern locations via Transcaucasia, without crossing the highest part of the range, and replaces the drier continental air.
The wind speeds at the sites of the eastern group are noticeably higher and reach their largest values at Kurapdag, the highest (3553 m) and simultaneously the driest of the sites considered. The lowest PWV values at all three eastern sites are associated with winds of the north-westerly sector at speeds of 4–8 m/s, corresponding to the outflow of dry continental air.
On the whole, the NWR analysis performed confirms the high spatial non-uniformity of the PWV distribution over the North Caucasus and the difference in the mechanisms of formation of the precipitable water vapor fields. A practical conclusion follows from this: correct estimates of the moisture content for a particular summit require either in situ observations directly at the site or the application of special methods for correcting atmospheric characteristics with a high spatial resolution, since reanalysis data averaged over a certain area smooth out the differences between the sites. From this, it follows, firstly, that under a south-westerly transfer, astro-weather forecasts for the two sectors diverge: observation conditions improve in the west and deteriorate in the east. Secondly, despite the generally positive correlation of PWV between the sectors (r = 0.59), anomalies of the opposite sign reduce the probability of simultaneously unfavorable conditions at the western and eastern sites. According to the model, a distributed configuration of instruments (for example, a prototype in the western sector and the main ESMT telescope in Dagestan) can increase the total time suitable for observations in the region.
3.4. Simulation of the Spatial Fields of PWV, Wind and Cloudiness over the Caucasus Region
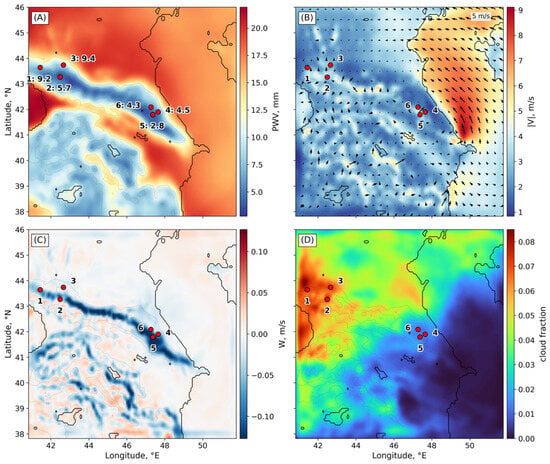
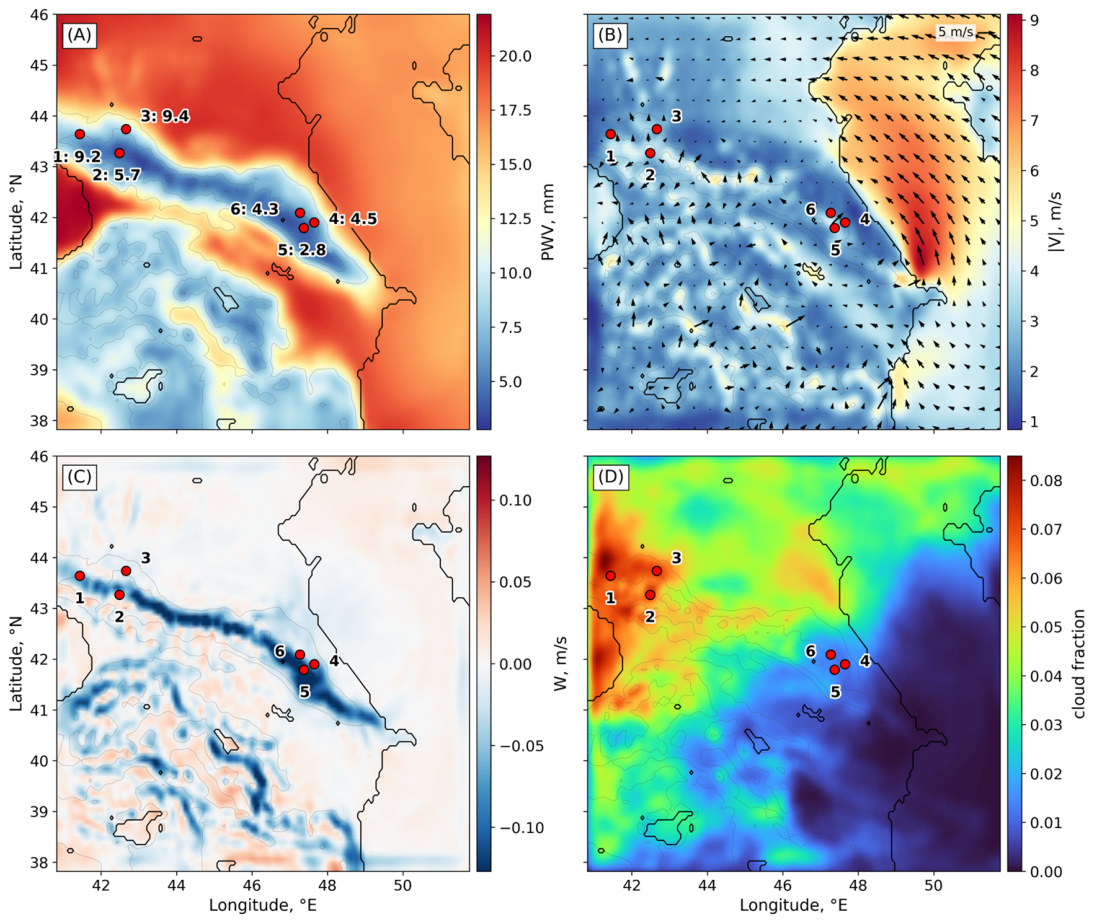
Figure 5 shows the distributions of PWV, horizontal and vertical wind speed and integrated cloudiness averaged over the night-time hours (20:00–04:00 local time, UTC+3) of all nights of the period. The PWV field exhibits a pronounced spatial non-uniformity. The lowest PWV values (4–8 mm) are observed along the high-mountain part of the Caucasus Range (6.3 mm on average for cells with a terrain height above 2000 m), and the highest ones over the lowlands and foothills (16–20 mm, 18.3 mm on average for cells below 500 m), i.e., the contrast between the lowlands and the high mountains is about a factor of three. In terms of the mean night-time PWV, the sites are ranked as follows (from the lowest to the highest): Kurapdag (2.8 mm), Shunudag (4.3 mm), Dzhufudag (4.5 mm), Terskol (5.7 mm), SAO (9.2 mm) and GAS GAO (9.5 mm). At comparable altitudes, the summits of the eastern group have PWV values not exceeding those at Peak Terskol, i.e., the eastern sector is drier than the western one in the averaged simulated field as well. This result is consistent with the conclusion of direct radiometric measurements of subterahertz absorption that the atmosphere over the eastern part of the North Caucasus is systematically drier [10].
Figure 5.
Fields of (A) PWV; (B) wind speed magnitude (color) and direction (arrows) at a height of 10 m; (C) vertical wind velocity W in the boundary layer; (D) integrated cloudiness (fraction), averaged over the night-time hours (20:00–04:00 local time, UTC+3) of 26 March–4 April 2025, from WRF domain d01. Thin gray lines are terrain contours. The numbers denote the sites: 1—SAO, 2—Terskol, 3—GAS GAO, 4—Dzhufudag, 5—Kurapdag, 6—Shunudag; in panel (A), the PWV value at the site, mm, is given next to its number. Red dots mark the locations of the sites.
In addition to the sites under study, other areas of reduced PWV that are of potential interest for further analysis also stand out in the fields presented. The identification of such zones from a continuous model field, in contrast to point-wise ground-based or GNSS estimates, is a direct advantage of the use of mesoscale models [14,15,46].
The lowest mean wind speed at a height of 10 m (|v|), calculated over the night-time hours, is characteristic of the SAO RAS (1.83 ± 0.73 m/s) and Dzhufudag (1.76 ± 1.44 m/s) sites, where speeds below 2 m/s are observed in 55 and 61% of the cases, respectively. These speeds are indicative of a wind regime corresponding to a certain background level. The highest |v| was recorded for the Kurapdag site. The mean |v| reaches 6.81 ± 3.25 m/s (gusts of the near-surface wind may reach and exceed 25 m/s). This indicates that the site with the lowest PWV proves to be the least sheltered from the wind, and that the choice of a site for the deployment of an instrument is reduced not to a search for the extremum of a single parameter but to a balance between the transparency of the atmosphere and the wind loading.
In the field of the vertical velocity (W) within the boundary layer, a narrow zone of downward motions stands out along the Caucasus Range. The mean values of W over areas with a terrain height exceeding 2000 m range from about −0.05 to −0.06 m/s, with extrema down to −0.5 m/s. The persistent subsidence maintains a stratification of the lower troposphere that is close to stable, which limits vertical mixing and impedes the transport of moisture from the valleys to the level of the summits. It may be assumed that it is precisely this that accounts for the spatial coincidence of the subsidence zone with the cloudiness minima over the eastern part of the range.
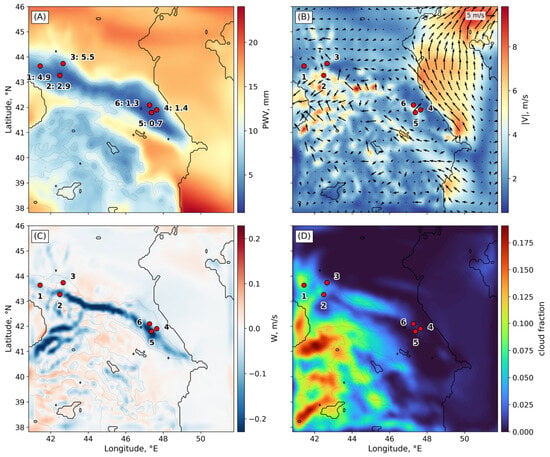
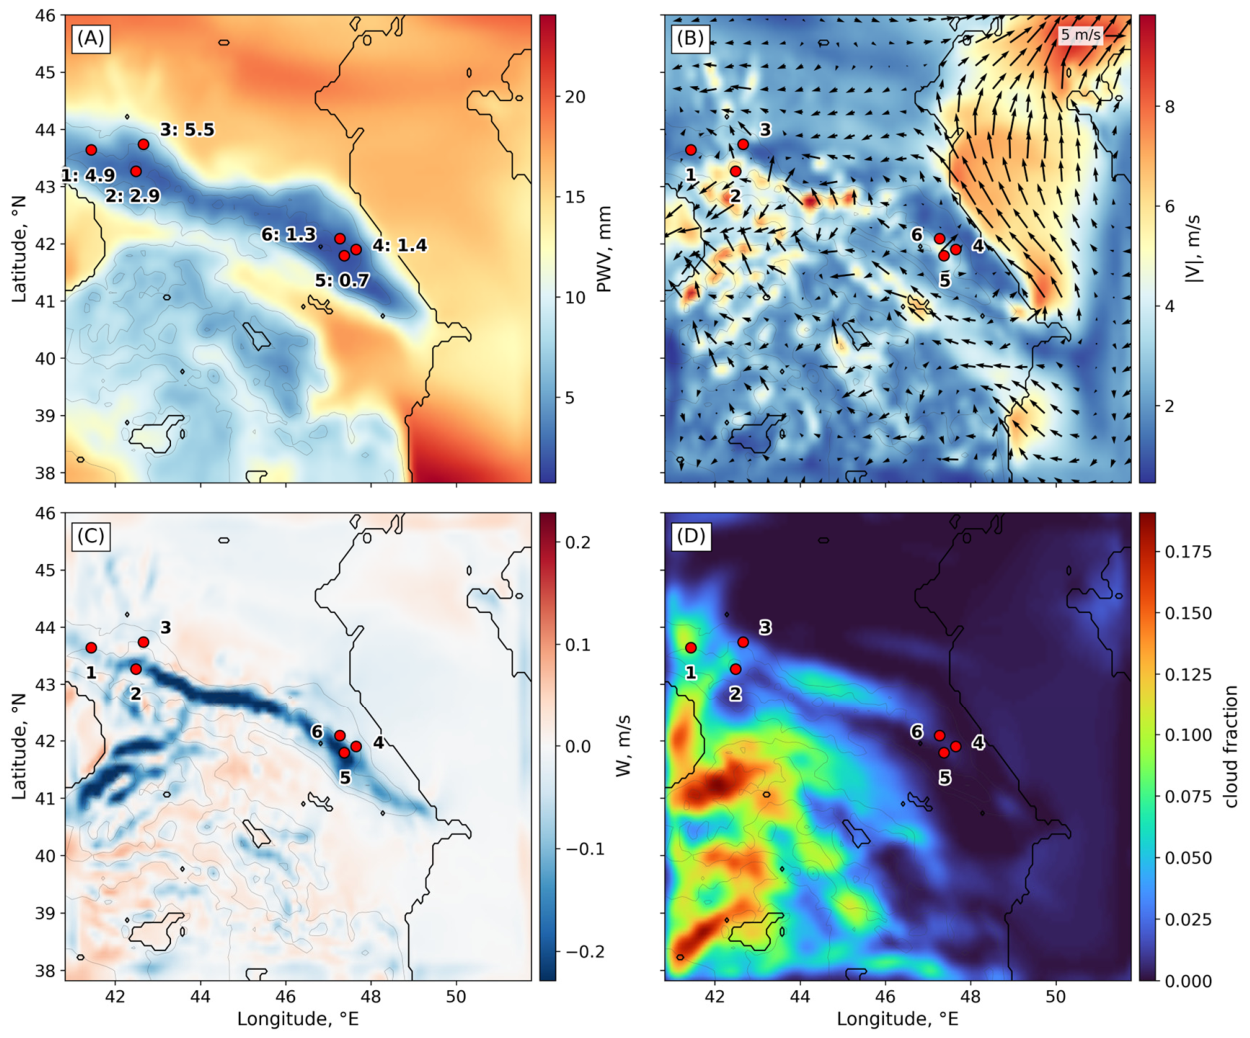
The night of 1–2 April 2025 (Figure 6) represents the episode of minimum moisture content over the study period. The decrease in PWV affects all six sites, but is expressed differently at each of them. In the western group the mean night-time PWV value decreases from 8.1 to 4.4 mm, that is, by 45%, and in the eastern group from 3.9 to 1.2 mm, by 70%. The lowest values were recorded at Kurapdag (0.7 mm), Shunudag (1.3 mm) and Dzhufudag (1.4 mm); at the SAO and GAS GAO sites, the moisture content remained at the level of 4.9 and 5.5 mm, respectively. At the same time, the absolute loss of moisture in the western group (3.7 mm) even exceeded the loss in the eastern group (2.7 mm). Consequently, the higher relative decrease in the east is explained not by a more intense drying there, but by a background level of moisture content that is lower by a factor of two. The decrease over sites separated by more than 500 km indicates a change in the type of air mass over the region as a whole.
Figure 6.
Same as Figure 5 for the night of the regional PWV minimum, from 20:00 on 1 April to 04:00 on 2 April 2025 (local time, UTC+3): (A) PWV; (B) wind speed magnitude and direction at a height of 10 m; (C) vertical wind velocity; (D) integrated cloudiness. In panel (A), the PWV value at the site, mm, is given next to its number. The numbers and red dots indicate locations, and the arrows indicate the wind direction.A practical consequence is the enhancement of the contrast between the sectors under conditions favorable for observations. On average over the period (Figure 5), the eastern group is drier than the western one by a factor of 2.1, and on the night of the minimum by a factor of 3.8, with an absolute difference of 3.3 mm. The mean night-time value of Heff proved to be close for both groups of sites (1689 m for the western and 1686 m for the eastern group), i.e., the vertical structure of the water vapor distribution depends weakly on the sector. The difference in PWV between the sites is determined both by their altitude and by the background moisture content of the sector: reducing the PWV of Peak Terskol to the altitudes of the Dagestan summits with Heff ≈ 1.7 km gives values 29–37% higher than the simulated ones. On the night of the minimum, the mean Heff decreases to 1497 and 1338 m, respectively, which indicates a simultaneous decrease in humidity and in the vertical scale of the moist layer.
The relationship between PWV and the vertical scale of its distribution is not monotonic (Table 3). The median Heff reaches a minimum in the PWV range of 3.5–4.0 mm (1221 m). In conditions with a reduced PWV (1.0–2.0 mm), the effective height varies on average in the range from 1463 to 1595 m, and with a PWV above 4 mm it increases to 1858 m (with PWV = 12.0–12.5 mm). It follows that a low effective height in itself is not an indicator of low moisture content: the same value of about 1300–1350 m occurs both with a PWV of 3.0–3.5 mm and with a PWV of 4.0–5.5 mm.
Table 3.
Quartiles Q1, Q2 and Q3 of the effective height of water vapor, m, within 0.5 mm bins of PWV during the night-time hours (20:00–04:00 local time, UTC+3) for the whole simulation period, 26 March–4 April 2025, and for the night of the regional minimum, 1–2 April 2025.
A comparison of the two periods at fixed PWV intervals shows that the Heff on the night of the PWV minimum (1–2 April) is higher than the average for the simulation period. The median difference is 180–270 m with a PWV of 3.0–5.0 mm. The maximum difference is reached in the range of PWV 7.0–7.5 mm (946 m) and decreases further. In the intervals below 2 mm, the quartile estimates for the minimum episode and all night-time periods coincide.
The decrease in PWV is accompanied by changes in the W and |v| fields. W in the lower troposphere above the crest intensifies: the mean over areas with a terrain height exceeding 2000 m changes from −0.05 to −0.07 m/s, and over the sites of the eastern group from −0.14 to −0.20 m/s.
3.5. Relationship Between the ERA5 Reanalysis and WRF PWV Fields
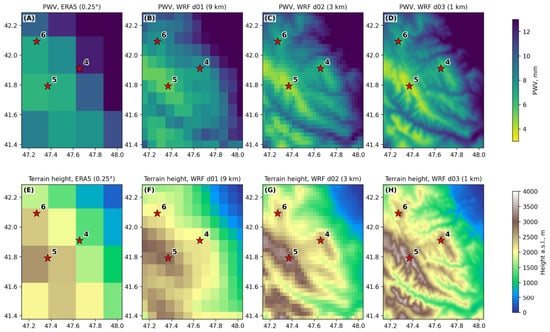
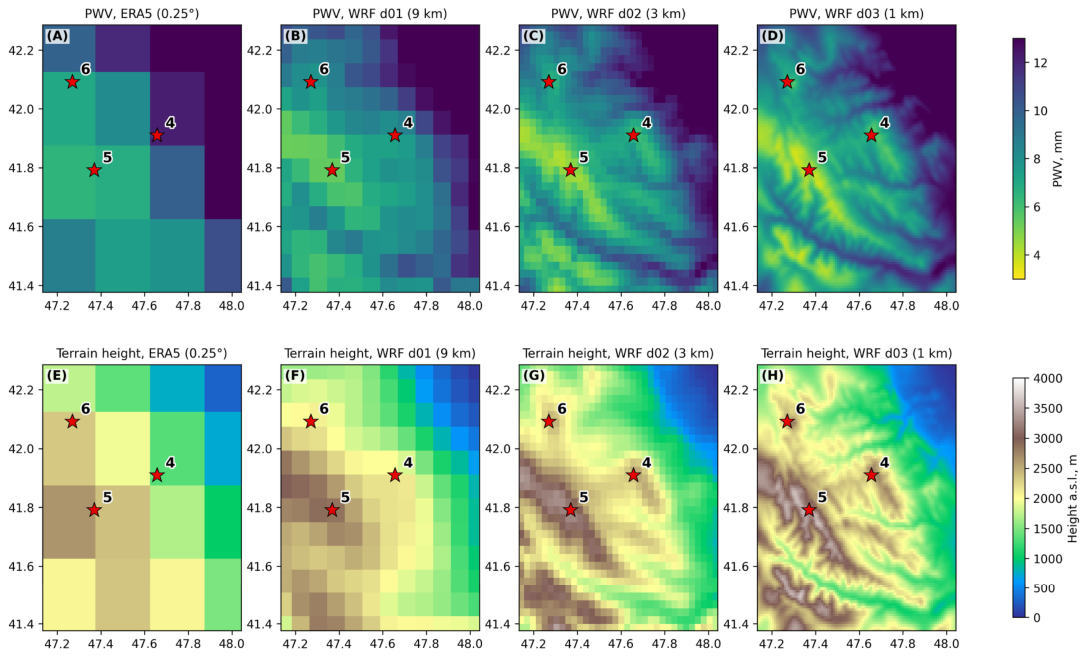
Figure 7 shows the period-mean PWV fields within domain d03 from the ERA5 reanalysis (Figure 7A) and from the WRF simulations in domains d01, d02 and d03 (Figure 7B–D, respectively). The area-mean PWV over d03 decreases from 10.6 mm in ERA5 to 9.6, 9.4 and 9.3 mm in domains d01, d02 and d03, respectively. Refining the WRF grid changes the area-mean PWV by no more than 0.3 mm, whereas the difference between WRF and ERA5 is 1.0–1.3 mm. As the grid spacing decreases, individual ridges and valleys appear in the PWV field (Figure 7E–H). The ERA5 reanalysis does not reproduce such contrasts: at a grid spacing of 0.25° (about 28 km), individual ridges and intermontane valleys are not resolved, and the orography is smoothed, with the ridge heights underestimated and the valley floors, in contrast, overestimated. As a result, the reanalysis overestimates PWV over the ridges, where the column above the smoothed ERA5 surface includes the lowest and moistest layer that is absent above the real crest, and underestimates PWV in the valleys. Essentially, this discrepancy is not a shortcoming of the reanalysis moisture fields, which satisfactorily reproduce the time series of PWV, but a representativeness error caused by the difference between the actual and model terrain elevations. According to formula (2), the elevation difference Δz changes the PWV approximately by a factor of exp(Δz/Heff); in the case of Heff ≈ 1.7 km, a difference of 500 m corresponds to a PWV change of approximately 34%, and in the case of a difference of 1000 m, approximately 80%. In this section, PWV values at the grid nodes are used without reduction to the actual site elevations.
Figure 7.
Period-mean (26 March–4 April 2025) PWV fields from ERA5 (A) and WRF domains d01 (9 km), d02 (3 km) and d03 (1 km) (B–D); (E–H) terrain height on the same grids. The numbers denote the sites: 4—Dzhufudag, 5—Kurapdag, 6—Shunudag. Red stars mark the locations of the summits.
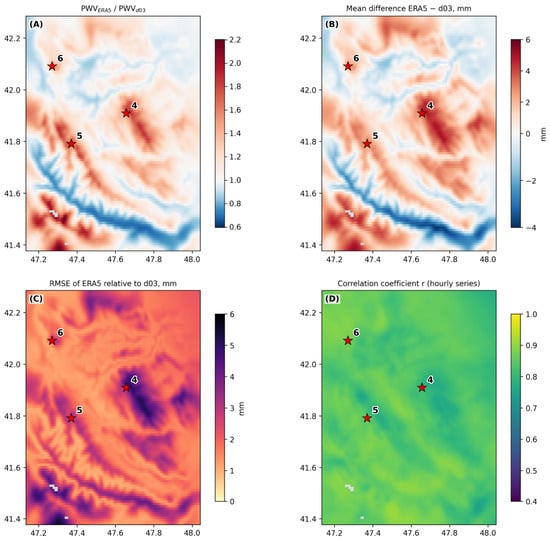
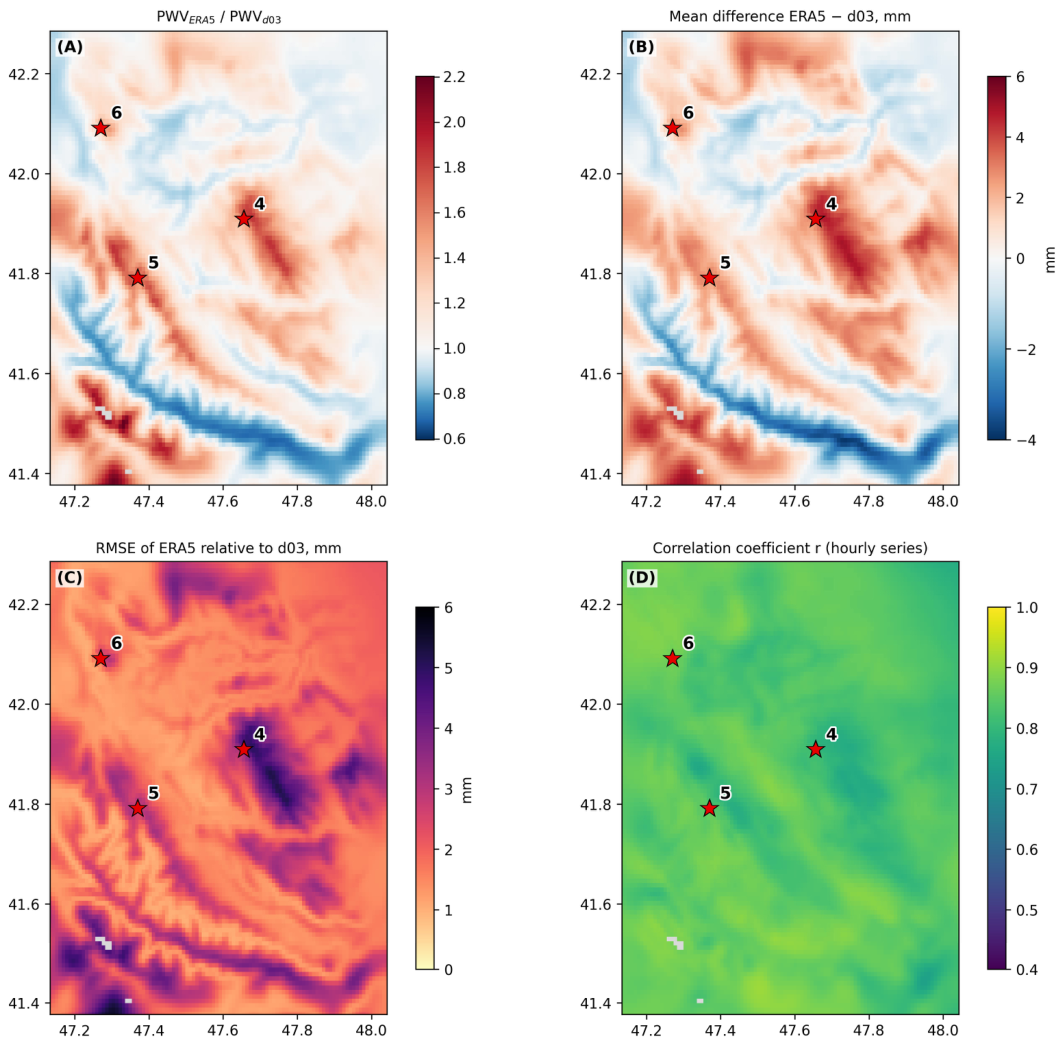
The ratio of the period-mean ERA5 and WRF d03 PWV at the land nodes varies from 0.7 to 2.2, with a mean of 1.1 (Figure 8A). The mean bias of ERA5 relative to d03 is +0.8 mm and ranges from −1.6 to +3.3 mm for 90% of the nodes (Figure 8B). RMSE is 2.1 mm on average and reaches 3.7–5.5 mm over the ridges, including the Dzhufudag area (Figure 8C). The correlation coefficient of the hourly series varies from 0.80 to 0.88 and depends weakly on the terrain (Figure 8D). Hence, ERA5 reproduces the temporal behavior of PWV, and the main discrepancy with the mesoscale model is systematic and orographic.
Figure 8.
Comparison of ERA5 and WRF d03 PWV: (A) ratio of the period-mean values; (B) mean bias ERA5 − d03; (C) RMSE; (D) correlation coefficient of the hourly series. Nodes over water are shown in gray. The red stars and numbers represent: 4—Dzhufudag, 5—Kurapdag, 6—Shunudag.
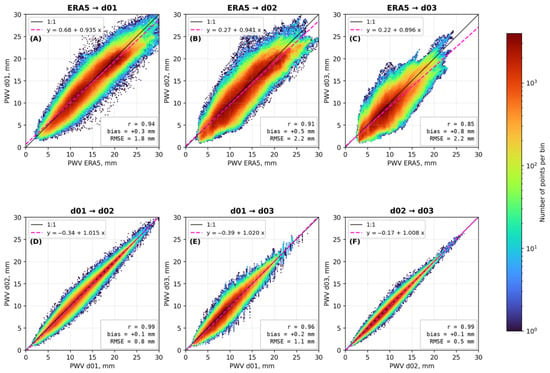
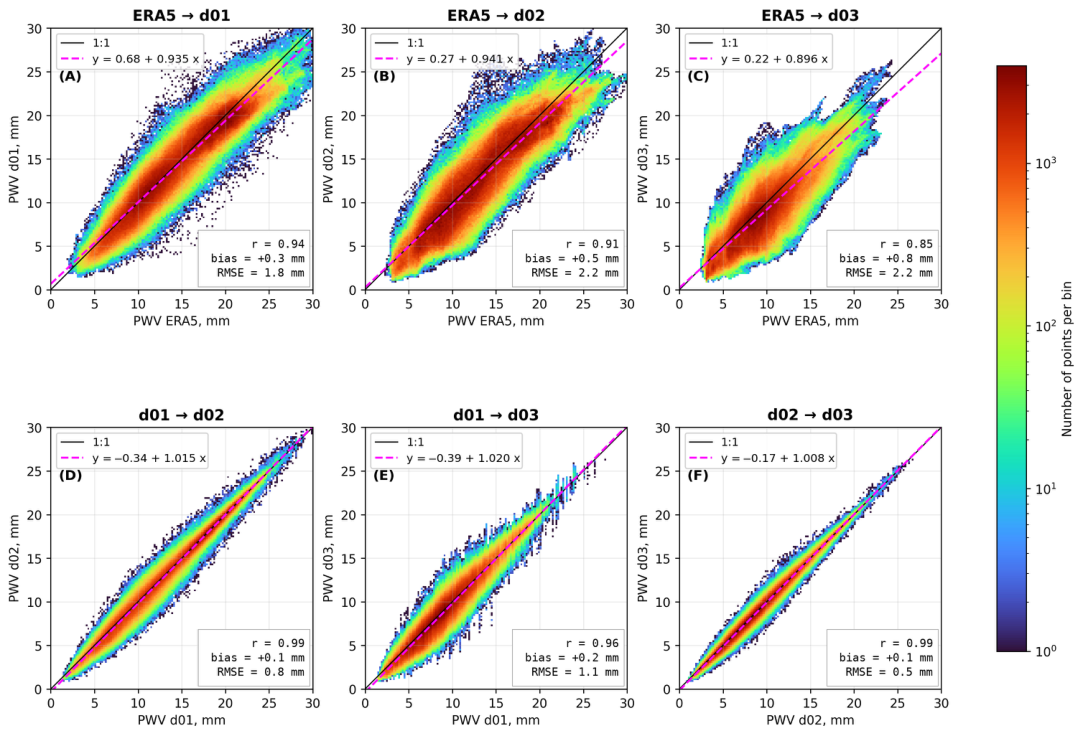
Figure 9 shows the relationships between PWV at different modeling scales. In the comparison of the WRF domains, the points are concentrated near the 1:1 line, the relationship between the domains is close to functional (r = 0.96–0.99), and RMSE ranges from 0.5 to 1.1 mm (Figure 9D–F). The smallest differences were obtained between domains d02 and d03 (r = 0.99, RMSE 0.5 mm) and the largest between domains d01 and d03 (r = 0.96, RMSE 1.1 mm); for the pair d01 and d02, RMSE is 0.8 mm. Hence, the main restructuring of the PWV field occurs on passing from a grid spacing of 9 km to 3 km, whereas further refinement of the grid improves the field only at individual nodes. The bias in all pairs of domains is small (+0.1…+0.2 mm) and positive, i.e., the coarser domain slightly overestimates PWV on average.
Figure 9.
Relationships between hourly PWV values at the land nodes: (A–C) ERA5 versus WRF domains d01, d02 and d03; (D–F) pairs of WRF domains. The color shows the number of points per bin (logarithmic scale); the black line is 1:1; the dashed line is the linear regression; the boxes give the correlation coefficient r, the bias and RMSE.
The comparison with ERA5 shows a considerably larger scatter (r = 0.85–0.94, RMSE 1.8–2.2 mm), and the excess of ERA5 over WRF increases with PWV (Figure 9A–C). As the WRF grid spacing decreases, the agreement with ERA5 deteriorates: the correlation coefficient decreases from 0.94 (d01) to 0.85 (d03), and the bias increases from +0.3 to +0.8 mm. The ERA5 PWV values do not fall below 2.5–3.0 mm, whereas in the WRF domains PWV reaches 1.0–1.5 mm (Figure 9A–C). Hence, the driest conditions over the ridge crests are not reproduced on the reanalysis grid.
Recalculation of PWV using the linear regression (Figure 9C) reduces the overestimation of PWV in ERA5 but does not take into account the difference in terrain height and therefore does not fully eliminate the error. For the Dzhufudag, Kurapdag and Shunudag summits, the original ERA5 values are 9.97, 6.78 and 8.13 mm, and after recalculation by the regression 9.15, 6.29 and 7.50 mm, whereas at the nearest d03 nodes PWV is 6.24, 3.95 and 5.96 mm. Thus, the regression removes only 17–29% of the discrepancy. This is due to the fact that linear regression does not take into account the difference in elevation, which is what determines the main part of the displacement. Hence, the transition from the reanalysis field to PWV at particular summits requires methods that explicitly account for the difference in terrain height. Besides the WRF model, machine learning methods that take into account, in addition to altitude, slope exposure, boundary layer characteristics and the synoptic situation are also a promising direction. In practice, this means that preliminary site selection based solely on reanalysis data may miss narrow dry ridges and should be supplemented with mesoscale modeling. Since reanalysis adequately reproduces the temporal variability of PWV, the long-term ERA5 series can be used for climatic assessments of PWV at the peaks after elevation correction based on the effective water vapor height, the parameters of which are determined from the results of mesoscale modeling.
4. Conclusions
The numerical experiment performed makes it possible to formulate a number of statements that are significant for the selection of sites for millimeter and submillimeter instruments in the Caucasus. These statements are preliminary and require verification by multi-season simulations and measurements at the sites.
The region is not homogeneous in astroweather terms and is not described by a single characteristic of moisture content. The western and eastern sectors differ not only in the level of precipitable water vapor (9.3 ± 1.9 mm at SAO and GAS GAO against 2.8 ± 1.2 to 4.3 ± 1.6 mm at the Dagestan summits), but also in the character of its variability: the coefficient of variation increases from 20–21% in the west to 36–42% in the east. The consistency of the temporal behavior of PWV between the sectors proves to be substantially lower than within each of them (r = 0.59 against 0.86 for the western group and 0.96 for the eastern one). At the same time, according to the NWR analysis, one and the same direction of transport can produce PWV anomalies of opposite sign: the south-westerly transport is accompanied by a reduced moisture content in the west and an increased moisture content in the east of the region. This means that a PWV estimation procedure calibrated for one astronomical site cannot be transferred to another site without an additional local calibration, with allowance for the dynamics of atmospheric processes, even within the limits of a single mountain region.
The vertical structure of the PWV distribution is stable in space: the effective height averaged over the night-time hours practically coincides for the two sectors (1689 and 1686 m), whereas for individual sites it varies substantially in time, from about 1000 to about 3000 m. The relation between the effective height and PWV is not monotonic (Table 3): the median effective height reaches a minimum in the PWV interval 3.5–4.0 mm (1221 m) and increases both towards a higher moisture content, up to 1858 m at 12.0–12.5 mm, and towards the driest intervals, reaching 1463–1595 m below 2 mm. A low effective height therefore cannot serve as an indicator of a low PWV. The decrease in the mean effective height on the night of the regional minimum (to 1497 and 1338 m) is a consequence of the shift of the whole PWV distribution towards small values: within one and the same PWV interval the effective height on that night was, in contrast, 730–950 m greater than the period-average value in the range from 6.0 to 8.5 mm. The incoming dry air mass was thus characterized not by a steeper but by a more extended vertical distribution of water vapor, and the reduction in PWV to the actual elevation of a summit for such episodes requires the instantaneous rather than the period-average value of the effective height.
Analysis of the identified episode with a PWV minimum showed that the advantage of the eastern sector over the western one is realized to the greatest extent. The overall decrease in PWV during the change in air mass proved to be similar at all the sites irrespective of their initial state, as a result of which the contrast between the sectors on such nights increases approximately twofold relative to the mean level. For instruments operating in the submillimeter range, where observations are possible only on a limited number of the driest nights, it is precisely this distribution of extreme conditions that is of importance.
Analysis of data from the WRF model has revealed a narrow subregion of intense downward air motion, with vertical velocities ranging from −0.05 to −0.5 m/s. This persistent dynamic subsidence of air masses is likely to impede the vertical transport of moisture from valleys to the level of mountain peaks. This effect is particularly evident in the formation of localized dry subregions in the eastern part of Dagestan, where the dynamics of PWV cannot be explained solely by the absolute elevation of the terrain.
The discrepancy between the ERA5 reanalysis and the mesoscale model over mountainous terrain is predominantly systematic rather than random. The reanalysis reproduces the temporal behavior of the moisture content satisfactorily, but the spatial distribution of PWV is governed by the smoothed orography of its grid. Therefore, it is precisely for the summits and ridges, which are of greatest interest for millimeter and submillimeter astronomy, that ERA5 gives the most overestimated values. For the mesoscale model, the decisive step is the transition from a grid spacing of 9 km to 3 km, at which individual ridges are resolved; further refinement of the grid to 1 km improves the field only locally. From a practical point of view, this means that a domain with a grid spacing of about 3 km reproduces the main features of the PWV field required for the astroclimatic and astroweather assessment of high-mountain sites.
Several preliminary recommendations should be noted. Based on an analysis of mesoscale atmospheric dynamics, the site of Dzhufudag (3015 m) stands out, characterized by moderately low PWV and moderate wind conditions. In this regard, Mount Dzhufudag within the Northern Caucasus may be considered a promising location for the long-term implementation of the ESMT project. The Shatdzhatmaz Plateau (the site of the GAS GAO observatory, 2096 m) or the Semirodniki site (2280 m), located near the SAO (Special Astrophysical Observatory), could serve as a testing ground for deploying a prototype millimeter-wave telescope. Although the western sector generally exhibits moderate conditions in PWV, specific wind patterns here facilitate the rapid drying of the atmosphere during periods of synoptic-scale minima. Furthermore, while Semirodniki is susceptible to the influence of moist air masses arriving from the west, the local topography promotes airflow patterns that help, to some extent, to prevent the accumulation of moisture in the valleys during regional dry spells.
Author Contributions
Conceptualization: M.Y.S. and A.Y.S.; methodology, M.Y.S., A.Y.S. and A.A.L.; software: M.Y.S. and V.S.G.; validation: M.Y.S. and V.S.G.; formal analysis: M.Y.S.; investigation: M.Y.S. and A.Y.S.; resources: A.A.L.; writing—original draft preparation: M.Y.S.; writing—review and editing: A.Y.S. and P.G.K.; visualization: M.Y.S.; supervision: P.G.K.; project administration: A.Y.S. All authors have read and agreed to the published version of the manuscript.
Funding
This research was funded by the Russian Science Foundation, grant number 24-72-10043, “Development of methods for the high-resolution diagnostics of the characteristics of the lower atmosphere as applied to ground-based astronomical telescopes”.
Institutional Review Board Statement
Not applicable.
Informed Consent Statement
Not applicable.
Data Availability Statement
The WRF simulation output and the derived series of PWV, effective height of water vapor and near-surface wind analyzed in this study are available from the corresponding author upon reasonable request owing to their large volume. The ERA5 reanalysis data are available from the Copernicus Climate Change Service Climate Data Store. The radiosonde data for the Erzurum (WMO 17095), Divnoye (WMO 34858) and Makhachkala (WMO 37259) stations are available from the University of Wyoming upper-air sounding archive (https://weather.uwyo.edu/upperair/sounding.shtml (accessed on 9 August 2026)).
Conflicts of Interest
The authors declare no conflicts of interest.
References
- Georgiev, C.G.; Santurette, P.; Maynard, K. Diagnosis of thermodynamic environment of deep convection. In Weather Analysis and Forecasting; Academic Press: Cambridge, MA, USA, 2016; pp. 157–222. [Google Scholar]
- Bolbasova, L.; Shikhovtsev, A.; Ermakov, S.A. Statistics of precipitable water vapour above the sites of the 6-m Big Telescope Alt-azimuthal and new 3-m Large Solar Telescope using ERA5 data. Mon. Not. R. Astron. Soc. 2023, 520, 4336–4344. [Google Scholar] [CrossRef] [Scilit]
- Balbay, R.; Kaba, K.; Fişek, S.; Yeşilyaprak, C. Evaluation of PWV products derived from satellite-based and radiosonde retrievals for the Eastern Anatolia Observatory (DAG). Exp. Astron. 2024, 58, 2. [Google Scholar] [CrossRef] [Scilit]
- Valeria, L.; Martínez-Ledesma, M.; Reeves, R.A. Satellite-based atmospheric characterization for sites of interest in millimeter and sub-millimeter astronomy. Astron. Astrophys. 2024, 684, A186. [Google Scholar] [CrossRef] [Scilit]
- Bevis, M.; Businger, S.; Herring, T.A.; Rocken, C.; Anthes, R.A.; Ware, R.H. GPS meteorology: Remote sensing of atmospheric water vapor using the Global Positioning System. J. Geophys. Res. 1992, 97, 15787–15801. [Google Scholar] [CrossRef] [Scilit]
- Vaquero-Martínez, J.; Antón, M.; de Galisteo, J.P.O.; Cachorro, V.E.; Costa, M.J.; Román, R.; Bennouna, Y.S. Validation of MODIS integrated water vapor product against reference GPS data at the Iberian Peninsula. Int. J. Appl. Earth Obs. Geoinf. 2017, 63, 214–221. [Google Scholar] [CrossRef] [Scilit]
- Diedrich, H.; Preusker, R.; Lindstrot, R.; Fischer, J. Retrieval of daytime total columnar water vapour from MODIS measurements over land surfaces. Atmos. Meas. Tech. 2015, 8, 823–836. [Google Scholar] [CrossRef] [Scilit]
- Hersbach, H.; Bell, B.; Berrisford, P.; Hirahara, S.; Horányi, A.; Muñoz-Sabater, J.; Nicolas, J.; Peubey, C.; Radu, R.; Schepers, D.; et al. The ERA5 global reanalysis. Q. J. R. Meteorol. Soc. 2020, 146, 1999–2049. [Google Scholar] [CrossRef] [Scilit]
- Gelaro, R.; McCarty, W.; Suárez, M.J.; Todling, R.; Molod, A.; Takacs, L.; Randles, C.A.; Darmenov, A.; Bosilovich, M.G.; Reichle, R.; et al. The Modern-Era Retrospective Analysis for Research and Applications, Version 2 (MERRA-2). J. Clim. 2017, 30, 5419–5454. [Google Scholar] [CrossRef] [Scilit] [PubMed]
- Balega, Y.Y.; Bataev, D.K.-S.; Bubnov, G.M.; Vdovin, V.F.; Zemlyanukha, P.M.; Lolaev, A.B.; Lesnov, I.V.; Marukhno, A.S.; Marukhno, N.A.; Murtazaev, A.K.; et al. Direct measurements of atmospheric absorption of subterahertz waves in the Northern Caucasus. Dokl. Phys. 2022, 67, 1–4. [Google Scholar] [CrossRef] [Scilit]
- Pardo, J.R.; Cernicharo, J.; Serabyn, E. Atmospheric transmission at microwaves (ATM): An improved model for millimeter/submillimeter applications. IEEE Trans. Antennas Propag. 2001, 49, 1683–1694. [Google Scholar] [CrossRef] [Scilit]
- Skamarock, W.C.; Klemp, J.B.; Dudhia, J.; Gill, D.O.; Zhiquan, L.; Berner, J.; Wang, W.; Powers, J.G.; Duda, M.G.; Barker, D.M.; et al. A Description of the Advanced Research WRF Model Version 4.3; NCAR Technical Note NCAR/TN-556+STR; NCAR: Boulder, CO, USA, 2021; 165p. [Google Scholar] [CrossRef]
- Giordano, C.; Vernin, J.; Trinquet, H.; Muñoz-Tuñón, C. Weather Research and Forecasting prevision model as a tool to search for the best sites for astronomy: Application to La Palma, Canary Islands. Mon. Not. R. Astron. Soc. 2014, 440, 1964–1970. [Google Scholar] [CrossRef] [Scilit]
- Pérez-Jordán, G.; Castro-Almazán, J.A.; Muñoz-Tuñón, C. Precipitable water vapour forecasting: A tool for optimizing IR observations at Roque de los Muchachos Observatory. Mon. Not. R. Astron. Soc. 2018, 477, 5477–5485. [Google Scholar] [CrossRef] [Scilit]
- Qian, X.; Yao, Y.; Wang, H.; Zou, L.; Li, Y.; Yin, J. Validation of the WRF model for estimating precipitable water vapor at the Ali Observatory on the Tibetan Plateau. Publ. Astron. Soc. Pac. 2020, 132, 125003. [Google Scholar] [CrossRef] [Scilit]
- Khaikin, V.B.; Shikhovtsev, A.Y.; Shmagin, V.E.; Lebedev, M.K.; Kopylov, E.A.; Lukin, V.P.; Kovadlo, P.G. Eurasian Submillimeter Telescopes (ESMT) project. Possibility of submm image quality improvement using adaptive optics. Zhurnal Radioelektron. 2022, 7, 1684–1719. (In Russian) [Google Scholar] [CrossRef] [Scilit]
- Stolyarov, V.A.; Balega, Y.Y.; Mingaliev, M.G.; Sotnikova, Y.V.; Vdovin, V.F.; Gunbina, A.A.; Kukushkin, D.E.; Tarasov, M.A.; Fominsky, M.Y.; Chekushkin, A.M.; et al. Prospects of millimeter astronomy development at the Special Astrophysical Observatory of the Russian Academy of Sciences (SAO RAS). Astrophys. Bull. 2024, 79, 321–339. [Google Scholar] [CrossRef] [Scilit]
- Balega, Y.; Bubnov, G.; Glyavin, M.; Gunbina, A.; Danilevsky, D.; Denisov, G.; Khudchenko, A.; Lesnov, I.; Marukhno, A.; Mineev, K.; et al. Atmospheric Propagation Studies and Development of New Instrumentation for Astronomy, Radar, and Telecommunication Applications in the Subterahertz Frequency Range. Appl. Sci. 2022, 12, 5670. [Google Scholar] [CrossRef] [Scilit]
- Balega, Y.Y.; Valeev, A.F.; Valyavin, G.G.; Vdovin, V.F.; Vdovin, A.V.; Gunbina, A.A.; Dubrovich, V.K.; Efimova, M.V.; Kapustin, S.A.; Krasilnikov, A.M.; et al. A system for observations in the subterahertz range at the 6-m optical telescope BTA. Dokl. Ross. Akad. Nauk. Fiz. Tekh. Nauk. 2026, 526, 5–19. Available online: https://journals.rcsi.science/2686-7400/article/view/415546 (accessed on 9 August 2026). (In Russian)
- Khabarova, T.A.; Zemlyanukha, P.M.; Dombek, E.M.; Marukhno, A.S.; Vdovin, V.F. Analysis of the results of astroclimate measurements in the millimeter wavelength range using machine learning methods. Astrophys. Bull. 2024, 79, 340–349. [Google Scholar] [CrossRef] [Scilit]
- Khaikin, V.B.; Shikhovtsev, A.Y.; Mironov, A.P.; Qian, X. A study of the astroclimate in the Dagestan mountains Agul region and at the Ali Observatory in Tibet as possible locations for the Eurasian SubMM Telescopes (ESMT). In Proceedings of the Multifaceted Universe: Theory and Observations—2022 (MUTO2022), Nizhny Arkhyz, Russia, 23–27 May 2022. PoS(MUTO2022)072. [Google Scholar]
- Shikhovtsev, A.Y.; Kovadlo, P.G.; Khaikin, V.B.; Kiselev, A.V. Precipitable water vapor and fractional clear sky statistics within the Big Telescope Alt-Azimuthal region. Remote Sens. 2022, 14, 6221. [Google Scholar] [CrossRef] [Scilit]
- Shikhovtsev, A.Y.; Khaikin, V.B.; Mironov, A.P.; Kovadlo, P.G. Statistical analysis of the water vapor content in North Caucasus and Crimea. Atmos. Ocean. Opt. 2022, 35, 168–175. [Google Scholar] [CrossRef] [Scilit]
- Azimov, A.M.; Tillayev, Y.A.; Hafizov, A.R.; Tillayeva, N.Y. Long-term statistics of meteorological data at the Maidanak Astronomical Observatory. Res. Astron. Astrophys. 2026, 26, 015019. [Google Scholar] [CrossRef] [Scilit]
- Zinchenko, I.I.; Lapinov, A.V.; Vdovin, V.F.; Zemlyanukha, P.M.; Khabarova, T.A. Measurements and evaluations of the atmospheric transparency at short millimeter wavelengths at candidate sites for millimeter- and sub-millimeter-wave telescopes. Appl. Sci. 2023, 13, 11706. [Google Scholar] [CrossRef] [Scilit]
- Agafonov, M.I.; Bubnov, G.M.; Bubukin, I.T.; Vdovin, V.F.; Gorbunov, R.V.; Zinchenko, I.I.; Lapchenko, V.A.; Nosov, V.I.; Pankratov, A.L.; Rakut, I.V. The results of observing the astroclimate on the Crimean Peninsula in the shortwave part of the millimeter wavelength range. Astrophys. Bull. 2018, 73, 387–392. [Google Scholar] [CrossRef] [Scilit]
- Bubukin, I.T.; Agafonov, M.I.; Rakut’, I.V.; Pankratov, A.L.; Yablokov, A.A.; Troitsky, A.V.; Priymak, A.S.; Gorbunov, R.V. Prototype of a two-wave radiometric system of the millimeter wavelength range for remote sensing of the atmosphere and features of atmospheric absorption at Kara-Dag according to field measurements. Radiophys. Quantum Electron. 2019, 62, 562–569. [Google Scholar] [CrossRef] [Scilit]
- Pankratova, E.A.; Bubukin, I.T.; Rakut, I.V.; Agafonov, M.I.; Yablokov, A.A.; Bubukin, V.I.; Pankratov, A.L.; Vodzyanovsky, Y.O.; Khudchenko, A.V.; Tretyakov, I.V. Analysis of atmospheric absorption data at Khulugaysha site. Atmos. Environ. 2026, 383, 122274. [Google Scholar] [CrossRef] [Scilit]
- Khabarova, T.A.; Zemlyanukha, P.M.; Dombek, E.M.; Markov, K.V.; Marukhno, A.S.; Khudchenko, A.V.; Vdovin, V.F. Astroclimate in the vicinity of the Hulugaisha Peak based on the analysis of meteorological and radiometric measurements. Radiophys. Quantum Electron. 2025, 68, 16–24, Original Russian text: Izv. Vyss. Uchebn. Zaved. Radiofiz. 2025, 68, 18–28. [Google Scholar] [CrossRef] [Scilit]
- Shikhovtsev, M.Y.; Shikhovtsev, A.Y.; Lezhenin, A.A.; Gradov, V.S.; Khaikin, V.B.; Kirichenko, K.E.; Kovadlo, P.G. WRF model estimation of precipitable water vapor over the Sayan Solar Observatory and Khulugaysha Peak. Atmos. Ocean. Opt. 2026, 39, 355–361. [Google Scholar] [CrossRef] [Scilit]
- Shikhovtsev, A.Y.; Kovadlo, P.G.; Baron, P. Candidate sites for millimeter and submillimeter ground-based telescopes: Atmospheric rating for the Eurasian Submillimeter Telescopes project. Sensors 2025, 25, 2144. [Google Scholar] [CrossRef] [Scilit] [PubMed]
- Bolbasova, L.A.; Kopylov, E.A. Long-term trends of astroclimatic parameters above the Terskol Observatory. Atmosphere 2023, 14, 1264. [Google Scholar] [CrossRef] [Scilit]
- National Centers for Environmental Prediction. NCEP GFS 0.25 Degree Global Forecast Grids Historical Archive; Research Data Archive; NCAR/CISL: Boulder, CO, USA, 2015. [Google Scholar] [CrossRef] [Scilit]
- Shikhovtsev, A.Y.; Kovadlo, P.G.; Lezhenin, A.A.; Gradov, V.S.; Zaiko, P.O.; Khitrykau, M.A.; Kirichenko, K.E.; Driga, M.B.; Kiselev, A.V.; Russkikh, I.V.; et al. Simulating atmospheric characteristics and daytime astronomical seeing using Weather Research and Forecasting Model. Appl. Sci. 2023, 13, 6354. [Google Scholar] [CrossRef] [Scilit]
- Shikhovtsev, A.Y.; Kovadlo, P.G.; Lezhenin, A.A.; Korobov, O.A.; Kiselev, A.V.; Russkikh, I.V.; Kolobov, D.Y.; Shikhovtsev, M.Y. Influence of atmospheric flow structure on optical turbulence characteristics. Appl. Sci. 2023, 13, 1282. [Google Scholar] [CrossRef] [Scilit]
- Hong, S.-Y.; Noh, Y.; Dudhia, J. A new vertical diffusion package with an explicit treatment of entrainment processes. Mon. Weather Rev. 2006, 134, 2318–2341. [Google Scholar] [CrossRef] [Scilit]
- Jiménez, P.A.; Dudhia, J.; González-Rouco, J.F.; Navarro, J.; Montávez, J.P.; García-Bustamante, E. A revised scheme for the WRF surface layer formulation. Mon. Weather Rev. 2012, 140, 898–918. [Google Scholar] [CrossRef] [Scilit]
- Thompson, G.; Field, P.R.; Rasmussen, R.M.; Hall, W.D. Explicit forecasts of winter precipitation using an improved bulk microphysics scheme. Part II: Implementation of a new snow parameterization. Mon. Weather Rev. 2008, 136, 5095–5115. [Google Scholar] [CrossRef] [Scilit]
- Kain, J.S. The Kain–Fritsch convective parameterization: An update. J. Appl. Meteorol. 2004, 43, 170–181. [Google Scholar] [CrossRef] [Scilit]
- Dudhia, J. Numerical study of convection observed during the Winter Monsoon Experiment using a mesoscale two-dimensional model. J. Atmos. Sci. 1989, 46, 3077–3107. [Google Scholar] [CrossRef] [Scilit]
- Mlawer, E.J.; Taubman, S.J.; Brown, P.D.; Iacono, M.J.; Clough, S.A. Radiative transfer for inhomogeneous atmospheres: RRTM, a validated correlated-k model for the longwave. J. Geophys. Res. Atmos. 1997, 102, 16663–16682. [Google Scholar] [CrossRef] [Scilit]
- Smirnova, T.G.; Brown, J.M.; Benjamin, S.G.; Kenyon, J.S. Modifications to the Rapid Update Cycle Land Surface Model (RUC LSM) available in the Weather Research and Forecasting (WRF) Model. Mon. Weather Rev. 2016, 144, 1851–1865. [Google Scholar] [CrossRef] [Scilit]
- Otárola, A.; Travouillon, T.; Schöck, M.; Els, S.; Riddle, R.; Skidmore, W.; Dahl, R.; Naylor, D.; Querel, R. Thirty Meter Telescope site testing X: Precipitable water vapor. Publ. Astron. Soc. Pac. 2010, 122, 470–484. [Google Scholar] [CrossRef] [Scilit] [PubMed]
- Henry, R.; Norris, G.A.; Vedantham, R.; Turner, J.R. Source region identification using kernel smoothing. Environ. Sci. Technol. 2009, 43, 4090–4097. [Google Scholar] [CrossRef] [Scilit] [PubMed]
- Carslaw, D.C.; Ropkins, K. openair—An R package for air quality data analysis. Environ. Model. Softw. 2012, 27–28, 52–61. [Google Scholar] [CrossRef] [Scilit]
- Marín, J.C.; Ortiz, F.; Curé, M. Forecasting the precipitable water vapour along lines of sight in the Chajnantor region from a WRF simulation. Mon. Not. R. Astron. Soc. 2023, 522, 457–465. [Google Scholar] [CrossRef] [Scilit]

Disclaimer/Publisher’s Note: The statements, opinions and data contained in all publications are solely those of the individual author(s) and contributor(s) and not of MDPI and/or the editor(s). MDPI and/or the editor(s) disclaim responsibility for any injury to people or property resulting from any ideas, methods, instructions or products referred to in the content. |
© 2026 by the authors. Licensee MDPI, Basel, Switzerland. This article is an open access article distributed under the terms and conditions of the Creative Commons Attribution (CC BY) license.