2. Literature Review
At the birth of accounting, a tool that helped businessmen become victims as the beginnings of manipulating economic records began to emerge. We can imagine the beginnings of manipulation when various records were impaired due to spilt ink in the accounting books. Believe that these manipulative origins are the source of the term camouflage [
7]. This trend stretches back centuries to the present day, when we no longer encounter spilt ink but much more sophisticated techniques for devaluing a company’s economic information. A new term, ‘creativity’ or ‘creative accounting’, has replaced the concept of camouflage. Accounting is a fragile tool that can be misused very quickly for its own good. The constant changes in the business environment, the impact of economic crises, the emergence of new types of property, forms of foreign resources, legislation, the impact of fiscal policy, and the constant expansion of the grey and black economy have transformed accounting into a vulnerable apparatus that relies on the intervention of a higher power. Creative accounting is linked to creative activity that generates original and atypical ideas. An article critiquing the US GAAP (United States Generally Accepted Accounting Principles) was published, contending that the accounting framework facilitated companies in manipulating financial records to retain shareholders [
8]. Research subsequently corroborated this perspective, describing such manipulation as a technique to align reported profits with owner preferences [
9]. The phrase “creative accounting” emerged more prominently in the 1970s, marked by an increase in pertinent publications by economists, accountants, and financial analysts [
10]. A thorough study further developed the concept, presenting synonymous terms such as earnings management, income smoothing, big bath accounting, and window dressing [
11]. In various regions, creative accounting practices were characterised by metaphorical phrases: “the art of faking a balance sheet” [
12], “calculating the benefits” [
13], “presenting a balance sheet” [
14], and “saving money” [
15].
Recent scholarly research has enhanced the comprehension of creative accounting by examining its definitions, mechanisms, and motivating factors. Certain studies emphasise the ambiguous interpretation of creative accounting, frequently perceived as manipulation but sometimes linked to innovation [
16]. Additional studies define the particular accounting tactics employed to manipulate financial statements, emphasising both individual and market-driven incentives for these behaviours [
17]. Subsequent analyses differentiate creative accounting from blatant fraud, indicating that although it may adhere to accounting standards, it can still undermine the objective of accurately portraying a company’s financial status [
18]. Frequently referenced reasons include tax optimisation, earnings stabilisation, and alignment with investor expectations [
19]. Research underscores the significance of psychological and organisational factors influencing the use of creative techniques by highlighting leadership styles, ethical ambiguity, and internal performance pressure as pivotal drivers of such behaviour.
Creative accounting can be defined through various conceptual frameworks. Certain studies clarify this term from an accounting perspective, emphasising its representation of various methodologies for addressing conflicts between competing financial results intended for presentation and the underlying transactions [
20]. A key feature of creative accounting is that it intentionally strays from normal accounting rules, avoiding established regulations to reach a desired reporting outcome [
21]. More research shows that these practices often happen when companies try to change accounting from the legal format to one that fits their management goals [
22]. A dual-level interpretation has been suggested [
23], with the first level pertaining to initiatives designed to address new economic occurrences that remain unregulated by current accounting standards. The second level generally defines this term as activities that lead to the manipulation of financial statements. The work Creative Financial Accounting: Its Nature and Use articulates an academic perspective wherein creative accounting is characterised by the alteration of financial data from its original recorded state to a representation that aligns with the desired image of company proprietors—accomplished either through the manipulation of permissible policies or by selectively disregarding specific regulations [
24]. Another contribution to the discourse offers a critical evaluation, indicating that while creative accounting may enable firms to influence financial results, such manipulation does not inherently lead to economic advantages. Conversely, over a prolonged timeframe, such practices may negatively impact the company’s performance and sustainability [
25]. The motivations for creative accounting are varied. Alongside traditional motivations like tax minimisation and shaping investor perceptions, prior research [
17] has revealed systematic behavioural patterns among financial professionals, affirming a common rationale that includes income smoothing and achieving established performance targets. Additional research [
26,
27] further links creative accounting to individual motivations, inadequate internal controls, and ambiguities within the legal framework. One study contends that creative accounting should not invariably be viewed in a strictly negative light, consistent with the viewpoint articulated in [
25]. The primary conclusion is that organisations can improve their reported performances as long as they adhere to legal accounting standards. In such instances, the actions, while innovative, remain lawful. Another contribution [
26] outlines two different views on creative accounting: in the U.S., it is often seen as related to fraud, while in the U.K., it is viewed as a legal way to use rules flexibly—unless it crosses into dishonest practices [
28]. Jones’s simplified definition is even more stringent when defining creative accounting, asserting that it applies to any business that does not adhere to the fundamental principles of accounting, thereby failing to maintain a faithful and authentic image [
29]. Consequently, numerous nations regard creative accounting as straddling legal and regulatory ambiguities. A study [
30] indicates that the likelihood of accounting manipulation escalates with the size of the company. In contrast, the influencing elements were later categorised into two primary groups [
31]: external factors, encompassing government revenues and regulations, and internal factors related to the firms themselves. Another study [
32] contests this conclusion, demonstrating no significant correlation between firm size and manipulation. The aforementioned study identifies cultural, social, and legal contexts as more pivotal factors influencing the decision to engage in manipulation.
The first group consists of factors that influence the enterprise through state revenues, and the second group consists of factors of the enterprises themselves. Nevertheless, focusing solely on firm size, legal structure, or country of operation encompasses only a limited range of potential factors influencing accounting manipulation. To mitigate this limitation, a study [
22] performed an industry-specific analysis, concentrating on firms within a particular sector. The researchers sought to ascertain if the gender of a company’s CEO influences the propensity for manipulation, considering that strategic decisions related to financial reporting generally emanate from senior management roles. Research has demonstrated that women exhibit a conservative approach to manipulation, whereas men exhibit a high propensity for manipulation. This research also revealed that mixed leadership falls into the category of potential manipulators, resulting in ambiguous and unclear outcomes.
Creative accounting is not limited to private enterprises; governments also partake in such practices. Numerous studies have examined the phenomenon of creative accounting at the governmental level [
32,
33,
34,
35,
36,
37]. However, understanding the results about how states manipulate their finances is challenging because different hidden factors—such as political pressures, economic changes, or off-balance-sheet activities —can create confusing signals or hide what is really happening. Bibliometric analyses [
38] indicate that research on creative accounting has markedly increased recently, garnering heightened interest across multiple academic fields. Notwithstanding this expansion, a significant gap remains in country-specific research, especially in Eastern Europe and developing economies—a shortcoming this paper seeks to rectify. The latest bibliometric analysis [
39] has tracked the growth of creative accounting research in academic databases, highlighting an increasing focus on different fields, especially in agricultural and rural financial management. Their findings emphasise the significance of creative accounting in corporate settings and public and sectoral reporting frameworks. Slovak authors deal, in most cases, with a simpler but much more important part of the group that could manipulate accounting, as it is the main driver of the GDP of each state. Most Slovak research on creative accounting focuses on the enterprise level due to its importance as a primary contributor to national GDP. A study examined the phenomenon of creative accounting in the transport sector among the Visegrad Four nations [
40]. A separate analysis investigated the aggregation of firms within the Slovak agribusiness sector, which has traditionally demonstrated a significant prevalence of accounting manipulation [
41]. The same authors further expanded their analysis to encompass the construction industry [
41]. The authors of [
3] further examined the issue of financial disclosure in the transport sector, highlighting the risks associated with underreporting and data distortion. The COVID-19 pandemic, as noted in [
42], caused significant disruption and instability for businesses of all sizes, prompting the adoption of smart sensors for real-time financial performance monitoring. A related study [
43] examined publicly traded companies in the Visegrad Four, focusing on their utilisation of earnings management within the framework of shared corporate responsibility and behavioural tendencies in financial reporting. A recent study focused on identifying how corporations manage their earnings using Kasznik’s model [
44]. In addition to this approach, the authors employed correspondence analysis, a visual method well-suited for illustrating patterns in financial data. Benford’s law was also applied in their analysis to detect earnings dilution based on the frequency and order of numerical digits [
44]. According to [
45], the Beneish model remains one of the most reliable tools for uncovering creative accounting practices. Firms often attempt to present manipulated results as quickly as possible in order to attract investors or fulfil reporting benchmarks imposed by regulatory or international frameworks.
In another study, researchers examined the extent to which earnings management facilitates the rapid achievement of strategic business goals [
46]. This issue was further analysed with an emphasis on corporate indebtedness within Slovak firms [
47]. Their results revealed a notable relationship between debt management and earnings manipulation. When a firm alters the true values of its indicators to align with targeted outcomes, as observed in the work of [
48], the distortion becomes evident in the firm’s overall financial condition.
Researchers have formulated numerous models to identify companies engaged in creative accounting practices. Fundamental contributions to this domain encompass the work of [
1,
49,
50], who introduced models for identifying manipulation in financial reporting. The Jones model has emerged as one of the most prevalent linear regression-based instruments for detecting earnings management. It employs variations in sales and long-term assets as explanatory variables and introduces the notion of accruals, which are categorised into discretionary and non-discretionary components. By accounting for variations in receivables, the model subsequently evolved into the Modified Jones model [
50]. The Beneish M-Score is another significant method that uses eight financial ratios to evaluate the probability of financial manipulation. Various empirical contexts have validated its robustness. For instance, reference [
51] highlighted the extensive economic ramifications of financial manipulation, proposing that an increase in fraudulent reporting could lead to macroeconomic instability, including a decline in GDP. Consequently, there is a distinct necessity to create and enhance instruments that can promptly detect manipulative practices and safeguard both markets and investors. As indicated in [
52], linear regression continues to be the primary method employed in fraud detection models, forming the basis of numerous existing approaches. The Modified Jones model is considered one of the most effective instruments for identifying financial irregularities, as noted in references [
45,
53]. This assertion is corroborated by findings from [
54], which validated its superior performance across various contexts. Nevertheless, certain scholars have advocated for the adoption of more adaptable, non-linear methodologies. Research by [
55,
56] highlights the inadequacies of linear models in representing complex connections and recommends models that incorporate non-linearity. For example, ref. [
57] used discriminant analysis to improve the accuracy of the Beneish model. Expanding upon the Beneish framework, ref. [
45] further enhanced the model by integrating indicator values across three successive years to augment temporal precision. Beyond traditional models, novel approaches have also emerged. Ref. [
58] introduced the CFEBT method, which aims to detect creative accounting used to postpone bankruptcy. According to [
59], any effective financial reporting system must prioritise accuracy and truthfulness, especially when financial statements are used for managerial, regulatory, and strategic decision-making purposes. For most interest groups, accounting information remains a primary source of information about the company. Therefore, it is logical that each interest group will expect different values to meet their own goals. Consequently, it is important to determine the limits in accounting legislation by considering the use of different accounting techniques and procedures that accounting entities use to express their objectives. The approach to evaluating the company typically provides the motivation for these goals and the necessary values. In this direction, business evaluation is most conveniently expressed through the improvement of mathematical apparatuses, the decomposition of indicators, and subsequent applications based on selective data that may not always yield the desired exact result. Contend that creative accounting transcends mere technical manipulation, frequently arising from ingrained organisational compromises and decision-making cultures [
60]. Their qualitative findings demonstrate that accounting outcomes mirror internal power dynamics, necessitating a more profound contextual comprehension beyond just quantitative study.
3. Materials and Methods
3.1. Data Used in the Study
The dataset used in this study was sourced from the publicly available Finstat database, which aggregates financial statements and registration information for Slovak and Czech firms. The database facilitates the systematic extraction of firm-level data and is commonly employed in academic research and financial analysis. The database’s accessibility ensures the replicability of the analysis, allowing other researchers to obtain all data using the same filters and timeframes. This source has been utilised in previous empirical investigations concerning Slovak SMEs and financial performance [
45,
48,
61,
62], confirming its pertinence and dependability for scholarly research.
The first dataset comprised 257,234 Slovak enterprises. The final sample, including data cleaning and filtering, consisted of 149,566 firms with consistent reporting from 2016 to 2023. The selection process adhered to the following criteria:
Activity sectors: Companies were classified according to the NACE Rev. 2 taxonomy. We incorporated all private business enterprises throughout sectors A to S, excluding public administration (O), extraterritorial organisations (U), and unclassifiable or state-run entities.
The sample encompasses micro, small, medium, and large firms, categorised according to the European Commission’s SME classification, which is based on turnover and staff count.
Exclusion criteria: Firms without complete or available essential financial statistics (e.g., total assets, equity, revenues), exhibiting zero turnover throughout the whole period, or possessing duplicate/inactive entries were excluded.
Continuity filter: Only firms with valid annual financial data for the entirety of eight years (2016–2023) were included, hence confirming the stability of observed trends.
Each firm in the final dataset is characterised by 12 financial metrics, chosen for their theoretical significance in creative accounting and financial manipulation. These encompass metrics of profitability, liquidity, leverage, and efficiency.
To achieve more granularity, we categorised enterprises by region (NUTS 3 level), facilitating a regional analysis of aberrant conduct. The Bratislava region represented the greatest proportion (32.87%), succeeded by Košice (10.71%) and Žilina (10.65%). This stratification facilitates territorial comparisons and the identification of regional concentration effects.
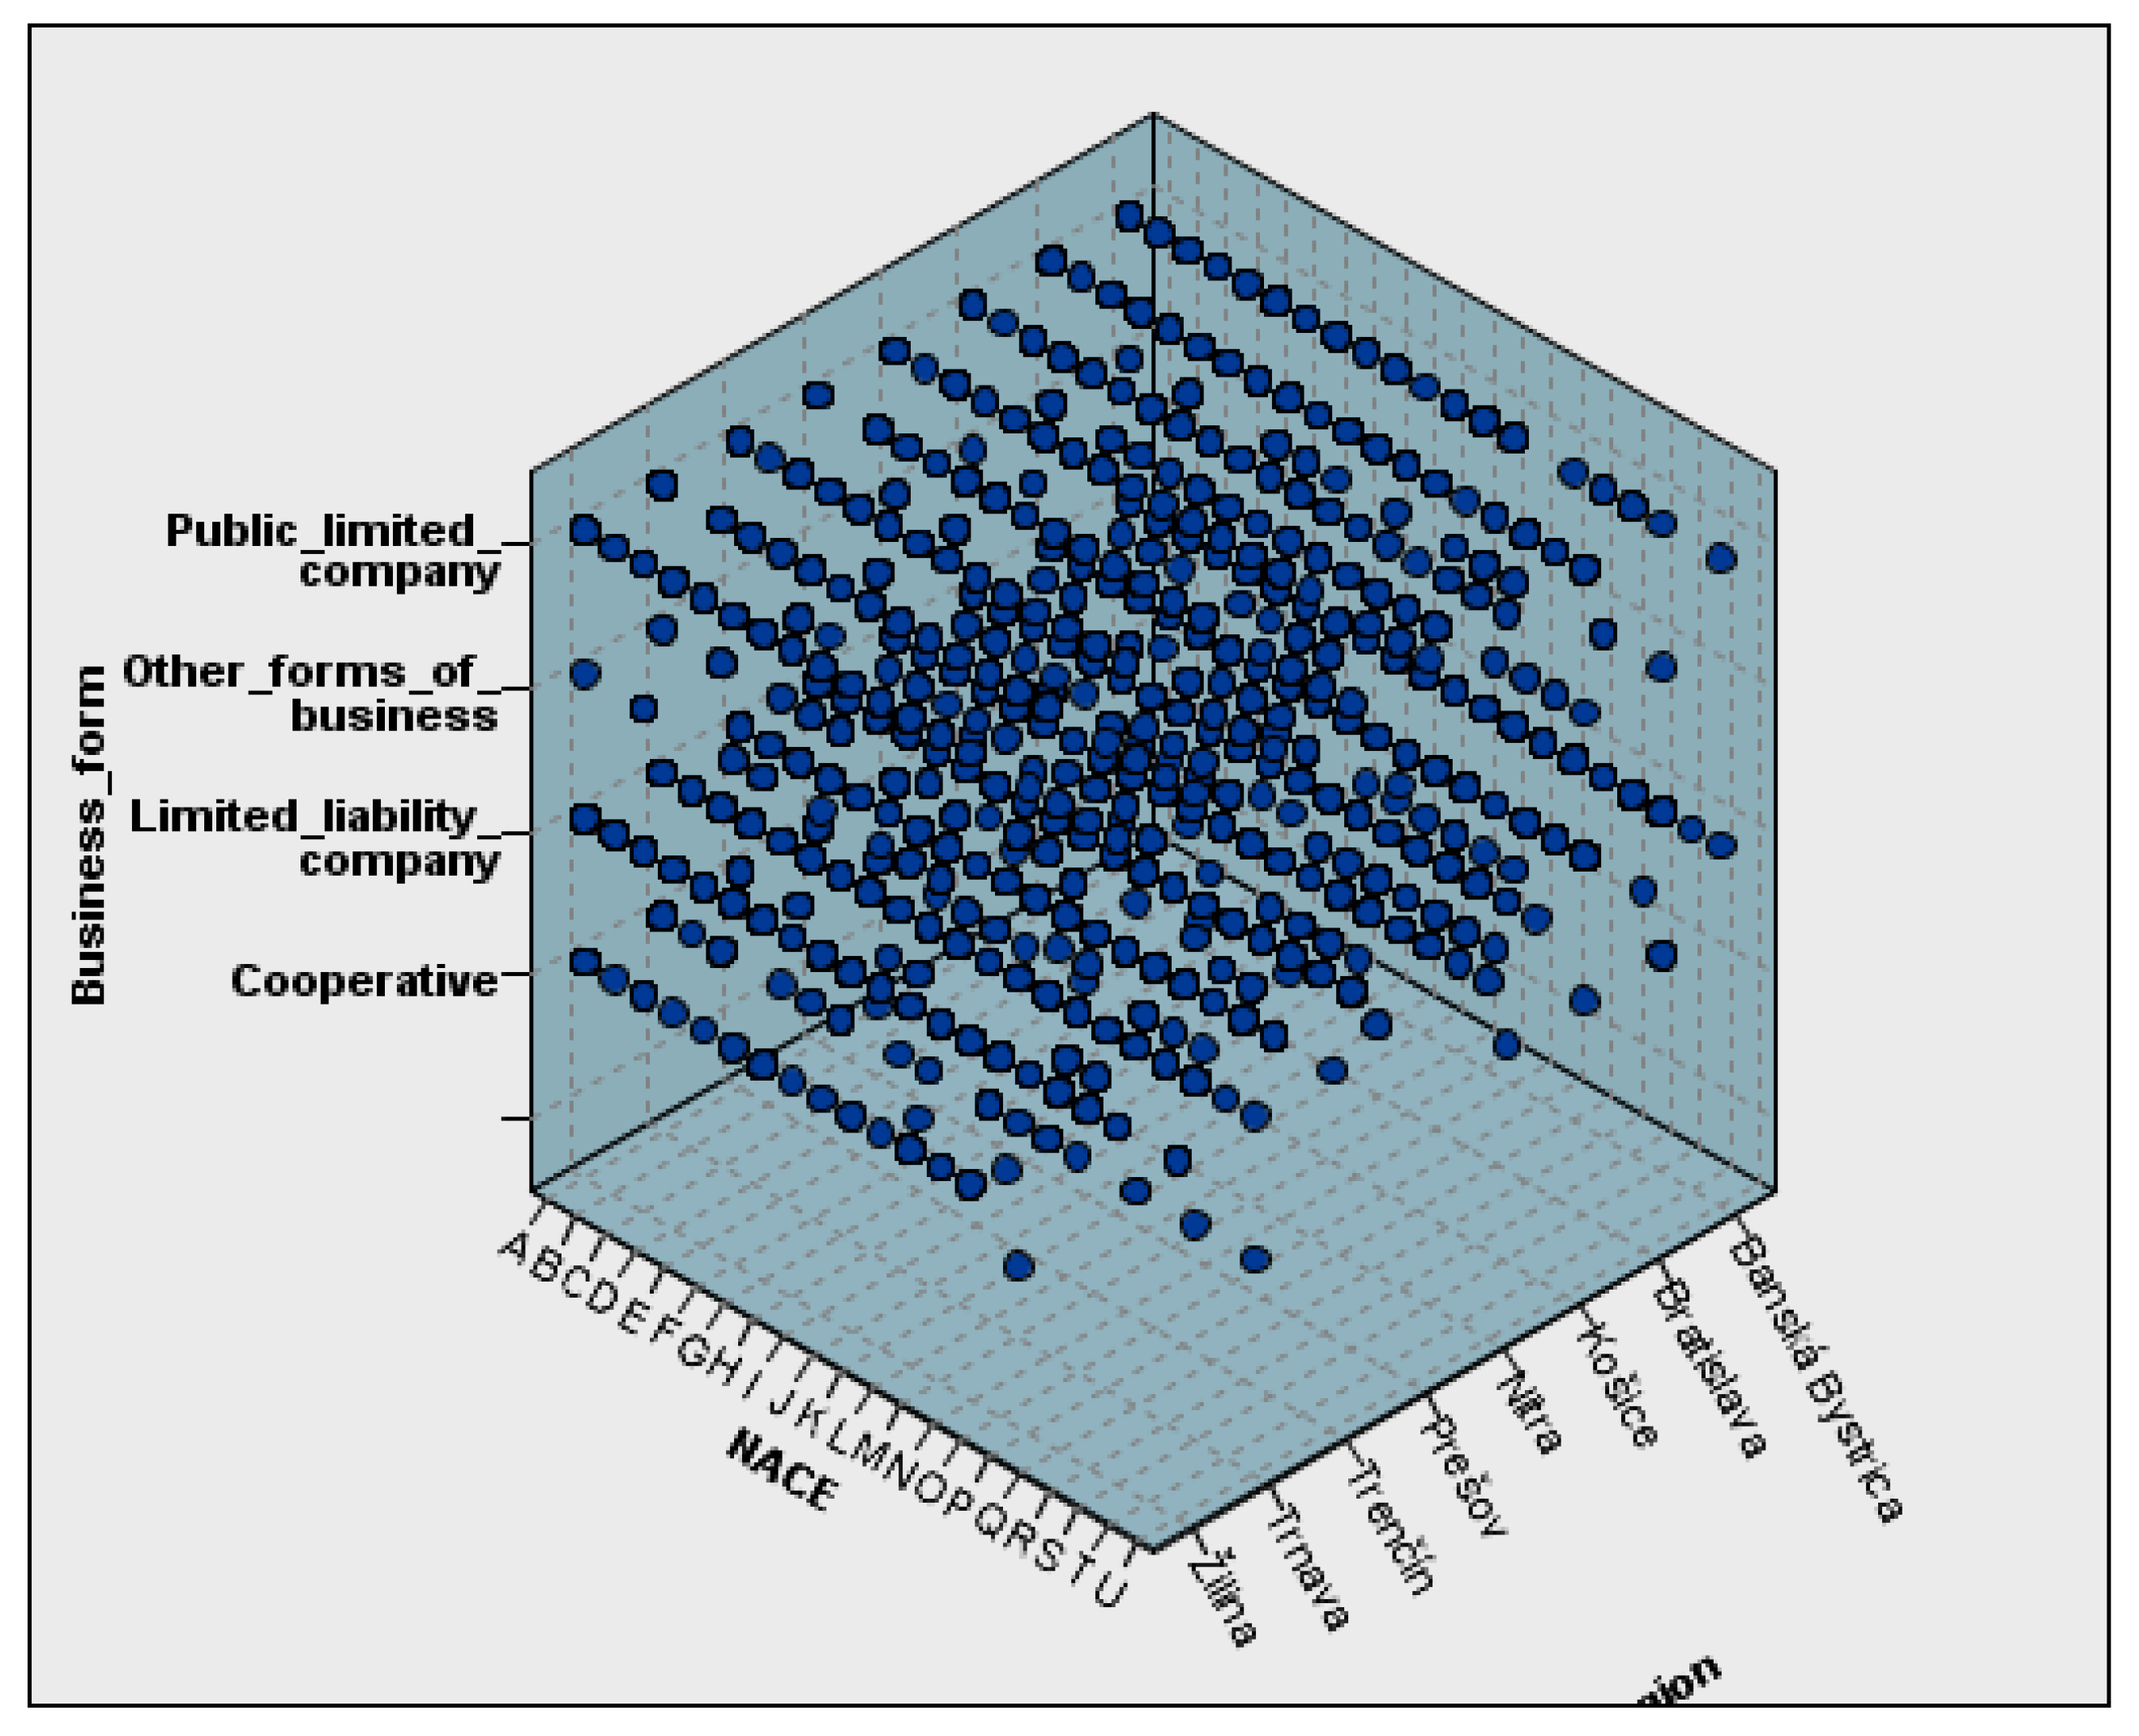
Figure 1 illustrates a three-dimensional depiction of the input dataset used for model building. It depicts the distribution of enterprises based on their legal framework, economic sector (NACE classification), and geographic association (NUTS 3 level). This visual summary contextualises the composition of the sample, guaranteeing that the employed clustering algorithm is based on a sufficiently varied range of elements. The graph was generated using IBM SPSS Statistics, which enables the visualisation of categorical data in multidimensional spaces.
The comprehensive inclusion of enterprises across all regions provides a robust foundation for examining the spatial distribution and economic dynamics of Slovak businesses. The methodology ensured that no relevant business entities were excluded, thereby enhancing the accuracy and generalisability of the study’s findings.
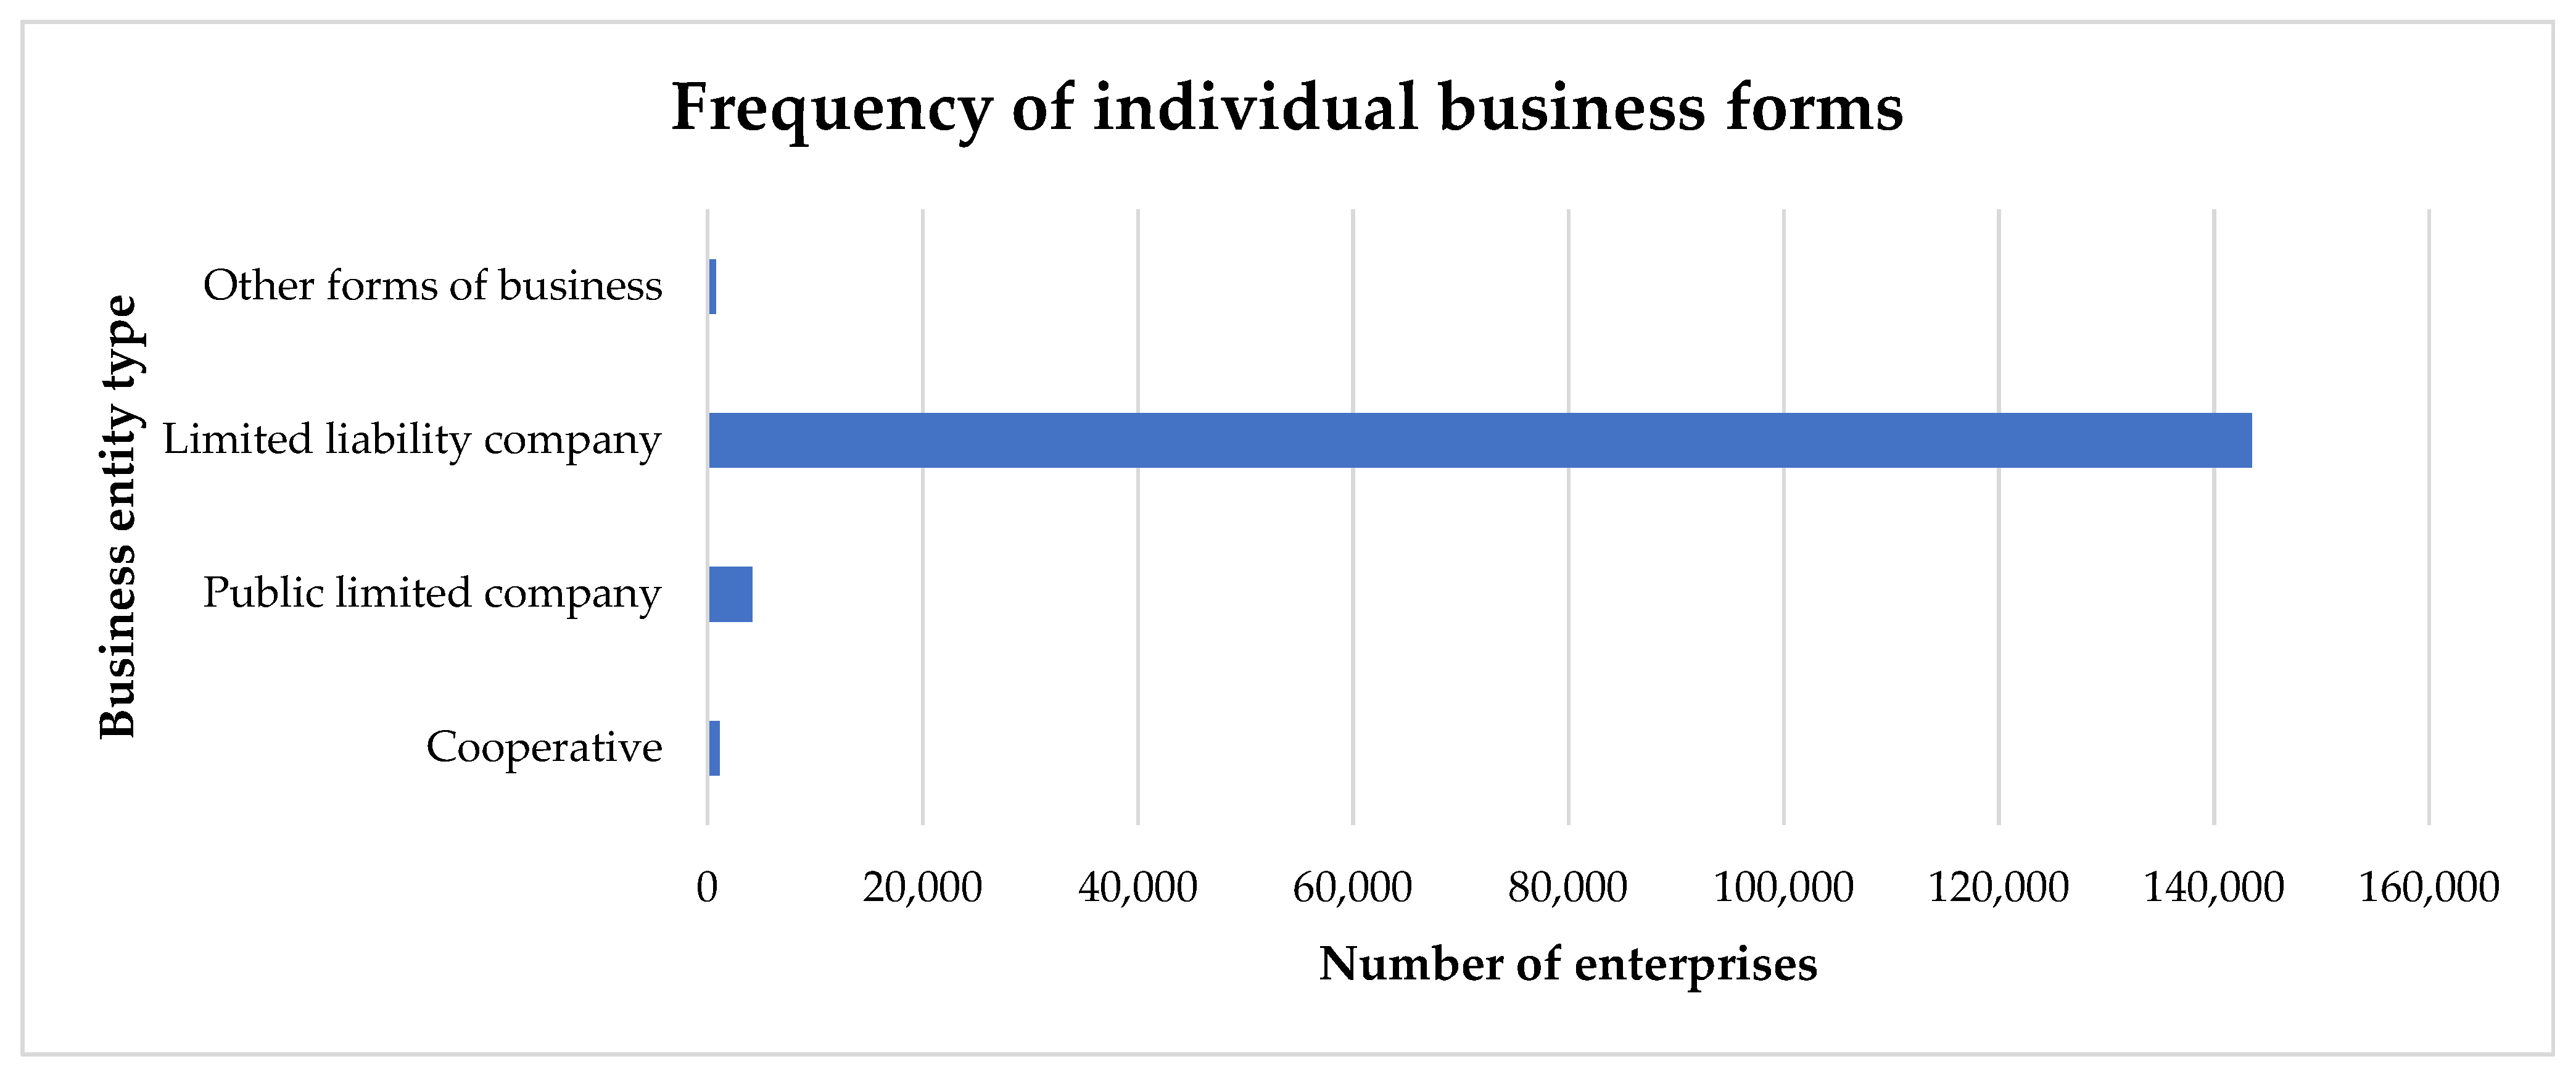
According to data from the Slovak Republic’s Statistical Office, small and medium-sized enterprises (SMEs) with various legal forms account for up to 99.95% of the country’s business environment. In this study, the most prevalent legal form among Slovak enterprises is the limited liability company (LLC), which accounts for 143,506 entities or 95.95% of the analysed sample. This reflects the dominant role of this legal structure in the Slovak business landscape, particularly due to its flexibility and accessibility for smaller enterprises.
The second most numerous legal form is the public limited company (PLC), comprising 4146 entities or 2.77% of the dataset. This form is typically associated with larger corporations operating on a broader, often national or international scale.
The third most common are cooperatives, with 1110 entities (0.74%), which play a niche but stable role, especially in sectors such as agriculture and community-based activities.
Lastly, other business forms account for 804 entities (0.54%), covering a wide range of less common legal structures tailored to specific operational or regulatory needs.
Figure 2 illustrates the distribution of firms categorised by legal forms in the input dataset. This visual representation was generated in Microsoft Excel 365 and enhances the numerical summary by distinctly illustrating the predominant presence of LLCs and the general composition of the examined population. The dataset was sourced from Finstat and encompasses the years 2016 to 2023.
This distribution underscores the predominance of limited liability companies within Slovakia’s business environment, aligning with global trends in the SME sector. The significant share of PLCs and cooperatives further illustrates the diversity of legal forms supporting various economic activities across the country.
To develop a comprehensive model of creative accounting, publicly available data from companies’ financial statements were utilised. A total of 12 financial ratios were chosen for model construction.
Table 1 presents the median values of all selected variables during the reviewed period. Median values were preferred over means, as they provide a more accurate representation of the descriptive characteristics, given that financial ratios often exhibit a strongly right-skewed distribution. Therefore, mean values would not effectively reflect the central tendency of the variables.
These variables were carefully selected to capture the essential components of financial reporting, ensuring consistency and reliability for the modelling process. They provide a comprehensive basis for analysing patterns and behaviours associated with creative accounting practices.
3.2. Methodology of Model Creation
The choice to use clustering-based anomaly detection was motivated by the lack of ground-truth labels in financial data related to fraudulent or irregular accounting activities. Supervised approaches, such as decision trees or neural networks, necessitate labelled datasets, which are rarely accessible or dependable in the context of small and medium-sized enterprises (SMEs). Clustering, specifically the integration of TwoStep and K-means, facilitates the segmentation of companies based on multivariate similarity and the detection of statistical outliers without preconceived assumptions. This methodology is particularly appropriate for extensive datasets, provides clear cluster interpretation, and facilitates replication in empirical research with the same data limitations.
The aim of the project was to develop an unsupervised model for identifying aberrant financial behaviour that could suggest applying creative accounting techniques. Consequently, we employed a two-phase clustering methodology utilising statistical and machine learning approaches executed in IBM SPSS Statistics and IBM SPSS Modeller. These tools were chosen for their reliability in processing large-scale tabular data, their strong implementation of TwoStep and K-means clustering algorithms, and their visual interpretability, which facilitates intuitive comprehension of clustering results. The visualisation and post-processing of the chosen outputs were conducted via Microsoft Excel 365, incorporating Power Pivot and Power Query features.
The modelling process included the subsequent steps:
Variable selection: We employed 12 financial indicators that denote profitability, liquidity, leverage, and operational efficiency. These were selected because of their significance in previous fraud detection research [
2,
6].
Standardization: Before clustering, all continuous variables were standardised via z-scores to ensure comparability and mitigate scale effects.
Initial clustering (TwoStep): We initially employed the TwoStep technique to determine the optimal number of clusters. This approach uses a blend of distance metrics and model-based criteria, including the Bayesian Information Criterion, to ascertain the inherent groups within the dataset.
The final clustering (K-means) used the best number of clusters found by TwoStep to help group the companies more effectively. This amalgamation improves both precision and resilience [
63].
Anomaly detection: We computed the anomaly index for each firm as the Euclidean distance from the corresponding cluster centroid. We identified the companies with the most significant deviation as probable anomalies. We utilised the upper quantile of the distance distribution (Q4) to ascertain the conclusive group of dubious firms.
The system is structured to function without the necessity of prior labelling for fraudulent or non-fraudulent instances. This renders it appropriate for data contexts where financial fraud is underreported, obscured, or only indirectly detectable. It enables regulators and analysts to examine extensive populations and pinpoint cases warranting more forensic scrutiny.
We used the silhouette coefficient to assess the suitability of the cluster structure, measuring both intra-cluster cohesiveness and inter-cluster separation. The finalised model achieved a silhouette score of 1.0, signifying outstanding compactness and differentiation among clusters. This result matches earlier studies showing that performance-related measures for grouping data—like the silhouette coefficient and new validation metrics—are closely linked to how well anomalies are detected, often exceeding Pearson correlation coefficients of 0.95 [
64]. Their findings corroborate our methodological approach and validate the efficacy of employing internal validation criteria to optimise cluster-based anomaly models in unsupervised contexts.
Fraud detection is one of the most common applications of data mining in the field of unsupervised learning. A typical task in this field often involves identifying fraudulent grant applications, insurance claims, tax evasion, or financial statement manipulation. Unlike supervised learning, a key characteristic of unsupervised learning is the absence of an outcome (dependent or target) variable. This absence may arise either from a type of solved problem, the lack of available data or, most typically, from the challenge of measuring the target variable. In our study, this situation arose from the inability to determine from historical records who committed fraud and who did not, except for a few publicly known cases, which are, however, insufficient for a comprehensive evaluation. As a result, traditional supervised machine learning models cannot be effectively utilised to make predictions of fraudulent behaviour based on historical data.
Unsupervised models, as fraudulent financial reporting indeed is, require a different approach and methodology for constructing prediction models. This approach involves identifying typical behavioural patterns within the population of companies and then detecting cases that significantly deviate from these patterns. Such cases are then classified as anomalies and are considered “suspicious” (unusual or outlier) instances in the data that must be further investigated. This procedure is based on the idea that companies with normal behaviour form well-defined clusters, while fraudulent activities appear as outliers or in less cohesive clusters. By analysing cluster characteristics and their deviations, fraudulent behaviour can be effectively detected.
In statistics, anomalies are defined as observations that markedly diverge from the anticipated pattern or trend of the dataset [
65]. Such deviations may occur due to multiple factors, including measurement inaccuracies, inconsistencies in data collection methods, or infrequent occurrences. Anomalies can show up as outliers—values that are far away from the average or other typical values—or as unusual patterns that disrupt the basic organisation of the data [
66].
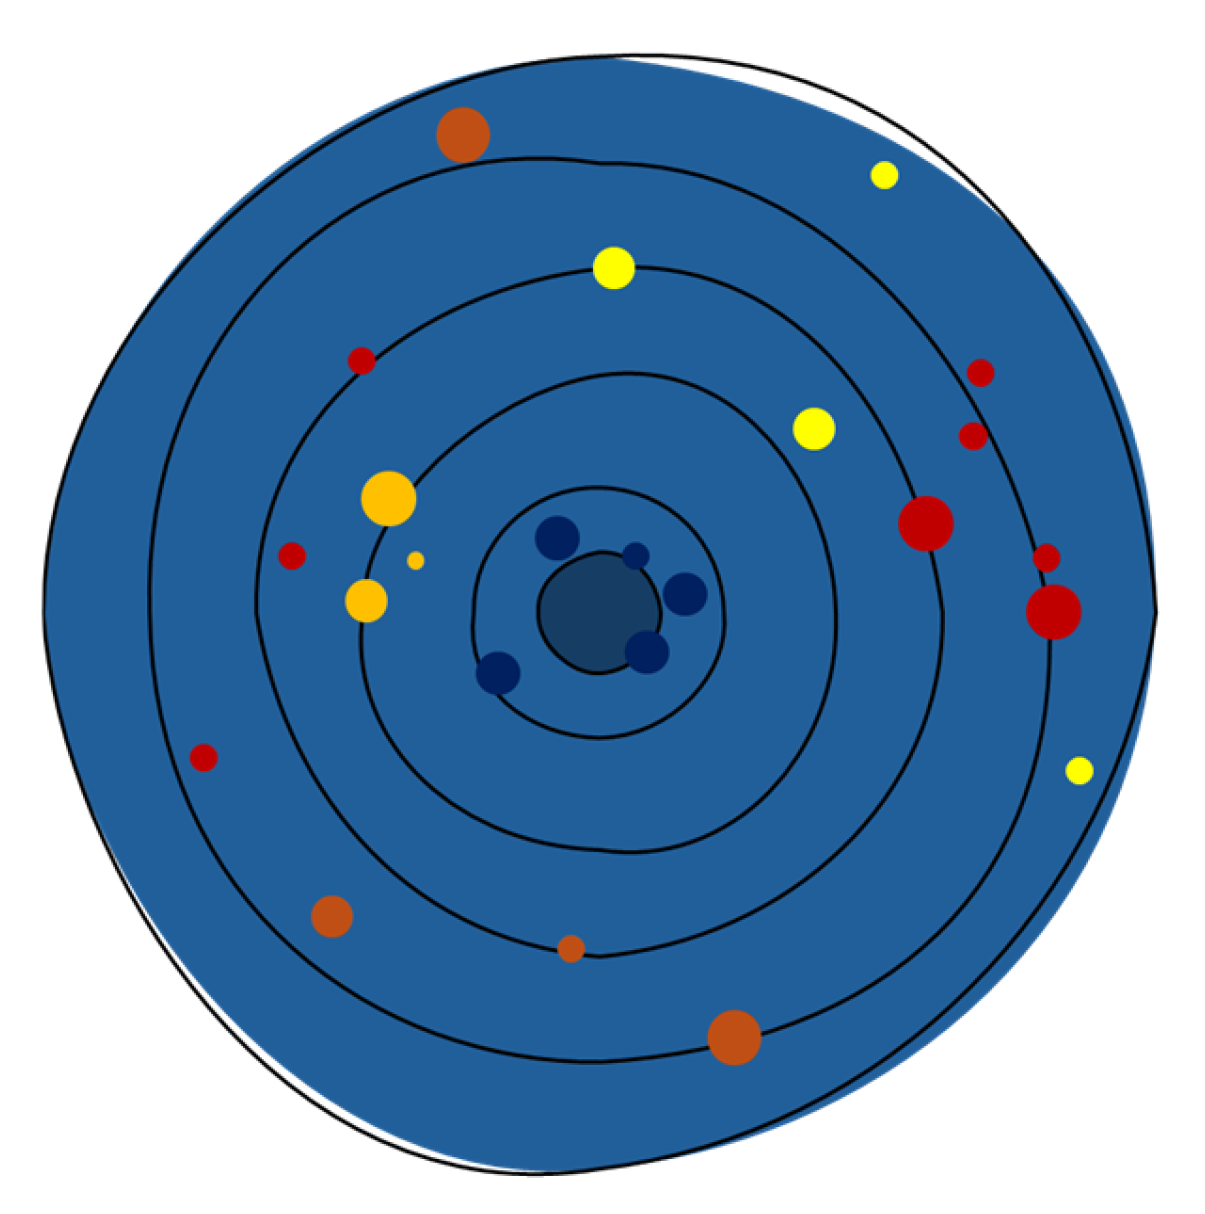
Figure 3 offers a conceptual representation of the clustering-based anomaly detection method, illustrating how abnormalities are identified by their deviation from standard behavioural patterns. The concentric circles depict escalating divergence from the normative centre, which signifies “anticipated” financial behaviour resulting from clustering. Each dot signifies an observation (i.e., enterprise). Dark blue dots in the centre indicate standard or anticipated financial profiles. Conversely, the yellow, orange, and red dots are progressively further away from the centre, indicating greater levels of abnormality. The colour gradient represents the degree of deviation: red indicates the most anomalous entities, whereas yellow shows minor abnormalities. This picture, while not based on actual data, exemplifies the core premise of our analysis: the farther a data point is from the behavioural cluster centroid, the higher the probability that it is deemed anomalous.
The prediction model for identifying potential fraud behaviour is based on the abovementioned principle of finding the typical behavioural patterns within the data cases. This step is conducted through cluster analysis, which aims to find clusters of cases that exhibit similar behaviour within the dataset. This similar behaviour is typically assessed by measuring the minimal distance between cases based on input variable values. Consequently, the fraud detection model is based on the identification of anomalies by finding the companies with the highest distance from the “normal” patterns.
It must be stated that anomalies do not directly mean fraudulent behaviour. Instead, the anomalous case found is potentially fraudulent and needs to be further investigated using appropriate mechanisms. On the other hand, detecting anomalies identifies potential cases that must be subjected to this control instead of complete or random case screening.
Based on the described principle, creating a detection model for fraudulent behaviours involves two main steps. Firstly, the cluster analysis is used to find similar cases in the data. Secondly, the anomalous cases are detected by calculating the measure of anomaly based on the distance of the cases in created clusters from a typical mean representative of the particular cluster (cluster centroid).
In the following section, we will briefly describe the main principles of both these steps.
3.2.1. Cluster Analysis
Cluster analysis is an unsupervised machine learning technique designed to identify groups of similar observations within a dataset. The method guarantees increased intra-cluster similarity while optimising inter-cluster dissimilarity [
67].
The importance of clustering lies in its ability to identify and separate different data groups based on similarities and differences, which later serve as a foundation for constructing a reference model for anomaly detection. Without clustering, detecting anomalies in the data would be highly complex and computationally demanding, as it would require an exceptionally detailed understanding of all possible structures that anomalies might take. Clustering simplifies anomaly detection by identifying underlying structures in the data that may contain anomalies. The more effective the clustering process is, the more accurately anomalies can be detected, ultimately improving the performance of the final model.
Clustering relies on predefined similarity or distance metrics, computed from the values of the selected input variables. The Euclidean distance is favoured for continuous variables, whereas the Manhattan distance is generally employed for categorical or ordinal data [
68]. In practical applications, the squared Euclidean distance is frequently employed to streamline calculations. An additional option is the Mahalanobis distance, which considers correlations among variables. This study employed Euclidean distance as a similarity metric for clustering.
Clustering can be performed utilising various algorithms, including hierarchical clustering and K-means clustering. Hierarchical clustering establishes groups by progressively merging or dividing clusters according to their pairwise distances. This method does not necessitate a predetermined number of clusters; however, it becomes computationally impractical for extensive datasets [
69].
The second clustering algorithm mentioned, K-means clustering, is widely used in financial fraud detection due to its computational efficiency, scalability to large datasets, and ability to group transactions into well-defined clusters. This method defines clusters using centroids and assigns instances based on proximity to the nearest centroid, minimising intra-cluster variances. It is easy to implement and provides intuitive cluster groupings, facilitating the identification of patterns of normal and suspicious behaviour. However, its effectiveness relies on selecting an appropriate number of clusters, k, and it is sensitive to outliers, which can distort centroid positions and lead to the misclassification of fraudulent transactions. Therefore, it is important to note that instances marked as anomalies may not be considered fraud automatically but must be further investigated.
We used TwoStep Cluster Analysis, a scalable, model-based clustering technique included in IBM SPSS Statistics, to categorise the data into internally coherent and externally different groupings. This approach is especially appropriate for extensive datasets and facilitates the use of both continuous and categorical factors in the clustering procedure. The TwoStep technique employs a log-likelihood distance metric, predicated on the premise that continuous variables adhere to normal distributions and categorical variables conform to multinomial distributions, with variables exhibiting mutual independence. Log-likelihood distance is applicable to both continuous and categorical variables. The distance between two clusters is inversely related to the reduction of the natural logarithm of the probability function when they are amalgamated into a single cluster. Log-likelihood distance calculation assumes that continuous variables follow normal distributions, categorical variables adhere to multinomial distributions, and that the variables are independent of one another [
70]. The distance between clusters
and
is defined as follows:
where
And in Equation (2), we obtain the following:
with the following notations:
is the distance between clusters and ;
index that represents the cluster formed by combining clusters and ;
is the totatl number of continuous variables;
is total number of categorical variables;
is the number of categories for the -th categorical variable;
is the total number of data records in cluster ;
is the number of records in cluster whose categorical variable takes category;
is the number of records in categorical variable that take the category;
is the estimated variance (dispersion) of the continuous variable , for the entire dataset;
is the estimated variance of the continuous variable , in cluster .
The method employs a dual-phase approach to autonomously ascertain the quantities of clusters. First, for each possible number of clusters in the specified range, the BIC or AIC (Akaike Information Criterion) is calculated; this value is then used to make an initial guess about how many clusters there are. This study utilised the BIC principle for J clusters, as defined by the following formula:
where
The technique determines the ideal number of clusters by employing the Bayesian Information Criterion, which reconciles model fit with complexity. The TwoStep method’s primary advantage is its automated clustering, which begins with the creation of a Cluster Feature Tree and advances to a probabilistic categorisation of instances, allocating each example to a cluster according to the calculated probability of cluster affiliation. The resultant clusters signify collections of enterprises exhibiting analogous financial profiles, which are thereafter used as a benchmark for anomaly detection.
This study employed K-means clustering with k designated as 5 clusters, which proved to be a suitable quantity, corroborated by the same value obtained from the TwoStep clustering method.
3.2.2. Anomalies Detection
During the clustering process, observations are assigned to different clusters, and for each cluster, a centroid is calculated as the mean of the attribute values within that cluster. This centroid serves as a typical representative of the cluster. In mathematics, a centroid represents the central point of a geometric shape, symmetrically positioned relative to all other points within that shape. In data analysis, centroids are often used to represent the central points of clusters, calculated as the mean, acting as a typical cluster representative.
Furthermore, centroids are frequently used to compute distances between data points in data analysis. The distance between two data points is commonly assessed based on the distance between their respective centroids. This concept is particularly relevant in anomaly detection, as anomalies are identified by their significant deviation from the centroid of a given cluster. Thus, clustering not only helps structure data but also enhances the efficiency and accuracy of anomaly detection within datasets.
In this study, the anomaly index serves as a quantitative metric for deviations from standard financial behaviour. It gives a number to each observation that shows how much it differs from the usual pattern, making it easier to spot possible fraud or unusual cases. The anomaly index is generally computed as the distance between a data point and the centroid of its designated cluster, with elevated values signifying a higher probability of abnormal behaviour [
71].
Mathematically, the anomaly index for a company
can be defined as the ratio of the distance of
from the centroid to the average distance of all cases in the cluster from its centroid, written as follows:
where
is an Euclidean distance between company
and its corresponding cluster centroid
and the denominator is the mean of the distances of all companies
from the cluster centroid
.
Integrating the anomaly index in fraud detection models enables financial institutions to systematically prioritise high-risk transactions for further examination. A predetermined anomaly threshold is set to detect potentially fraudulent behaviour by flagging instances that exceed the critical anomaly index value [
72]. Should the distance from the centroid exceed this threshold, the respective observation is deemed anomalous. Another option should be to set a proportion of companies which would be considered anomalies, for example, 5 or 10% of companies, and consider them candidates for further investigation.
All calculations in this study were conducted using IBM SPSS Statistics (version 29) and the IBM SPSS Modeller (version 18.3), which provide functionalities for creating the model for detecting anomalies. To construct such a model, it is essential that this exploratory method, designed to detect unusual or outlier observations, is integrated with both nominal and numerical variables. This ensures that after thorough data preparation, the final model is successfully developed.
3.3. Model Evaluation
The quality of clustering is contingent upon the judicious selection of input variables, the selection of an effective clustering algorithm, and the identification of the ideal number of groups. The TwoStep clustering approach estimates this number using the BIC, which reconciles model fit with complexity.
We used the silhouette coefficient, a recognised internal validation metric, to assess the internal structure of the resultant clusters. This metric evaluates intra-cluster cohesiveness and inter-cluster separation, making it especially appropriate for unsupervised learning tasks that lack labelled data for model validation.
Substantiate the utilisation of internal validation methodologies, highlighting the strong correlation between clustering quality and the efficacy of anomaly detection models [
64]. Their research indicates that internal metrics such as the silhouette coefficient can function as reliable indicators of model validity when ground-truth labels are unavailable.
The silhouette is calculated as a measure of similarity between individual cases and the clusters to which they have been assigned. Specifically, in clustering with
k clusters and
n cases, let
represent the average distance of case
from all other cases within the cluster to which it was assigned, and let
be the smallest average distance of case
i from all cases in any other cluster. Simply said, the silhouette compares the distances from the closest and the second closest cluster representatives. Then, the silhouette can be calculated as follows:
The silhouette score for the entire model is computed as the average silhouette score across all instances. The silhouette value ranges from −1 to 1, where the definitions are as follows:
A value of 1 indicates that the instances are well separated within their clusters and exhibit strong similarity to their assigned clusters.
A value of −1 signifies that the instances have been misclassified, implying a faulty clustering process.
A value of 0 means that the instances are equally close to their assigned clusters and other clusters they were not supposed to belong to.
Subsequently, we calculated an anomaly index for each organisation based on its Euclidean distance from the cluster centroid. The larger the distance, the more unconventional the firm’s financial profile is compared to its designated cluster. This unsupervised, distance-based methodology facilitates the detection of possible anomalies without dependence on established fraud cases.
Purity is calculated as the ratio of correctly assigned data cases to the total number of data cases. Specifically, in clustering with
k clusters and
n instances, let
represent the number of cases in the true cluster
i assigned to cluster
j during the clustering process. Then, purity can be computed as follows:
Purity is a value ranging from 0 to 1, with 1 indicating a perfect match between the true clusters and the clustering model, while 0 signifies a complete mismatch. It is essential to note that purity may become an ineffective metric in situations where samples across multiple clusters are highly similar or when clustering is not entirely distinct. In such cases, additional metrics such as the silhouette score or the Calinski–Harabasz index may be more suitable for evaluating clustering quality.
4. Results
The implementation of the integrated TwoStep and K-means clustering algorithms yielded five distinct clusters, each embodying a specific financial behaviour pattern across the study timeframe. The computed anomaly index, which is defined as the Euclidean distance from the cluster centroid, classified 231 companies (roughly 0.15% of the dataset) as anomalous. These organisations significantly diverged from their cluster’s standard financial profile and were consequently identified for additional analysis.
Cluster analysis was conducted using the two-step clustering algorithm included in IBM SPSS Statistics. This approach autonomously identified the ideal cluster count via the BIC and categorised the companies according to their financial behaviours.
A total of 96 input variables, resulting from 12 principal financial indicators, were utilised and picked according to the variables outlined in the Beneish models, including the eight consecutive years under examination (2016–2023). This temporal granularity enables the model to identify structural and behavioural irregularities throughout time.
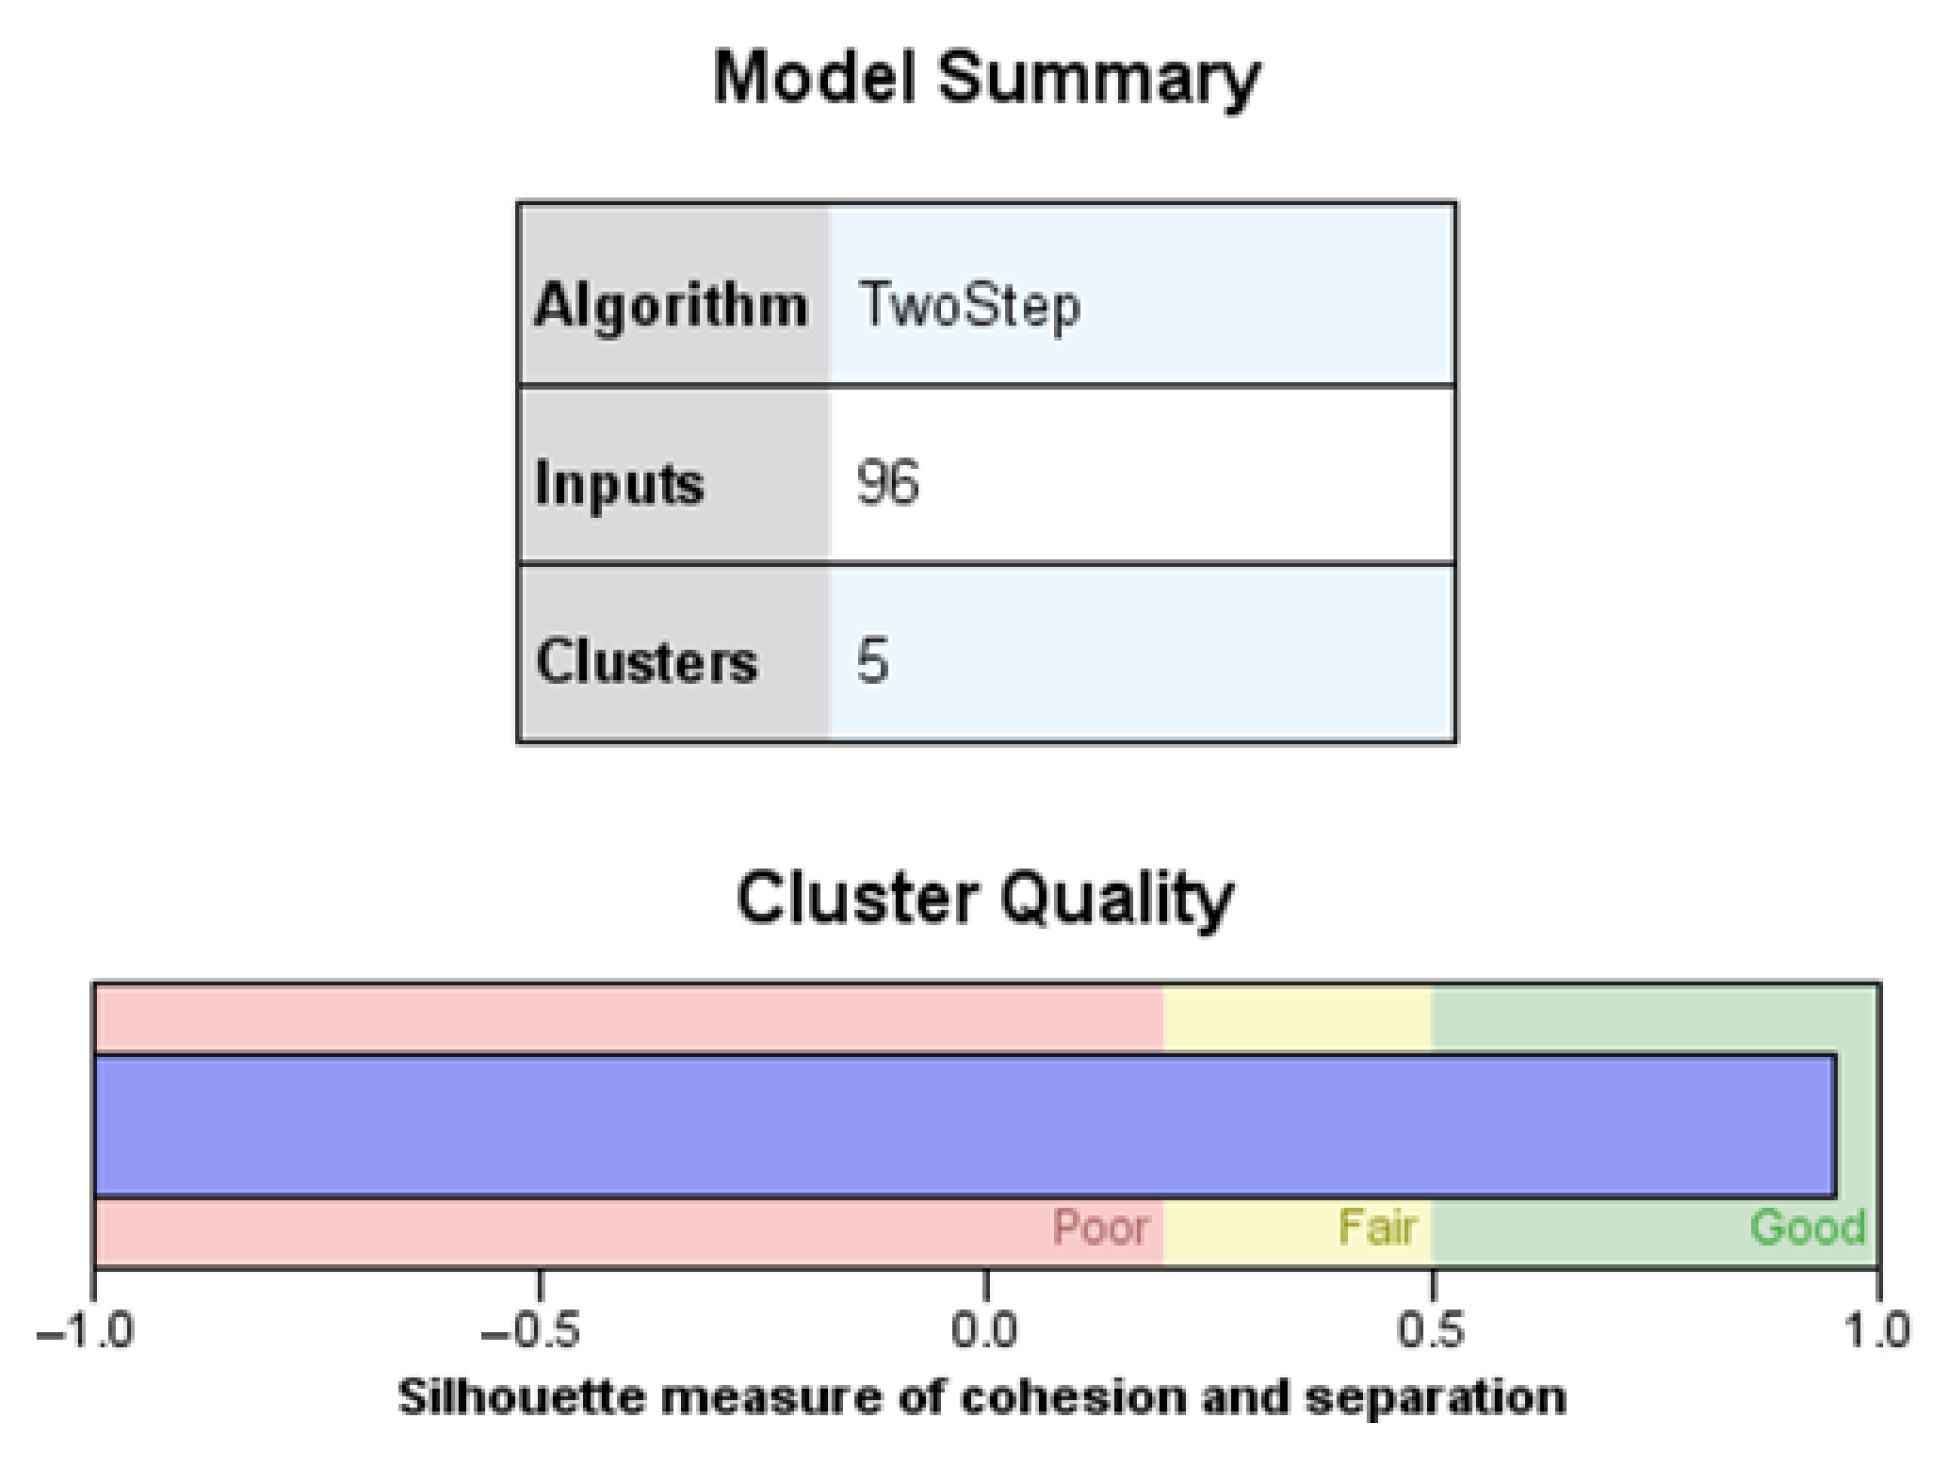
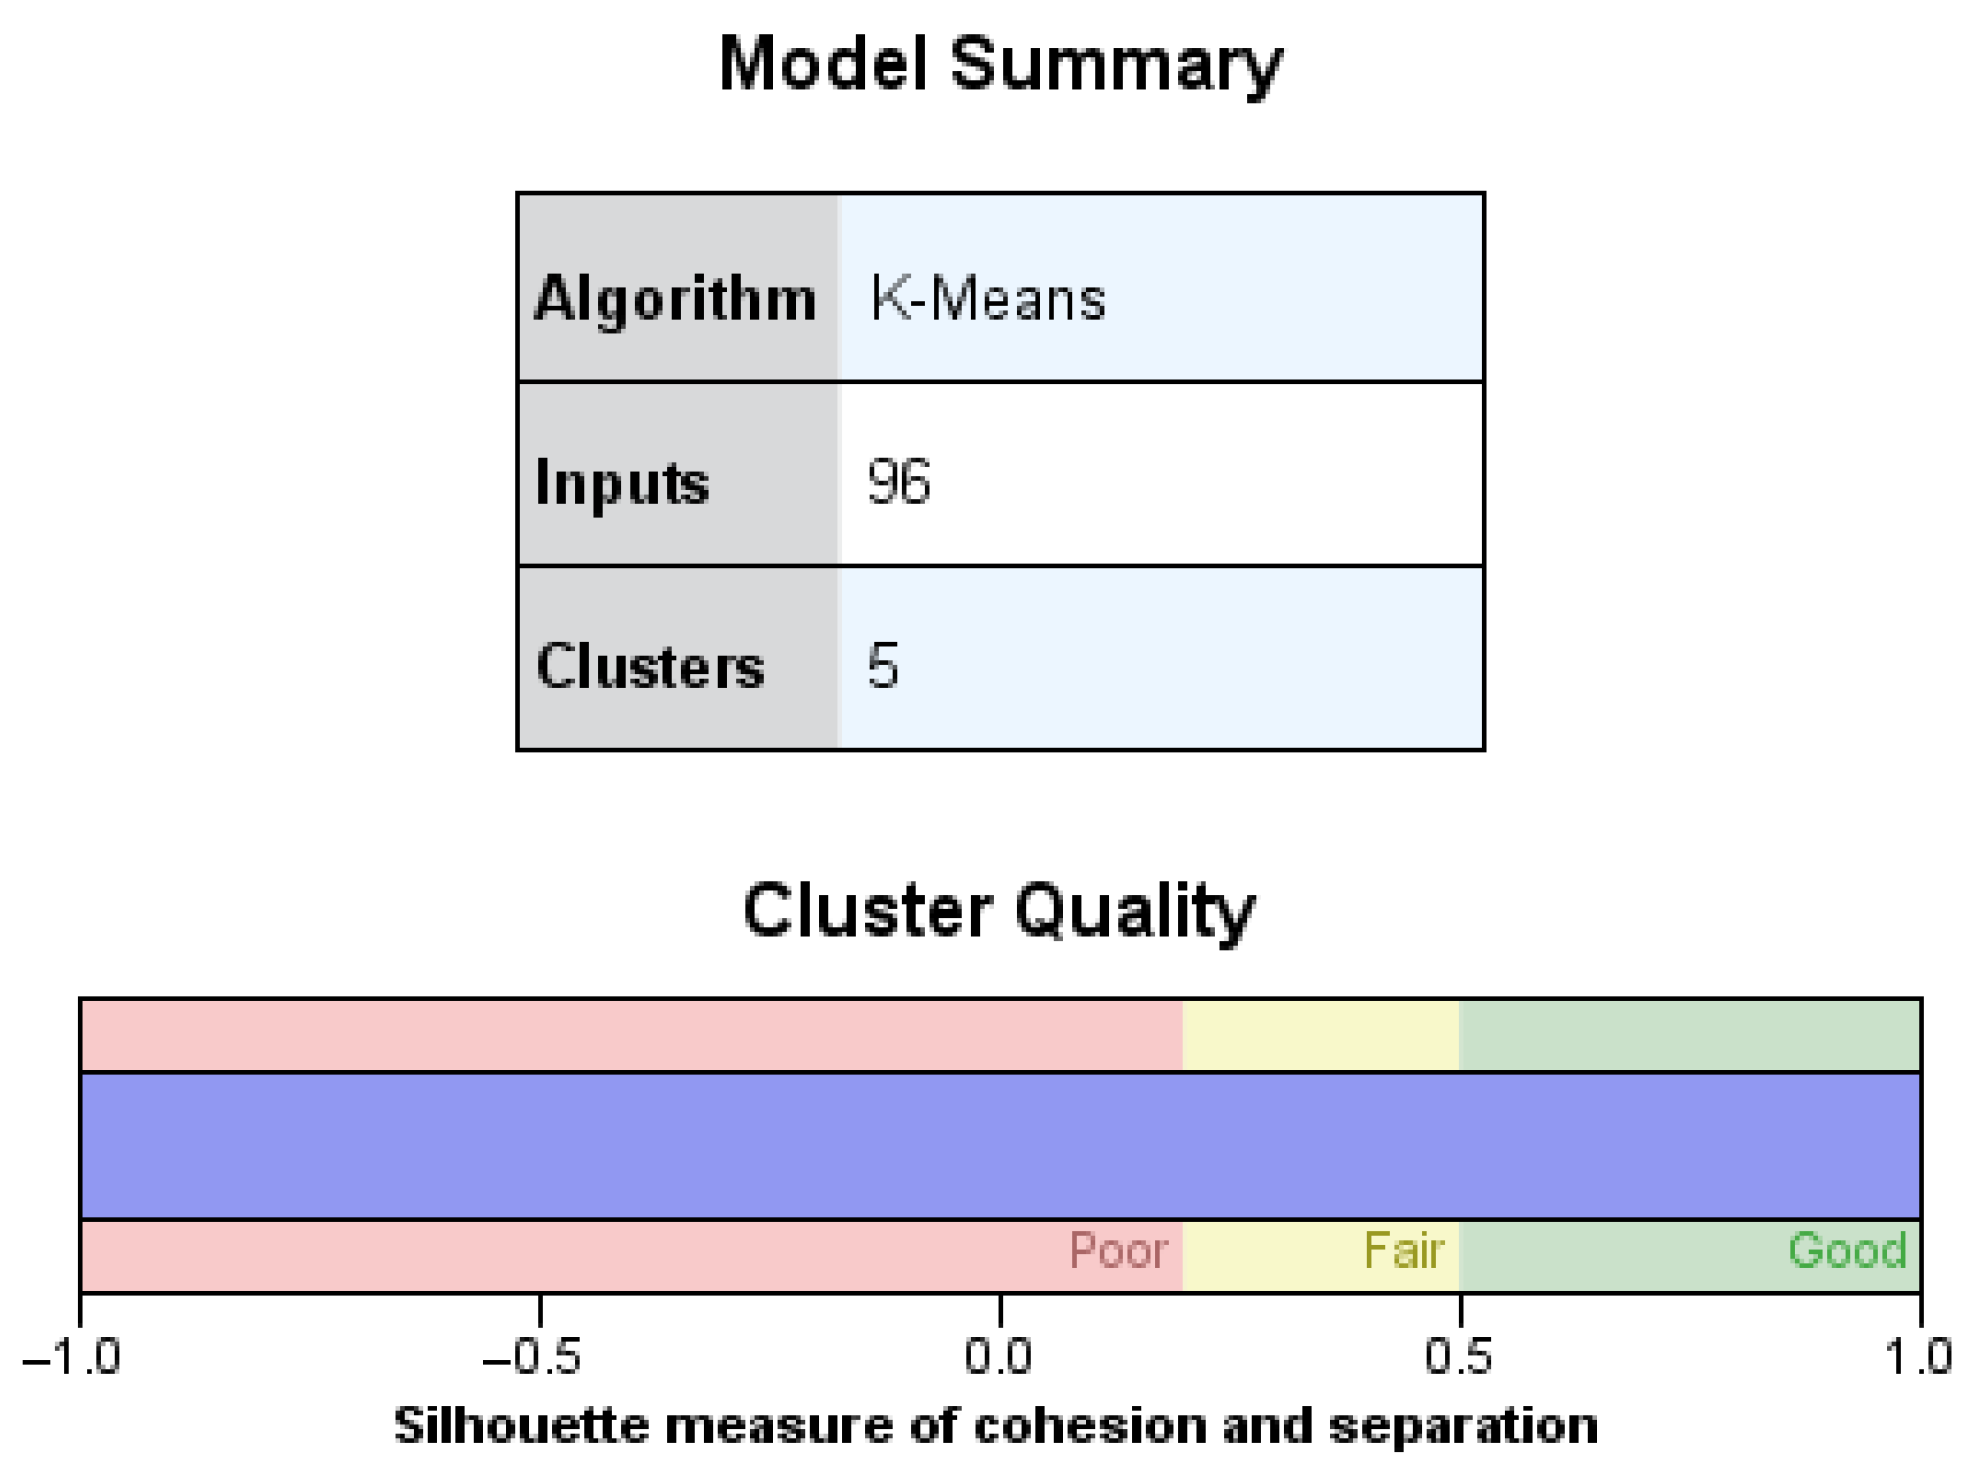
The clustering process yielded five discrete clusters, as illustrated in
Figure 4. The upper panel of the graphic displays the model configuration, whereas the lower bar depicts the silhouette measure of cohesiveness and separation, which is categorised as “Good”. The result indicates that the clusters are clearly delineated and internally coherent, hence enhancing the reliability of later anomaly identification.
This internal validation technique adheres to the principles established by Foorthuis [
64], which enhances the methodological rigour of the model.
The K-means technique used in IBM SPSS Modeller indicates a total of five clusters. The operating profit from 2016 to 2023 was used as the input sample variable for demonstration purposes.
The quality of the clustering solution was assessed using the silhouette coefficient, which evaluates both cohesion (within-cluster similarity) and separation (between-cluster dissimilarity). The resulting average silhouette value of 1.00 indicates excellent cluster quality, meaning that the individual cases are strongly associated with their assigned cluster and clearly distinct from cases in other clusters. According to the methodology employed in SPSS Modeller, this reflects a high degree of internal homogeneity and external heterogeneity among the clusters.
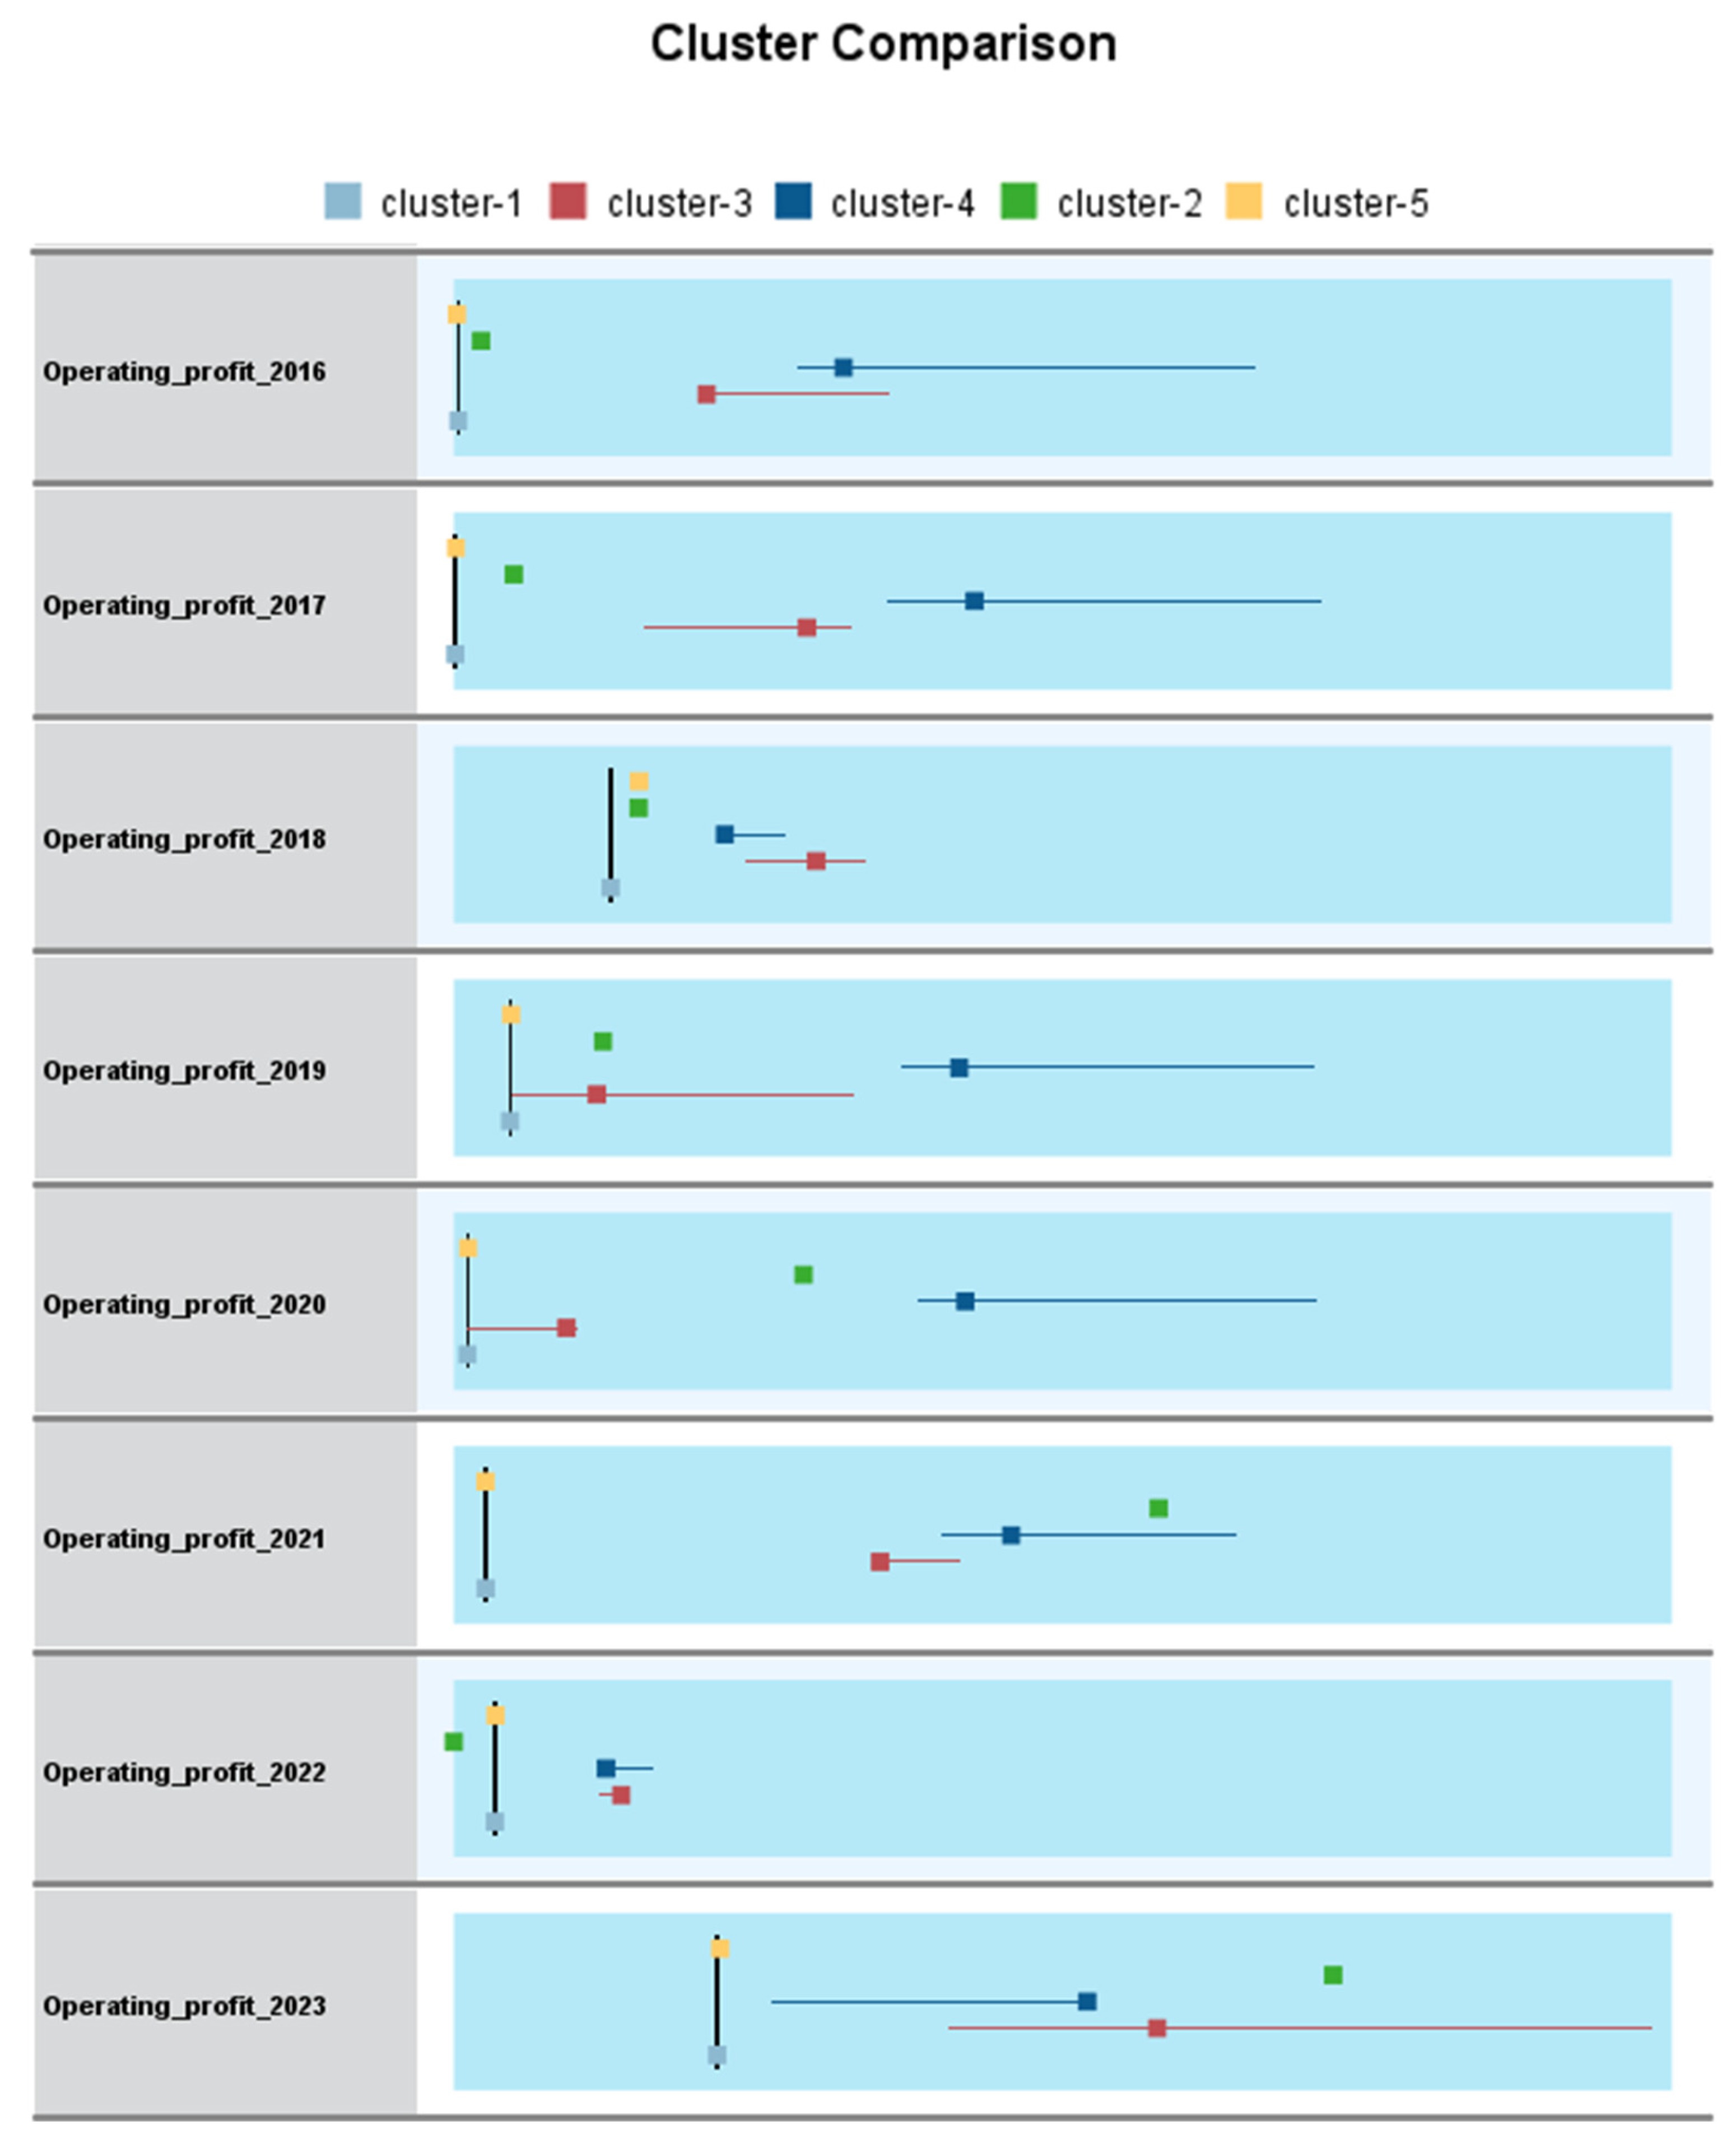
Figure 5 illustrates a comparative chart of clusters showing the annual distribution of operating profit across five clusters from 2016 to 2023. This visualisation was created using the IBM SPSS Modeller for post-clustering analysis. The figure facilitates an intuitive comparison of profitability patterns both within and among clusters over time.
Each coloured sign represents one of the five clusters, while the horizontal placement reflects the distribution of operating earnings for a specific year. The image illustrates the historical dynamics of financial performance, facilitating the discovery of systemic disparities between groups.
Visually, distinct patterns emerge: Cluster 4 consistently exhibits elevated operational profit values, while Cluster 5 comprises firms with diminished or negative profitability. The inter-cluster disparities underscore the varied characteristics of financial conduct within the sample. Certain clusters demonstrate increased variability throughout the years, indicating disparities in risk exposure, operational stability, or sectoral sensitivity.
The chart illustrates the efficacy of the clustering method, particularly the application of the K-means algorithm subsequent to the TwoStep calculation of the ideal number of clusters. The model attained a high silhouette coefficient, reinforcing the statistical validity of the segmentation. This output establishes a basis for subsequent targeted analysis, such as identifying cluster-specific financial paths, conducting strategic benchmarking, or detecting anomalies based on temporal aberrations.
Figure 6 encapsulates the outcomes of the final clustering operation, which employed the K-means algorithm with 96 input variables across the period from 2016 to 2023. The ideal number of clusters (k = 5) was previously determined by two-step clustering using the BIC.
The silhouette coefficient, shown in the lower panel of the figure, attained a value of 1.0, regarded as outstanding in clustering analysis. This score signifies that each observation is strongly cohesive inside its designated cluster and distinctly differentiated from other clusters.
This outcome offers robust statistical evidence for the validity and reliability of the created clusters, enhancing their appropriateness for further interpretation and anomaly identification. The figure was produced using IBM SPSS Modeller, which combines cluster summary tables with graphical validation tools.
This internal validation substantiates the efficacy of the clustering methodology, as advocated in the literature [
65], wherein the silhouette index is acknowledged as a highly reliable metric of clustering performance in unsupervised learning contexts.
We computed the anomaly index for each company by measuring its Euclidean distance from the designated cluster centroid to identify those exhibiting possibly fraudulent financial conduct. This distance-based index measures the divergence of each observation from the standard cluster configuration.
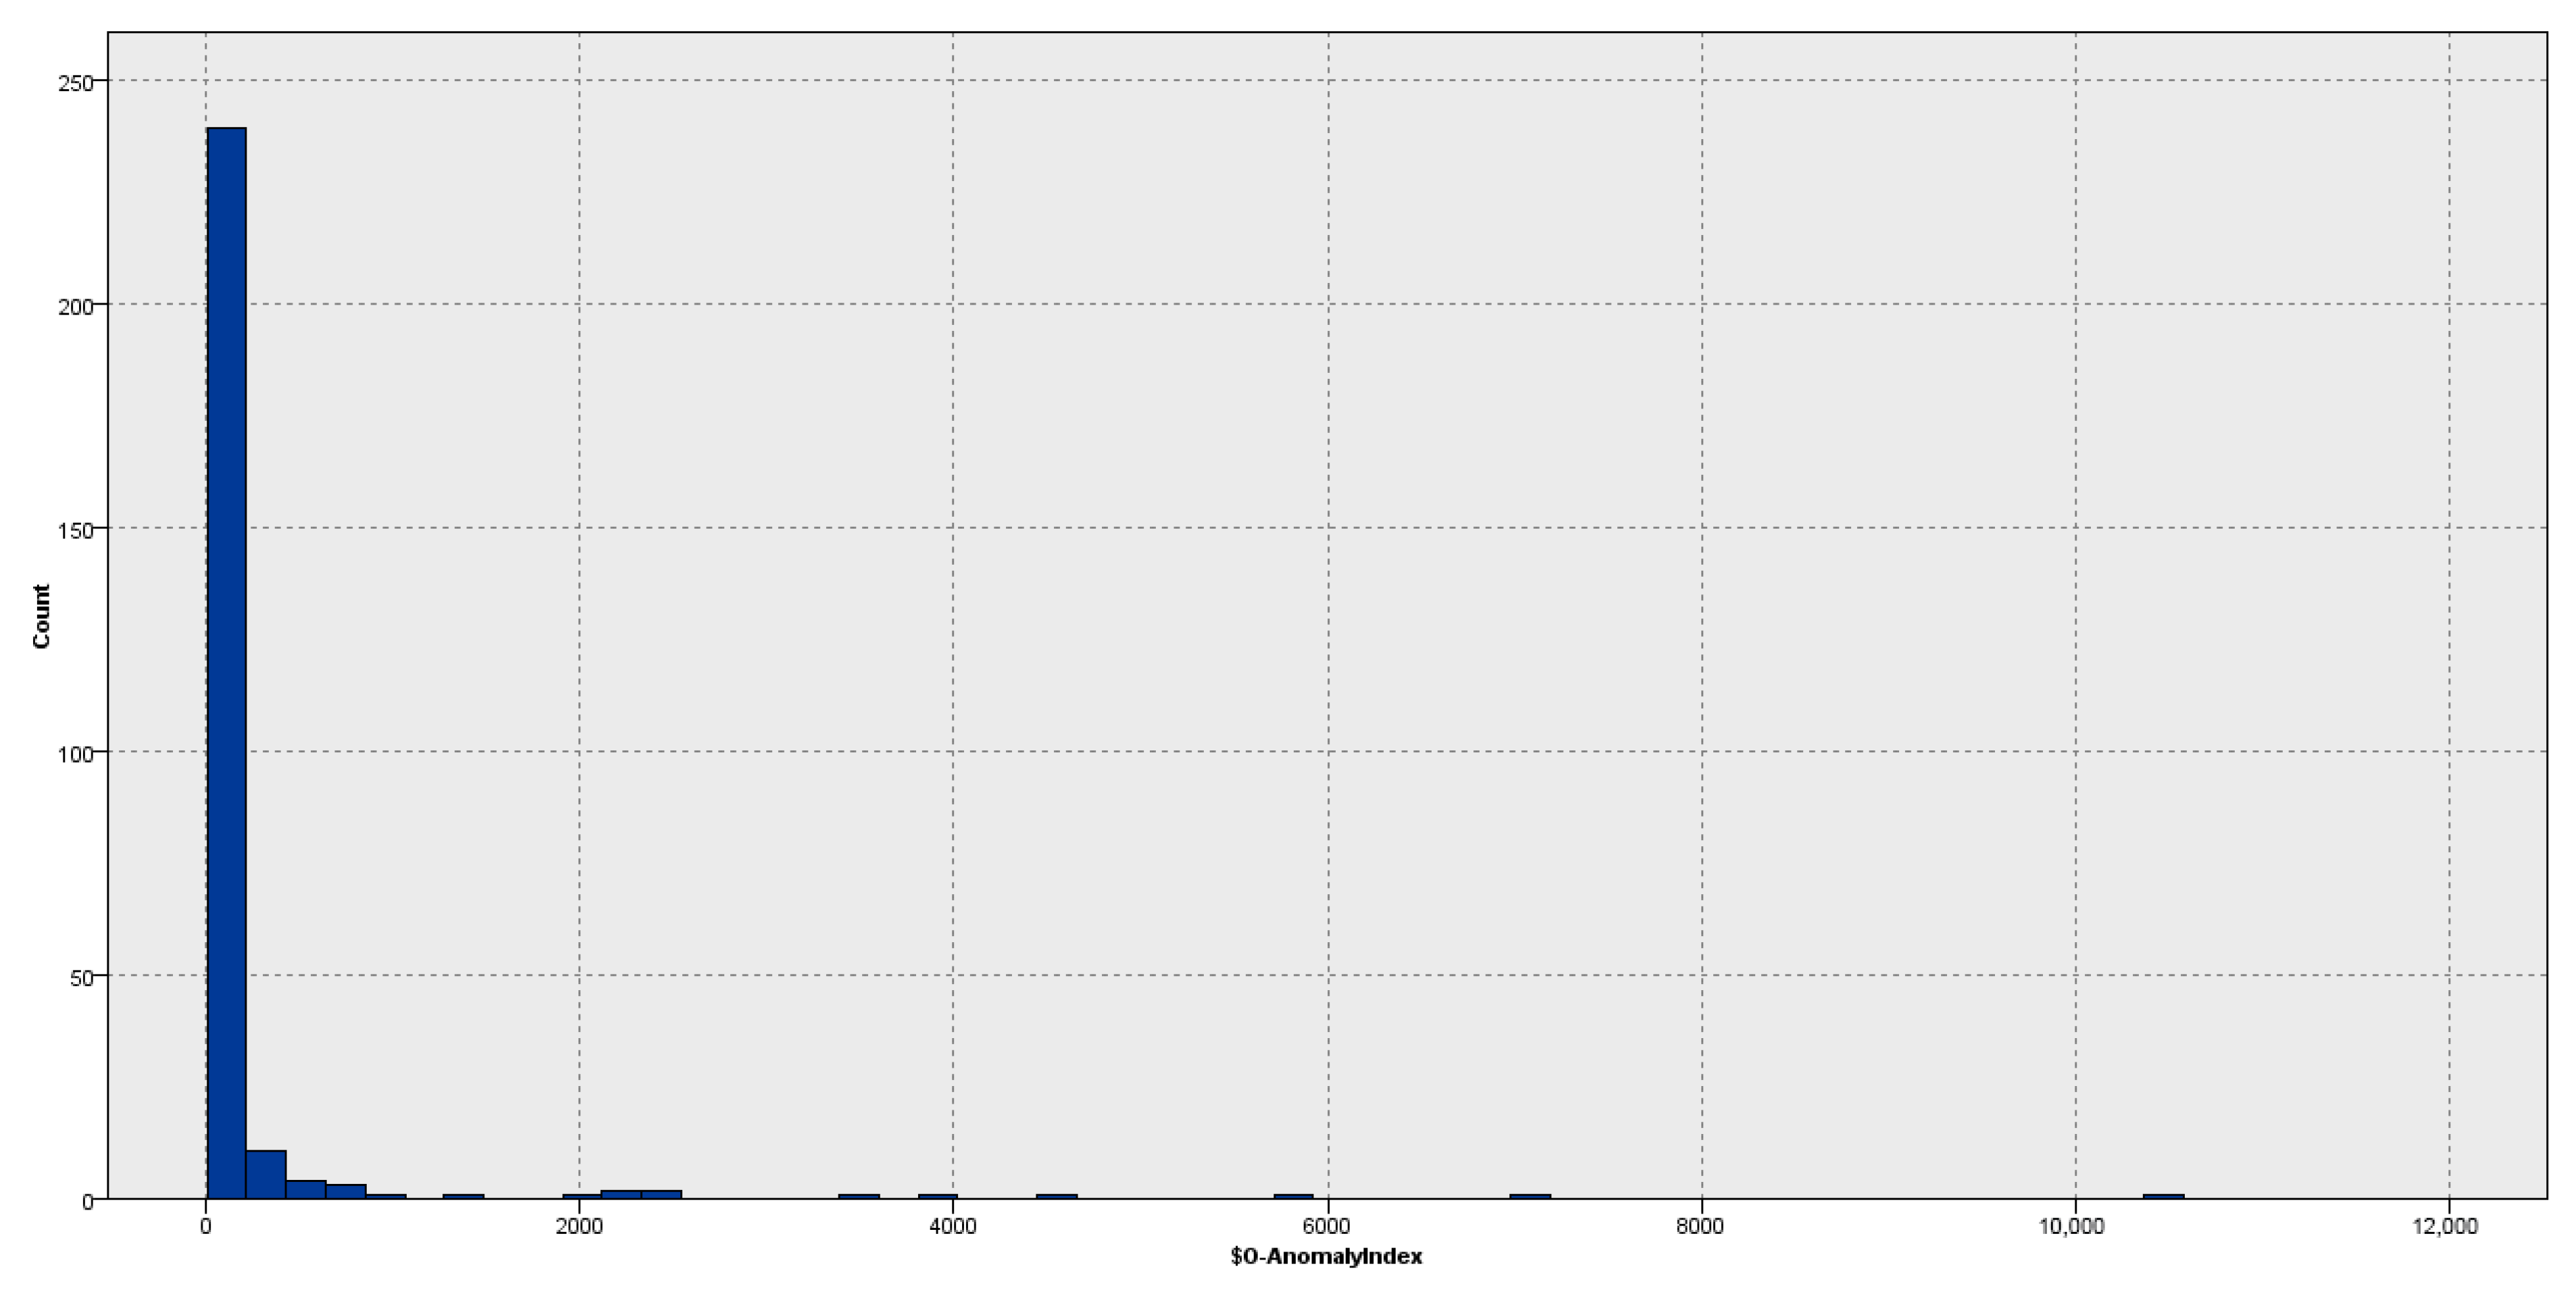
Figure 7 illustrates a histogram of anomaly index values for all enterprises in the sample. The majority of firms congregate around low index values, signifying adherence to anticipated financial conduct. The distribution displays an elongated right-hand tail, indicating firms with progressively unusual financial profiles.
This graphical form facilitates visual analysis of the distribution shape and aids in establishing an appropriate threshold for anomaly categorisation. In later stages, a cut-off value is determined to isolate the most severe outliers from the sample for comprehensive examination. The histogram was generated in IBM SPSS Modeller, facilitating the smooth integration of cluster results with exploratory visualisations.
To mitigate the pronounced skewness in the anomaly index distribution (refer to
Figure 7), we implemented a logarithmic modification (base 10) on the index data. This adjustment enhances data interpretability by broadening the range of lower values and condensing outliers into a more comprehensible scale.
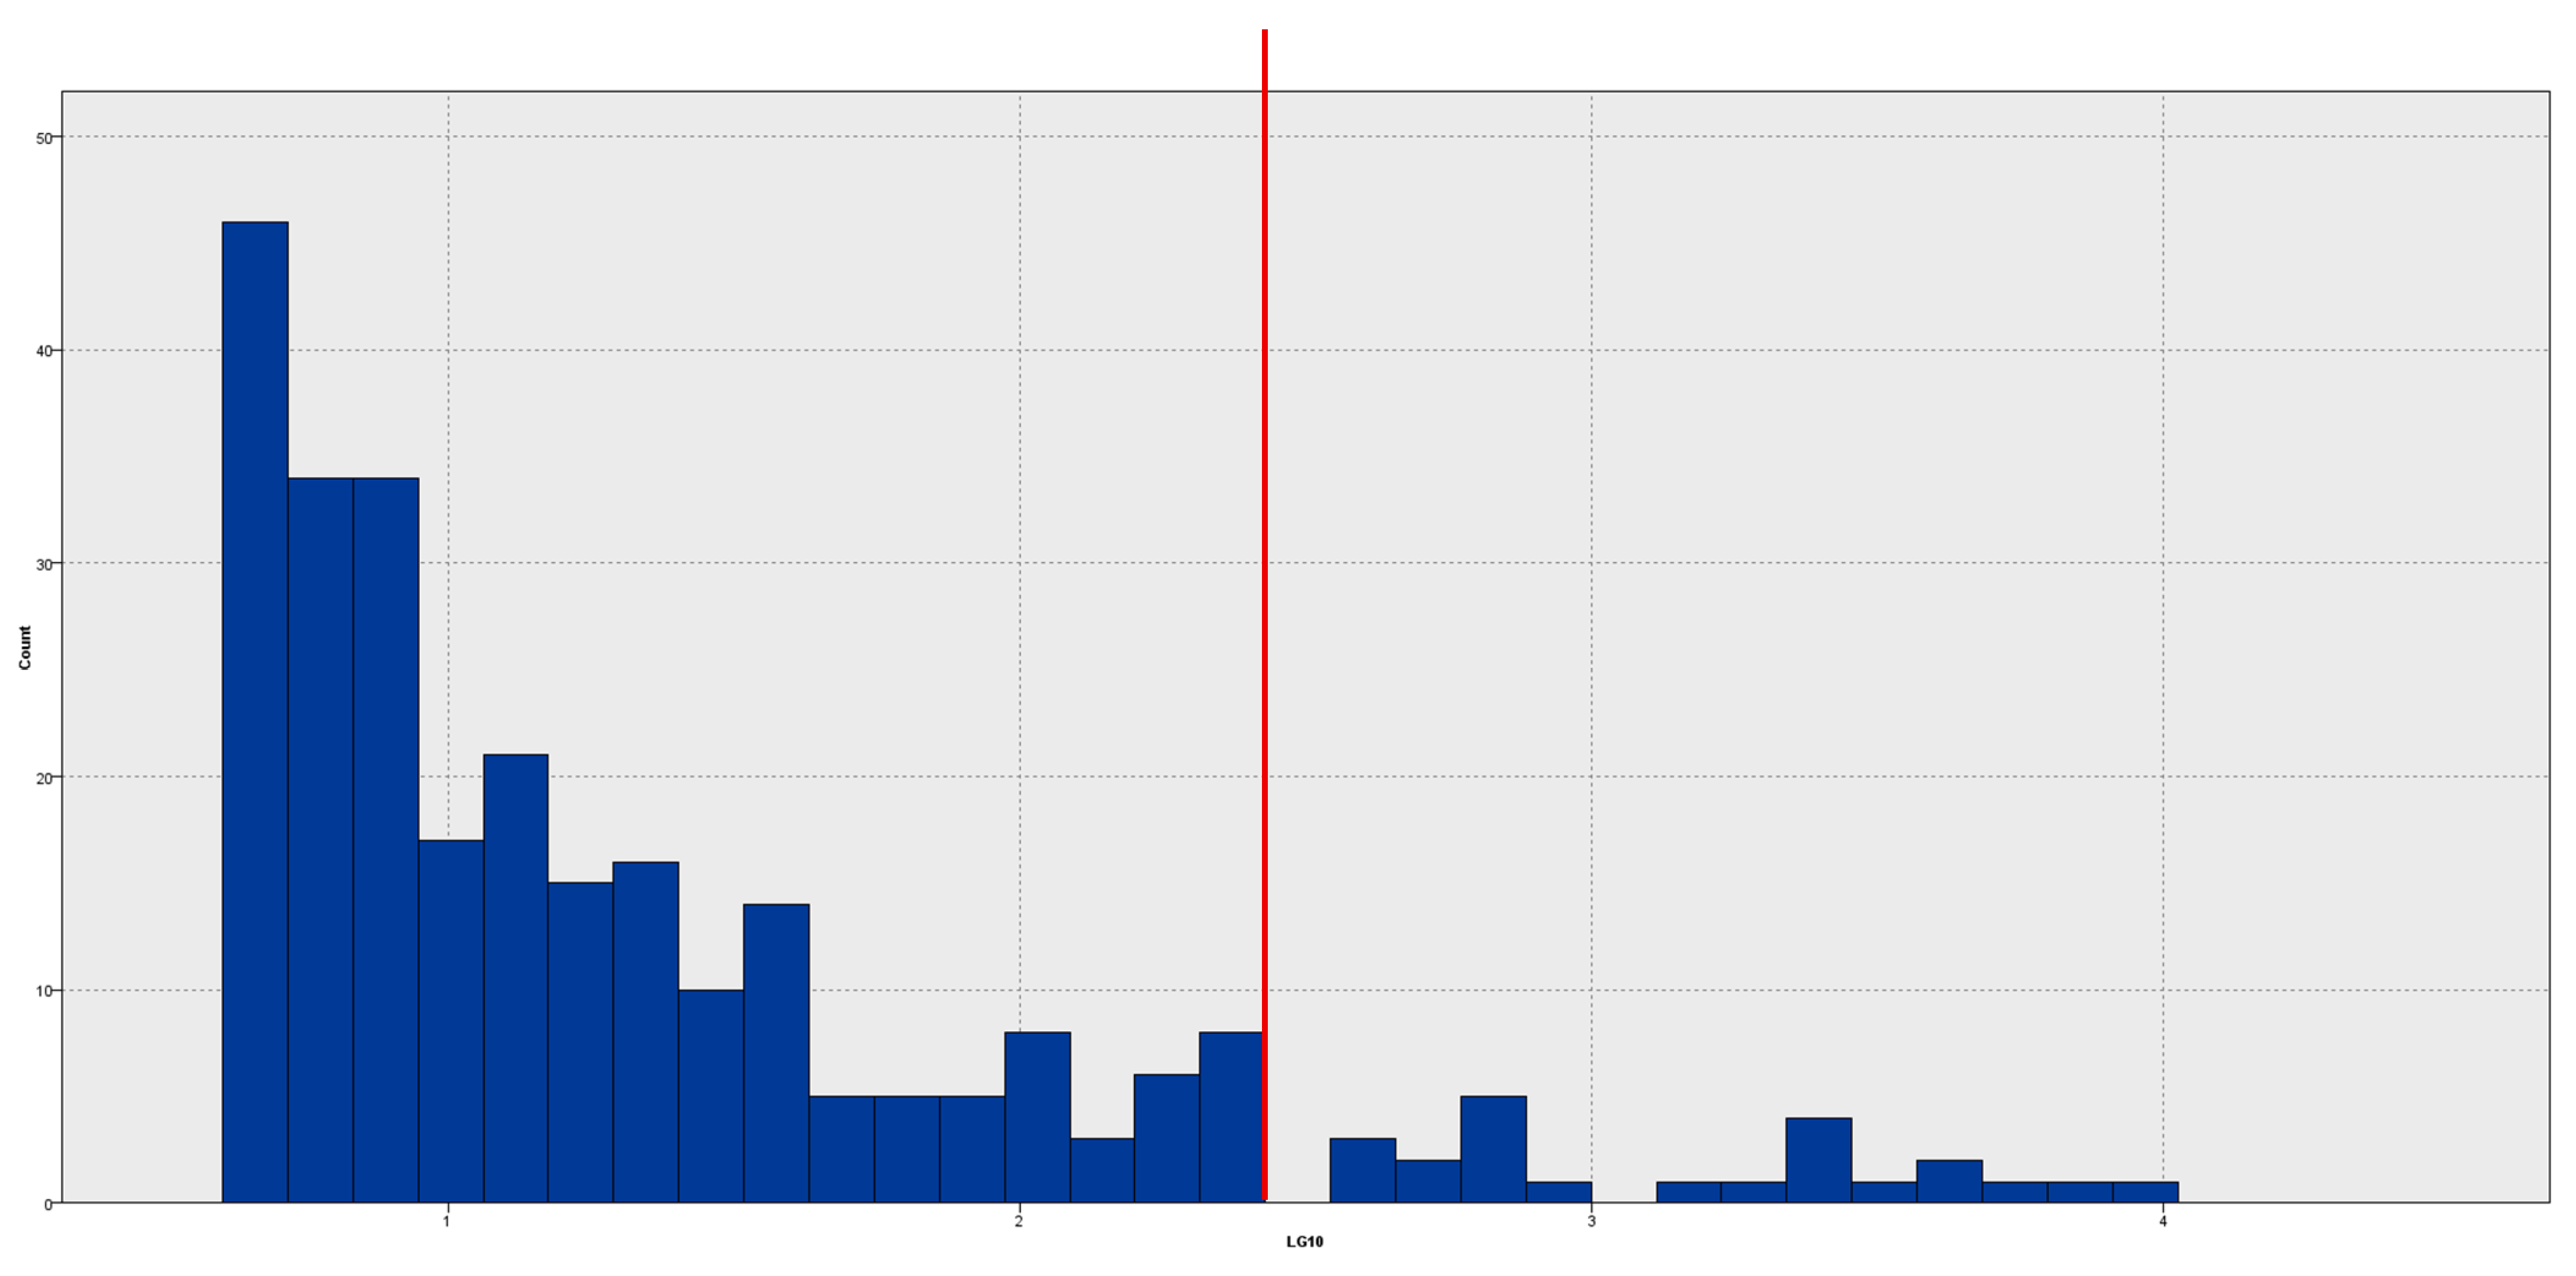
Figure 8 displays the histogram of the log-transformed anomaly index, facilitating improved visual differentiation between standard and anomalous instances. The vertical red line indicates the designated cut-off point for identifying outliers. This strategy improves the detection of the most significant anomalies and enables a clearer selection of companies for further analysis.
The histogram was produced with IBM SPSS Modeller, utilising the log-transformed anomaly index as a numerical input for visual analysis.
This picture provides a more elucidative representation of the anomaly index distribution. The use of a logarithmic transformation elucidates the points at which values begin to deviate significantly, revealing distinct gaps among the most extreme data. These gaps indicate a distinct behavioural divergence, and values in this area may be regarded as significantly deviating from the standard.
We implemented a quantile-based thresholding technique to identify organisations that displayed possibly fraudulent conduct. We specifically identified the top 10% of firms exhibiting the highest anomaly index values, which correlate to the greatest distances from their respective cluster centroids. These organisations’ financial trends significantly diverge from those of their peers, indicating the potential for creative accounting procedures or unconventional reporting frameworks.
In the absence of labelled data, quantile-based threshold algorithms are commonly employed to identify anomalous cases. Prior studies by West and Bhattacharya [
71] and Goldstein and Uchida [
72] have employed criteria ranging from 1% to 10% of the highest anomaly scores, thereby creating a standard methodology for unsupervised anomaly detection.
In accordance with this methodological framework, we established a 10% threshold to identify the most severe observations based on their distance from cluster centroids. This level was determined by expert assessment and represents a practical equilibrium between sensitivity and specificity. The selection of 10% guarantees an adequate number of instances are identified for examination while preventing an excess of false positives in the study. This threshold is adaptable and may be modified based on the analytical goal or the necessary risk tolerance in actual applications.
The Final Comprehensive Model of Creative Accounting
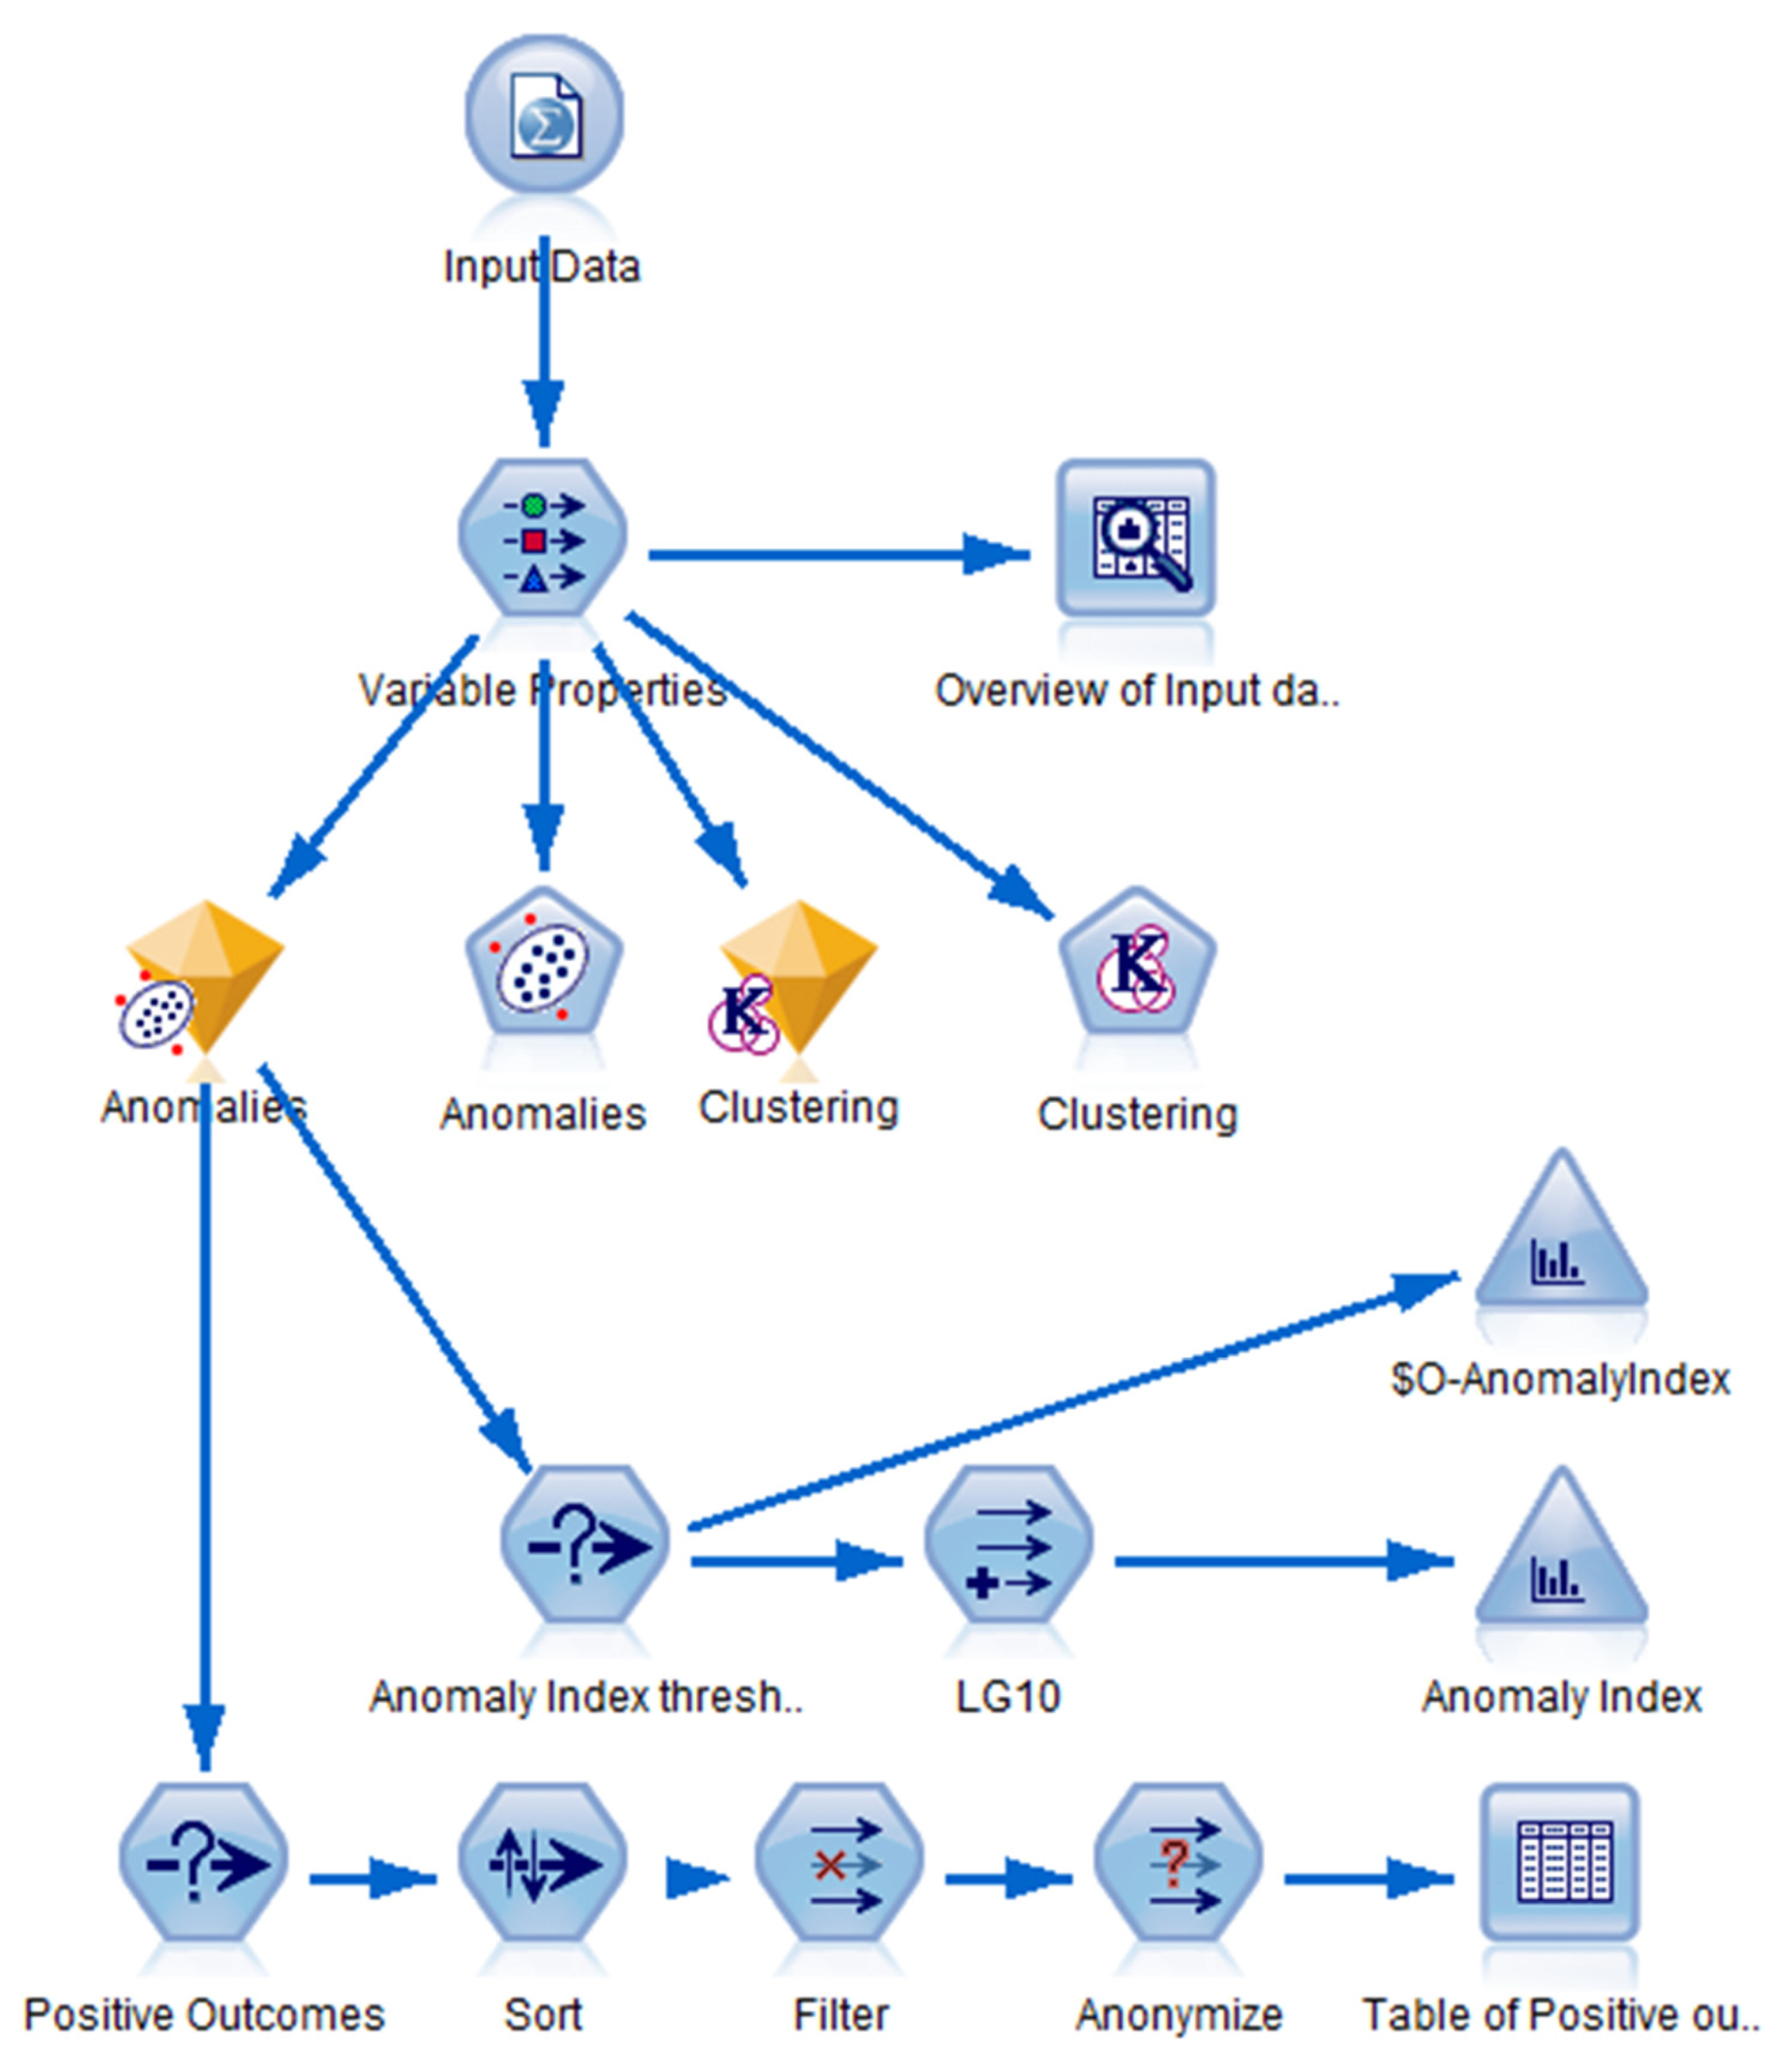
Figure 9 illustrates the process flow of the anomaly detection model executed in IBM SPSS Modeller. The graphic delineates the sequence of components utilised, including data importation, variable selection, clustering, anomaly scoring, transformation, and result filtration.
The model used the “number of anomalous cases” approach in the anomaly settings for the final selection of anomalous entities. The output was specifically designed to produce the top 10% of companies with the largest anomaly index values, representing the enterprises that most significantly diverge from the conventional financial behaviour of their designated cluster.
This parameter can be dynamically modified in SPSS Modeller, allowing users to select among the following three methodologies:
Minimum anomaly index—establishing a definitive threshold value determined by the distance from the centroid;
Proportion of cases—identifying a specified percentage (e.g., top 5%, 10%) of the most anomalous enterprises;
The research determines the quantity of cases by isolating a precise count of the most extreme outliers.
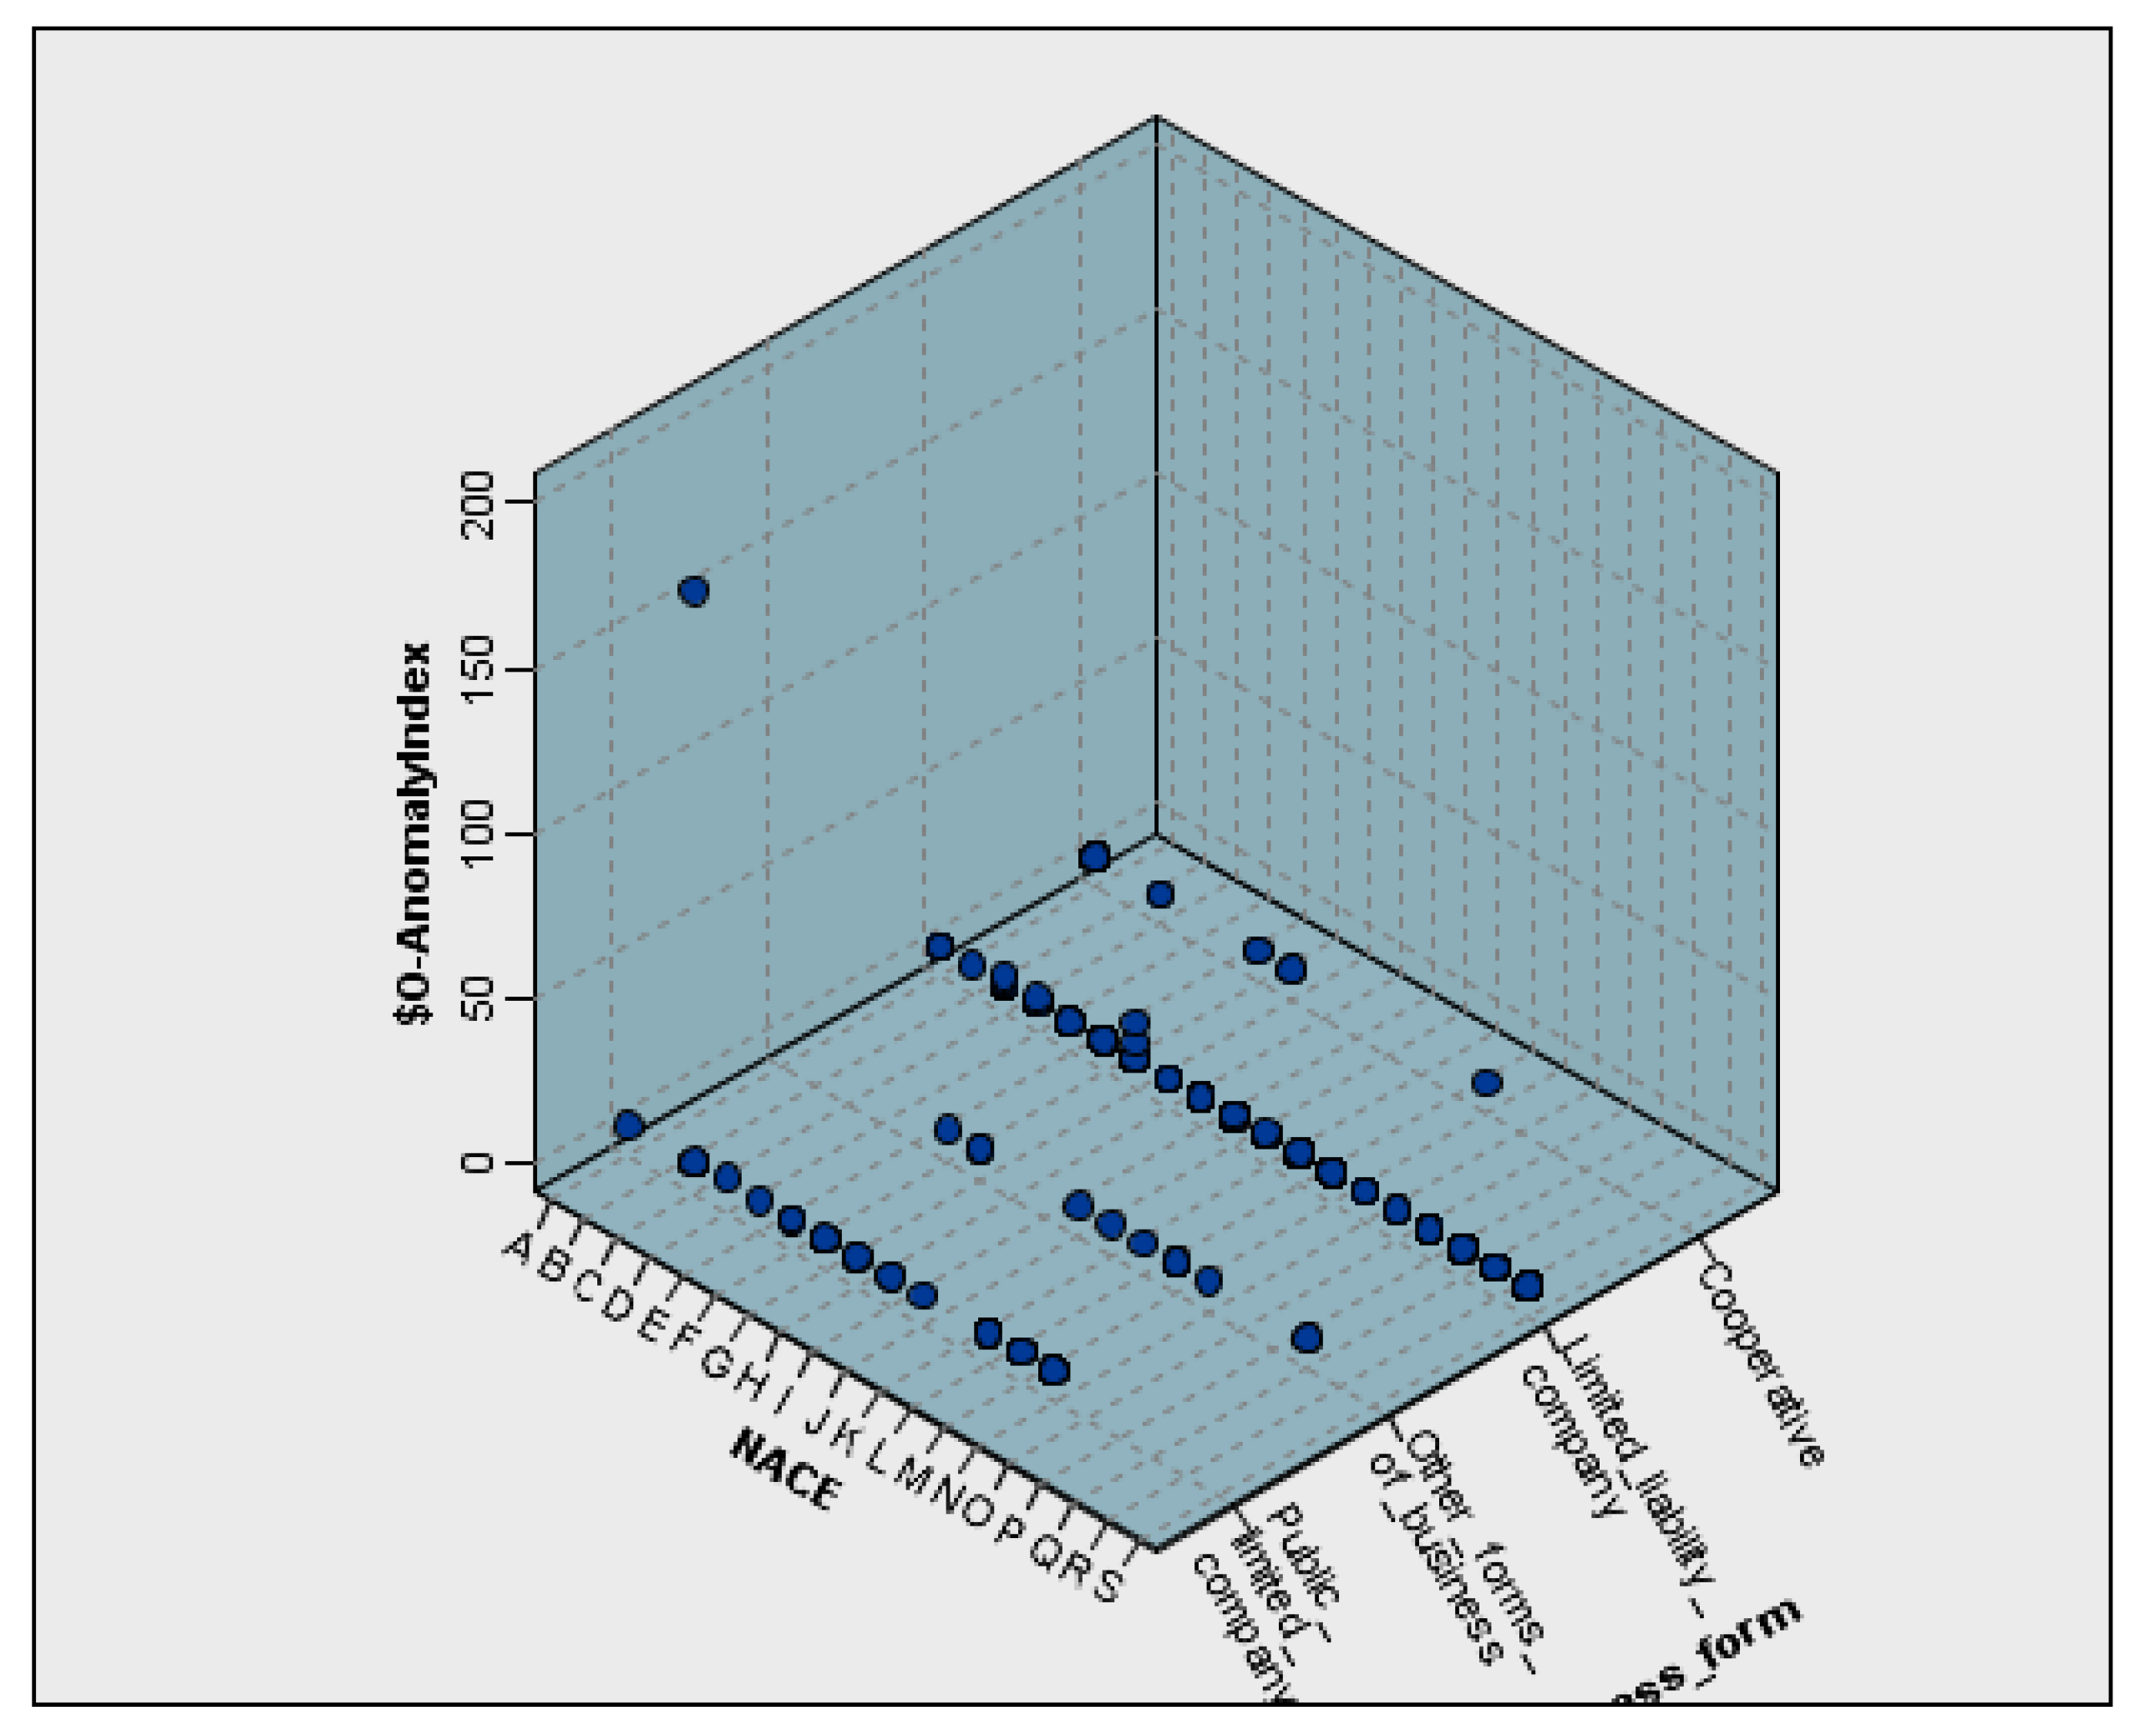
Figure 10 provides a three-dimensional surface map showing the distribution of anomaly index values across NACE sectors (x-axis) and the estimated anomaly index, based on the Euclidean distance from the assigned cluster centroid as indicated in the approach. y-axis. The z-axis represents the legal structure of the enterprises.
The visualisation indicates that limited liability firms (LLCs) in certain sectors have markedly elevated anomaly ratings. These elevated ratings may indicate financial irregularities particular to the sector or abnormalities in structural reporting. Conversely, joint-stock corporations (PLCs) and cooperatives exhibit lower index values, signifying more uniform financial patterns within their respective categories.
The plot was generated using IBM SPSS Statistics. The 3D format offers an integrated perspective of sector and legal structure; however, it must be approached with caution due to potential visual distortion and overlapping surfaces. The presence of elevated index values in specific sector–form combinations suggests the importance of sector-sensitive methodologies in anomaly detection and risk assessment.
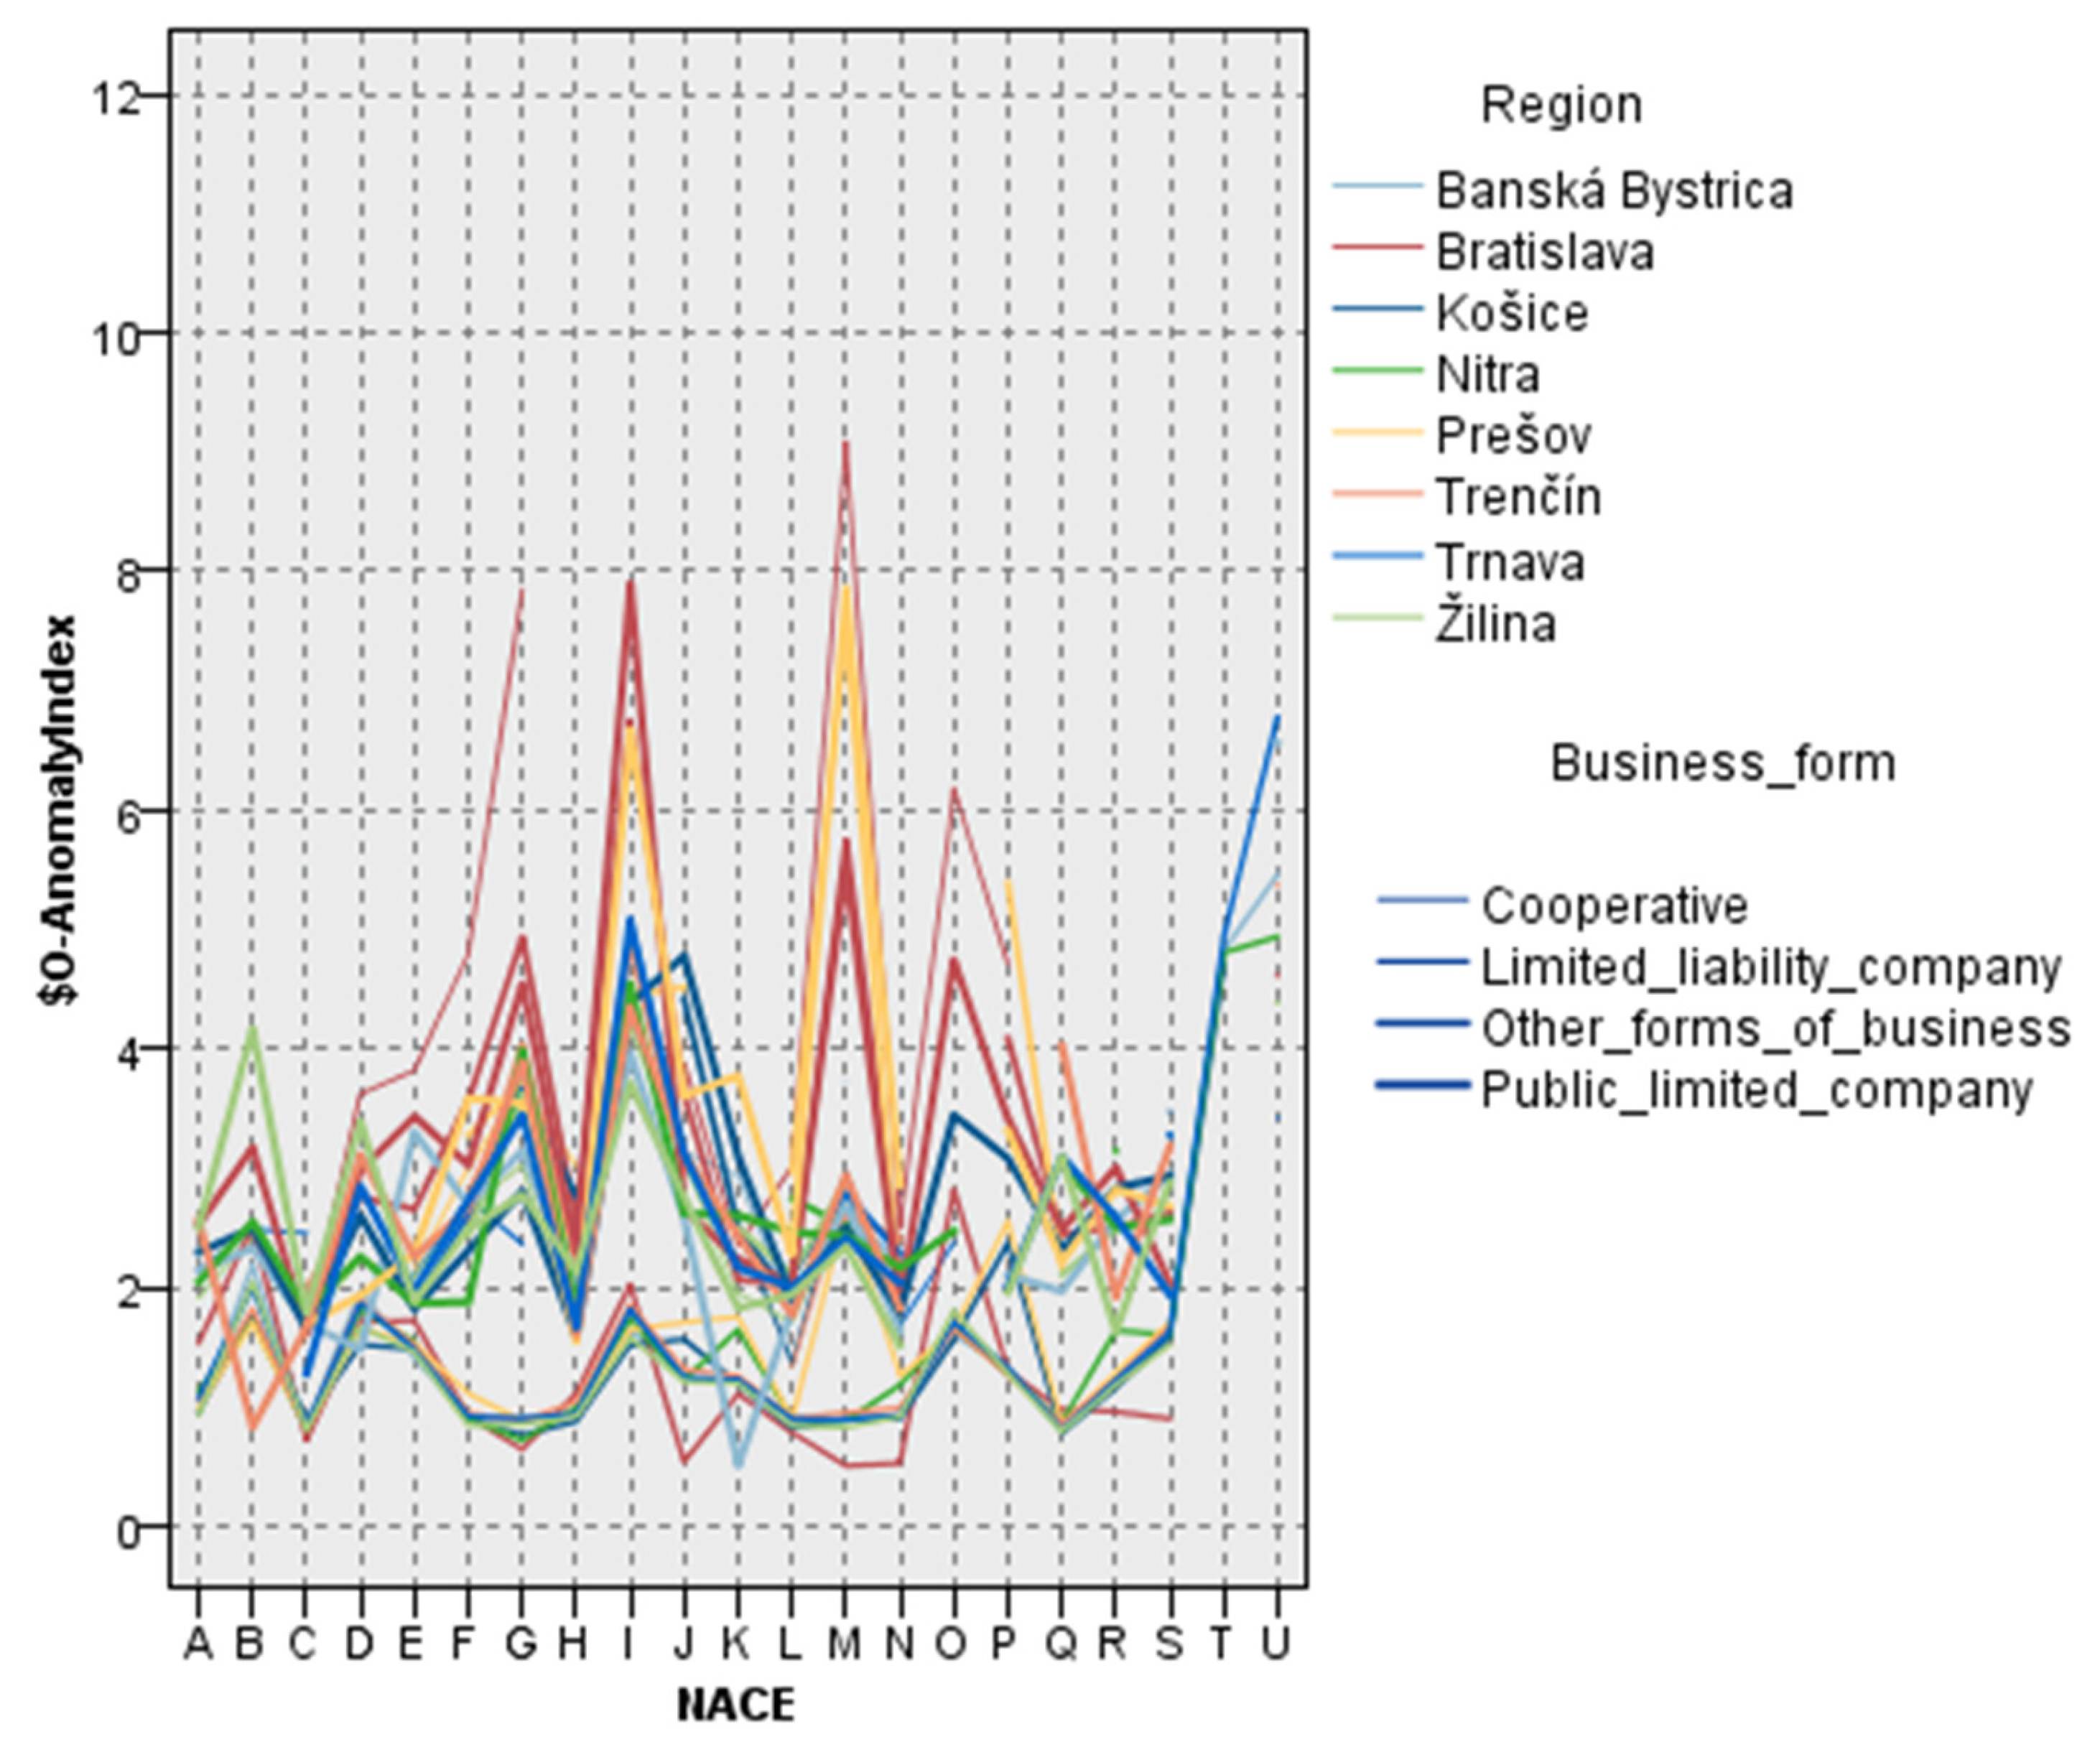
Figure 11 illustrates the fluctuations in average anomaly index values across Slovak firms, categorised concurrently by economic sector (NACE), NUTS3 area, and legal company structure. The anomaly index indicates the Euclidean distance between each firm and the centroid of its designated cluster, acting as a surrogate for the extent of divergence from standard financial conduct.
The chart indicates significant variability in anomaly intensity. Specific NACE categories, those designated H, J, and M, have elevated anomaly values across various locations and legal structures. Enterprises located in the Bratislava and Prešov regions, particularly limited liability corporations, consistently demonstrate high anomaly indices across many sectors. This pattern may indicate regional economic traits, sector-specific reporting methodologies, or differences in firm scale and regulatory scrutiny.
A high anomaly index does not inherently signify fraudulent behaviour; nonetheless, it denotes statistically unusual financial behaviour that warrants further scrutiny. The identified multi-dimensional discrepancies highlight the necessity of context-sensitive risk evaluations. These findings may assist auditors and regulators in focusing their analytical endeavours on sectoral, legal, and geographical risk considerations.
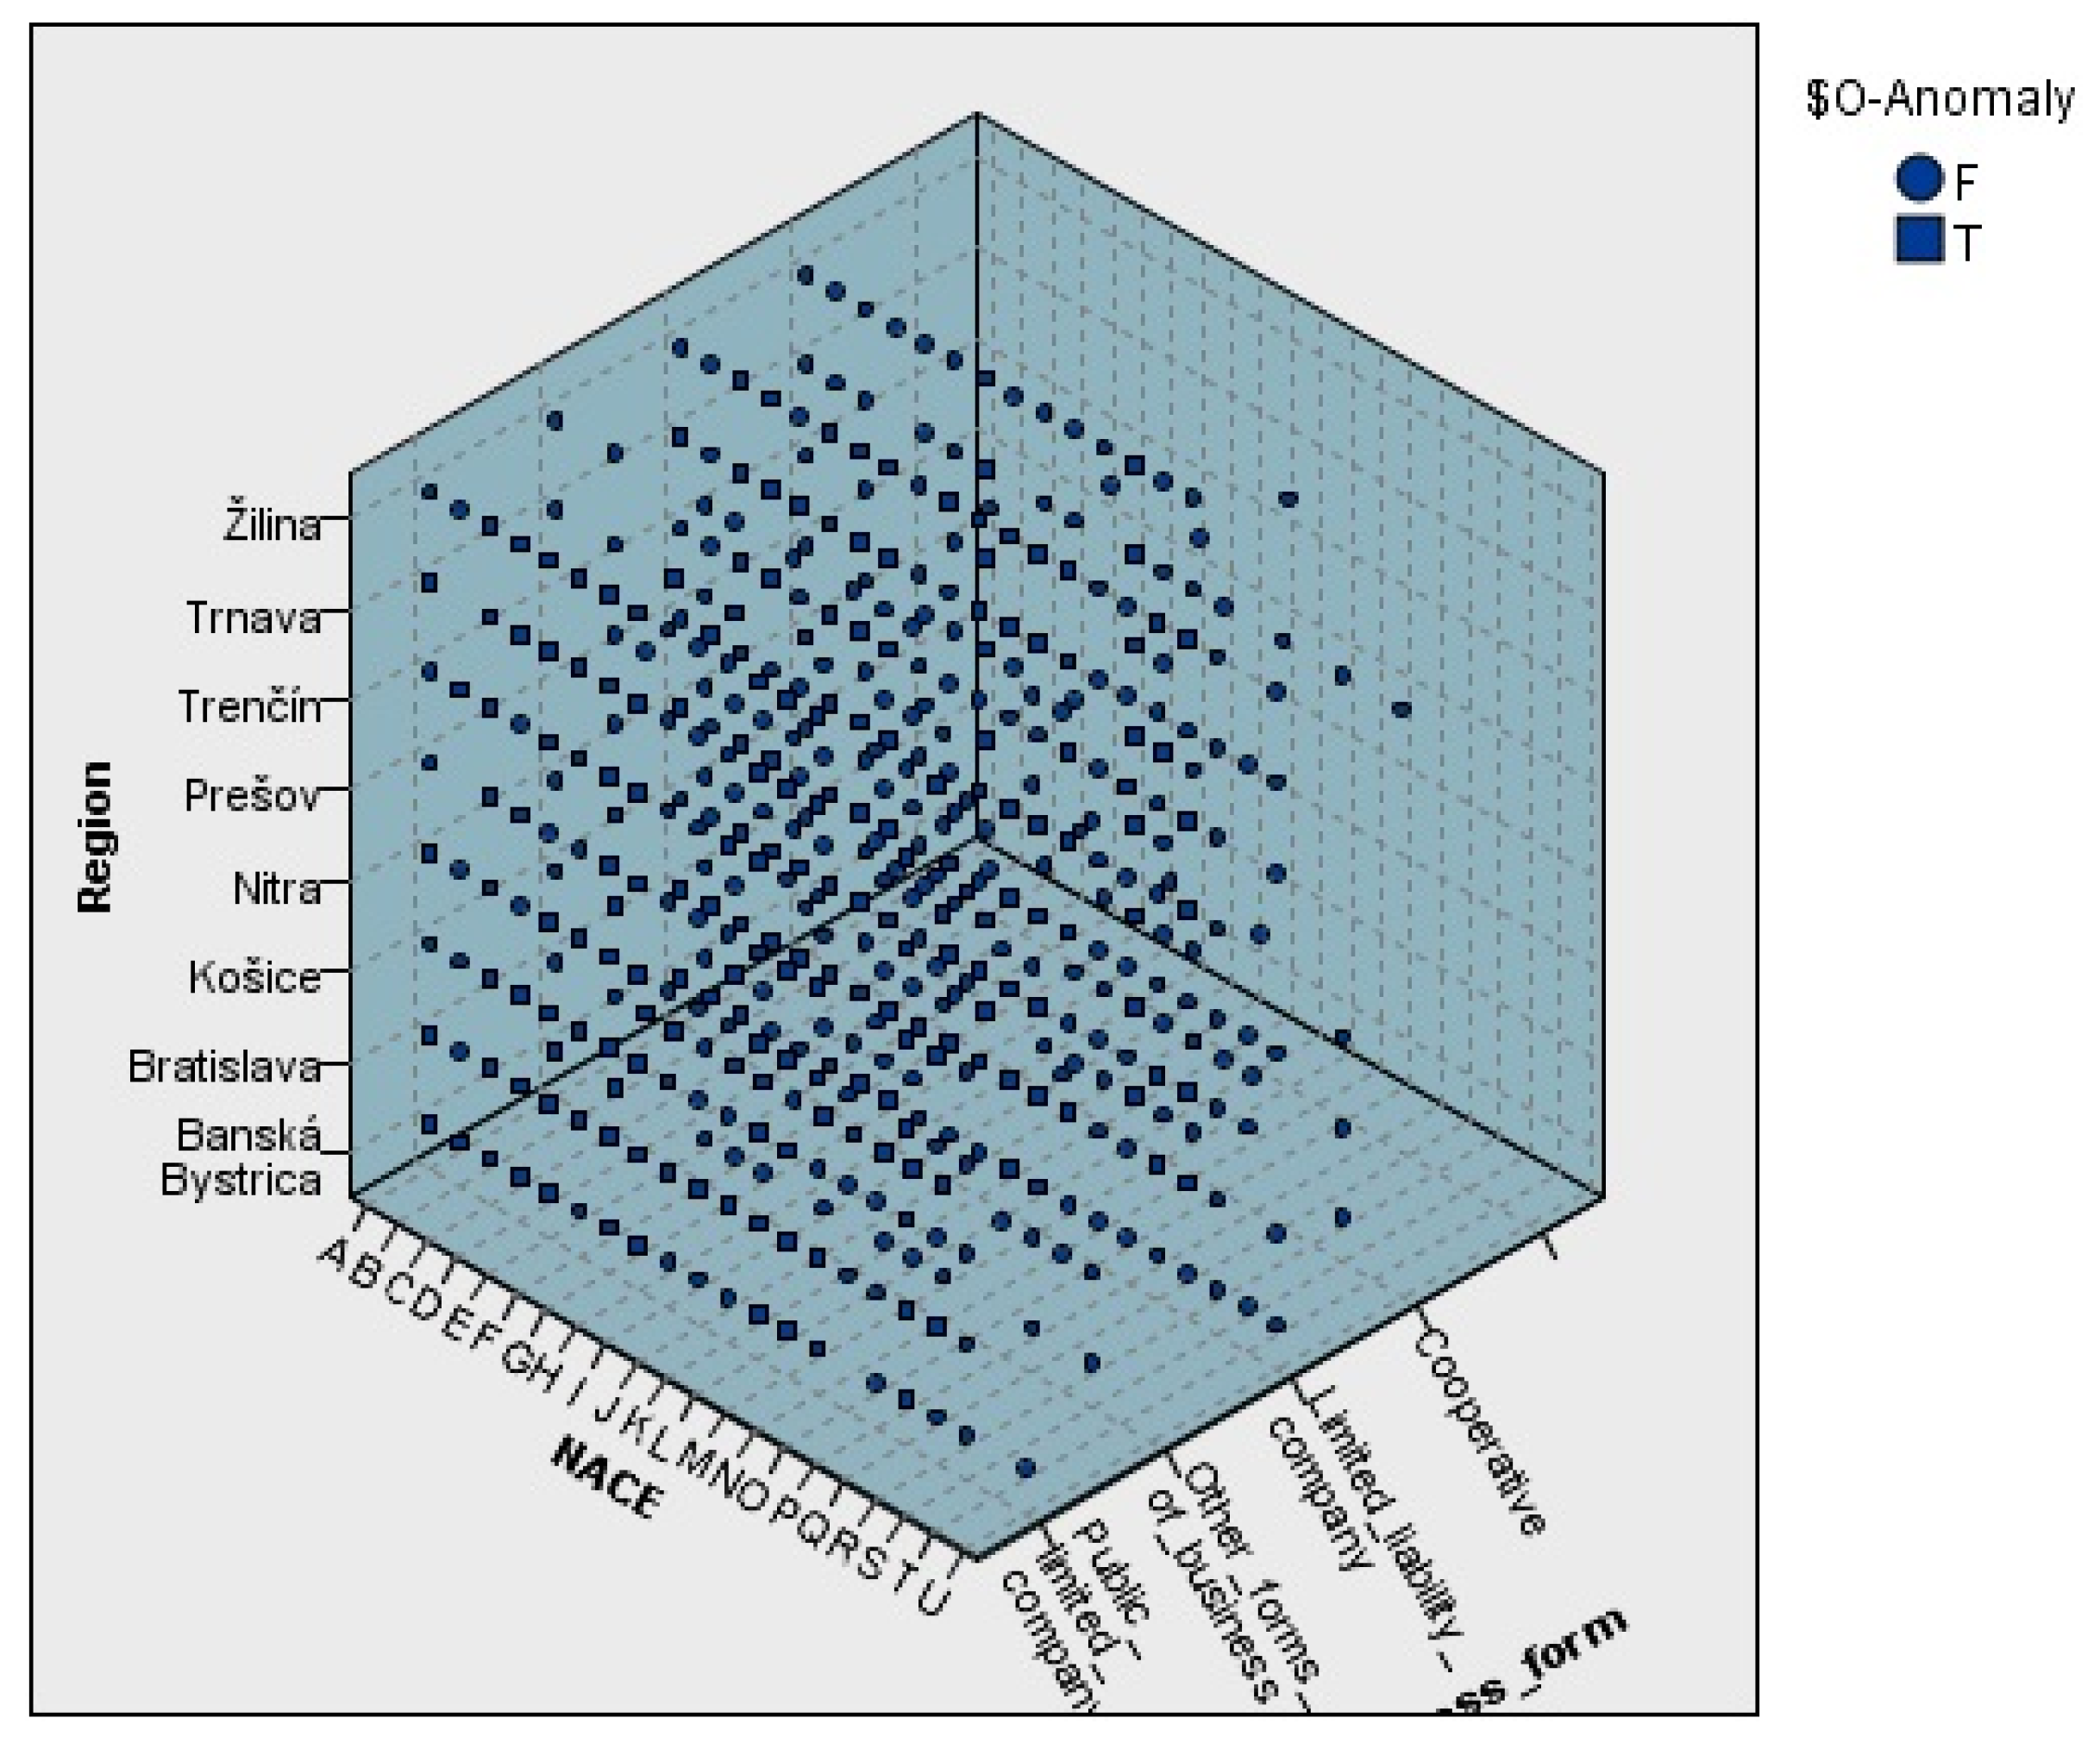
Figure 12 illustrates a three-dimensional scatterplot depicting the distribution of average anomaly index values across various combinations of regions (NUTS 3), NACE sectors, and legal types of enterprises. The dimensions and hues of each marker reflect the average anomaly index for each particular combination, providing a comprehensive perspective on how structural attributes affect financial behaviour.
The data indicates that limited liability corporations (LLCs) predominate in all areas and industries, aligning with their widespread presence in the Slovak economic environment. Nonetheless, there exist nuanced differences in the composition of legal forms, particularly in areas like Nitra and Prešov, where the prevalence of LLCs and the lack of specific formal structures may affect anomaly index results.
In contrast, cooperatives and public limited corporations (PLCs) typically exhibit more regionally concentrated distributions, frequently linked to particular sectors. The disparities in organisational structure and sectoral focus may partially explain the regional variations in anomaly scores and highlight the necessity for contextual analysis when assessing anomalous activity.
6. Conclusions
This research employed unsupervised machine learning methods to identify unusual financial conduct among Slovak firms. Employing clustering-based methods on a dataset of 149,566 enterprises and 96 financial indicators spanning eight years (2016–2023), we found 231 entities with anomalous financial trends. This work enhances the methodology of anomaly detection by integrating a multi-year view, allowing for the identification of structural aberrations that may be overlooked in short-term analysis. This represents one of the initial extensive implementations of unsupervised clustering-based anomaly detection in Central European SMEs using public registry data. The greatest concentration of abnormalities was identified in sectors C (Manufacturing), G (Trade), and L (Real Estate). The findings indicate that certain industries may be more vulnerable to accounting irregularities, which should be prioritised for regulatory oversight and audit intervention.
From a theoretical standpoint, our findings enhance the expanding body of work on anomaly detection by illustrating that unsupervised models may effectively recognise systematic discrepancies in financial data without the necessity of tagging fraud instances. This facilitates the creation of scalable, interpretable instruments for detecting financial anomalies in practical settings, especially inside under-explored SME environments.
The proposed methodology offers an effective screening tool for auditors, financial controllers, and regulatory bodies. Its form is flexible for various institutional contexts and nations, making it appropriate for cross-national comparisons or standardised regulatory frameworks, such as those in the EU or OECD. The capacity to identify abnormalities by industry, location, or legal structure offers helpful tips for risk-orientated audit planning and focused policy execution. This method can also be applied in internal business environments to identify high-risk entities or transactions. Given that financial transparency is fundamental to economic credibility, including anomaly detection methods in supervisory processes may enhance early warning systems and reduce the incidence of financial malfeasance.
Notwithstanding its merits, the study possesses multiple limitations. The approach has a set threshold (top 10%), which may not accurately represent optimal sensitivity across various sectors. It employs a distance-based anomaly index, which may neglect complex relationships among financial ratios. The analysis is confined to accounting data and excludes macroeconomic variables, behavioural indicators, or textual analyses from narratives or disclosures. While a fixed percentile threshold was employed, alternative thresholding techniques, such as dynamic z-score filters or distance quantiles modified by cluster density, might be investigated to enhance the detection of abnormal observations.
Future studies will explore sophisticated machine learning techniques, such as ensemble models and neural networks, to enhance the accuracy of anomaly categorisation. Furthermore, incorporating elements of profitability, liquidity, activity, and leverage would provide a more holistic perspective on financial conduct. Subsequent enquiries may concentrate on sector-specific models and the influence of macroeconomic and regulatory changes on the creation of anomalies. Furthermore, since the dataset includes eight years of financial reporting, future studies could use longitudinal modelling tools to examine temporal patterns, identify recurring anomalies, and distinguish between temporary financial shocks and structural irregularities. These guidelines would enhance detection techniques and facilitate the continuous development of resilient, flexible frameworks for evaluating financial integrity. A future study may benefit from interdisciplinary collaboration, integrating financial analytics with legal reasoning, behavioural science, or text mining to comprehensively address financial anomalies and reporting habits. We advise that institutions engaged in financial oversight and auditing explore trial deployments of anomaly detection frameworks within their risk assessment methodologies.
The model relies exclusively on historical financial indicators, devoid of contextual or behavioural characteristics, and should be regarded as a preliminary framework for anomaly detection. Future development must emphasise the integration of supplementary qualitative data, including audit findings and disclosure quality, while involving domain experts to authenticate the model’s conclusions. This would markedly enhance the model’s accuracy and expand its utility in regulatory or internal control contexts.


