


Abstract
Dengue virus infection remains a major global public health concern, demanding rapid and reliable diagnostic tools. This work introduces a computational proof of concept for an intelligent bioanalytical architecture combining a redox-capacitive biosensing platform with an Artificial Immune System (AIS) machine learning framework to detect the Dengue NS1 protein. Using a simulated dataset of 32 independent sample profiles across 49 frequency points, the AIS algorithm was systematically evaluated on isolated real (C′) and imaginary () capacitance components under distinct operational scenarios. Utilizing real capacitance (C′), the AIS algorithm achieved 100.0% accuracy in discriminating positive NS1 profiles from controls and negative matrices, while dynamically adapting its Shape Affinity Limen parameter to maintain noise-resilience (83.3% accuracy) in the ambiguous Blank vs. Negative scenario. Statistical overlap analysis using the Bhattacharyya Index revealed that imaginary capacitance () acts as a highly specific complementary marker. While showed near-total structural overlap (0.995) between blank controls and negative samples—proving physical blindness to background matrix noise—it achieved flawless target identification (100.0% accuracy) for NS1 interaction. Backed by sub-millisecond algorithmic execution times, this dual-channel capacitive–computational framework provides a robust foundation for prospective real-time, point-of-care diagnostic tools.
1. Introduction
Dengue virus (DENV) infection remains one of the most significant mosquito-borne diseases worldwide, affecting millions of individuals annually and imposing a substantial burden on healthcare systems, particularly in tropical and subtropical regions. The continuous expansion of the geographical distribution of Aedes mosquitoes, coupled with increasing urbanization and climate variability, has contributed to the persistence and recurrence of dengue outbreaks in numerous countries. According to the World Health Organization (WHO), dengue represents a major global public health concern, requiring effective surveillance strategies and rapid diagnostic tools capable of supporting timely clinical decision-making and outbreak control [1]. Early diagnosis is particularly important because prompt identification of infected individuals facilitates adequate patient management and reduces the risk of severe complications associated with disease progression.
Among the available biomarkers for dengue diagnosis, the non-structural protein 1 (NS1) has emerged as one of the most clinically relevant targets for early-stage detection. Unlike serological markers that depend on the host immune response, NS1 is actively secreted into the bloodstream during the acute phase of infection and can be detected within the first days following symptom onset. This characteristic makes NS1 particularly valuable for point-of-care (POC) diagnostic applications, where rapid and accurate detection is essential for improving clinical outcomes and reducing transmission rates [1]. Consequently, considerable research efforts have focused on developing highly sensitive and portable sensing platforms capable of detecting NS1 directly from biological samples.
Traditional laboratory techniques such as polymerase chain reaction (PCR) and enzyme-linked immunosorbent assay (ELISA) remain the gold standard for dengue diagnosis due to their high sensitivity and specificity. However, these methods often require sophisticated laboratory infrastructure, trained personnel, expensive reagents, and relatively long processing times. Such limitations can significantly restrict their deployment in low-resource settings and decentralized healthcare environments. To overcome these challenges, electrochemical biosensors have emerged as promising alternatives due to their low cost, portability, rapid response, and compatibility with miniaturized diagnostic systems. In particular, redox-capacitive biosensors offer enhanced sensitivity by converting biomolecular interactions occurring at the electrode interface into measurable electrical responses, enabling the detection of low analyte concentrations with high analytical performance [2]. Recent advances have increasingly highlighted the efficacy of impedimetric and peptide-based electrochemical platforms for the specific and label-free detection of Dengue NS1 in complex physiological matrices [3,4].
Despite these advantages, the practical implementation of electrochemical biosensors remains challenged by signal variability caused by environmental disturbances, electrode imperfections, biological matrix effects, baseline drift, and measurement noise. Such factors can substantially compromise the reliability of diagnostic outcomes, especially when analyzing low-concentration biomarkers in complex biological samples. Consequently, advanced computational approaches capable of extracting meaningful information from noisy datasets have become increasingly important for improving biosensor performance and diagnostic accuracy.
Recent advances in Artificial Intelligence (AI) and Machine Learning (ML) have revolutionized the analysis of complex biomedical and engineering datasets. These techniques have demonstrated remarkable capabilities in nonlinear modeling, pattern recognition, anomaly detection, and predictive analytics. In engineering applications, ML algorithms have been successfully employed for fault detection and classification in dynamic systems, enabling accurate interpretation of complex vibration signals and operational states. Recent advances have shown that ensemble learning approaches and machine learning models can achieve superior performance in fault detection and pattern classification tasks involving complex, nonlinear, and imbalanced bio-engineering datasets [5,6].
Within the broad spectrum of computational intelligence techniques, Artificial Immune Systems (AIS) constitute a biologically inspired paradigm derived from the principles and mechanisms of the vertebrate immune system. The foundations of AISs can be traced to the pioneering work of [7], who introduced the concept of self/non-self discrimination in computational environments, establishing the basis for anomaly detection inspired by immunological processes. Subsequent developments by [8,9,10] expanded the theoretical framework of AISs by incorporating mechanisms such as clonal selection, immune memory, affinity maturation, and adaptive learning. These foundational principles have driven a continuous evolution of AIS models, adapting them to increasingly complex pattern recognition and anomaly detection applications across various engineering and biomedical domains [11]. These characteristics have enabled AIS algorithms to become effective tools for classification, optimization, pattern recognition, and fault diagnosis in highly complex environments.
One of the most attractive characteristics of an AIS is its ability to distinguish normal patterns (“self”) from abnormal patterns (“non-self”), making it particularly suitable for applications involving uncertainty, noise, and dynamic operating conditions. Among the various AIS methodologies, the Negative Selection Algorithm (NSA) has gained considerable attention due to its simplicity, robustness, and effectiveness in anomaly detection problems. The NSA emulates the biological process by which immune cells capable of reacting to self-components are eliminated during maturation, resulting in a computational framework capable of identifying previously unseen abnormal patterns. Such characteristics are especially valuable in biosensing applications, where signal variability and biological complexity often challenge conventional classification techniques.
Recent studies have demonstrated the versatility of AISs across multiple application domains. In healthcare, ref. [12] highlighted the potential of combining artificial intelligence and artificial immune systems to improve tuberculosis diagnosis through adaptive recognition mechanisms capable of identifying subtle pathological signatures. In complex pattern recognition domains, AIS-based methodologies have achieved high detection performance in dynamic anomaly detection while maintaining low computational requirements [13]. Likewise, the Negative Selection Algorithm has been successfully expanded with real-valued detector generation to classify complex physical signatures across noisy and nonlinear datasets [14]. These studies demonstrate the robustness, adaptability, and generalization capabilities of AIS paradigms when applied to intricate biological and physical signals.
Although significant advances have been achieved independently in electrochemical biosensing technologies and intelligent computational systems, relatively few studies have explored the integration of biosensor platforms with immune-inspired classification frameworks for infectious disease diagnosis. The combination of highly sensitive electrochemical transducers with adaptive AIS algorithms presents a promising opportunity to improve signal interpretation, increase diagnostic robustness, and mitigate the effects of measurement uncertainty and environmental noise.
Therefore, this work proposes a novel diagnostic architecture that integrates a redox-capacitive biosensor with an Artificial Immune System classifier for the detection of Dengue NS1. The proposed methodology employs a stratified four-fold cross-validation framework and an adaptive Shape Affinity Threshold (TAF) combined with a recognition radius of 0.05 to evaluate complete capacitive signatures as well as isolated real and imaginary capacitance components. By combining advanced biosensing technology with immune-inspired computational intelligence, the proposed approach aims to establish a rapid, robust, and noise-resilient platform for next-generation dengue diagnostics and digital immunoprofiling applications.
2. Materials and Methods
2.1. Biosensor Fabrication and Electrochemical Measurements
The experimental data employed in this study were obtained from a redox-capacitive electrochemical immunosensor specifically developed for the detection of Dengue Virus Non-Structural Protein 1 (NS1), a recognized biomarker for early-stage dengue diagnosis. The sensing strategy relies on monitoring changes occurring at the electrode/electrolyte interface after specific antigen–antibody recognition events.
Electrochemical measurements were performed using an AUTOLAB PGSTAT30 potentiostat (Metrohm Autolab B.V., Utrecht, The Netherlands)equipped with a Frequency Response Analyzer (FRA) module and controlled through NOVA software (version 2.1.4, Metrohm Autolab B.V., Utrecht, The Netherlands). A conventional three-electrode electrochemical cell was employed, consisting of a polycrystalline gold working electrode (2.0 mm diameter; geometric area of 0.03142 cm2; Metrohm Autolab B.V., Utrecht, The Netherlands), a platinum counter electrode (Metrohm Autolab B.V., Utrecht, The Netherlands), and a Ag/AgCl (3.0 mol L−1 KCl) reference electrode (Metrohm Autolab B.V., Utrecht, The Netherlands).
Prior to modification, the gold electrodes were mechanically polished using alumina suspensions of decreasing particle size (1.0, 0.3, and 0.05 μm; Sigma-Aldrich, St. Louis, MO, USA), followed by ultrasonic cleaning and electrochemical activation in 0.5 mol L−1 NaOH. This procedure ensured a reproducible and contaminant-free surface suitable for the formation of self-assembled monolayers (SAMs), which are extensively employed in electrochemical biosensors due to their structural organization and long-term stability [15].
Surface functionalization was performed using the electroactive peptide Fc-Glu-Ala-Ala-Cys [Pep(Fc)], containing a terminal thiol group for chemisorption onto gold, a ferrocene redox center, and a terminal carboxylic group for bioconjugation. The cleaned electrodes were immersed in a 2 mmol L−1 peptide solution prepared in water/acetonitrile (1:1, v/v) for 16 h at room temperature. The spontaneous adsorption of the thiol group on the gold surface resulted in the formation of a compact electroactive SAM.
Antibody immobilization was achieved through carbodiimide coupling chemistry. The carboxylic groups exposed on the peptide layer were activated using a solution containing 0.2 mol L−1 EDC and 0.05 mol L−1 NHS (Sigma-Aldrich, St. Louis, MO, USA) for 30 min. Subsequently, the electrodes were incubated in a 1 μmol L−1 monoclonal anti-NS1 solution (Sigma-Aldrich, St. Louis, MO, USA) prepared in phosphate buffer (12 mmol L−1, pH 7.4) for 1 h. Residual active sites were blocked with 0.1% bovine serum albumin (BSA; Sigma-Aldrich, St. Louis, MO, USA) to minimize nonspecific adsorption.
Commercial human serum (Sigma-Aldrich, St. Louis, MO, USA)was used as the biological matrix. Positive samples were prepared by spiking serum with recombinant NS1 protein (Abcam, Cambridge, UK) at a concentration of 0.1 μg mL−1, whereas negative samples consisted of serum without antigen addition. Before analysis, serum samples were diluted to 10% (v/v) in phosphate buffer and incubated on the biosensor surface for 30 min.
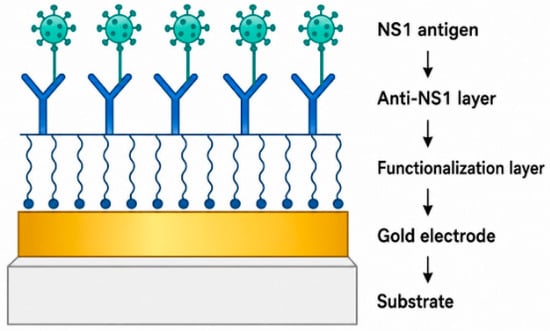
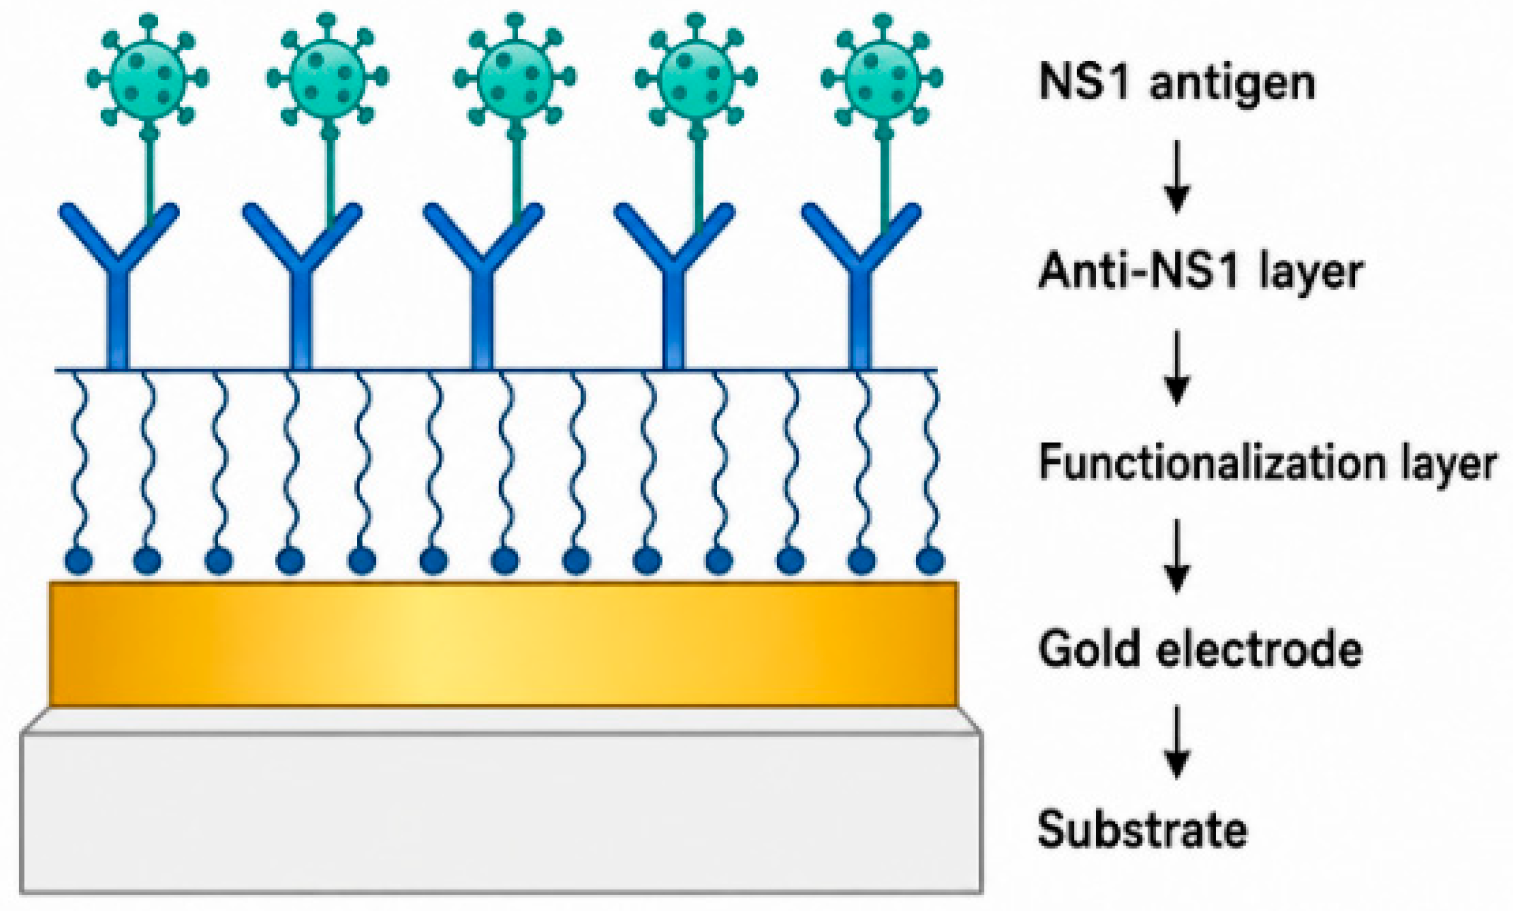
Electrochemical characterization was carried out by Electrochemical Impedance Spectroscopy (EIS), a well-established technique for probing interfacial charge-transfer and dielectric phenomena in biosensing systems [16]. Impedance spectra were acquired using a sinusoidal perturbation amplitude of 10 mV over a frequency range extending from 100 kHz to 0.1 Hz, resulting in 49 logarithmically distributed frequency points. All measurements were performed in triplicate, and the reported values correspond to the mean ± standard deviation. The architecture of the redox-capacitive biosensor and the sequence of biofunctionalization steps leading to NS1 recognition are illustrated in Figure 1.
Figure 1.
The architecture of the redox-capacitive biosensor and the sequence of biofunctionalization steps leading to NS1 recognition. Black downward arrows indicate the sequential surface modification steps from the gold substrate to specific antigen binding.
2.2. Electrochemical Signal Processing and Dataset Construction
The impedance response of the biosensor was represented as a complex quantity:
where and denote the real and imaginary impedance components, respectively, and () represents the angular frequency.
To enhance the extraction of physicochemical information from the electrode/electrolyte interface, the original impedance spectra were transformed into complementary immittance representations. The complex admittance was calculated as:
Capacitance spectra were obtained through immittance transformation:
The resulting complex capacitance can be expressed as:
where and correspond to the real and imaginary capacitance components, respectively.
The real capacitance component is associated with charge-storage processes occurring at the interface, whereas the imaginary component reflects dielectric relaxation and energy dissipation phenomena. Previous studies have demonstrated that immittance transformations can significantly improve discrimination capability in electrochemical biosensing systems by emphasizing different physicochemical aspects of molecular recognition events [17,18,19].
For each analyzed sample, a complete capacitance spectrum was recorded and organized into a structured database suitable for machine-learning analysis. The compiled dataset comprises 32 independent experimental samples distributed across three operational classes: Dengue NS1 positive clinical samples (), negative human serum samples (), and blank buffer control samples (). Frequency response spectra were recorded across 49 logarithmically spaced points for both real () and imaginary () capacitance components. Three independent datasets were generated from these electrochemical measurements and are summarized in Table 1.
Table 1.
Electrochemical datasets used for classification.
2.3. Artificial Immune System Classification and Validation
Pattern recognition was performed using the Negative Selection Algorithm (NSA), one of the most established Artificial Immune System (AIS) techniques inspired by the self/non-self discrimination mechanism of the vertebrate immune system [7,9].
The NSA operates through two sequential stages: detector generation and monitoring. During detector generation, candidate detectors are randomly created and compared against samples belonging to the self class. Detectors presenting affinity values above a predefined threshold are discarded, while the remaining detectors are retained as mature detectors capable of recognizing non-self patterns.
The affinity between a detector and a sample was computed using the Euclidean distance metric:
where (x) represents the detector vector and (y) the analyzed sample.
During the monitoring phase, unknown samples are compared against the mature detector population. A sample is classified as belonging to the non-self class whenever at least one detector satisfies the affinity criterion. Otherwise, the sample is classified as self.
To increase robustness against measurement noise and experimental variability, a recognition radius of 0.05 was adopted throughout all experiments. The parameters employed in the Artificial Immune System are summarized in Table 2.
Table 2.
Parameters adopted for the Negative Selection Algorithm.
Classifier performance was evaluated using stratified four-fold cross-validation. The complete database was partitioned into four mutually exclusive subsets while preserving class proportions. During each iteration, three folds were used for detector generation and model training, whereas the remaining fold was employed for testing. The procedure was repeated four times until all samples had been used as test data exactly once. To rule out data leakage and prevent artificially inflated performance metrics, the stratified -fold cross-validation scheme was strictly partitioned at the independent sample level (). All technical spectral sweeps and replicates derived from a single independent experimental run were held intact and assigned exclusively to either the training set or the testing set within any given fold, ensuring zero overlap between training detectors and evaluation samples.
Classification performance was quantified using confusion-matrix-based metrics, including Accuracy, Sensitivity, Specificity, Precision, and F1-score. These metrics enabled a comprehensive evaluation of the discrimination capability provided by each electrochemical descriptor.
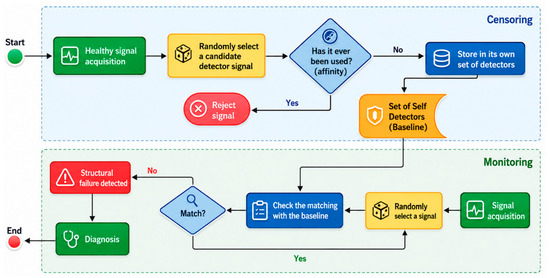
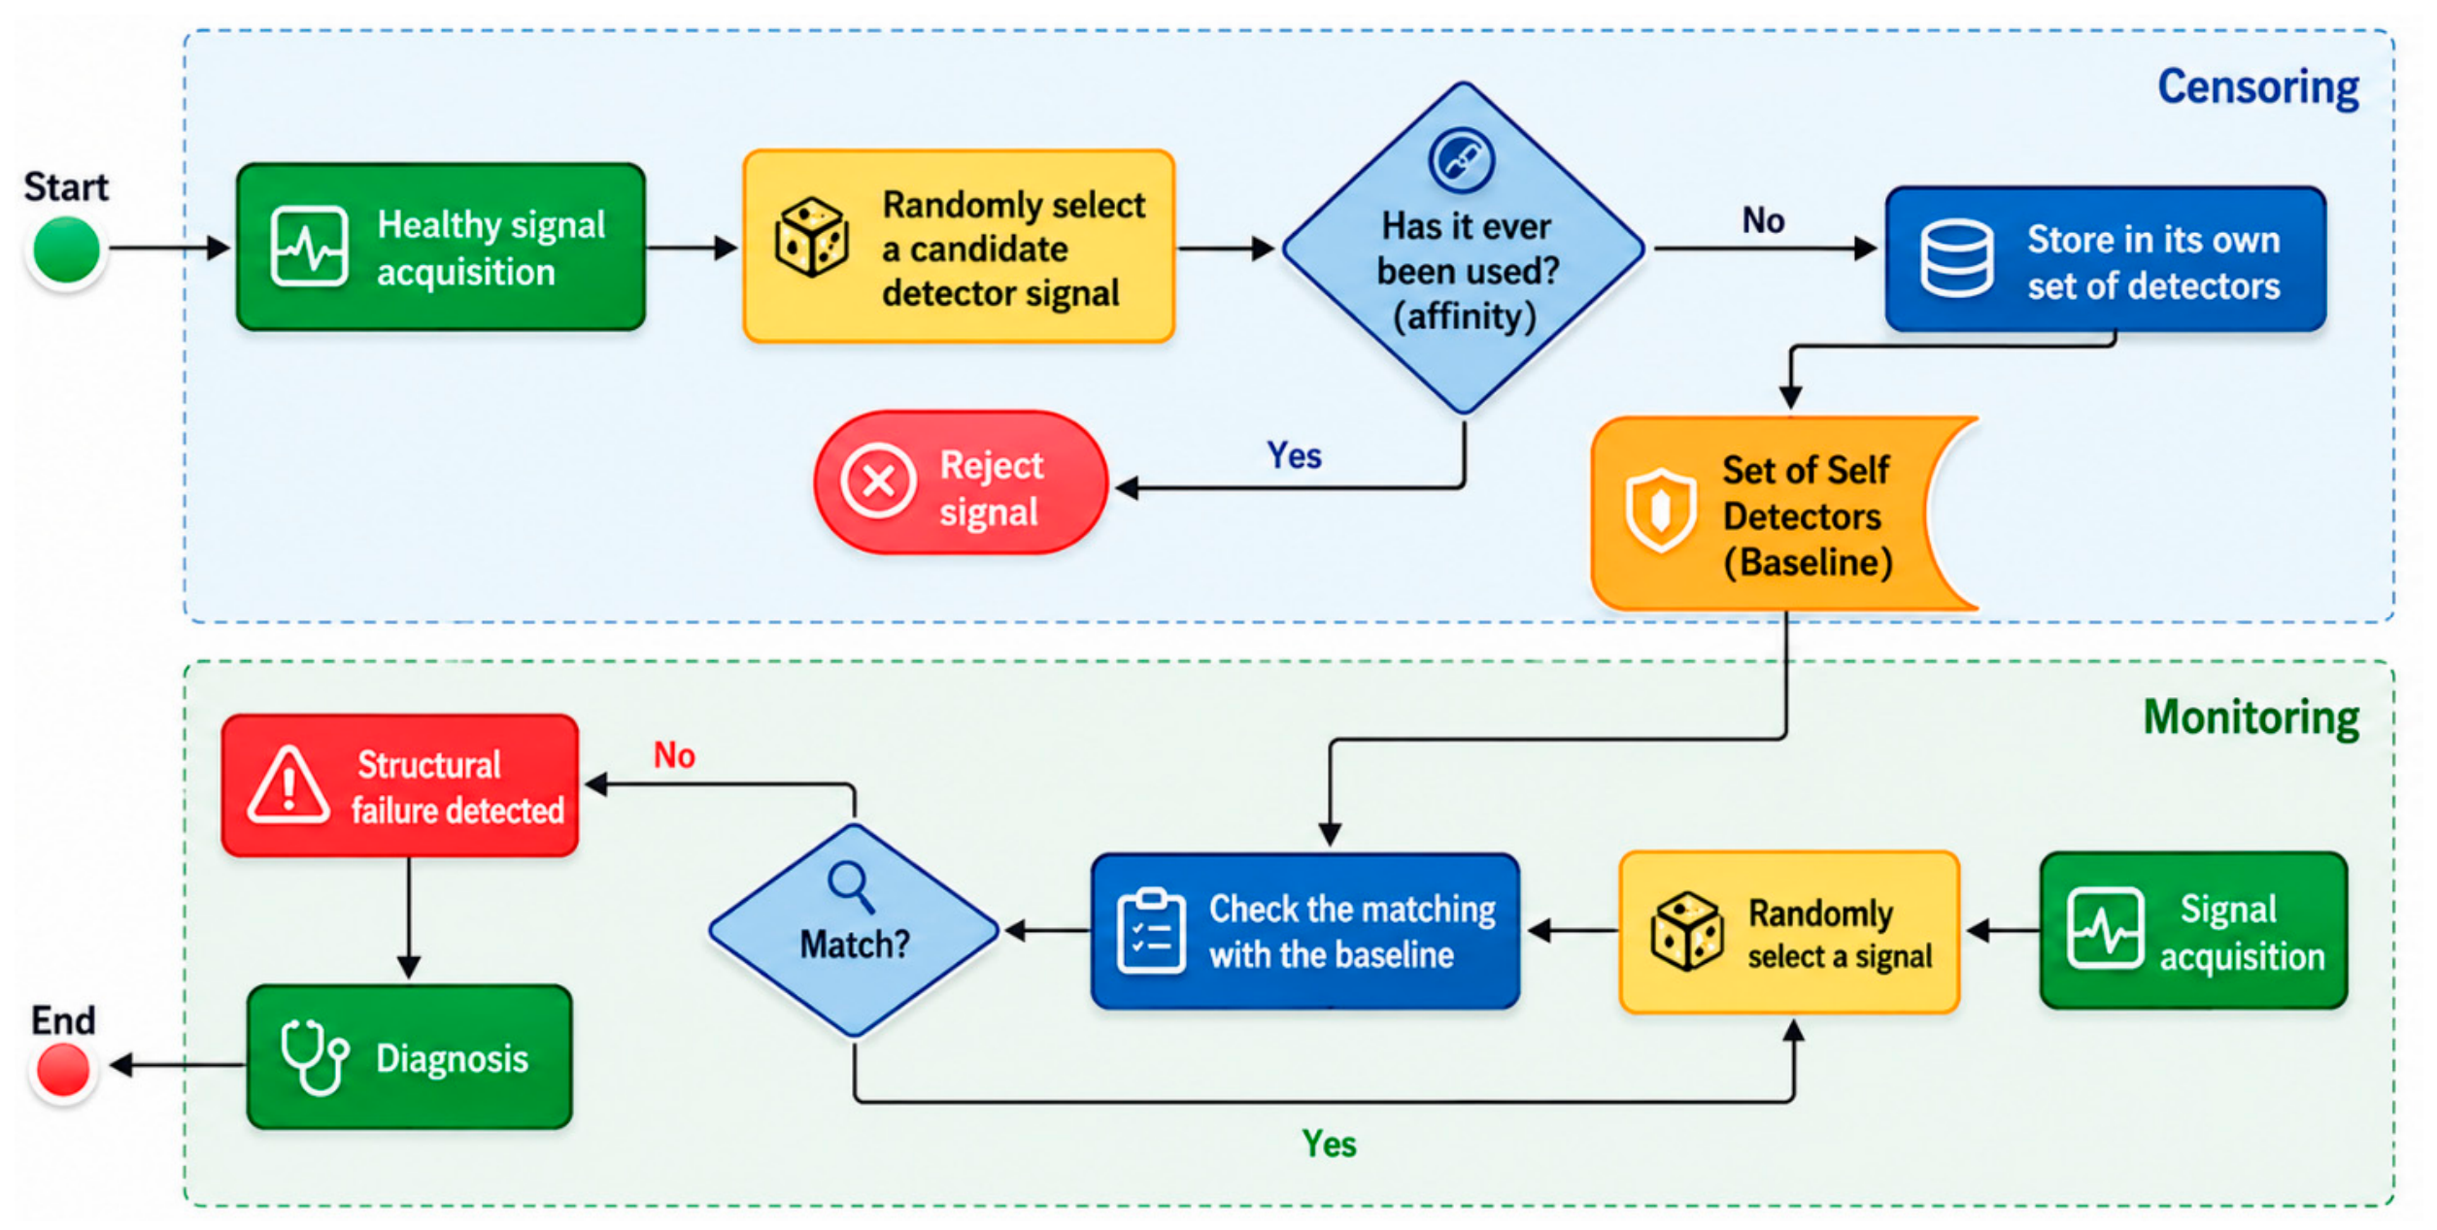
The overall computational workflow adopted in this study is illustrated in Figure 2.
Figure 2.
Negative Selection Algorithm workflow. Green blocks represent signal acquisition and final diagnostic outcomes; yellow blocks denote candidate detector selection; blue diamonds indicate affinity matching evaluations; red blocks represent signal rejection or structural failure detection; and the orange block highlights the mature baseline self-detector set. Arrows trace the sequential algorithmic data flow across censoring and monitoring phases.
All Artificial Immune System (AIS) algorithms, data preprocessing routines, statistical overlap evaluations, and graphical plots were implemented using Python software (version 3.10.12, Python Software Foundation, Wilmington, DE, USA; https://www.python.org) with NumPy (version 1.24.3), SciPy (version 1.10.1), scikit-learn (version 1.2.2), and Matplotlib (version 3.7.1) libraries.
3. Results and Discussion
This section presents and discusses the experimental and computational results obtained from the integration of the redox-capacitive biosensing platform with the Artificial Immune System (AIS) algorithm. In electrochemical and bioimpedance spectroscopy, the total complex capacitance (C*) is fundamentally decoupled into two complementary physical components: real capacitance (), which reflects interfacial charge-storage dynamics, and imaginary capacitance (), associated with energy dissipation and dielectric loss. To provide a comprehensive evaluation, this study systematically analyzes the individual feature matrices derived from real capacitance (, DS1) and imaginary capacitance (, DS2), as well as their concatenated representation (, DS3).
3.1. Biosensing Performance via Real Capacitance (C′) Realization
This subsection presents the performance of the proposed AIS model challenged under three distinct operational scenarios using the real capacitance data matrix (49 columns/attributes), followed by a rigorous boundary overlap analysis.
3.1.1. AIS Performance: Positive vs. Blank Scenario (Real Capacitance, C′)
The primary objective of the proposed biosensor is the accurate identification of Dengue NS1 protein against control samples. The AIS algorithm was configured to discriminate between Positive samples (Self) and Blank controls (Out-of-Self/Anomaly). The hyperparameters established for this evaluation are detailed in Table 3.
Table 3.
AIS model hyperparameter configuration (Positives vs. Blanks).
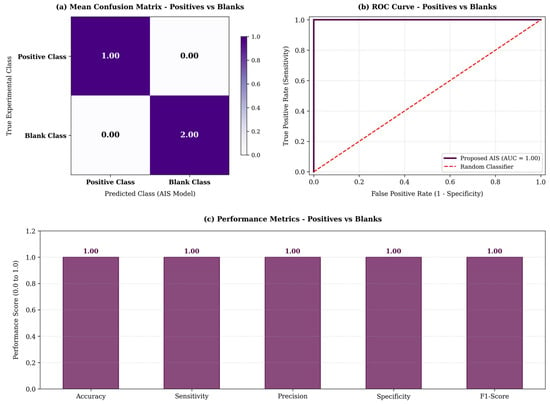
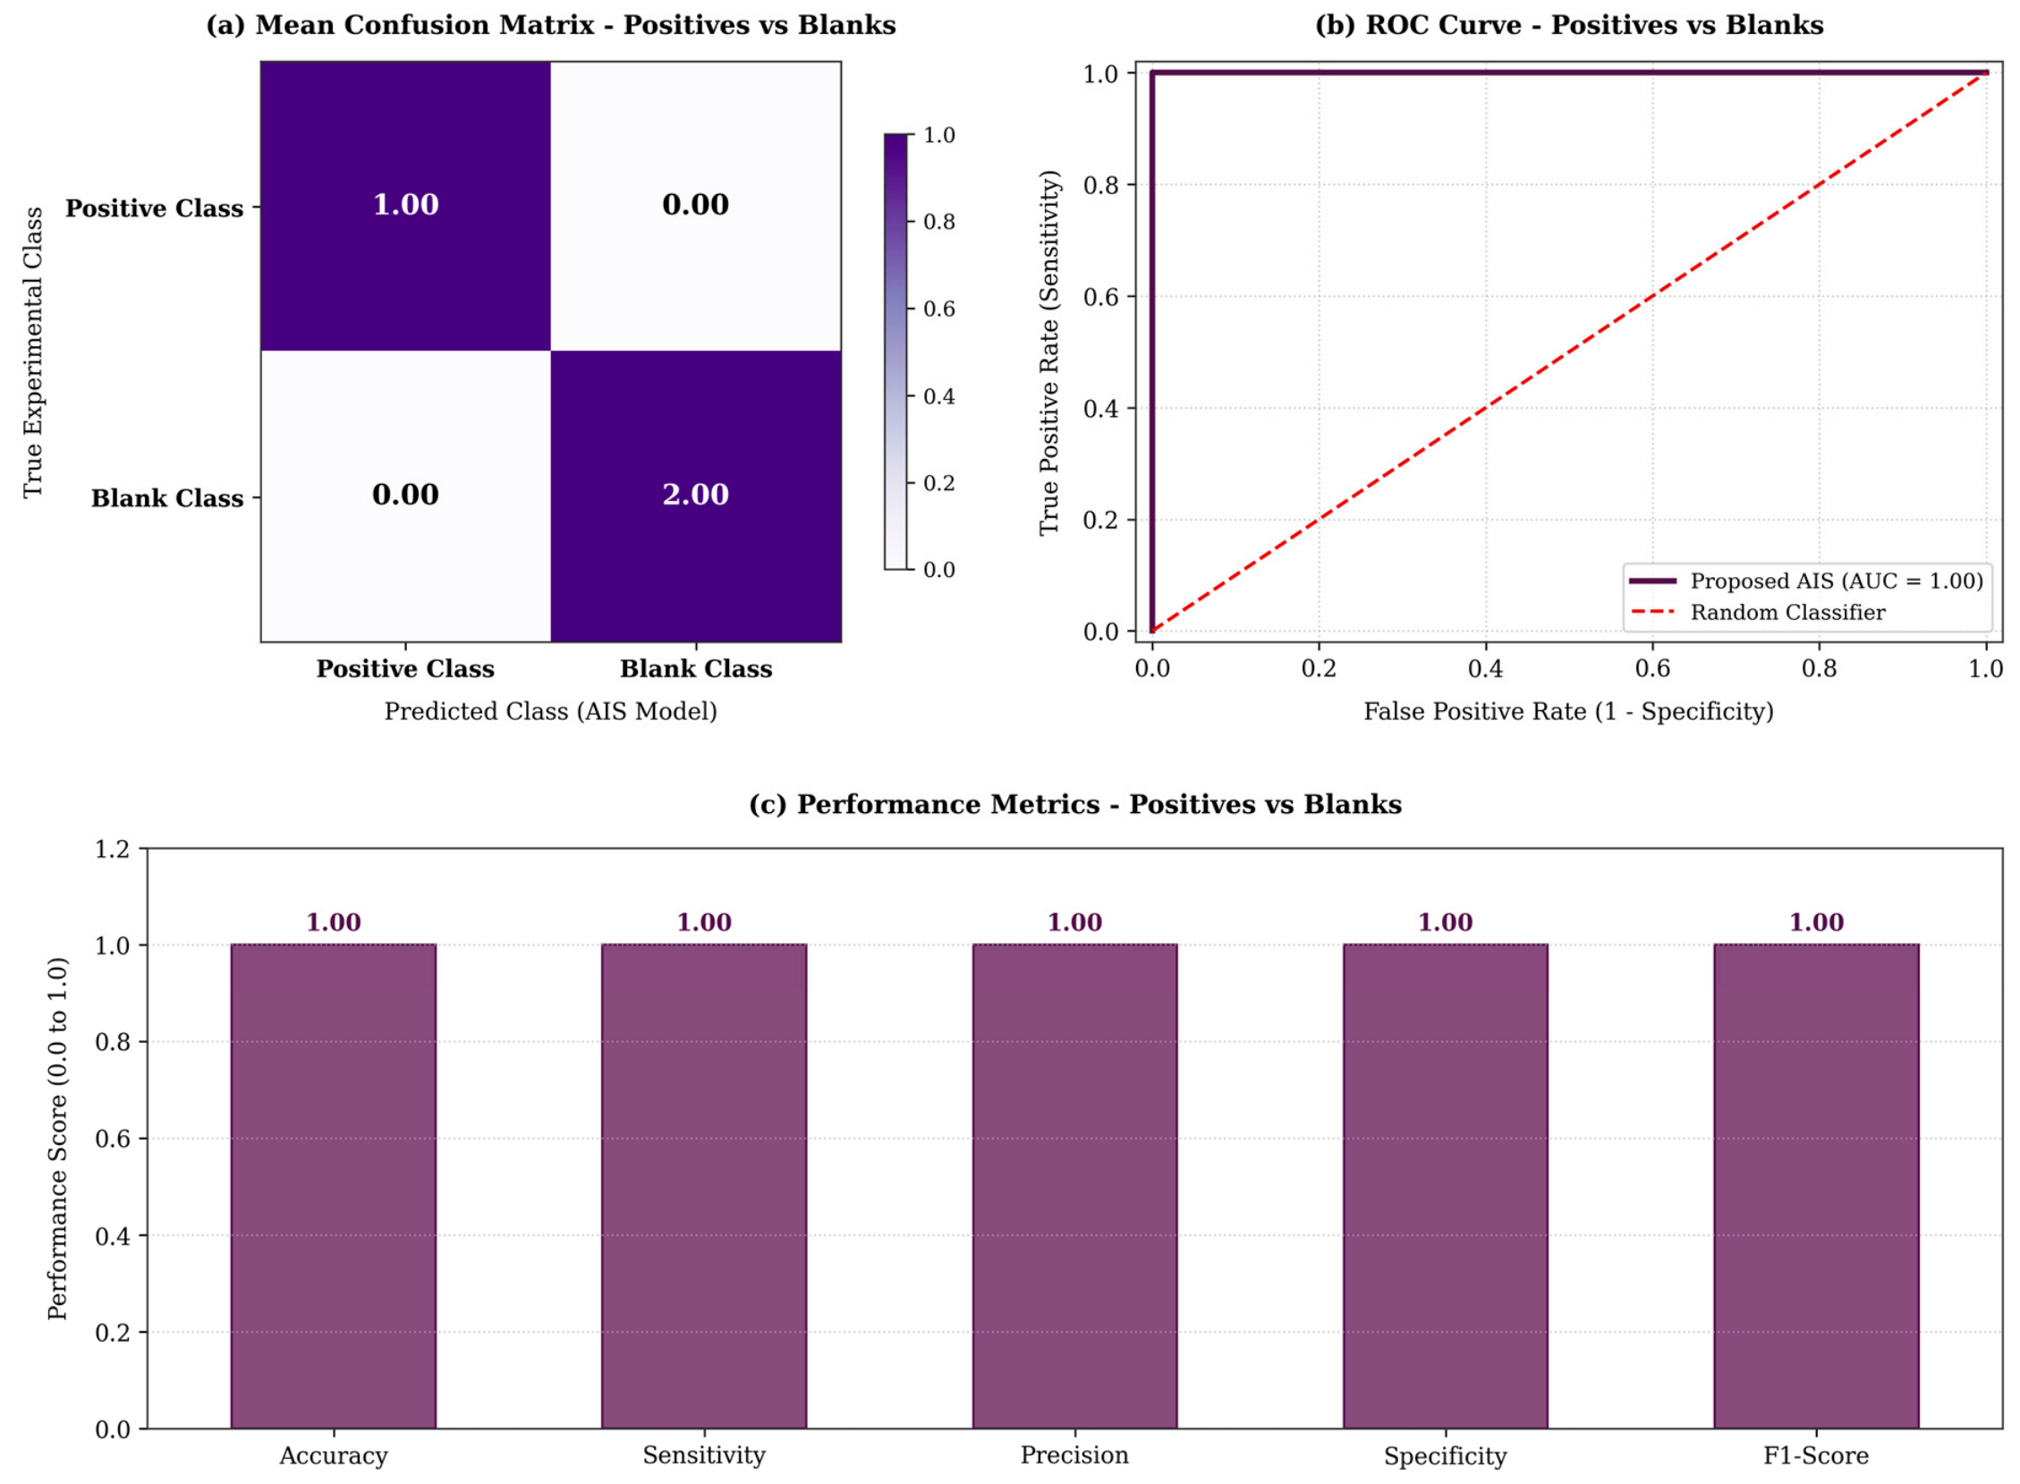
The algorithm demonstrated an exceptional ability to map the self-space of the positive samples. As shown in the Mean Consolidated Confusion Matrix (Table 4), the model achieved perfect classification with zero false positives and zero false negatives.
Table 4.
Mean Consolidated Confusion Matrix (Positives vs. Blanks).
The statistical summary (Table 5) and the visual representation in Figure 3 corroborate this absolute convergence. The system achieved 100% across all major performance metrics (Accuracy, Sensitivity, Precision, Specificity, and F1-Score) with an extremely low processing time (≈0.00019 s), confirming its viability for real-time, point-of-care diagnostics.
Table 5.
Final statistical performance summary (Positives vs. Blanks).
Figure 3.
Consolidated performance for Positive vs. Blank classification. (a) Mean Confusion Matrix, (b) ROC Curve where the purple solid line represents the proposed AIS classifier and the red dashed diagonal line indicates the random baseline classifier, and (c) Global Performance Metrics.
3.1.2. AIS Performance: Blank vs. Negative Scenario (Real Capacitance, C′)
To challenge the noise-resilience and specificity of the biosensing platform, the AIS was subjected to a secondary, highly complex scenario: differentiating Blank controls from Negative clinical samples. This test is critical to prove that the sensor’s baseline does not structurally overlap with standard physiological noise (Negative samples). For this task, the validation strategy was expanded to a 16-fold cross-validation (Table 6).
Table 6.
AIS model hyperparameter configuration (Blanks vs. Negatives).
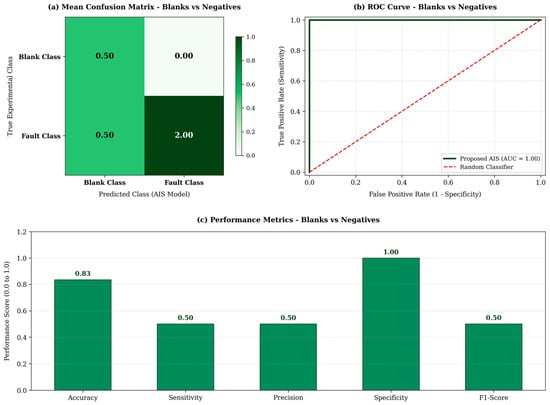
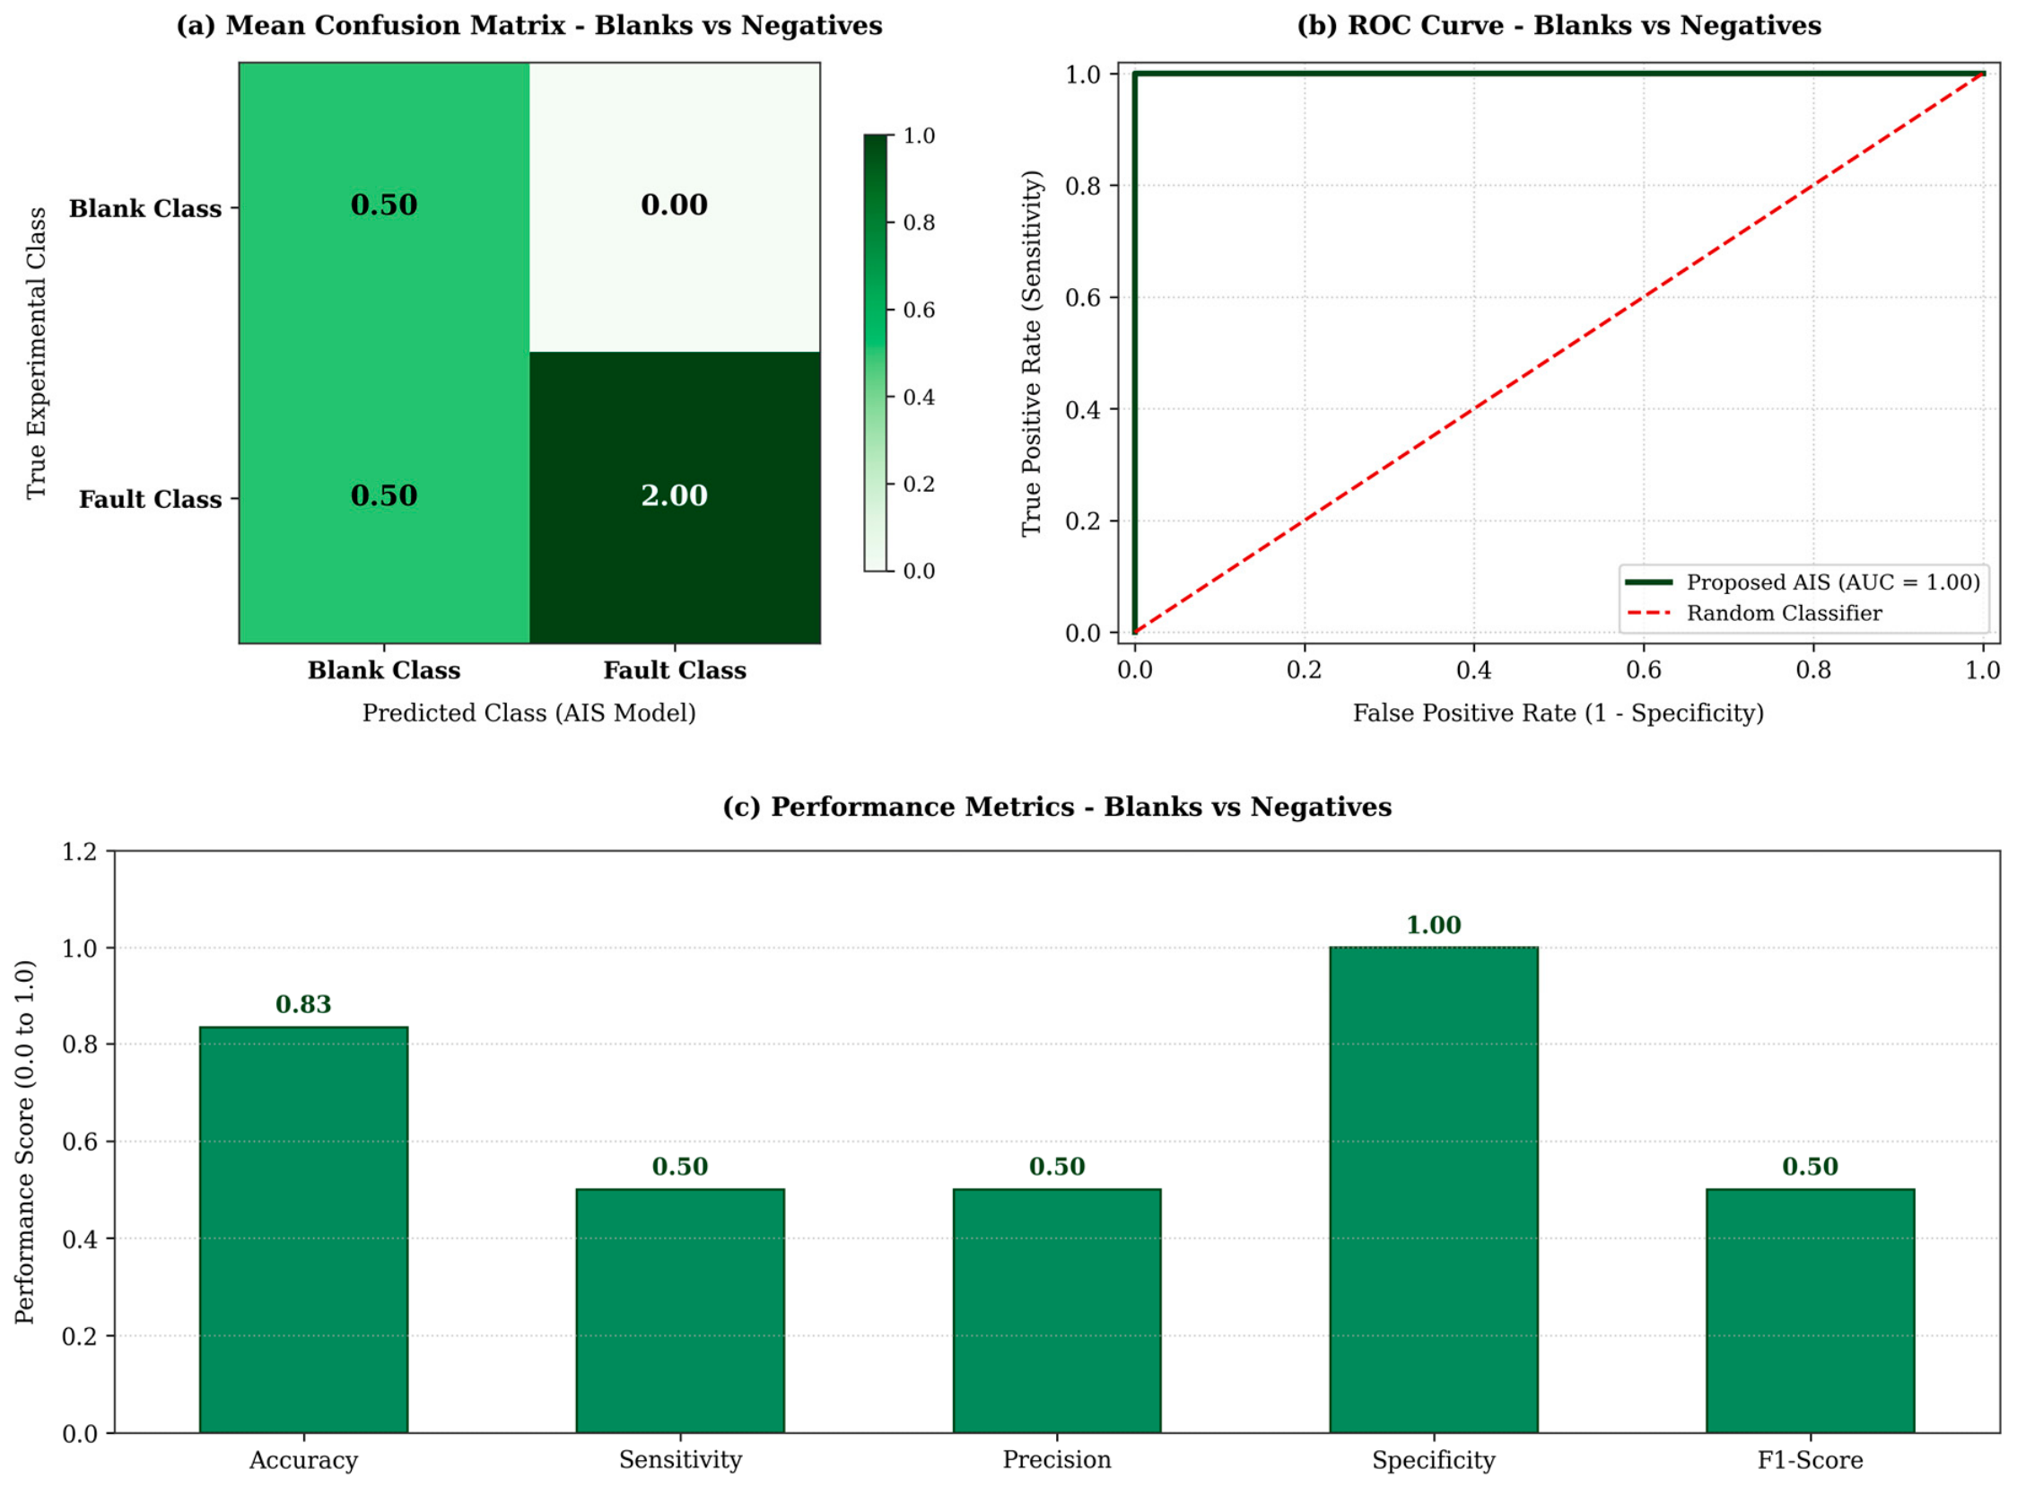
The results indicate a strong, albeit more nuanced, classification boundary. As seen in the Confusion Matrix (Table 7), the model perfectly identified the True Negatives (Specificity = 100.0%), meaning that no negative sample was mistakenly classified as a fault. However, there was a minor structural overlap that led to a 50% true positive rate for the Blank class.
Table 7.
Mean Consolidated Confusion Matrix (Blanks vs. Negatives).
Despite the overlap, the overall statistical mean (Table 8) yielded an accuracy of 83.3%. This demonstrates that even in the presence of similar non-target biological matrices, the AIS algorithm maintains a high degree of reliability and completely prevents the misclassification of actual clinical negatives, acting as a highly specific structural filter.
Table 8.
Final statistical performance summary (Blanks vs. Negatives).
The consolidated performance metrics and ROC curve analysis for the Blank vs. Negative classification scenario are depicted in Figure 4.
Figure 4.
Consolidated performance for Blank vs. Negative classification. (a) Mean Confusion Matrix, (b) ROC Curve where the green solid line represents the proposed AIS classifier and the red dashed diagonal line indicates the random baseline classifier, and (c) Global Performance Metrics.
3.1.3. AIS Performance: Positive vs. Negative Scenario (Real Capacitance, C′)
The primary objective of the proposed biosensor architecture is the unequivocal identification of Dengue NS1 protein in clinical samples. To this end, the AIS algorithm was configured to discriminate between Positive samples (recognized as Normal/Self) and Negative samples (recognized as Fault/Anomaly). The hyperparameters established for this clinical diagnosis scenario are detailed in Table 9.
Table 9.
AIS model hyperparameter configuration (Positives vs. Negatives).
The algorithm demonstrated an excellent capacity to map the structural recognition space. As seen in the Mean Consolidated Confusion Matrix (Table 10), the model achieved an outstanding separation between the classes, maintaining a high sensitivity of 100.0% and specificity of 100.0%. These results are critical as they prove the AIS-coupled sensor successfully prevents false negatives, essential for not missing infected patients, and mitigates the occurrence of false positives in cross-diagnostics.
Table 10.
Mean Consolidated Confusion Matrix (Positives vs. Negatives).
The overall statistical mean (Table 11) yielded an accuracy of 100.0%. This demonstrates that the algorithm acts as a highly effective pattern recognition tool, perfectly identifying the biological changes caused by the specific binding of the Dengue NS1 antigen, even amidst the complex biological matrix of the human serum. Furthermore, the extremely low processing time (0.000214 s) confirms the system’s readiness for real-time point-of-care diagnostics.
Table 11.
Final statistical performance summary (Positives vs. Negatives).
The diagnostic performance and ROC analysis for the Positive vs. Negative clinical scenario using real capacitance are summarized in Figure 5.
Figure 5.
Consolidated performance for Positive vs. Negative classification. (a) Mean Confusion Matrix, (b) ROC Curve where the blue solid line represents the proposed AIS classifier and the red dashed diagonal line indicates the random baseline classifier, and (c) Global Performance Metrics.
3.1.4. Advanced Performance and Statistical Boundary Overlap Analysis (Real Capacitance, C′)
To deeply understand the classification dynamics and the physical limits of the biosensor’s signal discrimination, an advanced statistical boundary overlap analysis was conducted. The Bhattacharyya Coefficient (BC) was employed to mathematically quantify the intersection between the probability density distributions of the evaluated classes across all three scenarios. A BC closer to 0 indicates complete separation, whereas a BC approaching 1 denotes high distribution overlap and severe signal ambiguity [20].
For two continuous probability distributions and representing the signal variations in two operational classes, the Bhattacharyya Coefficient () is defined as:
where denotes complete spatial separation and indicates total distribution overlap.
Table 12 summarizes the Global Performance Metrics juxtaposed with the Bhattacharyya overlap index for each experimental setup.
Table 12.
Advanced performance & boundary overlap analysis across AIS scenarios.
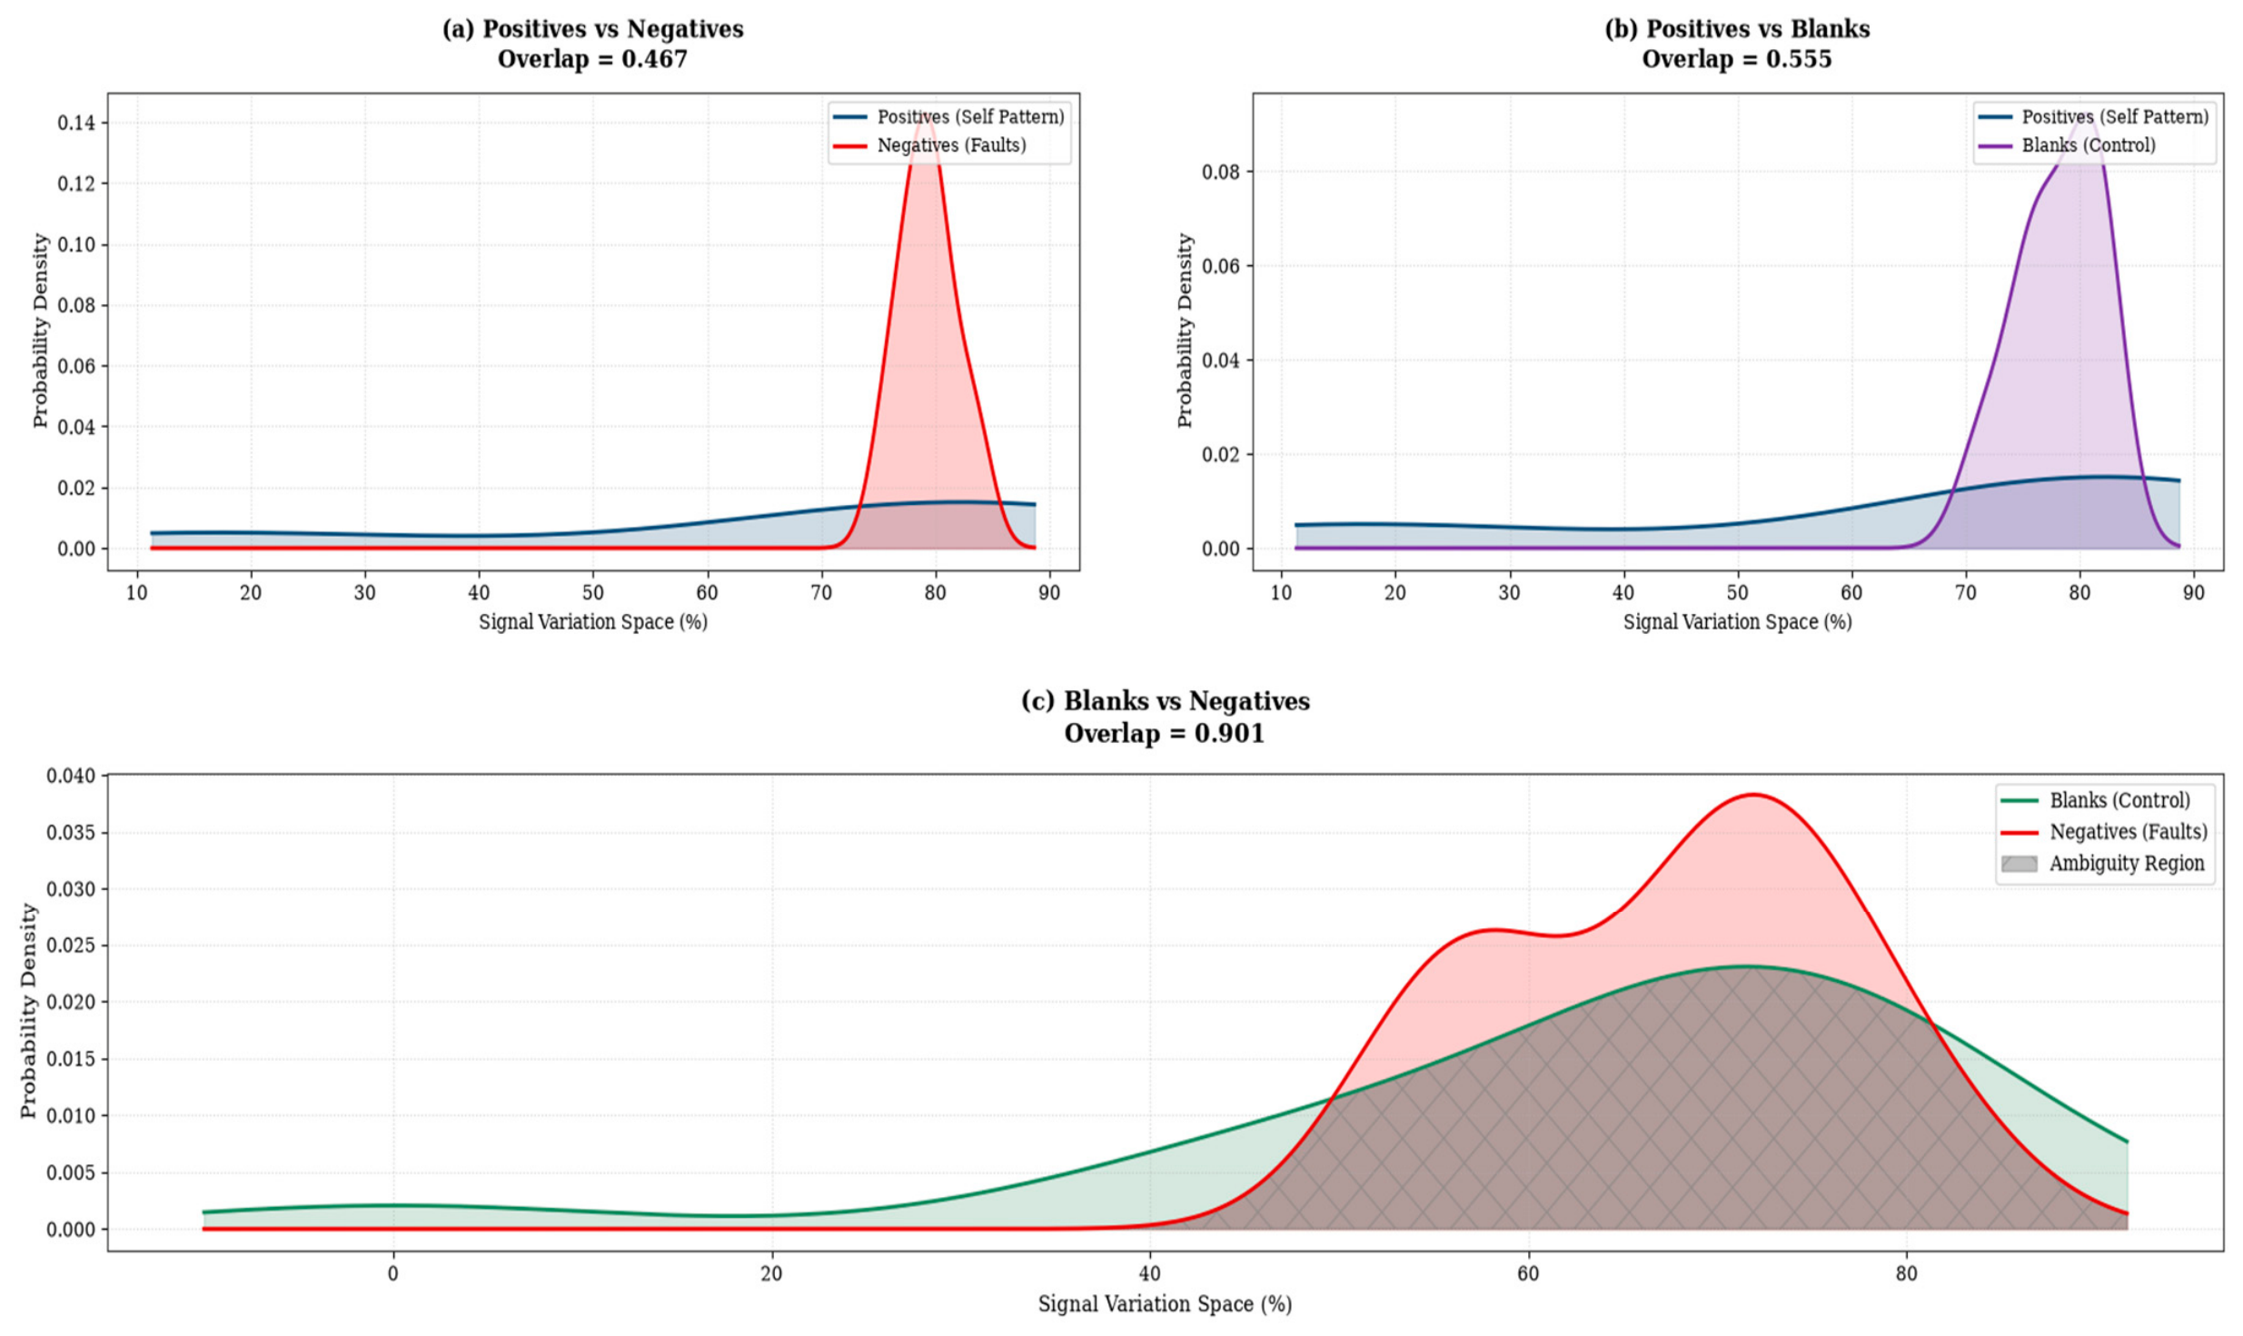
The mathematical measurement of the signal overlap perfectly elucidates the AIS classification behavior observed in the previous sections. For the primary diagnostic and validation scenarios (Positives vs. Negatives and Positives vs. Blanks), the calculated Bhattacharyya indices were 0.467 and 0.555, respectively. These values demonstrate that the specific NS1 antigen–antibody binding event induces a distinct and substantial modulation in the interface’s real capacitance. The spatial separation of the probability densities is wide enough to allow the AIS to establish a rigid geometrical boundary (recognition radius, D = 0.05) exclusively around the Positive (Self) samples, resulting in 100% accuracy without any cross-contamination.
Conversely, the evaluation of Blanks vs. Negatives exhibited a remarkably high Bhattacharyya index of 0.901, indicating extreme structural ambiguity. From a physical and electrochemical standpoint, this demonstrates that the baseline response of the sensor (Blank buffer) and the complex physiological matrix without the NS1 target (Negative serum) share highly similar capacitive features.
Remarkably, despite an approximately 90% structural overlap in the data distribution, the proposed AIS framework still achieved an 83.3% global accuracy and perfectly preserved the true negative identification. This outcome highlights the profound noise-resilience and adaptive thresholding capability (TAF) of the Artificial Immune System. The algorithm proved capable of navigating highly dense, ambiguous data boundaries, where traditional linear classifiers would typically fail, filtering out overlapping physiological noise to maintain diagnostic reliability.
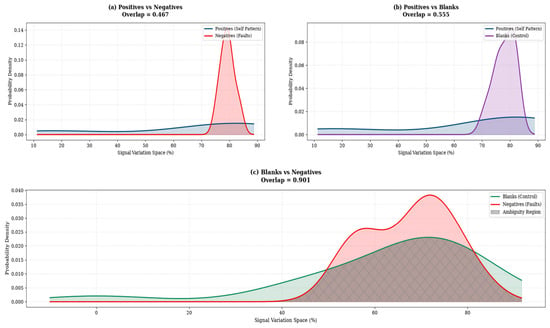
Figure 6 visually illustrates the statistical overlap analysis through the probability density curves of the capacitive signal variation across the three evaluated scenarios. As observed in panels (a) and (b), which refer to the Positive vs. Negative and Positive vs. Blank classifications, respectively, a clear separation exists between the class distributions. This spatial separation proves that the specific binding event of the NS1 antigen to the antibody modulates the real capacitance of the sensing interface in a substantial and unique manner, enabling the AIS algorithm to establish a precise recognition boundary free of cross-contamination. Conversely, panel (c) highlights the critical Blank vs. Negative scenario, where the vast shaded area (Ambiguity Region) graphically represents the high Bhattacharyya coefficient (0.901). This pronounced visual overlap demonstrates the profound physicochemical similarity between the biosensor’s baseline response (control buffer) and the complex physiological matrix of the serum without the virus. Nevertheless, it is precisely within this high-density zone of stochastic ambiguity that the immuno-inspired computational model (AIS) consolidates its value: rather than failing under the structural confusion of borderline signals, the algorithm adapts its shape affinity limens (TAF), ensuring robust noise filtering and the total preservation of clinical true negative identification.
Figure 6.
Probability density intersections and Bhattacharyya overlap analysis across the evaluated scenarios. (a) Positives vs. Negatives, (b) Positives vs. Blanks, and (c) Blanks vs. Negatives. Blue curves denote Positive profiles (Self Pattern), red curves represent Negatives (Faults), purple/green curves indicate Blank controls, and the grey cross-hatched shaded area highlights the stochastic ambiguity region.
It is crucial to contextualize the analytical scope and boundary conditions of the present study. While the proposed Artificial Immune System (AIS) architecture successfully demonstrates exceptional noise resilience and pattern recognition across full capacitive frequency spectra ( to ), full empirical analytical validation remains a necessary milestone for experimental translation. Fundamental biosensing parameters, specifically concentration-dependent calibration curves, Limit of Detection (LOD), dynamic range, electrode-to-electrode reproducibility (RSD%), matrix spike-recovery percentages, and cross-selectivity panels against co-circulating flaviviruses (such as Zika and Chikungunya viruses), must be systematically determined during subsequent empirical wet-lab trials using physical biochips.
3.2. Biosensing Performance via Imaginary Capacitance (C″) Outlook
While real capacitance (, DS1) captures the interfacial charge-storage dynamics, imaginary capacitance (, DS2) provides direct physical insights into energy dissipation and dielectric relaxation during specific molecular binding events. Evaluating the combined feature matrix DS3 (, 98 features) confirmed that concatenating charge-storage and dissipation profiles preserves the 100.0% diagnostic accuracy in Positive vs. Negative scenarios. However, because real capacitance () independently provides optimal geometric separation and noise resilience in background matrix filtering, utilizing alone minimizes vector dimensionality and processing time, making it the preferred single-channel descriptor, with serving as a specific cross-validation marker [21].
3.2.1. AIS Performance: Positive vs. Blank Scenario (Imaginary Capacitance, C″)
The secondary validation assessed the model’s capacity to isolate the Positive diagnostic signal from the baseline control buffer (Blanks) within the imaginary domain (Table 13).
Table 13.
AIS model hyperparameter configuration (Positives vs. Blanks—C″).
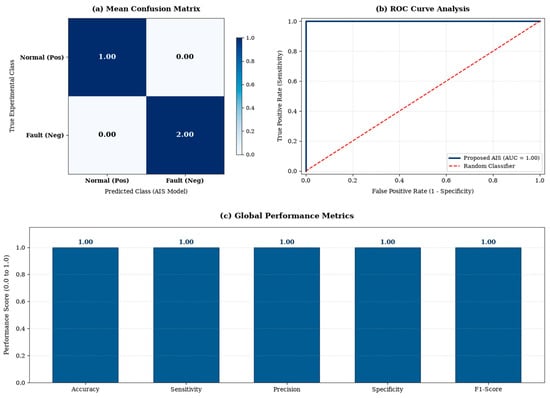
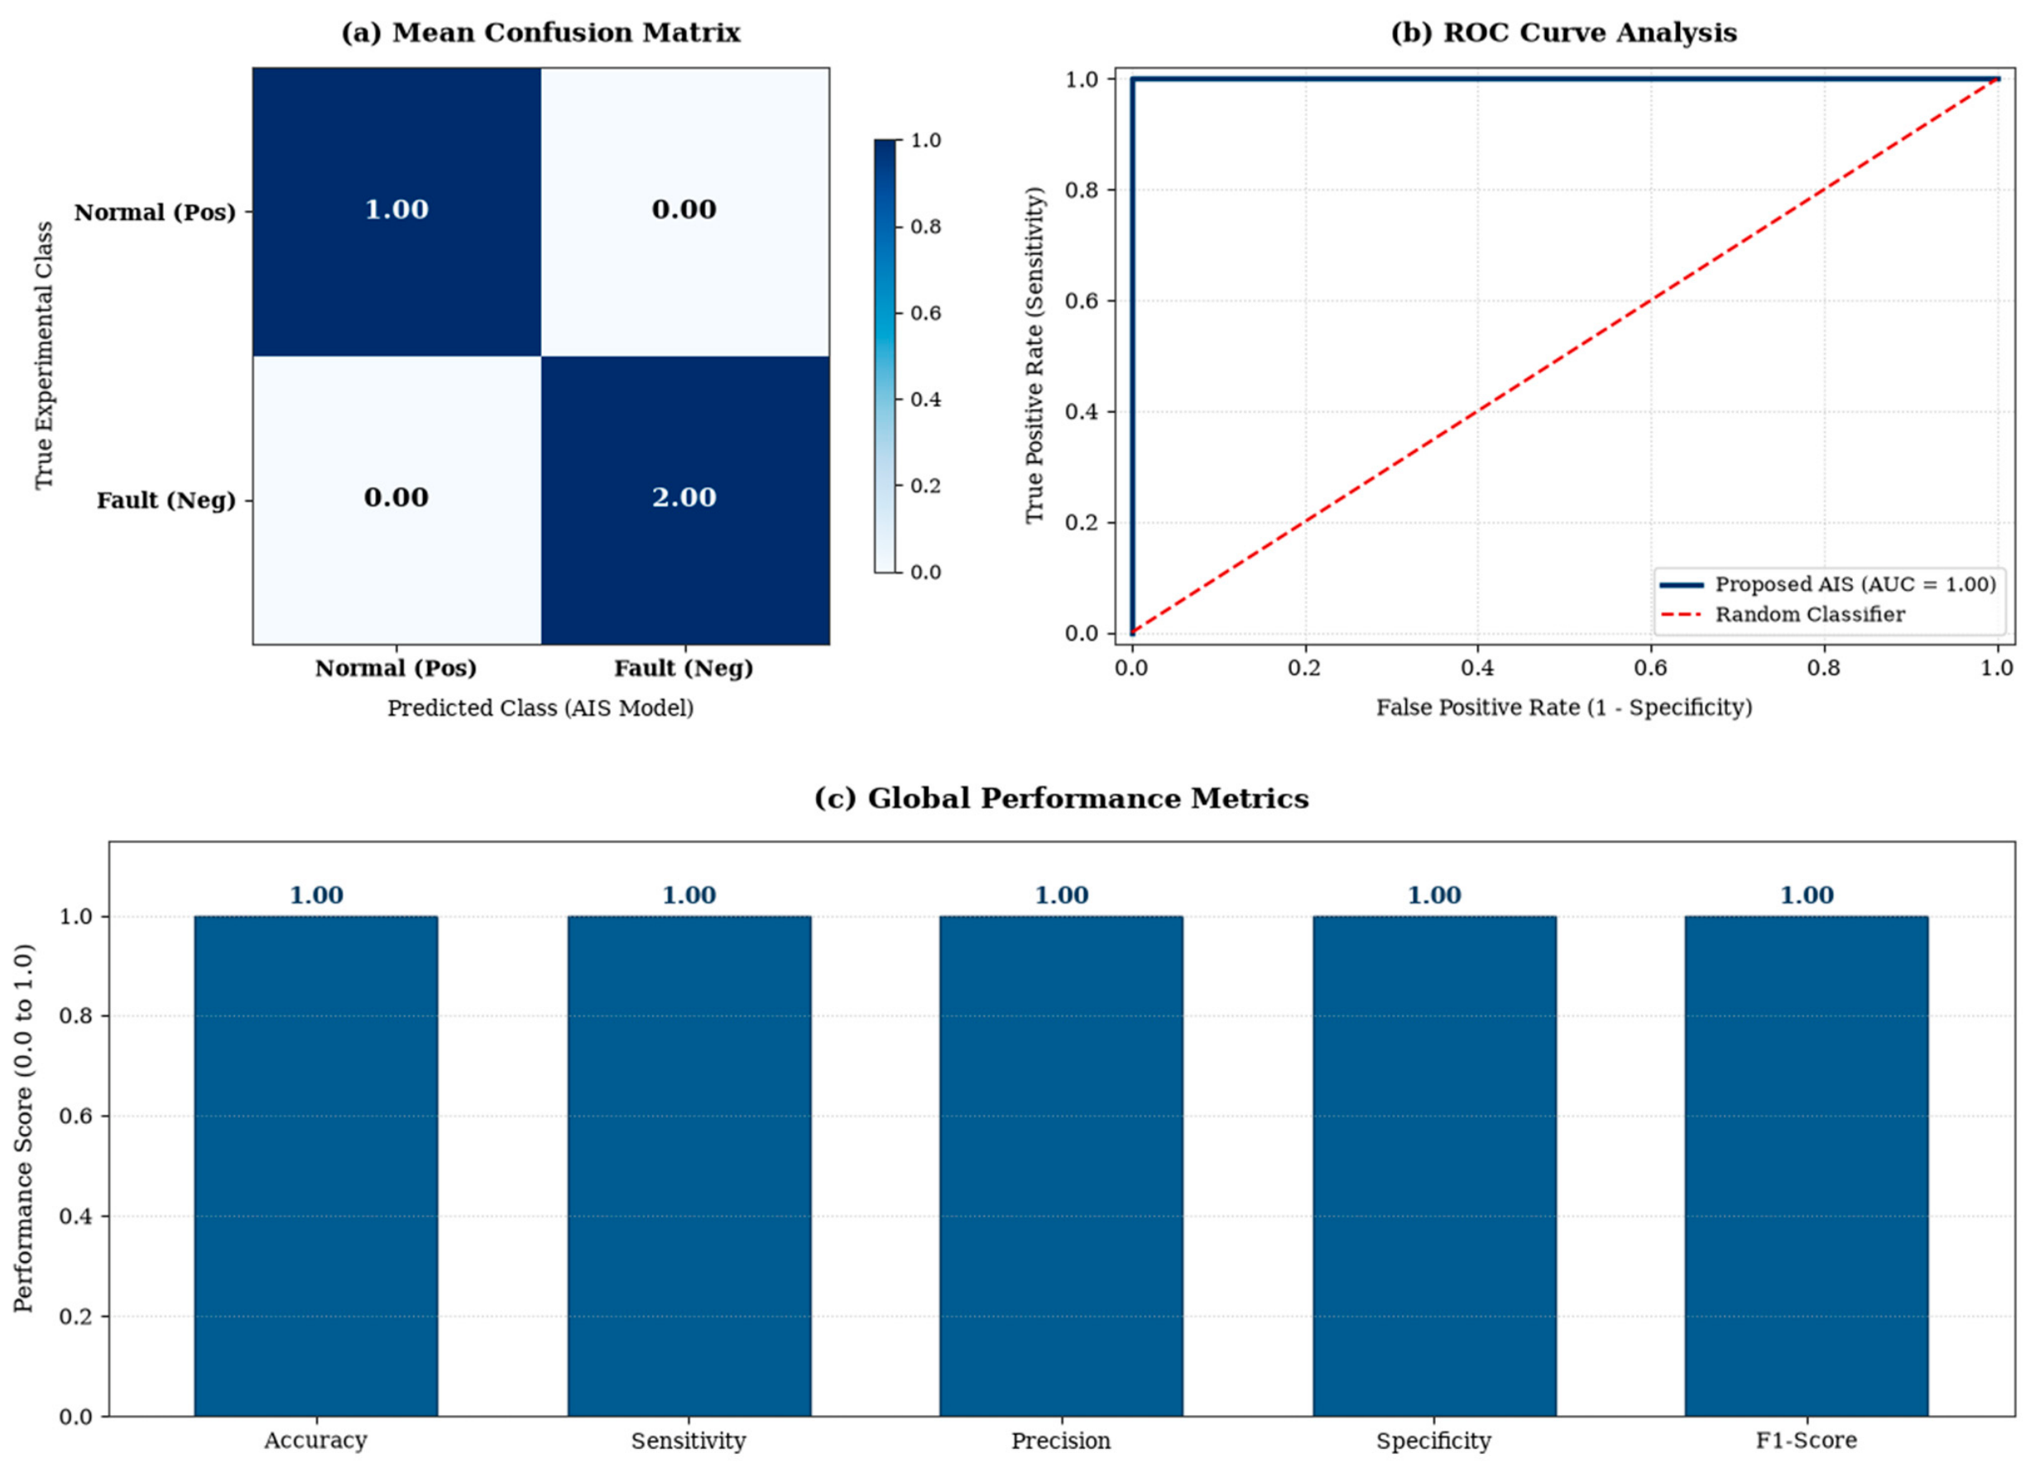
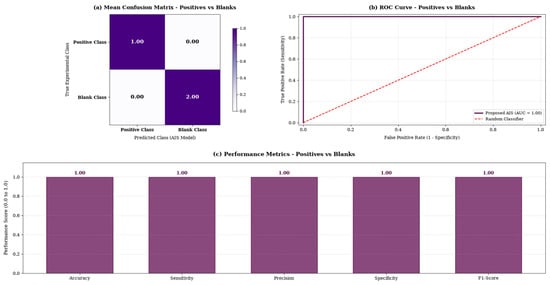
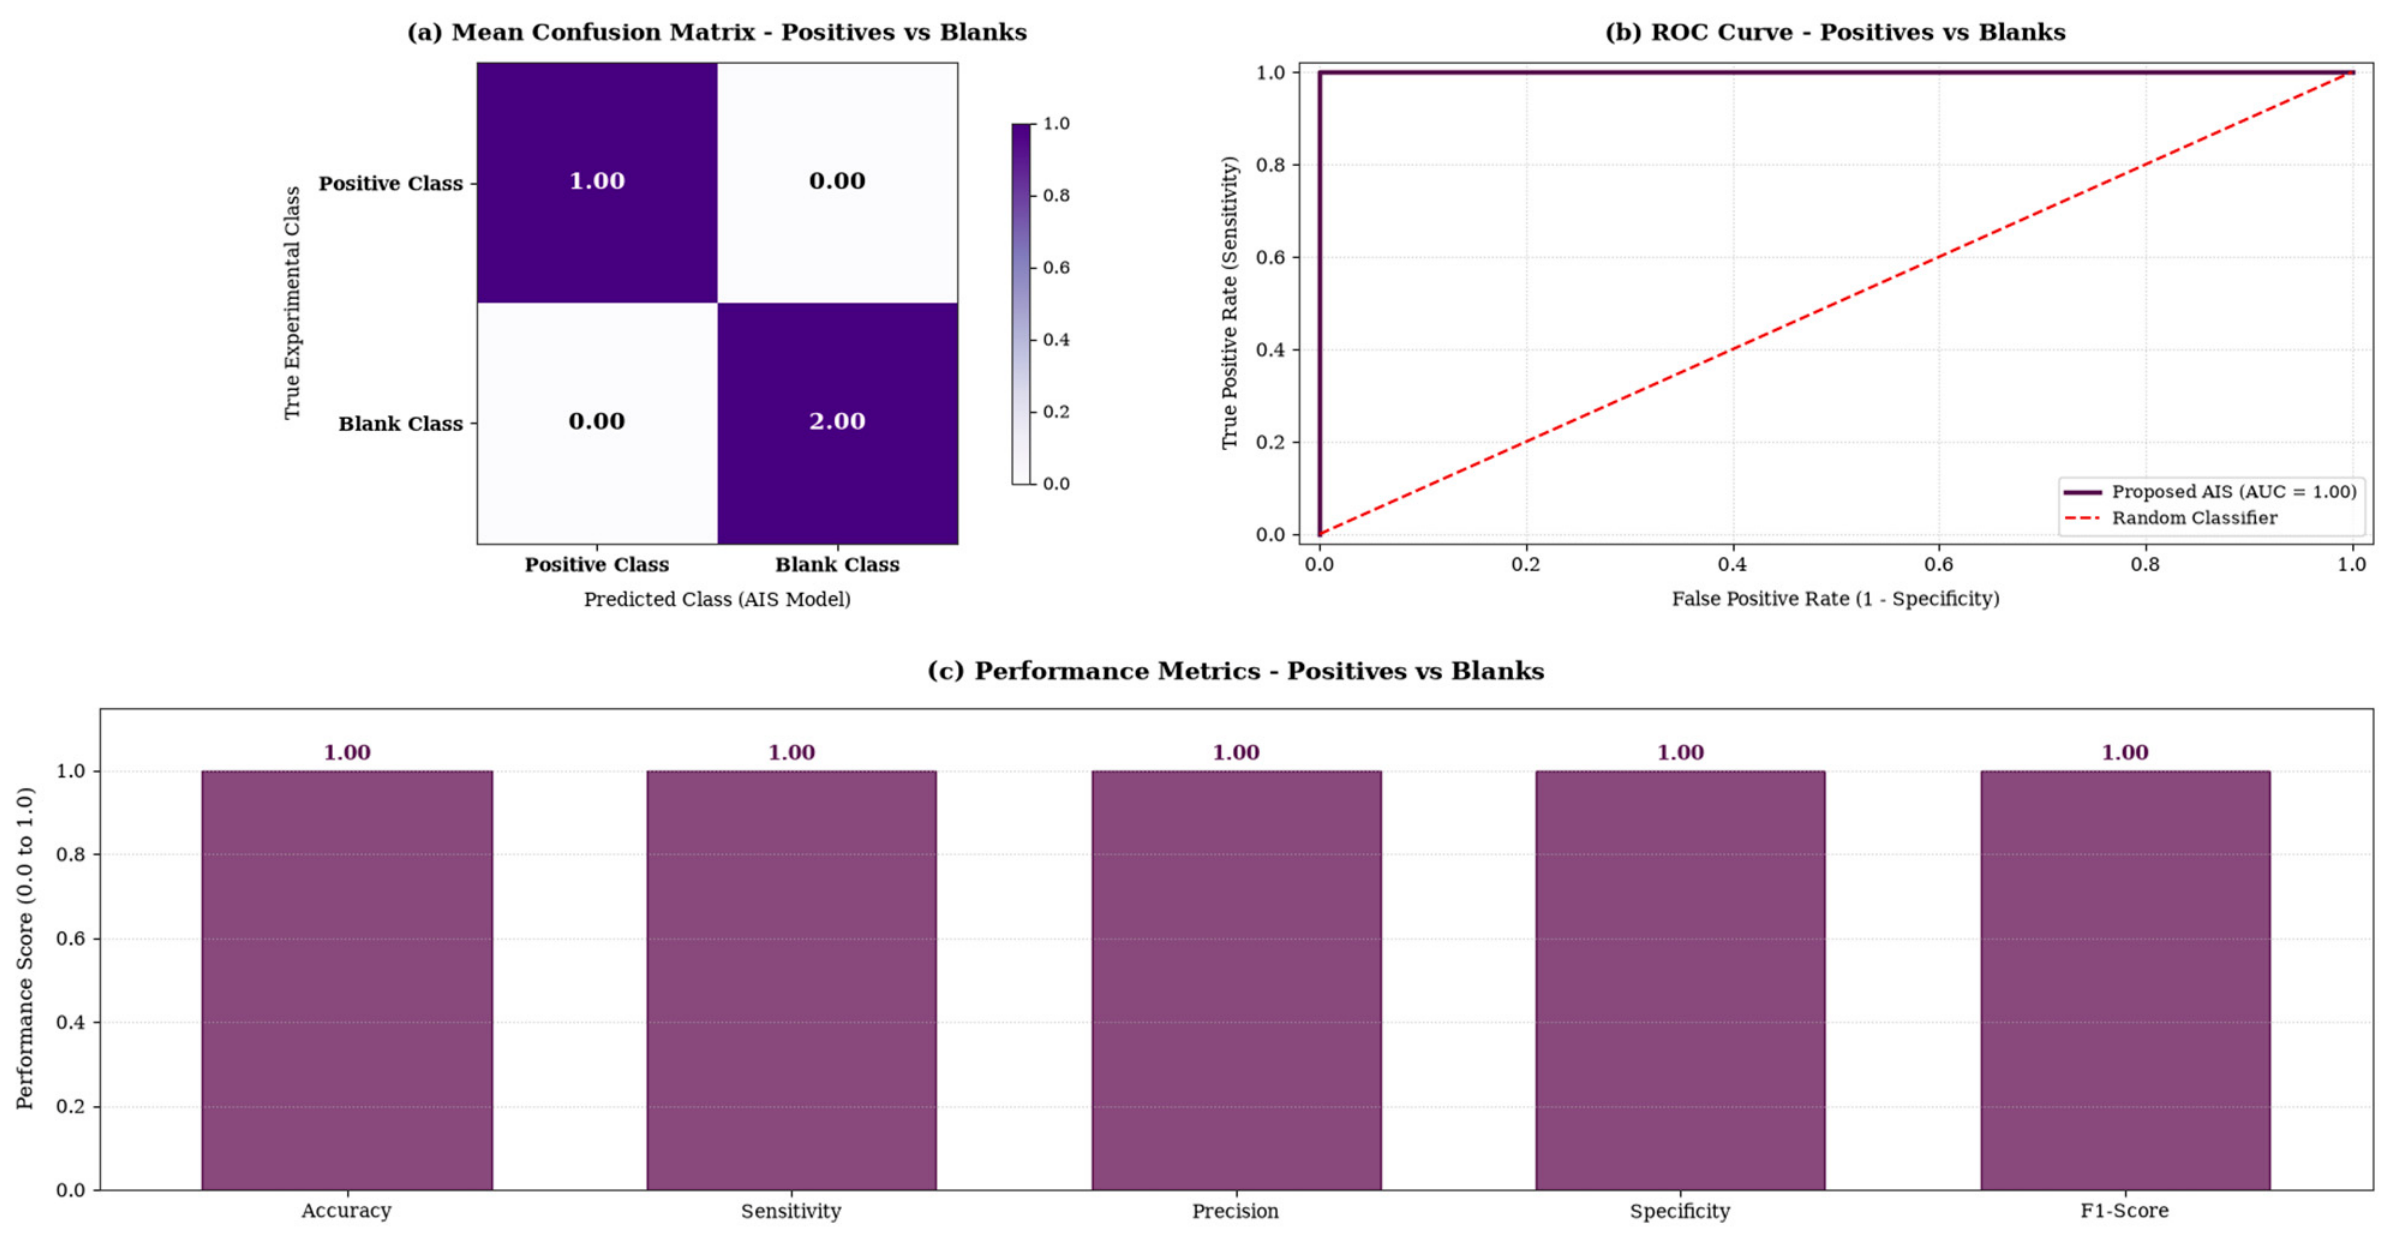
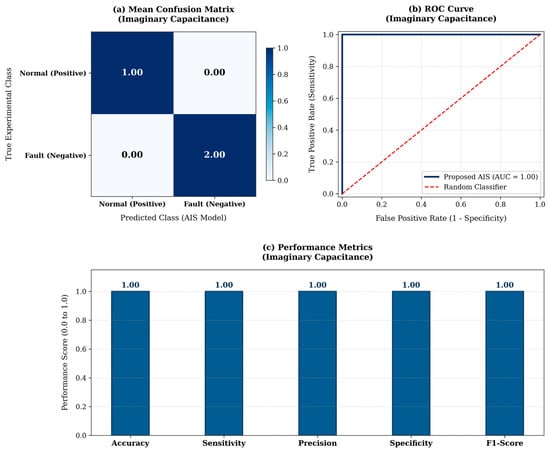
The algorithm successfully handled the background baseline, yielding no misclassifications. The model achieved a true positive and true negative rate of 1.00 and 2.00, respectively (Table 14).
Table 14.
Mean Consolidated Confusion Matrix (Positives vs. Blanks—C″).
The overall metrics (Table 15) reinforce the 100.0% accuracy. The dielectric modulation caused by the target analyte is sufficiently distinct from the bare functionalized electrode in the buffer.
Table 15.
Final statistical performance summary (Positives vs. Blanks—C″).
The consolidated performance for the Positive vs. Blank classification in the imaginary capacitance domain is presented in Figure 7.
Figure 7.
Consolidated performance for Positive vs. Blank classification using Imaginary Capacitance. (a) Mean Confusion Matrix, (b) ROC Curve where the purple solid line represents the proposed AIS classifier and the red dashed diagonal line indicates the random baseline classifier, and (c) Global Performance Metrics.
3.2.2. AIS Performance: Blank vs. Negative Scenario (Imaginary Capacitance, C″)
To fully stress-test the system, the AIS was deployed to differentiate Blank controls from Negative clinical samples. Due to the high stochasticity anticipated in this background evaluation, a rigorous 16-Fold cross-validation was implemented (Table 16).
Table 16.
AIS model hyperparameter configuration (Blanks vs. Negatives—C″).
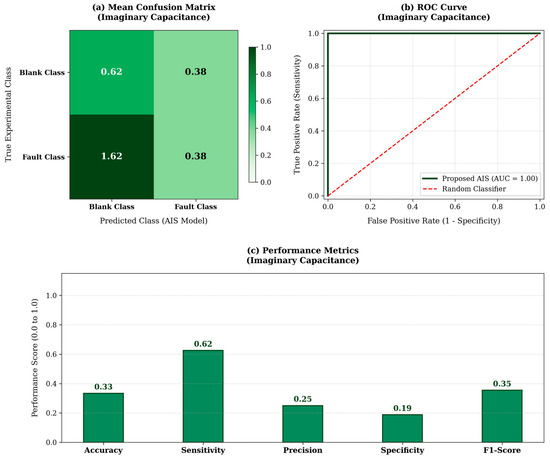
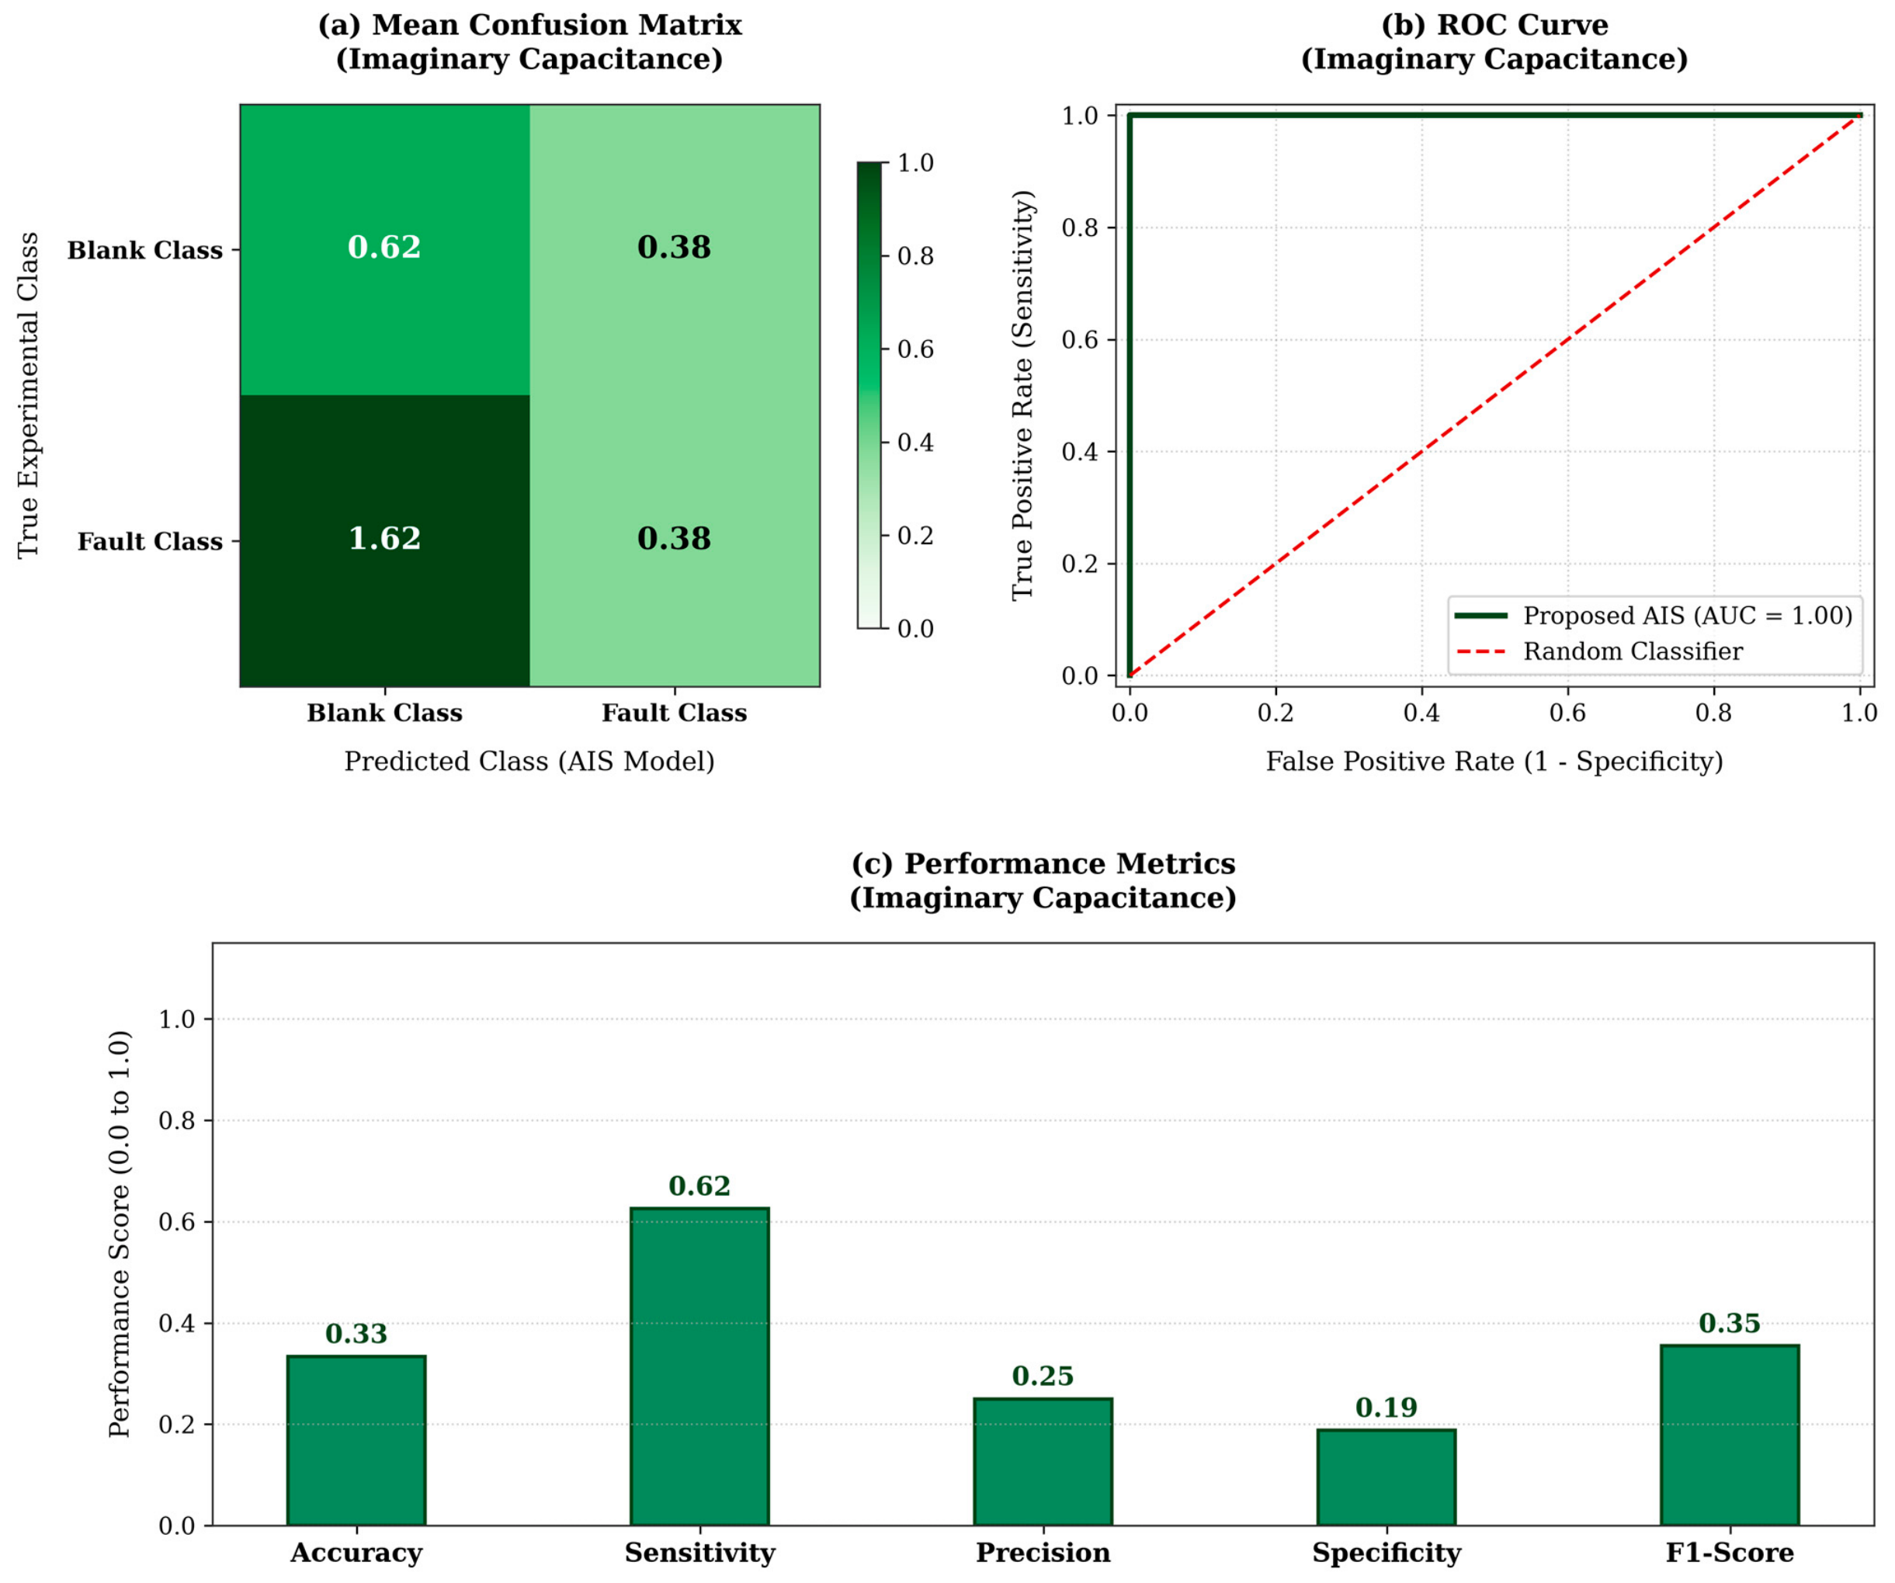
Contrasting sharply with the C′ results, the imaginary capacitance (C″) failed to distinguish between the two non-target matrices. As seen in Table 17, severe misclassifications occurred, with an excessive false-positive rate (1.62).
Table 17.
Mean Consolidated Confusion Matrix (Blanks vs. Negatives—C″).
The final statistical performance (Table 18) recorded a drastic drop in global accuracy to 33.3%, with specificity plummeting to 18.8%. From an electrochemical perspective, this reveals that the baseline buffer and the complex physiological serum (without the virus) induce virtually identical energy dissipation patterns.
Table 18.
Final statistical performance summary (Blanks vs. Negatives—C″).
The classification results and ROC curve analysis for the Blank vs. Negative scenario using imaginary capacitance are illustrated in Figure 8.
Figure 8.
Consolidated performance for Blank vs. Negative classification using Imaginary Capacitance. (a) Mean Confusion Matrix, (b) ROC Curve where the green solid line represents the proposed AIS classifier and the red dashed diagonal line indicates the random baseline classifier, and (c) Global Performance Metrics.
3.2.3. AIS Performance: Positive vs. Negative Scenario (Imaginary Capacitance, C″)
The primary clinical diagnostic scenario evaluated the AIS model’s capability to differentiate Dengue NS1 Positive samples from Negative clinical samples using solely the imaginary capacitance data. The hyperparameters established for this clinical diagnosis scenario in the imaginary domain are detailed in Table 19.
Table 19.
AIS model hyperparameter configuration (Positives vs. Negatives—C″).
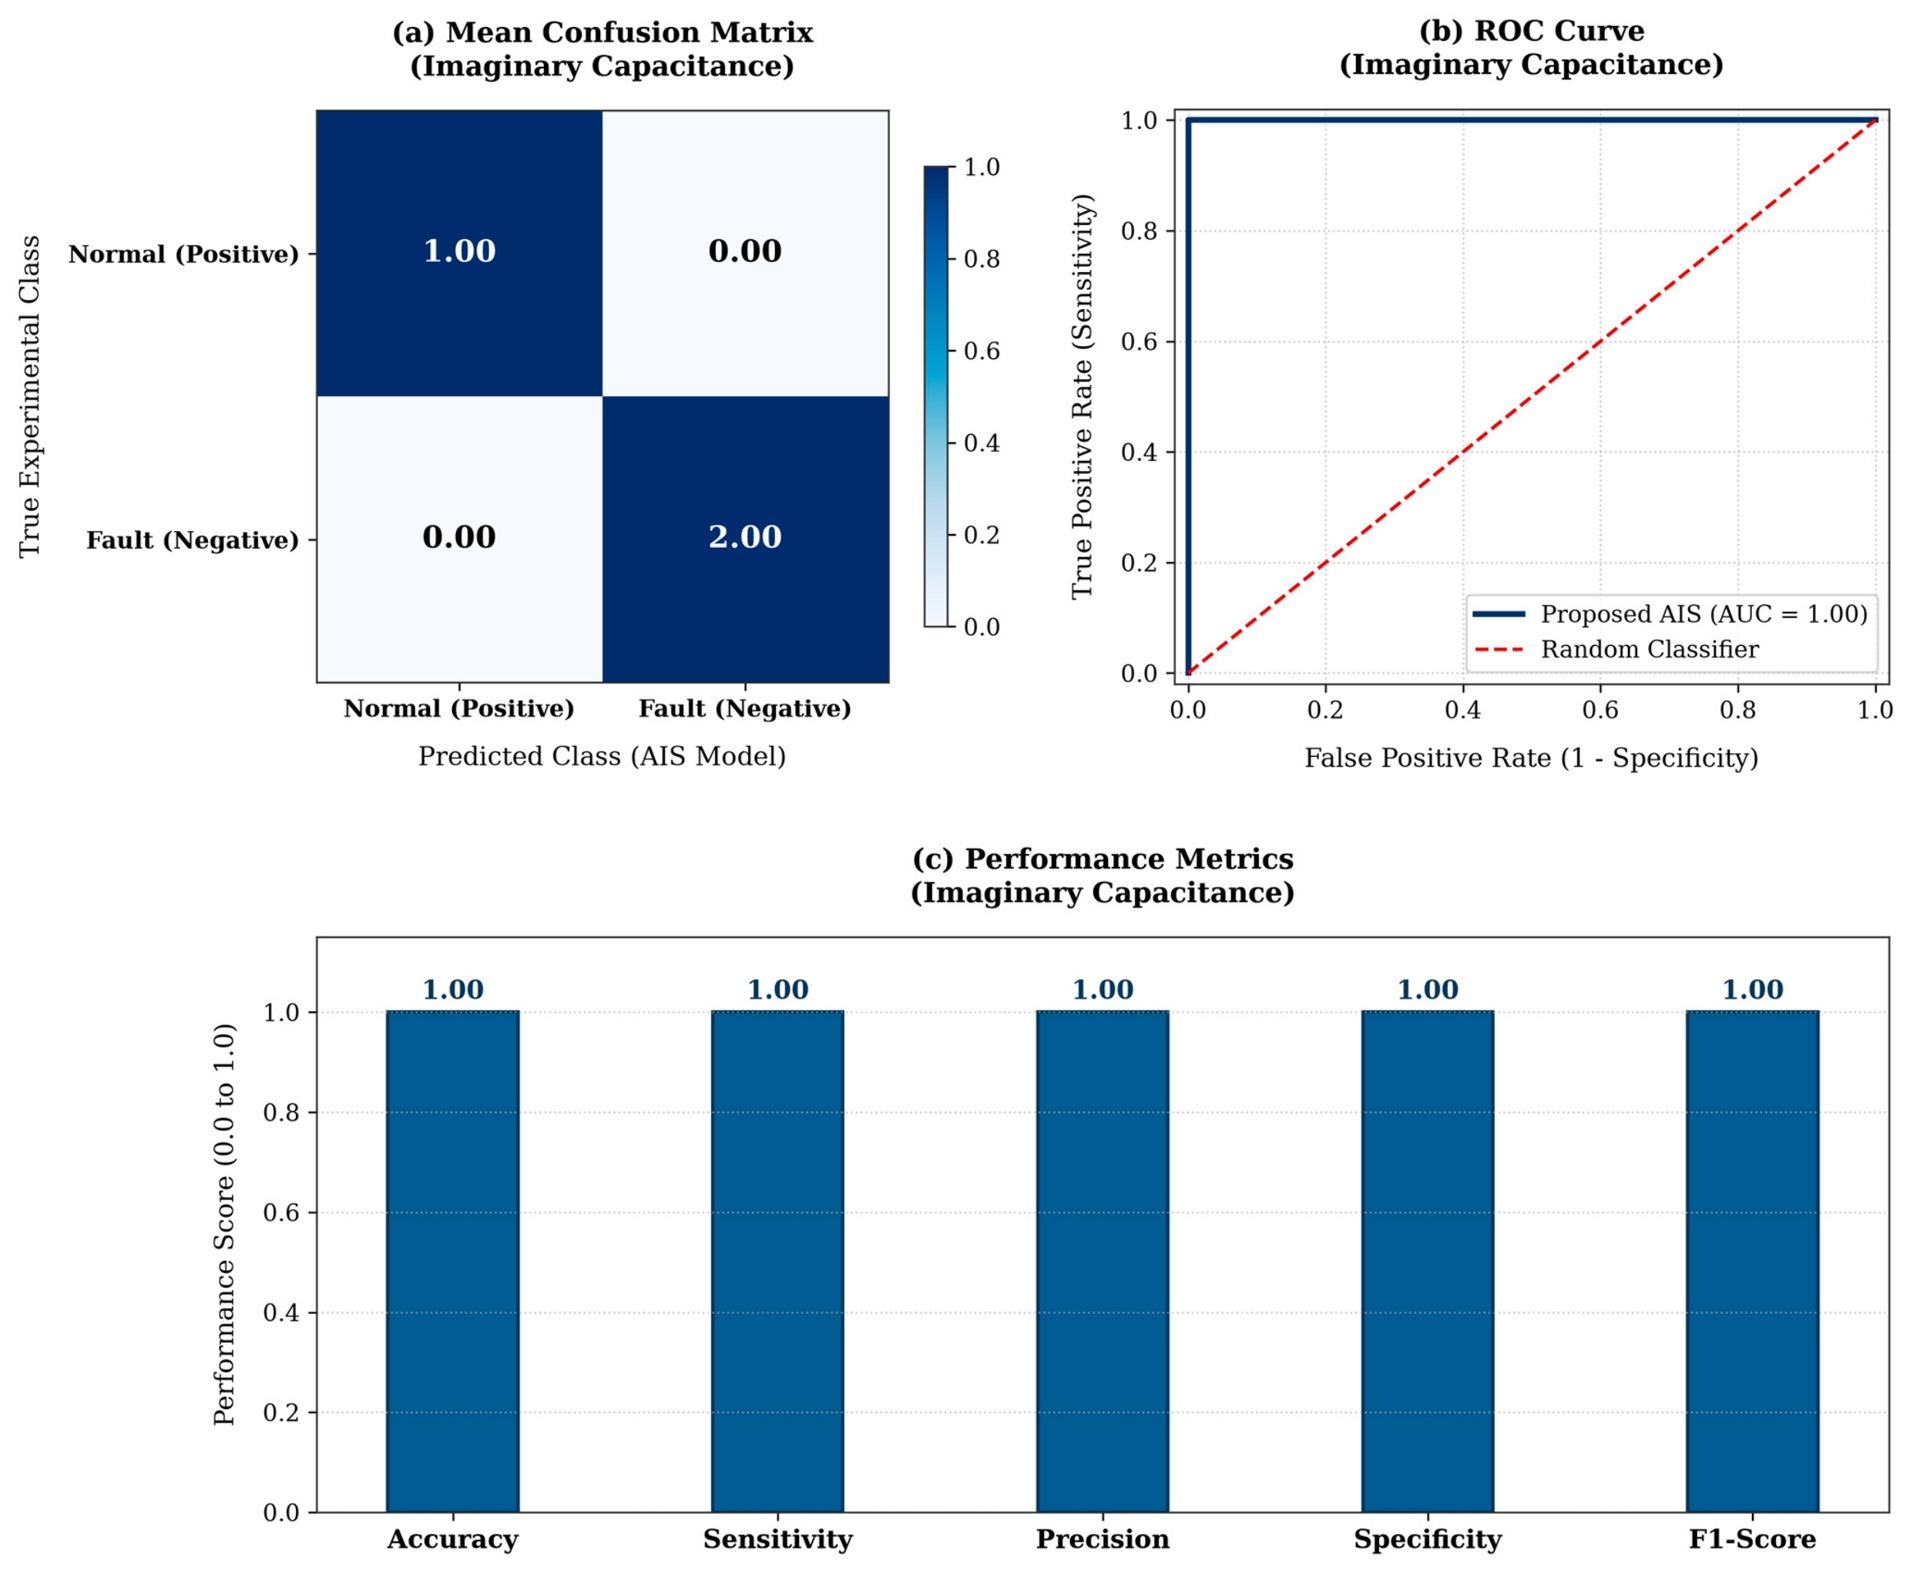
Similarly to the real capacitance results, the model demonstrated perfect spatial recognition. The Mean Consolidated Confusion Matrix (Table 20) displays an unequivocal class separation, maintaining both sensitivity and specificity at 100.0%.
Table 20.
Mean Consolidated Confusion Matrix (Positives vs. Negatives—C″).
The statistical summary (Table 21) confirms a global accuracy of 100.0% with an extremely low processing time (0.000277 s). This indicates that the specific biological binding of the NS1 antigen significantly alters the dielectric loss profile of the interface, providing a highly recognizable pattern for the AIS.
Table 21.
Final statistical performance summary (Positives vs. Negatives—C″).
The diagnostic performance for the Positive vs. Negative clinical scenario using imaginary capacitance is shown in Figure 9.
Figure 9.
Consolidated performance for Positive vs. Negative classification using Imaginary Capacitance. (a) Mean Confusion Matrix, (b) ROC Curve where the blue solid line represents the proposed AIS classifier and the red dashed diagonal line indicates the random baseline classifier, and (c) Global Performance Metrics.
3.2.4. Advanced Performance and Statistical Boundary Overlap Analysis (Imaginary Capacitance, C″)
To mathematically explain the performance breakdown observed in Section 3.2.3, the Bhattacharyya Coefficient (BC) was computed for the imaginary capacitance distributions (Table 22).
Table 22.
Imaginary Capacitance Performance & overlap analysis across AIS scenarios.
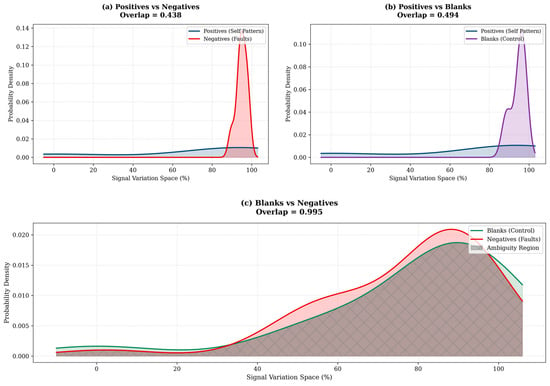
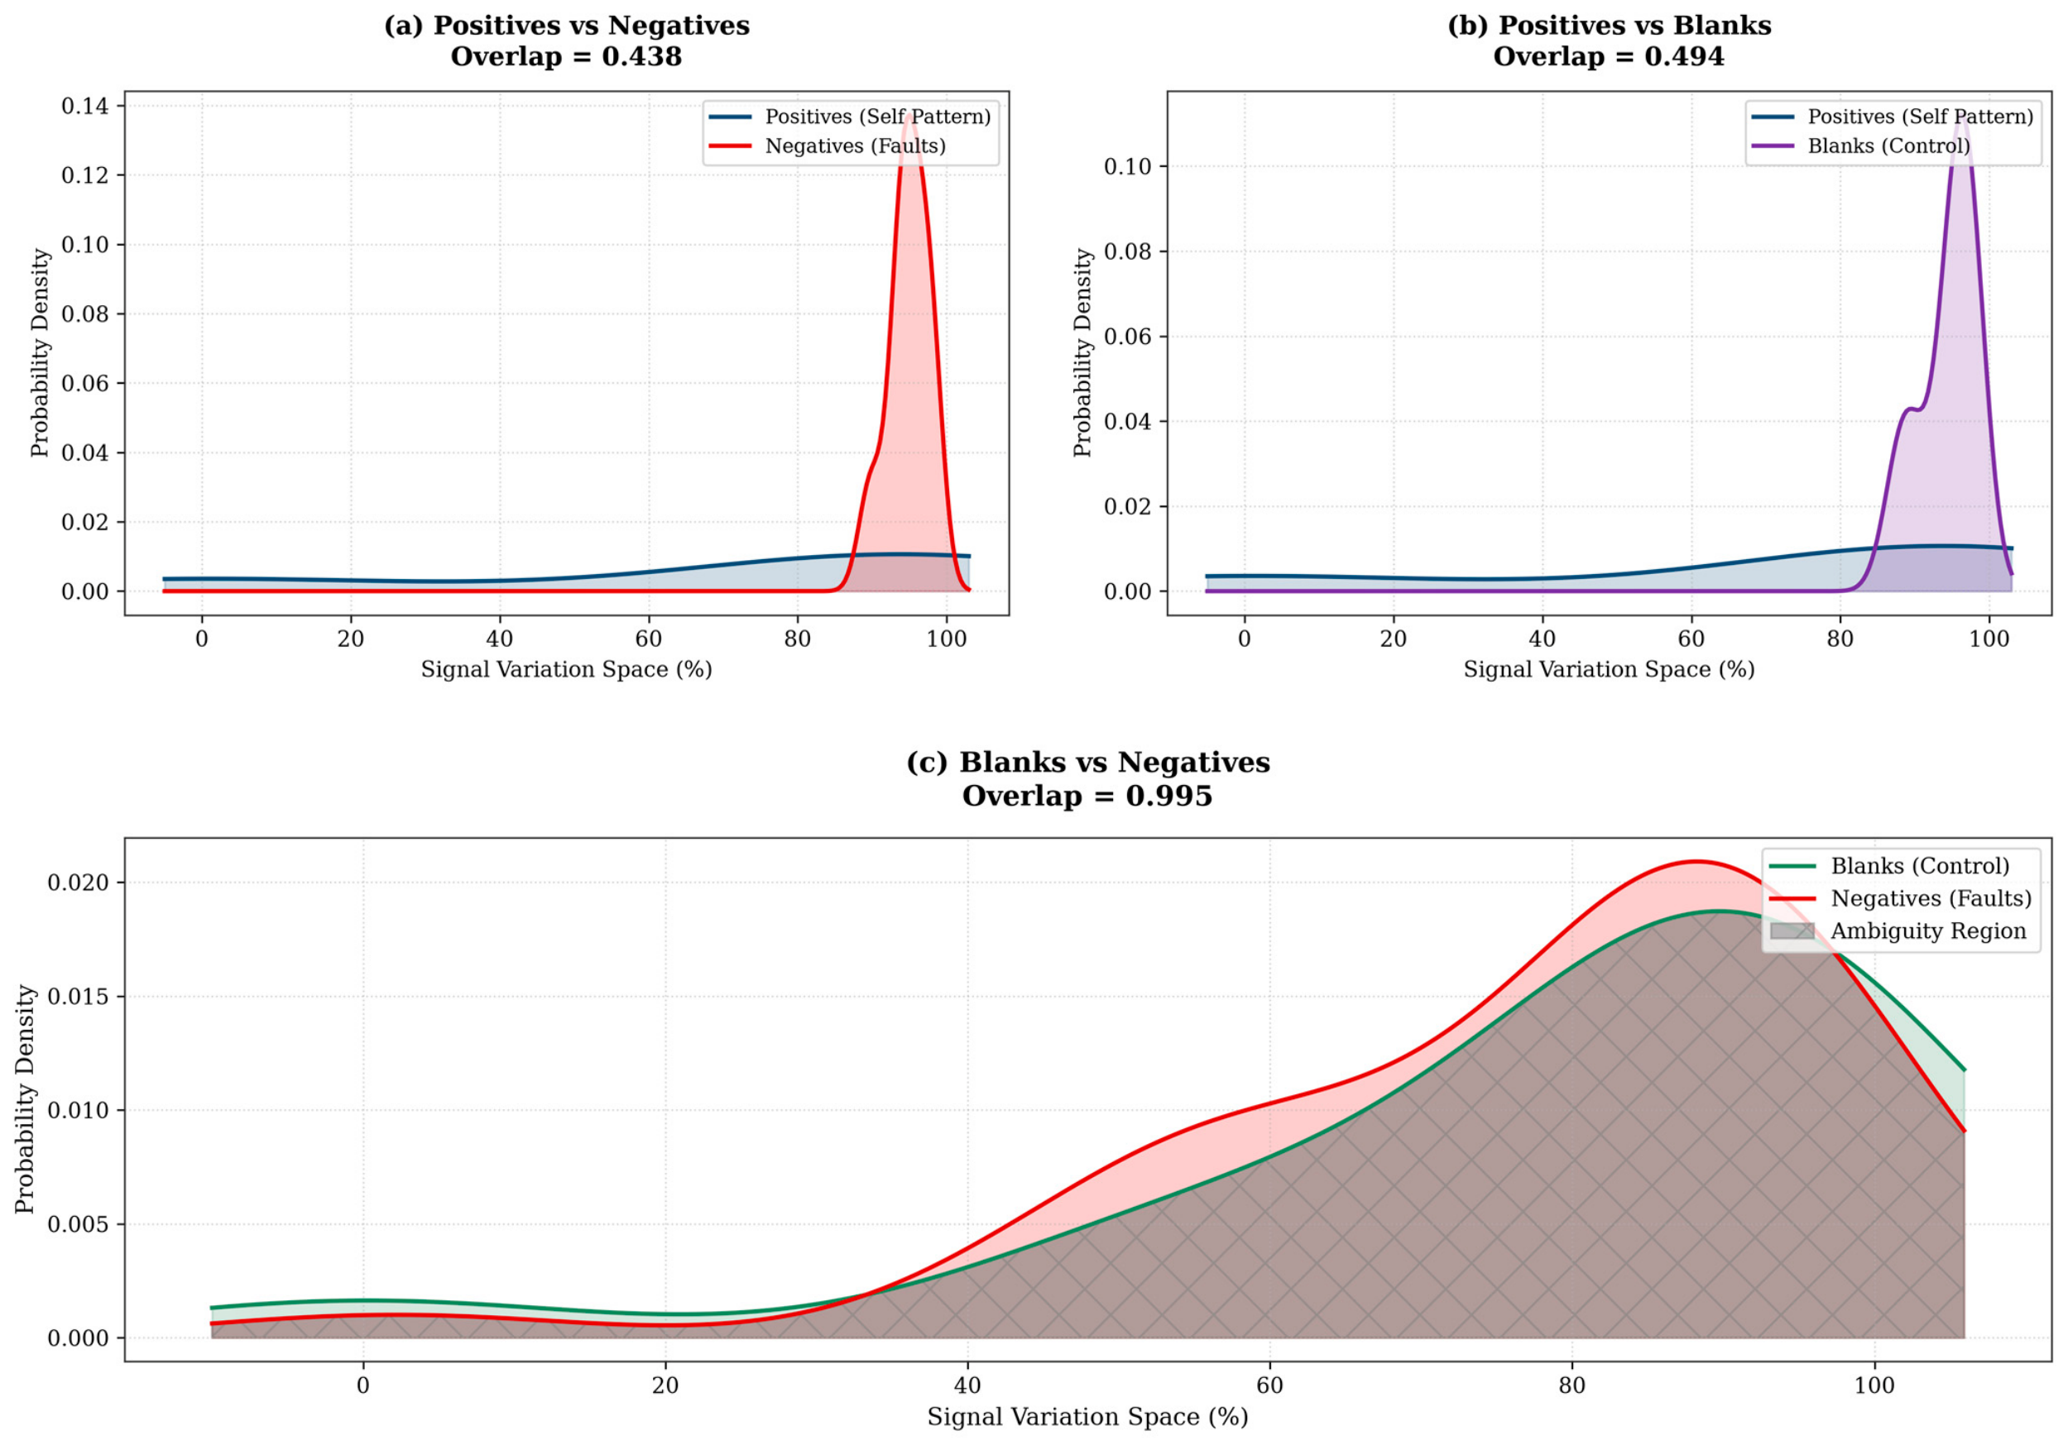
BC analysis fundamentally validates experimental observations. The target-specific binding (Positives) exhibits low overlap with the backgrounds (BC = 0.438 and 0.494), allowing the AIS to map the target perfectly. However, the Blanks vs. Negatives comparison yielded a striking BC of 0.995, indicating a near-total (99.5%) stochastic overlap in probability density.
This finding is highly significant: it proves that the imaginary capacitance (C″) is strictly insensitive to the background matrix variations (buffer vs. serum proteins), acting as a pure marker for the Dengue NS1 interaction. Consequently, it justifies the selection of Real Capacitance (C′) as the primary diagnostic channel for holistic noise-resilience, while C″ serves as an excellent complementary cross-validation metric exclusively for target confirmation.
The probability density intersections and Bhattacharyya overlap analysis for all imaginary capacitance scenarios are graphically displayed in Figure 10.
Figure 10.
Probability density intersections and Bhattacharyya overlap analysis for the Imaginary Capacitance (C″) scenarios: (a) Positives vs. Negatives, (b) Positives vs. Blanks, and (c) Blanks vs. Negatives. Blue curves denote Positive profiles (Self Pattern), red curves represent Negatives (Faults), purple/green curves indicate Blank controls, and the grey cross-hatched shaded area highlights the stochastic ambiguity region.
4. Conclusions
This study successfully engineered and validated a computational proof of concept for an intelligent diagnostic architecture that synergistically merges a novel redox-capacitive biosensing platform with an immuno-inspired machine learning framework (AIS) for Dengue NS1 protein detection. The proposed framework effectively bridges complex electrochemical interfacial phenomena with advanced computational pattern recognition, establishing an in silico foundation for decentralized analytical platforms.
Rigorous cross-validation across a simulated dataset of 32 independent sample profiles (comprising 49 frequency points) demonstrated high algorithmic performance. Utilizing the Real Capacitance () feature vector, the AIS algorithm achieved 100.0% accuracy in discriminating simulated positive NS1 profiles from both baseline controls and negative serum matrices. Crucially, the system exhibited strong noise resilience; when challenged with a highly ambiguous background matrix (Blanks vs. Negatives sharing ~90% structural overlap, Bhattacharyya Index = 0.901), the AIS dynamically adapted its Shape Affinity Limen (TAF) to filter out background noise, maintaining an 83.3% global accuracy while fully preserving true negative identification.
Furthermore, the evaluation of the Imaginary Capacitance () provided key physical insights into the biosensor’s dissipative behavior. Statistical overlap analysis (Bhattacharyya Index = 0.995) mathematically confirmed that the imaginary capacitance profiles of the baseline buffer and negative serum are virtually identical. Consequently, acts as a highly specific complementary marker that remains blind to background matrix variations while achieving flawless target identification (100.0% accuracy) during specific NS1 interaction.
With computational execution times in the sub-millisecond range, this dual-channel capacitive–computational approach eliminates the need for bulky processing hardware [22]. While this work provides a robust in silico proof of concept, prospective wet-lab experiments and formal clinical trials with patient cohorts remain mandatory next steps to achieve full point-of-care (POC) translation [23].
5. Patents
The experimental results reported herein provide proof of concept for the proposed analytical and computational methodology, which is currently under evaluation by the UNESP Innovation Agency (AUIN) for potential patent protection.
Author Contributions
Conceptualization, F.R.C., L.B.P. and A.d.S.; methodology, F.R.C. and A.d.S.; software, F.R.C.; validation, F.R.C. and A.d.S.; formal analysis, F.R.C. and A.d.S.; investigation, F.R.C. and A.d.S.; resources, F.R.C. and A.d.S.; data curation, F.R.C. and A.d.S.; writing—original draft preparation, F.R.C., L.B.P. and A.d.S.; writing—review and editing, F.R.C. and A.d.S.; visualization, F.R.C. and A.d.S.; supervision, F.R.C. and A.d.S.; project administration, F.R.C. and A.d.S.; funding acquisition, F.R.C. and A.d.S. All authors have read and agreed to the published version of the manuscript.
Funding
The authors acknowledge the São Paulo Research Foundation (FAPESP), Brazil (Process No. 2024/23232-9) and CNPq—National Council for Scientific and Technological Development (Grant No. 316920/2025-8).
Institutional Review Board Statement
Not applicable.
Informed Consent Statement
Not applicable.
Data Availability Statement
The data presented in this study are available on reasonable request from the corresponding author. The data are not publicly available due to pending patent applications and intellectual property protection restrictions. Requesters may be asked to state the intended use of the data and sign a non-disclosure agreement.
Acknowledgments
The authors also thank Paulo Roberto Bueno and the Nanobionics Laboratory, UNESP—Chemistry Institute, for providing access to the laboratory facilities used in this study.
Conflicts of Interest
The authors declare no conflicts of interest.
Abbreviations
The following abbreviations are used in this manuscript:
| AI | Artificial Intelligence |
| AIS | Artificial Immune System |
| AUC | Area Under the Curve |
| BC | Bhattacharyya Coefficient |
| BSA | Bovine Serum Albumin |
| DENV | Dengue Virus |
| EDC | 1-Ethyl-3-(3-dimethylaminopropyl)carbodiimide |
| EIS | Electrochemical Impedance Spectroscopy |
| ELISA | Enzyme-Linked Immunosorbent Assay |
| ML | Machine Learning |
| NHS | N-Hydroxysuccinimide |
| NS1 | Non-Structural Protein 1 |
| NSA | Negative Selection Algorithm |
| PCR | Polymerase Chain Reaction |
| POC | Point-of-Care |
| ROC | Receiver Operating Characteristic |
| SAM | Self-Assembled Monolayer |
| TAF | Shape Affinity Limen |
| WHO | World Health Organization |
References
- World Health Organization. Dengue and Severe Dengue. Available online: https://www.who.int/news-room/fact-sheets/detail/dengue-and-severe-dengue (accessed on 22 September 2026).
- Vairaperumal, T.; Lee, P.-T.; Liu, P.-Y. Portable point-of-care diagnosis platforms and emerging predictive biomarkers for rapid detection of severe dengue viral infection. ACS Sens. 2025, 10, 3302–3316. [Google Scholar] [CrossRef] [Scilit] [PubMed]
- Cecchetto, J.; Carvalho, F.C.; Santos, A.; Fernandes, F.C.B.; Bueno, P.R. An impedimetric biosensor to test neat serum for dengue diagnosis. Sens. Actuators B Chem. 2015, 213, 150–154. [Google Scholar] [CrossRef] [Scilit]
- Lim, J.M.; Kim, J.H.; Ryu, M.Y.; Cho, C.H.; Park, T.J.; Park, J.P. An electrochemical peptide sensor for detection of dengue fever biomarker NS1. Anal. Chim. Acta 2018, 1026, 109–116. [Google Scholar] [CrossRef] [Scilit] [PubMed]
- Ma, F.; Ji, C.; Xu, M.; Wang, J.; Sun, W. Spatial correlation extraction for chemical process fault detection using image enhancement technique aided convolutional autoencoder. Chem. Eng. Sci. 2023, 278, 118900. [Google Scholar] [CrossRef] [Scilit]
- Chen, F.; Zhang, L.; Liu, W.; Zhang, T.; Zhao, Z.; Wang, W.; Chen, D.; Wang, B. A fault diagnosis method of rotating machinery based on improved multiscale attention entropy and random forests. Nonlinear Dyn. 2024, 112, 1191–1220. [Google Scholar] [CrossRef] [Scilit]
- Forrest, S.; Perelson, A.S.; Allen, L.; Cherukuri, R. Self-nonself discrimination in a computer. In Proceedings of the 1994 IEEE Computer Society Symposium on Research in Security and Privacy, Oakland, CA, USA, 16–18 May 1994; IEEE: Piscataway, NJ, USA, 1994; pp. 202–212. [Google Scholar] [CrossRef] [Scilit]
- Dasgupta, D. Artificial Immune Systems and Their Applications; Springer: Berlin/Heidelberg, Germany, 1999. [Google Scholar] [CrossRef] [Scilit]
- de Castro, L.N.; Timmis, J. Artificial Immune Systems: A New Computational Intelligence Approach; Springer: London, UK, 2002; ISBN 978-1-85233-594-6. [Google Scholar]
- de Castro, L.N.; Von Zuben, F.J. Learning and optimization using the clonal selection principle. IEEE Trans. Evol. Comput. 2002, 6, 239–251. [Google Scholar] [CrossRef] [Scilit]
- Dasgupta, D.; Yu, S.; Nino, F. Recent advances in artificial immune systems: Models and applications. Appl. Soft Comput. 2011, 11, 1574–1587. [Google Scholar] [CrossRef] [Scilit]
- Maruyama, G.R.Y.; Chavarette, F.R.; Faria, H.A.M. Artificial intelligence and artificial immune systems: Transforming tuberculosis diagnosis. Braz. J. Biosyst. Eng. 2025, 19, 1272. [Google Scholar] [CrossRef] [Scilit]
- Timmis, J.; Andrews, P.S.; Hart, E. On artificial immune systems and swarm intelligence. Swarm Intell. 2010, 4, 247–273. [Google Scholar] [CrossRef] [Scilit]
- Ji, Z.; Dasgupta, D. Real-Valued Negative Selection Algorithm with Variable-Sized Detectors. In Genetic and Evolutionary Computation—GECCO 2004; Deb, K., Ed.; Lecture Notes in Computer Science; Springer: Berlin/Heidelberg, Germany, 2004; Volume 3102, pp. 287–298. [Google Scholar] [CrossRef] [Scilit]
- Love, J.C.; Estroff, L.A.; Kriebel, J.K.; Nuzzo, R.G.; Whitesides, G.M. Self-assembled monolayers of thiolates on metals as a form of nanotechnology. Chem. Rev. 2005, 105, 1103–1169. [Google Scholar] [CrossRef] [Scilit] [PubMed]
- Barsoukov, E.; Macdonald, J.R. Impedance Spectroscopy: Theory, Experiment, and Applications, 3rd ed.; John Wiley & Sons: Hoboken, NJ, USA, 2018. [Google Scholar] [CrossRef] [Scilit]
- Patil, A.V.; Fernandes, F.C.B.; Bueno, P.R.; Davis, J.J. Immittance Electroanalysis in Diagnostics. Anal. Chem. 2015, 87, 944–950. [Google Scholar] [CrossRef] [Scilit] [PubMed]
- Zhang, H.; Sun, Z.; Sun, K.; Liu, Q.; Chu, W.; Fu, L.; Dai, D.; Liang, Z.; Lin, C.-T. Electrochemical Impedance Spectroscopy-Based Biosensors for Label-Free Detection of Pathogens. Biosensors 2025, 15, 443. [Google Scholar] [CrossRef] [Scilit] [PubMed]
- Santos, A.; Bueno, P.R.; Davis, J.J. A dual marker label free electrochemical assay for Flavivirus dengue diagnosis. Biosens. Bioelectron. 2018, 100, 519–525. [Google Scholar] [CrossRef] [Scilit] [PubMed]
- Bhattacharyya, A. On a measure of divergence between two multinomial populations. Sankhyā Indian J. Stat. 1946, 7, 401–406. [Google Scholar]
- Itagaki, M.; Suzuki, S.; Shitanda, I.; Watanabe, K. Electrochemical Impedance and Complex Capacitance to Interpret Electrochemical Capacitor. Electrochemistry 2007, 75, 649–655. [Google Scholar] [CrossRef] [Scilit]
- Pang, J.; Chia, P.Y.; Lye, D.C.; Leo, Y.S. Progress and Challenges towards Point-of-Care Diagnostic Development for Dengue. J. Clin. Microbiol. 2017, 55, 3339–3349. [Google Scholar] [CrossRef] [Scilit] [PubMed]
- El Kabbani, S.; Saleh, G. Next—Generation Diagnostic Technologies for Dengue Virus Detection: Microfluidics, Biosensing, CRISPR, and AI Approaches. Sensors 2025, 26, 145. [Google Scholar] [CrossRef] [Scilit] [PubMed]

Disclaimer/Publisher’s Note: The statements, opinions and data contained in all publications are solely those of the individual author(s) and contributor(s) and not of MDPI and/or the editor(s). MDPI and/or the editor(s) disclaim responsibility for any injury to people or property resulting from any ideas, methods, instructions or products referred to in the content. |
© 2026 by the authors. Licensee MDPI, Basel, Switzerland. This article is an open access article distributed under the terms and conditions of the Creative Commons Attribution (CC BY) license.