


Abstract
There are no widely used standardized tests of pickleball skill. The purpose of this research was to develop a test to represent general paddle-stroke ability via evaluation of the serve. This paper describes multiple phases of sequential exploratory research studies that iteratively developed the procedures of the Pickleball Power and Placement test. Additionally, we performed preliminary examinations of reliability and validity. In early phases, pickleball players were recruited to perform the test in a single session to determine aspects of its reliability. In later phases, players were recruited to perform the test immediately prior to playing in a pickleball tournament to test the validity of the test for predicting winning performance in the sport. The results of the earlier phases demonstrated good inter-rater reliability and helped provide data-driven modifications to the test setup and procedures. The results of the later stages demonstrated preliminary validity for the test to predict winning performance in singles and women’s doubles tournaments, though not for men’s doubles. The results of the final stage indicate that the current procedures may not adequately provide participants with an opportunity to overcome the learning effect on the test; however, the learning effect may be of such small effect size to have no practical relevance. We conclude that the Pickleball Power and Placement test demonstrates sufficient reliability and validity to warrant further development and more rigorous testing.
1. Introduction
In 2024, pickleball was the fastest-growing sport according to the Sports & Fitness Industry Association [1,2]. It has also been professionalized. Reliable and valid skill tests could help with talent identification and training, both for recreational and professional development. However, there are no widely accepted and used tests of pickleball skill. In a review of the literature, only two publications presented pickleball-specific skills tests; the Pickleball Assessment of Skills and Tactics [3] and the Comprehensive Pickleball Skill Test [4]. The Pickleball Assessment of Skills and Tactics was developed as a tool for middle-school physical education teachers to have a basic assessment of children’s ability to play the game at all, as evidenced by the scoring system—each criterion is rated as successful or unsuccessful [3]. For example, did they make a legal serve or not? This simplistic assessment is insufficient for talent identification and training purposes, and so was not considered further. The Comprehensive Pickleball Skill Test was also developed as a tool to use in physical education classes, but at the university-student level [4]. It has a scaler rating system, whereby participants were awarded higher levels of points for increasing levels of performance on each test. The Comprehensive Pickleball Skill Test, developed by Wasem, is a set of seven tests of pickleball skill and ability [4]. The purpose of the test battery was to help students objectively track their development in the game. The biggest limitations to the Comprehensive Pickleball Skill Test are logistical—performing seven separate tests takes a lot more time than a single test, and some of the tests require extra equipment beyond the normal materials for playing pickleball. For example, the “Lob” or “High Clear” test requires an extra pickleball net to be strung up across the court eight feet high off the ground. Therefore, as a total test battery, we did not find the Comprehensive Pickleball Skill Test suitable to our needs.
One of the tasks within the Comprehensive Pickleball Skill Test is serving. In racquet and paddle sports, the serve is often one of the most important strokes, with the quality of the serve strongly influencing who wins the rally and the game overall [5,6,7]. The serve test Wasem [4] developed was based on the first bounce of the ball, with the goal to drive the ball deep, regardless of lateral placement on the court. A deep serve is often tactically beneficial because it forces the receiver to stay far away from the net, due to the rule that the serve must bounce before the receiver can return it. However, a deep serve that goes straight to the receiver’s forehand striking area may still allow the receiver to return the ball in a manner that disadvantages the serving player, due to the fact that most players are able to maximize their stroke performance when in a stable position and using a forehand stroke. Therefore, ignoring the lateral placement of the ball ignores whether the serve may have forced the receiving opponent to move out of an optimal return position. Furthermore, by only measuring the first bounce, Wasem’s serve test [4] does not account for the ability of serving players to create penetration against their opponent with their serve. Serve penetration describes the degree to which the serve has the power and placement required to place the receiver into a defensive (non-offensive) posture. Serve penetration cannot be accurately determined in tennis or pickleball by only the first bounce, as a single point does not describe the trajectory of the ball or indicate the probable posture of the receiver. Furthermore, only knowing the location of the first bounce does not indicate if the server was able to put spin on the ball, which can be a key tactic and is a higher-order skill in racquet and paddle sports [8]. We believe Wasem’s serve test, with the focus on only the first bounce, neither sufficiently represents the effectiveness of the serve nor acts as a general representation of pickleball skill. Instead, the second bounce of the ball after the serve, which represents the penetration of the serve against the receiver, is more likely both a better representation of serve skill specifically and of pickleball skill in general. Therefore, we looked for existing skill tests outside of pickleball, but still from racquet sports, that may better represent the qualities of skill we were interested in testing.
Annesi [9] developed a test for tennis called the Mobility, Power, and Placement test. This test scores the serve based on the second bounce, reflecting the penetration of the serve. We decided to develop a similar test for pickleball, by adapting Annesi’s Mobility, Power, and Placement test for tennis. We have called our test the Pickleball Power and Placement Test. It gives players a score based on where the second bounce of the ball lands. The scores increase as the ball bounces to an area that represents better placement of the ball, and therefore better ball control, as well as higher speed of ball movement due to higher force from the serve. Together, the better placement and higher ball speed create better penetration of the serve against the receiver. A better-penetrating serve would be harder to return and/or would require the receiver to move far enough away from their optimal position on the court as to decrease their chances of getting to and successfully returning the subsequent rally hit.
The purpose of the present paper is to present the combined findings of multiple iterative pilot studies. These studies were exploratory in nature, rather than hypothesis testing, in order to have evidence-based decisions on test construction to build up to a future study that will be able to test formal hypotheses. Each study examined one or more aspects of the test procedures. The results of each study informed changes to the test and scoring procedures for subsequent studies. Finally, data from multiple phases were aggregated for an overall analysis of inter-trial reliability. In this paper, the objectives, methods, and results of each pilot study are presented together, with a small discussion at the end of each as a transition to the next study. Finally, an overall discussion and conclusions are presented at the end of this paper. The objective of the overall paper is to document the development of the test to date, providing readers with the evidence base for the test construction.
2. Phase 1: Pre-Empirical Data Gathering Pilot and Test Description
Prior to formal data collection, our research team examined the dimensions and setup of the Mobility, Power, and Placement test for tennis [9], and scaled them to the dimensions of the pickleball court. We lined a pickleball court for the test, and the researchers and other volunteers tried serving. In this phase, we assessed two aspects of validity. As a very first step, we assessed the less-rigorous face validity of the test through expert review. One of the researchers was a regular pickleball player, and one of the researchers was a Master Professional tennis coach certified by the United States Professional Tennis Association. After watching players attempt the Mobility, Power, and Placement test using pickleball paddles and balls, these two researchers determined that the specifications for the Mobility, Power, and Placement test, with all lines parallel or perpendicular to the baseline and sideline of the court, were not valid for the sport of pickleball. The problem was the distance the ball could realistically travel after the first bounce—a pickleball travels less distance than a tennis ball after bouncing. After the first day of testing and discussion, we made adjustments to the distance and angles of lines, per the expert reviewers’ feedback, to determine the present dimensions of the test.
Upon retesting, the two expert reviewers concurred that the new test dimensions were more valid for the demands of pickleball. At the retesting session, we assessed a preliminary form of discriminate validity; some of the research team members had no experience with racquet or paddle sports, while others did. The researchers all tried to perform the test. The researchers without experience could rarely perform a serve that would be considered successful (i.e., a non-fault serve), while the researchers with experience could at least consistently get the serve in, and the most experienced researchers could routinely hit target areas of higher score values. Therefore, even before recruiting true research participants, we determined that our Pickleball Power and Placement test had at least enough construct validity to begin formal evaluation.
There are four total targets used in the test, named for where the server aims to place the ball: left corner, left middle, right corner, and right middle. The left and right versions are mirrored to test the ability of the player to serve from each side of the court. Wasem also recognized the value of testing from the right and left service areas [4]. Below, we describe how to set up the test; throughout the description, we use the word “draw” to indicate creating the lines. We recommend using painter’s tape to draw the lines, but chalk or any other visual demarcation is suitable. A note on these descriptions: because the USA Pickleball manual describes the dimensions of the pickleball court in feet, we have similarly used imperial instead of scientific units of length for most dimensions.
2.1. Phase 1: Procedures Common to All Targets
- The server stands on the side of the court opposite the target so that they can perform a legal serve. Per standard pickleball rules, they must stand off the court and between the imaginary extension of the sideline and the midline. They must perform a legal serve of their choice, following rules currently set out by the applicable governing body for pickleball.
- A ball basket should be placed off the court behind the baseline, approximately near the middle of the other service court. The purpose of this placement is to force servers to walk over to the ball basket and retrieve a ball for each trial. Servers should only take one ball at a time, and not hold multiple balls in their hand. Servers should not store balls in their pockets. After each trial, they must leave their position and go retrieve the next ball.
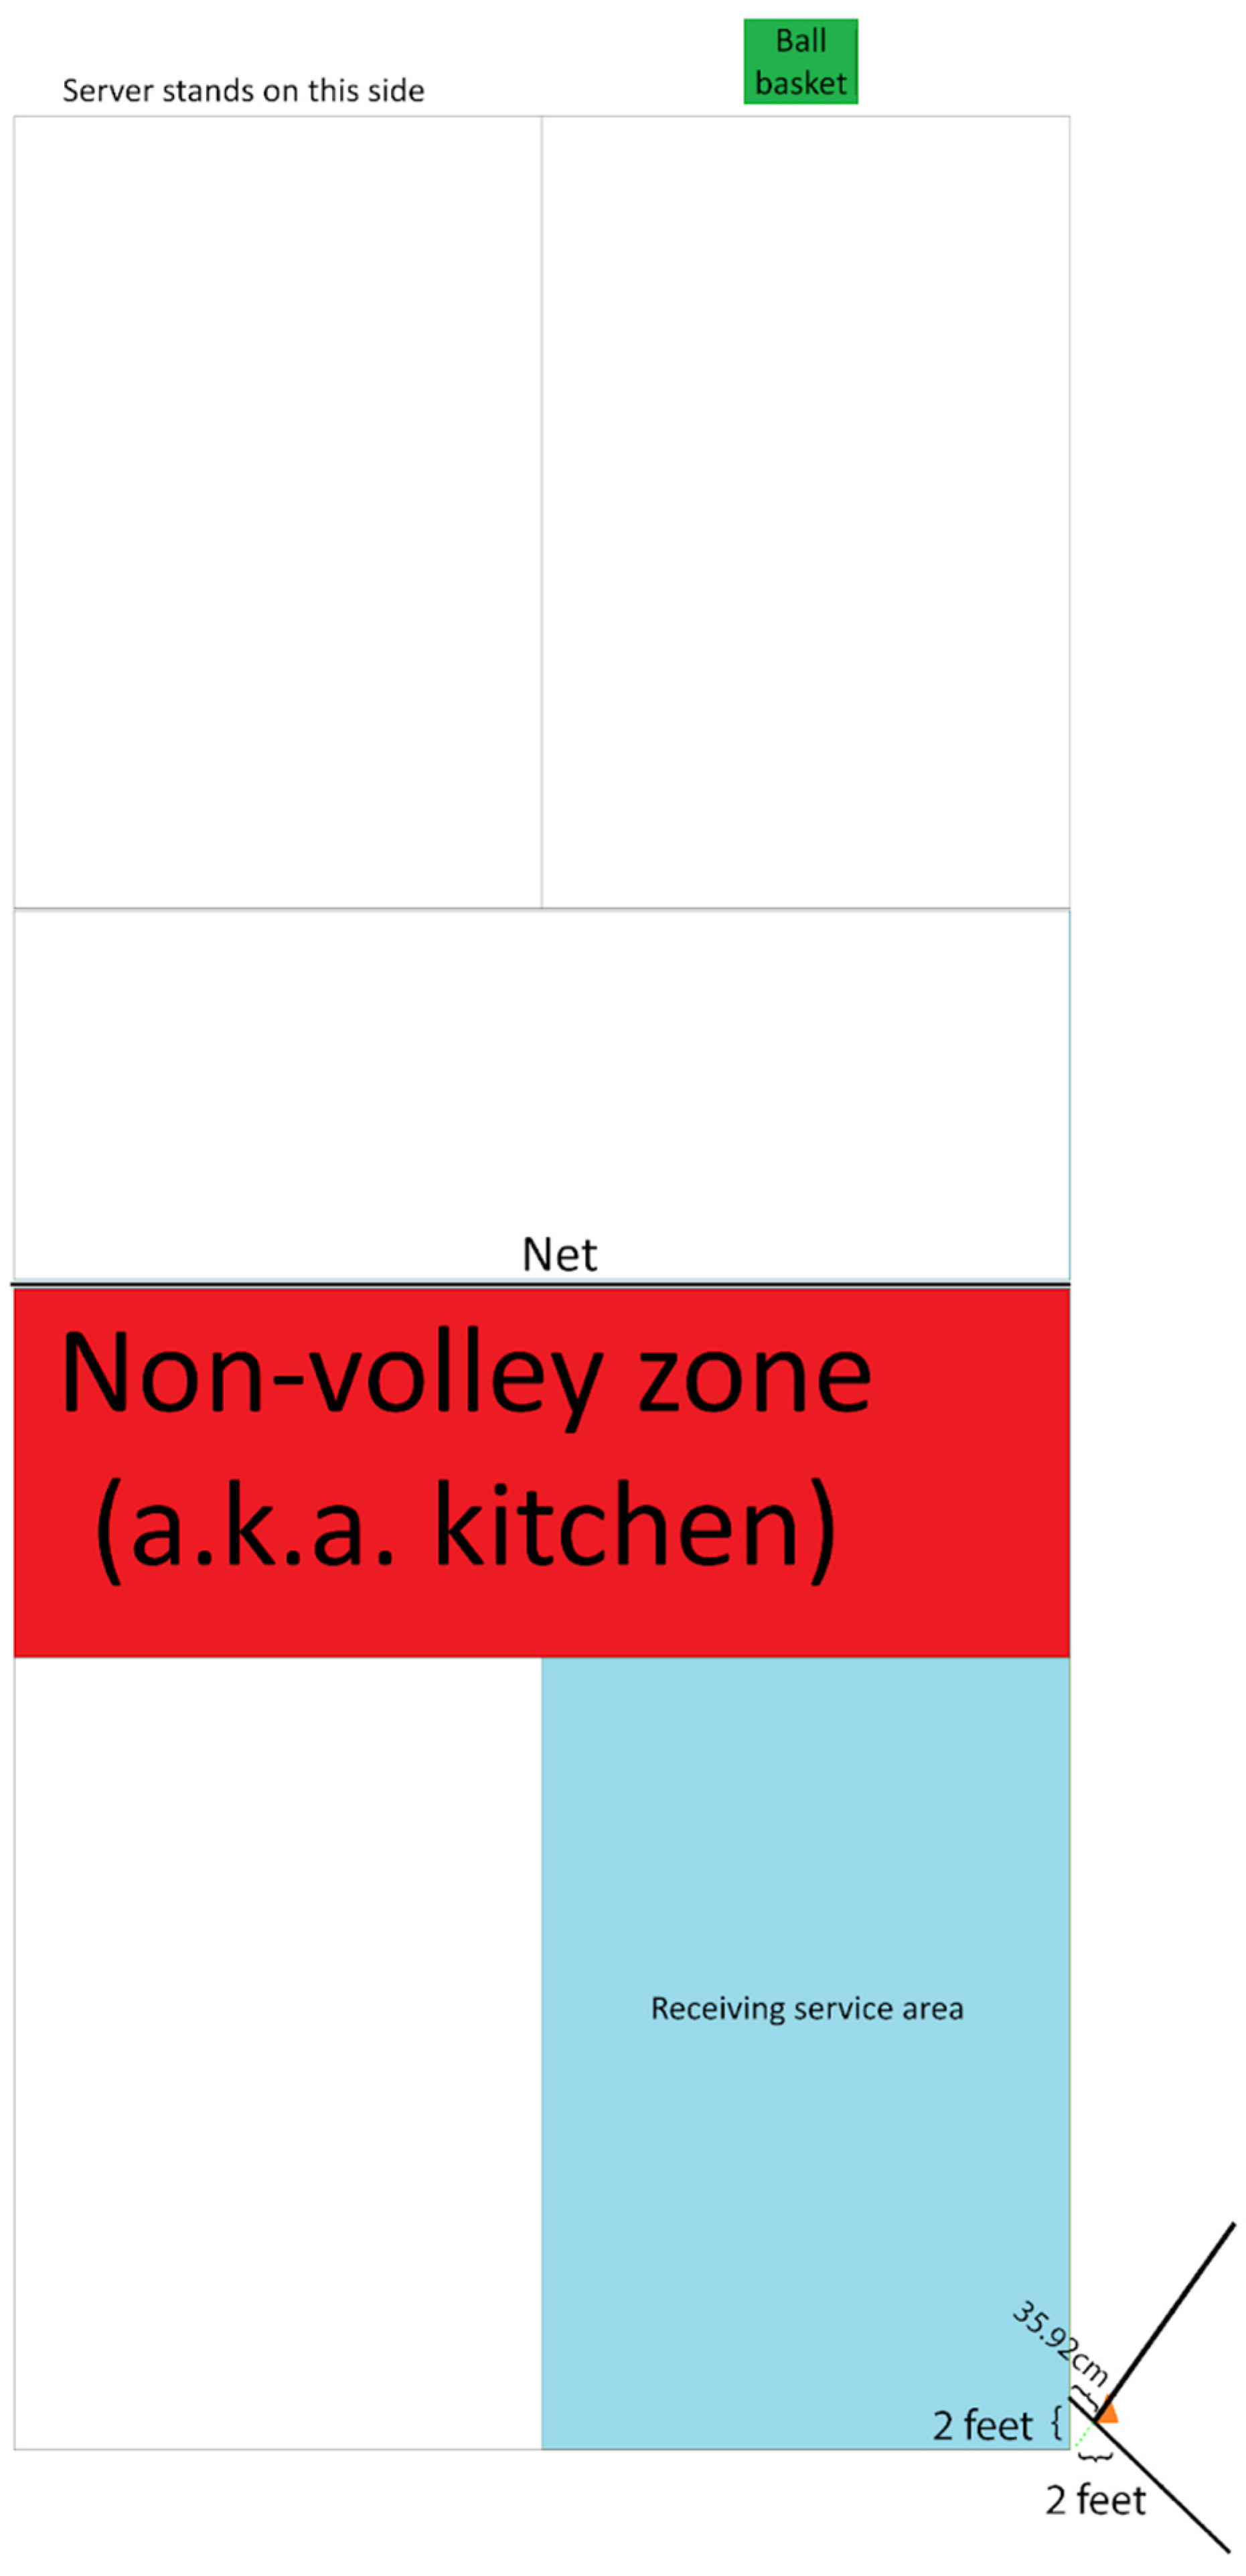
2.2. Phase 1: Detailed Description of Setup for Corner Targets (Figure 1)
- First, mark a point 2 feet from the sideline on the imaginary extension of the baseline; mark another point 2 feet from the baseline on the sideline. Draw a line connecting the two points and extending out at least 10 feet; the line theoretically extends infinitely.
- On the line just drawn, mark a point 35.92 cm away from the sideline. Form a line that connects this point and the corner of the baseline and sideline (note, in Figure 1, this is indicated by a green dotted line, but the dotted line should not be drawn), but only draw it on the side of the line—drawn in the previous step—away from the baseline. This line theoretically extends infinitely; we recommend drawing at least 10 feet.
- A cone is placed at the intersection of the two lines, with the corner of the cone (not the middle of the cone) at the intersection so that the body of the cone is in the region laterally farthest from the court.
Figure 1.
Setup for left corner target. The mirror image would be used to set up the right corner target. The green dotted line is not drawn on the court, but is an imaginary extension of the drawn line. The orange triangle represents the cone placed at the intersection of the lines.
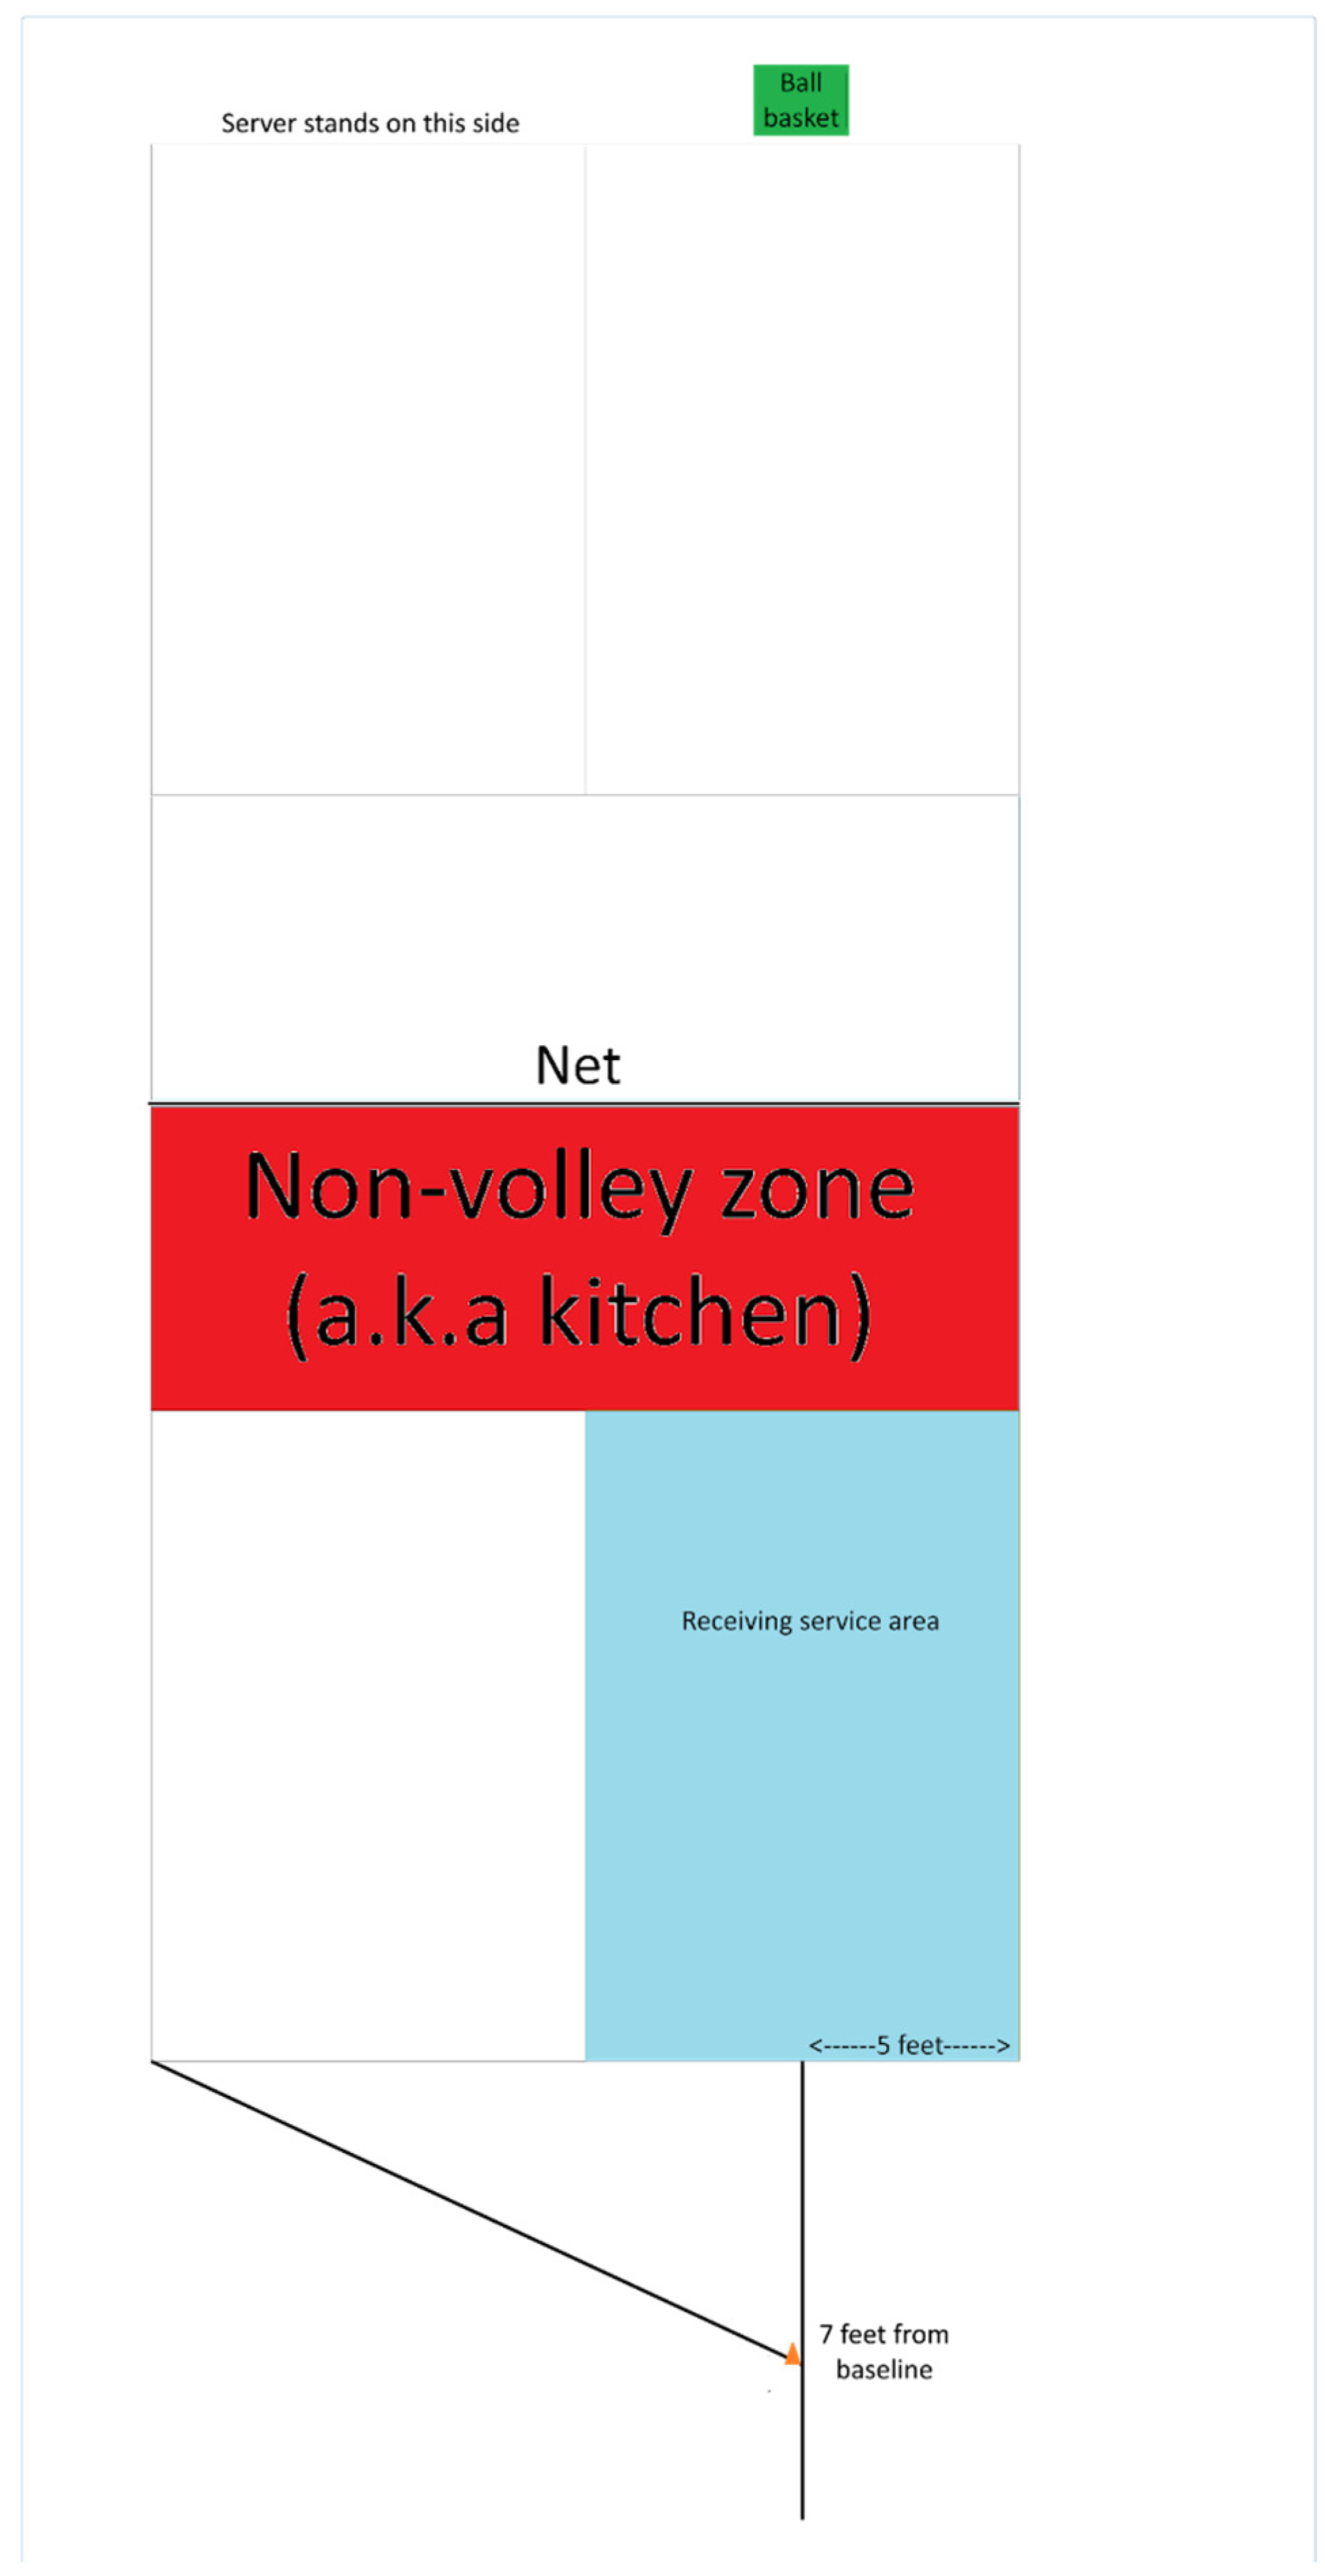
2.3. Phase 1: Detailed Description of Setup for Middle Targets (Figure 2)
- The vertical line runs perpendicular to the baseline; the vertical line intersects the baseline at the midpoint between the sideline and the middle of the midline (i.e., 5 feet from the outer edge of the sideline). The vertical line should be at least 10 feet long, though it theoretically extends infinitely. If there is enough space between the baseline and the fence behind the court, we recommend extending the line to 15 feet. If the fence is closer than 10 feet behind the baseline, the vertical line should be imagined to extend up the fence.
- The diagonal line intersects the vertical line 7 feet away from the baseline and runs to the opposite corner of the court.
- A cone is placed at the intersection of the two lines, with the corner of the cone (not the middle of the cone) at the intersection so that the body of the cone is in the region farthest from the baseline.
Figure 2.
Setup for left middle target. The mirror image would be used to set up the right middle target. The orange triangle represents the cone placed at the intersection of the lines.
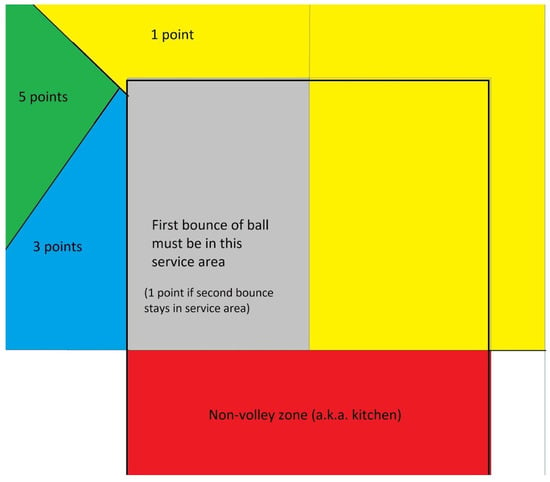
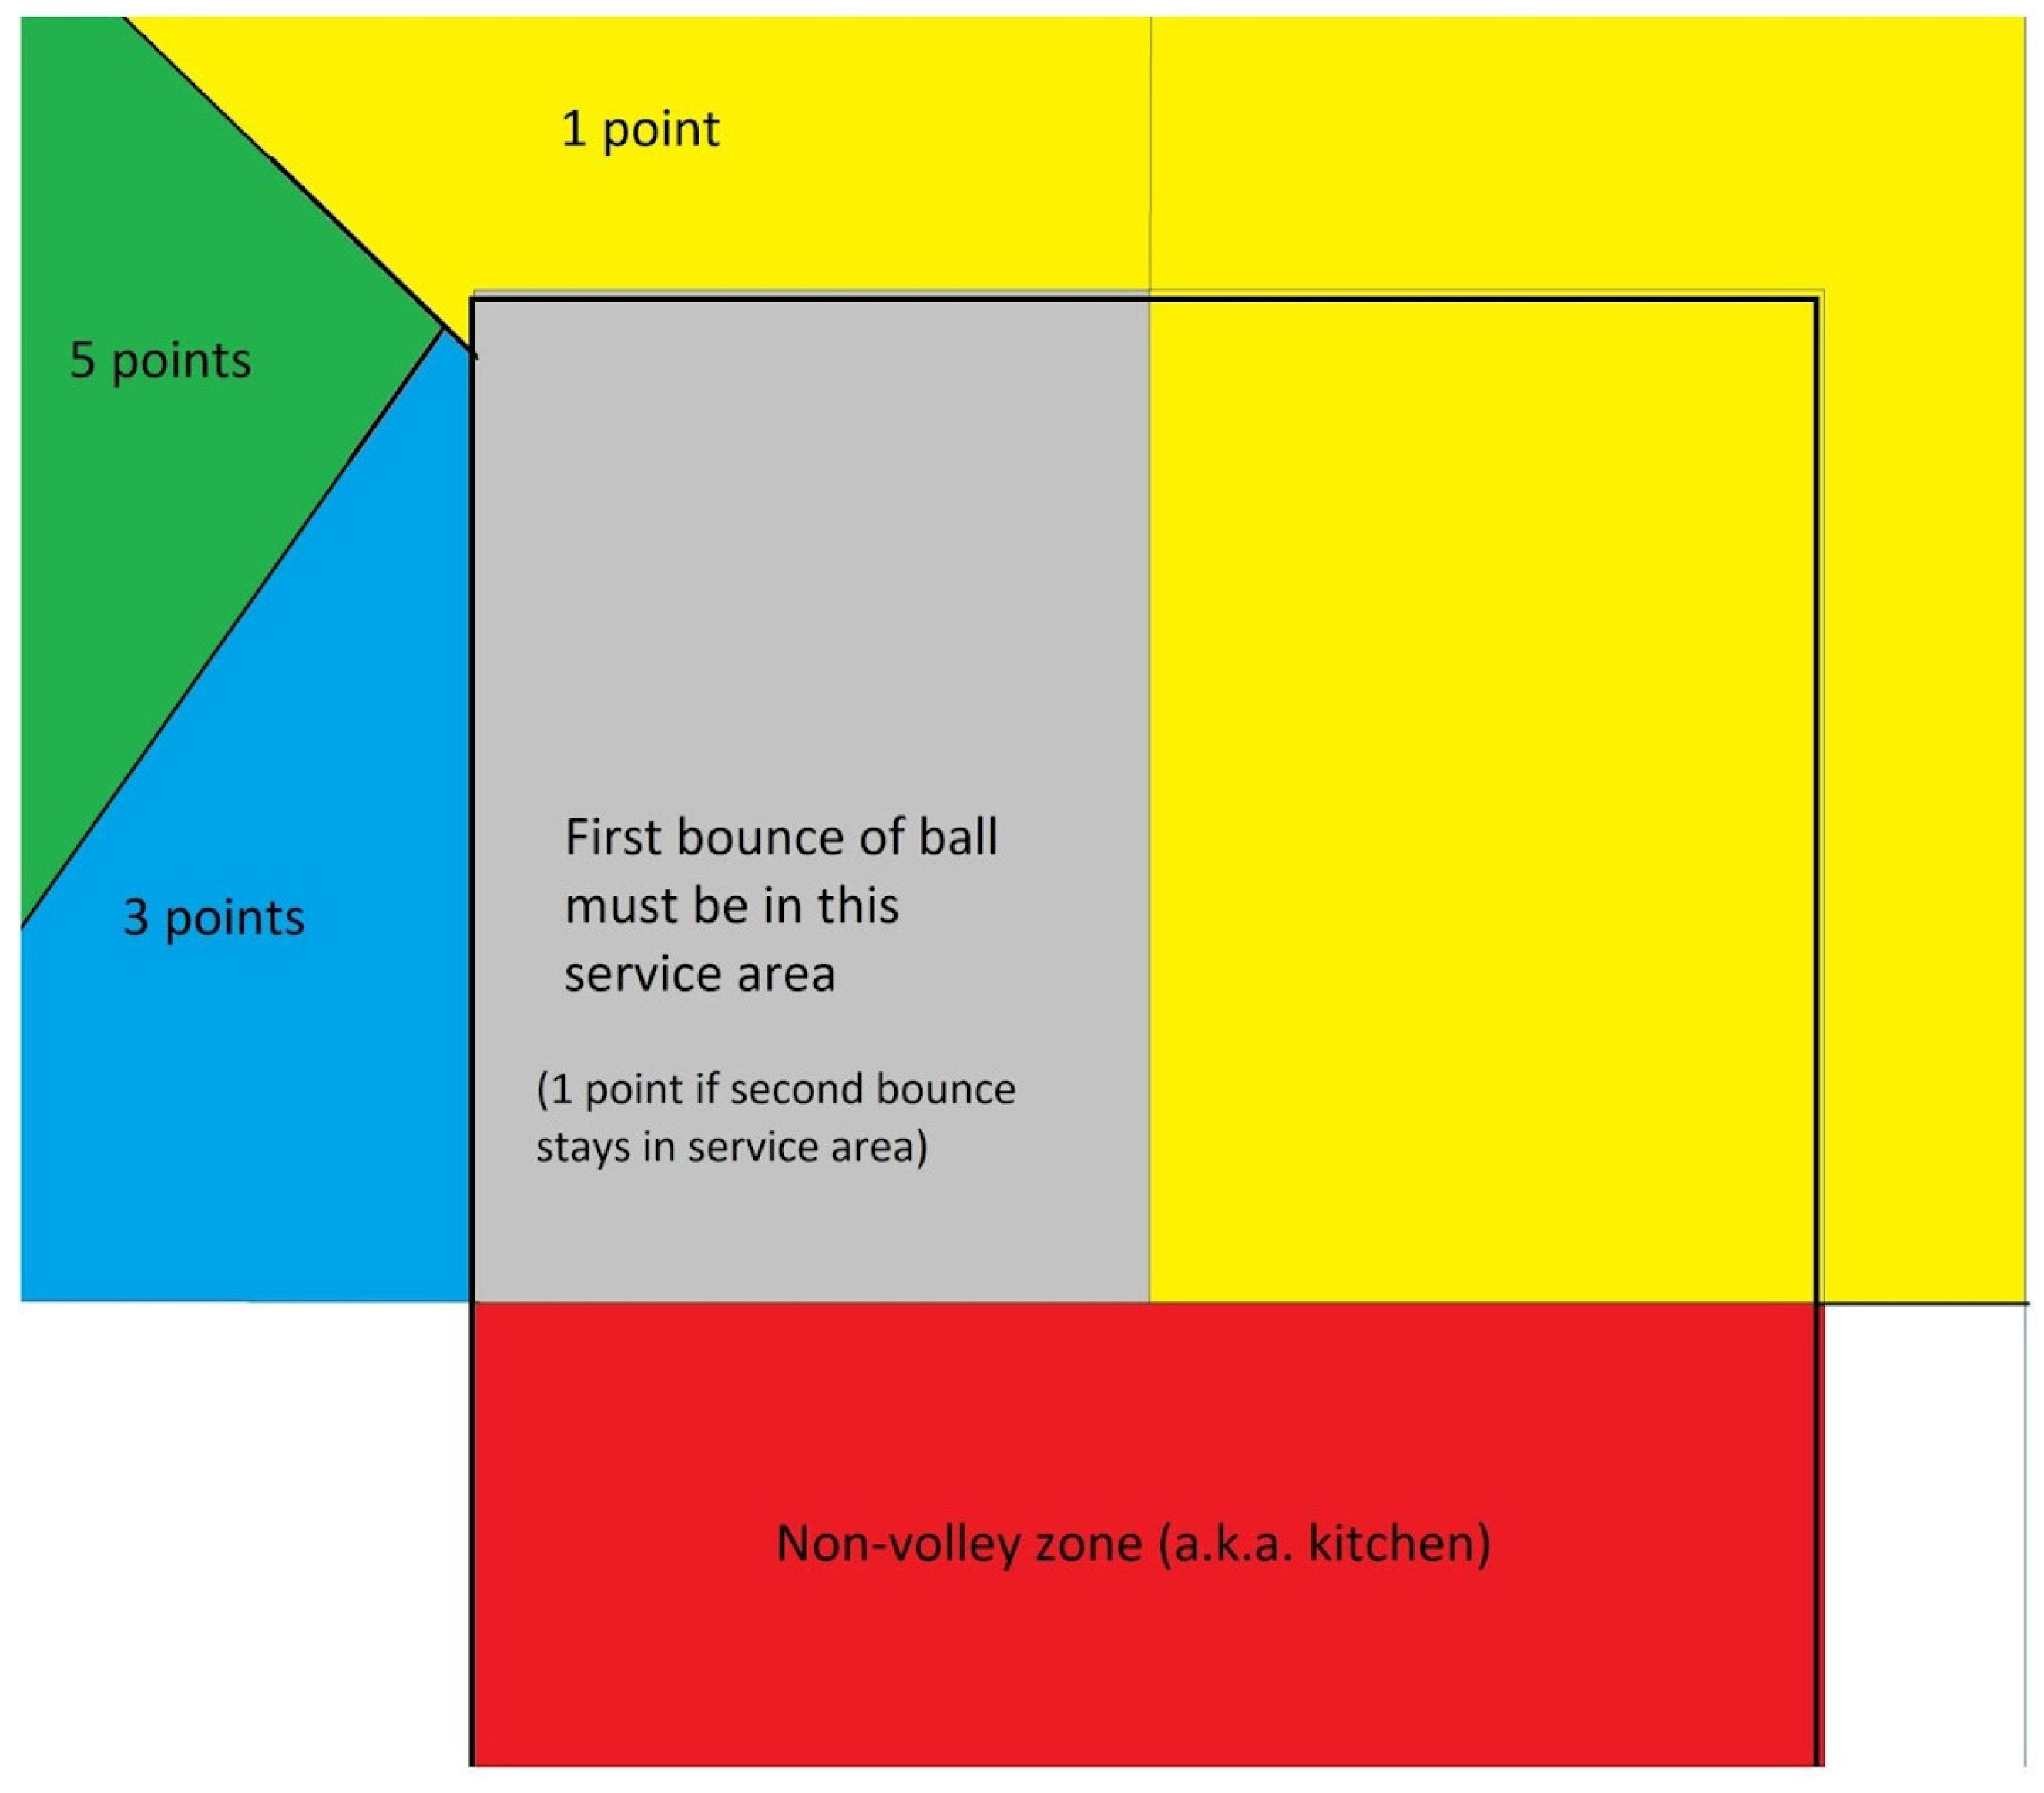
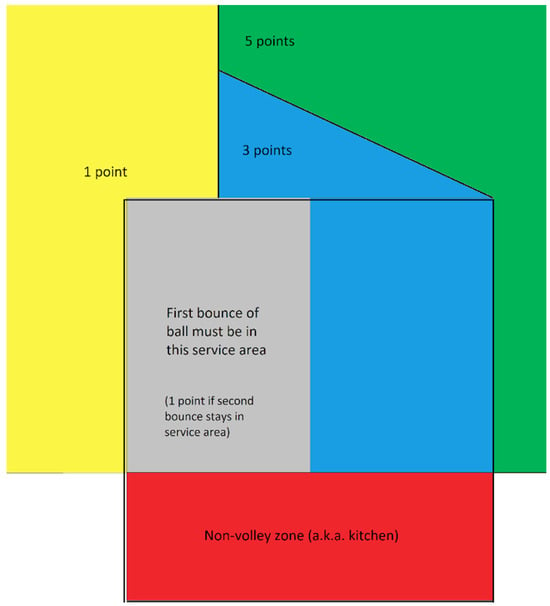
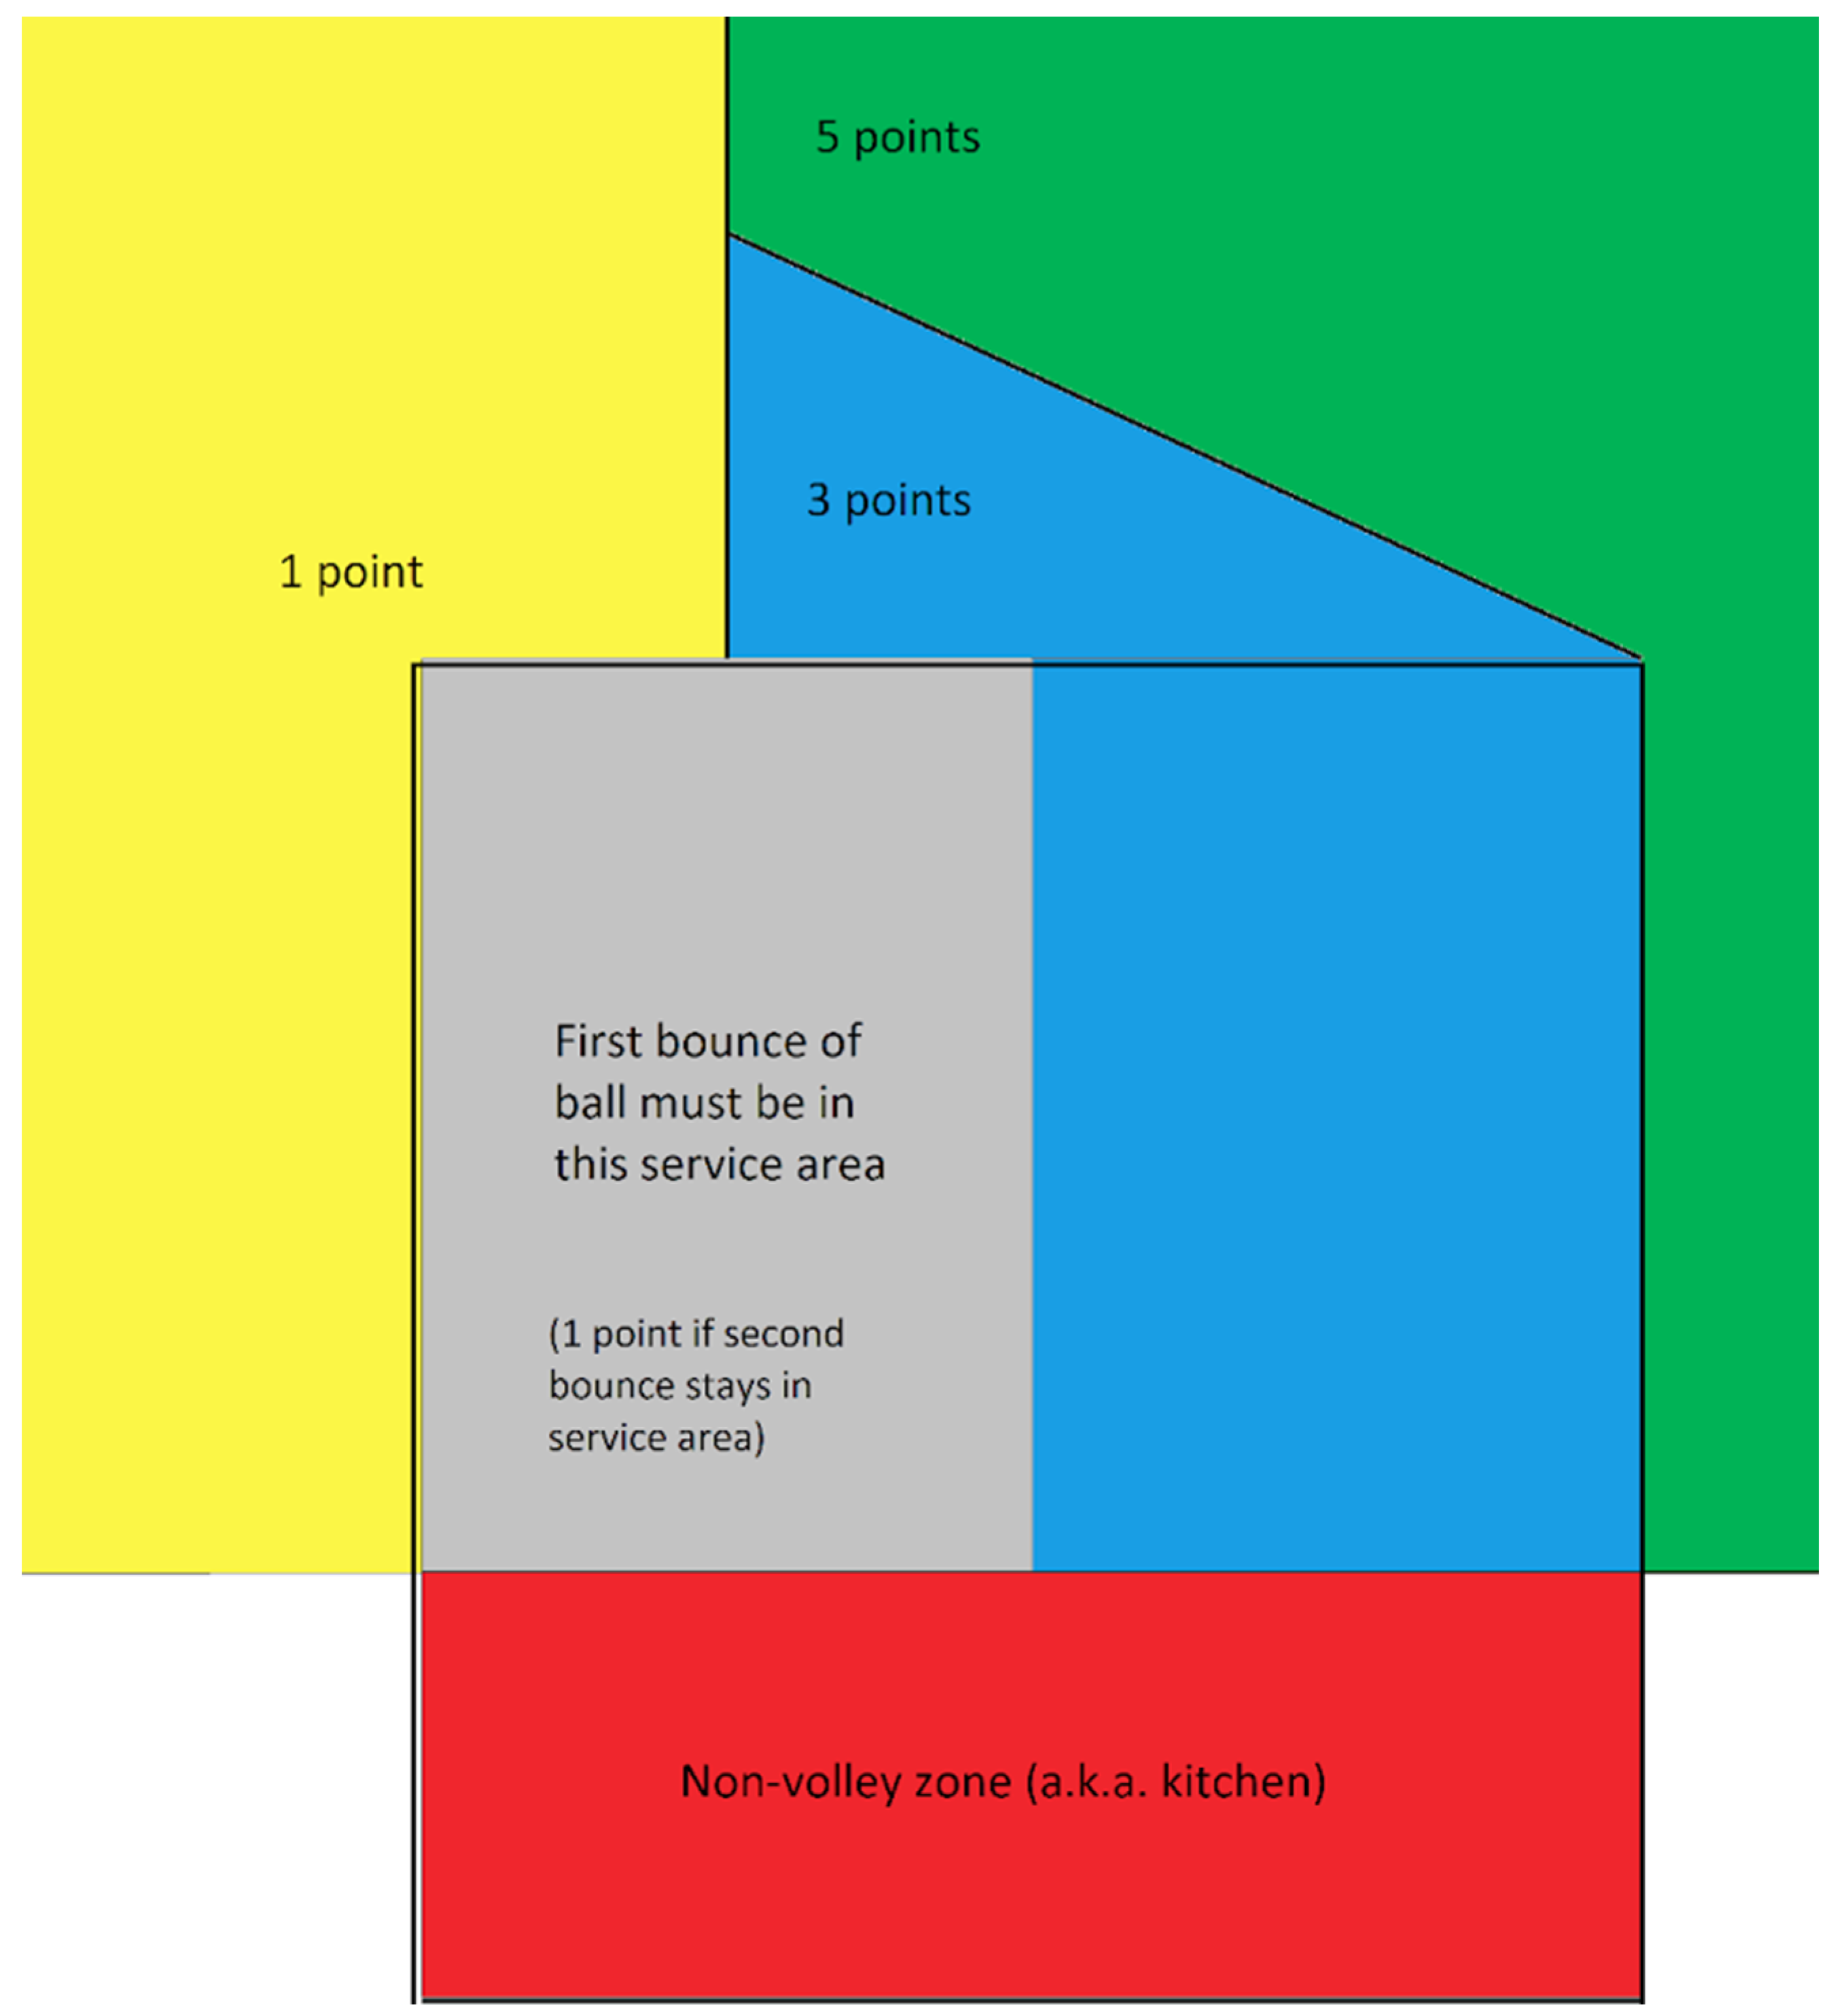
The scoring for the test used the same system as the Mobility, Power, and Placement test from tennis, which this test was based upon [9]. The score of each serve was determined by where the second bounce of the ball landed. If a serve faulted, the serve was scored as 0 points. See Figure 3 and Figure 4 for schematics of scoring of successful serves.
Figure 3.
Point allocation aiming for the left corner target. The mirror image would be used to score the right corner target.
Figure 4.
Point allocation aiming for the left middle target. The mirror image would be used to score the right middle target.
3. Rater Training and Blinding
From Phase 2 on, we used a large team of researchers to conduct the pilot studies. The team consisted of four professors and eight undergraduate research students. All researchers were trained in how to set up, perform, and score the Pickleball Power and Placement Test. Raters were trained initially with an explanation of the test and scoring using the above figures, as well as a discussion of hypothetical scoring of bounces. Next, in the lab, scoring zones were marked out and balls were bounced to simulate the performance of the test to demonstrate and explain the test further. Lastly, all researchers underwent a training session where live trials were performed by other members of the research team until each researcher felt comfortable scoring and had demonstrated consistency and congruence with how the principal investigators expected points to be scored based on test parameters (scoring discrepancies between raters and researchers were discussed and corrected as needed during this training period). All researchers underwent at least two training sessions (theoretical/lab demonstration and a live practice session) before participating in any data collection. Furthermore, the membership of the research team was consistent across all the phases, meaning that they accumulated more practice through participating in data collection sessions as the research agenda progressed. Throughout all phases of data collection, raters were blinded to individual player’s skill levels. To keep the independence of ratings, raters were instructed to write down their scores for each trial without discussion with the other rater(s).
4. Phase 2: Comparison of First and Second Bounce and Position of Raters
4.1. Phase 2: Objectives
This was the first pilot study with empirically collected and statistically analyzed data. This study had three objectives. The first was to determine whether three or two raters are needed to score the test. If fewer raters are needed, that makes the test less resource-intensive. The second was to determine where the raters should stand while scoring the test to best produce reliable ratings (three positions were tested, which are described in the Methods). The third was to compare scores based on the first bounce (using the scoring system of the serve test from Wasem [4]) to scores based on the second bounce (using the scoring system illustrated in Figure 3 and Figure 4, based on the Mobility, Power, and Placement test [9]). In other words, the third objective was to compare scores between the two tests.
4.2. Phase 2: Methods
4.2.1. Phase 2: Participants
We recruited pickleball players from the local community to participate in this test. All participants had to be adults who identified themselves as having pickleball experience. Potential participants were excluded if they were currently suffering any injury that would hinder their ability to perform a pickleball serve. This study was approved by the supervising IRB (Committee for the Protection of Human Subjects; protocol #270). All participants provided verbal informed consent, as no personally identifiable information was collected.
4.2.2. Phase 2: Serve Test Setup
In this study, we drew lines on a pickleball court with chalk to mark out the two tests simultaneously used. The test developed by Wasem [4] requires three lines to be drawn across the interior of the court; each line runs parallel to the baseline and is spaced two feet apart, starting from the baseline. This creates four total zones within the service area of the court—three that are two feet deep each and earn higher points, and then a larger zone that covers the area from the non-volley line to the first of these extra drawn lines. If the ball’s first bounce lands in the zone adjacent to the baseline, 5 points are awarded; the next two zones score 3 and 2 points, and if the ball’s first bounce lands in the service area closer than the drawn lines, it earns one point.
4.2.3. Phase 2: Procedures
Participants were recruited to complete the test in groups of two to six. After consent, the test was explained and demonstrated. After participants asked questions, testing order within the group was assigned sequentially based on overall study subject ID number. Within the group, one participant performed their first set of serves, then the next participant performed their first set of serves, and so on until all participants in the group had performed their first set of serves. The first person would then perform their next set of serves, etc. The order of targets for each participant was randomized, based on a preprinted random-order chart. At each target, participants performed 15 serves in a row, following the rules stated above in the test setup.
Three raters judged each serve, scoring both the first and second bounce. Raters were all members of the research team. One rater stood parallel to the baseline, about 3 m laterally away from the sideline (side position). One rater stood about 3 m laterally away and 3 m behind the baseline (diagonal position). One rater stood in line with the sideline and about 3 m behind the baseline (back position). Raters were instructed to write down the score on the first and second bounces. If the ball hit a line drawn for the purpose of the test, the line was considered to belong to the higher score area it bordered. Raters were explicitly instructed not to record any score on an individual bounce if they felt they did not know where the ball landed (for example, if they blinked at the exact wrong moment).
4.2.4. Phase 2: Statistical Analysis Methods
When a serve was rated by three raters, the three scores may disagree. When two raters agreed and one rater disagreed, the most likely assumption was to trust the two raters’ common score rather than the one that differed from the two. Therefore, the mode of three scores was used as the official score of each serve. When the mode did not exist (i.e., all three scores were different), we trusted the rater who reported agreed scores most often rather than the one who more frequently reported disagreed scores (i.e., the best raters’ scores were used). Therefore, the following method was used: Each rater was evaluated by calculating the average deviation from the mode, if it existed, and a good rater was determined by a small average deviation. Then, the best rater’s score was treated as the official score. This method was used for the first bounce and the second bounce separately. After calculating the official score of each serve, to determine the raters’ positions and whether two or three raters were needed, the percent of agreed scores were calculated between all three raters, any two raters, side and diagonal raters, side and behind raters, and diagonal and behind raters.
We used two strategies to compare the scores between the two tests. In both of these analyses, we used the official score, as described in the Methods above, as the dependent variable. First, we assessed the convergent validity aspect of construct validity. Convergent validity was established by running Pearson’s correlation (which assesses the correlation with assumed linearity) and Spearman’s correlation (which assesses the correlation without assumed linearity) between the official score of the first bounce and the official score of the second bounce. However, we also wanted to determine if the two tests, while both assessing serve ability, assess it in different ways. In other words, we wanted to show that Wasem’s [4] test does not account for lateral placement or penetration, but that our test does. To assess this, we counted the frequency of non-faulting serves that resulted in each possible combination of scores on the two tests (e.g., 1 point on both tests/bounces; 1 point on the first bounce and 3 points on the second bounce; 1 point on the first bounce and 5 points on the second bounce; 3 points on the first bounce and 1 point on the second bounce, etc.). A mixed-effect model for the count data (log link) was used with the first bounce score and the second bounce score (additive terms) and their interaction term to test whether the first bounce score and the second bounce score depend on each other. In this mixed-effect model, participants were included as a random effect. The likelihood-ratio test was used to test against the null model (i.e., no interaction term).
4.3. Phase 2: Results
There was a total of 1015 serves (17 subjects served 15 times at each of the 4 targets, with 5 invalidly captured trials removed—the invalid trials were ones where the raters reported impossible scores). Table 1 summarizes the data by the percent of agreed scores between raters. When a serve is scored by three raters, an official score is available (i.e., mode exists) for nearly every trial for both first bounce (98.7%) and second bounce (98.4%). When only two raters are available, the side and diagonal positions are recommended at a cost of decreased percent of agreement by 10%. The score by a rater agreed with the official score (mode) 91.3%, 95.2%, and 88.4% of the time when the rater’s position was side, diagonal, and behind, respectively, for the first bounce, and 93.6%, 93.7%, and 87.6%, respectively, for the second bounce. These statistics also indicate that the rating at the behind position tends to disagree with the mode more often than the ratings at side and diagonal positions.
Table 1.
The percent of serves agreed between raters.
With respect to all trials performed, Pearson’s correlation between the scores of each bounce was 0.39 (p < 0.001), and Spearman’s correlation was 0.67 (p < 0.001). These results indicate that the scores of each bounce are moderately correlated, but not linearly. If the score of the first bounce was 0, 1, 2, 3, and 5, the respective expected score of the second bounce was 0, 2.46, 2.46, 2.17, and 2.68, which was not a linear increment (p < 0.001). The frequency of scores on the two tests with respect to each other is presented in Table 2. Of the 1015 serves, 295 were faults, and therefore received a score of 0 on both tests. The most common result overall was to score 1 point on both bounces, i.e., most serves would not be considered high-quality/attacking serves. When a person earned the highest score possible on the first bounce, they most frequently earned the lowest score possible on the second bounce, and vice versa. The likelihood-ratio test indicated that the score on the first bounce and the score on the second bounce depend on each other significantly (ꭓ2 = 45.362, df = 6, p < 0.001). Overall, 27.9% of serves were 5 points on the second bounce, and 26.1%, 27.1%, 27.6%, and 41.3% of serves were 5 points on the second bounce when the score on the first bounce was 1, 2, 3, and 5, respectively.
Table 2.
Frequency of scores on 1st and 2nd bounces.
4.4. Phase 2: Discussion and Conclusions
Based on the results, positioning a rater at the back position led to more errors than at the side or diagonal positions; so, in the following phases, the back rater position was dropped and the side and diagonal positions were kept. The agreement between raters at the side and diagonal positions was about 88%, indicating that with two raters, there is a high likelihood that the observed score on either test represented the true value of the test.
The moderate correlation on scores, driven by the fact that most people scored 1 point on both the first and second bounce or faulted, thus receiving a score of 0 on both bounces, helps support the basic convergent validity between the Pickleball Power and Placement Test and Wasem’s serve test [4]. In other words, both tests validly indicate if a person made a legal serve or not, as no one scored 0 points in one version of the test while scoring more points in the other version. The mismatch in high performance on the tests (i.e., when someone scored high on the first bounce, they usually scored poorly on the second bounce and vice versa) indicates that the two tests assess different abilities in the serve. The first bounce test by Wasem [4] was designed to assess serve power with little regard to placement beyond not faulting, whereas the Pickleball Power and Placement Test assesses ball control and placement in addition to power. While this study did not empirically assess the comparative validity of the two tests for game performance, conceptually, the Pickleball Power and Placement Test seems superior as a holistic assessment of pickleball skill because it requires intentional accuracy of ball placement.
A major limitation of this phase of this study was not controlling which rater stood at each position for each serve; the phase lasted over multiple data collection sessions, and assignment of raters to each position was random, but not in a systematically random way. Therefore, we were unable to detect if there was systematic error in scoring between individual raters. In the next phase, we sought to more systematically evaluate the interrater reliability of the Pickleball Power and Placement Test.
5. Phase 3: Interrater Reliability of the Pickleball Power and Placement Test
5.1. Phase 3: Objective
In Phase 2, a major limitation was that the person who acted as rater at each position during each set of serves was not controlled. Therefore, in Phase 3, we systematically rotated multiple raters between positions to determine multiple aspects of interrater reliability. We conducted another pilot study and collected new data to support this phase of the test development.
5.2. Phase 3: Methods
Eight members of the research team acted as raters during 16 total sets of serves (n = 240 serves). Serves were performed by two adult pickleball players, who alternated sets of serves. The players provided verbal consent (IRB protocol #270) as no personal data were collected on them. For this small study, we were only interested in assessing scores for the Pickleball Power and Placement Test; so, the court was lined for all four targets as described in Phase 1.
The eight raters were divided into two groups. During each set of serves, one group of four raters stood at the side position, and the other four raters stood at the diagonal position, as described in Phase 2. A cone was placed at each position, and raters were asked to cluster around the cone, with just enough space between them to still have a clear view of the court and markings. Each rater independently wrote down the score based on the second bounce of the ball. The rater groups were systematically moved so that each group rated every target from both positions.
Phase 3: Statistical Analysis Methods
The interrater reliability was measured by the intraclass correlation coefficient (ICC) and percent of agreement among raters. The ICC is defined as Vα/(Vα + Vε), where Vα quantifies the variability in scores due to the quality of serves and Vε quantifies the variability in scores due to raters (i.e., raters may score differently on the same serve). Mathematically, the ICC is high (close to one) when Vα is large and Vε is small. In other words, the ICC is high when most or all raters give the same score on each serve (i.e., Vε is small) and the quality of serve is well distinguishable between the players (i.e., Vα is large). The ICC was estimated under the random-effect model. More specifically, we let yij denote the score of the ith serve rated by the jth rater and modeled yij = μ + αi + εij, where μ is the overall average score, the variance in αi is denoted by Vα, and the variance in εij is denoted by Vε. The 95% confidence interval (CI) for ICC was calculated by bootstrapping. In addition, on each serve, the percent of raters who scored the same as the official score (mode) was calculated, and the percent of agreement was estimated by averaging over all serves under the binomial logistic regression model. Both ICC and percent of agreement were estimated by the four targets (left corner, left middle, right corner, and right middle) and the two raters’ positions (diagonal and side). Lastly, we tested if the percent of agreement differed by the targets and raters’ positions. In this analysis, the generalized linear mixed-effect model (logistic link) was used to account for the variation due to the players and their serves. The targets and raters’ positions were specified as a fixed effect and players and repeated trials were specified as a random effect for this mixed-effect model.
5.3. Phase 3: Results
The overall ICC, grouping all targets and raters’ positions, was 0.868 with a 95% CI of (0.807, 0.904), indicating good inter-rater reliability [10]. Table 3 summarizes the ICCs by the four targets and the two positions of raters. The ICC of the right middle target was 0.616 and 0.665 for diagonal and side raters, respectively, indicating moderate reliability [10]. Each of the other targets (left corner, left middle, and right corner) showed ICCs above 0.8, indicating good-to-excellent reliability.
Table 3.
Intraclass correlation coefficient (ICC) and percent of agreement by the four targets and the two raters’ positions (95% CIs are in the parentheses).
The overall percent of agreement, grouping all targets and raters’ positions, was 94.6% with a 95% CI of (93.4, 95.6). The percent of agreement of the right middle target was 89.5% and 90.9% for diagonal and side raters, respectively, and the other targets had a percent of agreement between 94.1% and 97.1% depending on the targets and raters’ positions (Table 3).
There is significant evidence that the percent of agreement is lower when the target is right middle (p < 0.001). For any given target, the percent of agreement was not significantly different between the two positions where raters stood (p = 0.842), and there was no significant interaction effect between the target and raters’ positions (p = 0.526).
5.4. Phase 3: Discussion and Conclusions
The overall inter-rater reliability of the Pickleball Power and Placement Test was high. When observing the right middle target, the inter-rater agreement was significantly lower than that of the other targets. After significant discussion among all members of the research team, we judged that, in the current setup, the raters were too far away from the target area (standing a total of 5 m laterally away from the vertical line that separated the 5 and 3 point zones from the 1 point zone). Therefore, after Phase 3, we changed the setup to have the cones, which mark where the raters stand, to be in line with the sideline of the court during serves to the middle targets. This change brought them closer; thus, it would be easier to see where the ball landed, and should reduce error further. Even though the inter-rater reliability was high, we felt it was still optimal to have two raters judging the test when available, but that one rater could be used in a minimal-personnel situation. With the procedures and inter-rater reliability established, we next performed a preliminary examination of the predictive validity of the Pickleball Power and Placement Test by deploying it prior to tournaments.
6. Phase 4: Initial Validity Exploration of the Pickleball Power and Placement Test
6.1. Phase 4: Objective
To give an initial assessment of the validity of the Pickleball Power and Placement Test, participants performed the test and then played in a tournament, and we assessed the association between the test scores and the tournament outcomes.
6.2. Phase 4: Methods
To test the serve in a variety of settings, we hosted three tournaments: mixed singles, men’s doubles, and women’s doubles. Six adults (five men, one woman) participated in the mixed singles. Sixteen adults participated in each of the doubles tournaments. Inclusion criteria for all the tournaments were adult pickleball players who either self-rated or had an official pickleball rating (by any rating system) between 2.5 and 3.5; this range of ratings indicates intermediate-level players. An exclusion criterion was anyone suffering an injury that currently made it unsafe for them to play. All players provided written informed consent (IRB protocol #270) prior to data collection and playing.
Based on the results from Phases 2 and 3, we used the following test setup and administration procedures: Two raters judged each trial. Raters stood at the side and diagonal positions; cones were placed to indicate where the raters should stand. For the corner targets, the side rater stood in line with the baseline of the court, 3 m away from the sideline. The diagonal rater also stood 3 m laterally away from the sideline and 3 m behind the baseline. For the middle targets, both the side and diagonal raters stood in line with the sideline; the side rater stood on the baseline, and the diagonal rater stood about 3 m behind the baseline. To line the courts for the test, we used 2-inch wide painter’s tape (2 inches is the same width as the official lines of the court). The edge of the painter’s tape was placed on the border of scoring zones, with the body of the tape sitting in the higher scoring zone. Thus, if the ball hit the tape, it scored the higher number of points.
Immediately prior to each tournament, participants completed the Pickleball Power and Placement Test. Participants were placed into groups, with each person in the group completing their set of serves to the target before the group moved on to the next target. To accommodate the large number of participants, groups were sequentially formed based on arrival time to the pickleball courts. Groups were alternately assigned to start at one of two targets: either left corner or left middle target. Groups rotated around until they completed all targets. The order, based on the starting point of the left corner, was: left corner, right corner, left middle, right middle. For those who started at the left middle, they progressed to the right middle, left corner, and then right corner. At each target, the researchers read from a script to ensure uniform administration of the test.
There was one difference in the administration of the Pickleball Power and Placement Test between the singles and doubles tournaments, based on feedback from the players and observation by the research team during the singles tournament (which occurred first). In the doubles tournaments, players were instructed that their first five serves would count as warm up, and they were told their score on each of them. Participants were told that their last 10 serves counted toward their total score for the test, and during these, the researchers did not provide any feedback.
For the singles tournament, participants played each other within a set (five matches), and performed three sets (i.e., played everyone three times, for 15 total matches). Each match lasted 8 min, rather than playing to 11, with the person with the higher score declared the winner. After each set, participants were given a 20 min rest break. Between matches within a set, players received a 5 min rest and transition break.
For the doubles tournaments, participants were assigned different partners for every match. Partner assignments and match matchups were determined by an algorithm designed for sports tournament research to attempt to minimize the standard error of statistical parameter estimation [11]. The statistical parameter of interest was the relationship between the match outcome and serve score under the linear regression model. In the doubles tournaments, everyone participated in 11 matches, each lasting 10 min. A 5 min rest and transition break was given between matches. After the 4th and 8th match, players received a 20 min break.
Match scores, as well as which person (singles) or team (doubles) won each rally (regardless of whether they scored a point) were tracked by two observers per court. Match statistics were compared and reconciled between observers before entry into the dataset.
Phase 4: Statistical Analysis Methods
For all tournaments, two raters independently scored each serve. When two raters scored a serve differently, it was difficult to apply the method of deciding an official score described in Phase 2 in the middle of trials; so, the average of the raters’ scores was used as the official score for each trial. However, for 95.1% of all trials, the two raters’ scores were identical, indicating extremely high inter-rater reliability and supporting the validity of the official scores given to each trial.
The first component of validity we assessed was predictive validity by testing if the serve test scores could predict winning in the tournament. We performed separate analyses for each tournament to discriminate if the serve test was a good predictor in each setting, i.e., in singles, women’s doubles, and men’s doubles tournaments.
For the singles tournament, the difference in individual players’ scores on the Pickleball Power and Placement Test was used as the predictor variable, and the binary outcome (winning or not) of each rally was used as the dependent variable. The generalized mixed-effect model (logistic link) was used to model the probability of winning a rally to account for any unobserved random effect of each match. Under this model, the response variable was the binary outcome for each rally (win or loss), the fixed effect was the difference in the serve score, and the random effect was the match. Given the small number of subjects, we tested our hypothesis based on all rally-level outcomes instead of analyzing subject-level averaged outcomes.
For the analyses of the doubles tournaments, we made the following calculation: for each match, we computed the average score on the Pickleball Power and Placement Test of the two players on each team, and then subtracted the team averages to compute average test score difference. The average test score difference was used as the predictor variable in these analyses, and the binary outcome (winning or not) of each rally was used as the dependent variable. As we did for the singles tournament, the generalized mixed-effect model (logistic link) was used to model the probability of winning a rally to account for any unobserved random effect of each match. The response variable was the binary outcome for each rally (win or loss), the fixed effect was the difference in the average serve score, and the random effect was the match. This provided a team-level analysis of the predictive validity of the Pickleball Power and Placement Test.
To understand the importance of an individual’s score on the Pickleball Power and Placement Test to match success, for each individual, we summed all the points their teams scored in all games, as well as all the points teams scored against them in all games, and computed the margin of points scored. We used the individual’s Pickleball Power and Placement Test score as a predictor variable, and tested it against their margin of points scored. Simple linear-regression analysis was used for this analysis.
The scoring system of the Pickleball Power and Placement Test was copied from the test it was based upon, the Mobility, Power, and Placement test from tennis [9]. However, as part of testing the validity of the Pickleball Power and Placement Test, we wanted to examine if a different scoring system would better represent the test by doing a better job predicting tournament performance. Therefore, we set up two alternate scoring systems, which are summarized in Table 4. For each scoring system, trial scores were averaged within target, and the mean scores were averaged across the four targets as a final serve score for each player.
Table 4.
Test scoring systems for Pickleball Power and Placement Test.
The theoretical underpinning of the alternate scoring systems are as follows: for all the alternate systems, a larger point gap is created between a fault and making a legal, basic serve. This was done in recognition that, in pickleball, you do not get a second attempt at a serve (unlike in tennis, where if you commit a fault on the first serve, you get a second serve). In alternate system 1, this importance is further emphasized by making a fault worth −1 points. Alternate system 2 is (X − 5)2, where X is the original score system. The average of (X − 5)2 is referred to as the mean square error (from the highest score of 5), and considers both precision and accuracy for evaluating a set of serves. A lower score is better in this scoring system. The above analyses, comparing Pickleball Power and Placement Test scores with match outcomes, were repeated with each scoring system.
6.3. Phase 4: Results
Descriptive statistics of performance on the Pickleball Power and Placement test for each tournament can be seen in Table 5. The table presents average performance using the original scoring system and the two alternate scoring systems.
Table 5.
Overall average Pickleball Power and Placement Test score in each tournament using the original scoring system and the two alternate scoring systems.
In the singles tournament, 67% of games were won by the player with the higher Pickleball Power and Placement Test score. For the singles tournament, the original score on the Pickleball Power and Placement Test was significantly related to the probability of winning a rally (p < 0.001). Except for one player, who was an outlier by performing the worst on the serve test while placing second in the tournament, there was a general pattern of increasing wins with higher test performance. The mixed-effect model estimated that the probability of winning a rally is 0.69 with a 95% CI of (0.59, 0.78) when one player’s original test score is 1-point higher than the opponent. A probability of 0.69 is about odds of 2:1 (two rallies won per one loss), and we interpret it as a practically significant result. The marginal R-square value was 0.336, which is theoretically interpreted as the proportion of variance in the rally outcome explained by the difference in the test score. The statistical significance was weaker when the two alternate systems were used as a predictor (p = 0.511 and p = 0.141 for alternate systems 1 and 2, respectively).
In the men’s doubles tournament, 57% of games were won by the team with the higher average serve test score. For the men’s doubles tournament, the difference between opposing teams’ average serve scores was not significantly related to the probability of winning a rally for all scoring systems (p = 0.911, 0.409, and 0.594 for the original system and alternate systems 1 and 2, respectively). The mixed-effect model estimated that the probability of winning a rally is 0.48 with a 95% CI (0.36, 0.60) per 1-point difference in the team’s average serve score. A probability of 0.48 is just like a coin toss (i.e., odds of 1:1), and the marginal R-square value was less than 0.001, indicating that the null finding for the men’s doubles is likely due to the true absence or a negligible effect size.
In the women’s doubles tournament, 80% of games were won by the team with the higher average serve test score. For the women’s doubles tournament, the difference between opposing teams’ average serve scores was significantly related to the probability of winning a rally with p < 0.001 for all scoring systems. The mixed-effect model estimated that the probability of winning a rally is 0.84, with a 95% CI of (0.77, 0.89), when a team’s average original serve score is 1 point higher than the opponent. The R-square values were 0.652, 0.631, and 0.645 (p < 0.001 for each) when the original system and alternate systems 1 and 2 were used as a predictor, respectively. Given the same number of participants (n = 16) and identical tournament design (11 matches, each lasting 10 min) as the men’s double tournament, the validity of the serve test appears to be different between men’s and women’s doubles.
In addition to a pair’s average serve test score, we assessed how an individual player’s serve test score impacted winning in the doubles tournaments. For male players, their individual serve test score was not significantly related to the margin of points (points his teams scored minus points score against his teams) for all scoring systems (p = 0.958, 0.890, and 0.931, respectively). For female players, their individual serve score was significantly related to the margin of points for all scoring systems (p = 0.003, 0.005, and 0.004, respectively). The simple linear model estimated that the expected margin of points is 4.52 points higher per 1-point increase in the original serve score with a 95% CI of (1.75, 7.29). The R-square values were 0.447, 0.423, and 0.439 when the original system and alternate systems 1 and 2 were used as a predictor, respectively, indicating that the alternate scoring systems do not necessarily provide better predictive power.
6.4. Phase 4: Discussion and Conclusions
Among pickleball players rated 2.5–3.5, the Pickleball Power and Placement Test was a significant predictor of success in the mixed singles and women’s doubles tournaments. For the women’s doubles tournament, this was true both when using the pair’s average serve score and when examining an individual player’s serve test score. It was not a significant predictor of success in the men’s doubles tournaments for either pairs or individuals. The evidence for validity in two out of three settings in our pilot work provides sufficient confidence in the Pickleball Power and Placement Test to warrant its continued development. However, the incongruence between men’s and women’s doubles may indicate that untested factors besides serve skill—like physical fitness, tactics, or teamwork—contribute more to success in men’s doubles, while ball control (as represented by the serve test) may explain about 65% of the variance for winning a rally in women’s doubles.
The original scoring system was the best of the three scoring systems tested to predict tournament success, and will be kept as the official scoring system. In this phase of this research, for the doubles tournaments, we used the first five trials as stated warm ups. However, this number was arbitrarily chosen. In the final phase of this research, we aggregated the official scores collected in Phases 2 and 4 and examined inter-trial reliability, learning effect, and whether we can use less targets to represent performance on the overall test. Phase 3 was excluded from the aggregate due to the higher number of trials each player performed; thus, potentially, they would have had a greater learning effect by the time they performed later targets.
7. Phase 5: Streamlining the Test
7.1. Phase 5: Objective
The Pickleball Power and Placement Test has always been done in small groups (usually four people). This creates a natural rest break for each individual before moving on to the next target. It also has the benefit of creating some logistic efficiency (testing in groups instead of just one person at a time). However, even at our research group’s peak efficiency, it required access to four courts simultaneously and over an hour to test 16 participants, with a single group of four people taking about 45 min to complete all four targets. Therefore, our final phase retrospectively examined data aggregated from prior phases to answer the following research questions:
- How many practice trials are needed to overcome a learning effect on the Pickleball Power and Placement Test?
- How many more trials are needed, after the learning effect has ended, to determine a reliable score on the Pickleball Power and Placement Test?
- Is there an order effect to the targets?
- Is there one target people perform better on, regardless of the order it comes up in?
- Do any specific targets better represent performance on the whole Pickleball Power and Placement Test so that we can reduce the number of targets?
7.2. Phase 5: Methods
Datasets were compiled from Phases 2 and 4 with the following information: trial number; official score on the second bounce; target; and order of targets (1 to 4). The original scoring system was used to score all trials, based on the conclusion from Phase 4 that the original scoring system had the strongest predictive validity.
Phase 5: Statistical Analysis Methods
For the first research question, the changepoint regression [12] was applied with the following assumptions: the expected score increases until trial t (learning period), and then it is constant after trial t for t = 1, 2, 3, …, 15. The random effect was considered in the changepoint regression to account for the correlations due to repeated measures. The Akaike Information Criterion (AIC) and Bayesian Information Criterion (BIC) were calculated to evaluate which assumption fits observed data well without overfitting the data. According to the AIC and BIC, among the fifteen choices (t = 1, 2, 3, …, 15), the top two best models were t = 15 (i.e., the expected score increased for 15 trials), followed by t = 1 (i.e., the expected score is constant with respect to the trial). In either model, we could not address the second research question.
Under the assumption that the expected score increases for 15 trials, the linear mixed-effect model was used to address the third and fourth research questions. Under this mixed-effect model, the trials (1 to 15), targets (left corner (LC), left middle (LM), right middle (RM), and right corner (RC)), and order of targets (1 to 4) were the fixed effect and individual subjects were the random effect to account for the variability between subjects (i.e., repeated measures per subject). The likelihood-ratio test was used to test for each fixed effect. We used Cohen’s partial F2 to assess the effect size of each fixed effect, with partial F2 < 0.02 indicating a trivial effect size, partial F2 ≥ 0.02 and <0.15 indicating a small effect size, partial F2 ≥ 0.15 and <0.35 indicating a medium effect size, and partial F2 ≥ 0.35 indicating a large effect size.
Per subject, we let LC, LM, RM, and RC denote the average score within each target, and we defined LC + LM + RM + RC as the overall score. For the fifth question, we calculated the correlation between the overall score and each possible subset score. For instance, we calculated the correlation between LC + LM + RM + RC (the overall score) and LM + RM + RC (a subset score). For a score consisting of two or more targets, Cronbach’s α (which is also commonly called the coefficient α) was calculated for internal reliability. A popular rule of thumb for adequate reliability is 0.7, but it is known to be sensitive to the number of items in a test. The α value can increase by simply increasing the number of items, and it tends to be low when the number of items (2, 3, or 4 in our case) is low given the same internal reliability [13,14]. In addition, we calculated the mean absolute error (MAE) between two ranks: when we rank subjects by the overall score and when we rank subjects by a subset score. A high correlation and a low MAE indicate that the subset score is similar to the overall score.
7.3. Phase 5: Results
This phase aggregated data from 56 participants and a total of 3360 trials. The average total serve test score for the players was 1.96 SD 0.56 points. As aforementioned, the AIC and BIC suggested that the expected score increases for 15 trials. Under the mixed-effect model, there was a significant difference for expected score between the four targets (p < 0.001, partial F2 = 0.01), but there was not a significant effect for the order of the targets (p = 0.699, partial F2 < 0.001). Given the same target and order, the expected score increased by 0.0251 points per trial, which amounts to a change of 0.0251 × 15 = 0.377 points when we compare the first trial and the last (15th) trial. Given the large number of data points in the mixed-effect model (3360 trials from 56 participants), the learning effect appeared to be statistically significant (p < 0.001); however, the effect size for this learning effect was considered trivial (partial F2 = 0.004), and the marginal R2 explained by the fixed effect (trials) was only 0.0035. Given the same order and trial, the expected score was 0.287 points higher for LM (p = 0.001), 0.435 points higher for RM (p < 0.001), and 0.007 points lower for RC (p = 0.441) when compared to LC. That is, subjects scored higher on average for the middle targets than the corner targets.
Table 6 presents Cronbach’s α, correlation (between overall score and subset score), and MAE (between overall score rank and subset score rank). The correlation between the overall score (LC + LM + RM + RC) and a subset score is generally higher with more targets. The three subsets of targets with the highest correlation with the overall score were LM + RM + RC (r = 0.963); RM + RC (r = 0.912); and RC (r = 0.813). These three subsets also resulted in the lowest MAE (LM + RM + RC = 3.625; LC + RC = 5.321; and RC = 7.964).
Table 6.
Cronbach’s α, correlation, and mean absolute error of target combinations.
7.4. Phase 5: Discussion and Conclusions
Based on the current evidence, we cannot make definitive conclusions at this time about the intertrial reliability of the Pickleball Power and Placement Test. The p value for the fixed effect of trial indicated that players with intermediate pickleball ratings (2.5–4.0) continuously improved across all 15 trials within each target. However, the effect size of the change was considered trivial, the difference in score from the 1st to the 15th trial was about one third of the standard deviation of the average player score on the test, and the fixed effect of trial contributed less than 1% of the marginal R2. To summarize, the p value was low due to the large number of serves, but three other pieces of evidence indicate that more than 15 trials may not provide meaningful benefit. Therefore, for now, we do not have sufficient evidence to increase the number of trials required in the test procedures. Future research will have to determine conclusively how many trials are necessary. Furthermore, we will need to consider if more serve trials should be provided within each test or could be provided with multiple practice or testing sessions on different days. However, any improvement in test stability through multiple sessions may represent a true improvement in skill through concentrated practice rather than simple test familiarization. This will require addressing one aspect of reliability we have not yet examined: between-session reliability. In filling this gap, future research would likely need to test not just between-session reliability on 2 days, but over a series of days.
While the order for performing the targets did not significantly impact scores, there was a significant difference in scores between targets. People scored significantly higher on average when aiming for the middle targets compared to the corner targets. This difference in performance may reflect the skills needed to achieve the middle targets versus the corner targets. When aiming for the middle targets, the server needs to aim to the inner half of the court, i.e., nearly straight forward, and can focus mostly on the force of the serve to drive the ball back toward the 5 point zone. In this way, the middle targets are very similar in demand to the serve test developed by Wasem [4]. To get a high score when serving to the corners, the server needs to either position themself far out on the baseline in order to create the proper linear angle, or they must be able to put a high degree of spin on the ball during their serve while hitting the ball with a powerful stroke. The potential requirement of high power and spin to score well on the corner targets makes them more difficult than the middle targets. This higher difficulty may mean that scores on these targets could discriminate between higher- and lower-skill players.
Testing players on all four targets is very time-consuming. Throughout our phases, we tested players in groups to be more logistically efficient and to allow one player to rest while other players performed their trials at a target. Even at our peak efficiency, with a large research staff and running multiple targets simultaneously in stations on multiple adjacent courts, we estimate that it took us 45 min to complete the test for a group of 4–5 players. Therefore, in this phase, part of our analysis attempted to determine if we could use fewer targets to still represent overall performance to make a more logistically efficient test. Based on our analysis, we sought subsets that would have high correlations with the overall score, relatively high Cronbach’s α (representing high internal consistency), and low MAE. Looking at all possible subsets of the four targets, we tried to judge which subset within each number grouping (i.e., using any three targets, any two targets, or just one target) would be best to represent the overall score. Of the subsets of any three targets, the combination of LM + RM + RC had the highest correlation with the overall score, the second highest Cronbach’s α, and the lowest MAE. Among the subsets of any two targets, using RM + RC had the highest correlation; however, LC + RC had the best Cronbach’s α and MAE, with a similar correlation. Among single targets, RC had the highest correlation and lowest MAE. An important pattern within these is that the subsets with the best combination of these metrics consistently included RC, even when using only one target. Therefore, it appears that the RC is a necessary target to include. For players and coaches looking to maximize their time efficiency, we recommend using either the right corner only or the right middle + right corner to assess aiming for both sides of the service box.
8. Overall Discussion and Conclusions
This multi-phase research project sought to develop a new standardized test, focusing on the task of serving, but that would generalize to pickleball stroke skill overall. At this point, we feel we have established sufficient predictive validity to warrant its continued development due to the significant relationship between serve test score and performance in singles and women’s doubles pickleball tournaments seen in Phase 4. We recognize that full validity and reliability have not been established yet for the final version of the test (presented in the next section) to warrant widespread adoption and use for longitudinal skill development and tracking. This publication provides a foundation from* which further, more sophisticated, hypothesis-testing studies can be built. We would recommend as a next major step in its validity that its sensitivity to skill-rating be examined; if it is truly valid, it should be able to discriminate between novice, intermediate, and advanced players. In our pilot testing, we did see that it could discriminate between people who had some experience with racquet and paddle sports and those with no experience in these types of sports, but even this assessment of discriminate validity could be more formally and robustly replicated. While we had a range of skill levels, we purposefully kept our inclusion criteria to players of a 2.5–4.0 rating to represent intermediate level players. We chose this range in the belief that intermediate players represent a segment of players balanced between skilled enough to want to be competitive and play in tournaments while still representing recreational players, and therefore the largest player population who would utilize and benefit most from skill-testing. One limitation that should be noted is that throughout these phases of research, participants were asked to report their skill level, “by self-rating or any formal rating system, such as DUPR.” Many people self-rated, and some indicated on the questionnaire that they were just guessing at their rating. Therefore, we did not feel we could use the reported pickleball ratings as perfectly valid identifiers for the participants. In examining the sensitivity of this test, a pool of subjects that had strongly accurate external skill ratings, either by a robust DUPR rating or having a skilled coach appraise them with the USA Pickleball rating system criteria, would be needed.
For administering the test, the evidence from Phases 2 and 3 strongly support the inter-rater reliability of the test. We determined empirically that raters should stand either at the side or diagonal position, and relatively close to the targets. Our results indicate that one rater is probably sufficient, but that multiple raters can help when support is available. Future development in this area should compare the ratings of the servers themselves to a rater standing near targets as in our current instructions. If the server can reliably score themselves, it would make the test even more accessible and efficient. Also, we have evidence from Phase 5 that players could use just the right corner target, or the right corner and right middle targets, to efficiently represent their overall performance. This could cut the time demand, not just of performance but also for setup, by 50–75%, which would be of significant practical benefit. In a coaching situation, or in an education situation like grade school or secondary education physical education classes, this could allow instructors to quickly evaluate large groups of students at various points during the term.
For test administration, the area that most needs the further development is the familiarization and number of trials needed. Our aggregated data in Phase 5 provided mixed evidence about whether or not 15 trials were enough to overcome the learning effect in intermediate level players. Future research will also need to assess between-session reliability to determine how many times someone will need to perform this test before they see consistent results. As stated earlier, the samples used in this research represent intermediate level players only. It is possible that higher-skill-level players than were predominant in this sample could perform consistently within the allotted 15 trials, and potentially without extra familiarization sessions. A cross-sectional study with multiple sessions would ideally determine the learning effects for different skill levels of players.
Strengths and Limitations
The major strength of our work so far in developing this test is the iterative and successive use of multiple studies to hone the procedures of the test. This allowed for careful attention and refinement of key procedures like how many raters are needed and exactly where they should stand. Another strength is that we have utilized the test in multiple settings and populations, including singles and doubles pickleball players, as well as a range of ages and both sexes.
One limitation to the population we have used is in the range of pickleball player skill level. As described above, we purposefully used the inclusion criteria of players between 2.5 and 4.0 ratings, which represent the range of intermediate-level players. Some of the factors that we have tested, like inter-rater reliability, will likely hold up no matter what the skill level of players tested. However, the predictive validity of the test may change when used with beginner, advanced, or professional players. In terms of the test itself, the major remaining gap is in the inter-trial reliability and overcoming the learning effect. We will seek to address this in future studies of the development of this test.
Regarding the limited number of participants in the singles tournament (n = 6), the statistically significant finding (p < 0.001) indicates that there were a big effect and enough statistical power to detect the effect with such a small number of participants. We note that the mixed-effect model was used to analyze rally-level outcomes and estimated that the probability of winning a rally is 0.69 when one player’s original serve score is 1-point higher than the opponent. We believe that this pilot result is practically significant and hope that it can be reproduced in a larger study.
Author Contributions
Conceptualization, E.A.M., S.B.K. and J.J.A.; methodology, E.A.M., S.B.K., J.J.A. and G.K.B.; software, E.A.M.; validation, E.A.M. and S.B.K.; formal analysis, S.B.K.; investigation, E.A.M., S.B.K., J.J.A. and G.K.B.; resources, E.A.M., S.B.K. and G.K.B.; data curation, E.A.M. and S.B.K.; writing—original draft preparation, E.A.M. and S.B.K.; writing—review and editing, E.A.M., S.B.K., J.J.A. and G.K.B.; visualization, E.A.M.; supervision, E.A.M.; project administration, E.A.M.; funding acquisition, E.A.M., S.B.K. and G.K.B. All authors have read and agreed to the published version of the manuscript.
Funding
This research was funded by the CSUMB Research, Scholarship & Creative Activity Competition, grant number 835.
Institutional Review Board Statement
This study was conducted in accordance with the Declaration of Helsinki, and approved by the Institutional Review Board of Cal State Monterey Bay (protocol code 270, approved 13 February 2023).
Informed Consent Statement
Informed consent was obtained from all subjects involved in this study.
Data Availability Statement
The raw data supporting the conclusions of this article will be made available by the authors on request.
Acknowledgments
The authors would like to thank all who helped with data collection during this project: Guy Baz, Margaret Falknor, Natalie Fornito, Sean Gonzalez, Evan Hedrick, Ryan Merriam, and Luke Rockenbaugh.
Conflicts of Interest
The authors declare no conflict of interest.
Abbreviations
The following abbreviations are used in this manuscript:
| IRB | Institutional Review Board |
| ICC | Interclass-Correlation Coefficient |
| CI | Confidence Interval |
| AIC | Akaike Information Criterion |
| BIC | Bayesian Information Criterion |
| LC | Left corner target |
| LM | Left middle target |
| RM | Right middle target |
| RC | Right corner target |
| MAE | Mean absolute error |
References
- Sports & Fitness Industry Association. Sports, Fitness, and Leisure Activities Topline Participation Report; Sports & Fitness Industry Association: Laurel, MD, USA, 2024. [Google Scholar]
- Sports & Fitness Industry Association; Pickleheads. State of Pickleball: Participation & Infrastructure Report. 2024. Available online: https://www.sportstravelmagazine.com/sfia-and-pickleheads-release-participation-infrastructure-report/ (accessed on 13 April 2026).
- Michael, R.; Webster, C. Pickleball Assessment of Skill and Tactics. Strategies 2020, 33, 18–24. [Google Scholar] [CrossRef] [Scilit]
- Wasem, J. Pickleball: A Comprehensive Skills Test. Strategies 1994, 7, 21–25. [Google Scholar] [CrossRef] [Scilit]
- Wang, J. Comparison of Table Tennis Serve and Return Characteristics in the London and the Rio Olympics. Int. J. Perform. Anal. Sport 2019, 19, 683–697. [Google Scholar] [CrossRef] [Scilit]
- Abidin, Z.A.W.; Ruslan, N.A.S. Exploring the Importance of Players’ Characteristics and Performance on Serve and Return of Serve in Winning the Women’s Singles Grand Slam Tennis Tournaments. J. Phys. Conf. Ser. 2020, 1496, 012008. [Google Scholar] [CrossRef] [Scilit]
- Katsikadelis, M.; Pilianidis, T.; Mantzouranis, N. The Interaction between Serves and Match Winning in Table Tennis Players in the London 2012 Olympic Games. In The 13th ITTF Sports Science Congress; International Table Tennis Federation (ITTF): Lausanne, Switzerland; French Table Tennis Association (FFTT): Paris, France, 2013; pp. 75–77. [Google Scholar]
- Over, S.; O’donoughue, P. Analysis of Strategy and Tactics in Tennis. ITF Coach. Sport Sci. Rev. 2010, 18, 21–24. [Google Scholar] [CrossRef] [Scilit]
- Annesi, J.; Trinity, J. A Guide for Tennis Player Development: A Learning Progressions Approach; Enhanced Performance Technologies: Tampa, FL, USA, 1994. [Google Scholar]
- Koo, T.K.; Li, M.Y. A Guideline of Selecting and Reporting Intraclass Correlation Coefficients for Reliability Research. J. Chiropr. Med. 2016, 15, 155–163. [Google Scholar] [CrossRef] [Scilit] [PubMed]
- Kim, S.B.; Palominos, M.J.; Martin, E.A.; Beckham, G.K.; Annesi, J.J. Real-Time Application of Optimal Experimental Design to Study Factors Related to Doubles Pickleball Match Outcome. Int. J. Stat. Probab. 2025, 14, 24–33. [Google Scholar] [CrossRef] [Scilit]
- Julious, S.A. Inference and Estimation in a Changepoint Regression Problem. J. R. Stat. Soc. Ser. D (Stat.) 2001, 50, 51–61. [Google Scholar] [CrossRef] [Scilit]
- Panayides, P. Coefficient Alpha: Interpret with Caution. Eur. J. Psychol. 2013, 9, 687–696. [Google Scholar] [CrossRef] [Scilit]
- Morera, O.F.; Stokes, S.M. Coefficient A as a Measure of Test Score Reliability: Review of 3 Popular Misconceptions. Am. J. Public Health 2016, 106, 458–461. [Google Scholar] [CrossRef] [Scilit] [PubMed]

Disclaimer/Publisher’s Note: The statements, opinions and data contained in all publications are solely those of the individual author(s) and contributor(s) and not of MDPI and/or the editor(s). MDPI and/or the editor(s) disclaim responsibility for any injury to people or property resulting from any ideas, methods, instructions or products referred to in the content. |
© 2026 by the authors. Licensee MDPI, Basel, Switzerland. This article is an open access article distributed under the terms and conditions of the Creative Commons Attribution (CC BY) license.