


Abstract
Maritime transport is energy-efficient but remains heavily dependent on fossil fuels. Renewable electricity-based ammonia (e-NH3) has emerged as a promising alternative, particularly through small-scale, modular production. Assessing its economic viability is essential for future adoption, and techno-economic analysis offers a structured way to evaluate its feasibility. This study investigates the cost performance of a small-scale offshore e-NH3 plant of 2.4 tons per day (tpd) at the Port of Santander, Spain, based on nitrogen obtained via membrane separation and hydrogen from electrolysis of pretreated seawater. The results are based on process simulation outcomes obtained using ASPEN v14, and the detailed cost breakdown is derived from modular costing methodologies applied to preliminary process designs and sensitivity analyses of the levelized cost of ammonia (LCOA) with respect to the main variables. A comparative review of LCOA values reported in the literature for offshore and onshore e-NH3 plants is provided. An estimated CAPEX of 5.99 M EUR (equivalent to 0.53 M EUR/y), OPEX of 1.58 M EUR/y, and an LCOA of 2408 EUR/tNH3 are obtained, with equipment investment and operating costs identified as the most influential parameters. The results highlight the need for supraregional techno-economic studies considering optimal offshore wind availability within a collaborative interregional framework.
1. Introduction
Maritime transport plays a fundamental role in the global economy and remains one of the most energy-efficient modes of transportation. However, the sector is still almost entirely dependent on fossil fuels. In the International Energy Agency’s (IEA) Net Zero Emissions by 2050 Scenario, the use of renewable hydrogen and electrofuels (e-fuels) in the energy sector, primarily in transport, shows significant medium- to long-term growth potential, with projected expansion from near-zero levels today to 1.5 exajoules by 2030 [1].
The 2023 strategy of the International Maritime Organization (IMO) outlines several “levels of ambition”, including (i) reducing CO2 emissions per transport work by at least 40% by 2030 compared to 2008 levels and (ii) achieving net-zero greenhouse gas (GHG) emissions from international shipping by 2050, among other goals. Technological innovation and global adoption of alternative fuels and/or energy sources for international maritime transport will be essential to meeting these ambitions [2]. In parallel, the European Union’s FuelEU Maritime regulation aims to increase the share of renewable and low-carbon fuels in the maritime energy mix. This proposal seeks to reduce GHG emissions on board vessels up to 75% by 2050, thereby promoting the use of more sustainable fuels within the shipping sector [3].
In this context, hydrogen has been proposed as an energy carrier that can be produced in regions with abundant renewable resources and transported to areas where needed [4,5,6]. Nevertheless, the use of hydrogen presents significant challenges, including low volumetric energy density and complex conditions required for storage and transport. In order to overcome these limitations, other hydrogen-derived compounds have been proposed within the framework of Power-to-X (PtX) processes. These involve the conversion of renewable electricity into chemical products or e-fuels, known as Power-to-Fuel (PtF). Among these products, ammonia stands out due to its potential to serve as (i) an efficient energy carrier, (ii) a medium for electricity storage, (iii) a fuel for various applications such as maritime transport, and (iv) a feedstock for the chemical industry.
Ammonia represents a viable carbon-free, non-fossil fuel alternative for maritime transport over the medium to long term. Solid oxide fuel cells (SOFCs) as well as hybrid systems combining SOFCs with reciprocating engine generators have shown considerable potential for near-term deployment in marine applications [7,8]. A major advantage of ammonia lies in its well-established infrastructure for production, storage, and distribution owing to its long-standing use in the fertilizer industry. Nonetheless, the transition to green ammonia presents several challenges, including compliance with safety regulations, engine adaptation (e.g., dual-fuel configurations), scale-up/down capacity, and continued innovation in renewable energy technologies. Although such challenges are comparable to those faced by other emerging green fuels, proactive measures are essential to address these barriers and enable its broader adoption [9].
Several authors have conducted environmental impact studies and life cycle analyses on the use of e-NH3 as a marine fuel [10,11,12,13]. Although green ammonia may present a lower environmental impact compared to other fuels, these studies may show discrepancies depending on the methodology, case study, scope, impact categories, analysis boundaries, data, and assumptions employed. From a regulatory perspective, a significant barrier to the use of ammonia as a fuel may arise from future legal regulations in the maritime sector. In this regard, the IMO [14] is expected to approve interim guidelines for ammonia fuel use, providing the shipping industry with its first international standard for safe ammonia fuel operations.
One of the key aspects to consider for the future adoption of e-NH3 in maritime transport is its economic viability, given the significant economic risks associated with this fuel, as highlighted by Fullonton et al. [15]. Additionally, several factors have been identified as major challenges for the integration of green ammonia into the maritime supply chain, including safety, ammonia propulsion technology, fuel availability, uncertain regulatory framework, and intermittency and variability of renewable electricity generation from sources like solar and wind [16,17]. Despite the remaining challenges, the prospects for the production and use of e-ammonia as a maritime fuel may contribute to the achievement of the Sustainable Development Goals (SDGs), particularly SDG 7 (Affordable and Clean Energy) and SDG 13 (Climate Action), as it relies on renewable energy sources, atmospheric nitrogen, and water. Moreover, projections indicate that green ammonia could power up to 99% of the marine sector by 2050, underscoring its relevance to SDG9 (Industry, Innovation, and Infrastructure) [18,19,20].
Currently, there is no fully mature application of liquid ammonia carriers in ship transportation [21]. However, several authors have explored the use of ammonia as a marine fuel. Inal et al. [22] provided evidence that ammonia is the most suitable zero-carbon fuel for the application of the marine fuel cell. The review by Machaj et al. [23] discussed ammonia from technological, scientific, economic, and regulatory perspectives, presenting a technical justification for using solid oxide fuel cells to enhance energy conversion efficiency. In Braun et al. [24], the feasibility of using ammonia as a green fuel for inland waterway vessels was assessed, highlighting onboard hydrogen release, ammonia–hydrogen combustion in internal combustion engines (ICEs), and thermal integration. The study concludes that small- and medium-sized ships can operate effectively with proper system integration. Wang Z et al. [25] proposed a green ship power system based on H2 and NH3 using a “demand–configuration–integration–evaluation” framework, identifying six key requirements for zero-carbon fuel ships: emissions, power, cost, safety, volume, and noise. Caprace et al. [26] revealed that shipowners prioritize biofuels while higher-cost alternatives like ammonia remain economically unviable without additional policy support. Wang and Li [27] shows that ammonia-based fuels serve as transitional solutions to adopting sustainable transportation solutions, showcasing their long-term potential for zero-emission shipping. Currently, there are few examples of commercial applications for ammonia on ships, such as the Norwegian Viking Energy and the Scandinavian MS Green Ammonia; however, several ammonia-powered and dual-fuel vessels are expected to enter operation in 2026, following advances made across the ammonia fuel value chain [17,28].
Supportive policies for demonstration projects, fundamental R&D, and case study analyses will help reduce cost-related barriers and facilitate the implementation of regulations that ensure a level playing field for e-fuels in comparison with conventional alternatives. Techno-economic analysis applied to e-ammonia production methods enables the assessment of their technical readiness and economic viability and can identify key technical and financial barriers to its implementation. In particular, small-scale production, along with modularity and mild operating conditions, are of special interest for the sustainable production of e-ammonia. This modular approach allows for progressive, flexible, and decentralized development of production units, reducing technological and economic risks while facilitating integration with renewable energy sources. Furthermore, small-scale analysis enables experimental validation and controlled scaling, which are key factors for accelerating the industrial adoption of sustainable solutions within the framework of global decarbonization.
The wide range of potential applications for e-NH3 is currently driving the planning of numerous production projects linked to the generation of e-H2 from renewable energy sources. Of particular interest is the use of e-NH3 for heavy-duty, long-haul segments in the maritime transport sector [29,30]. In this context, both at the Spanish national level and within the Cantabria region (Northern Spain on the coast of the Cantabrian Sea), various activities related to the marine energy value chain are being developed on a small scale such, as the Bahia H2 project and Cantabria Sea of Innovation cluster [31,32].
Nevertheless, techno-economic studies on small-scale offshore e-NH3 production remain relatively scarce in the international literature. Existing studies on green ammonia mainly focus on large onshore plants and address process design, costs, and site constraints separately, leaving a lack of integrated assessments for small-scale modular e-NH3 production under location-specific offshore conditions. To fill this gap, the main purpose of this study is to assess the costs associated with the small-scale offshore production of e-NH3 at a rate of 2.4 tpd (100 kg/h), based on nitrogen obtained via membrane separation and hydrogen produced through electrolysis. All e-NH3 processing units would be located on an offshore platform in the Port of Santander (Cantabria, Spain); this platform is situated at sea but immediately adjacent to the port, and the wind turbines would be situated at a maritime buoy 22 miles from the Port of Santander. The relevance and novelty of this work lie in the combined evaluation of process simulation, modular cost assessment, and location-specific offshore constraints to determine the economic viability of small-scale, decentralized e-NH3 production. The findings aim to support policymakers in promoting e-ammonia as a sustainable energy solution for maritime transport.
2. Literature Review of e-NH3 Production Cost Assessment
A comparative overview of research works related to green ammonia production plants has been conducted for both offshore (Table 1a) and onshore (Table 1b), organized by increasing production capacity. This literature analysis includes production capacity (in tons per day, tpd), Capital Expenditure (CAPEX), electricity cost, Operational Expenditure (OPEX), and the levelized cost of ammonia (LCOA), as well as contextual details and references. To ensure comparability, the economic data extracted from the different studies were first updated to constant 2024 prices to account for inflation and subsequently converted into euros.
Firstly, offshore plants (Table 1a) typically show lower production capacities, with many plants producing below 300 tpd, though one large-scale scenario reached 2740 tpd [33]. On the contrary, onshore plants (Table 1b) include a wider range of scales, from small pilot plants (<10 tpd) to industrial-scale facilities (>3000 tpd). This suggests that onshore plants are currently more scalable.
Regarding the costs, it can be observed that in both offshore and onshore cases CAPEX per tpd tends to decrease with increasing plant scale, although there is a wide variability depending on the technology and the location. At very large scales (approaching 3000 tpd), CAPEX decreases more, suggesting that huge scale production is the most cost-effective configuration. Offshore plants’ CAPEX is, in general, a higher per unit of production than that of onshore plants. The need for specialized infrastructure, such as wind turbines or offshore platforms, significantly increases capital costs.
Small-scale demonstrators or pilot plants exhibit high capital costs per ton of daily ammonia. At very low capacities (<20 tpd), the CAPEX can be as high as that of large-capacity plants. This is due to the fact that infrastructure, equipment, and other systems are often similar in complexity and cost to larger installations but are amortized over a much smaller volume of production. The small-scale plants are typically early-stage or experimental projects and not optimized for economic performance.
In relation to OPEX, smaller installations, particularly those offshore or in remote locations, tend to have a higher relative OPEX due to operational complexity, maintenance, and logistical costs. In contrast, larger plants, especially those with stable energy supply and infrastructure (typically onshore), have lower OPEX percentages (Table 1a,b). This is consistent with the fact that larger systems spread fixed operational costs over a higher production volume. For instance, some large-scale systems explicitly report OPEX as low as 2% of CAPEX per year [34].
These relationships between plant scale, CAPEX, and OPEX are reflected in the LCOA (Table 1a,b). Plants with low production capacity and high unit CAPEX/OPEX report high values of LCOAs, around 1000–4000 EUR/tNH3, which are economically uncompetitive when compared with typical conventional large-scale (260–500 EUR/tNH3) or low-scale (≃520–1000 EUR/tNH3 applying the six-tenths rule to scale down) grey ammonia production based on natural gas reforming [34,35,36].
It is also worth noting that electricity cost, shown in Table 1a,b, is included in OPEX calculation, and it is a major cost driver in LCOA. Offshore production heavily depends on wind or hybrid renewable sources; therefore, site selection with favorable wind profiles and shorter distances to shore can reduce the values of LCOA. In optimal conditions (e.g., strong wind or proximity to grid), LCOA could potentially reach levels below 800 EUR/tNH3, approaching the cost of grey ammonia in some markets [37].
Although the comparability of the data presented in Table 1a,b may be affected by differences in the assumptions adopted across the studies, such as system boundaries, energy sources, process units, and technology types, the data show that green ammonia production is becoming more developed, especially for onshore plants, which are currently more cost-effective and easier to scale up. Offshore plants have potential, especially for energy integration and decentralized production, but they still face high costs and technical challenges that must be addressed for wider adoption. The studies summarized in Table 1a,b show a general consensus regarding the significant potential of e-NH3 to serve as an efficient energy carrier, a medium for electricity storage, a fuel for various applications, and a feedstock for the chemical industry.
All references of Table 1a,b (except the ASPIRE demonstrator plant [38]) correspond to conceptual studies and simulations of ammonia production plants; the approach of these references enables the analysis of different scenarios, including plant topology, curtailment, energy sources, electricity cost scenarios, electrolyzer costs, and ammonia production rates, among others, as well as the development of economic projections for the future. In addition to the references included in Table 1, numerous e-NH3 production projects have been announced worldwide, with capacities ranging from 400 tpd to 60,000 tpd; most of these projects remain in early development stages, with operations generally expected to begin around 2030. However, significant uncertainty remains, and some of these projects may ultimately not be realized or constructed [30]. Several authors [39,40,41,42] have compiled relevant projects for ammonia production from electrolysis powered by renewable energy at pilot and demonstration plant scale, typically with production capacities below 1 tpd. Alongside pilot and demonstration plants, several compact commercial systems for onshore e-NH3 production have recently emerged. These containerized or modular plants, developed by companies such as Ammpower, FuelPositive, Atmonia, Kapsom, and Thyssenkrupp [43,44,45,46,47], target small-scale decentralized ammonia production, typically integrating renewable electricity with water electrolysis. Current designs range from approximately 12.5 kg/h to over 2000 kg/h of NH3, with scalable modular configurations and, in some cases, incorporating novel electrochemical processes for direct ammonia synthesis.
A growing body of additional techno-economic studies, not included in Table 1a,b, has conducted comparative analyses of the global potential for green ammonia production. These studies examine a large number of locations and countries in diverse geographic regions worldwide, addressing a large number of scenarios that provide a huge amount of data beyond of the scope of Table 1a,b [33,48,49,50,51,52]. They are framed within a global context characterized by substantial renewable energy potential, an urgent need to mitigate CO2 emissions, and a growing worldwide demand for both energy and fertilizers. In this context, e-NH3 emerges as a promising energy carrier and a key chemical feedstock for sustainable fertilizer production. These analyses explore various renewable energy sources and system configurations encompassing production, transportation, and distribution, adopting a full supply chain perspective to identify geographically favorable locations and to project production costs up to 2050. Although projected LCOA can vary widely, within the range of approximately 2000–260 EUR/tNH3, several future scenarios indicate that e-NH3 could achieve cost competitiveness with conventional fossil-based ammonia.
Table 1.
(a) Comparative overview of e-NH3 production offshore plants cost assessment. (Monetary units expressed in updated 2024 euros.) (b) Comparative overview of e-NH3 production onshore plants cost assessment. (Monetary units expressed in updated 2024 euros.)
3. Process Description
The e-ammonia production plant under study comprises four sequential units: seawater purification, H2 generation, air separation, and NH3 synthesis (Figure 1). The power supply required for the plant will be provided by offshore wind energy. Due to the intermittency of renewable energy supply, storage systems for H2 and electricity are required. The plant is designed for a production capacity of 100 kg/h (2.4 tpd) of ammonia with a minimum purity of 99.6%, using a 1.5 MW electrolyzer. The diverse techno-economic studies on e-ammonia production presented in Table 1a,b show that the economic assessment of this process is site-specific. Therefore, the Port of Santander in the Cantabria Region, Spain, was selected as a case study for the development of the techno-economic analysis.
Figure 1.
Boundary of the studied e-ammonia plant.
The supply of purified water is ensured through a reverse osmosis (RO) unit, a technology characterized by relatively low energy consumption and cost, capable of providing water with a total dissolved solids (TDS) content of less than 3 ppm and conductivity below 5 µS/cm, as required for alkaline electrolysis [75,76]. The unit consists of pretreatment via dissolved air flotation (DAF) coupled with a stage of dual media filtration, high-pressure pumps, and a membrane array housed in pressure vessels. DAF equipment is an effective pretreatment system for seawater desalination, commonly employed as water pretreatment for RO desalination systems [77,78,79]. The DAF system, when combined with filtration, is particularly efficient in removing algal cells, oil and grease, and suspended solids present in seawater. Reported removal efficiencies range from 90 to 98% for suspended solids and exceed 99% for algal removal [80,81,82].
The air separation unit (ASU), which provides the N2 required for synthesis, is based on membrane separation technology, the preferred alternative for small-scale systems [83,84]. An optimal configuration is proposed using three membrane modules to achieve a nitrogen purity of 99.9% [85,86]. In addition to the membrane modules, the main components of the ASU include compressors, vacuum pumps, and heat exchangers.
Alkaline electrolysis (AEL) is the selected technology in this study for hydrogen production [5,65], yielding hydrogen at 99.5% purity and a pressure of 30 bar. Alkaline electrolyzer stacks enable flexible operation, with the ability to rapidly ramp up or down and operate across a wide range of conditions. These characteristics are essential for effectively managing the variability and intermittency associated with renewable energy sources. In addition to the alkaline electrolyzer cell, the unit includes pumps, heat exchangers, and flash equipment.
The synthesis unit is based on the Haber–Bosch (HB) process and includes compressors, reactors, heat exchangers, a synthesis loop with recycle and purge streams, and flash equipment. The unit is designed with a configuration of two reactors in series operating at pressures between 205 and 250 bar [87]. The produced ammonia would be stored at the Port of Santander facilities, in parallel with the existing liquefied natural gas storage infrastructure used for current maritime transport.
Gaseous hydrogen storage is presently the most widely employed technology for storing hydrogen. Medium-to-low-pressure storage aligns well with the pressure of hydrogen gas generated by the electrolyzer [68]. For this study, a 3 MPa low-pressure hydrogen storage spherical tank was chosen as the hydrogen storage equipment. For energy storage, a fully integrated modular system consisting of rechargeable lithium-ion batteries with high energy density, long service life, and high efficiency was selected, intended for wind energy integration. The system can operate as a microgrid to support backup and islanded operations. All described units will be located on an offshore platform situated in the Port of Santander, Spain.
In Figure 2, the process diagram is shown, with the four process units distinguished by different colors and all the equipment included.
Figure 2.
Process Flow Diagram of the studied e-NH3 plant.
4. Methodology
The applied methodology follows a structured approach for estimating the costs of the ammonia production plant, integrating process simulation, equipment sizing and costing, and Capital and Operating Expenditures estimation. The process involves different key steps, from mass and energy balances analysis to the final estimation of the LCOA.
The four units that comprise the e-ammonia production plant are steady-state simulated using Aspen Plus® Version 14 software. The process simulation is based on a previous work of the research team [87], incorporating a seawater desalination unit and implementing heat integration within the Haber–Bosch synthesis unit. The process analysis enables the determination of the mass and energy balances as well as the operating conditions, which is the basis for equipment sizing and costs estimating.
The design of the various units across the process flowsheet—such as storage tanks, flash separators, and heat exchangers—is carried out based on standard design methodologies described by Sinnott and Towler [88] and Biegler et al. [89]. Pumps and compressors are sized according to their power requirements, while the Haber–Bosch (HB) reactors are designed based on kinetic models available in the literature [34,90]. The sizing of the desalination unit (including pretreatment and reverse osmosis) and the air separation unit (ASU, using membrane modules) is performed by specific design correlations [87,91].
For preliminary equipment cost estimation, the Guthrie modular method is employed to account for both direct and indirect costs. This module costing technique is particularly suitable for early-stage feasibility studies and is widely adopted in chemical process design due to its flexibility and ease of use. This method yields the updated Bare Module Cost (BMC), which incorporates correction factors for material type, operating pressure, equipment complexity, installation costs, and monetary update to 2024 values [89]. In addition, equipment cost correlations provided by Seider et al. [92] are applied. A detailed breakdown of the formula used to calculate the BMC for each equipment type is provided in the Table S1 of the Supporting Information.
Given the rapid technological development of electrolyzers and electricity and hydrogen storage systems, together with the scarcity of reliable cost data for platforms hosting offshore NH3 production, the authors opted for a state-of-the-art literature review of these costs rather than relying on preliminary modular cost estimation methods. Thus, the cost estimation of the electrolyzer, the storage systems, and the platform was carried out through a dedicated literature review described in Section 5.2.1, Section 5.2.2 and Section 5.2.3, respectively.
4.1. Capital Expenditures (CAPEX) and Operating Expenditures (OPEX)
The CAPEX of the designed plant includes the Total Permanent Investment (TPI) and the Working Capital (WC), as described in Equation (1). The TPI is calculated as a function of the BMC and the platform acquisition cost and encompasses all investments required for plant construction and commissioning, including equipment procurement, installation, and project development. The Working Capital was estimated at 5% of the TPI for a simple, single-product process without product storage, following the guidelines of Sinnott and Towler [88]. The commonly used Capital Recovery Factor (Equation (2)) allows the annualization of CAPEX as a function of the annual discount rate (i) and the plant lifetime (PL) [93].
The estimation of operating expenditures (OPEX) accounts for yearly operating costs and comprises the sum of direct manufacturing costs (DMC), fixed manufacturing costs (FMC), and general expenses (GE). Each of these components can be estimated using the updated Bare Module Cost (BMC), cost of operating labor (COL), cost of utilities (CUT), cost of waste treatment (CWT), and cost of raw materials (CRM) by applying appropriate multiplication factors as described in Equation (3) [93]. CWT and CRM are equal to zero.
For the estimation of operating labor, the rule-of-thumb presented in Equation (4) was applied, where P represents the number of processing steps involving solids handling—zero in this case—and Nnp is the number of non-particulate processing steps. The operator salary was sourced from the 21st General Collective Agreement for the Chemical Industry in Spain for the year 2024 [94]. The utility cost in this study includes the electricity consumption of all electrically driven equipment. An average electricity price of 0.0199 EUR/kWh was assumed, corresponding to the mean wind energy price in Spain in 2024 compared to the average wholesale electricity market price of 0.06303 EUR/kWh [95]. The waste streams in the electric ammonia plant consist primarily of brine from the RO unit and oxygen and argon streams from air separation and electrolysis units. All waste streams are assumed to be environmentally friendly, and hence, waste treatment costs are considered negligible. The cost of raw materials is not included, as seawater and atmospheric air are used for ammonia production.
4.2. Levelized Cost of Ammonia (LCOA)
LCOA in EUR/tNH3 is the sum of the present value of the CAPEX and the OPEX over the lifetime of the system, divided by the total ammonia production (Equation (5)). This cost metric enables direct comparison with values reported in scientific literature, providing a benchmark for economic feasibility.
where i is the discount rate (%), PL the plant lifetime (years), and F is the yearly ammonia production (t/year).
The main economic assumptions regarding capital and operating cost estimation and LCOA are presented in Table 2.
Table 2.
Economic evaluation assumptions.
5. Results and Discussion
This section presents the simulation, sizing, and costing results of the 2.4 tpd of e-ammonia production plant, assuming its location at the Port of Santander, in the Cantabria Region, Spain. All economic values in this study are expressed in 2024 euros.
5.1. Process Analysis: Mass and Energy Flows and Operating Conditions
The process simulation yields the mass and energy balances, the feedstock and utility requirements, as well as the operating conditions necessary for equipment sizing. The input materials for the production process include 544 kg/h of seawater supplied to the RO unit and 120.5 kg/h of air to the air separation unit (ASU). Additionally, 14.4 kg/h of compressed air is required for the DAF pretreatment system.
The simulation of the desalination unit consists of a DAF system, filtration, and RO. The membrane module for desalination was simulated in Aspen Custom Modeler (ACM) and subsequently exported to Aspen Plus to construct a flowsheet model of a two-stage seawater desalination system with energy recovery via a pressure exchanger. Seawater is mixed with compressed air in a DAF unit, where air bubbles injected at 3 bars attach to suspended solids, enabling them to float to the surface. The DAF unit is modelled as a “Flash3” block, which allows representation of a third solid phase. These suspended solids, being a complex mixture of organic and inorganic compounds, were defined as a nonconventional component because their composition is not represented by a simple chemical formula but rather by their elemental analysis and higher heating value (HHV). The user must provide these inputs to Aspen Plus to enable estimation of physical properties such as density and enthalpy. In this work, data corresponding to algae were considered, with a concentration of 20 mg/L [96]. The clarified water is directed to a dual-media filtration (DMF) system consisting of anthracite and sand and then subsequently split into two streams. The upper stream is pumped to the pressure exchanger (PX), where it receives energy from the retentate of the first reverse osmosis stage (RO-1); the lower stream is pressurized to match the outlet pressure of the PX, ensuring proper pressure balance in the downstream mixer. The reverse osmosis system, with a total membrane area of 8 m2, achieves a recovery of 32% in a configuration closely resembling that of commercial reverse osmosis systems [97]. The desalination unit delivers 164 kg/h of water suitable for AEC electrolysis, with a TDS content of 1.5 ppm and an electrical conductivity of 2.8 µS/cm. This is achieved from an input flow of 544 kg/h of seawater with an initial TDS of 35,000 ppm and a conductivity of 71,000 µS/cm [98].
For small-scale systems, membrane permeation is the preferred option for nitrogen production. These systems typically include three membrane modules and compression or vacuum equipment to handle the feed and permeate streams [84,85,86]. The ASU unit is based on three membrane modules with a total membrane area of 444 m2. Air is compressed to 2.9 bar and heated before entering the first membrane module (MOD1), producing an oxygen-enriched permeate. The retentate sequentially feeds MOD2 and MOD3, where high-purity nitrogen (99.9% molar) is obtained. The permeates from MOD2 and MOD3 are recompressed and recirculated to the preceding modules, while vacuum pumps maintain the pressure gradient of 0.2 bar required for efficient oxygen permeation. The membrane modules are simulated using the “Sep” block, which enables separation based on the component fluxes. In this work, the fluxes are determined according to the membrane area and the permeability values of commercial membranes [87]. The unit delivers a nitrogen stream of 85 kg/h with a purity of 99.9%.
Considering small-scale systems, alkaline electrolysis was selected in this study as the hydrogen production technology. An aqueous stream containing 35 wt% potassium hydroxide is fed to the alkaline electrolyzer, yielding two gaseous output streams: hydrogen at the cathode and oxygen at the anode. The potassium hydroxide solution is continuously recirculated, while the water consumed during electrolysis is replaced. Subsequently, the O2 and H2 streams are purified to obtain high-purity gases (>99.5%). The liquid streams from the flash unit are recirculated to the process and a safety purge is implemented to maintain stable feed conditions to the electrolyzer. For the “electrolyzer” block, a physical model available in Aspen Plus® V14 was employed. The unit was designed based on specifications provided in the technical data sheets of commercial electrolyzers. The alkaline electrolysis process produces 18.4 kg/h of hydrogen with a purity of 99.94%, operating at 30 bar and 60 °C.
The Haber–Bosch unit consists of a compressor that pressurizes the synthesis loop, a reactor system for converting H2 and N2 gases into NH3, a heat exchanger that utilizes the exothermic heat of reaction to preheat the reactor feed stream, a condensation-based separation system to extract ammonia from the product stream, and recycle and purge lines to recover unreacted H2 and N2 while removing inert gases to prevent accumulation in the loop. In the present work, the reactors were modeled using an “RPLUG” block in Aspen Plus V14, according to de la Hera et al. [87]. The HB plant design developed in this work includes two heat exchangers between process streams, which allow the reactor inlet streams to reach the optimal reaction temperatures required to maximize conversion while maintaining suitable reaction rates. This heat integration reduces the overall energy demand of the unit, which is mainly concentrated in the coolers located upstream of the ammonia separation systems (Figure 2). The Haber–Bosch unit operates in a dual-reactor configuration [87], producing 100 kg/h of ammonia with a purity of 99.6%. In Table 3, the main material and energy flows obtained are summarized. Figure 2 and Table 3 summarize the key findings regarding plant topology, operating conditions, and mass and energy balance results after the discussion of equipment selection and operating parameters.
Table 3.
Main material and energy flows.
The overall specific energy consumption of the e-ammonia plant is estimated at 10.55 kWh/kg NH3, of which 94.8% corresponds to hydrogen production, 3.9% to ammonia synthesis, 0.5% to nitrogen production, and 0.9% to seawater desalination, as can be observed in Figure 3. Under regular operating conditions, the electrolyzer alone requires most of the electrical power, which is significantly higher than the consumption of the other process units and clearly dominates the plant’s overall energy demand.
Figure 3.
Energy requirements of process units of the studied e-NH3 plant.
To reduce the overall energy consumption of the plant, two energy integration strategies are proposed: the use of a pressure exchanger (PX) in the desalination plant and the implementation of heat integration through shell-and-tube heat exchangers (HX1; HX2) in the ammonia synthesis unit. The energy recovery system employed in seawater reverse osmosis is a PX, in which hydraulic energy is recovered by transferring pressure from the high-pressure brine reject stream (retentate) to the feed stream, using only one moving part [99]. The equipment cost estimation is based on data reported by Timur et al. [100] and Wang et al. [101], extrapolated to the purified water production levels considered in the present study and complemented with purchase cost correlations for a liquid expander [92]. The installed equipment cost falls within the range of 3900–10,000 EUR depending on the model, efficiency, pressure, and local conditions, with a value of 7000 EUR adopted in this work for a very small plant without economies of scale. This price corresponds to that of small-sized commercial units available on the market [102].
The heat exchangers in the Haber–Bosch unit enable heat integration between process streams by preheating the inlet streams to the first reaction stage (RX1) using the hot outlet streams from the two reactors; these hot streams are subsequently cooled in HX1 before entering the flash unit (F5) and in HX2 before entering the second reaction stage (RX2).
5.2. Equipment Sizing and Costing
Equipment sizing is the basis step for a reliable economic assessment. The sizing of each unit operation depends on the results of process mass and/or energy balances, depending on the type and function of the equipment. In Table S1 of the Supporting Information, the equipment sizing parameters are included, organized by each unit of the ammonia production plant. Table S2 of the Supporting Information includes the obtained values of the sizing parameters of the different equipment. Based on these parameters, the investment and operating costs of the plant are estimated as well as the LCOA. All prices in this study are expressed in 2024 euros, adjusted for inflation using the average value of 799.1 from the Chemical Engineering Plant Cost Index (CEPCI) of 2024 [103].
The application of the Guthrie modular method for cost estimation, combined with the equipment cost correlations provided by Seider et al. [92], enables the estimation of installed equipment costs (Bare Module Cost, BMC), which are shown in Table S3 of the Supporting Information.
The costs of the electrolyzer, the hydrogen and energy storage, and the offshore platform are analyzed separately and discussed in the following sections.
5.2.1. Electrolyzer Cost
The estimation of electrolyzer capital costs presents a significant challenge due to several factors, including the technology employed, economies of scale, production capacity, and future cost projections. Table 4 compiles bibliographic data on current and projected costs of alkaline electrolysis (AEL) systems, with particular focus on small-scale units around 1–2 MW. Costs are primarily dependent on the specific technology and plant capacity, with reported estimates varying up to an order of magnitude in EUR/kW.
The work of Reksten et al. [104] provides a useful model for estimating the CAPEX of alkaline electrolyzer plants up to 10 MW, incorporating both scale factors and learning rates. Based on this model, the average current reference cost of a 1.5 MW alkaline electrolyzer is assumed to be 1000 EUR/kW, representing a conservative assumption for present-day installations. However, other studies [105,106,107] incorporate expert elicitation from both academia and industry and account for variables such as production scalability, electricity market size, reference prices, and varying intensities of research and development. As shown by Gallardo et al. [108], using data from 2015 to 2017 for electrolyzers ranging from kW scale to a few MW, the cost curve is significantly steep (exceeding >9 k US USD/kW for very small systems), decreasing to approximately 0.9 k USD/kW for scales between 1–2 MW and exhibiting high scaling exponents up to 0.5.
Overall, the literature summarized in Table 4 indicates that current specific investment costs for MW-scale alkaline electrolyzers are typically between 600 and 900 EUR/kW, with a median value of approximately 750 EUR/kW is highlighted as a relevant finding from the literature review of electrolyzer technology. For systems of around 1 MW, this median value can be considered representative of present market conditions. Future projections suggest further cost reductions driven by technological advancements and scaling effects, with estimates for 2030 ranging from 160 to 1300 EUR/kW (median: 700 EUR/kW) and for 2050 range between 225 and 393 EUR/kW. Based on the median literature value, 750 EUR/kW has been adopted, resulting in an estimated electrolyzer capital cost of 1.125 M EUR.
Table 4.
Capital costs of alkaline electrolyzers (AEL). Values for ≈1 MW capacity are highlighted in green.
5.2.2. Energy Management Strategy and Hydrogen Storage
The energy management strategy is determined by the availability of wind energy for both the electrolyzer and the remaining units of the ammonia production plant. An hourly assessment covering the period from September 2020 to March 2021—the most recent period with available wind speed data provided by the Augusto Linares buoy, located 22 nautical miles north of Santander city (43°50.67′ N, 03°46.2′ O)—was conducted to evaluate energy availability. The analysis indicates that, assuming a planned offshore wind farm composed of seven 1.5 MW wind turbines, the minimum hydrogen storage requirement to ensure continuous plant operation is 2423 kg (Figure 4). The analyzed period time in Figure 4 is autumn and winter time, which is the part of the year with slightly higher wind velocity, and it can be observed that for the continuous production of the e-NH3, the lower the number of wind turbines, the higher the surplus of H2 and therefore the higher the storage costs.
Figure 4.
Hydrogen storage requirements as a function of installed offshore wind energy capacity located in the Santander coastline.
Reported values of hydrogen storage cover a wide range from 175 to 1300 EUR/kg depending on the scale and the pressure [35,108,120]. For the low-pressure hydrogen storage tank chosen in the present study, a cost assumption of 350 EUR/kg is taken, resulting in an estimated investment of EUR 848,050 to ensure continuous ammonia production; this value is similar to that obtained using the cost correlation to estimate the purchase cost of a gas holder provided by Seider et al. [92].
The required battery energy storage capacity to ensure uninterrupted ammonia production is four days, corresponding to the longest consecutive period with wind speeds below 4 m/s [98] since wind turbines cannot operate under such conditions. When wind speeds range between 4 and 8.5 m/s, hydrogen is produced proportionally to the available power; when wind speeds exceed 8.5 m/s, the electrolyzer operates at its maximum hydrogen production capacity, enabling hydrogen storage, while surplus electrical power is used to recharge the batteries.
Additionally, the cost of energy storage for a 4-day period to maintain the electrolyzer at its minimum operating capacity of 30% is estimated at EUR 144,520. This estimation assumes nominal ammonia production sustained with the stored hydrogen, based on a capital cost of 100 EUR/kWh for lithium-ion battery racks considering high-growth projections for battery deployment [121]; a nominal capacity of 372.7 kWh [122] and a specific energy consumption of 3.55 kWh/kgNH3, which corresponds to the fraction that must be stored to maintain 30% operation, are considered.
It is important to remark that the wind conditions under study (at the Augusto Linares buoy) are moderate since the wind velocity is lower than 6 m/s for a large part of the year; these adverse conditions show that a better location would be recommendable for the e-NH3 plant to reduce storage costs. A new location should be sought according to the Spanish government’s proposal [31], which defines the areas where off-shore wind farms can be installed. Asturias and Galicia regions, which are two Cantabrian Sea communities close to the Cantabria Region, have designated areas where offshore wind development is permitted. Those designated areas exhibit favorable wind conditions, enabling a reduction in the required number of wind turbines to below half of the installations proposed in the present study; the detailed cost analysis of the other locations will be carried out in the future.
5.2.3. Platform Costs
The capital costs of offshore platforms are estimated based on the construction costs of offshore oil rigs. Jack-up and semisubmersible platforms are considered for fixed and floating structures, respectively. Wang et al. [37] estimated platform costs using correlations provided by Kaiser et al. [123], which are functions of production capacity, water depth, and delivery year. These correlations are defined for platforms with a typical area ranging from 4000 to 8500 m2. Given a minimum draft of 9 m at the Port of Santander and an ammonia production capacity of 2.4 tpd, these correlations yield a cost of USD 74.4 million for a jack-up platform. However, the space required for the projected plant is conservatively estimated at 200 m2, accounting for the equipment footprint and the necessary space for piping, valves, control and safety systems, and access. This estimated area aligns with the order of magnitude of modular ammonia production units offered by companies such as AmmPower [43], FuelPositive [44], and Kapsom [45] for small-scale ammonia production. Therefore, a preliminary platform cost of EUR 2 million is estimated for the present study as a key result of the analysis.
5.2.4. Equipment Cost Distribution
First, the Bare Module Cost of each piece of equipment was calculated as detailed in the methodology. The values obtained from these cost estimations are summarized in Table S3 provided in the Supporting Information. A total equipment cost of approximately EUR3.2 M is distributed among desalination, air separation, electrolysis, synthesis (Haber–Bosch process), and hydrogen/energy storage.
Figure 5 illustrates the Bare Module Cost (BMC) associated with the main process units involved in the green ammonia production plant proposed in this study. The cost allocation highlights the relative economic weight of each technological component in the overall system.
Figure 5.
Equipment cost distribution among process units.
The electrolysis unit represents the largest investment share, accounting for EUR 1,351,976 (42%) of the total cost. The hydrogen storage system is the second most expensive unit at EUR 848,050 (26%) due to high-pressure rating and material constraints. This result aligns with the known capital-intensive nature of water electrolysis systems for obtaining H2 and storing it. Reducing the cost of electrolyzers and H2 storage remains one of the main challenges for improving the competitiveness of green ammonia production plants. Locating the e-NH3 plant in an area with superior wind-energy potential, combined with anticipated decreases in electrolysis technology costs, will help reduce these expenditure categories.
The air separation unit (ASU), responsible for nitrogen production, contributes EUR 412,733 (13%). The ASU requires significant capital investment due to compressors and membrane separation system. The Haber–Bosch synthesis unit accounts for EUR 355,145 (11%) of the investment. Within this unit, the compressors constitute the largest share of the cost due to the high operating pressure required by the process. Finally, the desalination unit has the smallest economic impact of only EUR 105,721 (6%) of the total cost. Although it is essential for supplying demineralized water to the electrolyzer, its contribution is relatively low thanks to the availability and technological maturity of reverse osmosis systems. Energy storage in battery racks account for EUR 144,520 and 4% of the total BMC.
To complement the process unit distribution cost, Figure 6 shows the BMC of all the equipment classified by type. Overall, the cost breakdown confirms that hydrogen-related technologies (production + storage) dominate the equipment investment, representing more than 60% of total equipment cost. As a result of the obtained equipment cost breakdown, future cost-reduction strategies for green ammonia should prioritize improvements in electrolyzer performance and hydrogen storage optimization.
Figure 6.
Equipment cost distribution by equipment type.
5.3. CAPEX and OPEX
Once the BMC is obtained, the CAPEX can be calculated based on Equation (1). The resulting CAPEX for the plant is EUR 5.99 M. When annualized, this corresponds to a value of EUR 0.53 M per year. On the other hand, the resulting total OPEX is close to EUR 1.58 M per year. This demonstrates that the economic performance of the process will be primarily driven by operating costs over its lifetime.
Figure 7 presents the distribution of annualized CAPEX and OPEX for the proposed plant, including the percentage distribution of each cost component. Overall, the figure highlights that OPEX represents the major contribution to the total yearly cost of the plant, significantly exceeding the CAPEX when this is annualized. This indicates that long-term operating efficiency will play a crucial role in the economic performance of the plant.
Figure 7.
CAPEX and OPEX of the proposed e-NH3 plant.
The lower section of the bars corresponds to the annualized CAPEX components, including the equipment cost investment, working capital, and platform-related costs. It can be observed that the equipment investment clearly dominates the CAPEX. This result is aligned with industry expectations, as the installed equipment cost usually accounts for the largest share of the investment in chemical facilities. The platform-related costs contribute 33% of annualized CAPEX, highlighting the significant impact of site preparation.
The upper section of the bars shows the OPEX. These include equipment operation costs (0.26·∑BMC), labor costs (2.18·COL), and utilities (1.075·CUT). The results confirm that equipment operational costs, which can include maintenance and repair, are the most influential factor in the overall operating costs, contributing 53% of total OPEX. Nevertheless, the equation used for OPEX estimation (Equation (3)) includes multiplicative coefficients applied to the terms ∑BMC, COL, and CUT that vary depending on the values associated with the individual components of these terms [93]. Therefore, a sensitivity analysis is considered necessary to assess the influence of variations in these parameters on the final cost of the plant.
Utilities represent 35% of OPEX, highlighting the energy-intensive nature of the process and the need to implement heat-integration and efficiency optimization strategies to control long-term expenses. Labor costs, although important, account for only 12%, suggesting a moderate staffing level or a high degree of process automation in a such as small-scale plant production.
Overall, the comparison between CAPEX and OPEX highlights that 75% of the total annual cost of the plant is associated with OPEX. Consequently, based on the obtained results, improvements in operational efficiency, such as optimizing maintenance and minimizing resource and consumable use, may offer potential for cost reduction. While CAPEX-related measures can support initial economic feasibility, the long-term profitability of the plant strongly depends on controlling operating expenses throughout the lifecycle of the facility.
5.4. Levelized Cost of Ammonia (LCOA) Results
The LCOA is a widely used metric to evaluate the economic performance of ammonia production, as it accounts for both CAPEX and OPEX over the lifetime of the plant.
In this study, the LCOA is calculated based on CAPEX and OPEX, assuming a discount rate of 8% and a plant lifetime of 30 years. Under these assumptions, the LCOA results in 2408.2 EUR/tNH3. This value is significantly higher compared to current grey ammonia large-scale plants, which reflects the strong influence of intensive capital and operating costs associated with small-scale production, highlighting the importance of scale, financing conditions, and cost reductions for improving the economic competitiveness of e-ammonia.
In Figure 8, the obtained LCOA in the present work is compared with the values reported in the literature and previously summarized in Table 1a (offshore plants) and Table 1b (onshore plants). The LCOA value lies within the range of small-scale offshore plants (up to 10 tpd).
Figure 8.
LCOA versus e-NH3 plant production based on literature data included in Table 1a,b.
Most conventional ammonia plants operate at large scales, typically producing between 1000 and 1500 tpd, while the smallest conventional designs have capacities below 250 tpd. This tendency toward large-scale production reflects the well-known economies of scale that dominate grey ammonia synthesis for fertilizers production. A decreasing trend in LCOA values is observed as production capacity increases. This trend is slightly more pronounced in onshore plants, which indicates both economy of scale and level of technology maturity.
The green band in Figure 8 represents large-scale conventional grey ammonia plants, covering a production range of approximately 600 to 3300 tpd NH3. For this conventional large-scale ammonia production based on natural gas reforming, reported LCOA values range from 260 to 500 EUR/tNH3, depending mainly on natural gas prices, electricity costs, and plant configuration [34,35,36]. These values effectively define the current benchmark for mature, fossil-based ammonia production.
Several studies estimating the production, storage, and distribution of e-NH3 by 2050, the target year set by the European Union to achieve climate neutrality, indicate that LCOA values for large-scale plants are expected to range between 200 and 610 EUR/tNH3 [115,124,125,126,127], as shown in the textured band in Figure 8. Electricity costs are identified as a critical factor in reducing these values compared to current levels, together with technological innovations and economies of scale. Nevertheless, these authors emphasized that the economic viability of e-NH3 requires an integrated approach that, in addition to technological advancements, includes fiscal incentives and a supportive regulatory framework for its deployment. The broader range for 2050 reflects the possible variability in costs (e.g., electricity prices; electrolyzer capital costs). The lower bound of this range suggests that, under favorable renewable electricity prices and significant technological maturity of hydrogen technology, green ammonia could become cost-competitive with conventional production in the long term.
It is expected that small-scale facilities will also benefit from reductions in unit costs, given the growing importance of distributed NH3 production in modular flexible plants designed to supply maritime fuels and capable of accommodating the intermittent output of nearby renewable-energy installations.
5.5. Sensitivity Analysis
The sensitivity analysis was carried out under two approaches. First, the inherent variability in estimates derived from modular costing methodologies—universally applied to preliminary process designs—can introduce variations of up to 50% [89] in CAPEX and OPEX estimations. Second, there are a series of individual variables with a hierarchical impact on costs that should be considered in a dynamic and globalized market.
Firstly, the sensitivity analysis was carried out by varying major capital and operating expenditure parameters by ±50% with respect to the base case. The objective of this analysis is to assess the relative influence of each cost category on the LCOA and to identify the dominant economic drivers of the system. The results are summarized in Figure 9, where the LCOA response is plotted as a function of the percentage variation in the main CAPEX and OPEX components. Results indicate that both OPEX and CAPEX have a strong influence on the LCOA, varying in the range of 1500–3300 EUR/tNH3.
Figure 9.
Sensitivity analysis for variation of CAPEX and OPEX (Baseline = 2408.2 EUR/tNH3).
Among the cost components, the equipment cost is the most sensitive parameter affecting the LCOA, as it shows the sharpest slope among all evaluated cost components. This highlights the capital-intensive nature of the plant and the importance of equipment selection, scaling strategies, and potential cost reductions. Also, the equipment operation costs exhibit a strong sensitivity, more than that of utilities and operating labor. This is explained by the fact that equipment operational costs are assumed to be 26% of the total equipment investment cost, directly linking this OPEX component to the CAPEX component.
In contrast, utilities and operating labor costs show a low impact on the LCOA. In particular, the utilities curve almost overlaps with that of the platform cost. Working capital also has a very limited effect on the LCOA, as its value remains nearly constant over the analyzed range. Consequently, its influence on the overall economic performance of the system can be considered negligible. Overall, the sensitivity analysis demonstrates that the LCOA is primarily driven by capital-intensive components, with equipment cost being the most critical parameter.
Together with CAPEX and OPEX sensitivity analysis, a second approach to the sensitivity analysis based on specific economic parameters was carried out and represented through a tornado diagram. The selected parameters were electrolyzer price, electricity cost, operator salary, hydrogen storage cost, discount rate, platform cost, and plant lifetime, as these are the variables expected to have the greatest influence on LCOA and the highest uncertainty in their estimation (Figure 10).
Figure 10.
Effect of variation in selected economic parameters on the LCOA.
As discussed before, OPEX and CAPEX (±25%) are the most influential parameters, producing the largest variation in LCOA. The electrolyzer cost varied between 160 and 1300 EUR/kW according to the projections for electrolyzer technologies by 2030. This wide range reflects the uncertainty associated with technology, and it significantly impacts the overall ammonia production cost, varying the LCOA almost ±400 EUR/tNH3.
The electricity price varied between 0.01 and 0.05 EUR/kWh, representing values commonly reported in the literature for renewable electricity. The increase in electricity costs has a significant impact on the LCOA, leading to increases of approximately 100 EUR/tNH3 for each 0.01 EUR/kWh rise in electricity price. The potential use of grid electricity (0.06 EUR/kWh) would result in an increase of about 400 EUR/tNH3.
Operating labor costs were assessed by varying the average operator salary between EUR 20,000 and EUR 35,000 per year [128], reflecting typical ranges reported for industrial plant operators in Spain. The effect of this parameter on the LCOA was around ±180 € EUR/tNH3.
Additional parameters, including hydrogen storage cost (200–500 EUR/kg), discount rate (6–10%), platform investment (EUR 1– EUR 3 M), and plant lifetime (25–35 years), show progressively lower influence on the value of LCOA.
The results of the economic sensitivity analysis allow the identification and prioritization of the parameters exerting the greatest influence on the cost of an offshore e-NH3 production plant, which is highly relevant for decision making by stakeholders in this field.
6. Conclusions
This work presents a preliminary techno-economic assessment of a small-scale e-ammonia production plant with a capacity of 2.4 tpd (100 kg/h) that would be located on the Cantabrian Sea at the port of Santander, Spain, and the aerogenerators would be situated 22 miles offshore. This area is characterized by moderate wind conditions, which increase storage costs and constrain the future expansion of wind-energy generation. The results confirmed that, under current technological and economic conditions, small-scale green ammonia plants are not yet competitive compared to conventional grey ammonia production plants in terms of CAPEX or OPEX. The estimated CAPEX of EUR 5.99 M (equivalent to 0.53 M EUR /y), OPEX of 1.58 M EUR /y, and LCOA of 2408 EUR /tNH3 are higher than most of the values reported for ammonia plants in the literature. These higher values are mainly driven by the lack of economy of scale and the high cost of green hydrogen production and storage. Nevertheless, the results of this study provide valuable information for decision making related to the implementation of flexible, modular e-ammonia production plants operating under mild conditions.
Despite the current economic disadvantage, green ammonia production plants are expected to become more competitive in the future: improvements in electrolyzer efficiency, reductions in renewable electricity costs, and the advancement of modular and standardized plant designs will play a decisive role in lowering production costs.
In this transition context, small-scale plants have particular strategic importance since they offer advantages in terms of energy integration. The results also highlight the importance of superregional techno-economic assessments; in this cross-regional context, the Spanish government has designed special areas for offshore wind farms, two of which are located in the autonomous communities of Asturias and Galicia along the Cantabrian Sea, where the wind conditions are highly favorable.
In addition to the techno-economic optimization of the process, it will be necessary in the future to evaluate its sustainability through a lifecycle assessment and to determine the potential contribution of such plants to achieving the United Nations Sustainable Development Goals (UN-SDGs).
Supplementary Materials
The following supporting information can be downloaded at https://www.mdpi.com/article/10.3390/cleantechnol8030065/s1, Table S1. Methodologies applied for Cost estimation of equipment; Table S2. Dimension parameters of equipment; Table S3. Bare Module cost of equipment.
Author Contributions
Conceptualization, J.R.V.; methodology, L.P.-G. and B.G.; software, B.G.; validation, L.P.-G., B.G. and J.R.V.; formal analysis, L.P.-G. and J.R.V.; investigation, L.P.-G., B.G. and J.R.V.; writing—review and editing, L.P.-G., B.G. and J.R.V.; visualization, J.R.V.; supervision, J.R.V. and B.G.; funding acquisition, J.R.V. All authors have read and agreed to the published version of the manuscript.
Funding
This study forms part of the ThinkInAzul program and is supported by Spanish Ministerio de Ciencia e Innovación with funding from European Union Next Generation EU (PRTR-C17.I1) and by Comunidad Autónoma de Cantabria. Project: C17.I1—Plan Complementario de Ciencias Marinas.
Data Availability Statement
The original contributions presented in this study are included in the article. Further inquiries can be directed to the corresponding author.
Acknowledgments
The authors declare that artificial intelligence (AI) tools were used only for language editing during the preparation of this manuscript.
Conflicts of Interest
The authors declare no conflicts of interest.
Abbreviations
The following abbreviations are used in this manuscript:
| ACM | Aspen Custom Modeler |
| AEL | Alkaline electrolysis |
| ASU | Air separation unit |
| BMC | Bare Module Cost (EUR) |
| CAPEX | Capital Expenditure (EUR) |
| CEPCI | Chemical Engineering Plant Cost Index |
| COL | Cost of operating labor (EUR/y) |
| Cplatform | Cost of platform (EUR) |
| CRM | Cost of raw materials (EUR/y) |
| CUT | Cost of utilities (EUR/y) |
| CWT | Cost of waste treatment (EUR/y) |
| DAF | Dissolved Air Flotation |
| DMC | Direct Manufacturing cost (EUR/y) |
| DMF | Dual Media Filtration |
| e-NH3 | electro-ammonia |
| F | yearly ammonia production (t/year) |
| FMC | Fixed Manufacturing costs (EUR/y) |
| GE | General Expenses (EUR/y) |
| GHG | Greenhouse Gas |
| HB | Haber–Bosch |
| HHV | Higher heating value (MJ/kg) |
| HX | Shell-and-tube heat exchanger |
| i | Discount rate (%) |
| IEA | International Energy Agency |
| ICE | Internal Combustion Engines |
| IMO | International Maritime Organization |
| LCOA | Levelized cost of ammonia (EUR/tNH3) |
| MOD | Membrane module |
| Nnp | Number of non-particulate processing steps |
| OPEX | Operational expenditure (EUR/y) |
| P | Number of processing steps involving solids handling |
| PL | Plant lifetime (years) |
| PtF | Power-to-Fuel processes |
| PtX | Power-to-X (PtX) processes |
| PX | Pressure exchanger |
| RO | Reverse osmosis unit |
| RX | Reaction stage |
| SDG | Sustainable Development Goal |
| SOFC | Solid oxide fuel cell |
| TDS | Total dissolved solids (ppm) |
| tpd | tons per day |
| TPI | Total Permanent Investment (EUR) |
| UF | Update Factor |
| WC | Working Capital (EUR) |
References
- IEA-International Energy Agency Report: Renewables 2024. Analysis and Forecast to 2030; IEA: Paris, France, 2024. [Google Scholar]
- IMO-International Maritime Organization. 2023 Strategy on Reduction of GHG Emissions from Ships; IMO: London, UK, 2023. [Google Scholar]
- European Commission. EU Transport and the Green Deal. Available online: https://commission.europa.eu/strategy-and-policy/priorities-2019-2024/european-green-deal/transport-and-green-deal_en (accessed on 5 June 2025).
- Soler, A.; Gordillo, V.; Lilley, W.; Schmidt, P.; Werner, W.; Houghton, T.; Dell’Orco, S. E-Fuels: A Techno-Economic Assessment of European Domestic Production and Imports Towards 2050; Concawe: Brussels, Belgium, 2022. [Google Scholar]
- Nemmour, A.; Inayat, A.; Janajreh, I.; Ghenai, C. Green Hydrogen-Based E-Fuels (E-Methane, E-Methanol, E-Ammonia) to Support Clean Energy Transition: A Literature Review. Int. J. Hydrogen Energy 2023, 48, 29011–29033. [Google Scholar] [CrossRef] [Scilit]
- Dash, S.; Singh, A.; Surapraraju, S.K.; Natarajan, S.K. Advances in Green Hydrogen Production through Alkaline Water Electrolysis: A Comprehensive Review. Int. J. Hydrogen Energy 2024, 83, 614–629. [Google Scholar] [CrossRef] [Scilit]
- Frattini, D.; Cinti, G.; Bidini, G.; Desideri, U.; Cioffi, R.; Jannelli, E. A System Approach in Energy Evaluation of Different Renewable Energies Sources Integration in Ammonia Production Plants. Renew. Energy 2016, 99, 472–482. [Google Scholar] [CrossRef] [Scilit]
- Wang, X.; Zhu, J.; Han, M. Industrial Development Status and Prospects of the Marine Fuel Cell: A Review. J. Mar. Sci. Eng. 2023, 11, 238. [Google Scholar] [CrossRef] [Scilit]
- Laursen, R.; Barcarolo, D.; Patel, H.; Dowling, M.; Penfold, M.; Faber, J.; Király, J.; van der Ven, R.; Pang, E.; van Grinsven, A. Potential of Ammonia as Fuel in Shipping; The European Maritime Safety Agency: Lisbon, Portugal, 2022. [Google Scholar]
- Chalaris, I.; Jeong, B.; Jang, H. Application of Parametric Trend Life Cycle Assessment for Investigating the Carbon Footprint of Ammonia as Marine Fuel. Int. J. Life Cycle Assess. 2022, 27, 1145–1163. [Google Scholar] [CrossRef] [Scilit]
- Ahmed, S.; Li, T.; Yi, P.; Chen, R. Environmental Impact Assessment of Green Ammonia-Powered Very Large Tanker Ship for Decarbonized Future Shipping Operations. Renew. Sustain. Energy Rev. 2023, 188, 113774. [Google Scholar] [CrossRef] [Scilit]
- Seddiek, I.S.; Ammar, N.R. Technical and Eco-Environmental Analysis of Blue/Green Ammonia-Fueled RO/RO Ships. Transp. Res. Part D Transp. Environ. 2023, 114, 103547. [Google Scholar] [CrossRef] [Scilit]
- Wang, H.; Zhou, P.; Jeong, B.; Mesbahi, A.; Mujeeb-Ahmed, M.P.; Jang, H.; Giannakis, A.; Sykaras, K.; Papadakis, A. Life Cycle Analysis of Ammonia Fuelled Ship—Case Ship Studies for Marine Vessels. J. Clean. Prod. 2025, 520, 146105. [Google Scholar] [CrossRef] [Scilit]
- International Maritime Organization (IMO). Progress on Safety Guidelines for Hydrogen- and Ammonia-Fuelled Ships. Available online: https://www.imo.org/en/MediaCentre/Pages/WhatsNew-1968.aspx (accessed on 8 September 2025).
- Fullonton, A.; Lea-Langton, A.R.; Madugu, F.; Larkin, A. Green Ammonia Adoption in Shipping: Opportunities and Challenges across the Fuel Supply Chain. Mar. Policy 2025, 171, 106444. [Google Scholar] [CrossRef] [Scilit]
- Balci, G.; Phan, T.T.N.; Surucu-Balci, E.; Iris, Ç. A Roadmap to Alternative Fuels for Decarbonising Shipping: The Case of Green Ammonia. Res. Transp. Bus. Manag. 2024, 53, 101100. [Google Scholar] [CrossRef] [Scilit]
- Christodoulou, A.; Dong, T.; Schönborn, A.; Ölçer, A.I.; Dalaklis, D. Linking the Employment of Alternative Marine Fuels to a Carbon Price for Shipping. Mar. Policy 2025, 171, 106452. [Google Scholar] [CrossRef] [Scilit]
- Olabi, A.G.; Abdelkareem, M.A.; Al-Murisi, M.; Shehata, N.; Alami, A.H.; Radwan, A.; Wilberforce, T.; Chae, K.-J.; Sayed, E.T. Recent Progress in Green Ammonia: Production, Applications, Assessment; Barriers, and Its Role in Achieving the Sustainable Development Goals. Energy Convers. Manag. 2023, 277, 116594. [Google Scholar] [CrossRef] [Scilit]
- Sekhar, S.J.; Samuel, M.S.; Glivin, G.; Le, T.G.; Mathimani, T. Production and Utilization of Green Ammonia for Decarbonizing the Energy Sector with a Discrete Focus on Sustainable Development Goals and Environmental Impact and Technical Hurdles. Fuel 2024, 360, 130626. [Google Scholar] [CrossRef] [Scilit]
- Makhlof, M.E.M.; Zabady, A.H.; Shehata, N. Green Ammonia and the Sustainable Development Goals (SDGs). In Comprehensive Green Materials; Elsevier: Amsterdam, The Netherlands, 2025; pp. 545–555. [Google Scholar]
- Zhao, F.; Wang, Z.; Dong, B.; Li, M.; Ji, Y.; Han, F. Comprehensive Life Cycle Cost Analysis of Ammonia-Based Hydrogen Transportation Scenarios for Offshore Wind Energy Utilization. J. Clean. Prod. 2023, 429, 139616. [Google Scholar] [CrossRef] [Scilit]
- Inal, O.B.; Zincir, B.; Deniz, C. Investigation on the Decarbonization of Shipping: An Approach to Hydrogen and Ammonia. Int. J. Hydrogen Energy 2022, 47, 19888–19900. [Google Scholar] [CrossRef] [Scilit]
- Machaj, K.; Kupecki, J.; Malecha, Z.; Morawski, A.W.; Skrzypkiewicz, M.; Stanclik, M.; Chorowski, M. Ammonia as a Potential Marine Fuel: A Review. Energy Strategy Rev. 2022, 44, 100926. [Google Scholar] [CrossRef] [Scilit]
- Braun, A.; Gierenz, N.; Braun, S.; Kubach, H.; Bernhardt, S.; Prehn, S.; Müller, M.; Engelmeier, L.; Fehlemann, L.; Steffen, M.; et al. Aspects of Ammonia as Green Fuel for Propulsion Systems of Inland Water Vessels. Energy Technol. 2025, 13, 2301648. [Google Scholar] [CrossRef] [Scilit]
- Wang, Z.; Dong, B.; Yin, J.; Li, M.; Ji, Y.; Han, F. Towards a Marine Green Power System Architecture: Integrating Hydrogen and Ammonia as Zero-Carbon Fuels for Sustainable Shipping. Int. J. Hydrogen Energy 2024, 50, 1069–1087. [Google Scholar] [CrossRef] [Scilit]
- Caprace, J.-D.; Marques, C.H.; Assis, L.F.; Lucchesi, A.; Pereda, P.C. Sustainable Shipping: Modeling Technological Pathways Toward Net-Zero Emissions in Maritime Transport (Part I). Sustainability 2025, 17, 3733. [Google Scholar] [CrossRef] [Scilit]
- Wang, Y.; Li, J. Multi-Criteria Decision-Making for Green Maritime Transportation: A Hybrid Fuzzy AHP-MOORA Approach to Reduce Marine Pollution. Mar. Pollut. Bull. 2025, 216, 118023. [Google Scholar] [CrossRef] [Scilit]
- Ammonia Energy Association (AEA). EXMAR: Preparing to Sail Using Ammonia as a Marine Fuel. Available online: https://www.ammoniaenergy.org/articles/ (accessed on 3 October 2025).
- Stanescu, V.; Pérez-Cedeño, R.; Hernández, J.C.; Batista, T. Global Transition of Energy Vectors in the Maritime Sector: Role of Liquefied Natural Gas, Green Hydrogen, and Ammonia in Achieving Net Zero by 2050. Energies 2026, 19, 568. [Google Scholar] [CrossRef] [Scilit]
- Galan, B.; Viguri, J. Decentralized Production of Sustainable Small-Scale Ammonia. In Hydrogen Production, Storage and Utilization Technologies: Ammonia and Methane Production; Martín Martín, M., Sánchez García, A., Eds.; De Gruyter: Berlin, Germany, 2026; ISBN 9783111634821. [Google Scholar]
- Maritime Spatial Plans—POEM. Ministerio para la transición ecológica y el reto demográfico. In Real Decreto 150/2023, de 28 de Febrero, por el que se Aprueban Los Planes de Ordenación del Espacio Marítimo de las Cinco Demarcaciones Marinas Españolas; BOE 54, 32350–32578; BOE: Beijing, China, 2023. [Google Scholar]
- Sea of Innovation Cantabria Cluster. Available online: https://cantabriaseaofinnovation.es/ (accessed on 7 February 2026).
- Salmon, N.; Bañares-Alcántara, R.; Nayak-Luke, R. Optimization of Green Ammonia Distribution Systems for Intercontinental Energy Transport. iScience 2021, 24, 102903. [Google Scholar] [CrossRef] [Scilit]
- Osman, O.; Sgouridis, S.; Sleptchenko, A. Scaling the Production of Renewable Ammonia: A Techno-Economic Optimization Applied in Regions with High Insolation. J. Clean. Prod. 2020, 271, 121627. [Google Scholar] [CrossRef] [Scilit]
- Del Pozo, C.A.; Cloete, S. Techno-Economic Assessment of Blue and Green Ammonia as Energy Carriers in a Low-Carbon Future. Energy Convers. Manag. 2022, 255, 115312. [Google Scholar] [CrossRef] [Scilit]
- Shin, B.-J.; Mun, J.-H.; Devkota, S.; Kim, S.-M.; Kang, T.-H.; Mazari, S.A.; Cho, K.; Kim, S.H.; Chun, D.-H.; Kim, K.-M.; et al. Comparative Assessment and Multi-Objective Optimization for the Gray and Blue Ammonia Synthesis Processes: Energy, Economic and Environmental (3E) Analysis. Int. J. Hydrogen Energy 2023, 48, 35123–35138. [Google Scholar] [CrossRef] [Scilit]
- Wang, H.; Daoutidis, P.; Zhang, Q. Harnessing the Wind Power of the Ocean with Green Offshore Ammonia. ACS Sustain. Chem. Eng. 2021, 9, 14605–14617. [Google Scholar] [CrossRef] [Scilit]
- STFC Energy Research Unit (Science and Technology Facilities Council). Ammonia Synthesis Plant from Intermittent Renewable Energy (ASPIRE): Feasibility Study; STFC Energy Research Unit (ERU): Oxford, UK, 2022. [Google Scholar]
- Wang, M.; Khan, M.A.; Mohsin, I.; Wicks, J.; Ip, A.H.; Sumon, K.Z.; Dinh, C.-T.; Sargent, E.H.; Gates, I.D.; Kibria, M.G. Can Sustainable Ammonia Synthesis Pathways Compete with Fossil-Fuel Based Haber–Bosch Processes? Energy Environ. Sci. 2021, 14, 2535–2548. [Google Scholar] [CrossRef] [Scilit]
- IEA-International Energy Agency. Ammonia Technology Roadmap. Towards More Sustainable Nitrogen Fertiliser Production; International Energy Agency: Paris, France, 2021. [Google Scholar]
- IRENA and AEA. Innovation Outlook: Renewable Ammonia; International Renewable Energy Agency: Abu Dhabi, United Arab Emirates, 2022. [Google Scholar]
- Ojelade, O.A.; Zaman, S.F.; Ni, B.-J. Green Ammonia Production Technologies: A Review of Practical Progress. J. Environ. Manag. 2023, 342, 118348. [Google Scholar] [CrossRef] [Scilit]
- AmmPower. IAMM Systems Spec Sheets. Available online: https://www.ammoniaenergy.org/wp-content/uploads/2022/10/AEA-2022-AmmPower-final.pdf (accessed on 18 June 2025).
- FuelPositive. Fuel for A Mindful World. Available online: https://fuelpositive.com/ (accessed on 18 June 2025).
- Kapsom. Available online: https://www.kapsom.com (accessed on 18 May 2025).
- Atmonia. Reinventing the Future 2024. Available online: https://atmonia.com/ (accessed on 11 October 2025).
- Thyssenkrupp. Available online: https://www.thyssenkrupp-uhde.com/en/products-and-technologies/green-chemicals/green-ammonia (accessed on 11 October 2025).
- MacFarlane, D.R.; Cherepanov, P.V.; Choi, J.; Suryanto, B.H.; Hodgetts, R.Y.; Bakker, J.M.; Vallana, F.M.F.; Simonov, A.N. A Roadmap to the Ammonia Economy. Joule 2020, 4, 1186–1205. [Google Scholar] [CrossRef] [Scilit]
- Nayak-Luke, R.M.; Bañares-Alcántara, R. Techno-Economic Viability of Islanded Green Ammonia as a Carbon-Free Energy Vector and as a Substitute for Conventional Production. Energy Environ. Sci. 2020, 13, 2957–2966. [Google Scholar] [CrossRef] [Scilit]
- Fasihi, M.; Weiss, R.; Savolainen, J.; Breyer, C. Global Potential of Green Ammonia Based on Hybrid PV-Wind Power Plants. Appl. Energy 2021, 294, 116170. [Google Scholar] [CrossRef] [Scilit]
- Galimova, T.; Ram, M.; Bogdanov, D.; Fasihi, M.; Gulagi, A.; Khalili, S.; Breyer, C. Global Trading of Renewable Electricity-Based Fuels and Chemicals to Enhance the Energy Transition across All Sectors towards Sustainability. Renew. Sustain. Energy Rev. 2023, 183, 113420. [Google Scholar] [CrossRef] [Scilit]
- Shin, W.; Lai, H.; Ibrahim, G.; Zang, G. Toward a Sustainable Energy Future Using Ammonia as an Energy Carrier: Global Supply Chain Cost and Greenhouse Gas Emissions. Energy Environ. Sci. 2026, 19, 162–188. [Google Scholar] [CrossRef] [Scilit]
- Cunanan, C.J.; Elorza Casas, C.A.; Yorke, M.; Fowler, M.; Wu, X.-Y. Design and Analysis of an Offshore Wind Power to Ammonia Production System in Nova Scotia. Energies 2022, 15, 9558. [Google Scholar] [CrossRef] [Scilit]
- Lin, B.; Wiesner, T.; Malmali, M. Performance of a Small-Scale Haber Process: A Techno-Economic Analysis. ACS Sustain. Chem. Eng. 2020, 8, 15517–15531. [Google Scholar] [CrossRef] [Scilit]
- Driscoll, H.; Salmon, N.; Bañares-Alcántara, R. Technoeconomic Evaluation of Offshore Green Ammonia Production Using Tidal and Wind Energy: A Case Study. Energy Sources Part A Recovery Util. Environ. Eff. 2023, 45, 7222–7244. [Google Scholar] [CrossRef] [Scilit]
- Morgan, E.R.; Manwell, J.F.; McGowan, J.G. Sustainable Ammonia Production from U.S. Offshore Wind Farms: A Techno-Economic Review. ACS Sustain. Chem. Eng. 2017, 5, 9554–9567. [Google Scholar] [CrossRef] [Scilit]
- Parmar, V.; Manwell, J.; McGowan, J. Ammonia Production from a Non-Grid Connected Floating Offshore Windfarm. J. Phys. Conf. Ser. 2020, 1452, 012015. [Google Scholar] [CrossRef] [Scilit]
- Salmon, N.; Bañares-Alcántara, R. A Global, Spatially Granular Techno-Economic Analysis of Offshore Green Ammonia Production. J. Clean. Prod. 2022, 367, 133045. [Google Scholar] [CrossRef] [Scilit]
- Micheletto, D.; Migliari, L.; Cau, G.; Cocco, D. Minimizing LCOA in Green Ammonia Production: Optimization of Components Size and Scheduling under Varying Curtailment Scenarios. In Proceedings of the Journal of Physics: Conference Series; Institute of Physics: London, UK, 2025; Volume 3143. [Google Scholar]
- Bahaj, M.; Harrak, A.E.; Naanani, H.; Bouchouk, H.; Faik, A. Techno-Economic Analysis and Machine Learning Integration for Enhanced Ammonia Production. Renew. Energy Focus 2026, 57, 100805. [Google Scholar] [CrossRef] [Scilit]
- Patel, S.P.; Gujarathi, A.M.; Vanzara, P.B. Process Development and Optimization of Sustainable and Integrated Large Scale Ammonia Production Process Using Water Electrolysis Based Green Hydrogen: Investigating Process, Energy, Economic & Environmental Perspectives. Int. J. Hydrogen Energy 2024, 93, 482–498. [Google Scholar] [CrossRef] [Scilit]
- Sousa, J.; Waiblinger, W.; Friedrich, K.A. Techno-Economic Study of an Electrolysis-Based Green Ammonia Production Plant. Ind. Eng. Chem. Res. 2022, 61, 14515–14530. [Google Scholar] [CrossRef] [Scilit]
- Armijo, J.; Philibert, C. Flexible Production of Green Hydrogen and Ammonia from Variable Solar and Wind Energy: Case Study of Chile and Argentina. Int. J. Hydrogen Energy 2020, 45, 1541–1558. [Google Scholar] [CrossRef] [Scilit]
- Pistolesi, C.; Giaconia, A.; Bassano, C.; De Falco, M. Flexible Green Ammonia Production: Impact of Process Design on the Levelized Cost of Ammonia. Fuels 2025, 6, 39. [Google Scholar] [CrossRef] [Scilit]
- Cameli, F.; Kourou, A.; Rosa, V.; Delikonstantis, E.; Galvita, V.; Van Geem, K.M.; Stefanidis, G.D. Conceptual Process Design and Technoeconomic Analysis of an E-Ammonia Plant: Green H2 and Cryogenic Air Separation Coupled with Haber-Bosch Process. Int. J. Hydrogen Energy 2024, 49, 1416–1425. [Google Scholar] [CrossRef] [Scilit]
- Cesaro, Z.; Ives, M.; Nayak-Luke, R.; Mason, M.; Bañares-Alcántara, R. Ammonia to Power: Forecasting the Levelized Cost of Electricity from Green Ammonia in Large-Scale Power Plants. Appl. Energy 2021, 282, 116009. [Google Scholar] [CrossRef] [Scilit]
- Hinojosa, J.N.; Cruz, D.M.T.; Moreno, I.T. Techno-Economic Simulation Model for Optimization of Power-To-X Green Hydrogen Systems Involving Several Energy Sources: A Case Study of Ammonia Production in South Africa. In Proceedings of the 37th International Conference on Efficiency, Cost, Optimization, Simulation and Environmental Impact of Energy Systems (ECOS 2024), ECOS 2024, Zografos, Rhodes, Greece, 30 June–5 July 2024; pp. 156–167. [Google Scholar]
- Zhou, J.; Zhang, Z.; Zhang, R.; Zhang, W.; Xu, G.; Wang, H. Optimal Capacity and Multi-Stable Flexible Operation Strategy of Green Ammonia Systems: Adapting to Fluctuations in Renewable Energy. Energy Convers. Manag. 2024, 314, 118720. [Google Scholar] [CrossRef] [Scilit]
- Nosherwani, S.A.; Neto, R.C. Techno-Economic Assessment of Commercial Ammonia Synthesis Methods in Coastal Areas of Germany. J. Energy Storage 2021, 34, 102201. [Google Scholar] [CrossRef] [Scilit]
- Ofori-Bah, C.O.; Amanor-Boadu, V. Directing the Wind: Techno-Economic Feasibility of Green Ammonia for Farmers and Community Economic Viability. Front. Environ. Sci. 2023, 10, 1070212. [Google Scholar] [CrossRef] [Scilit]
- Nami, H.; Hendriksen, P.V.; Frandsen, H.L. Green Ammonia Production Using Current and Emerging Electrolysis Technologies. Renew. Sustain. Energy Rev. 2024, 199, 114517. [Google Scholar] [CrossRef] [Scilit]
- Oh, S.; Kim, S.; Oh, S.; Kim, J.; Kim, Y.; Kang, S. Techno-Economic Assessment of Ammonia Value Chain with Consideration of Ammonia Utilizations. Appl. Therm. Eng. 2026, 286, 129412. [Google Scholar] [CrossRef] [Scilit]
- Palandri, J.; Rahmanifard, H.; Layzell, D.; Hastings-Simon, S. Blue vs. Green: A Comparative Analysis of Ammonia Production and Export in Western Canada and Australia. Renew. Energy 2025, 239, 121953. [Google Scholar] [CrossRef] [Scilit]
- Mersch, M.; Sunny, N.; Dejan, R.; Ku, A.Y.; Wilson, G.; O’Reilly, S.; Soloveichik, G.; Wyatt, J.; Mac Dowell, N.; Mac Dowell, N. A Comparative Techno-Economic Assessment of Blue, Green, and Hybrid Ammonia Production in the United States. Sustain. Energy Fuels 2024, 8, 1495–1508. [Google Scholar] [CrossRef] [Scilit]
- Kibria, M.A.; McManus, D.E.; Bhattacharya, S. Options for Net Zero Emissions Hydrogen from Victorian Lignite. Part 1: Gaseous and Liquefied Hydrogen. Int. J. Hydrogen Energy 2023, 48, 30339–30353. [Google Scholar] [CrossRef] [Scilit]
- Abdelsalam, R.A.; Mohamed, M.; Farag, H.E.; El-Saadany, E.F. Green Hydrogen Production Plants: A Techno-Economic Review. Energy Convers. Manag. 2024, 319, 118907. [Google Scholar] [CrossRef] [Scilit]
- Abdulrahim, H.K.; Al-Rasheed, A.M.; Hassan, A.S.; Mabrouk, A.-N.A.; Shomar, B.; Darwish, M.A. Reverse Osmosis Desalination System and Algal Blooms Part III: SWRO Pretreatment. Desalination Water Treat. 2017, 60, 11–38. [Google Scholar] [CrossRef] [Scilit]
- Ramírez, Y.; Cisternas, L.A.; Kraslawski, A. Application of House of Quality in Assessment of Seawater Pretreatment Technologies. J. Clean. Prod. 2017, 148, 223–232. [Google Scholar] [CrossRef] [Scilit]
- Abushaban, A.; Salinas-Rodriguez, S.G.; Philibert, M.; Le Bouille, L.; Necibi, M.C.; Chehbouni, A. Biofouling Potential Indicators to Assess Pretreatment and Mitigate Biofouling in SWRO Membranes: A Short Review. Desalination 2022, 527, 115543. [Google Scholar] [CrossRef] [Scilit]
- KWI. DAF as Pre-Treatment Technology for SWRO. Available online: https://kwi-intl.com/daf/seawater_desalination_daf (accessed on 16 September 2025).
- SIGMADAF. Seawater Pretreatment in SWRO Desalination Plants. Available online: https://sigmadafclarifiers.com/ (accessed on 16 September 2025).
- Kouhestani, A.; Tehrani, A.A.; Parsaeian, H.; Nikfar, M.H.; Bazargan, A.; Isfahani, H.M. Study of 3D-Printed Pressure Release Nozzle for Microbubble Formation in Full-Scale Dissolved Air Flotation (DAF). Chem. Eng. Process. Process Intensif. 2020, 155, 108070. [Google Scholar] [CrossRef] [Scilit]
- Sánchez, A.; Martín, M. Scale up and Scale down Issues of Renewable Ammonia Plants: Towards Modular Design. Sustain. Prod. Consum. 2018, 16, 176–192. [Google Scholar] [CrossRef] [Scilit]
- Ishaq, H.; Crawford, C. Review of Ammonia Production and Utilization: Enabling Clean Energy Transition and Net-Zero Climate Targets. Energy Convers. Manag. 2024, 300, 117869. [Google Scholar] [CrossRef] [Scilit]
- Bozorg, M.; Addis, B.; Piccialli, V.; Ramírez-Santos, Á.A.; Castel, C.; Pinnau, I.; Favre, E. Polymeric Membrane Materials for Nitrogen Production from Air: A Process Synthesis Study. Chem. Eng. Sci. 2019, 207, 1196–1213. [Google Scholar] [CrossRef] [Scilit]
- Adhikari, B.; Orme, C.J.; Klaehn, J.R.; Stewart, F.F. Technoeconomic Analysis of Oxygen-Nitrogen Separation for Oxygen Enrichment Using Membranes. Sep. Purif. Technol. 2021, 268, 118703. [Google Scholar] [CrossRef] [Scilit]
- Hera Barquín, G.D.L.; Ruiz Gutiérrez, G.; Viguri Fuente, J.R.; Galán Corta, B. Flexible Green Ammonia Production Plants: Small-Scale Simulations Based on Energy Aspects. Environments 2024, 11, 71. [Google Scholar] [CrossRef] [Scilit]
- Sinnott, R.K.; Towler, G.P. Chemical Engineering Design; Butterworth-Heinemann; Elsevier: Amsterdam, The Netherlands, 2020; ISBN 9780081025994. [Google Scholar]
- Biegler, L.T.; Grossmann, I.E.; Westerberg, A.W. Systematic Methods for Chemical Process Design; Prentice Hall International: Hoboken, NJ, USA, 1997; ISBN 9780134924229. [Google Scholar]
- Zhang, H.; Wang, L.; Van herle, J.; Maréchal, F.; Desideri, U. Techno-Economic Comparison of Green Ammonia Production Processes. Appl. Energy 2020, 259, 114135. [Google Scholar] [CrossRef] [Scilit]
- Ray, S.; Das, G. Process Equipment and Plant Design; Elsevier: Amsterdam, The Netherlands, 2020; ISBN 9780128148853. [Google Scholar]
- Seider, W.D.; Lewin, D.R.; Seader, J.D.; Widagdo, S.; Gani, R.; Ng, K.M. Product and Process Design Principles: Synthesis, Analysis, and Evaluation; John Wiley & Sons Inc.: Hoboken, NJ, USA, 2019; ISBN 9781119282631. [Google Scholar]
- Turton, R.; Bailie, R.C.; Whiting, W.B.; Shaeiwitz, J.A. Analysis, Synthesis, and Design of Chemical Processes; Prentice Hall: Hoboken, NJ, USA, 2018; ISBN 9780134177403. [Google Scholar]
- BOE. Resolución de 6 de Febrero de 2025, de La Dirección General de Trabajo, Por La Que Se Registra y Publica El XXI Convenio Colectivo General de La Industria Química. In «BOE» Núm. 41, de 17 de Febrero de 2025, Páginas 21869 a 22010 (142 Págs.); Sección: III. Otras Disposiciones Departamento: Ministerio de Trabajo y Economía Social Referencia: BOE-A-2025-3083; BOE: Beijing, China, 2025. [Google Scholar]
- REVE. Revista Eólica y Del Vehículo Eléctrico. Available online: https://reve.aeeolica.org/2025/01/28/eolica-en-el-mercado-2024/ (accessed on 1 December 2025).
- Faraji, M.; Saidi, M. Hydrogen-Rich Syngas Production via Integrated Configuration of Pyrolysis and Air Gasification Processes of Various Algal Biomass: Process Simulation and Evaluation Using Aspen Plus Software. Int. J. Hydrogen Energy 2021, 46, 18844–18856. [Google Scholar] [CrossRef] [Scilit]
- Pure Aqua, Inc. Sistema Ósmosis Inversa Comercial Para Desalinizar Agua de Mar. Available online: https://es.pureaqua.com/sistema-osmosis-inversa-comercial-para-desalinizar-agua-de-mar/ (accessed on 4 September 2025).
- Somavilla, R.; Ibañez-Tejero, L.; Viloria, A.; Marcos, E. SATS (Santander Atlantic Time-Series) Observatory Data; Seanoe: Plouzané, France, 2025. [Google Scholar] [CrossRef]
- Huang, B.; Pu, K.; Wu, P.; Wu, D.; Leng, J. Design, Selection and Application of Energy Recovery Device in Seawater Desalination: A Review. Energies 2020, 13, 4150. [Google Scholar] [CrossRef] [Scilit]
- Timur, R.S.; Corum, A.; Okten, H.E.; Coban, A.; Demis, G.; Bozbura, T. Comparative Cost Analysis of Pressure Exchanger (Px) and Turbine Type Energy Recovery Devices at Seawater Reverse Osmosis (SWRO) Plants. J. Environ. Prot. Ecol. 2011, 12, 1186–1194. [Google Scholar]
- Wang, C.; Meng, P.; Wang, S.; Song, D.; Xiao, Y.; Zhang, Y.; Ma, Q.; Liu, S.; Wang, K.; Zhang, Y. Comparison of Two Types of Energy Recovery Devices: Pressure Exchanger and Turbine in an Island Desalination Project Case. Desalination 2022, 533, 115752. [Google Scholar] [CrossRef] [Scilit]
- Energy Recovery. Available online: https://energyrecovery.com/pressure-exchangers/ (accessed on 9 February 2026).
- Maxwell, C. Towering Skills. Cost Indices. Available online: https://toweringskills.com/financial-analysis/cost-indices/ (accessed on 16 October 2025).
- Reksten, A.H.; Thomassen, M.S.; Møller-Holst, S.; Sundseth, K. Projecting the Future Cost of PEM and Alkaline Water Electrolysers; a CAPEX Model Including Electrolyser Plant Size and Technology Development. Int. J. Hydrogen Energy 2022, 47, 38106–38113. [Google Scholar] [CrossRef] [Scilit]
- Yates, J.; Daiyan, R.; Patterson, R.; Egan, R.; Amal, R.; Ho-Baille, A.; Chang, N.L. Techno-Economic Analysis of Hydrogen Electrolysis from Off-Grid Stand-Alone Photovoltaics Incorporating Uncertainty Analysis. Cell Rep. Phys. Sci. 2020, 1, 100209. [Google Scholar] [CrossRef] [Scilit]
- Brynolf, S.; Taljegard, M.; Grahn, M.; Hansson, J. Electrofuels for the Transport Sector: A Review of Production Costs. Renew. Sustain. Energy Rev. 2018, 81, 1887–1905. [Google Scholar] [CrossRef] [Scilit]
- Schmidt, O.; Gambhir, A.; Staffell, I.; Hawkes, A.; Nelson, J.; Few, S. Future Cost and Performance of Water Electrolysis: An Expert Elicitation Study. Int. J. Hydrogen Energy 2017, 42, 30470–30492. [Google Scholar] [CrossRef] [Scilit]
- Gallardo, F.I.; Monforti Ferrario, A.; Lamagna, M.; Bocci, E.; Astiaso Garcia, D.; Baeza-Jeria, T.E. A Techno-Economic Analysis of Solar Hydrogen Production by Electrolysis in the North of Chile and the Case of Exportation from Atacama Desert to Japan. Int. J. Hydrogen Energy 2021, 46, 13709–13728. [Google Scholar] [CrossRef] [Scilit]
- Wei, X.; Sharma, S.; Waeber, A.; Wen, D.; Sampathkumar, S.N.; Margni, M.; Maréchal, F.; Van herle, J. Comparative Life Cycle Analysis of Electrolyzer Technologies for Hydrogen Production: Manufacturing and Operations. Joule 2024, 8, 3347–3372. [Google Scholar] [CrossRef] [Scilit]
- van ’t Noordende, H.; Ripson, P. A 1 Gigawatt Green Hydrogen Plant; Institute for Sustainable Process Technology (ISPT): Utrecht, The Netherlands, 2023. [Google Scholar]
- Egerer, J.; Grimm, V.; Niazmand, K.; Runge, P. The Economics of Global Green Ammonia Trade—“Shipping Australian Wind and Sunshine to Germany”. Appl. Energy 2023, 334, 120662. [Google Scholar] [CrossRef] [Scilit]
- Chatenet, M.; Pollet, B.G.; Dekel, D.R.; Dionigi, F.; Deseure, J.; Millet, P.; Braatz, R.D.; Bazant, M.Z.; Eikerling, M.; Staffell, I.; et al. Water Electrolysis: From Textbook Knowledge to the Latest Scientific Strategies and Industrial Developments. Chem. Soc. Rev. 2022, 51, 4583–4762. [Google Scholar] [CrossRef] [Scilit] [PubMed]
- GIZ.; ARIEMA Energía y Medioambiente S.L.; TCI Gecomp SpA. Estudio de Prefactibilidad Técnica y Económica de La Producción de Hidrógeno Verde Mediante Electrólisis Para Las Entidades Aguas CAP y Energías de La Patagonia y Aysén SpA; Ministerio de Energía de Chile: Santiago de Chile, Chile, 2021. [Google Scholar]
- Santos, A.L.; Cebola, M.-J.; Santos, D.M.F. Towards the Hydrogen Economy—A Review of the Parameters That Influence the Efficiency of Alkaline Water Electrolyzers. Energies 2021, 14, 3193. [Google Scholar] [CrossRef] [Scilit]
- International Renewable Energy Agency (IRENA). Green Hydrogen Cost Reduction: Scaling up Electrolysers to Meet the 1.5 °C Climate Goal; International Renewable Energy Agency: Abu Dhabi, United Arab Emirates, 2020. [Google Scholar]
- Allman, A.; Palys, M.J.; Daoutidis, P. Scheduling-informed Optimal Design of Systems with Time-varying Operation: A Wind-powered Ammonia Case Study. AIChE J. 2019, 65, e16434. [Google Scholar] [CrossRef] [Scilit]
- Rouwenhorst, K.H.; Van der Ham, A.G.; Mul, G.; Kersten, S.R. Islanded Ammonia Power Systems: Technology Review & Conceptual Process Design. Renew. Sustain. Energy Rev. 2019, 114, 109339. [Google Scholar] [CrossRef] [Scilit]
- Bruce, S.; Temminghoff, M.; Hayward, J.; Schmidt, E.; Munnings, C.; Palfreyman, D.; Hartley, P. National Hydrogen Roadmap; CSIRO: Canberra, Australia, 2018. [Google Scholar]
- Hinkley, J.; Hayward, J.; McNaughton, R.; Gillespie, R.; Matsumoto, A.; Watt, M.; Lovegrove, K. Cost Assessment of Hydrogen Production from PV and Electrolysis; Australian Renewable Energy Agency (ARENA): Canberra, Australia, 2016.
- Eikeng, E. Power to Ammonia—A Computational Framework for Optimizing Green Ammonia Production from Off-Grid Wind and Solar Energy. Master’s thesis, National Taiwan Normal University, Taipei, Taiwan, 2023. [Google Scholar]
- Ikäheimo, J.; Kiviluoma, J.; Weiss, R.; Holttinen, H. Power-to-Ammonia in Future North European 100 % Renewable Power and Heat System. Int. J. Hydrogen Energy 2018, 43, 17295–17308. [Google Scholar] [CrossRef] [Scilit]
- CATL. CATL’s EnerOne battery storage system won ees AWARD 2022. Available online: https://www.catl.com/en/news/935.html (accessed on 9 September 2025).
- Kaiser, M.J.; Snyder, B.; Pulsipher, A.G. Offshore Drilling Industry and Rig Construction Market in the Gulf of Mexico; Bureau of Ocean Energy Management (BOEM): Washington, DC, USA, 2013.
- Souissi, N.; Fellow, A. Fueling the Future: A Techno-Economic Evaluation of e-Ammonia Production for Marine Applications; Oxford Institute for Energy Studies: Oxford, UK, 2024; ISBN 9781784672553. [Google Scholar]
- Jin, C.; Choi, J.; Lee, C.; Kim, M. Sustainable Maritime Decarbonization: A Review of Hydrogen and Ammonia as Future Clean Marine Energies. Sustainability 2025, 17, 11364. [Google Scholar] [CrossRef] [Scilit]
- Pozo, D.; Sauma, E.; Bolado-Lavín, R. Levelized Cost Analysis for Renewable Ammonia Production in Chile. Energy 2025, 335, 137554. [Google Scholar] [CrossRef] [Scilit]
- Sun, R.; Sun, L.; Li, J. Techno-Economic Evaluation of Green Ammonia Synthesis for Renewable Energy Storage Using Rigorous Models. Energy 2025, 336, 138068. [Google Scholar] [CrossRef] [Scilit]
- Economic Research Institute. Machine Operator Salary in Spain. Available online: https://www.erieri.com/salary/job/machine-operator/spain (accessed on 1 December 2025).
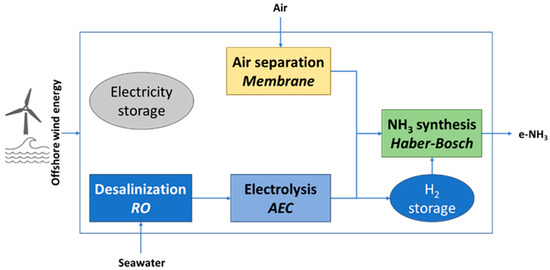
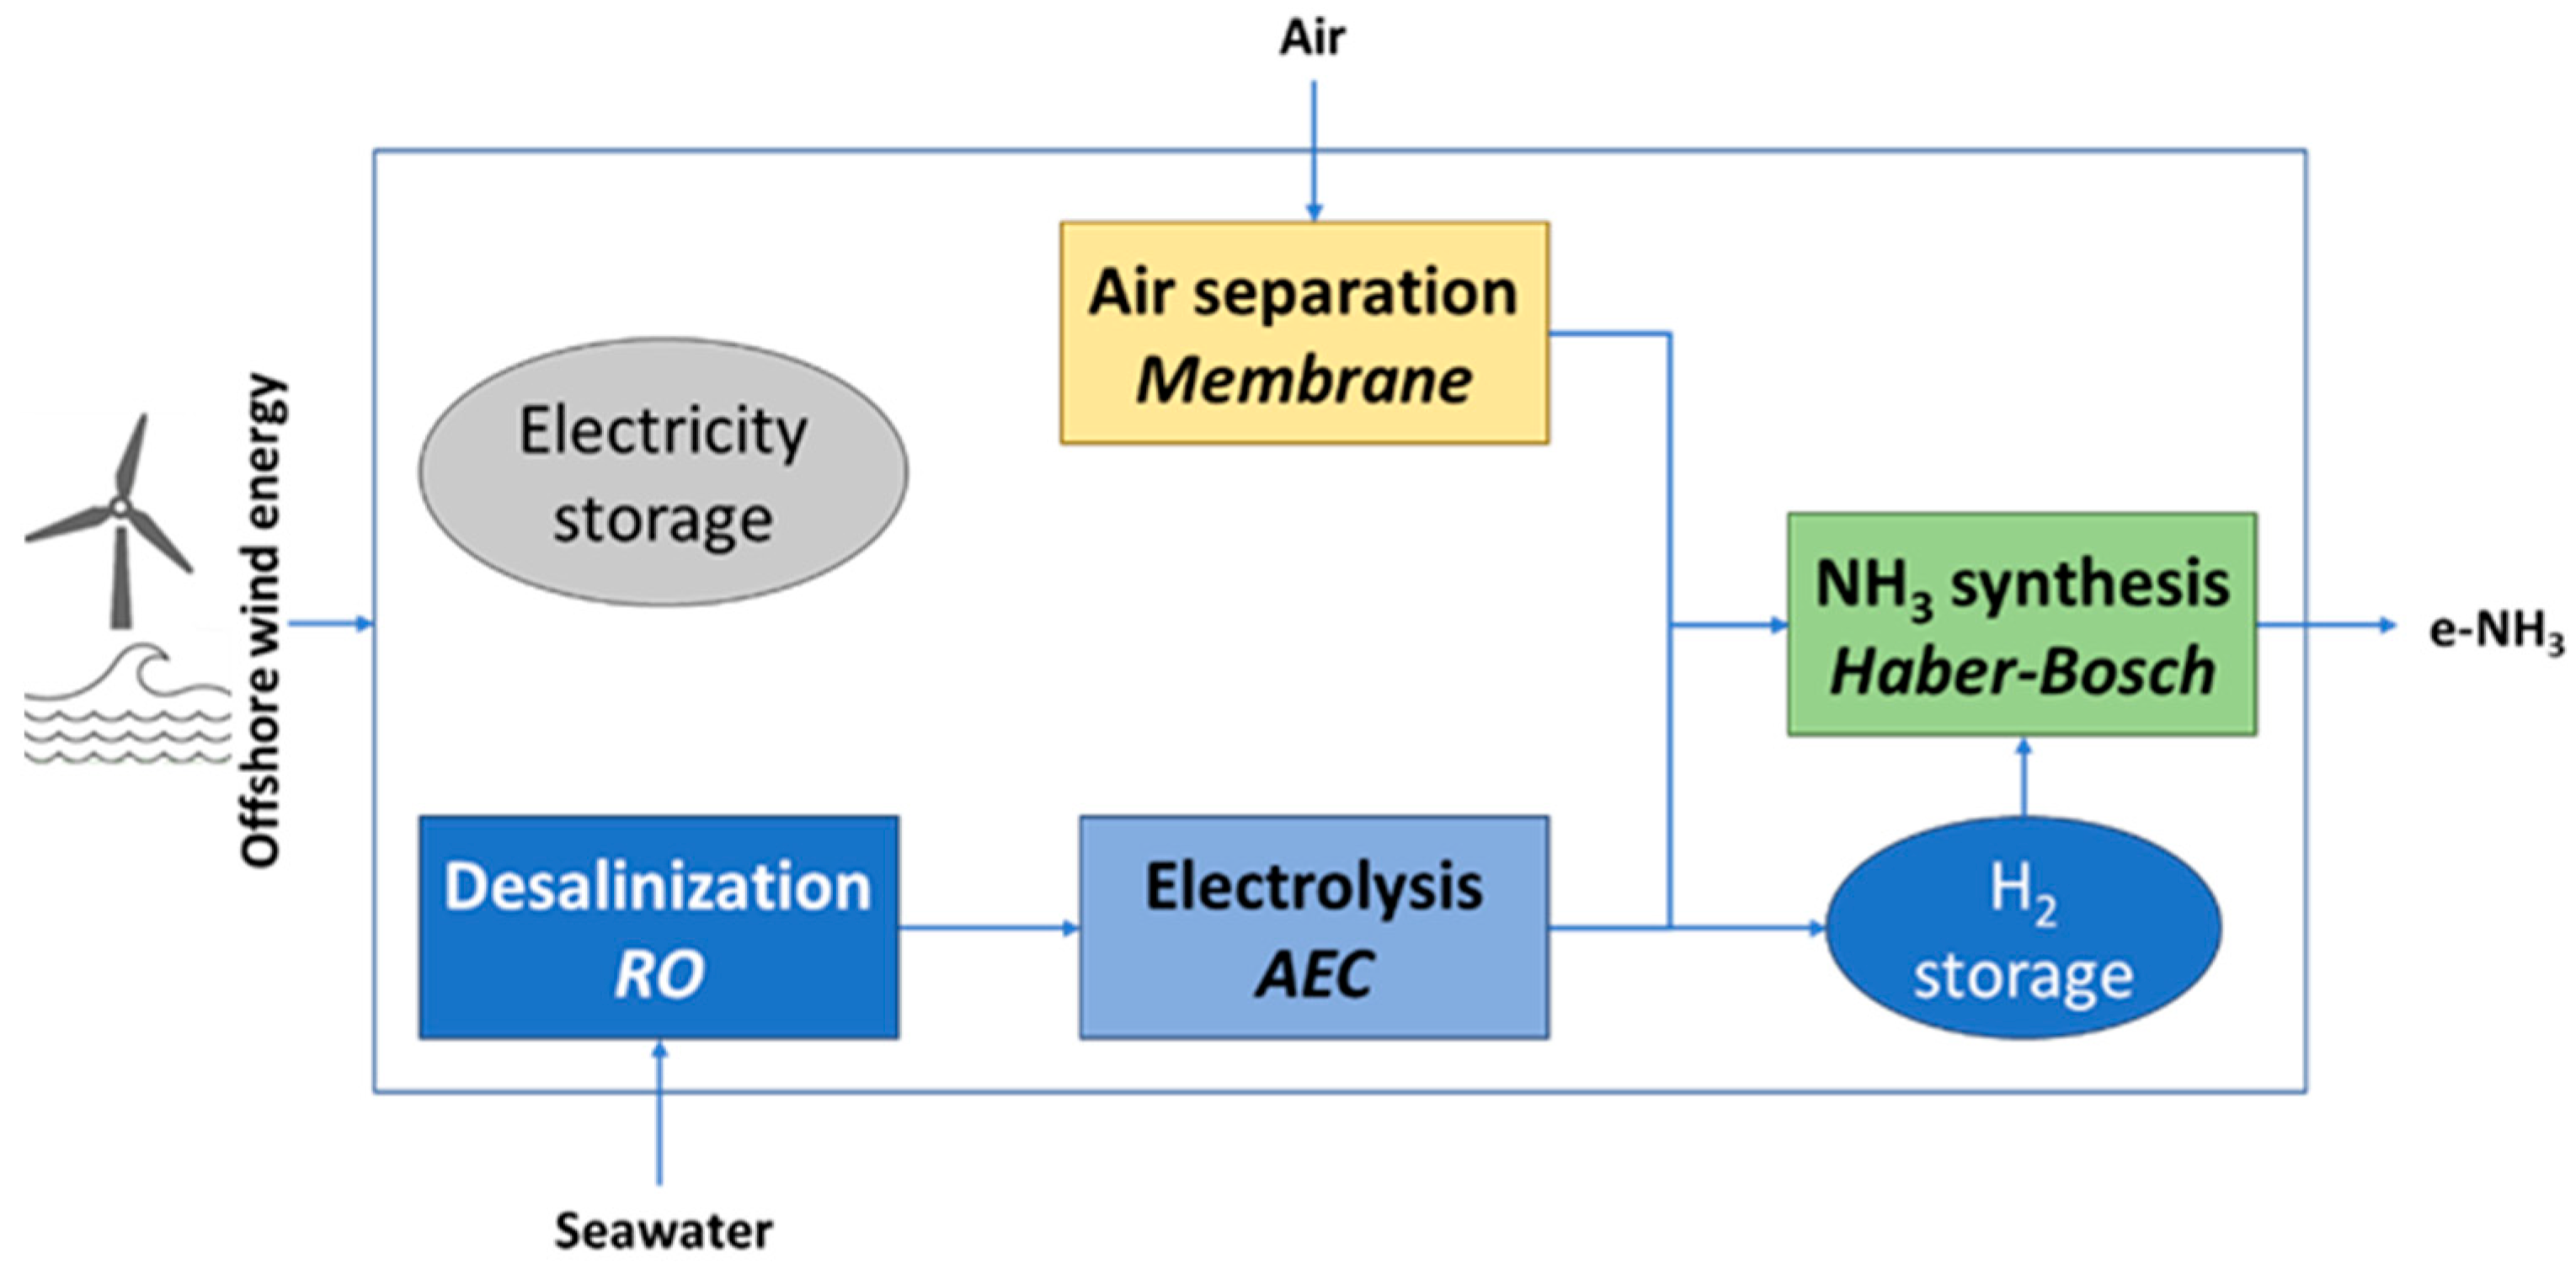
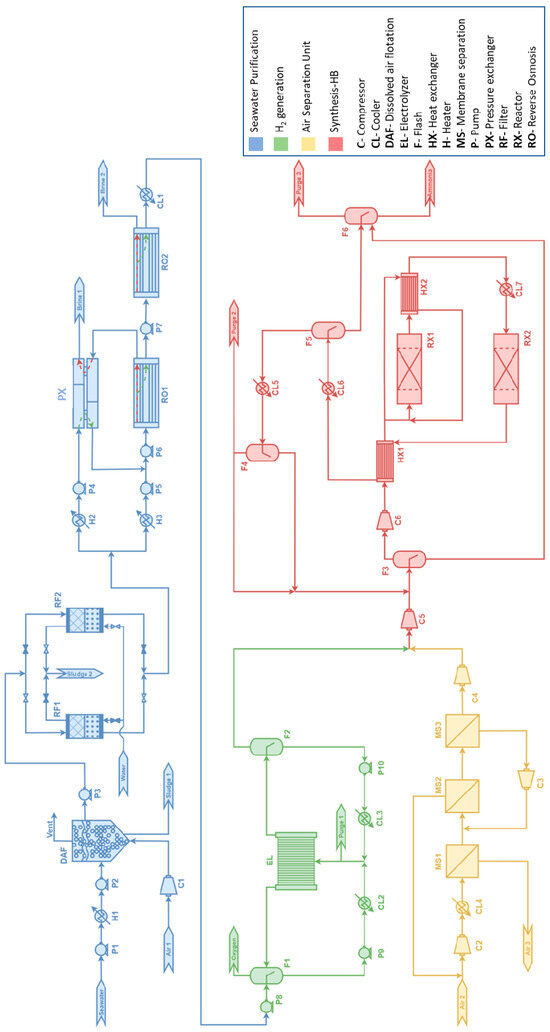
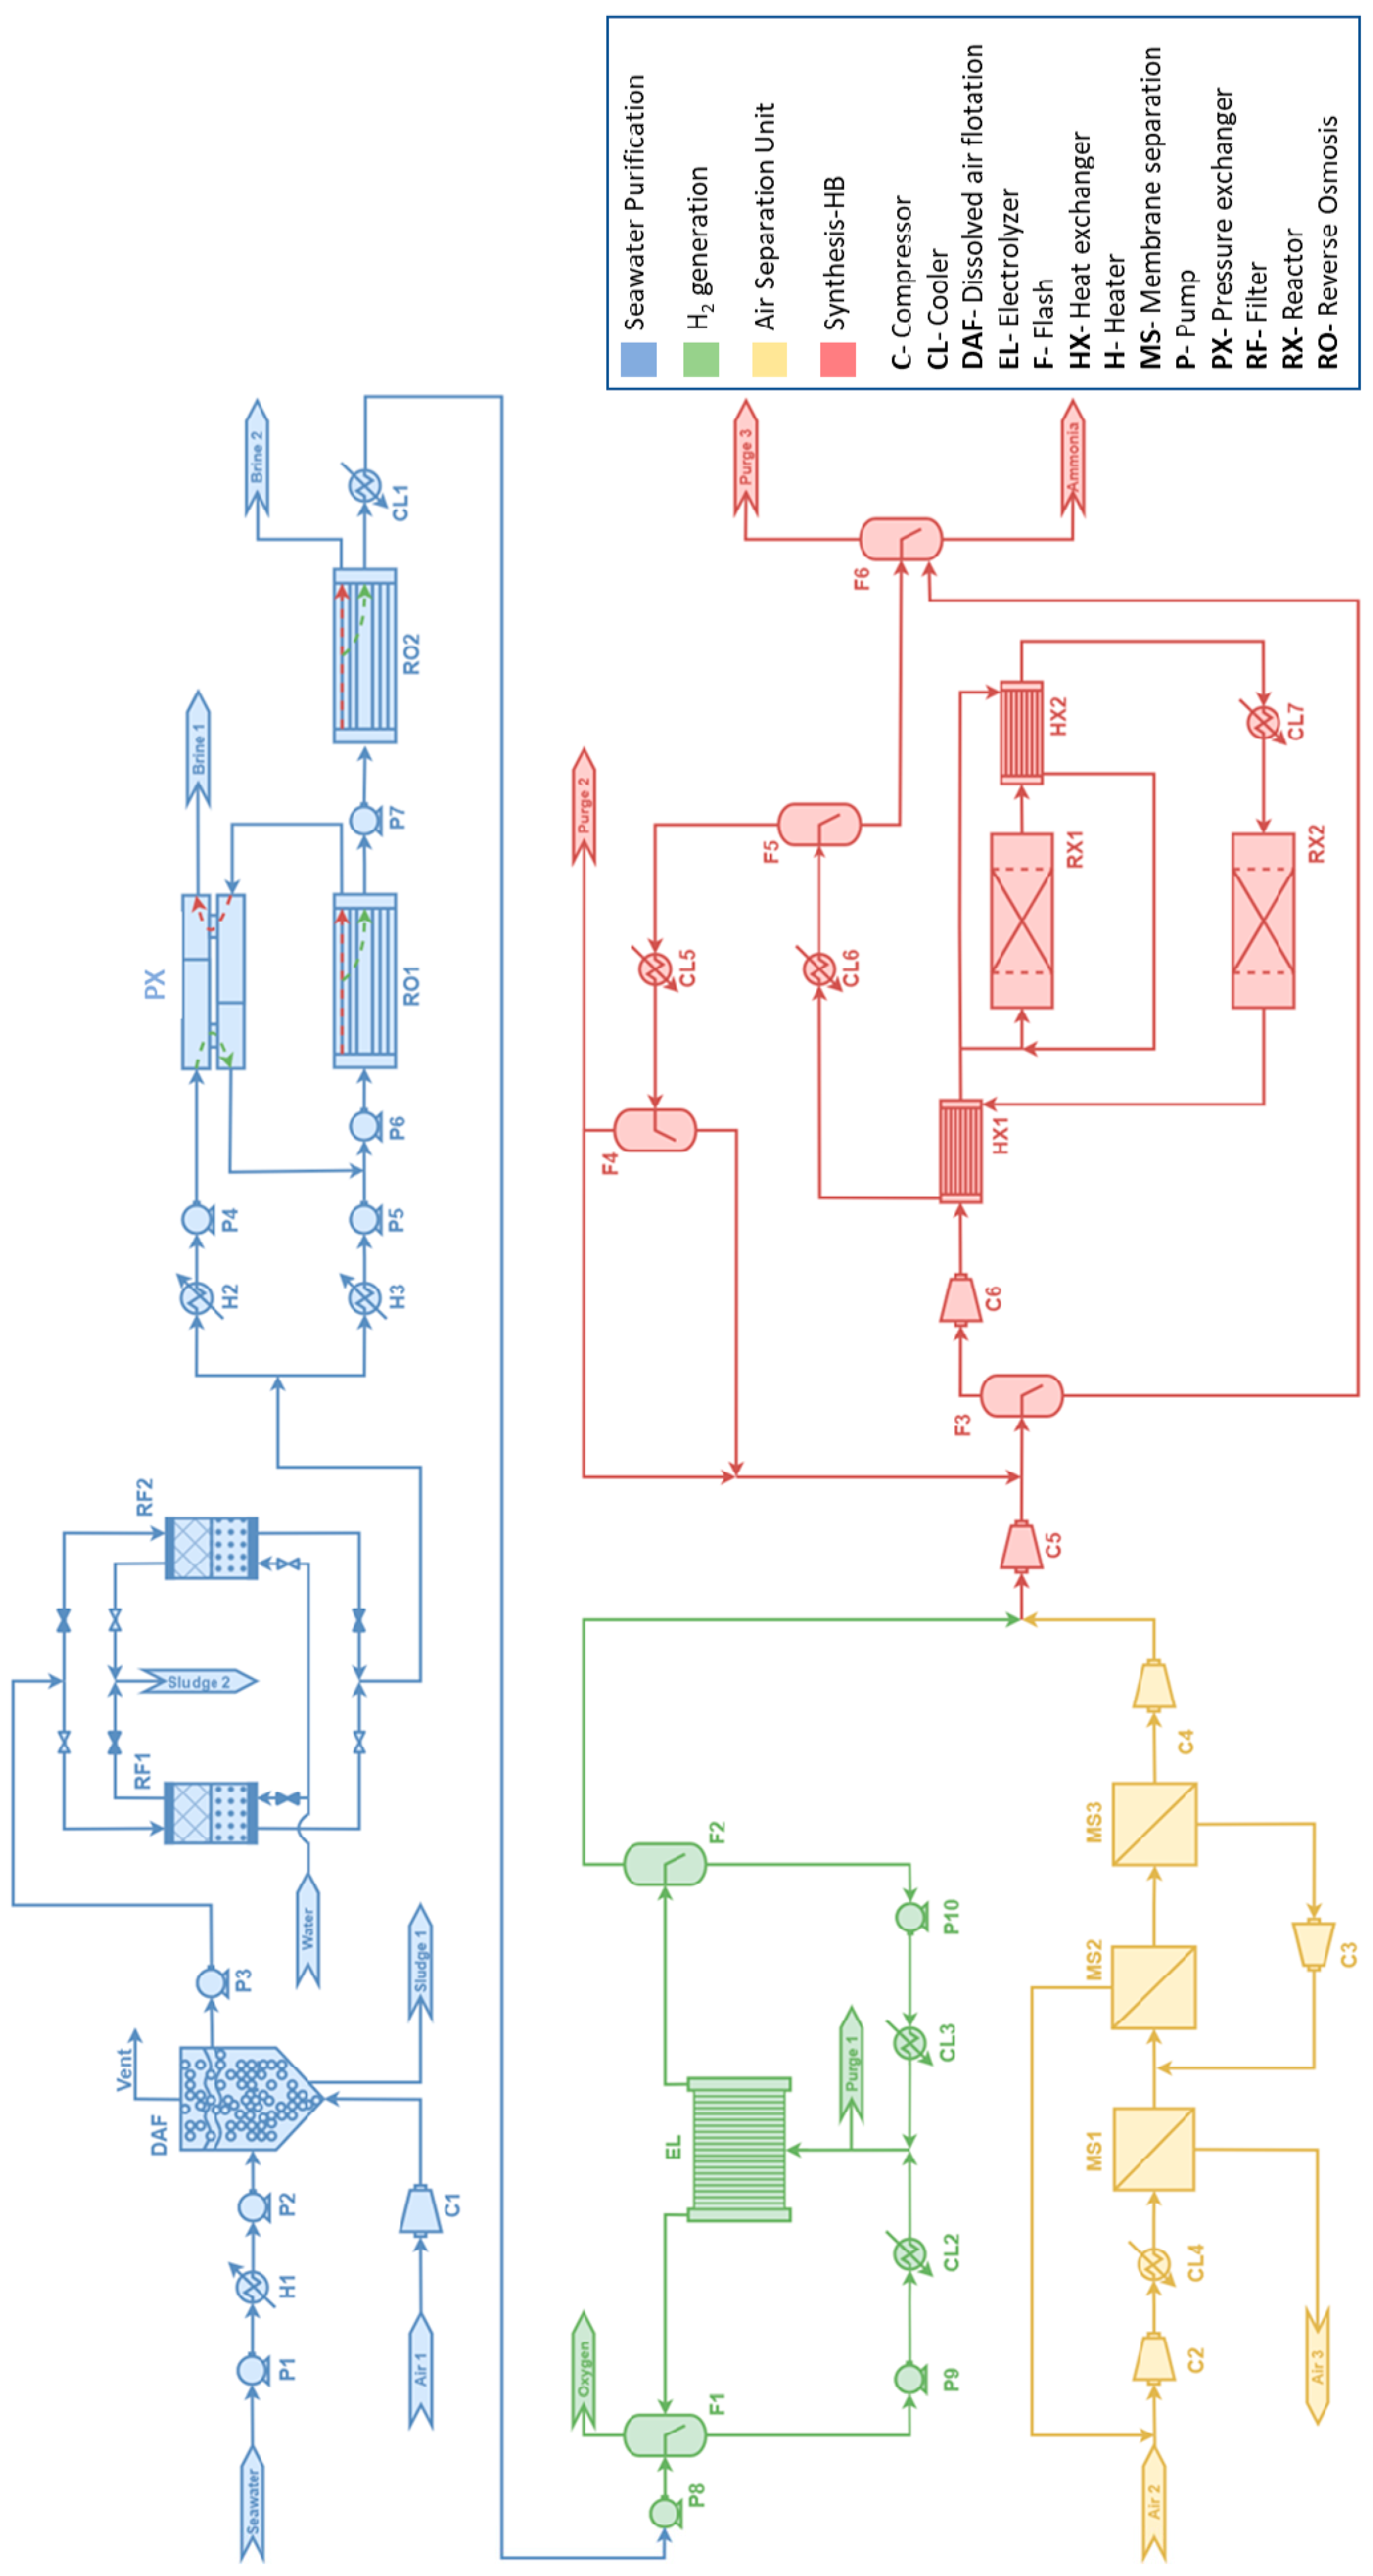
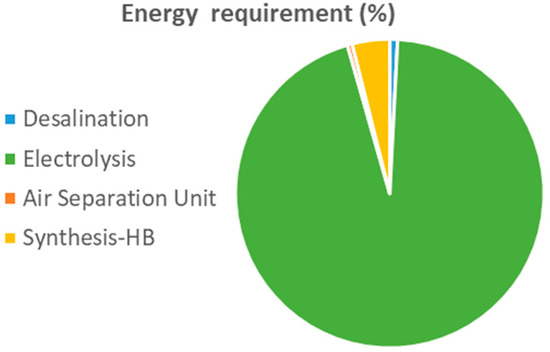
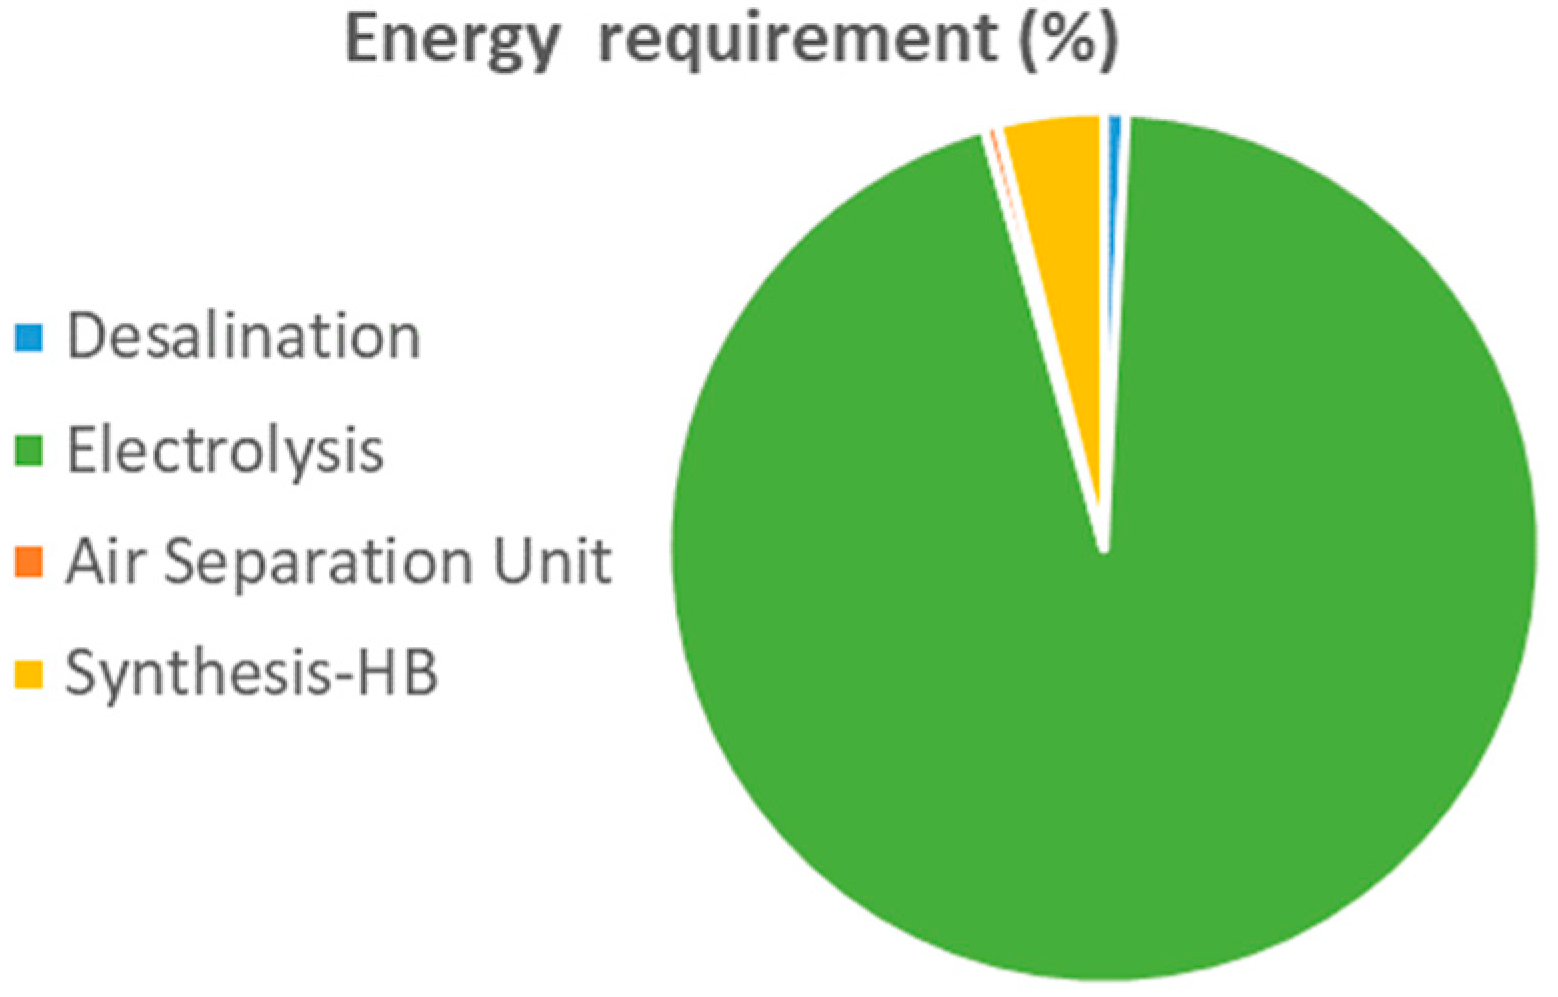
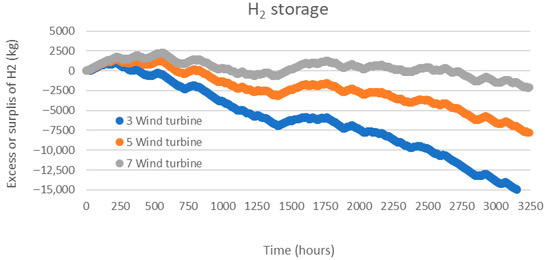
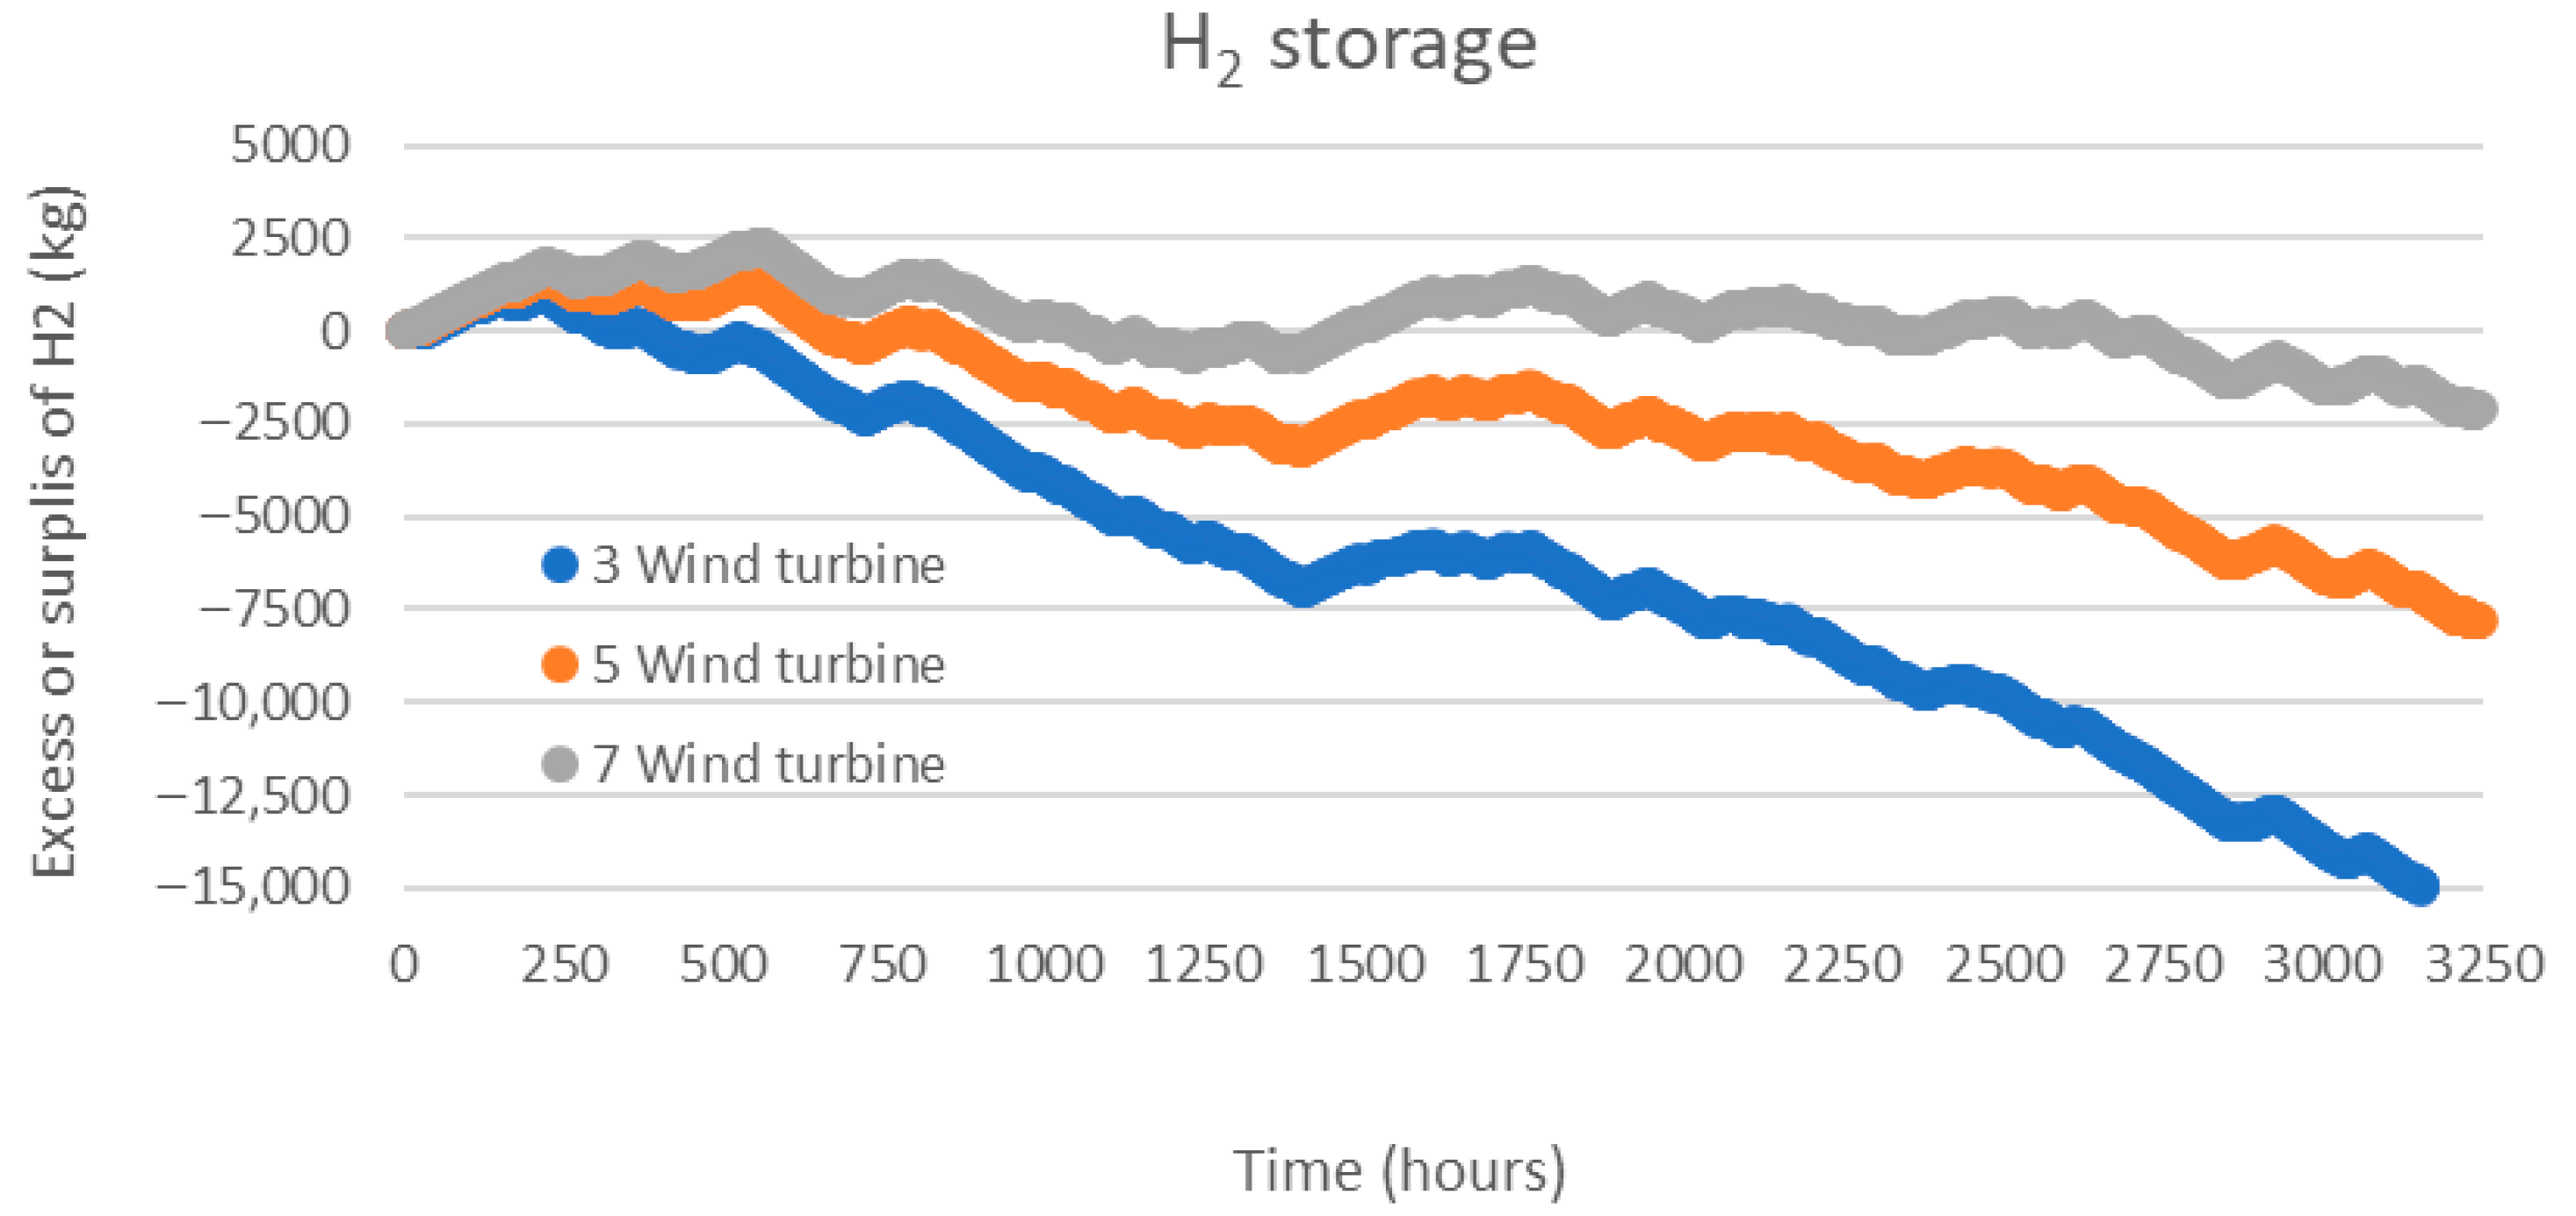
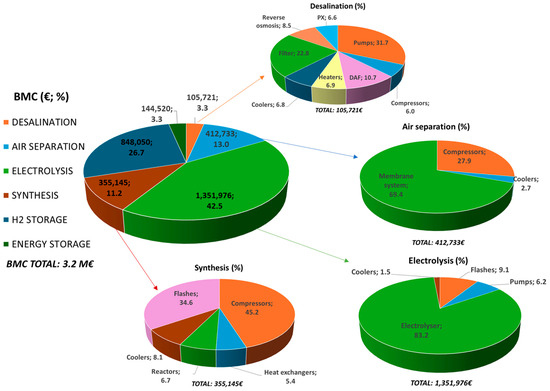
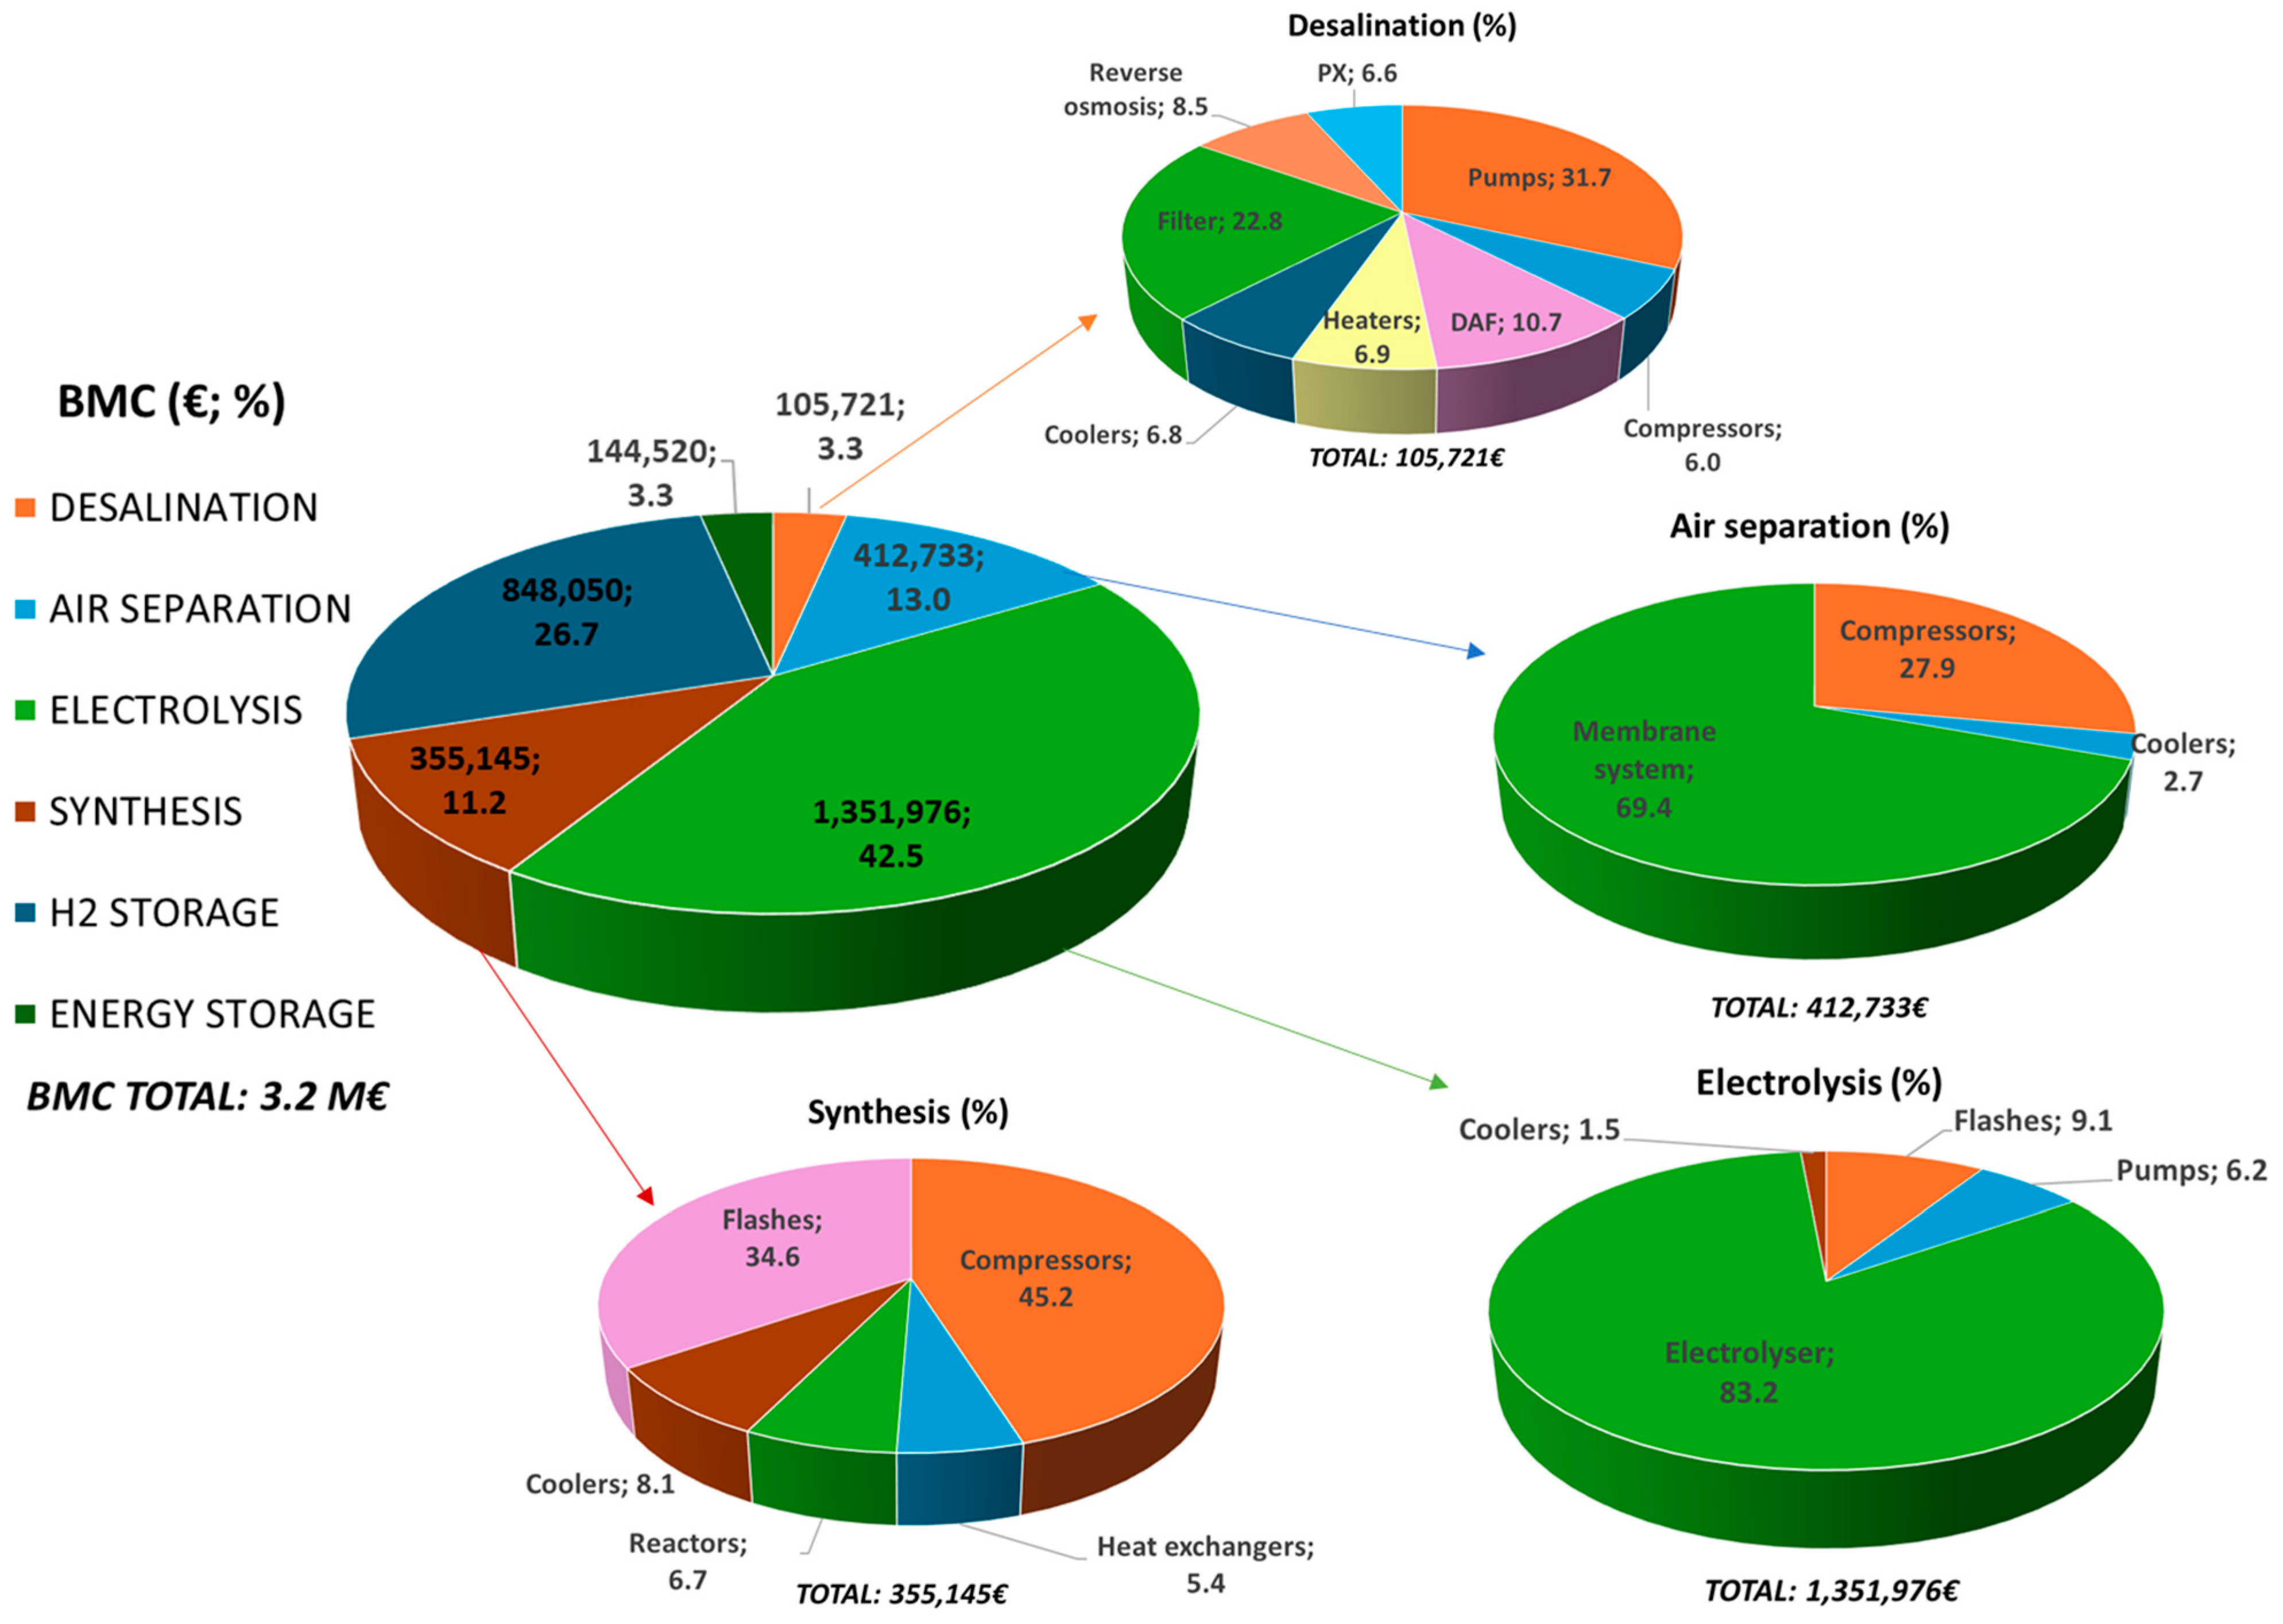
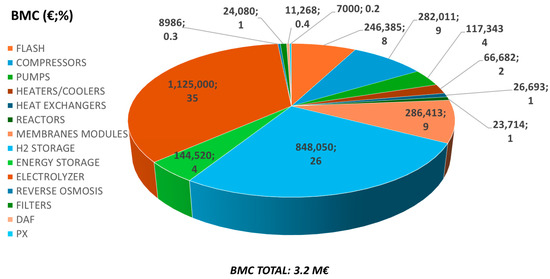
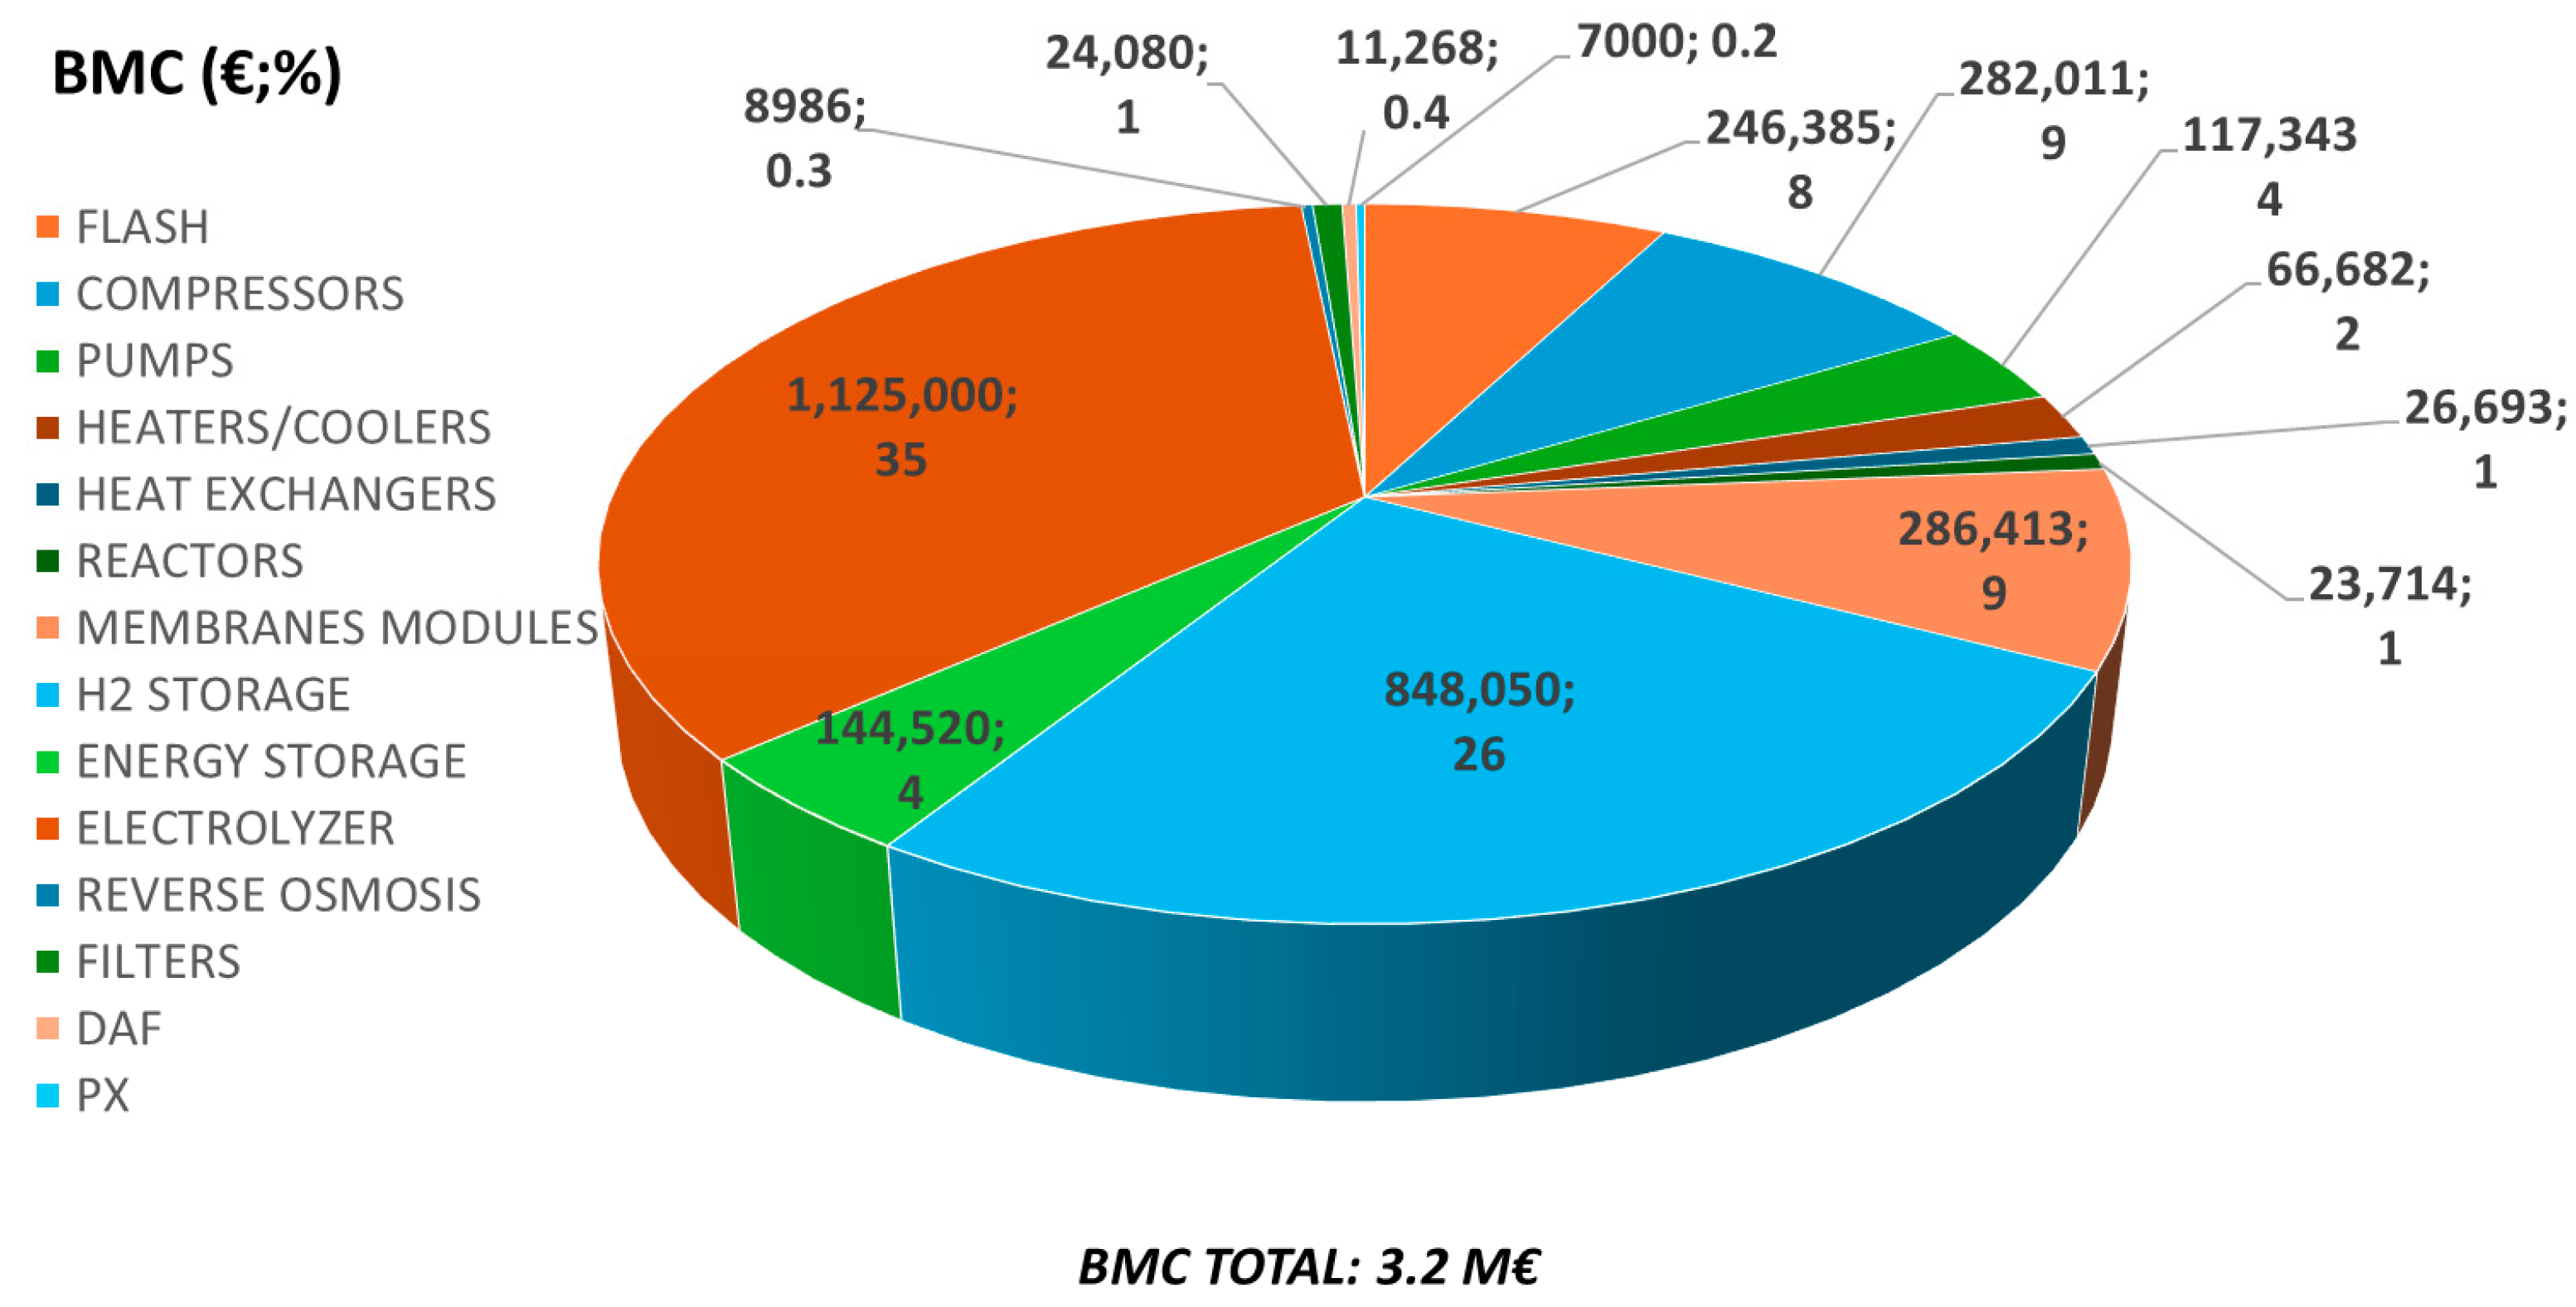
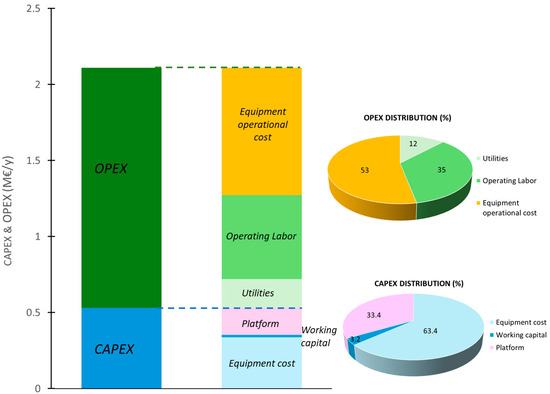
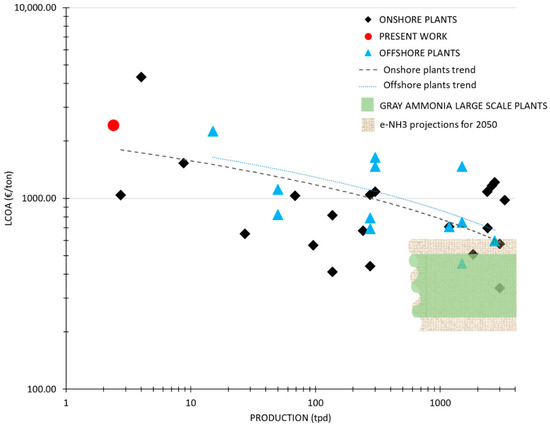
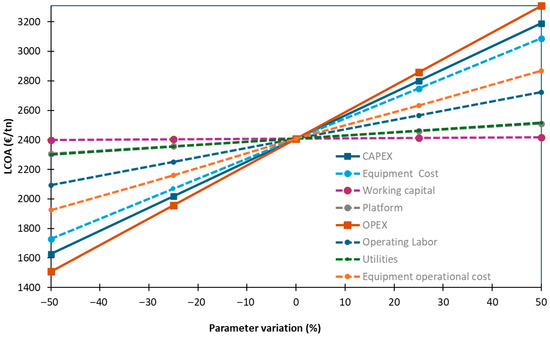
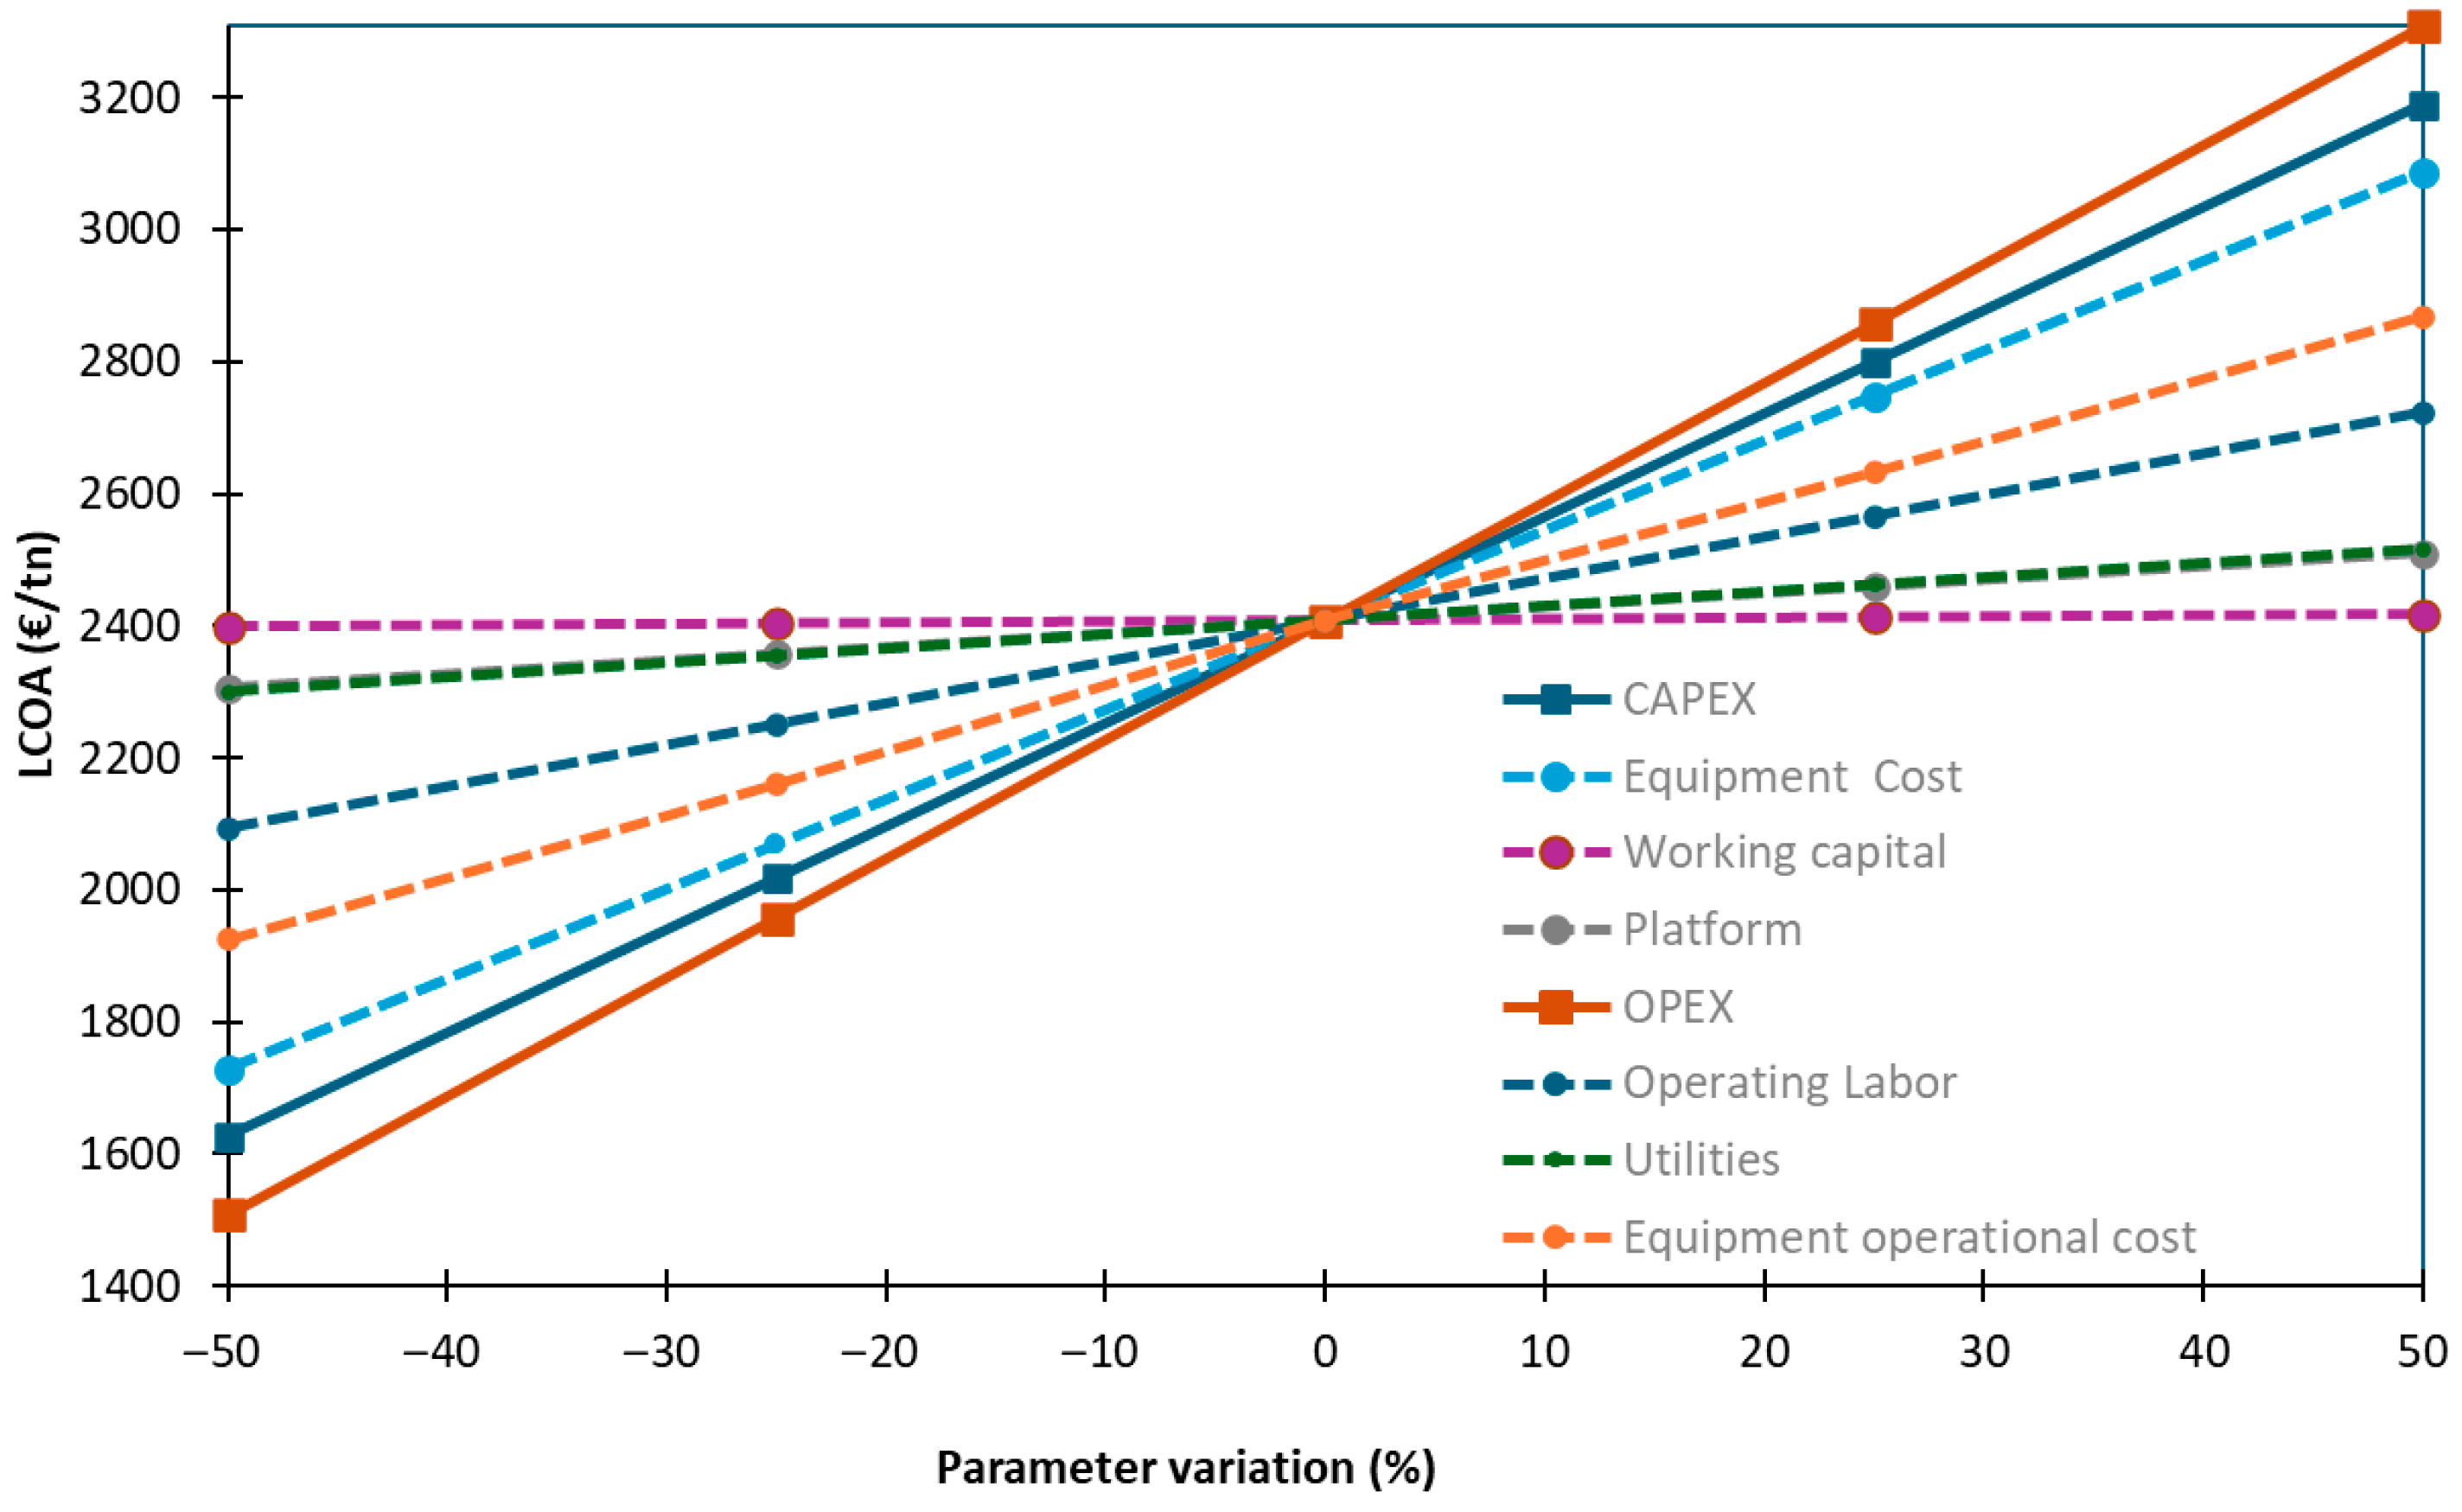
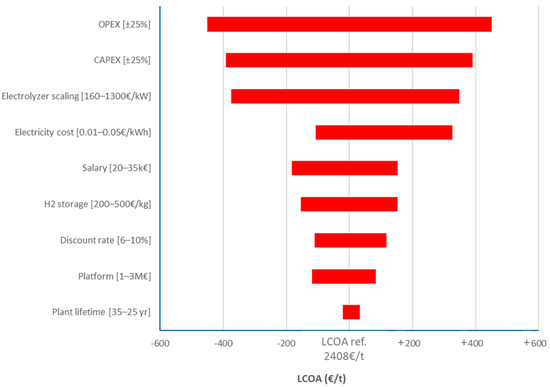
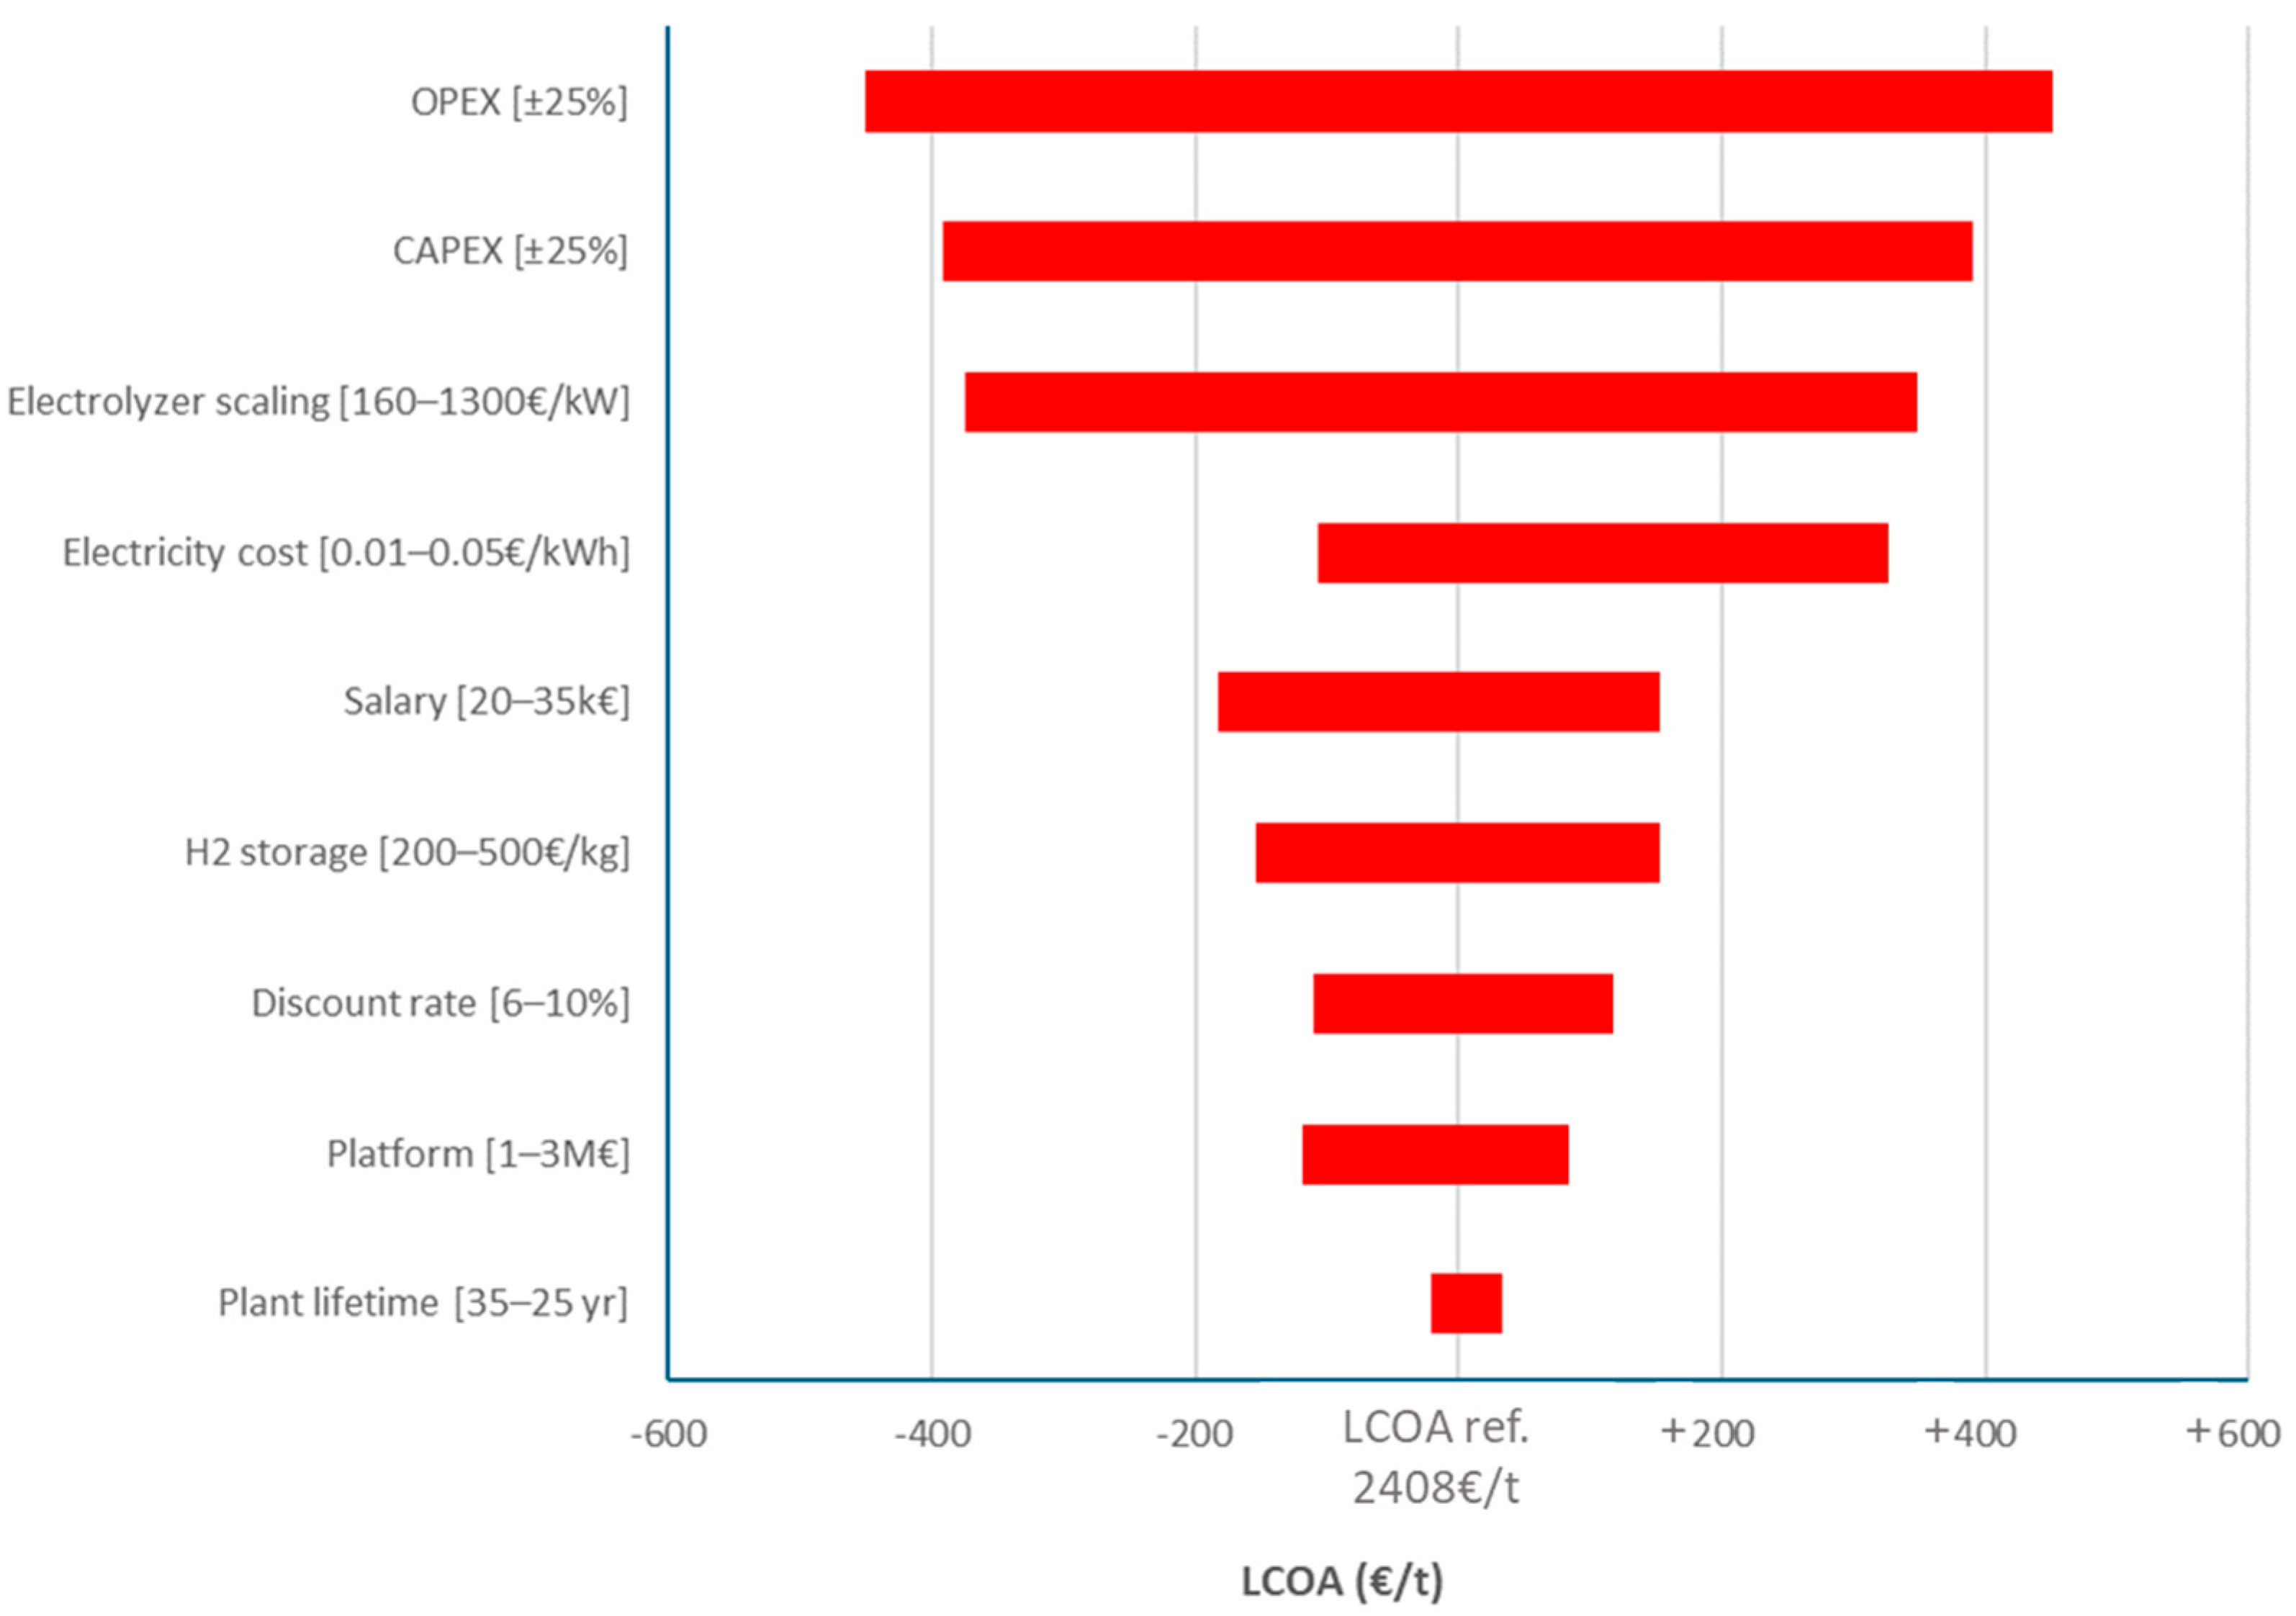

Disclaimer/Publisher’s Note: The statements, opinions and data contained in all publications are solely those of the individual author(s) and contributor(s) and not of MDPI and/or the editor(s). MDPI and/or the editor(s) disclaim responsibility for any injury to people or property resulting from any ideas, methods, instructions or products referred to in the content. |
© 2026 by the authors. Licensee MDPI, Basel, Switzerland. This article is an open access article distributed under the terms and conditions of the Creative Commons Attribution (CC BY) license.