


Abstract
Background/Objectives: Transcription factor 4 (TCF4) is a proneural basic helix–loop–helix transcription factor that plays a critical role in brain development and is associated with a variety of psychiatric disorders, including autism spectrum disorder (ASD), major depressive disorder, and schizophrenia. Autosomal dominant mutations in TCF4 result in a profound neurodevelopmental disorder called Pitt–Hopkins Syndrome (PTHS). Germline TCF4 loss-of-function (LOF) studies using human and mouse models have identified dysregulation in neural cell proliferation, genesis, and specification, which leads to disruption in neuronal, astroglial, and oligodendroglial lineages. In this study, we focused on the role of TCF4 in the genesis of the astrocyte lineage, specifically in the context of modeling PTHS. Methods: We investigated the expression of astrocyte marker genes in primary astrocyte cultures and whole-brain lysates, as well as assessed pan- and subclass-specific astrocyte markers, using immunohistochemical (IHC) analysis in a heterozygous mouse model of PTHS. Lastly, we tracked ventrally derived astrocytes using an Nkx2.1 reporter mouse to investigate misallocation of ventrally derived astrocytes into the dorsal cortex, a phenotype previously observed when both Tcf4 alleles were conditionally deleted in the Nkx2.1 lineage. Results: We show that germline heterozygous mutations in Tcf4 had no effect on the expression of astrocyte markers via qPCR or astrocyte cell density with IHC analysis. Germline heterozygous Tcf4 LOF also did not result in misallocation of ventrally derived astrocytes into the dorsal cortex. Conclusions: These data indicate that germline heterozygous TCF4 LOF, which models PTHS, does not appear to significantly affect the astrocyte lineage at the cell population level.
1. Introduction
Autism spectrum disorder (ASD) is a highly heritable, common childhood disorder, reported to occur in between 3.4 and 62.6 out of every 1000 children [1,2]. Core features of ASD include impaired social interaction, delayed or absence of language, and stereotypical patterns of behavior and can present with other comorbidities, such as intellectual disability, epilepsy, anxiety, depression, attention deficits, and sleep disorders [3]. The majority of ASD cases are thought to stem from common variant risk [4,5], while approximately 10% of cases are driven by rare and de novo variants that confer substantial risk [6,7]. One syndromic form of ASD is Pitt–Hopkins syndrome (PTHS), which is caused by loss-of-function (LOF) mutations in the transcription factor 4 (TCF4) gene (not to be mistaken for TCF7L2, which encodes T-Cell Factor 4). PTHS is a rare neurodevelopmental disorder characterized by intellectual disability, failure to acquire language, deficits in motor learning, hyperventilation, gastrointestinal abnormalities, and autistic behavior [8]. Although TCF4 LOF is clearly causal for PTHS, the downstream cellular and molecular mechanisms and pathophysiology are not fully established. One potential pathophysiological mechanism is related to the role of TCF4 in regulating cell fate and specification during cortical development.
TCF4 is highly expressed in dorsal and ventral neuroprogenitor cells in the developing central nervous system (CNS), where it is shown to regulate proliferation, differentiation, and specification [9,10,11]. Heterozygous Tcf4 LOF, which models PTHS, has been shown to alter the proportions of upper-layer excitatory neurons, distinct classes of inhibitory neurons, and the oligodendroglial (OL) lineage [9,12,13,14,15]. Tcf4 also appears to regulate astroglia, as germline homozygous Tcf4 LOF results in a severe depletion of midline glia (GFAP+) in the indusium griseum and callosal wedge [10]; in addition, conditional homozygous deletion in the Nkx2.1 lineage results in ectopic misallocation of ventrally derived astrocytes in the dorsal neocortex [16].
Astrocytes are a heterogeneous subset of glial cells that play diverse functional roles in the central nervous system, and their dysregulation is associated with several neurological and neuropsychiatric disorders. Representing 20–40% of cells within the human neocortex, astrocytes perform a multitude of functions. They participate in synaptic function by maintaining ion and neurotransmitter homeostasis, providing metabolic support, and releasing gliotransmitters, which can modulate synaptic transmission [17]. Their direct communication with neurons leads to an essential role for astrocytes in brain development, contributing to synaptogenesis, synaptic development, axon guidance, and synapse and axon pruning [18,19,20].
Astrocytes are implicated in a variety of neurodegenerative and neuropsychiatric disorders, including multiple sclerosis, Alzheimer’s disease, Parkinson’s disease, Huntington’s disease, and neuropsychiatric disorders [21]. Emerging evidence suggests that ASD risk genes functionally converge on the regulation of neural progenitor cell proliferation and differentiation during corticogenesis [22,23,24], which could lead to alterations in the density of astrocytes. In addition, the diverse functional roles of astrocytes that contribute to regulating brain development and synaptic function also implicate their potential association with ASD etiology and pathophysiology. However, so far, evidence of a role for astrocytes in ASD pathophysiology remains relatively scarce, with a few postmortem brain studies identifying alterations in the number of astrocytes in ASD brains compared to controls [17] and a single nuclear RNA sequencing study that identified evidence for an elevated state of activation in glial cell types, including astrocytes [25].
In this study, we focused on the role of Tcf4 in the regulation of the astrocyte lineage in the context of PTHS. Specifically, we asked if a germline heterozygous Tcf4 mutation (Tcf4+/tr) alters astrocyte marker gene expression and/or the density of astrocytes in the dorsal cortex, using established methods, brain regions, and mouse models that previously identified abnormal densities in OLs and inhibitory neurons [12,13]. We show no appreciable effect on astrocyte marker gene expression in primary astrocyte cultures and whole-brain samples from Tcf4+/tr mice. Similarly, Tcf4+/tr mice showed no difference in the total density of astrocyte populations (SOX9+) or in the density of fibrous (GFAP+) or protoplasmic (s100β+) subclasses of astrocytes in the late adolescent cortex. Lastly, using Nkx2.1-cre::TdTom reporter mice to label ventrally derived cells, we show that Nkx2.1-cre::TdTom::Tcf4+/tr mice show no difference in the density of ventrally derived astrocyte populations residing in the dorsal cortex. Together, these results indicate that the germline Tcf4 mutation, which models PTHS, does not appear to significantly alter the overall population density of cortical astrocytes or the cortical domains in which they reside based on their origin in the murine dorsal cortex.
2. Materials and Methods
2.1. Animals and Tissue Collection
The Tcf4+/tr mouse model of PTHS is heterozygous for an allele-encoding deletion of the DNA-binding domain of Tcf4 (B6;129-TCF4tm1Zhu/J, stock #013598, Jackson Laboratory, Bar Harbor, ME, USA). TdTom is listed as B6.Cg-Gt(ROSA) 26Sortm14(CAG-tdTomato)Hze/J (Jackson Laboratory stock #007909). Nkx2.1-Cre is listed as C57BL/6J-Tg(Nkx2-1-cre)2Sand/J (Jackson Laboratory stock #008661). Mouse colonies were backcrossed for at least ten generations in the C57/B6 background, maintained by the Lieber Institute for Brain Development’s Animal Facility on a 12 h light/dark cycle and fed ad libitum. Tcf4+/tr mouse samples were matched with samples from wildtype (Tcf4+/+) littermates, and sex was randomly selected in each genotype and age group. A total of 21 Tcf4+/tr mice and 19 Tcf4+/+ mice were euthanized within the experiments discussed in this manuscript. All procedures were performed in accordance with the National Institutes of Health Guide for the Care and Use of Laboratory Animals and approved by the Johns Hopkins University School of Medicine’s Institutional Animal Care and Use Committee.
2.2. Immunohistochemistry
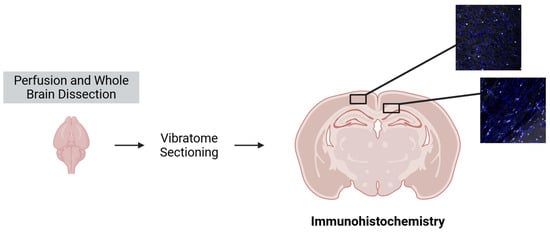
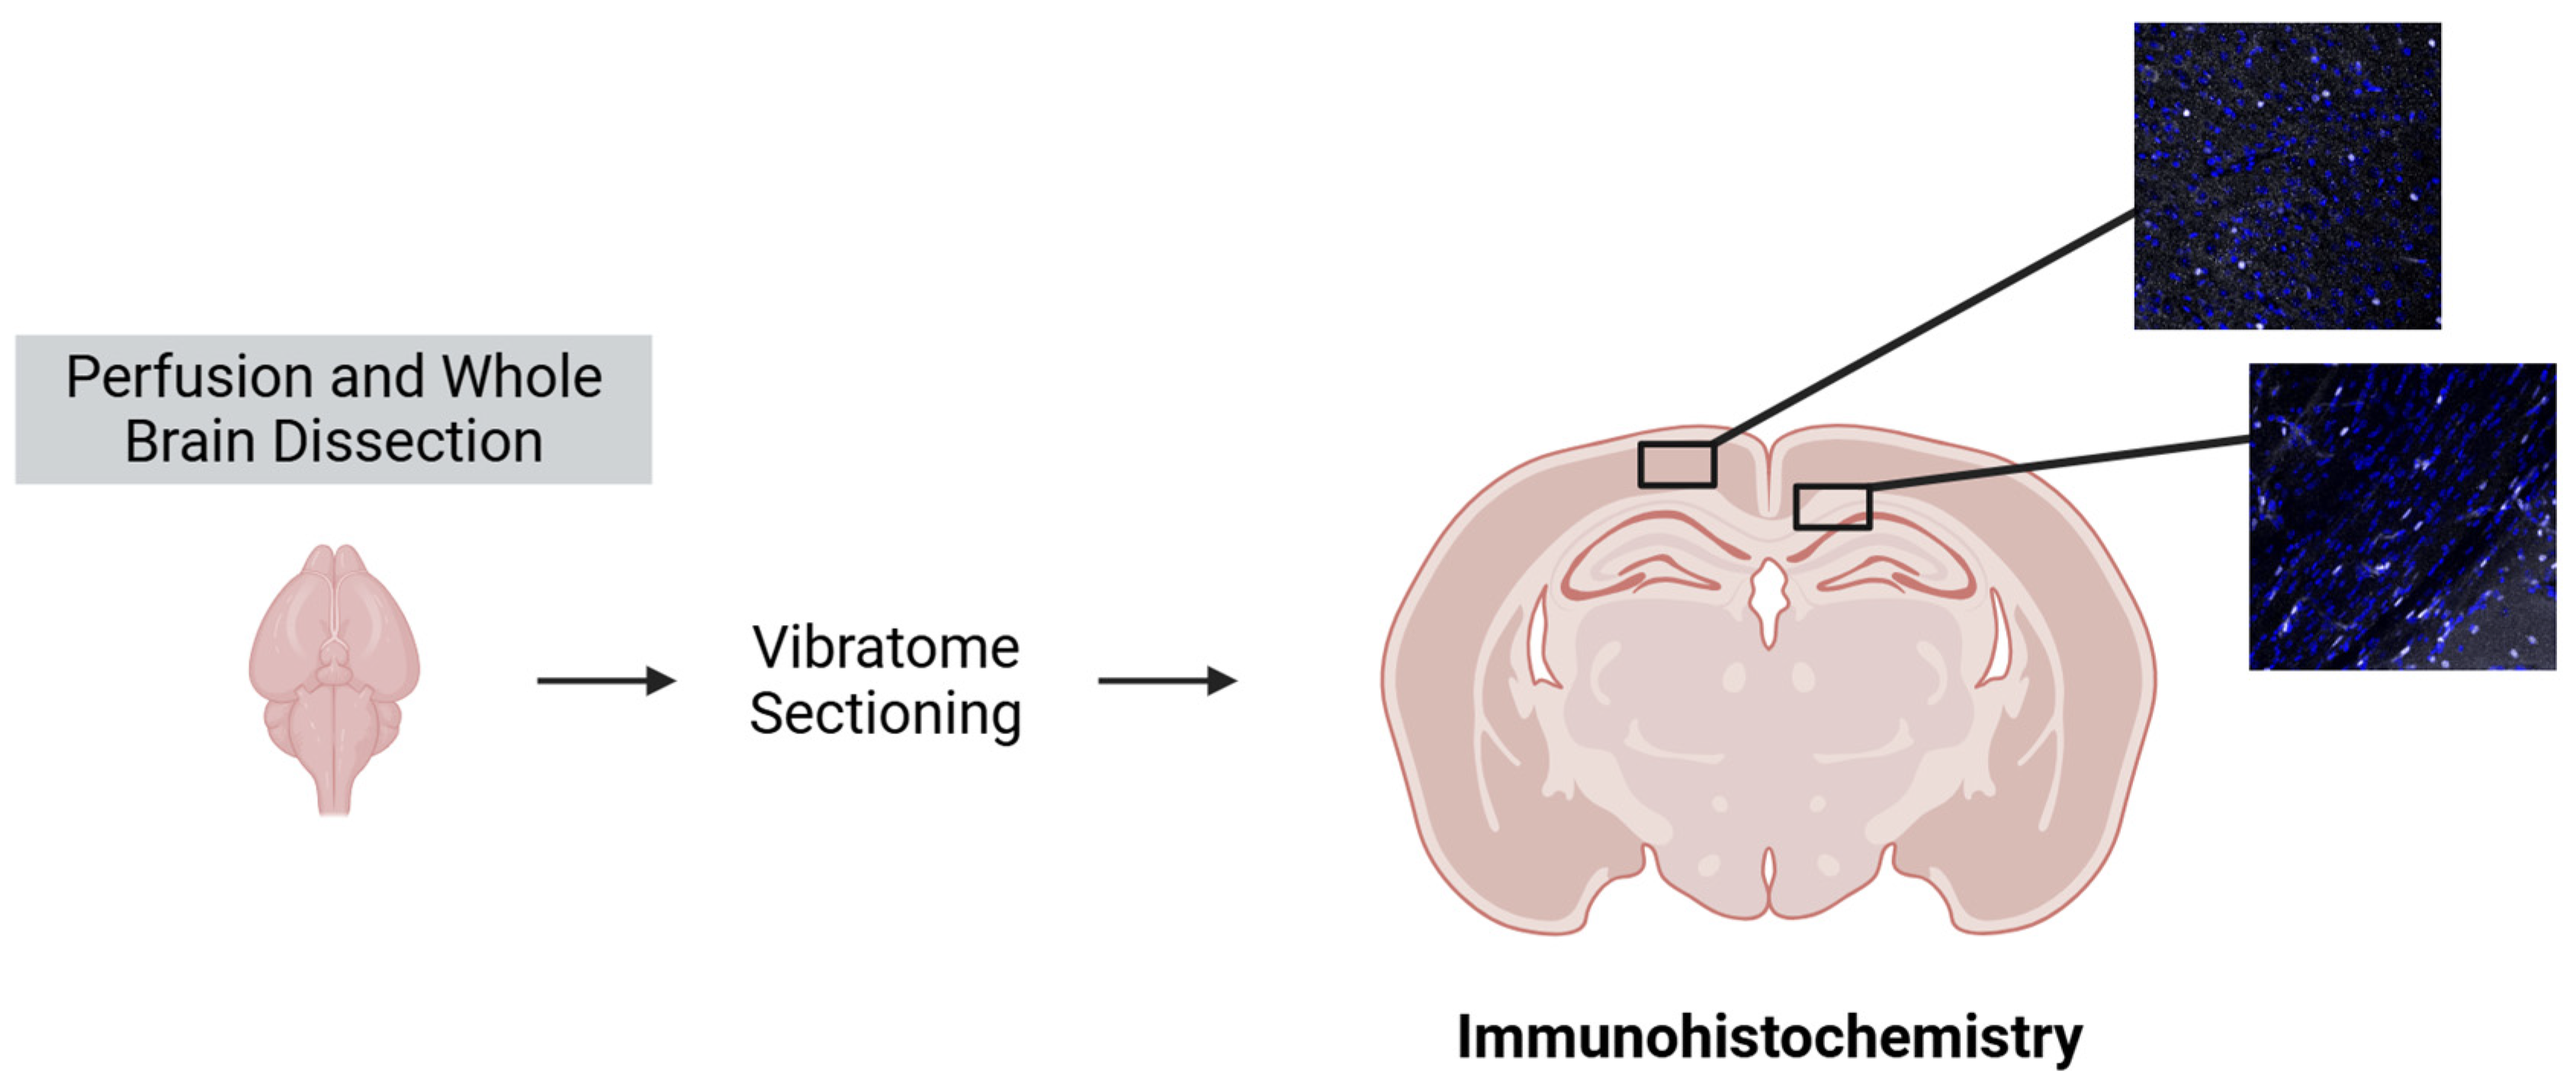
Mice (postnatal days 28 and 42) were euthanized by being deeply anesthetized with isoflurane (5%) and perfused with cold PBS, followed by 4% paraformaldehyde (4% PFA). Brains were dissected out and post-fixed in 4% PFA at 4 °C overnight before being transferred to PBS. Sections were sliced to a thickness of 55 µm using a Leica VT1000S vibratome (Leica Biosystems, Nussloch, Germany). Slices were washed three times with 0.4% Tween-20 and blocked in goat serum (10%) for 2 h at room temperature on an orbital shaker. After blocking, the primary antibody was added to goat serum (2%) in 0.4% Tween-20, and slices were incubated at 4 °C overnight. The following day, slices were washed three times with 0.4% Tween-20 and incubated with secondary antibody for 2h at room temperature. Following incubation, slices were washed three times with 0.4% Tween-20 before counterstaining with DAPI (D1306, Invitrogen, Waltham, MA, USA). Visualization was carried out on a ZEISS LSM 700 Confocal (Leica Microsystems, Wetzlar, Germany). To control for brain regional heterogeneity of astrocyte density, all staining was performed on coronal sections containing the dorsal hippocampus (−1.655 mm from Bregma on the adult mouse Allen Brain Atlas) [26]. Images were taken of layer 5 of the primary motor area in the cortex and the CC (Figure 1) for blinded, manual quantifications using the Cell Counter plugin on ImageJ/Fiji version 2.16.01/1.54p [27]. For each animal, two images per brain region were analyzed for cell counts. The cell count values from those two images were averaged for cell count summary plots. Quantifications for cell counts were standardized by cells per mm2. Countable cells were defined as cells positive for both immunohistochemical and DAPI signals. A total of 8 Tcf4+/tr mice and 9 Tcf4+/+ mice were euthanized for P42 IHC experiments. A total of 5 Tcf4+/tr mice and 5 Tcf4+/+ mice were euthanized for P28 IHC experiments. Below is a list of antibodies used in this study.
Figure 1.
Graphical representation of the cortex and CC regions quantified using IHC. Graphical representation of the two brain regions imaged and analyzed for IHC experiments. Analyzed brain regions included the cortex in layer 5 of the primary motor area and the CC. Coronal sections containing the dorsal hippocampus (−1.655 mm from Bregma) were selected for staining to control for brain regional heterogeneity.
2.3. IHC Antibodies
SOX9 1:250 rabbit HPA001758 (Millipore-Sigma, Burlington, MA, USA).
GFAP 1:500 chicken ab4674 (abcam, Waltham, MA, USA).
s100β 1:500 chicken S100B-0100 (aveslabs, Davis, CA, USA).
Alexa Fluoro 488 Goat anti-Chicken 1:1000 A11039 (Invitrogen, Waltham, MA, USA).
Alexa Fluoro 488 Goat anti-Rabbit 1:1000 A11008 (Invitrogen, Waltham, MA, USA).
Alexa Fluoro 546 Goat anti-Rabbit 1:1000 A11010 (Invitrogen, Waltham, MA, USA).
Alexa Fluoro 647 Goat anti-Chicken 1:1000 A32933 (Invitrogen, Waltham, MA, USA).
Alexa Fluoro 633 Goat anti-Rabbit 1:1000 A21071 (Invitrogen, Waltham, MA, USA).
2.4. Primary Astrocyte Cultures
Primary astrocytes were prepared as previously described, with modifications [28,29]. Briefly, cortices were extracted and meninges removed from postnatal day 2–3 pups. After dissection, cortices were triturated with a 1 mL pipette 10 times to break down the tissue into smaller pieces. The tissue was then incubated with 300 μL 2.5% trypsin-EDTA (Gibco, Waltham, MA, USA) and 100 μL DNase (100 μg/mL; Millipore-Sigma, Burlington, MA, USA) on a shaker at 150 rpm at 37 °C for 30–45 min. Subsequently, the cells were passed through a 40 μm mesh filter and plated in glial media (MEM, 5% FBS, Glucose (20 mM), Sodium bicarbonate (0.2 mg/mL), L-Glutamine (2.5 mM) and 1% Pen/Strep). After 24 h, the plates were vigorously tapped and shaken to remove any loosely attached cells. The cells were cultured for 6 days with medium changes every other day before collection in TRIzol (Life Technologies, Waltham, MA, USA) for RNA extraction. A cohort of 5 Tcf4+/tr pups and 2 Tcf4+/+ pups were euthanized for primary astrocyte cultures.
2.5. RNA Isolation and qPCR
The transcription expression of genes of interest was measured from whole mouse brain lysates at postnatal day 42 and in DIV6 primary astrocyte cultures. Samples were first collected and homogenized using TRIzol (Life Technologies, Waltham, MA, USA). Total RNA was extracted using phenol:chloroform isolation, followed by purification using the RNeasy Mini Prep Kit (74104, Qiagen, Venlo, The Netherlands). Complementary DNA (cDNA) was prepared from purified RNA using the High-Capacity RNA-to-cDNA Kit (4387406, Applied Biosystems, Waltham, MA, USA). qPCR assays were carried out using the QuantStudio3 Real-Time PCR system (Applied Biosystems, Waltham, MA, USA). qPCR was performed according to the manufacturer’s instructions using Taqman probes. Data are expressed as the fold change of the gene of interest normalized to Gapdh expression using 2−ΔΔCT. A cohort of 3 Tcf4+/tr mice and 3 Tcf4+/+ mice was euthanized for the qPCR experiments. Below is a list of Taqman probes used in this study.
Taqman probes:
Sox9 Mm00448840_m1 (Thermo Fisher Scientific, Waltham, MA, USA).
Gfap
Aldh1l1 Mm03048957_m1 (Thermo Fisher Scientific, Waltham, MA, USA).
Ndrg2 Mm00443483_m1 (Thermo Fisher Scientific, Waltham, MA, USA).
Fgfr3 Mm00433294_m1 (Thermo Fisher Scientific, Waltham, MA, USA).
Gja1 Mm01179639_s1 (Thermo Fisher Scientific, Waltham, MA, USA).
Slc1a3 Mm00600697_m1 (Thermo Fisher Scientific, Waltham, MA, USA).
Gapdh Mm99999915_g1 (Thermo Fisher Scientific, Waltham, MA, USA).
2.6. scRNA-seq Analysis
Single-cell RNA sequencing data from human dorsolateral prefrontal cortex samples was obtained from the PsychENCODE brainSCOPE dataset (http://brainscope.psychencode.org; accessed on 7 July 2025) [30]. This dataset comprises >2.8 million nuclei from 388 individuals. Biospecimens with fewer than 10 confidently annotated cell types were excluded to prevent downstream statistical analysis from being skewed by shallow sequencing depth, degraded tissue, or poor capture of the biological ecosystem. Gene expression was pseudobulked by cell type across biological replicates and log-normalized. TCF4 expression distributions were visualized using violin plots, with a reference line indicating mean astrocyte expression.
2.7. Statistical Analysis
Statistical analysis was performed using Prism version 11.0 (GraphPad Software, San Diego, CA, USA). Data were tested for normality using the Shapiro–Wilk test at an alpha level of 0.05. To determine statistical differences between group means between normally distributed data, we used unpaired t-tests. For nonparametric data, we compared the sample distributions using Kolmogorov–Smirnov (KS) tests. Unpaired t-tests were primarily used unless a KS test was indicated in the figure legend. For all tests, a p-value of <0.05 was considered statistically significant; statistical difference was denoted by the following symbols: * p < 0.05, ** p < 0.01, ns nonsignificant. Sample sizes for each experiment are detailed in the figure legends.
3. Results
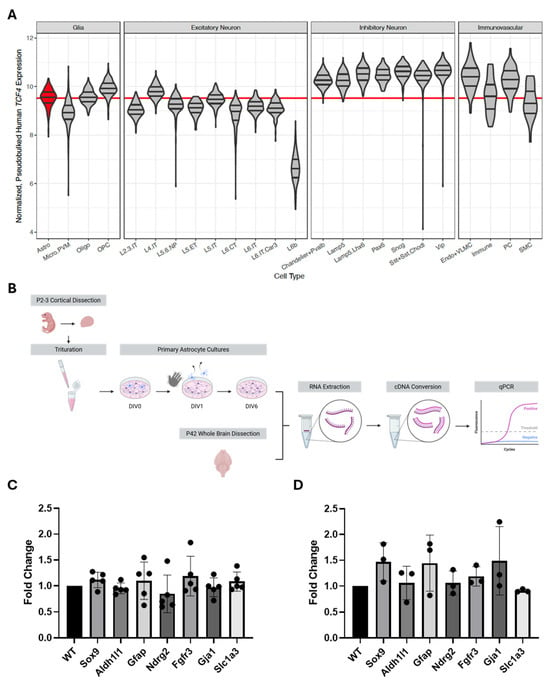
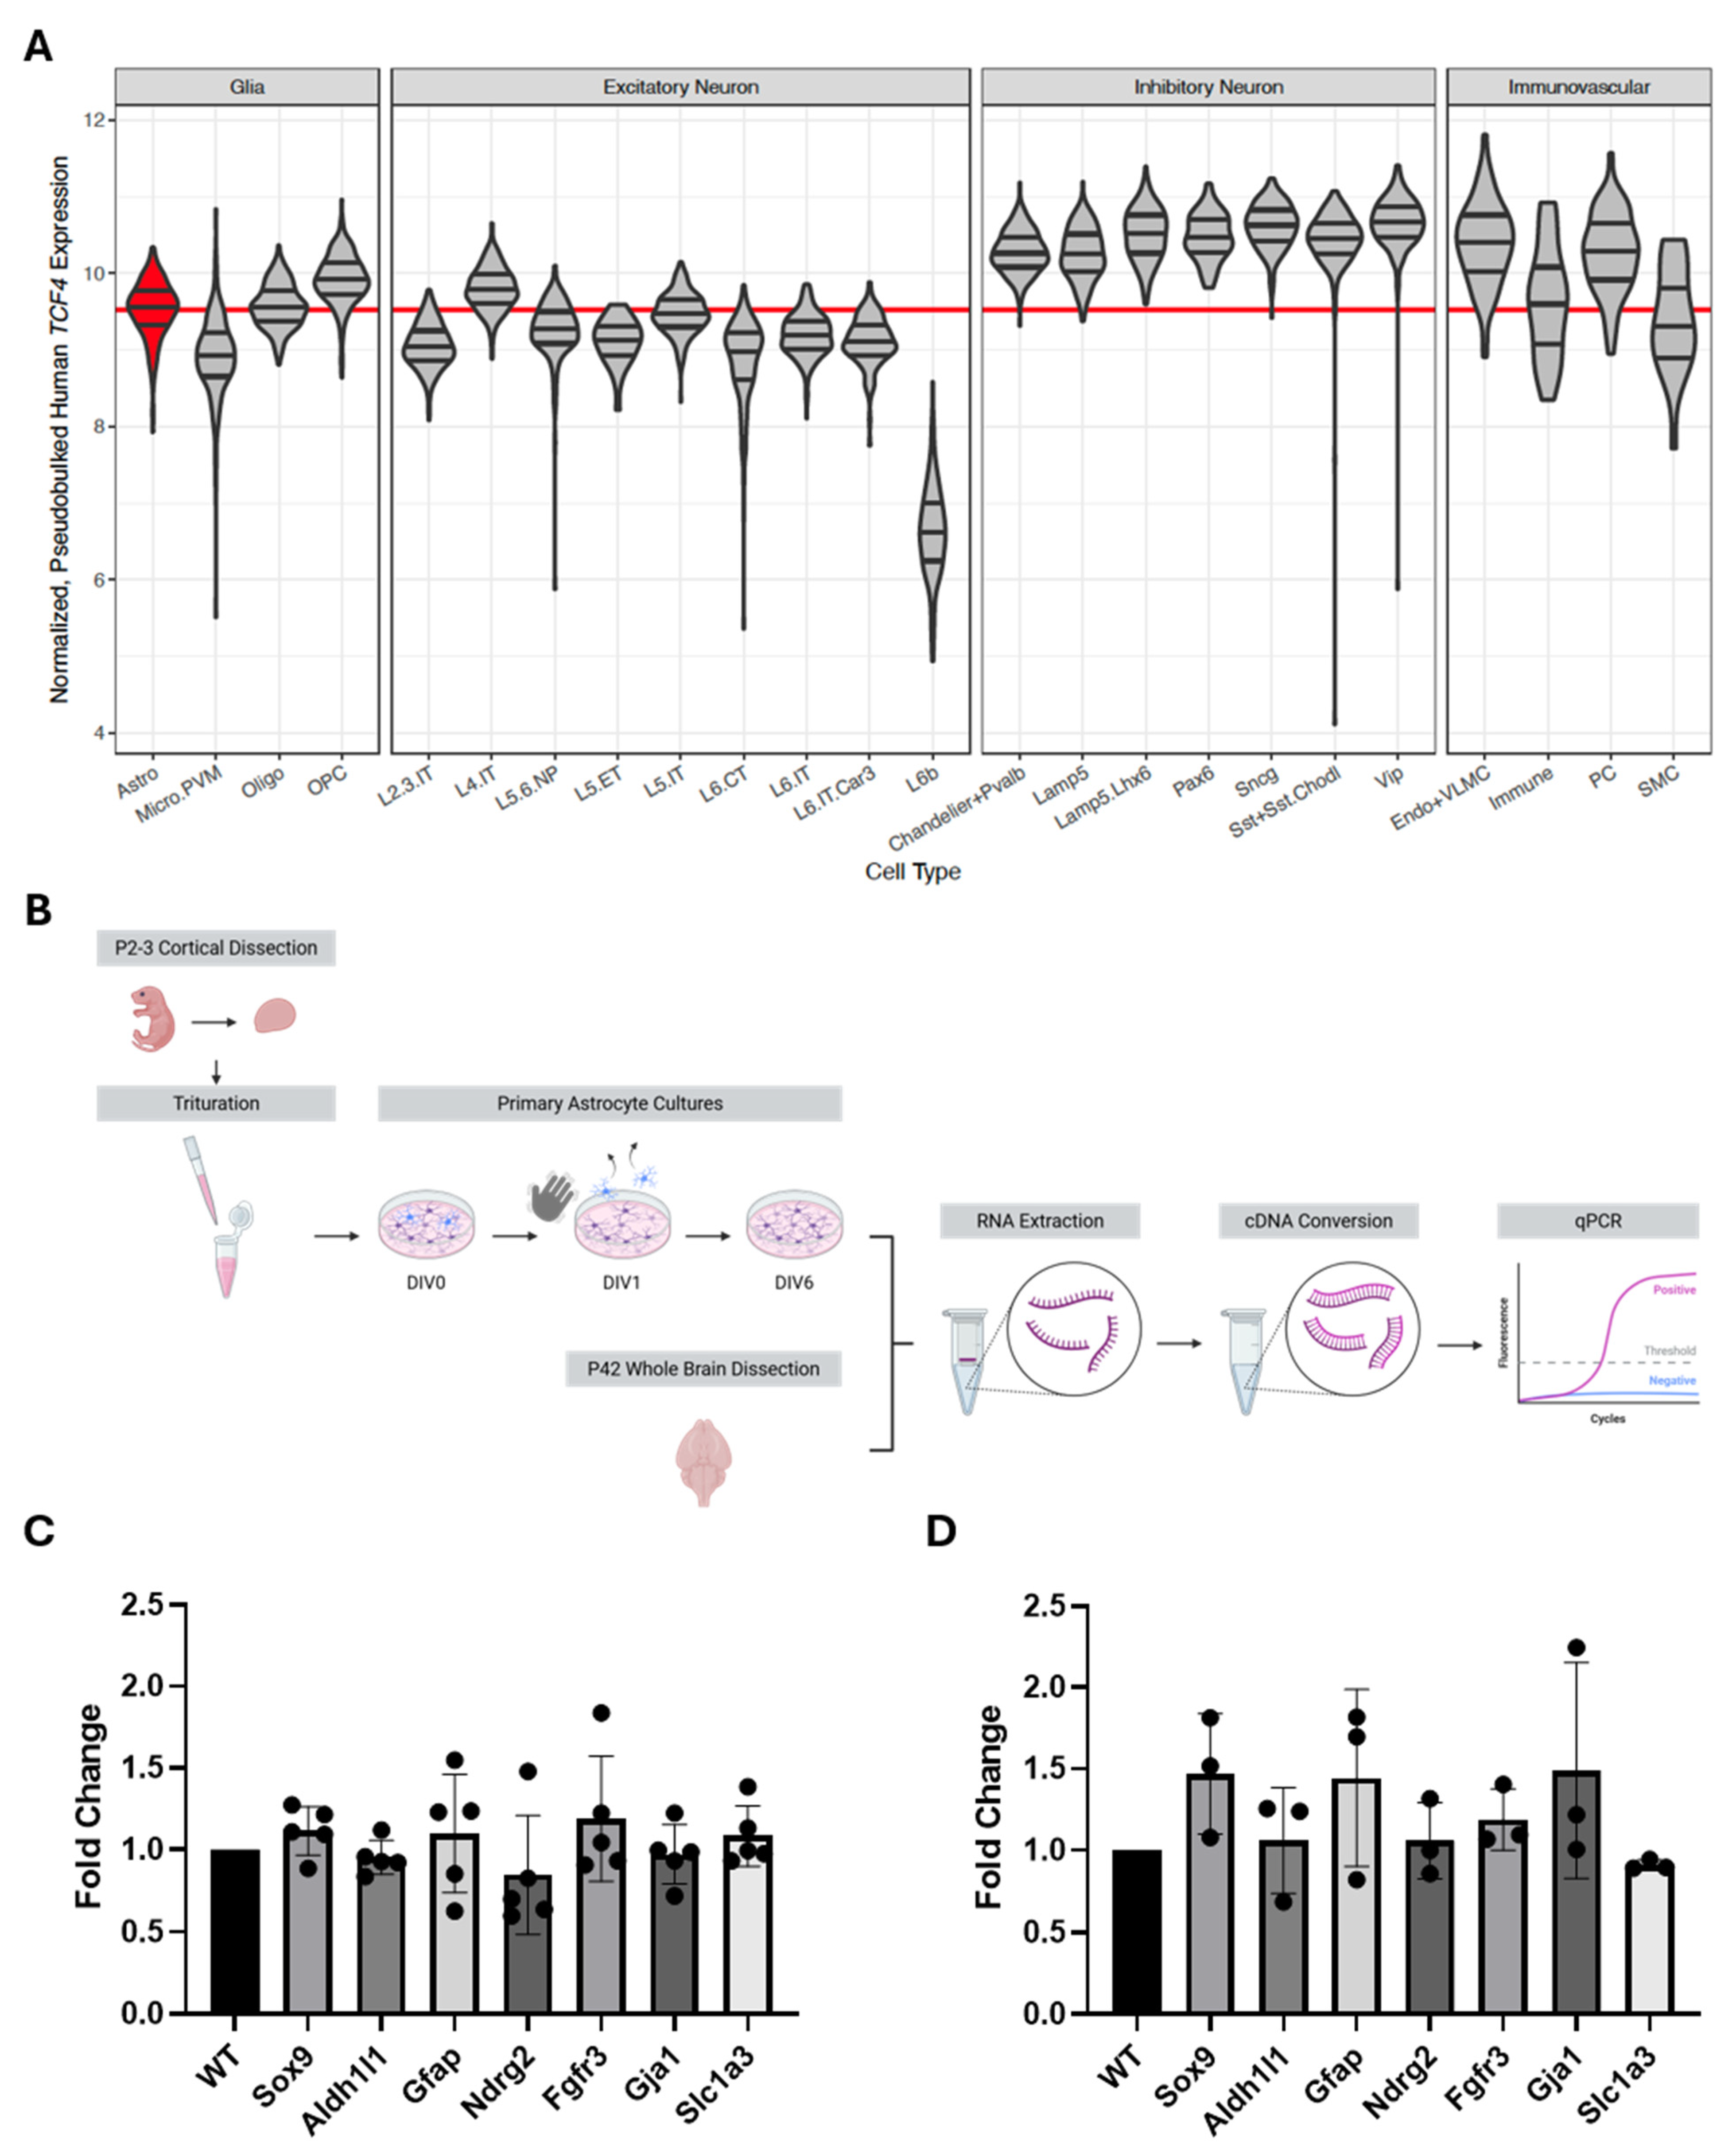
To begin to investigate the role of TCF4 in the astrocyte lineage, we first investigated cell-type-specific expression of TCF4 from publicly available single-cell RNA sequencing (scRNA-seq) data from human postmortem dorsolateral prefrontal cortical samples [30]. We observed that TCF4 was relatively moderately expressed in astrocytes compared to all other classified cell types; however, TCF4 expression was relatively lower in astrocytes compared to oligodendrocyte precursor cells (OPCs) and inhibitory neurons (Figure 2A). We next analyzed expression of astrocyte marker genes in primary astrocyte cultures and whole-brain samples obtained from Tcf4+/tr and Tcf4+/+ littermates (Figure 2B). We focused on the expression of well-known astrocyte markers, including the pan-astrocyte marker SOX9 [31]; glial fibrillary acidic protein (GFAP), which labels fibrous astrocytes in the white matter; and the protoplasmic astrocyte marker s100β [32,33,34]. We performed qPCR on DIV6 cultures and observed no difference in expression of Sox9, Aldh1l1, Gfap, Ndrg2, Fgfr3, Gja1, or Slc1a3 between genotypes (Figure 2C). Similarly, we observed no differences in astrocyte marker expression from P42 whole-brain lysates between Tcf4 genotypes (Figure 2D).
Figure 2.
Astrocyte transcript expression is unimpaired in the PTHS mouse model. (A) TCF4 expression across brain cell types in human dorsolateral prefrontal cortex. Violin plots showing normalized, pseudobulked TCF4 expression across major brain cell types grouped by class (glia, excitatory neuron, inhibitory neuron, vascular). The red line marks the average TCF4 expression in astrocytes. Violin plots display quartile lines. Cell type acronyms are as follows: Astro (astrocytes), Micro.PVM (microglia and perivascular macrophages), Oligo (oligodendrocytes), OPC (oligodendrocyte precursor cells), L2.3.IT (layer 2/3 intratelencephalically projecting neurons), L4.IT (layer 4 intratelencephalically projecting neurons), L5.6.NP (layer 5/6 near-projecting neurons), L5.ET (layer 5 extratelencephalic projecting neurons), L5.IT (layer 5 intratelencephalically projecting neurons), L6.CT (layer 6 corticothalamic projecting neurons), L6.IT (layer 6 intratelencephalically projecting glutamatergic neurons), L6.IT.Car3 (layer 6 intratelencephalic projecting Car3 neurons), L6b (layer 6b neurons), Chandelier + Pvalb (chandelier cells and PV neurons), Lamp5 (Lamp5 neurons), Lamp5.Lhx6 (Lhx6 Lamp5 neurons), Pax6 (Pax6 neurons), Sncg (Sncg neurons), SST + Sst.Chodl (SST neurons and SST Chodl neurons), Vip (Vip neurons), Endo + VLMC (endothelial cells and vascular leptomeningeal cells), Immune (immune cells), PC (pericytes), and SMC (smooth muscle cells). (B) Graphical representation of the astrocyte plating and whole-brain dissections for qPCR experiments. (C) qPCR of astrocyte-specific gene expression in DIV6 primary astrocyte cultures. Expression of Sox9 (p = 0.3866; FC = 0.1143 ± 0.1206), Aldh1l1 (p = 0.6696; FC = −0.06170 ± 0.1362), Gfap (p = 0.8143; FC = 0.07320 ± 0.2956), Ndrg2 (KS: p = 0.5714), Fgfr3 (p = 0.5536; FC = 0.1848 ± 0.2912), Gja1 (p = 0.8409; −0.03040 ± 0.1437), and Slc1a3 (p = 0.5782; FC = 0.09030 ± 0.1520) was not different between Tcf4+/tr and Tcf4+/+ cultures (Tcf4+/tr n = 5 mice; Tcf4+/+ n = 2 mice). (D) qPCR of astrocyte-specific gene expression in P42 whole-brain lysates of Tcf4+/tr and Tcf4+/+ littermates. Expression of Sox9 (p = 0.1901; FC = 0.4467 ± 0.2834), Aldh1l1 (p = 0.9157; FC = 0.03667 ± 0.3252), Gfap (p = 0.3716; FC = 0.4240 ± 0.4217), Ndrg2 (p = 0.7276; FC = 0.06067 ± 0.1623), Fgfr3 (p = 0.3281; FC = 0.1797 ± 0.1614), Gja1 (p = 0.2965; FC = 0.4830 ± 0.4026), and Slc1a3 (p = 0.6308; FC = −0.1117 ± 0.2149) was not different between genotypes (Tcf4+/tr n = 3 mice; Tcf4+/+ n = 3 mice). Data are presented as the fold change difference between means (FC) ± SEM.
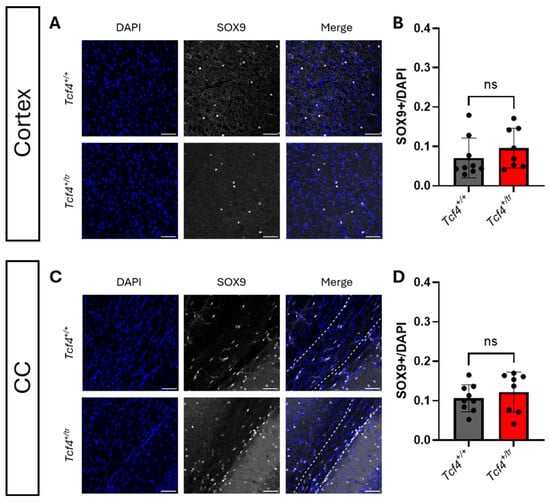
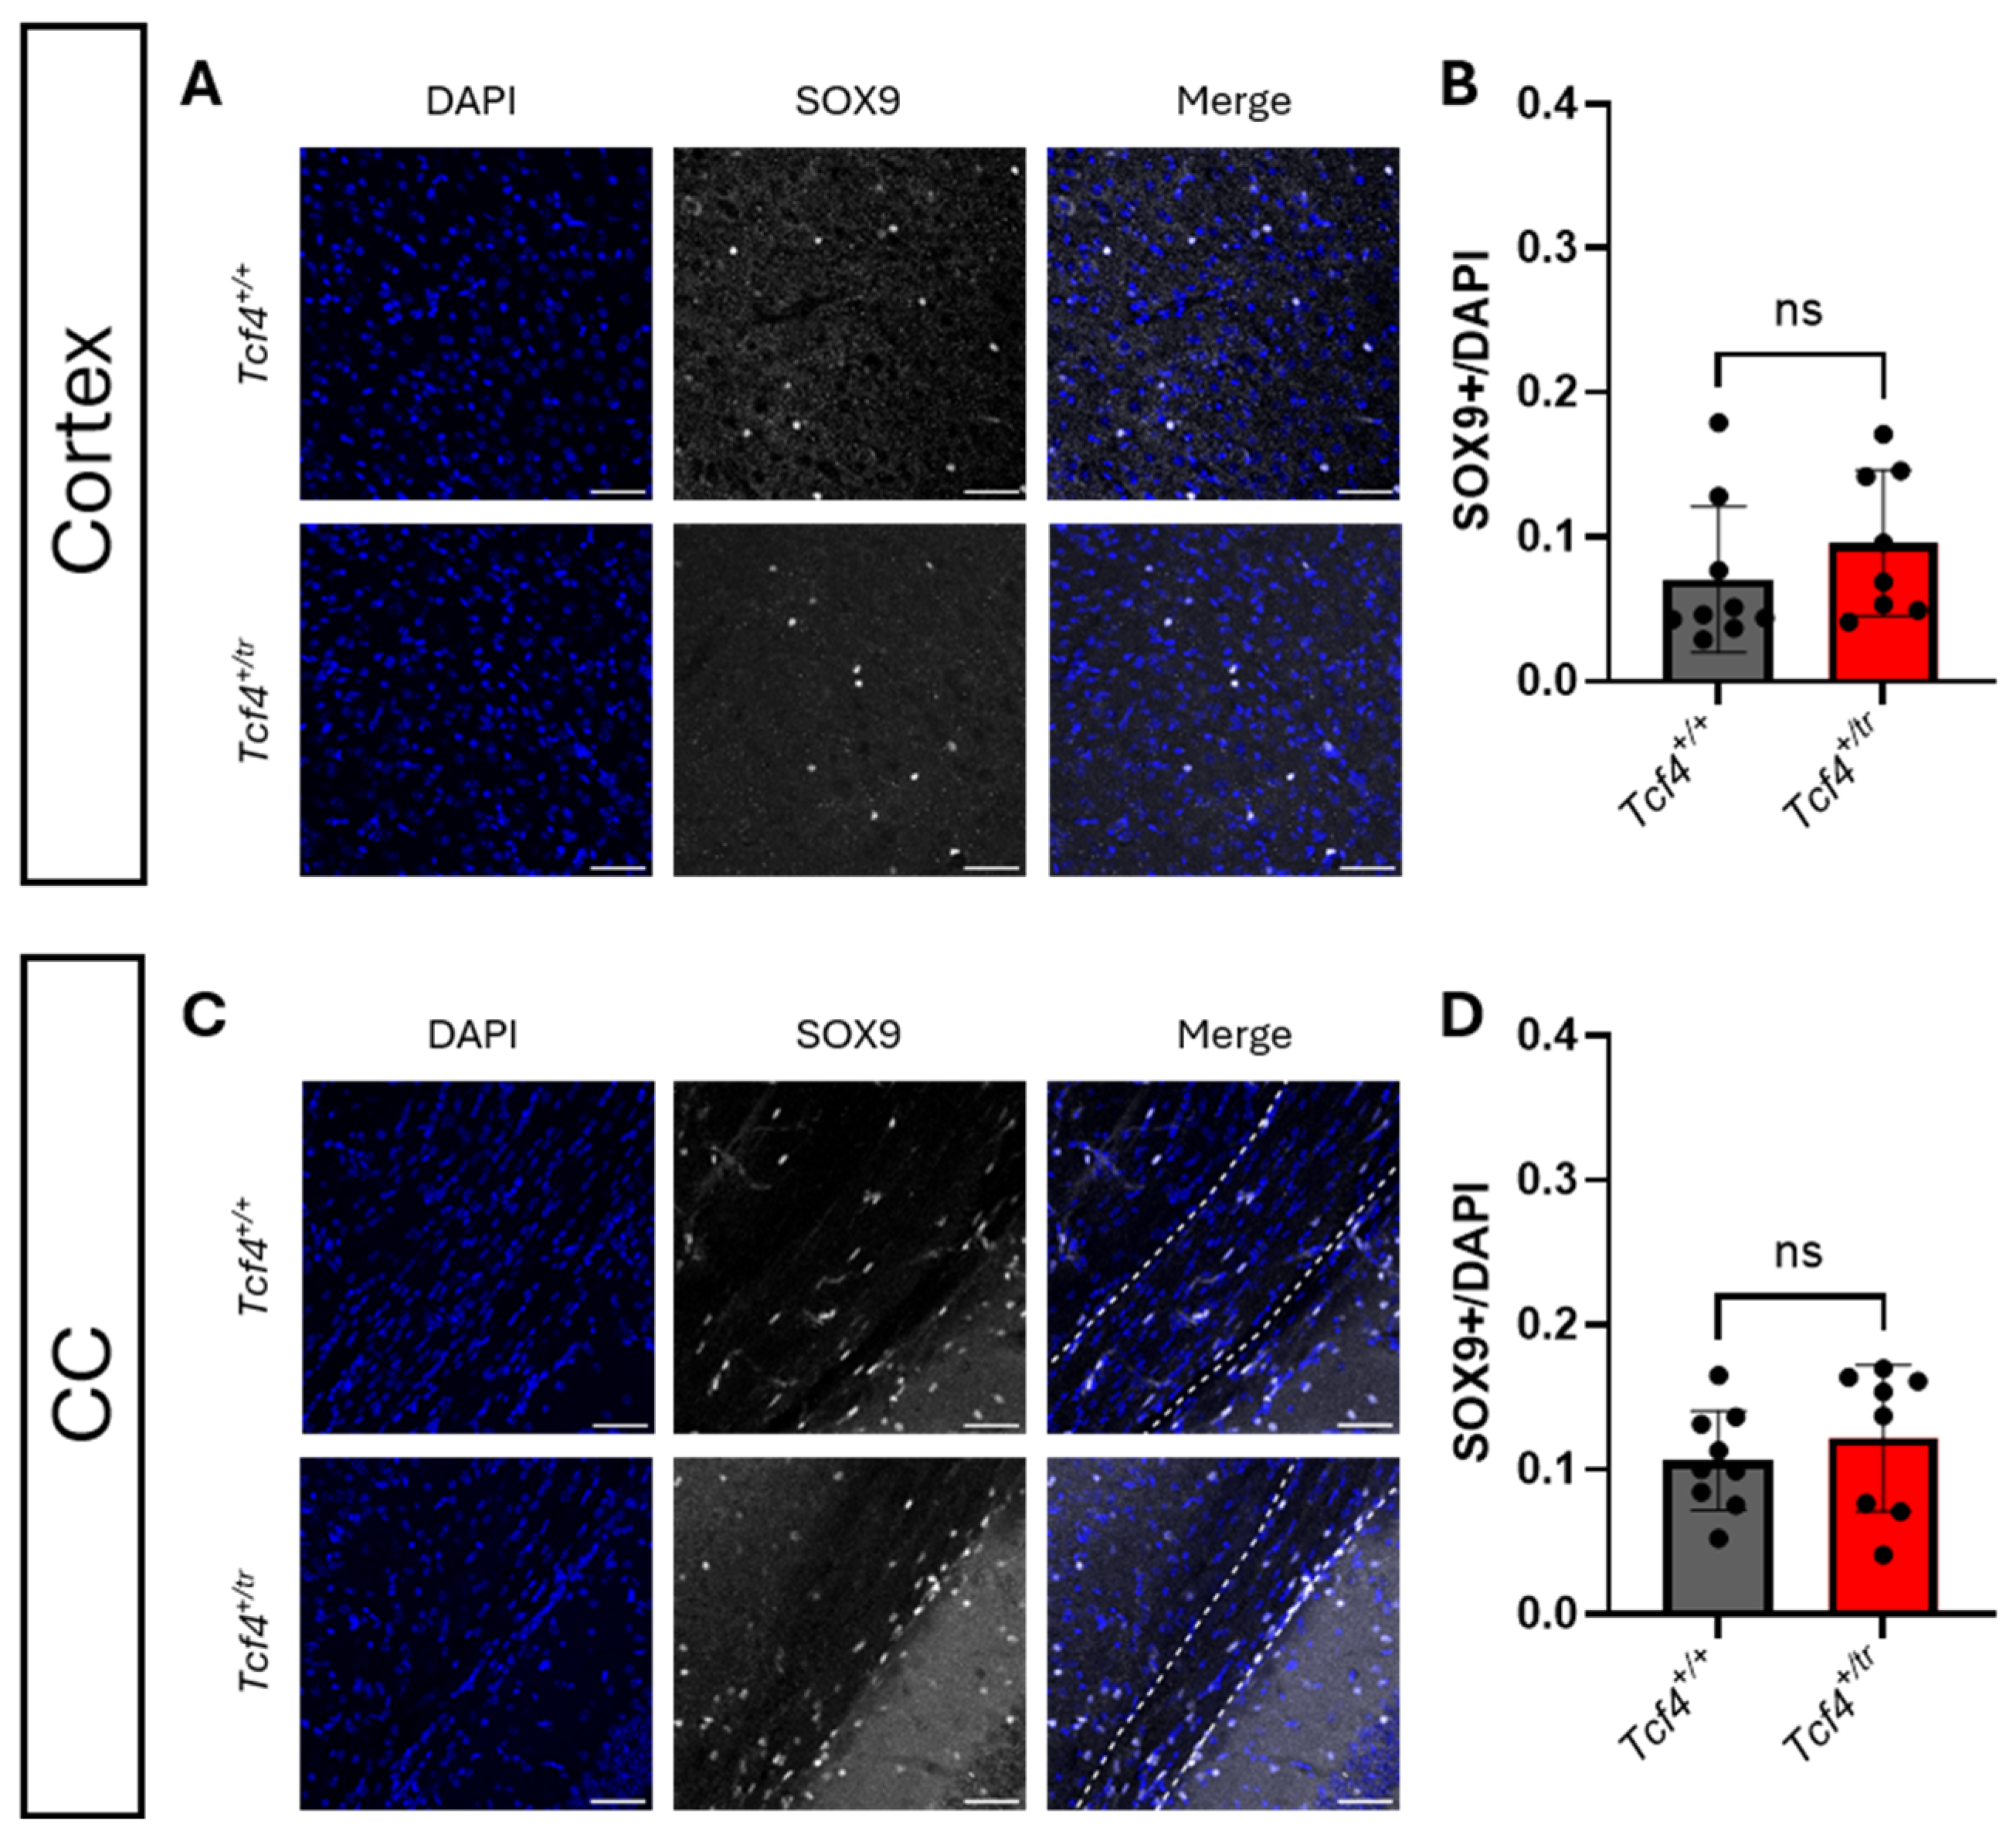
We next quantified the overall population density of astrocytes within the gray and white matter by performing IHC on coronal brain sections containing the cortex and CC from P42 Tcf4+/tr and Tcf4+/+ littermates. To control for brain-to-brain regional heterogeneity of astrocyte density, all analyses were performed on coronal sections containing the dorsal hippocampus (Figure 1). Astrocytes were identified by their expression of the pan-astrocyte marker SOX9, and cell counts were normalized with DAPI (Figure 3). The overall astrocyte population (SOX9+/DAPI) was not different between Tcf4+/tr and Tcf4+/+ littermates in both the cortex (Figure 3A,B) and CC (Figure 3C,D).
Figure 3.
Total astrocyte populations are unimpaired in the PTHS mouse model. (A) IHC of the overall astrocyte population in the adult cortex of Tcf4+/tr and Tcf4+/+ littermates. Tissue stained for DAPI (blue, column 1) and SOX9 (gray, column 2). (B) Summary plot showing no change in the overall proportion of SOX9+DAPI+/DAPI+ cells between Tcf4+/tr and Tcf4+/+ mice in the cortex (KS: Tcf4+/tr 0.09589 ± 0.0179 n = 8 mice, Tcf4+/+ 0.07041 ± 0.01688 n = 9 mice; p = 0.2964). (C) IHC of the overall astrocyte population in the adult CC of Tcf4+/tr and Tcf4+/+ littermates. Tissue stained for DAPI (blue, column 1) and SOX9 (gray, column 2). Dashed lines indicate the CC. (D) Summary plot showing no change in the overall proportion of SOX9+DAPI+/DAPI cells between Tcf4+/tr and Tcf4+/+ mice in the CC (Tcf4+/tr 0.1219 ± 0.01791, n = 8 mice; Tcf4+/+ 0.1065 ± 0.01146, n = 9 mice, p = 0.4695). Data are presented as mean values ± SEM; scale bars: 50 µm. ns nonsignificant.
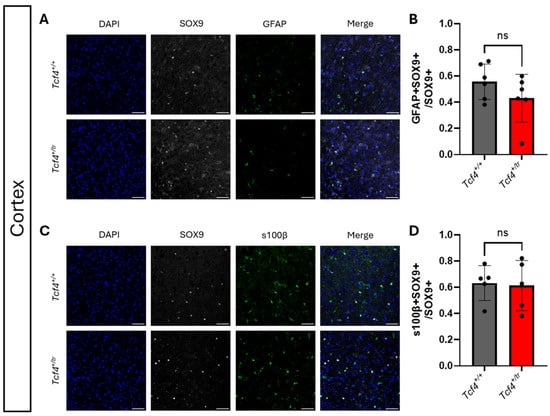
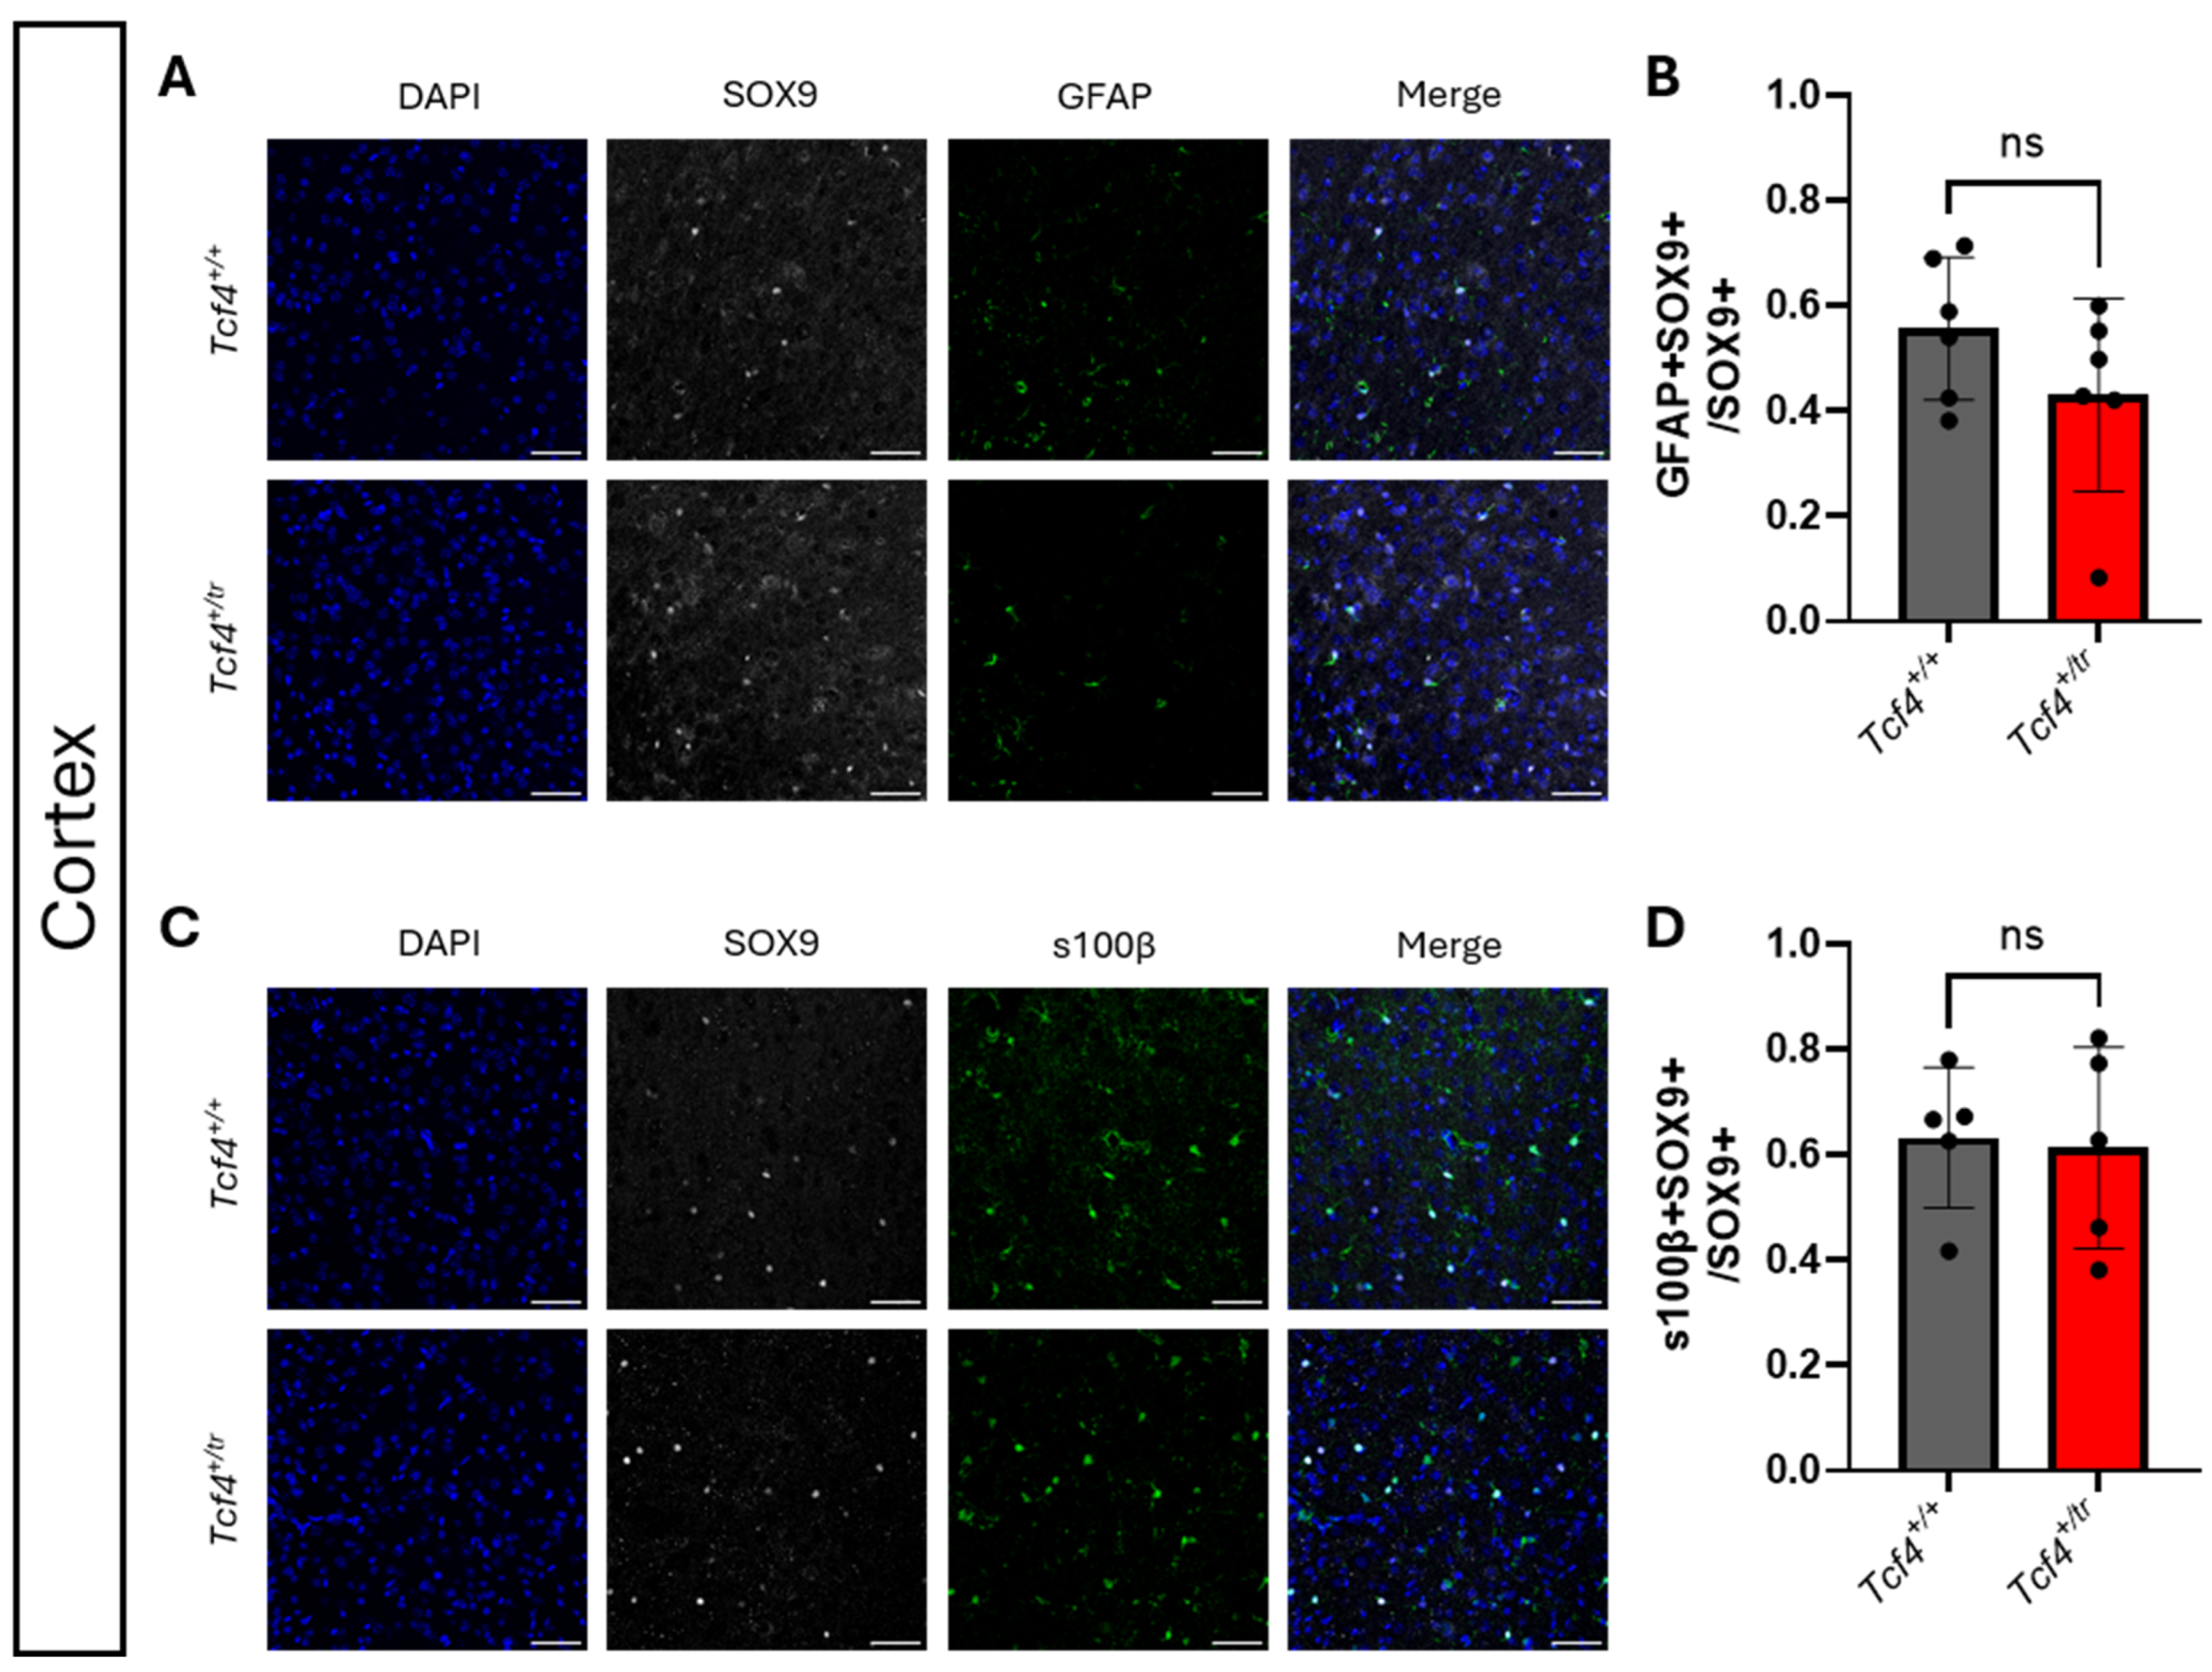
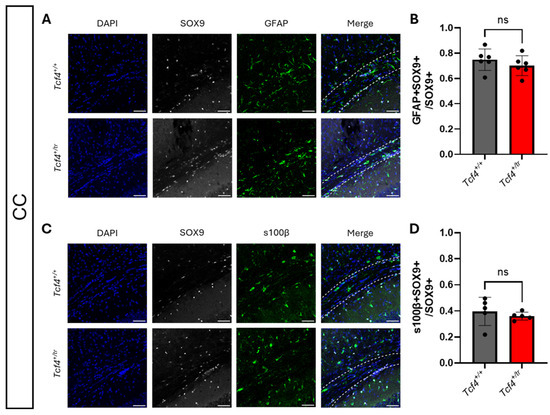
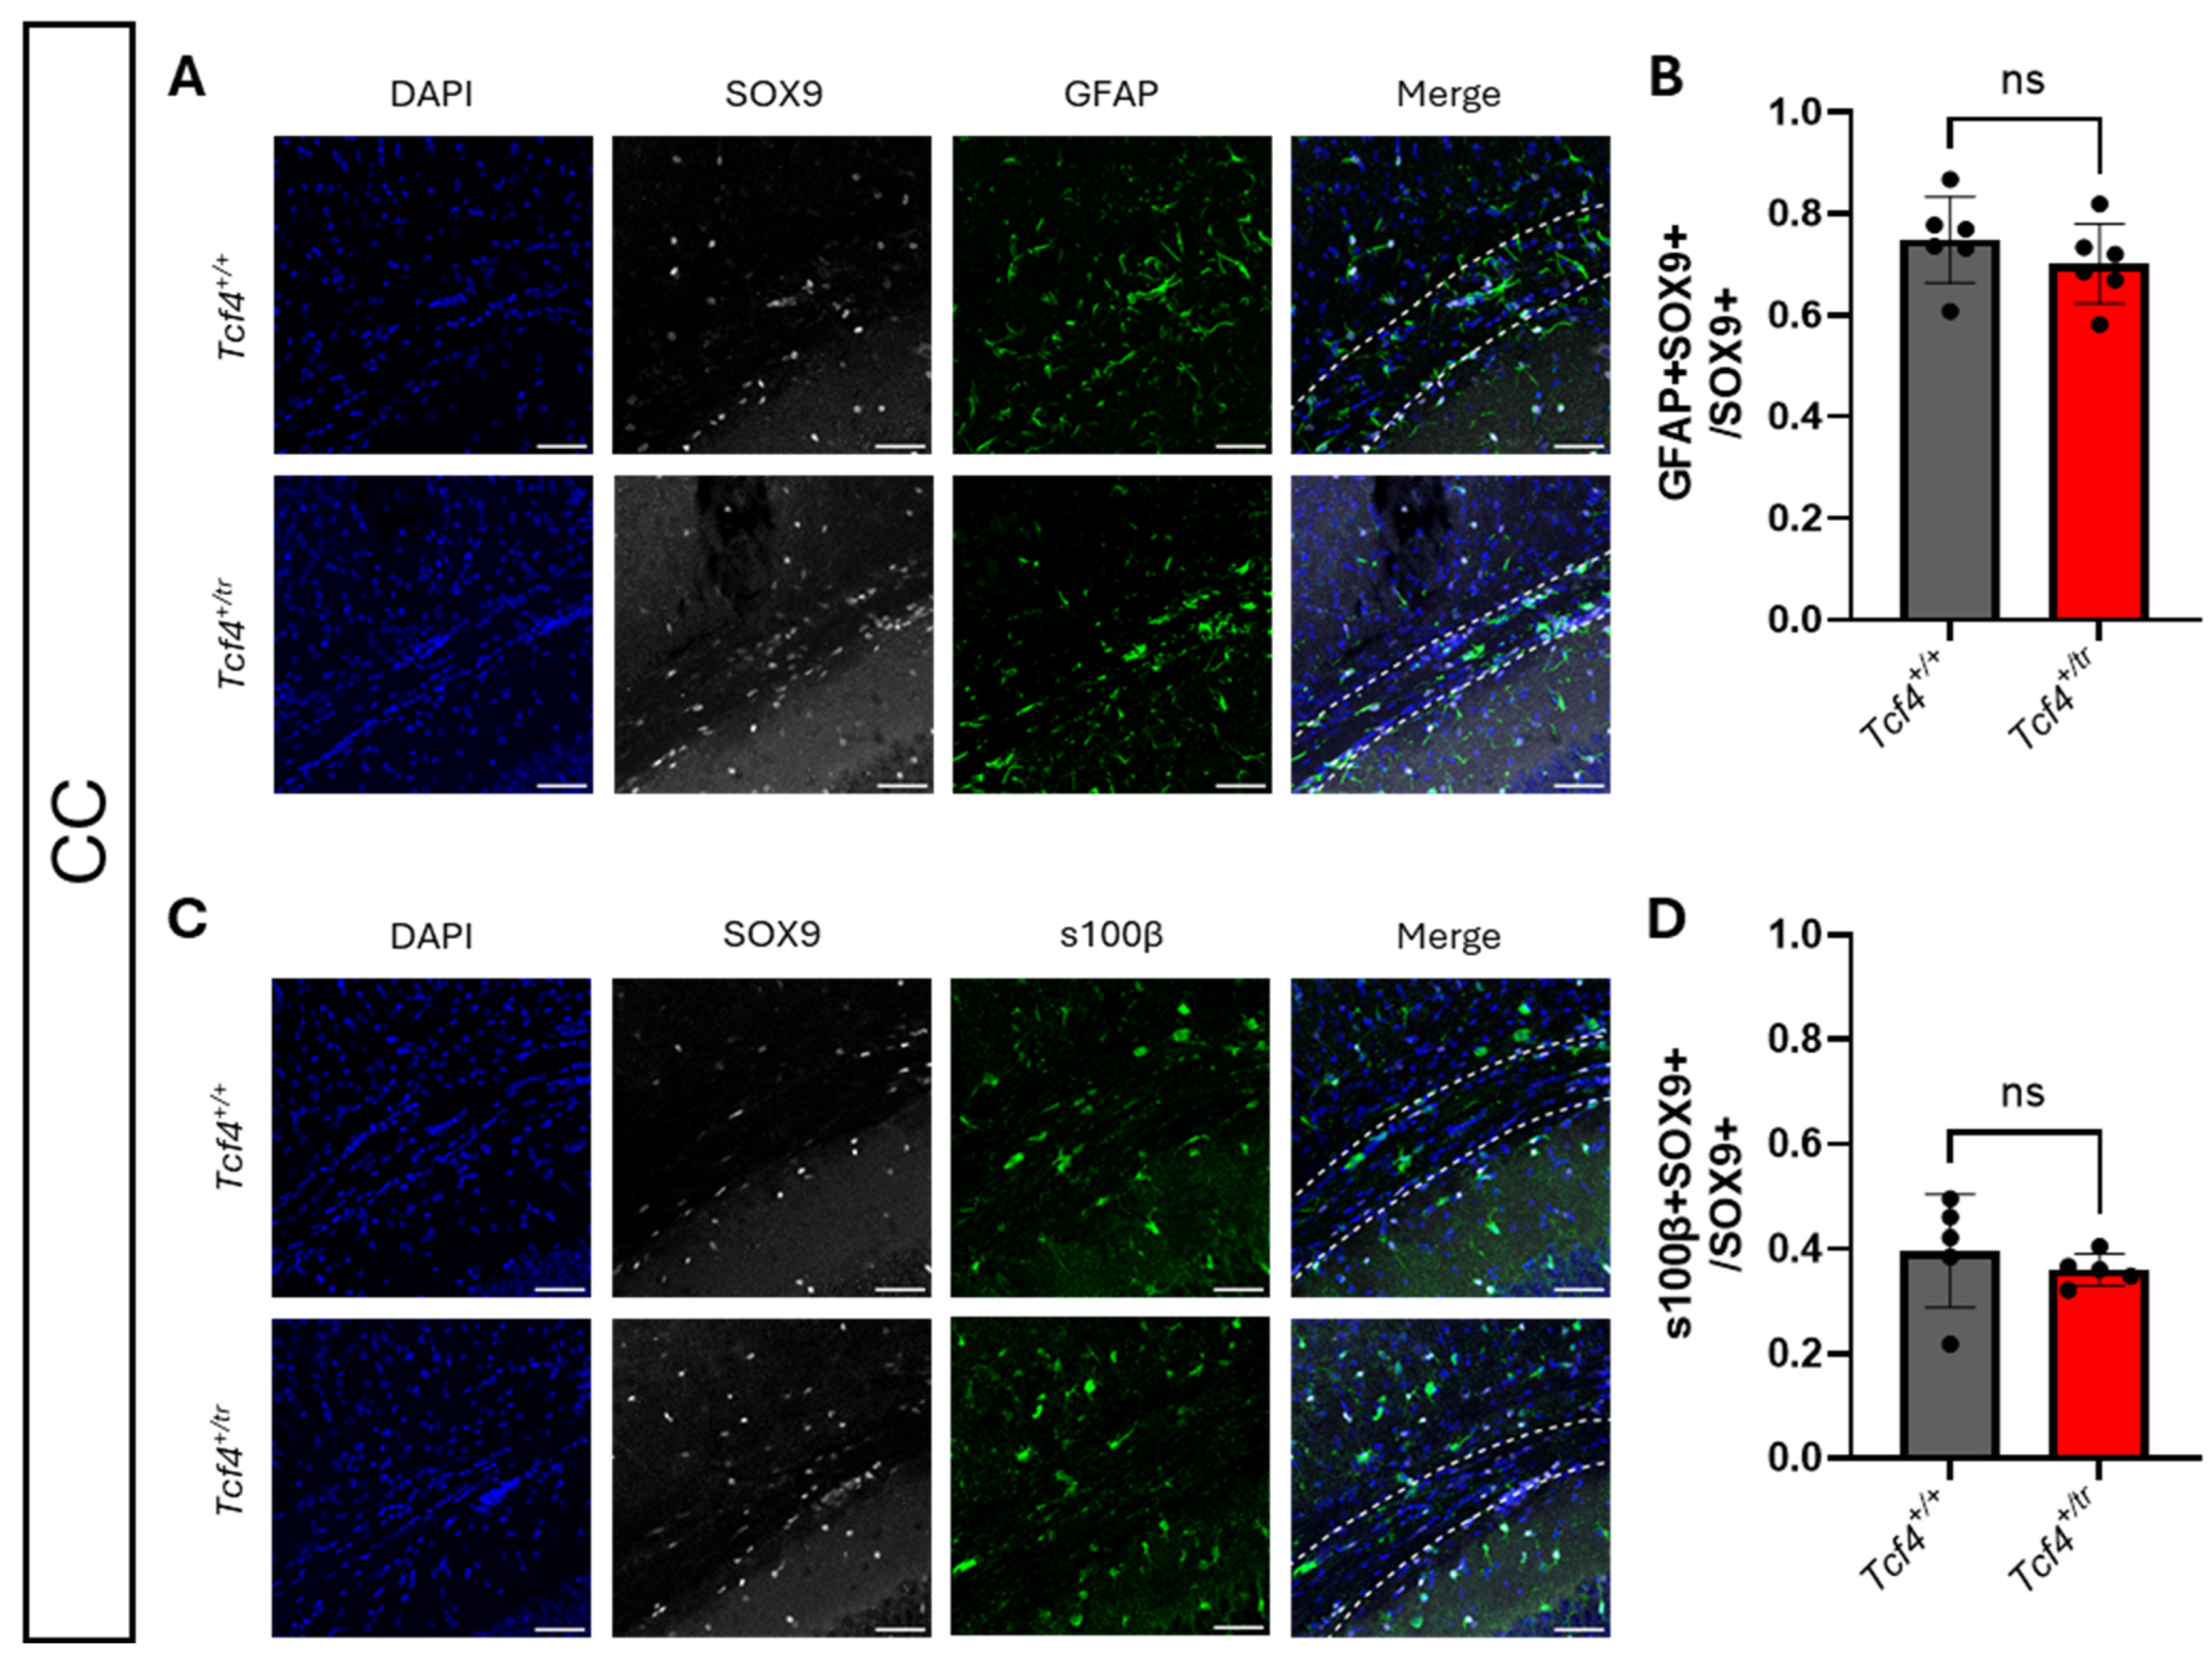
To determine if heterozygous Tcf4 mutation could selectively alter the proportions of subtypes of astrocytes, we performed IHC using specific markers of fibrous and protoplasmic astrocytes in the Tcf4+/tr mouse model. GFAP is a well-known marker for white matter fibrous astrocytes and reactive astrocytes [35]. We observed that the GFAP+ fibrous astrocyte populations (GFAP+SOX9+/SOX9+) were not different based on genotype in the cortex (Figure 4A,B) and CC (Figure 5A,B). s100β is a well-known marker of protoplasmic astrocytes within cortical gray matter, which also labels a minor subset of myelinating OLs [35,36]. To preclude counting s100β+ OLs, we only counted s100β+SOX9+ double-positive cells. Protoplasmic astrocyte populations (s100β+SOX9+/SOX9+) in the gray matter cortex (Figure 4C,D) and CC (Figure 5C,D) were also no different between Tcf4+/tr and Tcf4+/+ littermates.
Figure 4.
Astrocyte subpopulations in the cortex are unimpaired in the PTHS mouse model. (A) IHC of the fibrous astrocyte population in the P42 cortex of Tcf4+/tr and Tcf4+/+ littermates. Tissue stained for DAPI (blue, column 1), SOX9 (gray, column 2), and GFAP (green, column 3). (B) Summary plot showing no change in the proportion of GFAP+SOX9+/SOX9+ cells between Tcf4+/tr and Tcf4+/+ mice (Tcf4+/tr 0.4302 ± 0.07493 n = 6 mice, Tcf4+/+ 0.5562 ± 0.05531 n = 6 mice; p = 0.2060). (C) IHC of the protoplasmic astrocyte population in the P42 cortex of Tcf4+/tr and Tcf4+/+ littermates. Tissue stained for DAPI (blue, column 1), SOX9 (gray, column 2), and s100β (green, column 3). (D) Summary plot showing no change in the proportion of s100β+SOX9+/SOX9+ cells between Tcf4+/tr and Tcf4+/+ mice (Tcf4+/tr 0.6131 ± 0.08535 n = 5 mice, Tcf4+/+ 0.6323 ± 0.05959 n = 5 mice, p = 0.8579). Data are presented as mean values ± SEM; scale bars: 50 µm. ns nonsignificant.
Figure 5.
Astrocyte subpopulations in the CC are unimpaired in the PTHS mouse model. (A) IHC of the fibrous astrocyte population in the P42 CC of Tcf4+/tr and Tcf4+/+ littermates. Tissue stained for DAPI (blue, column 1), SOX9 (gray, column 2), and GFAP (green, column 3). (B) Summary plot showing no change in the proportion of GFAP+SOX9+/SOX9+ cells between Tcf4+/tr and Tcf4+/+ mice (Tcf4+/tr 0.7018 ± 0.03208 n = 6 mice, Tcf4+/+ 0.7487 ± 0.03462 n = 6 mice; p = 0.3439). (C) IHC of the protoplasmic astrocyte population in the P42 CC of Tcf4+/tr and Tcf4+/+ littermates. Tissue stained for DAPI (blue, column 1), SOX9 (gray, column 2), and s100β (green, column 3). Dashed lines indicate the CC. (D) Summary plot showing no change in the proportion of s100β+SOX9+/SOX9+ cells between Tcf4+/tr and Tcf4+/+ mice (Tcf4+/tr 0.3608 ± 0.01354 n = 5 mice, Tcf4+/+ 0.3965 ± 0.04802 n = 5 mice; p = 0.4950). Data are presented as mean values ± SEM; scale bars: 50 µm. ns nonsignificant.
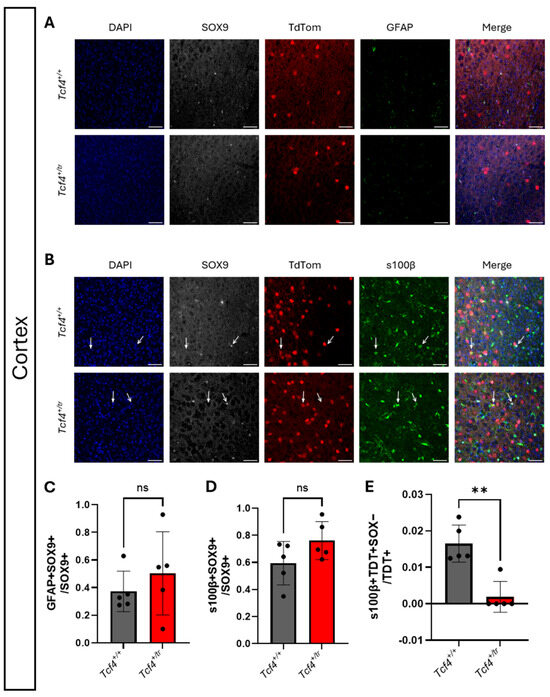
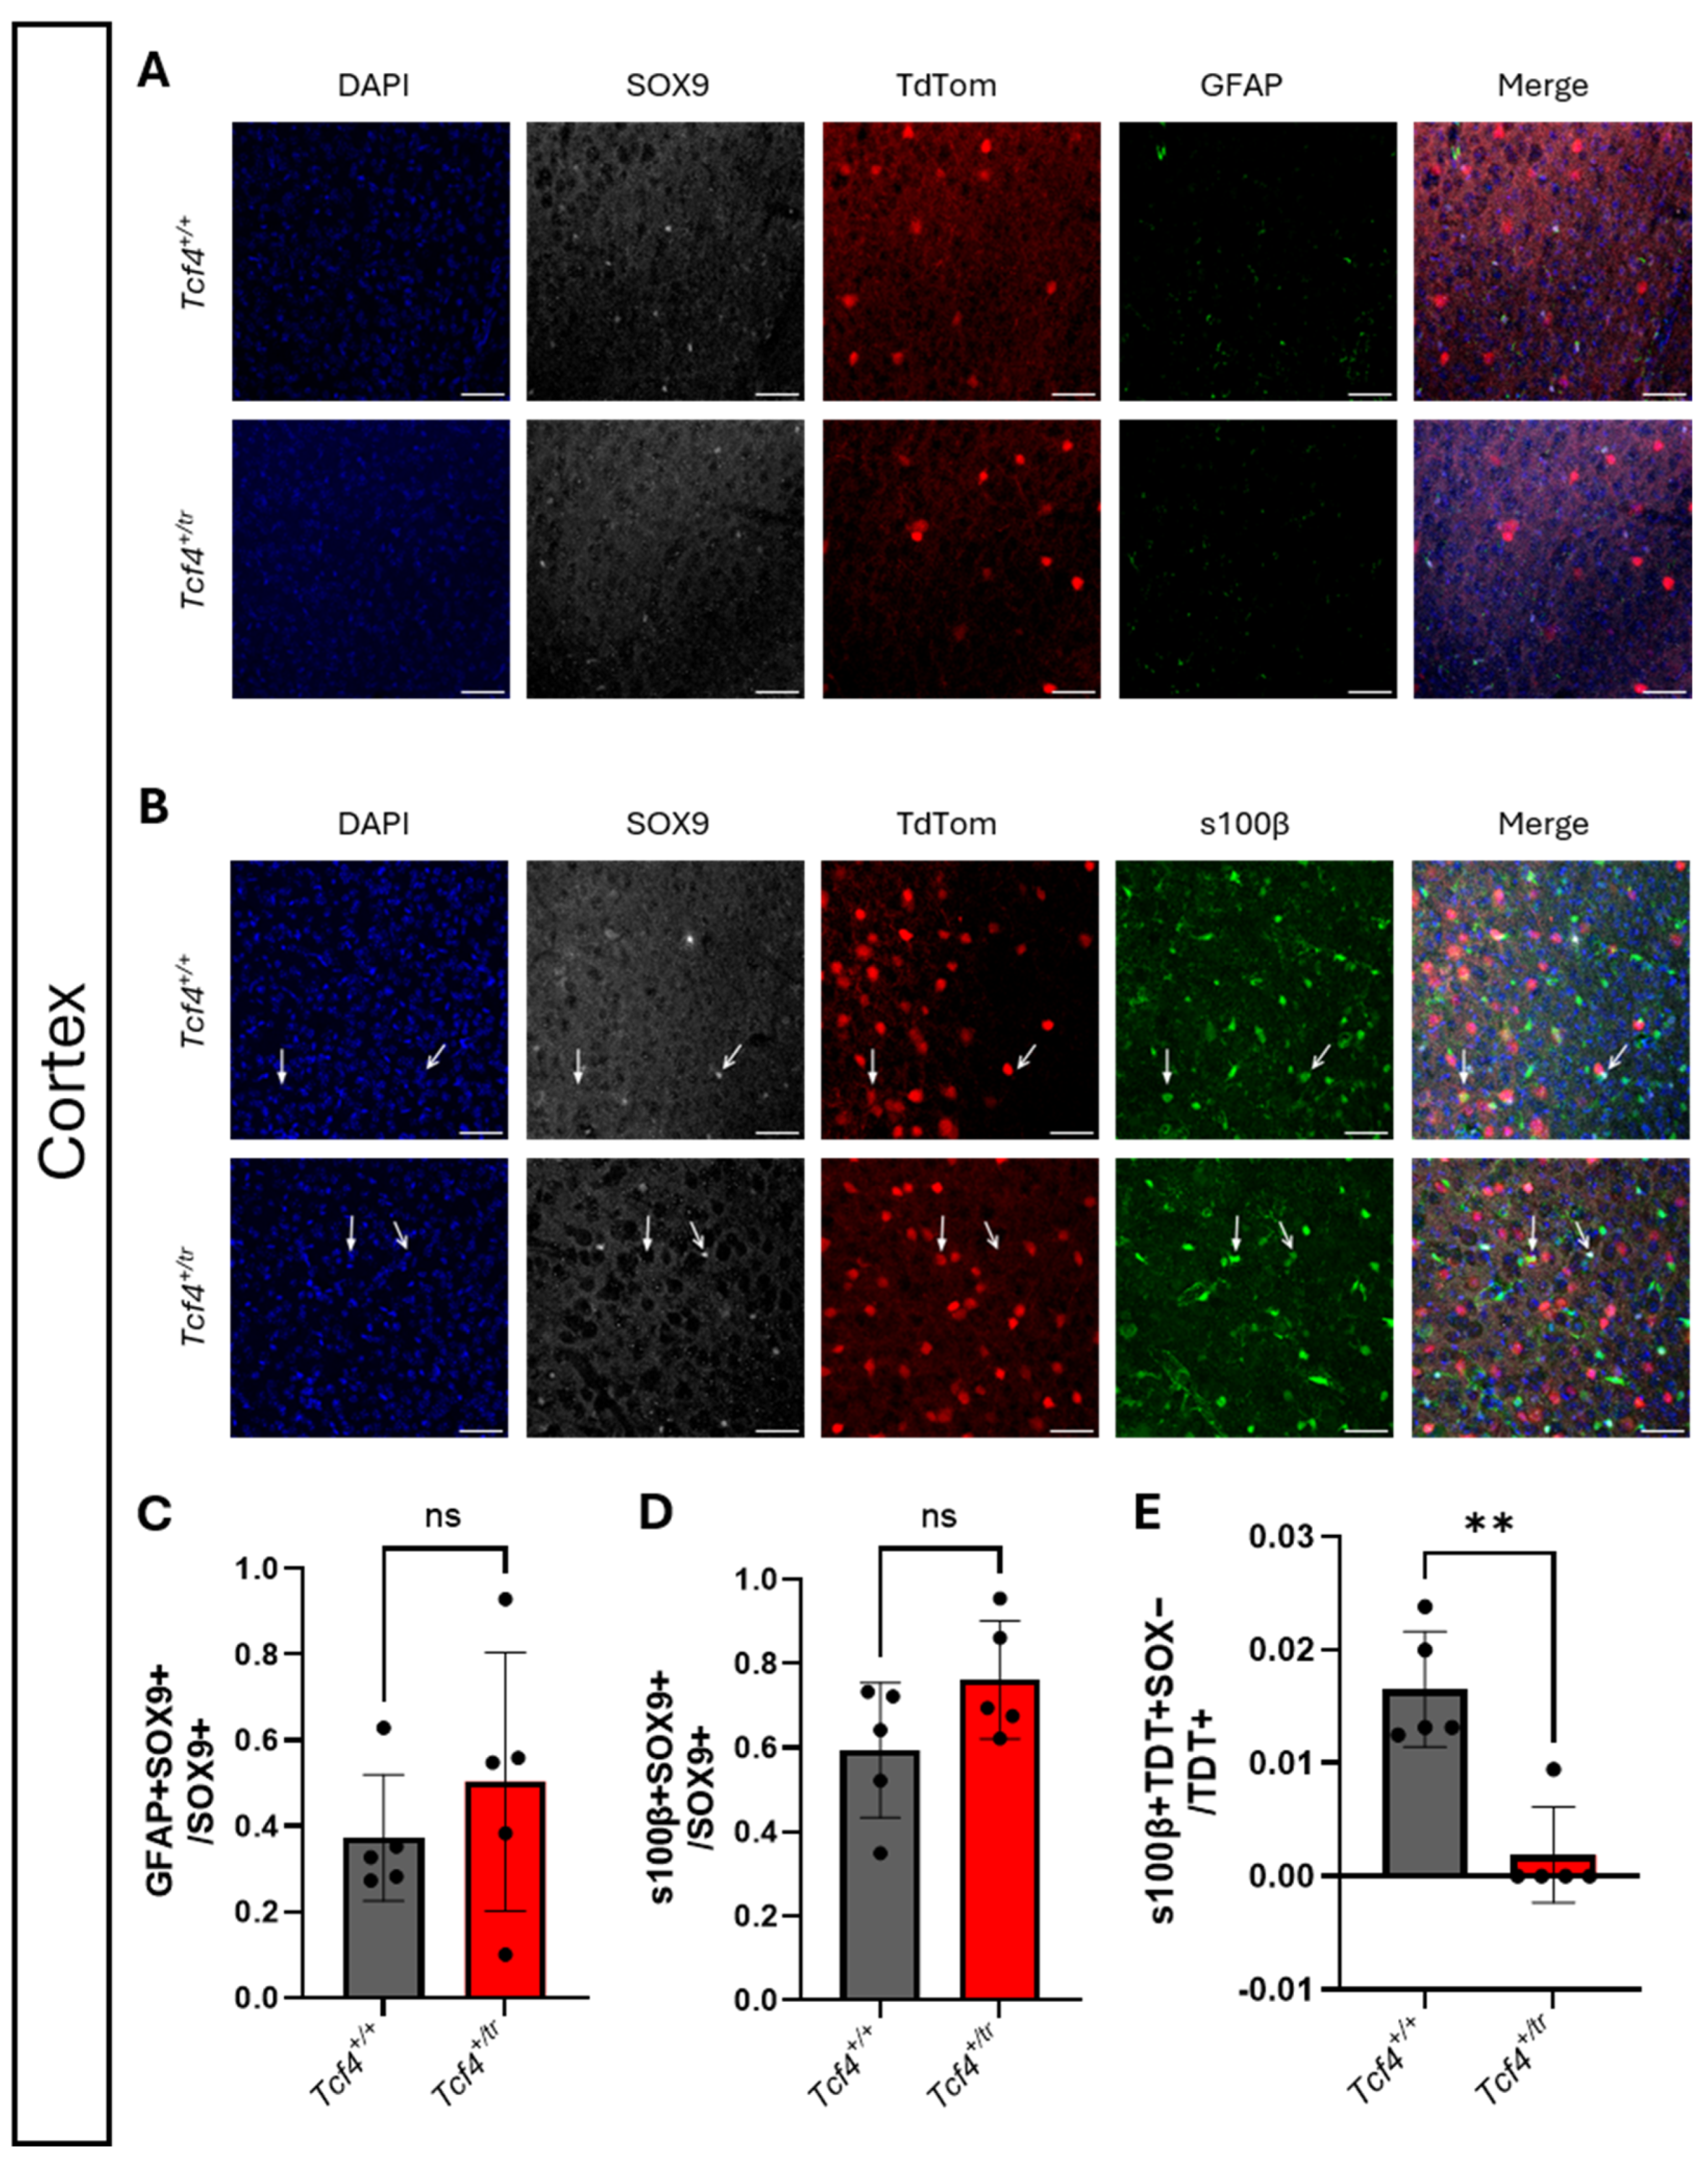
We crossed Nkx2.1-Cre with a conditional TdTomato reporter line (TdTom) to generate Nkx2.1::TdTom reporter mice to investigate misallocation of ventrally derived astrocytes in the dorsal cortex. These reporter mice were then crossed with Tcf4+/tr mice to quantify ventrally derived astrocyte populations in Tcf4+/tr and Tcf4+/+ mice. We performed IHC for SOX9 on P28 Nkx2.1::TdTom::Tcf4+/tr and Tcf4+/+ littermates and quantified the overall population of ventrally derived astrocytes in the cortex and CC. Consistent with our results comparing Tcf4+/tr and Tcf4+/+ littermates (Figure 3), we observed no overall difference in the proportion of SOX9+DAPI+/DAPI+ cells regardless of their origin between genotypes in either the cortex (Supplementary Figure S1A,B) or CC (Supplementary Figure S1C,D). Similarly, looking at subtypes of astrocytes, we observed no difference in the proportions of GFAP+SOX9+ or s100β+SOX9+ cells in either the cortex (Figure 6) or CC (Figure 7). To determine if a germline heterozygous mutation of Tcf4 resulted in mislocalization of ventrally derived astrocytes, we searched for SOX9+TdTom+ cells in the dorsal cortex but were unable to find any ventrally derived astrocytes (SOX9+TdTom+) residing in the dorsal cortex. In our detailed search for SOX9+TdTom+ astrocytes within the dorsal cortex, we were able to find a single SOX9+TdTom+ cell that was located below the CC in a single section from a single Tcf4+/tr animal (Supplementary Figure S2). However, in this single cell, it was difficult to distinguish which of the two neighboring DAPI+ cells was TdTom+, making it difficult to identify the cell as an astrocyte.
Figure 6.
Quantification of ventrally derived protoplasmic astrocyte populations in the PTHS mouse model. (A) IHC of the ventrally derived GFAP+ astrocyte population in the dorsal cortex of P28 Nkx2.1::TdTom::Tcf4+/tr and Tcf4+/+ littermates. Tissue stained for DAPI (blue, column 1), SOX9 (gray, column 2), TdTom (red, column 3), and GFAP (green, column 4). (B) IHC of the ventrally derived protoplasmic s100β+ astrocyte population in the cortex of P28 Nkx2.1::TdTom::Tcf4+/tr and Tcf4+/+ littermates. Tissue stained for DAPI (blue, column 1), SOX9 (gray, column 2), TdTom (red, column 3), and s100β (green, column 4). Closed arrows identify s100β+TdTom+SOX9- cells, while open arrows identify s100β+TdTom-SOX9+ cells. (C) Summary plot showing no change in the proportion of GFAP+SOX9+/SOX9+ cells in the cortex between Tcf4+/tr and Tcf4+/+ mice (KS: Tcf4+/tr 0.5036 ± 0.1347, n = 5 mice; Tcf4+/+ 0.3726 ± 0.06564, n = 5 mice; p = 0.3571). No GFAP+TdTom+ cells were found in the cortex from either genotype. (D) Summary plot showing no change in the proportion of s100β+SOX9+/SOX9+ cells in the cortex between Tcf4+/tr and Tcf4+/+ mice (Tcf4+/tr 0.7614 ± 0.06272 n = 5 mice, Tcf4+/+ 0.5939 ± 0.07172 n = 5 mice; p = 0.1168). (E) Summary plot showing a significant difference in the proportion of s100β+TdTom+SOX9-/TdTom+ cells in the cortex between Tcf4+/tr and Tcf4+/+ mice (KS: Tcf4+/tr 0.001887 ± 0.001887 n = 5 mice, Tcf4+/+ 0.01653 ± 0.002281 n = 5 mice, p = 0.0079). Data are presented as mean values ± SEM; scale bars: 50 µm. ** p < 0.01, ns nonsignificant.
Figure 7.
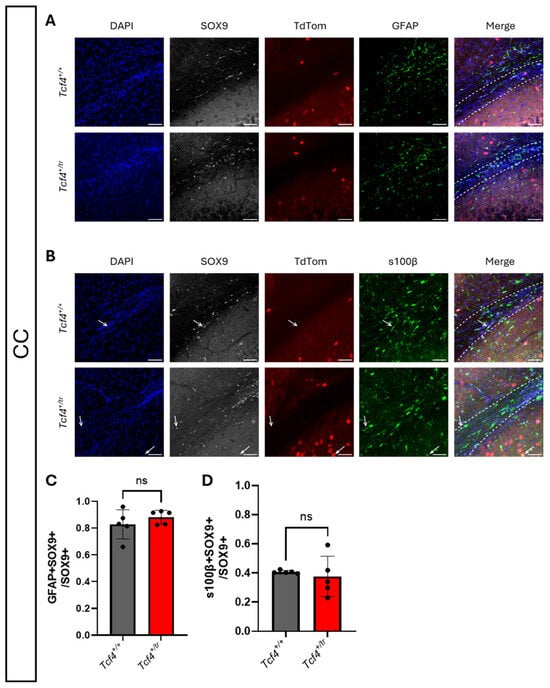
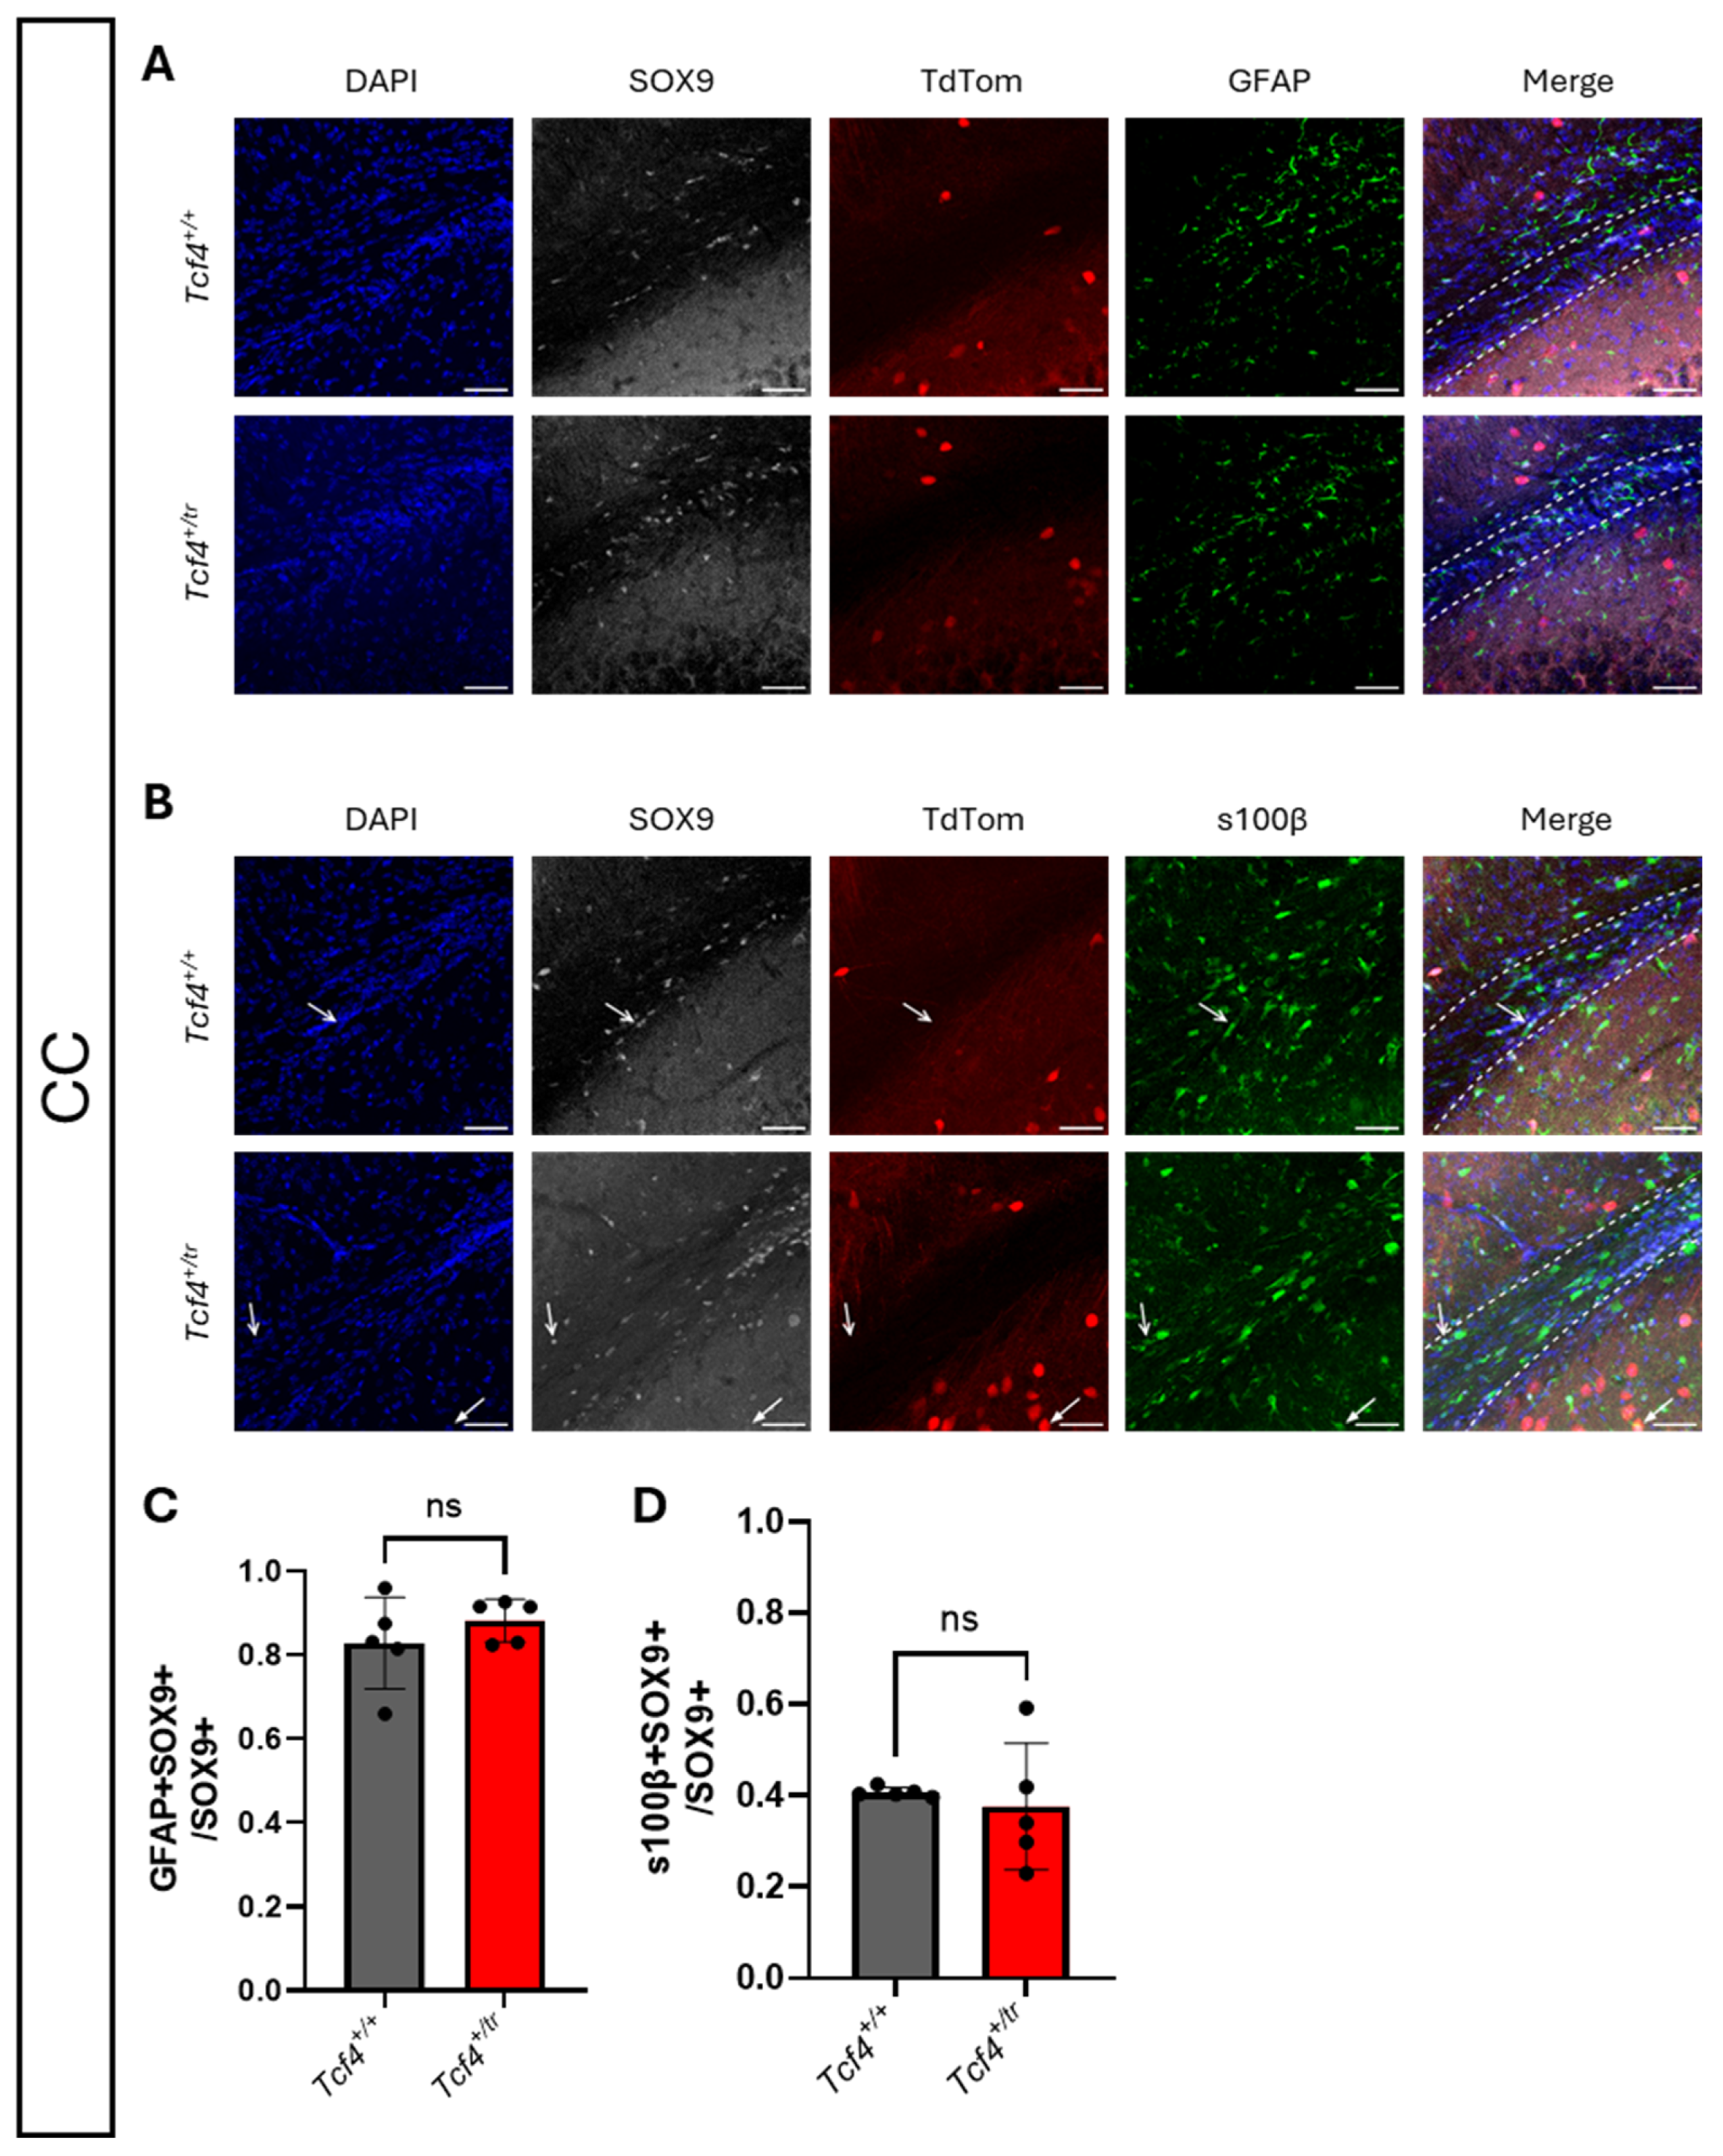
Characterization of ventrally derived fibrous astrocyte populations in the PTHS mouse model. (A) IHC of the ventrally derived GFAP+ astrocyte population in the CC of P28 Nkx2.1::TdTom::Tcf4+/tr and Tcf4+/+ littermates. Tissue stained for DAPI (blue, column 1), SOX9 (gray, column 2), TdTom (red, column 3), and GFAP (green, column 4). (B) IHC of the ventrally derived s100β+ protoplasmic astrocyte population in the CC of P28 Nkx2.1::TdTom::Tcf4+/tr and Tcf4+/+ littermates. Tissue stained for DAPI (blue, column 1), SOX9 (gray, column 2), TdTom (red, column 3), and s100β (green, column 4). Closed arrows identify s100β+TdTom+SOX9- cells, while open arrows identify s100β+TdTom-SOX9+ cells. Dashed lines indicate the CC. (C) Summary plot showing no change in the proportion of GFAP+SOX9+/SOX9+ cells in the CC between Tcf4+/tr and Tcf4+/+ mice (KS: Tcf4+/tr 0.8819 ± 0.02276 n = 5 mice, Tcf4+/+ 0.8279 ± 0.04891 n = 5 mice; p = 0.8730). No GFAP+TdTom+ cells were found in the CC from either genotype. (D) Summary plot showing no change in the proportion of s100β+/SOX9+ cells in the CC between Tcf4+/tr and Tcf4+/+ mice (Tcf4+/tr 0.3759 ± 0.06206, n = 5 mice; Tcf4+/+ 0.4070 ± 0.004861, n = 5 mice; p = 0.6301). No s100β+TdTom+ cells were found in the CC from either genotype. Data are presented as mean values ± SEM; scale bars: 50 µm. ns nonsignificant.
Next, we searched for the presence of ventrally derived fibrous and protoplasmic astrocyte subpopulations in the dorsal cortex of the Nkx2.1::TdTom::Tcf4+/tr model. Consistent with our results for SOX9+TdTom+ astrocytes, we did not observe any cells that were clearly GFAP+TdTom+ in the dorsal cortex (Figure 6) or CC (Figure 7) of either Tcf4+/tr or Tcf4+/+ mice. We did observe some TdTom+ cells that were contacted by GFAP processes, but these processes did not appear to be originating from the TdTom+ cells and were instead likely processes coming off nearby dorsally derived astrocytes. We did not determine the identity of the TdTom+ cells but presume that they represent cells of the OL or inhibitory neuron lineage; however, clear expression of TdTom serves as a positive control for the Nkx2.1-cre recombination of the reporter and for the migration of ventrally derived cell types into the dorsal cortex. We next searched for ventrally derived protoplasmic astrocytes (s100β+TdTom+) in the dorsal cortex and were able to identify a few extremely rare examples of s100β+TdTom+ cells in the dorsal cortex. These cells were clearly negative for SOX9, suggesting they are likely myelinating OLs [36]. Overall, we found a total of four s100β+TdTom+SOX9- cells in the dorsal cortex of Tcf4+/+ mice, and only one such cell in the dorsal cortex of Tcf4+/tr mice. Although these counts were found to be significantly different by genotype (Figure 6E and Supplementary Figure S3), the overall rarity of this cell population likely diminishes but does not completely rule out their potential relevance to pathology. No s100β+TdTom+ cells were found within the CC, though we did identify a single s100β+TdTom+ cell that was located below the CC in a single Tcf4+/tr animal (Figure 7B).
4. Discussion
Prior studies that modeled PTHS have indicated that TCF4 is critical to regulating the density of several different cell types in the mouse brain, including OPCs, OLs, inhibitory neurons, and excitatory neurons [9,12,13]. In the present study, we evaluated whether heterozygous mutations in Tcf4 had any effect on the expression of astrocyte markers, astrocyte density and/or astrocyte migration. Our primary observation was that the heterozygous Tcf4 mutation had no effect on astrocyte marker expression, the density of fibrous or protoplasmic astrocyte populations, or the proper allocation of ventrally derived astrocytes into dorsal cortical domains.
Emerging evidence suggests that ASD risk genes functionally converge on the regulation of neural progenitor cell proliferation and differentiation during corticogenesis [22,23,24], which could potentially lead to alterations in the density of neural cells, including astrocytes. The mRNA expression pattern of TCF4 over the lifespan of rodents and humans suggests it plays a critical role in brain development, whereby TCF4 expression peaks during cortical development and then declines during the early postnatal period before leveling off into adulthood [8,37]. In the adult mouse and human brain, TCF4 expression is primarily observed in the pallium and cerebellum, being expressed in both excitatory and inhibitory neurons, OPC, OLs and astrocytes (Figure 2) [38]. This expression pattern aligns well with evidence from both mouse models and human induced pluripotent stem cell models of PTHS, which consistently identify dysregulation of neural progenitor cell proliferation and specification that leads to abnormal genesis of neuronal and OL lineages [9,10,11,12,13,14,15]. For instance, we previously observed that a heterozygous Tcf4 mutation significantly reduced the expression of OL lineage and inhibitory neuron cell-type-specific markers, which primarily resulted from a reduction in the density of these cell populations [12,13]. Our current results suggest that heterozygous Tcf4 mutation has no effect on the expression of astrocyte marker genes, both in vivo and in vitro (Figure 2B–D), even though TCF4 expression was relatively consistent across glial cell subtypes in the postmortem human brain (Figure 2A). It should be noted that our in vitro expression data was only derived from 2 Tcf4+/+ mice, which limits us from making strong conclusions from this specific dataset (Figure 2C); however, astrocyte marker gene expression was also not different in vivo (Figure 2D), which is a more physiological approach that is more strongly indicative of cell population density.
Although differential gene expression in the PTHS mouse model has not previously implicated TCF4-dependent pathology in astrocytes [13], we were motivated to determine if astrocyte density was altered because two prior studies identified TCF4-dependent phenotypes related to astrocyte development and migration. The first study showed that at birth, germline homozygous knockout of Tcf4 in mice resulted in complete ablation of midline GFAP+ glia in the indusium griseum and callosal wedge; however, the density of GFAP+ glia was not disrupted in Tcf4+/− mice [10]. In the second study, conditional homozygous deletion of Tcf4 was restricted to the ventral proliferative zone using an Nkx2.1-cre (Nkx2.1-cre::Tcf4fl/fl). This conditional deletion resulted in ectopic localization of ventrally derived protoplasmic and fibrous astrocytes in the dorsal cortex but spared the overall density of astrocytes [16]. These studies clearly indicate that TCF4 plays a role in astrocyte allocation, migration, and development. However, in our present study, we set out to determine if astrocyte density or allocation was altered in the context of PTHS. Consistent with our astrocyte marker expression data, we observed no difference in the density of SOX9+ astrocytes or the density of either fibrous (GFAP+) or protoplasmic (s100β+) astrocytes in either the cortex or CC. These results indicate that heterozygous Tcf4 mutation does not appear to affect the density of astrocytes in the PTHS mouse model. Together, these studies suggest that TCF4 dosage appears to be critical to regulating astrocyte density.
TCF4 dosage also appears to be critical to regulating astrocyte migration and the dorsal/ventral allocation of astrocytes. Conditional homozygous deletion of Tcf4 only in the ventral proliferative zones using the Nkx2.1-cre::Tcf4fl/fl mouse model resulted in a population of ventrally derived “ectopic astrocytes” that had errantly migrated into the dorsal cortex by P15 and were continuously identifiable by P60 [16]. In our present study, we conditionally labeled all ventrally derived cells using the Nkx2.1-cre::TdTom mouse and tracked astrocyte allocation in the Tcf4+/tr and Tcf4+/+ genetic backgrounds. Consistent with our astrocyte density counts from unlabeled germline Tcf4 mutant mice (Figure 3, Figure 4 and Figure 5), we observed no overall difference in the total SOX9+ astrocyte population (Supplementary Figure S1) and no appreciable difference in the density of either GFAP+ or s100β+ astrocytes in the Nkx2.1::TdTom::Tcf4+/tr mouse (Figure 6 and Figure 7), regardless of their origin, genotype or brain region. To determine if ventrally derived astrocytes were misallocated to the dorsal cortex, we performed an extensive search for GFAP+TdTom+SOX9+ and s100β+TdTom+SOX9+, but we did not observe any cells that were clearly GFAP+TdTom+ in the dorsal cortex (Figure 6) or CC (Figure 7) of either Nkx2.1::TdTom::Tcf4+/tr or Nkx2.1::TdTom::Tcf4+/+ mice. These results indicate that germline heterozygous mutations in Tcf4 do not appear to alter the allocation of ventrally derived astrocytes into dorsal cortical domains, as was observed when Tcf4 was conditionally ablated in ventrally derived cells. Given the results of our study and those of Zhang and colleagues [16], it appears that TCF4 dosage is also critical to the regulation of astrocyte migration and allocation. Our hypothesis is that the observed misallocation of ventral astrocytes into the dorsal cortex in Nkx2.1-cre::Tcf4fl/fl mice may result from creating a stark gradient of Tcf4 expression between the dorsal and ventral domains, which may permit abnormal migration of ventrally derived astrocytes into the dorsal cortex.
Overall, we find our results somewhat surprising given that the density of both inhibitory neurons and OL lineages are significantly affected by heterozygous mutation in Tcf4. One possible explanation for this cell-type-specific regulation by TCF4 may involve its interaction with other basic helix–loop–helix (bHLH) transcription factors. ASCL1 is a class II bHLH factor that requires dimerization with an E-protein partner such as TCF4 for efficient DNA binding. ASCL1 expression is critical for inhibitory neuron and OL development [39,40,41], but is not thought to play a role in the development of astrocytes [42,43]. In addition, the homeostatic nature of astrocytes and their ability to proliferate may contribute to their ability to maintain appropriate astrocyte density in a heterozygous Tcf4 background. This compensatory mechanism appears to be at work in the Nkx2.1-cre::Tcf4fl/fl model, as there is no difference in the overall density of astrocytes in the dorsal cortex, even though ventrally derived astrocytes are misallocated to the dorsal cortex [16]. It should be stated that our results do not completely rule out a role for TCF4 in regulating gene expression in astrocytes. TCF4 is clearly expressed in astrocytes (Figure 2) and presumably is therefore likely to regulate expression of downstream genes beyond the few marker genes we examined in our study. Our study also does not address the potential for TCF4 to regulate the function of astrocytes, as we did not quantify the effect of TCF4 mutation on astrocyte morphology and/or physiological function in the brain.
In summary, using methods and sample sizes that have previously detected differences in cell type population density, our results indicate that in the context of PTHS, Tcf4 mutation does not appear to disrupt the density of fibrous and protoplasmic astrocytes in the murine dorsal cortex. Moreover, it does not appear that germline heterozygous TCF4 LOF leads to misallocation of ventrally derived astrocytes into the dorsal cortex. Our results predict that at the cell population level, the density of astrocytes is not a pathological mechanism in PTHS.
Supplementary Materials
The following supporting information can be downloaded at: https://www.mdpi.com/article/10.3390/neuroglia7030024/s1.
Author Contributions
S.M.S.: Methodology, Investigation, Validation, Formal Analysis, Data Curation, Visualization, Writing—Original Draft, Writing—Review and Editing. J.F.B.: Methodology, Investigation, Data Curation, Supervision, Writing—Original Draft, Writing—Review and Editing. B.P.: Methodology, Investigation, Data Curation, Formal Analysis, Visualization. B.J.M.: Conceptualization, Methodology, Resources, Data Curation, Visualization, Writing—Original Draft, Writing—Review and Editing, Supervision, Project Administration, Funding Acquisition. All authors have read and agreed to the published version of the manuscript.
Funding
This project was supported by the Lieber Institute for Brain Development, the National Institute of Mental Health (Grant No. R01MH110487 to BJM), and the Pitt–Hopkins Research Foundation and Penn Medicine Orphan Disease Center (Grant No. MDBR-24-002-PittHopkins to BJM). The content is solely the responsibility of the authors and does not necessarily represent the official views of the National Institutes of Health.
Institutional Review Board Statement
All experimental procedures involving animals were performed in accordance with the National Institutes of Health Guide for the Care and Use of Laboratory Animals and approved by the Johns Hopkins University School of Medicine’s Institutional Animal Care and Use Committee (protocol codes: MO22L91, approval date 18 April 2022; MO25L77, approval date 9 April 2026).
Informed Consent Statement
Not applicable.
Data Availability Statement
Data is contained within the Supplementary Materials.
Acknowledgments
We are grateful for the vision and generosity of the Lieber and Maltz families, who made this work possible. Figure 1 and Figure 2B were created in BioRender. Maher, B. (2025) https://BioRender.com/jzq5759 and https://BioRender.com/bl306ax.
Conflicts of Interest
The authors declare no conflicts of interest.
References
- Yeargin-Allsopp, M.; Rice, C.; Karapurkar, T.; Doernberg, N.; Boyle, C.; Murphy, C. Prevalence of autism in a US metropolitan area. JAMA 2003, 289, 49–55. [Google Scholar] [CrossRef] [Scilit] [PubMed]
- Chakrabarti, S.; Fombonne, E. Pervasive developmental disorders in preschool children: Confirmation of high prevalence. Am. J. Psychiatry 2005, 162, 1133–1141. [Google Scholar] [CrossRef] [Scilit] [PubMed]
- Bourgeron, T. From the genetic architecture to synaptic plasticity in autism spectrum disorder. Nat. Rev. Neurosci. 2015, 16, 551–563. [Google Scholar] [CrossRef] [Scilit]
- Sandin, S.; Lichtenstein, P.; Kuja-Halkola, R.; Hultman, C.; Larsson, H.; Reichenberg, A. The heritability of autism spectrum disorder. JAMA 2017, 318, 1182–1184. [Google Scholar] [CrossRef] [Scilit] [PubMed]
- Grove, J.; Ripke, S.; Als, T.D.; Mattheisen, M.; Walters, R.K.; Won, H.; Pallesen, J.; Agerbo, E.; Andreassen, O.A.; Anney, R.; et al. Identification of common genetic risk variants for autism spectrum disorder. Nat. Genet. 2019, 51, 431–444. [Google Scholar] [CrossRef] [Scilit] [PubMed]
- Satterstrom, F.K.; Kosmicki, J.A.; Wang, J.; Breen, M.S.; De Rubeis, S.; An, J.-Y.; Peng, M.; Collins, R.; Grove, J.; Klei, L.; et al. Large-Scale Exome Sequencing Study Implicates Both Developmental and Functional Changes in the Neurobiology of Autism. Cell 2020, 180, 568–584.e23. [Google Scholar] [CrossRef] [Scilit] [PubMed]
- Fu, J.M.; Satterstrom, F.K.; Peng, M.; Brand, H.; Collins, R.L.; Dong, S.; Wamsley, B.; Klei, L.; Wang, L.; Hao, S.P.; et al. Rare coding variation provides insight into the genetic architecture and phenotypic context of autism. Nat. Genet. 2022, 54, 1320–1331. [Google Scholar] [CrossRef] [Scilit] [PubMed]
- Chen, H.-Y.; Bohlen, J.F.; Maher, B.J. Molecular and Cellular Function of Transcription Factor 4 in Pitt-Hopkins Syndrome. Dev. Neurosci. 2021, 43, 159–167. [Google Scholar] [CrossRef] [Scilit] [PubMed]
- Li, H.; Zhu, Y.; Morozov, Y.M.; Chen, X.; Page, S.C.; Rannals, M.D.; Maher, B.J.; Rakic, P. Disruption of TCF4 regulatory networks leads to abnormal cortical development and mental disabilities. Mol. Psychiatry 2019, 24, 1235–1246. [Google Scholar] [CrossRef] [Scilit] [PubMed]
- Mesman, S.; Bakker, R.; Smidt, M.P. Tcf4 is required for correct brain development during embryogenesis. Mol. Cell. Neurosci. 2020, 106, 103502. [Google Scholar] [CrossRef] [Scilit] [PubMed]
- Espinoza, F.; Carrazana, R.; Retamal-Fredes, E.; Ávila, D.; Papes, F.; Muotri, A.R.; Ávila, A. Tcf4 dysfunction alters dorsal and ventral cortical neurogenesis in Pitt-Hopkins syndrome mouse model showing sexual dimorphism. Biochim. Biophys. Acta Mol. Basis Dis. 2024, 1870, 167178. [Google Scholar] [CrossRef] [Scilit] [PubMed]
- Chen, H.-Y.; Phan, B.N.; Shim, G.; Hamersky, G.R.; Sadowski, N.; O’Donnell, T.S.; Sripathy, S.R.; Bohlen, J.F.; Pfenning, A.R.; Maher, B.J. Psychiatric risk gene Transcription Factor 4 (TCF4) regulates the density and connectivity of distinct inhibitory interneuron subtypes. Mol. Psychiatry 2023, 28, 4679–4692. [Google Scholar] [CrossRef] [Scilit] [PubMed]
- Phan, B.N.; Bohlen, J.F.; Davis, B.A.; Ye, Z.; Chen, H.-Y.; Mayfield, B.; Sripathy, S.R.; Page, S.C.; Campbell, M.N.; Smith, H.L.; et al. A myelin-related transcriptomic profile is shared by Pitt-Hopkins syndrome models and human autism spectrum disorder. Nat. Neurosci. 2020, 23, 375–385. [Google Scholar] [CrossRef] [Scilit] [PubMed]
- Bohlen, J.F.; Cleary, C.M.; Das, D.; Sripathy, S.R.; Sadowski, N.; Shim, G.; Kenney, R.F.; Buchler, I.P.; Banerji, T.; Scanlan, T.S.; et al. Promyelinating drugs promote functional recovery in an autism spectrum disorder mouse model of Pitt-Hopkins syndrome. Brain 2023, 146, 3331–3346. [Google Scholar] [CrossRef] [Scilit] [PubMed]
- Wedel, M.; Fröb, F.; Elsesser, O.; Wittmann, M.-T.; Lie, D.C.; Reis, A.; Wegner, M. Transcription factor Tcf4 is the preferred heterodimerization partner for Olig2 in oligodendrocytes and required for differentiation. Nucleic Acids Res. 2020, 48, 4839–4857. [Google Scholar] [CrossRef] [Scilit] [PubMed]
- Zhang, Y.; Li, D.; Cai, Y.; Zou, R.; Zhang, Y.; Deng, X.; Wang, Y.; Tang, T.; Ma, Y.; Wu, F.; et al. Astrocyte allocation during brain development is controlled by Tcf4-mediated fate restriction. EMBO J. 2024, 43, 5114–5140. [Google Scholar] [CrossRef] [Scilit] [PubMed]
- Hodebourg, R.; Scofield, M.D.; Kalivas, P.W.; Kuhn, B.N. Nonneuronal contributions to synaptic function. Neuron 2025, 113, 2399–2415. [Google Scholar] [CrossRef] [Scilit] [PubMed]
- Vakilzadeh, G.; Martinez-Cerdeño, V. Pathology and astrocytes in autism. Neuropsychiatr. Dis. Treat. 2023, 19, 841–850. [Google Scholar] [CrossRef] [Scilit] [PubMed]
- Eroglu, C.; Barres, B.A. Regulation of synaptic connectivity by glia. Nature 2010, 468, 223–231. [Google Scholar] [CrossRef] [Scilit] [PubMed]
- Reemst, K.; Noctor, S.C.; Lucassen, P.J.; Hol, E.M. The Indispensable Roles of Microglia and Astrocytes during Brain Development. Front. Hum. Neurosci. 2016, 10, 566. [Google Scholar] [CrossRef] [Scilit] [PubMed]
- Lee, H.-G.; Wheeler, M.A.; Quintana, F.J. Function and therapeutic value of astrocytes in neurological diseases. Nat. Rev. Drug Discov. 2022, 21, 339–358. [Google Scholar] [CrossRef] [Scilit] [PubMed]
- Paulsen, B.; Velasco, S.; Kedaigle, A.J.; Pigoni, M.; Quadrato, G.; Deo, A.J.; Adiconis, X.; Uzquiano, A.; Sartore, R.; Yang, S.M.; et al. Autism genes converge on asynchronous development of shared neuron classes. Nature 2022, 602, 268–273. [Google Scholar] [CrossRef] [Scilit] [PubMed]
- Jourdon, A.; Wu, F.; Mariani, J.; Capauto, D.; Norton, S.; Tomasini, L.; Amiri, A.; Suvakov, M.; Schreiner, J.D.; Jang, Y.; et al. Modeling idiopathic autism in forebrain organoids reveals an imbalance of excitatory cortical neuron subtypes during early neurogenesis. Nat. Neurosci. 2023, 26, 1505–1515. [Google Scholar] [CrossRef] [Scilit] [PubMed]
- Li, C.; Fleck, J.S.; Martins-Costa, C.; Burkard, T.R.; Themann, J.; Stuempflen, M.; Peer, A.M.; Vertesy, Á.; Littleboy, J.B.; Esk, C.; et al. Single-cell brain organoid screening identifies developmental defects in autism. Nature 2023, 621, 373–380. [Google Scholar] [CrossRef] [Scilit] [PubMed]
- Wamsley, B.; Bicks, L.; Cheng, Y.; Kawaguchi, R.; Quintero, D.; Margolis, M.; Grundman, J.; Liu, J.; Xiao, S.; Hawken, N.; et al. Molecular cascades and cell type-specific signatures in ASD revealed by single-cell genomics. Science 2024, 384, eadh2602. [Google Scholar] [CrossRef] [Scilit] [PubMed]
- Allen Reference Atlas—Mouse Brain [Brain Atlas]. Available online: http://atlas.brain-map.org (accessed on 13 July 2026).
- Schindelin, J.; Arganda-Carreras, I.; Frise, E.; Kaynig, V.; Longair, M.; Pietzsch, T.; Preibisch, S.; Rueden, C.; Saalfeld, S.; Schmid, B.; et al. Fiji: An open-source platform for biological-image analysis. Nat. Methods 2012, 9, 676–682. [Google Scholar] [CrossRef] [Scilit] [PubMed]
- McCarthy, K.D.; de Vellis, J. Preparation of separate astroglial and oligodendroglial cell cultures from rat cerebral tissue. J. Cell Biol. 1980, 85, 890–902. [Google Scholar] [CrossRef] [Scilit] [PubMed]
- Schwartz, J.P.; Wilson, D.J. Preparation and characterization of type 1 astrocytes cultured from adult rat cortex, cerebellum, and striatum. Glia 1992, 5, 75–80. [Google Scholar] [CrossRef] [Scilit] [PubMed]
- Emani, P.S.; Liu, J.J.; Clarke, D.; Jensen, M.; Warrell, J.; Gupta, C.; Meng, R.; Lee, C.Y.; Xu, S.; Dursun, C.; et al. Single-cell genomics and regulatory networks for 388 human brains. Science 2024, 384, eadi5199. [Google Scholar] [CrossRef] [Scilit] [PubMed]
- Sun, W.; Cornwell, A.; Li, J.; Peng, S.; Osorio, M.J.; Aalling, N.; Wang, S.; Benraiss, A.; Lou, N.; Goldman, S.A.; et al. SOX9 Is an Astrocyte-Specific Nuclear Marker in the Adult Brain Outside the Neurogenic Regions. J. Neurosci. 2017, 37, 4493–4507. [Google Scholar] [CrossRef] [Scilit] [PubMed]
- Zhang, Z.; Ma, Z.; Zou, W.; Guo, H.; Liu, M.; Ma, Y.; Zhang, L. The appropriate marker for astrocytes: Comparing the distribution and expression of three astrocytic markers in different mouse cerebral regions. Biomed Res. Int. 2019, 2019, 9605265. [Google Scholar] [CrossRef] [Scilit] [PubMed]
- Lundgaard, I.; Osório, M.J.; Kress, B.T.; Sanggaard, S.; Nedergaard, M. White matter astrocytes in health and disease. Neuroscience 2014, 276, 161–173. [Google Scholar] [CrossRef] [Scilit] [PubMed]
- Hernández-Ortega, K.; Canul-Euan, A.A.; Solis-Paredes, J.M.; Borboa-Olivares, H.; Reyes-Muñoz, E.; Estrada-Gutierrez, G.; Camacho-Arroyo, I. S100B actions on glial and neuronal cells in the developing brain: An overview. Front. Neurosci. 2024, 18, 1425525. [Google Scholar] [CrossRef] [Scilit] [PubMed]
- Chaboub, L.S.; Deneen, B. Astrocyte form and function in the developing central nervous system. Semin. Pediatr. Neurol. 2013, 20, 230–235. [Google Scholar] [CrossRef] [Scilit] [PubMed]
- Du, J.; Yi, M.; Zhou, F.; He, W.; Yang, A.; Qiu, M.; Huang, H. S100B is selectively expressed by gray matter protoplasmic astrocytes and myelinating oligodendrocytes in the developing CNS. Mol. Brain 2021, 14, 154. [Google Scholar] [CrossRef] [Scilit] [PubMed]
- Rannals, M.D.; Hamersky, G.R.; Page, S.C.; Campbell, M.N.; Briley, A.; Gallo, R.A.; Phan, B.N.; Hyde, T.M.; Kleinman, J.E.; Shin, J.H.; et al. Psychiatric risk gene transcription factor 4 regulates intrinsic excitability of prefrontal neurons via repression of scn10a and KCNQ1. Neuron 2016, 90, 43–55. [Google Scholar] [CrossRef] [Scilit] [PubMed]
- Kim, H.; Berens, N.C.; Ochandarena, N.E.; Philpot, B.D. Region and cell type distribution of TCF4 in the postnatal mouse brain. Front. Neuroanat. 2020, 14, 42. [Google Scholar] [CrossRef] [Scilit] [PubMed]
- Sommer, L.; Shah, N.; Rao, M.; Anderson, D.J. The cellular function of MASH1 in autonomic neurogenesis. Neuron 1995, 15, 1245–1258. [Google Scholar] [CrossRef] [Scilit] [PubMed]
- Casarosa, S.; Fode, C.; Guillemot, F. Mash1 regulates neurogenesis in the ventral telencephalon. Development 1999, 126, 525–534. [Google Scholar] [CrossRef] [Scilit] [PubMed]
- Nakatani, H.; Martin, E.; Hassani, H.; Clavairoly, A.; Maire, C.L.; Viadieu, A.; Kerninon, C.; Delmasure, A.; Frah, M.; Weber, M.; et al. Ascl1/Mash1 promotes brain oligodendrogenesis during myelination and remyelination. J. Neurosci. 2013, 33, 9752–9768. [Google Scholar] [CrossRef] [Scilit] [PubMed]
- Li, X.; Liu, G.; Yang, L.; Li, Z.; Zhang, Z.; Xu, Z.; Cai, Y.; Du, H.; Su, Z.; Wang, Z.; et al. Decoding cortical glial cell development. Neurosci. Bull. 2021, 37, 440–460. [Google Scholar] [CrossRef] [Scilit] [PubMed]
- Kim, E.J.; Battiste, J.; Nakagawa, Y.; Johnson, J.E. Ascl1 (Mash1) lineage cells contribute to discrete cell populations in CNS architecture. Mol. Cell. Neurosci. 2008, 38, 595–606. [Google Scholar] [CrossRef] [Scilit] [PubMed]
Disclaimer/Publisher’s Note: The statements, opinions and data contained in all publications are solely those of the individual author(s) and contributor(s) and not of MDPI and/or the editor(s). MDPI and/or the editor(s) disclaim responsibility for any injury to people or property resulting from any ideas, methods, instructions or products referred to in the content. |
© 2026 by the authors. Licensee MDPI, Basel, Switzerland. This article is an open access article distributed under the terms and conditions of the Creative Commons Attribution (CC BY) license.