


Abstract
Vibrations occurring when playing a musical instrument can affect how the quality of the instrument is perceived by the player. Previous studies on violins have investigated how vibrotactile feedback influences certain perceptual attributes and the perceived quality or preference of the instruments. These studies have found that, in addition to auditory feedback, vibrotactile feedback had an important influence on the corresponding ratings. In these studies, however, to control the vibrotactile feedback independently from the auditory feedback was only possible to a limited extent, or not at all. To overcome this limitation, the present study introduces a concept for the creation of a violin-like instrument on which both vibrotactile and auditory feedback can be controlled individually. To apply this concept, the feedback that the instrument exposes by itself to the player is required to be as minimal as possible. This keeps interference with the intended feedback to a minimum. It was decided to use an electric violin as the basis, as the usual absence of a hollow body being the most important airborne excitation source meets this requirement in the auditory domain already quite well. In the vibrotactile domain, however, meeting this requirement is more challenging, as most of the structure-borne excitation sources persist. Therefore, the present study investigated the vibrotactile feedback of electric violins. Two setups for measuring the vibrotactile feedback exposed to the player at the neck of a violin are presented. One setup was intended to ensure high reproducibility while the other one was intended to resemble real playing scenarios more closely. Using these two setups, measurements were carried out for a set of six electric violins. The results were discussed regarding physical and perceptual aspects. Finally, one electric violin was selected for the creation of a violin-like instrument with independently controllable auditory and vibrotactile feedback.
1. Introduction
Playing a musical instrument is a multimodal experience, involving both auditory and vibrotactile feedback. The perceived quality of an instrument is not only influenced by the auditory feedback. Rather, the vibrotactile feedback also plays an important role [1,2,3,4]. It has been shown that modifications to both types of feedback can affect the ratings of certain perceptual attributes, the perceived quality, or preference. For example, modifying the auditory feedback of a violin in a listening test affected the assessment of certain timbre-related perceptual attributes [5]. Adding vibrotactile feedback during a listening test likewise changed the ratings of perceptual attributes [6]. In playing tests involving different violins with masked auditory or vibrotactile feedback, it was shown that both types of feedback were important for quality assessments [2]. Likewise, enhancing the vibrotactile feedback of a classical violin by using vibration actuators affected the ratings of perceptual attributes [7]. Similar results were shown for other instruments such as pianos [3]. Results of a recent study, using an electric cello equipped with vibration actuators, similarly showed that ratings of perceptual attributes changed when the vibrotactile feedback was enhanced [8].
The aforementioned studies compared conditions with vibrotactile feedback present or absent, or at normal or enhanced levels and found that vibrotactile feedback is in general perceptually relevant. In these studies, however, it was only possible to control the vibrotactile feedback independently from the auditory feedback to a limited extent, or not at all. This is because both types of feedback are interconnected via their mechanical generation principles on a classical instrument. To gain a deeper understanding of which specific characteristics of the vibrotactile feedback influence the perception to what extent, however, it is essential to control the vibrotactile feedback independently from the auditory feedback. The present study, therefore, addresses the question of how to gain full independence in controlling both types of feedback. A concept for the creation of a violin-like instrument was developed on which both vibrotactile and auditory feedback can be controlled individually. This concept comprises five main points:
- The ergonomics should be identical to the classical instrument to enable experienced players to adapt quickly.
- The intended auditory feedback is to be created with headphones. Therefore, the auditory feedback generated by the instrument itself when playing must be low enough to avoid interference with the headphone signals.
- The intended vibrotactile feedback is to be created with vibration actuators attached to the instrument. Therefore, the vibrotactile feedback generated by the instrument itself when playing must be low enough to avoid interference with the signals of the vibration actuators.
- The source signal for the generation of both vibrotactile and auditory feedback is acquired with a pickup attached to the instrument.
- The signals are processed in real-time.
An instrument created in accordance with this concept will be referred to as Auditory–Tactile Feedback-Adaptable Violin (ATaFAVi) in the following.
To maintain the ergonomics of a classical violin and to keep the auditory feedback generated when playing the ATaFAVi to a minimum, it was decided to select an electric violin (EV) as the basis. An EV usually lacks a hollow body, which is the most important airborne excitation source. Therefore, the auditory feedback generated while playing an EV is already mitigated quite well. The generation of vibrotactile feedback, however, is not reduced to a similar extent. As most of the structure born excitation sources persist on an EV, keeping the vibrotactile feedback generated when playing the ATaFAVi to a minimum is challenging. First, an EV needs to be identified that generates the lowest possible vibrotactile feedback when being played. Depending on the remaining amount, further passive or active reduction measures might have to be applied additionally.
The present study addresses this first step and investigates the vibrotactile feedback of EVs. Two setups for measuring the vibrotactile feedback exposed to the player at the neck of a violin are presented. One setup was intended to ensure high reproducibility while the other one was intended to resemble real playing scenarios more closely. Using these two setups, measurements were carried out for a set of six EVs. The results were discussed regarding physical and perceptual aspects. For quantitative comparison, a single value representation was introduced. Based on the comparison, one EV was selected as the basis for the creation of an ATaFAVi.
2. Materialsand Methods
2.1. Electric Violins
Five commercially available EVs and one prototype were used in this study. They were selected to provide a correspondingly wide range of variations in their construction and materials. Conventional shoulder and chin rests could be fitted to all EVs. Table 1 lists some specifications of the EVs along with their labels, which will be used throughout the manuscript.
Table 1.
Labels and some specifications of the electric violins used in this study. Missing information is labeled not available (n.a.).
EV-B and EV-C imitated the shape of a classical violin. In contrast to the hollow body of classical violins, these two EVs only possessed an outer rim. Therefore, sound radiation was minimized. EV-A and EV-F exhibited a streamlined design, with a smaller body replacement. EV-F had a rigid body replacement, while the body replacement of EV-A was hollow but closed. EV-D and EV-E had a minimalist design and were built out of an aluminum or carbon fiber pipe, respectively. EV-E is shown in Figure 1a. The basic dimensions of the EVs were almost identical. All EVs had a typical scale length of approximately 325 mm ( mm), a fingerboard width of 23 to 25 mm at the nut and 41 to 43 mm at the end, and a weight between 484 g (EV-E) and 653 g (EV-B).
Figure 1.
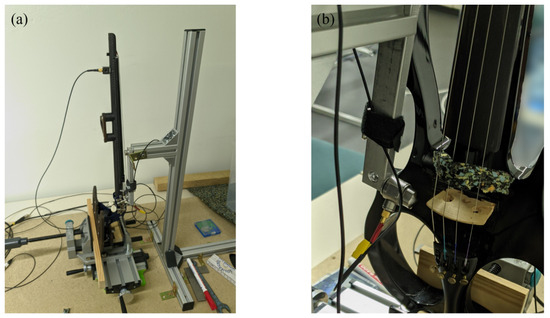
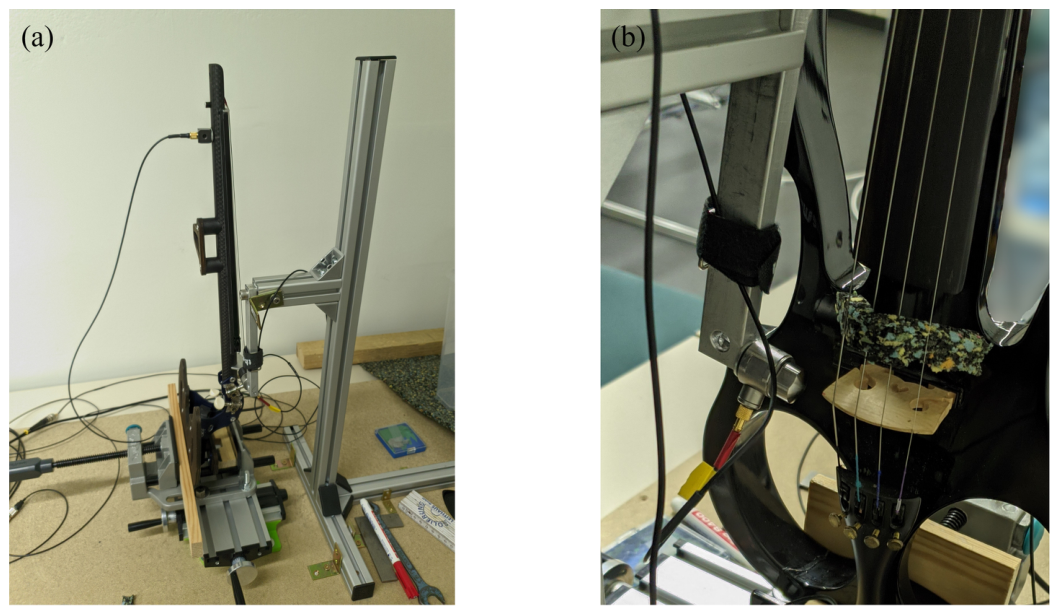
(a) Test stand with the electric violin EV-E clamped into it. (b) Force sensor connected to the pendulum of the test stand.
2.2. Measurement Setups
The vibrotactile feedback was investigated using two measurement setups. First, measurements were conducted in a test stand to achieve a high reproducibility. Second, measurements were conducted in playing position, resembling a real playing scenario. Both setups were used to characterize the vibrations occurring at the neck of the EV after an impact excitation at the bridge. The impact force imposed at the bridge of the EV and the acceleration in three dimensions at the contact point between the player’s left hand and the neck of the EV were measured. Even though there are more than one contact point (left hand, chin, shoulder), only the left hand contact point was investigated here as it is much more sensitive to vibrotactile stimulation than chin and shoulder [9,10]. Furthermore, the chin and shoulder contact points are usually at removable parts (chin rest and shoulder rest) whose coupling to the violin can be reduced by inserting a damping material. There is another contact point at the right hand, typically holding the bow. This contact point was, however, usually excluded from the scope of the studies in this research field (e.g., [2,6,11]). So it was excluded from the present study. In the following, the two setups and the measurements conducted with them are described in detail.
2.2.1. Test Stand Measurement
The EV was clamped into a test stand, which was built similarly to typical ones used in modal analyses of acoustical violins, as described, for example, in [12]. As done in [13], the EV was clamped at the lower end of the body in the same way as a chin rest would be attached to it. Therefore, no chin or shoulder rests were attached in this setup. Apart from its lower end, the EV was neither stopped nor damped. Therefore, the neck could swing freely. The clamp, in which the EV was placed, was connected to a compound sliding table for two-dimensional positioning in the horizontal plane. Figure 1a shows the test stand with EV-E clamped into it. Figure A1a provides further details on the test stand.
A type KS903B.100 triaxial acceleration sensor (Metra Meß- und Frequenztechnik Radebeul GmbH & Co. KG, Radebeul, Germany; sensitivity per axis: 10.2 mV/(ms−2); maximum range per axis: 600 ms−2) was attached to the neck of the EV using a two-component cold curing adhesive. It was placed on the backside of the neck, away from the strings, at the point where the strings need to be stopped to sound two semitones higher than the open strings (cf. Figure A1b). This approximated the location where the left hand touches the backside of the neck when playing a violin in the first position. Spatial averaging resulted from the contact area between the neck and the sensor, which had the dimensions of mm. This area is comparable with the area under the finger during playing. A type 1051V2 force sensor (Dytran Instruments, Inc., Chatsworth, CA, USA; sensitivity: 22.5 mV/N; maximum range: 222 N) was mounted with a screw to a pendulum with a rigid shaft, which was connected to a gallows via a ball bearing. A metal piece that was also attached to the gallows served as a stop for the pendulum’s deflection. This ensured a consistent radial velocity at the impact point. The force sensor was equipped with an aluminum tip. The correct height of the pendulum was set by sliding the gallows up or down. When the height was adjusted, it was fixed with two screws. Therefore, together with the use of the compound sliding table, the impact point of the hammer at the EV could be adjusted precisely in three dimensions. The impact point was chosen to be at the edge of the bridge next to the lowest string (cf. Figure 1b). The excitation direction was perpendicular to the strings and parallel to the body surface. Therefore, the excitation direction was aligned with the typical bowing direction. Both the gallows framework and the positioning table were mounted to a chipboard ground plate to keep them in place. During the measurement, the strings were damped with a small piece of elastic foam that was clamped in between the strings. For conducting the measurement, the pendulum was deflected until it reached the stop and then let go to be accelerated by gravity.
2.2.2. Measurement in Playing Position
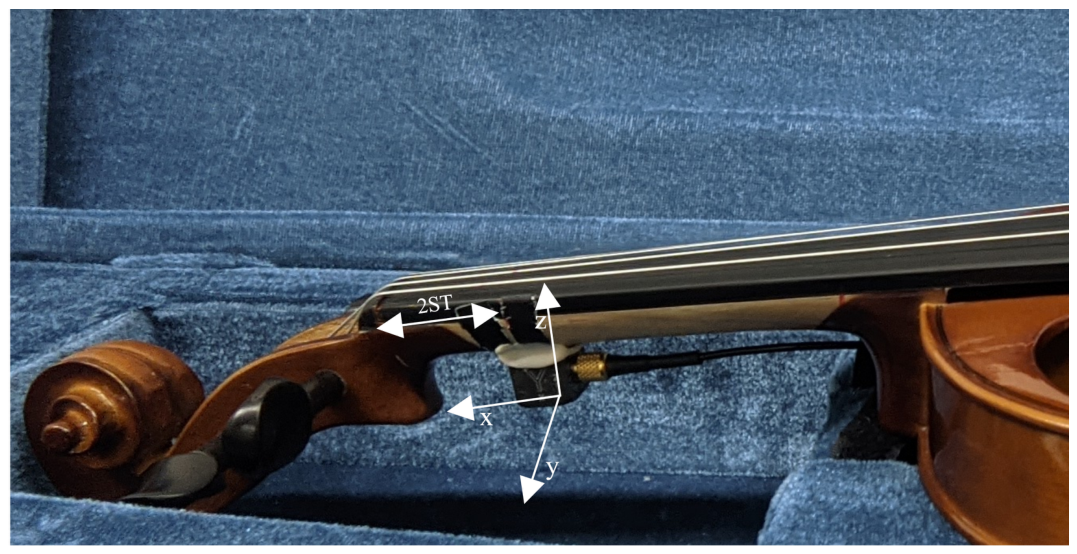
During the measurement, the EV was held by the experimenter in playing position. This mimicked the conditions of a real playing scenario. The left hand was touching the neck of the EV, similar to when it is played in the first position. However, no strings were stopped with the fingers. To prevent the strings from ringing, they were dampened with the same piece of foam that was used in the test stand measurements. The EV was equipped with a chin rest and a shoulder rest. The same acceleration sensor was attached to the neck of the EV as in the test stand measurements in the same position (cf. Figure A2). The experimenter’s hand closed around the acceleration sensor. The impact was generated using a type 8206 impact hammer (Hottinger Brüel & Kjær, Virum, Denmark; sensitivity: 22.7 mV/N; maximum range: 4448 N). The hammer was equipped with a metal tip and the bridge was excited at the same edge as in the test stand measurements. The hammer was manually operated by the experimenter.
2.3. Data Acquisition
All sensor signals were recorded with ArtemiS SUITE Recorder 13 via a labCOMPACT24 interface (HEAD acoustics GmbH, Herzogenrath, Germany). The sensors were powered by the interface and were coupled via a 22 Hz high-pass filter. The recordings were sampled at 48 kHz and stored in a 32-bit floating point data type. The gain of each channel was adjusted based on test measurements to avoid clipping while maintaining the maximum dynamic range.
2.4. Procedure
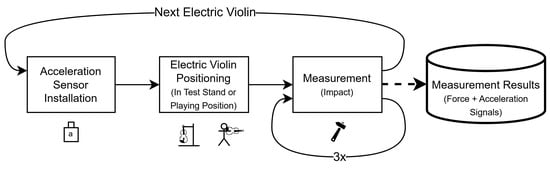
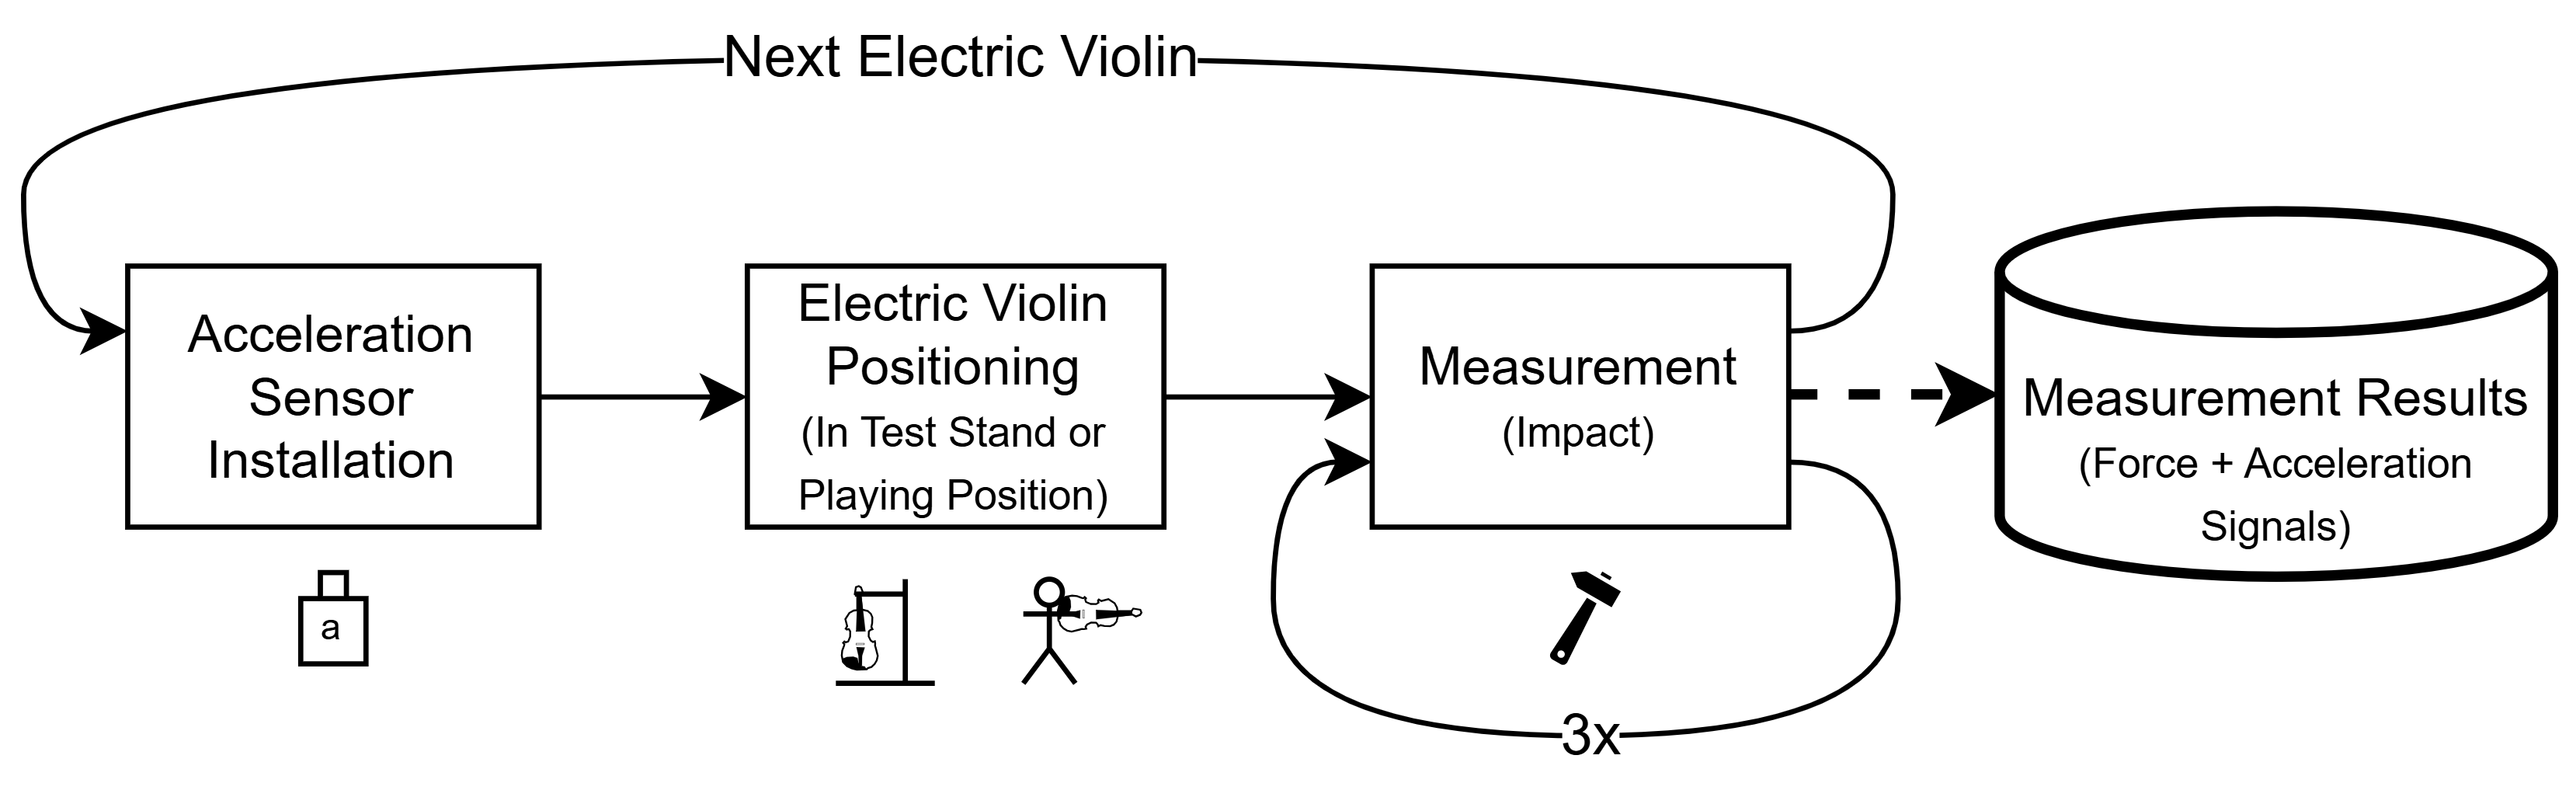
Multiple rounds of measurements were conducted with both measurement setups. In each round, all the EVs were measured sequentially. The procedure for one measurement round is depicted in Figure 2. For the measurement of one EV within one round, the acceleration sensor was attached to the neck of the EV. Then, the EV was placed on the test stand or the experimenter’s shoulder. For the test stand measurement, the impact point was carefully adjusted between the pendulum and the EV. When the EV was correctly positioned, three consecutive measurements were made, each with a total recording duration of 3 s, including 0.5 s prior to the impact and 2.5 s after the impact. After the three measurements, the EV was removed from the test stand or removed from the experimenter’s shoulder, and the process was started over with the next EV. One measurement round was over when each EV was mounted once.
Figure 2.
Measurement procedure of one measurement round for one electric violin. In each round, three consecutive measurements were made without changing the setup. Multiple non-consecutive rounds were conducted for each electric violin.
Conducting multiple measurement rounds and three consecutive measurements in each round provided information on the reproducibility between different mountings of the same EV, as well as within a single mounting. In the case of the test stand measurements, three measurement rounds were conducted. For the measurements in playing position, only two rounds were conducted, as an intermediate analysis of the results of the first two measurement rounds revealed that the deviations observed between measurements of the same round (when the EV was not put down in between) were similar to the deviations observed between the measurements of two rounds (when the EV was put down in between). Therefore, the third round of measurements was skipped.
2.5. Data Processing
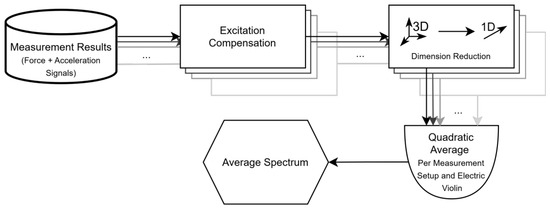
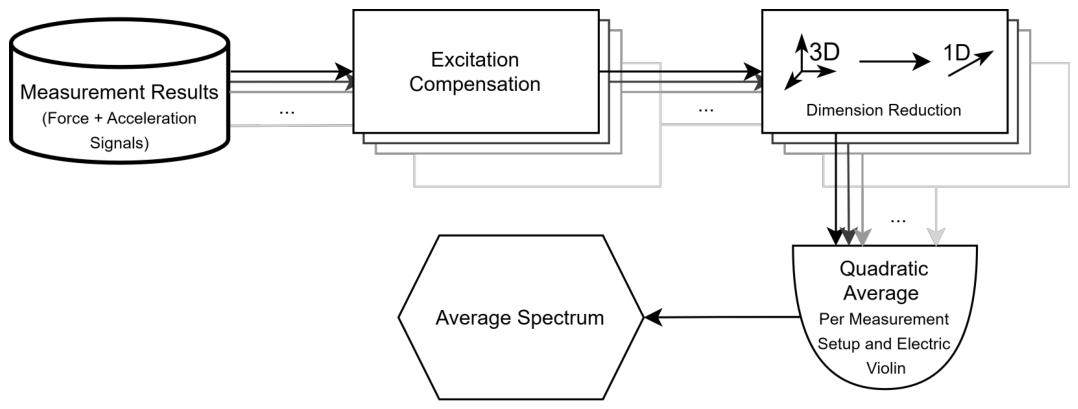
The data set collected in the present study comprised 54 test stand measurements (six EVs, three measurement rounds, three measurements per round) and 36 measurements in playing position (six EVs, two measurement rounds, three measurements per round). In order to enable a comparative analysis, several processing steps were applied to the measurement data. These steps are summarized in Figure 3 and are described below.
Figure 3.
Processing steps applied to the measurement data. First, the excitation signal is compensated for in the acceleration signals. Second, the spectra of the three acceleration axes are combined into a single one-dimensional spectrum per measurement. Third, the resulting one-dimensional spectra of all measurements corresponding to one electric violin are quadratically averaged separately for each measurement setup.
2.5.1. Excitation Compensation
In the first step, the excitation signal was compensated for in the corresponding acceleration signals. This was necessary to obtain comparable results for the different EVs, as the force differed between the EVs due to their different geometries and materials. The excitation force compensation was carried out in the frequency domain. For this, the magnitude of the transfer functions (TFs) between the force signal and the three acceleration signals was calculated for each measurement. The magnitude of the TFs was derived as the magnitude ratio of the averaged Fast Fourier Transform spectra (FFTs) with a length of 16,384 samples, Hanning windowing, and a 50% overlap. The TF results were multiplied by a hypothetical force signal with a uniform magnitude spectrum with a magnitude of 1 N, yielding acceleration magnitude spectra. Doing so enables a direct comparison between the results of the present study and perception thresholds from the literature. An excitation force of 1 N approximates the force between bow and strings occurring on violins at medium playing dynamics (mf) [14]. A similar force was assumed to be present between the strings and the bridge [15].
2.5.2. Average Spectra
In the second step, the three excitation-force-compensated magnitude spectra corresponding to the three acceleration axes of a single measurement were combined into a single one-dimensional magnitude spectrum by calculating their Euclidean norm in the frequency domain, similar to the DFT321 algorithm proposed by Landin et al. [16]. The resulting one-dimensional magnitude spectra of all measurements corresponding to one EV were quadratically averaged separately for each measurement setup, resulting in one average acceleration magnitude spectrum per EV and measurement setup, which will be referred to as the average spectrum in the following.
2.5.3. Analysis Frequency Range
The impact excitation used in both measurement setups covered a wide frequency range up to 2 kHz and beyond, depending on the measurement setup and EV. Both physical and perceptual aspects, however, suggested constraining the frequency range in which the measurement data was further analyzed. When a violin gets played, the lowest possible frequency, at which vibrotactile feedback can be excited, is the fundamental frequency of the lowest string. This is typically G3 with a fundamental frequency of approximately 196 Hz. The lower frequency limit for the further analysis was, therefore, set to 100 Hz corresponding to the rounded fundamental frequency of G3.
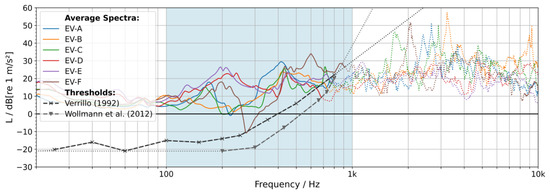
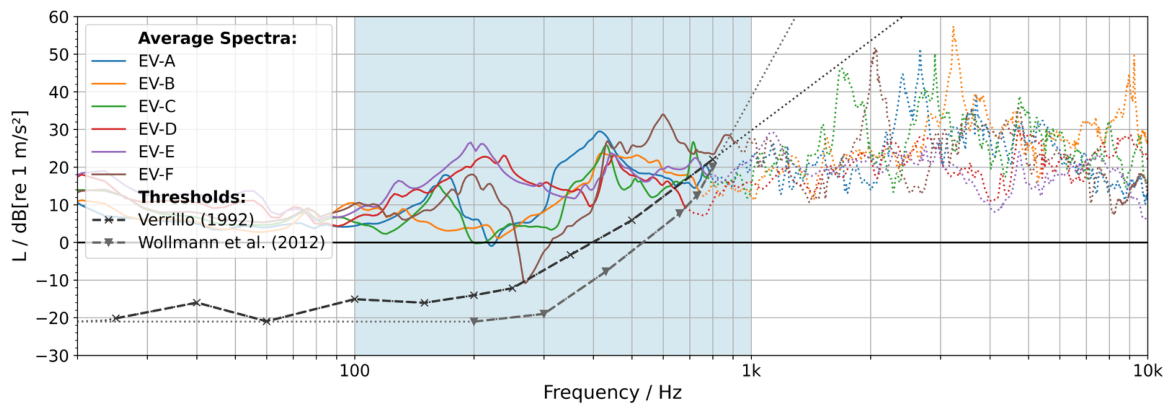
Human vibrotactile perception has been subject to various studies [13,17,18,19]. The frequency range covered in these studies often started from below 100 Hz and often reached up to 1 kHz, depending on the experimental scenario. Regarding horizontal vibrations occurring at the violin neck, a comparison to vibrotactile perception thresholds after Verillo [9] presented in [20] suggests that they are perceptible up to approximately 750 Hz. To analyze the measurements conducted in the present study regarding this aspect, Figure 4 shows the average spectra of all EVs together with vibrotactile perception thresholds after [9,21]. For easier comparability, the threshold curves were logarithmically extrapolated towards lower and higher frequencies.
Figure 4.
Average spectra of the acceleration at the neck for six electric violins (EVs), measured in the test stand. Along with the average spectra, two vibrotactile perception thresholds after Verillo [9] and Wollman et al. [21] are shown with dashed lines and markers. Gray dotted lines indicate a logarithmic extrapolation of the threshold curves. The average spectrum curves are dotted when they lie below both of the threshold curves. The frequency range shaded in blue visualizes the selected frequency range for the further analysis. Note that the acceleration shown was calculated based on a hypothetical excitation force signal with a uniform magnitude spectrum with a magnitude of 1 N (c.f. Section 2.5).
A comparison of the average spectra and the threshold curves suggests that the vibrations measured at the neck of all EVs were likely perceptible up to approximately 900 Hz, which is in good accordance with the findings presented in [20]. Assuming that playing dynamics vary between somewhat quieter or louder levels (between p and f), the upper perceptual frequency limit may vary between 500 Hz and 1 kHz. The upper frequency limit for the further analysis was, therefore, set to 1 kHz, corresponding to the assumed upper perceptual frequency limit for louder playing dynamics (f).
3. Results
3.1. Test Stand Measurements
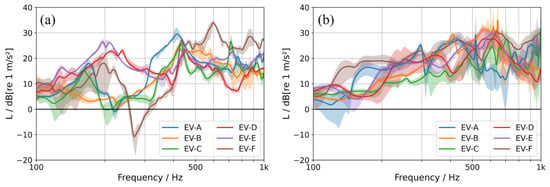
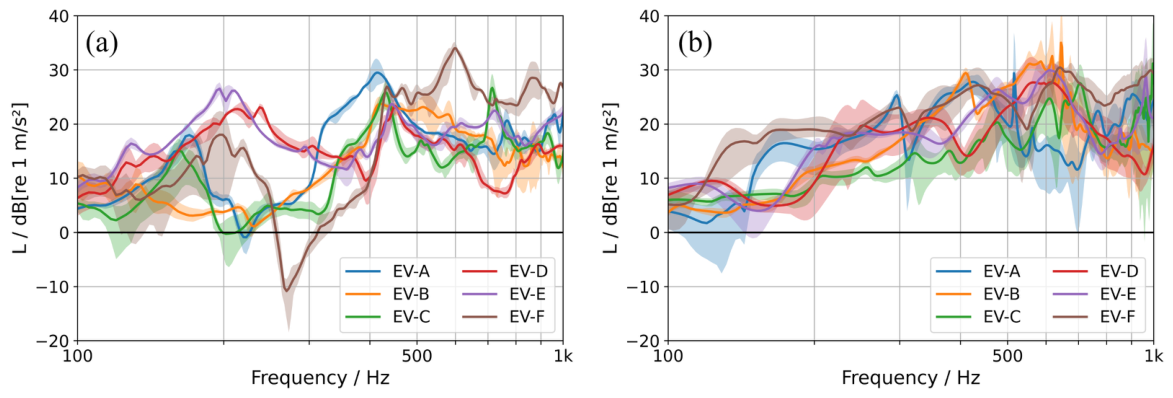
Figure 5a shows the average spectra of all EVs (solid lines) measured in the test stand. The shaded areas around the average spectrum curves indicate the span between the minimum and the maximum of the underlying individual measurements (cf. Section 2.5). The narrow shades indicate good reproducibility of the individual measurements per EV over a wide frequency range. The highest deviations occurred at frequencies below 200 Hz. In particular, the results of EV-F spread more than 10 dB in that frequency range. The consistency of the consecutive measurements per EV within one measurement round is not depicted, but these measurements yielded almost identical results for each EV. Therefore, the deviations shown in Figure 5a resulted from (re-)mounting the EVs in the test stand and from (re-)positioning the acceleration sensor.
Figure 5.
Average spectra of the acceleration at the neck for six electric violins (EVs), measured in the test stand (a) and in playing position (b). The shaded area around the average spectrum curves indicates the span between the minimum and the maximum of the underlying individual measurements. Note that the acceleration shown was calculated based on a hypothetical excitation force signal with a uniform magnitude spectrum with a magnitude of 1 N (c.f. Section 2.5).
The average spectrum of each EV exhibited frequency regions with elevated and attenuated acceleration magnitudes. This resulted from the mechanical vibration characteristics (modes) of the EVs. It is worth noting that the neck could swing freely in this setup, resulting in sharp peaks and dips in the spectrum. Whereas EV-D and EV-E exhibited strong peaks (more than 20 dB) at around 200 Hz, the other EVs tended not to resonate below 400 Hz. An outstanding property of EV-F was a strong anti-resonance at around 260 Hz. Furthermore, the average spectrum of EV-F showed the highest acceleration levels from 500 Hz to 1 kHz. EV-B and EV-C had a moderate average spectrum, without big resonance peaks. The average spectrum of EV-A showed a relatively wide peak between 300 Hz and 500 Hz.
3.2. Measurements in Playing Position
Figure 5b shows the average spectra of all EVs (solid lines) measured in playing position. The shaded areas around the average spectrum curves indicate the span between the minimum and the maximum of the underlying individual measurements (cf. Section 2.5). The wider shades indicate that the reproducibility of the individual measurements was worse than in the test stand measurements. The deviations were attributed to inevitable variations in EV positioning caused by the experimenter and to a lower reproducibility of the impacts as the EV was held by the experimenter during the measurement. At frequencies above 500 Hz, the shades tend to be broader than the differences between the corresponding average spectra. Therefore, a higher uncertainty of the results in this frequency range needs to be taken into account. As mentioned in Section 2.4, the deviations of the consecutive measurements per EV within one measurement round were at the same magnitude as those between two measurement rounds.
The average spectra of both EV-A and EV-F were elevated in the frequency range between 100 Hz and 200 Hz in contrast to the other EVs. Such behavior did not occur in the test stand measurements. In the playing position measurements, the average spectrum of EV-F showed high acceleration levels over the whole frequency range. The average spectrum of EV-A showed similarly high acceleration levels between 200 Hz and 500 Hz. In the test stand measurements, however, a sharp dip around 260 Hz occurred in the average spectrum of EV-F and a broader, less sharp dip occurred in the average spectrum of EV-A. The average spectra of EV-B, EV-C, EV-D and EV-E showed mostly similar progressions as in the test stand measurements. Around 200 Hz, however, the average spectra of EV-D and EV-E showed a peak, which was not present in the measurements in playing position. Furthermore, the average spectra of EV-B and EV-C began to rise at a frequency of 300 Hz in the test stand measurements, instead of 200 Hz in the measurements in playing position. Additionally, the average spectra of EV-B, EV-D, and EV-E showed significantly lower acceleration between 400 Hz and 1 kHz in the test stand measurements compared to the measurements in playing position.
In general, the average spectra of the EVs measured in playing position were smoother and the peaks and dips at lower frequencies were less prominent. Furthermore, the mid-frequency range was elevated for most of the EVs.
4. Discussion
There were differences in the results of the two measurement setups. In the test stand measurements, the average spectra showed sharp peaks. In the playing position measurements, the average spectra were smoother (cf. Figure 5). This difference is likely due to a difference in damping. In the test stand measurements, the EVs were clamped into a test stand at the lower end of the body, resulting in a free-swinging neck. In the playing position measurements, the EVs were held by the experimenter. The hand of the experimenter, therefore, added damping to the neck. Similar results have been presented for the resonance body of acoustic violins in [22], where clamping conditions with a higher level of damping caused less-sharp frequency response functions.
The results provided an overview of the different vibration characteristics of the EVs and enabled their qualitative comparison. The average spectrum of each EV showed individual dips and peaks. The dominant vibration energy, therefore, was located at different frequencies for different EVs. This aspect, however, makes a quantitative comparison of the EVs difficult for identifying one that is suitable as the basis for creating an ATaFAVi. To enable a quantitative comparison, a single value representing the overall signal energy of the vibrotactile feedback was calculated from the average spectra. For this, the average spectra were band-limited to the analysis frequency range using a Butterworth bandpass filter of 14th order and RMS levels were calculated from the filtered spectra. Based on physical and perceptual aspects, the initial analysis frequency range was set from 100 Hz to 1 kHz (cf. Section 2.5), with the upper frequency limit corresponding to the assumed upper frequency at which the vibrations generated by the EVs for louder playing dynamics (f) were no longer likely to exceed the vibrotactile perception threshold. To consider varying playing dynamics in the calculation of the band-limited RMS, an additional upper frequency limit of 500 Hz was selected, corresponding to the assumed upper perceptual frequency limit for quieter playing dynamics (p). The resulting band-limited RMS levels were used to rank the EVs, with the lowest rank index corresponding to the lowest band-limited RMS level. Low ranked EVs, therefore, had low vibrotactile feedback. Additionally, to assess the uncertainty of these band-limited RMS levels, their differences to the individual band-limited RMS levels for all one-dimensional magnitude spectra of the measurements corresponding to one EV and measurement setup were calculated. Doing so yielded differences to nine individual band-limited RMS levels per EV for the test stand measurements and to six individual band-limited RMS levels per EV for the playing position measurements. The arithmetic mean of the differences between the band-limited RMS level and the individual band-limited RMS levels per EV and measurement setup was chosen as the uncertainty measure.
Table 2 shows the ranking of the EVs resulting from the measurements in the test stand and in playing position, separately for the two frequency ranges corresponding to quieter (p) and louder playing dynamics (f). The band-limited RMS value corresponding to each EV in each condition is displayed in parentheses (first value). Additionally, the arithmetic mean of the differences in this band-limited RMS level to the individual band-limited RMS levels corresponding to the individual measurements of each EV is displayed as uncertainty measure (second value). The horizontal line between rank index 3 and 4 divides the EVs into two groups, one with low and the other with high vibrotactile feedback.
Table 2.
Ranking of six electric violins (EVs) according to the band-limited RMS level calculated from the acceleration at their neck, measured in the test stand and in playing position. The band-limited RMS level corresponding to each EV is displayed in parentheses (first value). Additionally, the arithmetic mean of the differences in this band-limited RMS level to the individual band-limited RMS levels corresponding to the individual measurements of each EV is displayed as uncertainty measure (second value). The lowest rank index corresponds to the lowest band-limited RMS level. The ranking was carried out in two frequency ranges corresponding to quieter (p) and louder playing dynamics (f). The horizontal line between rank index 3 and 4 divides the EVs in two groups, one with low and the other with high vibrotactile feedback.
The band-limited RMS levels in the test stand measurements have mostly smaller uncertainty than in the playing position measurements, which supports the observations made when comparing Figure 5a,b. In the frequency range corresponding to quieter playing dynamics (p: 100 Hz to 500 Hz), however, the band-limited RMS level of EV-C exhibits an inverse behavior with a slightly lower uncertainty in the playing position measurements. Averaged over all frequency ranges and measurement setups, the band-limited RMS levels of EV-A, EV-B and EV-E exhibit smaller uncertainty than those of EV-C, EV-D and EV-F. Averaged over all frequency ranges, measurement setups and EVs, the uncertainty of the band-limited RMS-level is 0.81 dB.
In the test stand measurements in the frequency range corresponding to louder playing dynamics (f: 100 Hz to 1 kHz), EV-D showed the lowest band-limited RMS levels. The levels of the two EVs following after (EV-C and EV-B) were approximately 1 dB higher and, therefore, in a similar range as EV-D. These three EVs thus formed the group with low vibrotactile feedback. The band-limited RMS levels of EV-E and EV-A were approximately 3 dB higher than the levels of the first three EVs. EV-F had a considerably higher band-limited RMS level, at 9.1 dB above the level of EV-D. These three EVs thus formed the group with high vibrotactile feedback.
In the playing position measurements in the frequency range corresponding to louder playing dynamics (f: 100 Hz to 1 kHz), the lowest band-limited RMS level was approximately 3.5 dB higher than in the corresponding test stand measurements. The highest level, however, was almost similar, resulting in a smaller spread of the band-limited RMS levels, spanning approximately 5.5 dB. The distribution among the individual band-limited RMS levels of the EVs changed, resulting in a different ranking. The most striking difference was that EV-A and EV-B interchanged positions. EV-B showed the second-highest band-limited RMS level and, therefore, was no longer in the group of EVs with low vibrotactile feedback. EV-A, in contrast, moved to this group. The EVs on the first two ranks (EV-C and EV-D) interchanged positions as well; however, they remained in their group. EV-E stayed on the fourth rank and EV-F stayed on the last rank, thus remained in their group as well.
In the frequency range corresponding to quieter playing dynamics (p: 100 Hz to 500 Hz), the band-limited RMS levels were smaller than in the frequency range corresponding to louder playing dynamics (f: 100 Hz to 1 kHz). This resulted from the exclusion of spectral parts at frequencies above 500 Hz. Therefore, the band-limited RMS level of EVs having more energy there was more affected. Both the distribution among the individual band-limited RMS levels of the EVs and their spread changed, resulting in a different ranking than in the frequency range corresponding to louder playing dynamics (f: 100 Hz to 1 kHz). In the test stand measurements the groups of EVs with low or high vibrotactile feedback remained the same as in the frequency range corresponding to louder playing dynamics (f: 100 Hz to 1 kHz). The band-limited RMS levels of the low group still spread less than 2 dB. EV-D moved from rank 1 to rank 3. EV-C moved to rank 1. The band-limited RMS levels of the high group were still more than 3 dB above the levels of the low group, but their spread was smaller. The band-limited RMS level of EV-F decreased drastically, moving its rank to index 4. This was due to the energy of EV-F was primarily located at frequencies above 500 Hz (cf. Figure 5). In contrast, the 400 Hz peak of EV-A caused it to be moved to the highest rank. In the playing position measurements, the groups with low or high vibrotactile feedback changed in comparison to the frequency range corresponding to louder playing dynamics (f: 100 Hz to 1 kHz). EV-A was no longer in the low group, whereas EV-E moved to this group. Apart from that, the groups remained the same. Furthermore, the lowest two and the highest ranked EV remained the same.
Across both measurement setups and both analysis frequency ranges, the rankings of the EVs showed similarities considering the lowest and highest ranks. In three of four conditions, EV-C was on the lowest rank. In the remaining condition, EV-C was on the second lowest rank. EV-C, therefore, generated the lowest possible vibrotactile feedback and thus seemed to be most suitable as the basis for creating an ATaFAVi. Regarding the composite ranking within the four conditions one could argue that EV-D might be a similarly suitable basis for creating an ATaFAVi, especially given the uncertainty of the band-limited RMS levels discussed above. However, EV-C was chosen over EV-D nevertheless, because its shape imitated the shape of a classical violin. Its shape was, therefore, in considerably better accordance with the ATaFAVi concept (cf. Section 1) than EV-D, which had a minimalist design and was built out of an aluminum pipe.
The set of EVs presented here was chosen to provide a wide range of variations in their construction and materials. The set, however, does not fully represent the entire market of EVs available. Although EV-C seemed to be the most suitable among the EVs investigated here, there may, therefore, be EVs that are even more suitable. The set of EVs should, therefore, be extended to further increase the generalization of the results.
Although there were differences in the average spectra of the two measurement setups, the band-limited RMS level used for the quantitative comparison of the EVs caused the corresponding rankings to be similar. This suggests that both setups were suitable for the characterization of the vibrotactile feedback of EVs for creating an ATaFAVi. One could argue that, for this purpose, the test stand setup should be preferred, as the corresponding measurements are easier to conduct and their reproducibility is higher. The overall context of an ATaFAVi, however, suggests that playing position measurements should be conducted nevertheless. For example, corresponding TFs could be used to design equalization filters for the vibration actuators. For this purpose, the TFs must be measured with the EV in playing position, as the damping needs to be similar to the damping during playing. As playing position measurements are important in the context of an ATaFAVi, the corresponding setup and procedure should be further standardized in order to enhance reproducibility. The positioning of the violin between hand, chin, and shoulder seems to be the primary source of variance. Supporting the positioning with laser leveling devices or pressure sensors for the chin and shoulder rest could be beneficial. Assigning a second experimenter to oversee the positioning could also be beneficial. Assigning the operation of the impact hammer to a second experimenter could also be beneficial to ensure stable positioning throughout a measurement round.
Both physical and perceptual aspects were involved during the analysis and the discussion of the results in the present study. One could argue that perceptual aspects should be emphasized even more in the analysis. For example, vibrotactile perception thresholds could be used to weight the average spectra (similar to the A-weighting in acoustics) rather than using them solely in the definition of the analysis frequency range. A corresponding analysis of the results of this study is given in [23], which was published by the authors after the initial submission of this manuscript. This analysis also suggested that EV-C generated the lowest possible vibrotactile feedback and thus seemed to be most suitable as the basis for creating an ATaFAVi. Apart from analyzing the results of measurements conducted with the EVs in the present study under perceptual aspects with varying complexity, one could argue that the EVs should be compared in subjective tests with musicians. Doing so would reveal to what extent the differences between the EVs, as indicated by the band-limited RMS levels, are perceptually relevant. However, the vibrotactile feedback of all tested EVs was beyond vibrotactile perception thresholds (cf. Figure 4). Therefore, the vibrotactile feedback of all EVs tested would very likely be perceptible and might thus require further treatment in the course of the development of an ATaFAVi. It seemed, therefore, reasonable to identify the EV with the lowest possible vibrotactile feedback solely based on measurements as a first step. Subjective tests will be part of the next step of developing an ATaFAVi, investigating the remaining vibrotactile feedback specifically in the intended use case. If necessary, further passive or active measures to reduce remaining vibrotactile feedback will be considered.
5. Conclusions
Up to now, in multimodal perception research on violins, it was only possible to control the vibrotactile feedback independently from the auditory feedback to a limited extent, or not at all. To overcome this limitation, the present study introduced a concept for the creation of a violin-like instrument on which both vibrotactile feedback and auditory feedback can be controlled individually, using an EV as the basis. For this, however, an EV needed to be identified that exposes by itself as little vibrotactile feedback as possible to the player.
This study investigated the vibrotactile feedback of electric violins. Two setups for measuring the vibrotactile feedback exposed to the player at the neck of a violin were presented: a test stand setup that was intended to ensure high reproducibility and a setup in playing position that was intended to resemble real playing scenarios more closely. Using these two setups, measurements of the acceleration at the neck after excitation with an impact hammer at the bridge were carried out for a set of six electric violins. Average acceleration spectra were calculated from the results of the individual measurements. Based on physical and perceptual aspects, the analysis frequency range was set from 100 Hz to 1 kHz. A comparison of the average spectra of each electric violin showed similar trends for both measurement setups. Due to differences in the damping of the neck, however, the average spectra of the playing position measurements were smoother. The average spectra varied between the electric violins, suggesting that the dominant vibration energy was located at different frequencies for different electric violins. To enable a quantitative comparison, RMS levels were calculated from the average spectra in two analysis frequency ranges corresponding to louder (f: 100 Hz to 1 kHz) and quieter playing dynamics (p: 100 Hz to 500 Hz). Across both measurement setups and both analysis frequency ranges, EV-C seemed to be most suitable as the basis for creating an ATaFAVi, as it showed the lowest band-limited RMS level in the majority of the conditions.
Based on the results from this paper, an ATaFAVi prototype will be developed in the future and will be evaluated both physically, involving measurements, and perceptually, involving subjective tests with musicians. Extending the list of electric violins to be investigated is another aspect for future work. So is the extension of the investigation to instruments other than the violin.
Author Contributions
Conceptualization, F.B. and M.E.A.; methodology, F.B.; software, F.B.; validation, F.B. and T.W.; formal analysis, F.B.; investigation, F.B. and T.W.; resources, F.B., M.E.A.; data curation, F.B.; writing—original draft preparation, F.B. and T.W.; writing—review and editing, F.B., T.W. and M.E.A.; visualization, F.B.; supervision, M.E.A.; project administration, M.E.A. and F.B.; funding acquisition, M.E.A. and F.B. All authors have read and agreed to the published version of the manuscript.
Funding
This research was funded by the Deutsche Forschungsgemeinschaft (DFG, German Research Foundation)—493698227.
Institutional Review Board Statement
Not applicable.
Informed Consent Statement
Not applicable.
Data Availability Statement
The raw data supporting the conclusions of this article will be made available by the authors on request.
Acknowledgments
The authors would like to thank sbip-instruments for lending two of their electric violins free of charge. During the preparation of this manuscript, the authors used https://www.deepl.com/de/write (accessed on 9 July 2026) for the purposes of translation and improvements of formulations in English language. The authors have reviewed and edited the output and take full responsibility for the content of this publication.
Conflicts of Interest
The authors declare no conflicts of interest. The funders had no role in the design of the study; in the collection, analyses, or interpretation of data; in the writing of the manuscript; or in the decision to publish the results.
Abbreviations
The following abbreviations are used in this manuscript:
| RMS | Root Mean Square |
| TF(s) | Transfer Function(s) |
| FFT | Fast Fourier Transform |
| EV(s) | Electric Violin(s) |
| ATaFAVi | Auditory–Tactile Feedback-Adaptable Violin |
| textitmf | mezzo-forte (in music: medium playing dynamic) |
| textitp | piano (in music: quiet playing dynamic) |
| textitf | forte (in music: loud playing dynamic) |
| ST | semi tone |
| n.a. | not available |
Appendix A. Further Specifications on Measurement Setups
Figure A1.
(a) Test stand dimensions in mm. The red arrow indicates the excitation of the violin bridge in y-direction. For conducting the measurement, the pendulum was deflected until the stop (marked with the black line) and then let go to be accelerated by gravity. (b) Acceleration sensor attached to the neck of the violin that is clamped into the test stand. The white arrows indicate the sensor coordinate system. The position of the sensor in z-direction was aligned to the position where the strings need to be stopped to sound two semi tones (ST) higher than the open strings. This position depended on the scale length of the electric violin. For the shown electric violin EV-E with a scale length of 322 mm, a distance of 26.3 mm from the nut resulted.
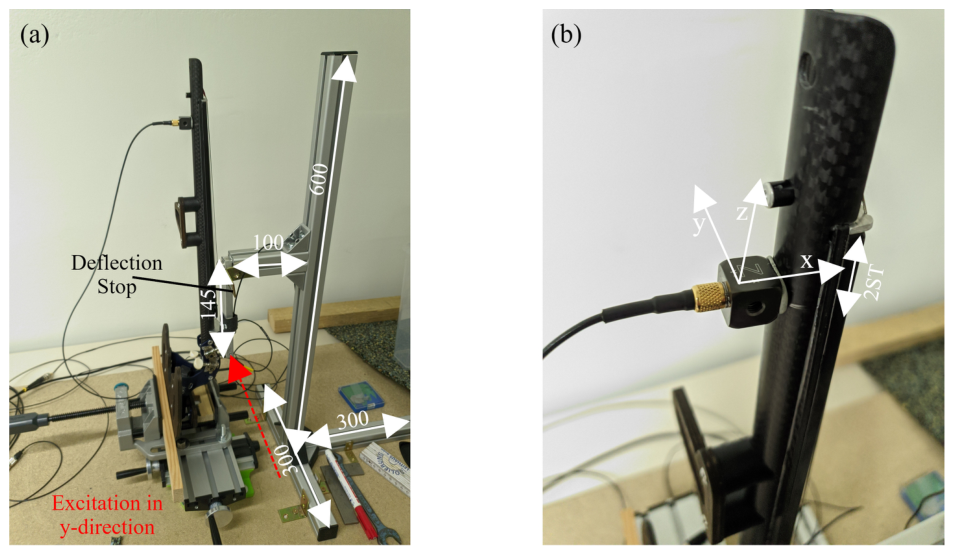
Figure A2.
Acceleration sensor attached to the violin neck for the playing position measurements. The white arrows indicate the sensor coordinate system. Note that the positioning of the sensor was different than in the test stand measurements to avoid collisions with the sensor cable when putting the hand around the violin neck (x-direction and z-direction were swapped). As it was done in the test stand measurements, the position of the sensor in x-direction was aligned to the position where the strings need to be stopped to sound two semi tones (ST) higher than the open strings. This position depended on the scale length of the electric violin. For the shown electric violin EV-C with a scale length of 329 mm, a distance of 26.8 mm from the nut resulted.
References
- Galembo, A.; Askenfelt, A. Quality assessments of musical instruments—Effects of multimodality. In Proceedings of the 5th Triennial ESCOM Conferecne, Hanover, Germany, 8–13 September 2003. [Google Scholar]
- Wollman, I.; Fritz, C.; Poitevineau, J.; McAdams, S. Investigating the Role of Auditory and Tactile Modalities in Violin Quality Evaluation. PLoS ONE 2014, 9, e112552. [Google Scholar] [CrossRef] [Scilit] [PubMed]
- Fontana, F.; Jarvelainen, H.; Papetti, S.; Avanzini, F.; Klauer, G.; Malavolta, L. Rendering and Subjective Evaluation of Real Vs. Synthetic Vibrotactile Cues on a Digital Piano Keyboard. In Proceedings of the 12th International Conference on Sound and Music Computing (SMC-15), Maynooth, Ireland, 30 July–1 August 2015; pp. 161–167. [Google Scholar]
- Saitis, C.; Järveläinen, H.; Fritz, C. The Role of Haptic Cues in Musical Instrument Quality Perception. In Musical Haptics; Papetti, S., Saitis, C., Eds.; Springer International Publishing: Cham, Switzerland, 2018; pp. 73–93. [Google Scholar] [CrossRef] [Scilit]
- Fritz, C.; Blackwell, A.F.; Cross, I.; Woodhouse, J.; Moore, B.C.J. Exploring violin sound quality: Investigating English timbre descriptors and correlating resynthesized acoustical modifications with perceptual properties. J. Acoust. Soc. Am. 2012, 131, 783–794. [Google Scholar] [CrossRef] [Scilit] [PubMed]
- Wollman, I.; Fritz, C.; Poitevineau, J. Influence of vibrotactile feedback on some perceptual features of violins. J. Acoust. Soc. Am. 2014, 136, 910–921. [Google Scholar] [CrossRef] [Scilit] [PubMed]
- Flückiger, M. Vibrotactile Feedback in Piano and Violin Playing: Actuation, Interaction, and Sensation. Ph.D. Thesis, ETH Zurich, Zurich, Switzerland, 2018. [Google Scholar]
- Järveläinen, H.; Papetti, S.; Larrieux, E. Exploring the Effects of Additional Vibration on the Perceived Quality of an Electric Cello. Vibration 2024, 7, 407–418. [Google Scholar] [CrossRef] [Scilit]
- Verrillo, R.T. Vibration Sensation in Humans. Music Percept. 1992, 9, 281–302. [Google Scholar] [CrossRef] [Scilit]
- Beyer, F.; Altinsoy, E.M. Vibrotaktile Wahrnehmungsschwelle Für Vibrationen Im Kinnbereich Im Kontext von Violinen. In Proceedings of the DAGA 2021—47th German Annual Conference on Acoustics, Vienna, Austria, 15–18 August 2021. [Google Scholar]
- Saitis, C.; Fritz, C.; Scavone, G.P.; Guastavino, C.; Dubois, D. Perceptual evaluation of violins: A psycholinguistic analysis of preference verbal descriptions by experienced musicians. J. Acoust. Soc. Am. 2017, 141, 2746–2757. [Google Scholar] [CrossRef] [Scilit] [PubMed]
- Bissinger, G.; Ye, K. Automated hammer-impact modal analysis with a scanning laser vibrometer: Working example—A violin. In Proceedings of the 18th International Modal Analysis Conference, San Antonio, TX, USA, 7–10 February 2000; pp. 943–949. [Google Scholar]
- Wollman, I.; Fritz, C.; Frelat, J. On the Characterization of Vibrotactile Feedback in Violinists’ Left Hand: A Case Study. Acta Acust. United Acust. 2015, 101, 360–368. [Google Scholar] [CrossRef] [Scilit]
- Askenfelt, A. Measurement of the bowing parameters in violin playing. II: Bow–bridge distance, dynamic range, and limits of bow force. J. Acoust. Soc. Am. 1989, 86, 503–516. [Google Scholar] [CrossRef] [Scilit]
- Lampis, A.; Mayer, A.; Pàmies-Vilà, M.; Chatziioannou, V. Examination of the static and dynamic forces at the termination of a bowed string. J. Acoust. Soc. Am. 2023, 153, A198. [Google Scholar] [CrossRef] [Scilit]
- Landin, N.; Romano, J.M.; McMahan, W.; Kuchenbecker, K.J. Dimensional Reduction of High-Frequency Accelerations for Haptic Rendering. In Haptics: Generating and Perceiving Tangible Sensations; Kappers, A.M.L., Van Erp, J.B.F., Tiest, B., Van Der Helm, W.M., Eds.; Springer: Berlin/Heidelberg, Germany, 2010; Volume 6192, pp. 79–86. [Google Scholar] [CrossRef] [Scilit]
- Verrillo, R.T. Vibrotactile thresholds measured at the finger. Percept. Psychophys. 1971, 9, 329–330. [Google Scholar] [CrossRef] [Scilit]
- Verrillo, R.T. Effect of Contactor Area on the Vibrotactile Threshold. J. Acoust. Soc. Am. 1963, 35, 1962–1966. [Google Scholar] [CrossRef] [Scilit]
- Morioka, M.; Griffin, M.J. Thresholds for the Perception of Hand-Transmitted Vibration: Dependence on Contact Area and Contact Location. Somatosens. Mot. Res. 2005, 22, 281–297. [Google Scholar] [CrossRef] [Scilit] [PubMed]
- Askenfelt, A.; Jansson, E.V. On Vibration Sensation and Finger Touch in Stringed Instrument Playing. Music Percept. 1992, 9, 311–349. [Google Scholar] [CrossRef] [Scilit]
- Wollman, I.; Fritz, C.; Frelat, J. Vibrotactile feedback in the left hand of violinists. In Proceedings of the Acoustics 2012 Nantes Conference, Nantes, France, 23–27 April 2012; pp. 3611–3616. [Google Scholar]
- Duerinck, T.; Segers, J.; Skrodzka, E.; Verberkmoes, G.; Leman, M.; Van Paepegem, W.; Kersemans, M. Experimental Comparison of Various Excitation and Acquisition Techniques for Modal Analysis of Violins. Appl. Acoust. 2021, 177, 107942. [Google Scholar] [CrossRef] [Scilit]
- Beyer, F.; Wühle, T.; Altinsoy, M.E. Comparison of the Vibrotactile Feedback of Electric Violins Considering Perceptual Aspects. In Proceedings of the DAGA 2026—52nd German Annual Conference on Acoustics, Dresden, Germany, 23–26 March 2026; pp. 959–962. [Google Scholar]

Disclaimer/Publisher’s Note: The statements, opinions and data contained in all publications are solely those of the individual author(s) and contributor(s) and not of MDPI and/or the editor(s). MDPI and/or the editor(s) disclaim responsibility for any injury to people or property resulting from any ideas, methods, instructions or products referred to in the content. |
© 2026 by the authors. Licensee MDPI, Basel, Switzerland. This article is an open access article distributed under the terms and conditions of the Creative Commons Attribution (CC BY) license.