


Abstract
Electric vehicle (EV) fires can rapidly affect smoke and thermal conditions in underground parking garages. In this study, fifteen PyroSim/FDS cases were screened, but quantitative analysis was restricted to four prescribed-extraction cases and one baseline-matched two-device spray pair. The 0.30 m production mesh was selected using characteristic-fire-diameter, geometric-resolution, and computational-cost criteria. A matched 0.20/0.30/0.50 m check yielded non-monotonic fixed-point responses; mesh independence was not established. Extraction cases were compared using 270–300 s means and the first downward crossing of a 10 m visibility reference. At the same nominal outflow of 10 m3/s, two 5 m/s surfaces produced lower M1 gas temperature and CO and higher visibility than one 10 m/s surface. Relocating the second spray device beneath the vehicle reduced the τ = 120–150 s mean M4 underside-region gas temperature from 776.5 to 103.4 °C, while M1 visibility remained about 0.22 m. Because the model lacks a physical make-up-air path and corresponding experiments were not reproduced, these findings are limited to local prescribed-boundary comparisons. Relevant experiments support the represented mechanisms but the results do not validate the absolute point values. The simulations do not demonstrate battery extinguishment, maintained tenability, or code compliance.
1. Introduction
The rapid increase in electric vehicle (EV) use has altered the fire-risk profile of residential and public parking facilities. Sun et al. [1] reviewed the principal fire hazards associated with lithium-ion batteries in road vehicles, including thermal runaway, prolonged heat release, re-ignition, and difficulties in final extinguishment. Larsson et al. [2] quantified toxic fluoride-gas emissions from lithium-ion battery fires, demonstrating that an EV fire may involve chemical hazards that are not adequately represented by temperature or carbon monoxide alone. Lecocq et al. [3] compared the fire consequences of an electric vehicle with those of an internal combustion engine vehicle, providing an early experimental basis for evaluating similarities and differences between the two propulsion types. More recently, Kang et al. [4] conducted full-scale fire tests with battery electric vehicles and reported peak heat release rates within the megawatt range, thereby providing an experimental basis for the selection of engineering design fires. Brzezinska and Bryant [5] subsequently applied performance-based analysis to EV-fire safety in car parks, while Hynynen et al. [6] examined the broader challenges of EV fires in enclosed spaces. Collectively, these studies show that the consequences of an EV fire cannot be characterized solely by its peak heat release rate; fire duration, underbody fire development, re-ignition potential, and toxic or corrosive emissions must also be considered.
The effects of these hazards are amplified in underground parking garages because smoke and heat are confined by limited ceiling height, restricted natural ventilation, dense vehicle arrangements, and complex internal obstructions. Merci and Shipp [7] reviewed smoke and heat control in large car parks and emphasized the dependence on enclosure geometry and ventilation strategy. Deckers et al. [8] showed that smoke distribution cannot be assessed from nominal extraction capacity alone because outlet location and internal flow paths also matter. Boehmer et al. [9] highlighted the changing combustible content and construction of modern vehicles. These studies establish the relevance of garage geometry and smoke extraction, but they do not provide a baseline-controlled comparison of prescribed high-level extraction configurations together with matched upper and underbody-oriented water application in relation to one EV-fire input.
A separate body of research has investigated water-based suppression of lithium-ion battery fires. Liu et al. [10] examined the cooling effect of water mist on thermal-runaway propagation in lithium-ion battery modules. Zhang et al. [11] experimentally evaluated water spray for suppressing lithium-ion battery fires, whereas Li et al. [12] assessed the effectiveness of water mist in controlling battery thermal runaway. Han et al. [13] further compared water-mist application strategies for large-capacity nickel–cobalt–manganese lithium-ion batteries. These studies demonstrate the substantial cooling potential of water-based systems and show that suppression performance is sensitive to the method of water application. However, most of these investigations were conducted at the cell, module, or battery-pack scale. Their findings cannot be transferred directly to a full-scale underground parking garage, where the vehicle body may shield an underbody battery fire, the ceiling smoke layer affects droplet transport, and mechanical exhaust changes the interaction among the plume, smoke layer, and spray.
Recent research has begun to address EV fires at vehicle and parking-garage scales. Kang et al. [14] evaluated thermal and fire-spread risks in full-scale underground-car-park tests, while Leone and Papurello [15] numerically examined smoke and thermal effects from alternative vehicles in confined parking facilities. Chen et al. [16] experimentally characterized EV fire evolution in an underground parking garage using vehicle-region temperatures, thermal radiation, and smoke-gas measurements. In a separate full-vehicle experiment, Chen et al. [17] compared no-mist, top-spray, and combined top-and-bottom fine-water-mist layouts; water application reduced temperature and radiation, whereas the responses of individual gas species were not uniform. These studies provide direct experimental evidence for confined EV-fire development and layout-dependent water application, but their geometry, fire history, ventilation conditions, nozzle characteristics, and sensor locations differ from the present model. Engineering guidance for covered car parks also recognizes the need to consider EV-fire development, firefighting access, smoke control, and water-based protection [18]. Heat release rate remains a central input for fire-hazard assessment [19]. However, limited information is available with regard to baseline-controlled comparisons that combine prescribed smoke-extraction configurations with matched upper and underbody-oriented water application in a common full-scale engineering model.
This study examines the following two narrowly defined questions in one idealized full-scale model: (1) how the number, distribution, and face velocity of prescribed high-level outflow surfaces affect local smoke and gas-temperature responses; and (2) how moving a second, otherwise identical water-discharge device from above the vehicle to beneath it affects local gas-temperature and smoke indicators. Fifteen cases were screened. Quantitative spray analysis was limited to the two-upper and upper–lower cases because device count, K value, pressure, cone angle, total nominal discharge, activation times, and recorded pre-activation histories were identical. The single-upper cases have been retained for traceability but are not used to isolate pressure, K value, cone angle, or device number effects. The model does not resolve cell-level thermal runaway, water-induced HRR reduction, re-ignition, or complete EV-specific gas chemistry.
2. Materials and Methods
2.1. Geometric Basis, Computational Domain, and System Layout
The physical model represents an idealized, full-scale, single-level underground parking garage measuring 60 m × 40 m × 4.5 m. It is an engineering comparison model, not a reconstruction of a benchmark facility or a specific building. The enclosure includes repeated columns, parked vehicles, an interior fire location, and high-level outflow surfaces so that plume rise, ceiling-jet development, smoke accumulation, obstruction-induced recirculation, and transport toward the outflow boundaries can be compared under common geometry [14,20,21]. Other architectural and ventilation details have been omitted.
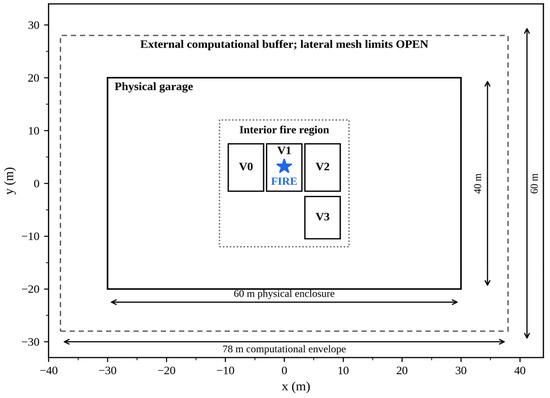
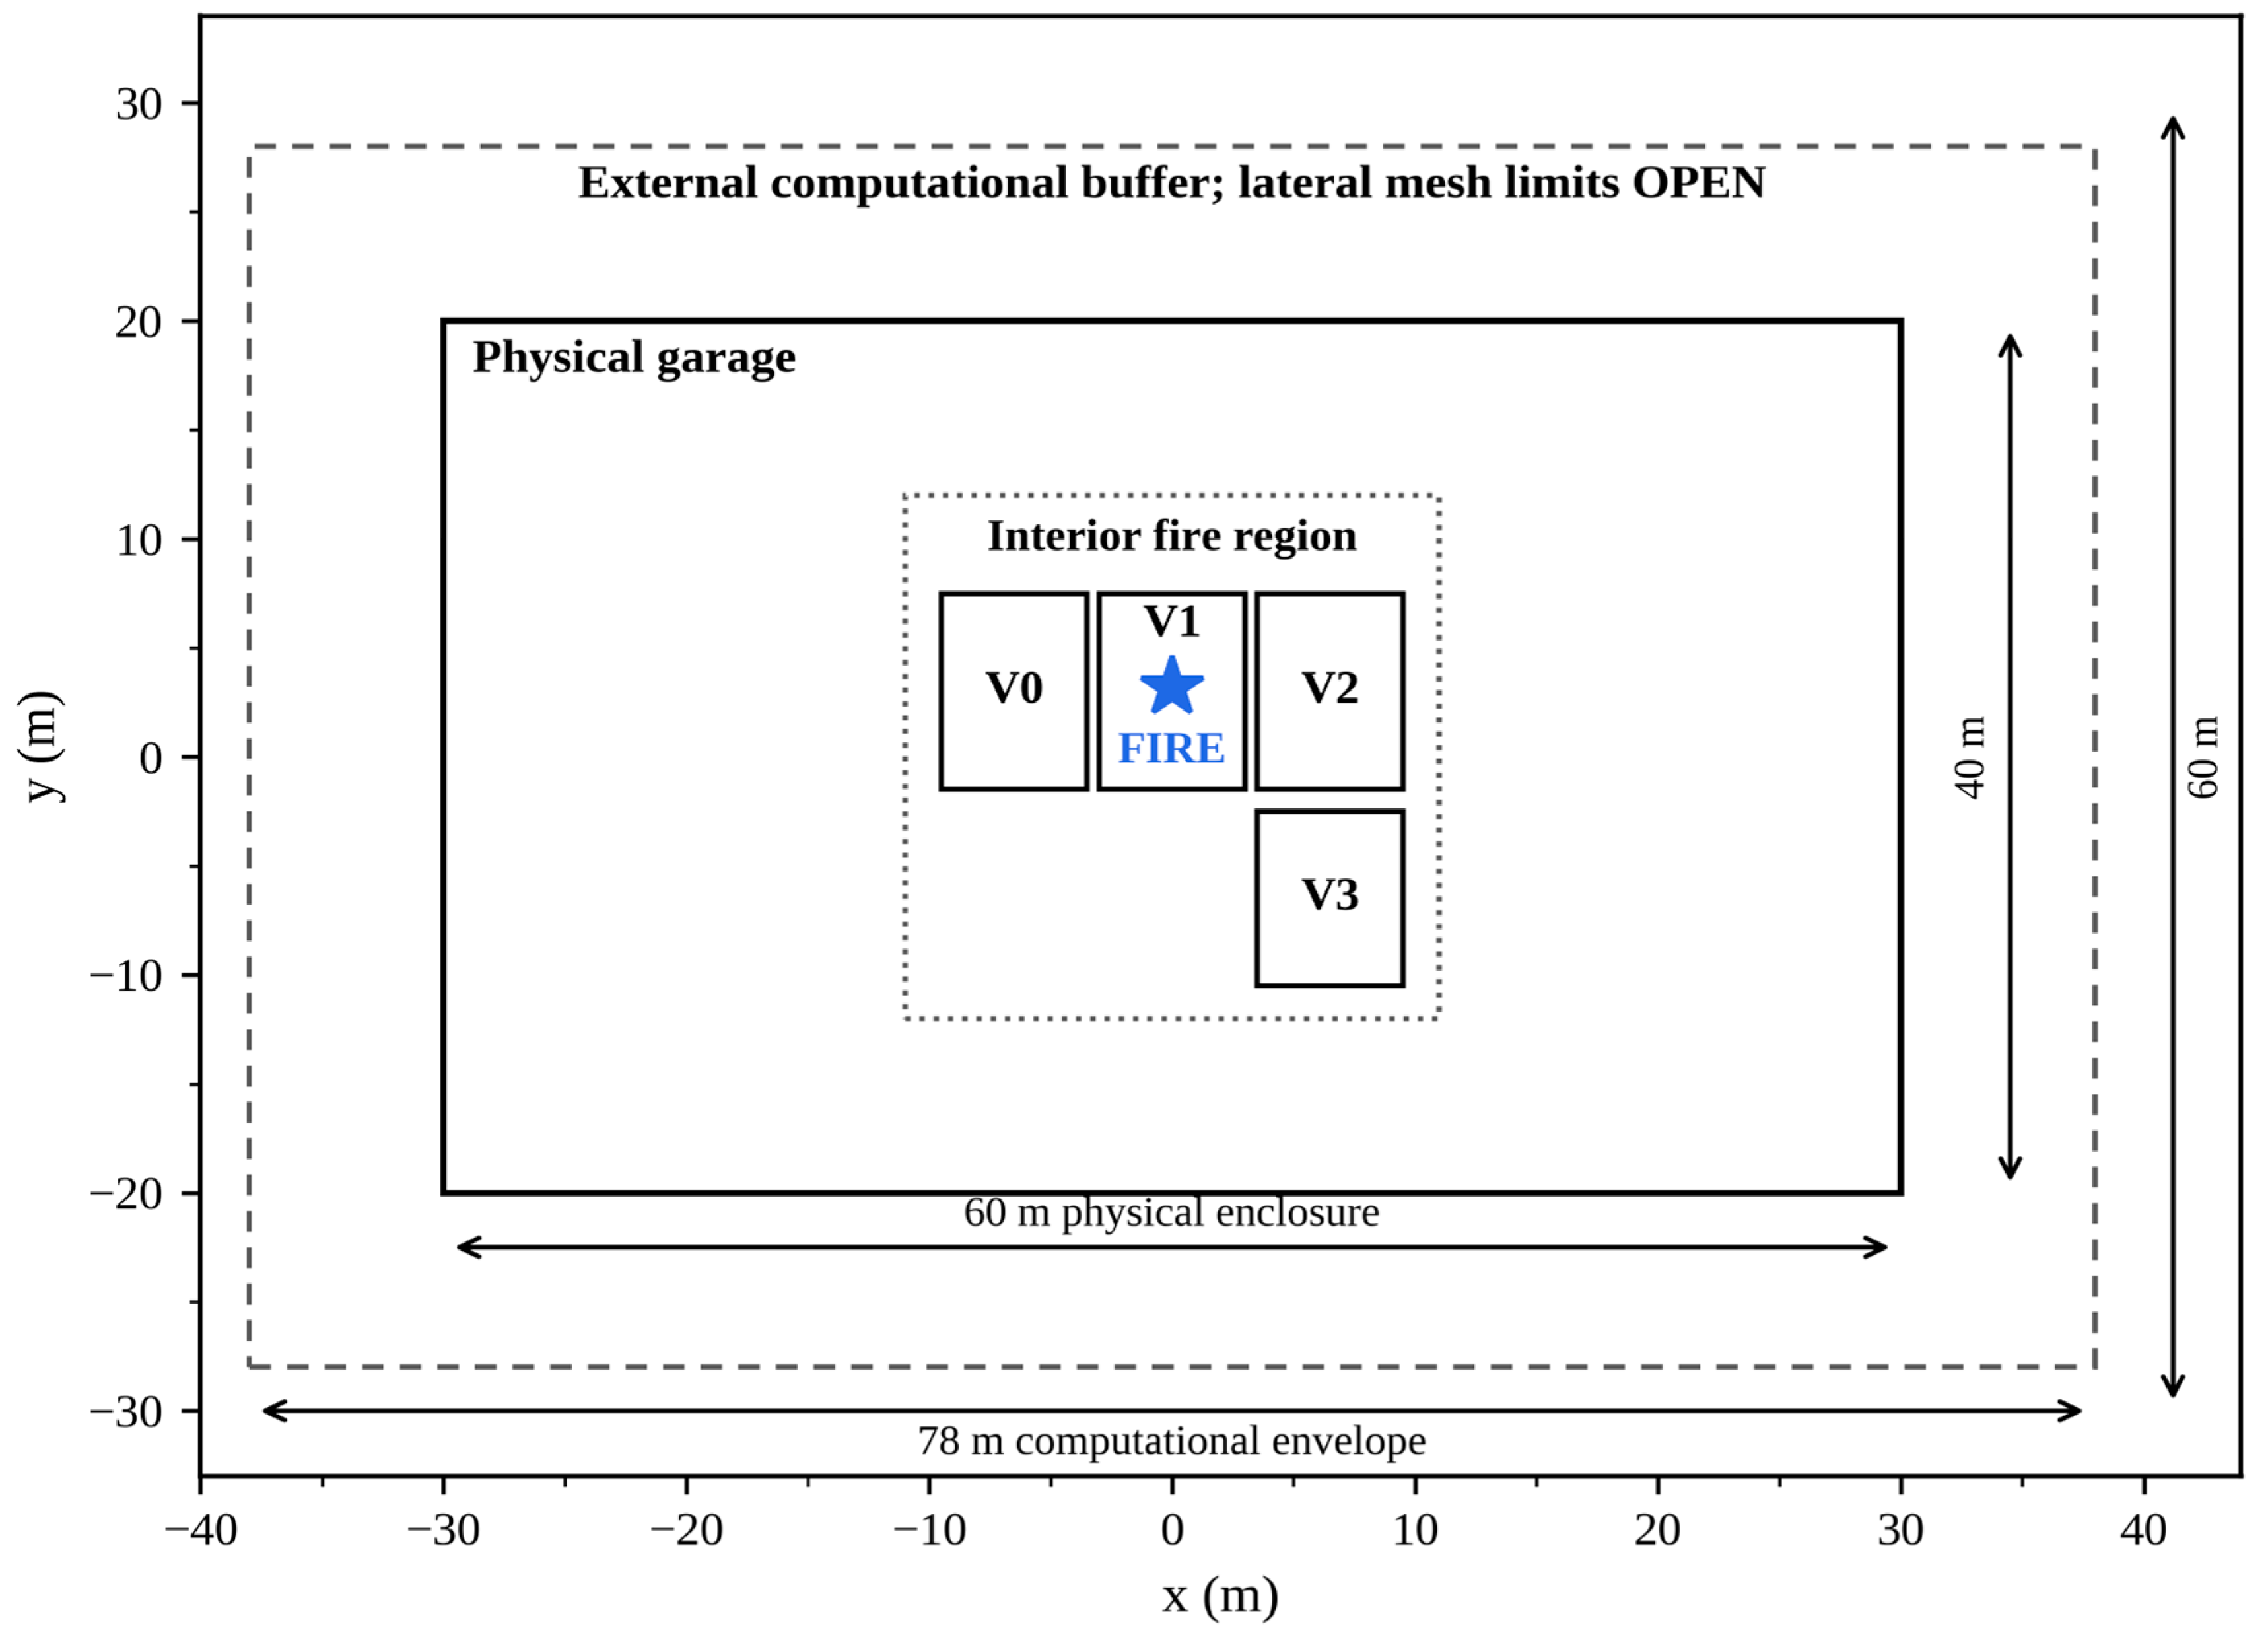
The physical enclosure was embedded in an approximately 78 m × 60 m × 5.1 m FDS envelope. The four lateral mesh boundaries were open and lay outside the garage walls. No ramp, doorway, mechanical supply opening, or other physical make-up-air connection linked the garage to the external buffer. The extraction cases therefore compare prescribed upper-boundary outflow conditions while the fire, geometry, monitoring points, and other boundary definitions remain fixed. They do not represent a pressure-balanced duct-and-fan system, and the nominal flows are not demonstrated air-change rates.
The prescribed fire source was positioned in the interior parking region, away from the external computational boundary. The same source, vehicles, structural geometry, and monitoring locations were retained in the compared cases. Two high-level extraction structures were placed on opposite sides of the fire region, with active horizontal faces at approximately z = 4.0 m. These positions are consistent with the general principle of extracting buoyant smoke from the upper compartment region [21], but the modeled faces are prescribed boundary conditions rather than a complete duct-and-fan system. The principal upper spray device was located at z = 4.0 m and directed downward. The second upper device was located at the same elevation, whereas the lower device was positioned at z = 0.20 m and directed upward toward the vehicle underside.
The modeled spray arrangements represent upper-only and underbody-oriented water application. Upper devices interact primarily with the rising plume, ceiling smoke layer, and upper vehicle surfaces, whereas the lower device directs water toward the vehicle underbody, where the traction battery of a battery electric vehicle is commonly installed [1,6,14]. Following the baseline-comparability check described in Section 3.4, causal layout interpretation is restricted to the two-upper and upper–lower cases. Both use two K = 80 devices at the same pressure, cone angle, activation logic, and total nominal discharge; their controlled difference is the location and direction of the second discharge.
The physical enclosure and surrounding computational envelope are shown in Figure 1.
Figure 1.
Dimensioned plan schematic of the 60 m × 40 m physical parking enclosure within the 78 m × 60 m computational envelope. The lateral mesh limits are external open boundaries; no physical make-up-air opening connects them to the garage.
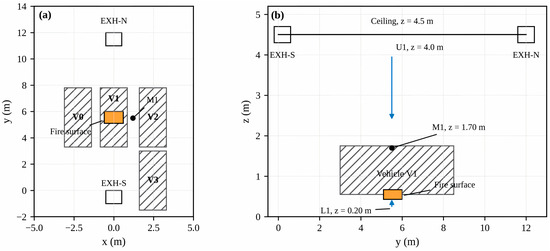
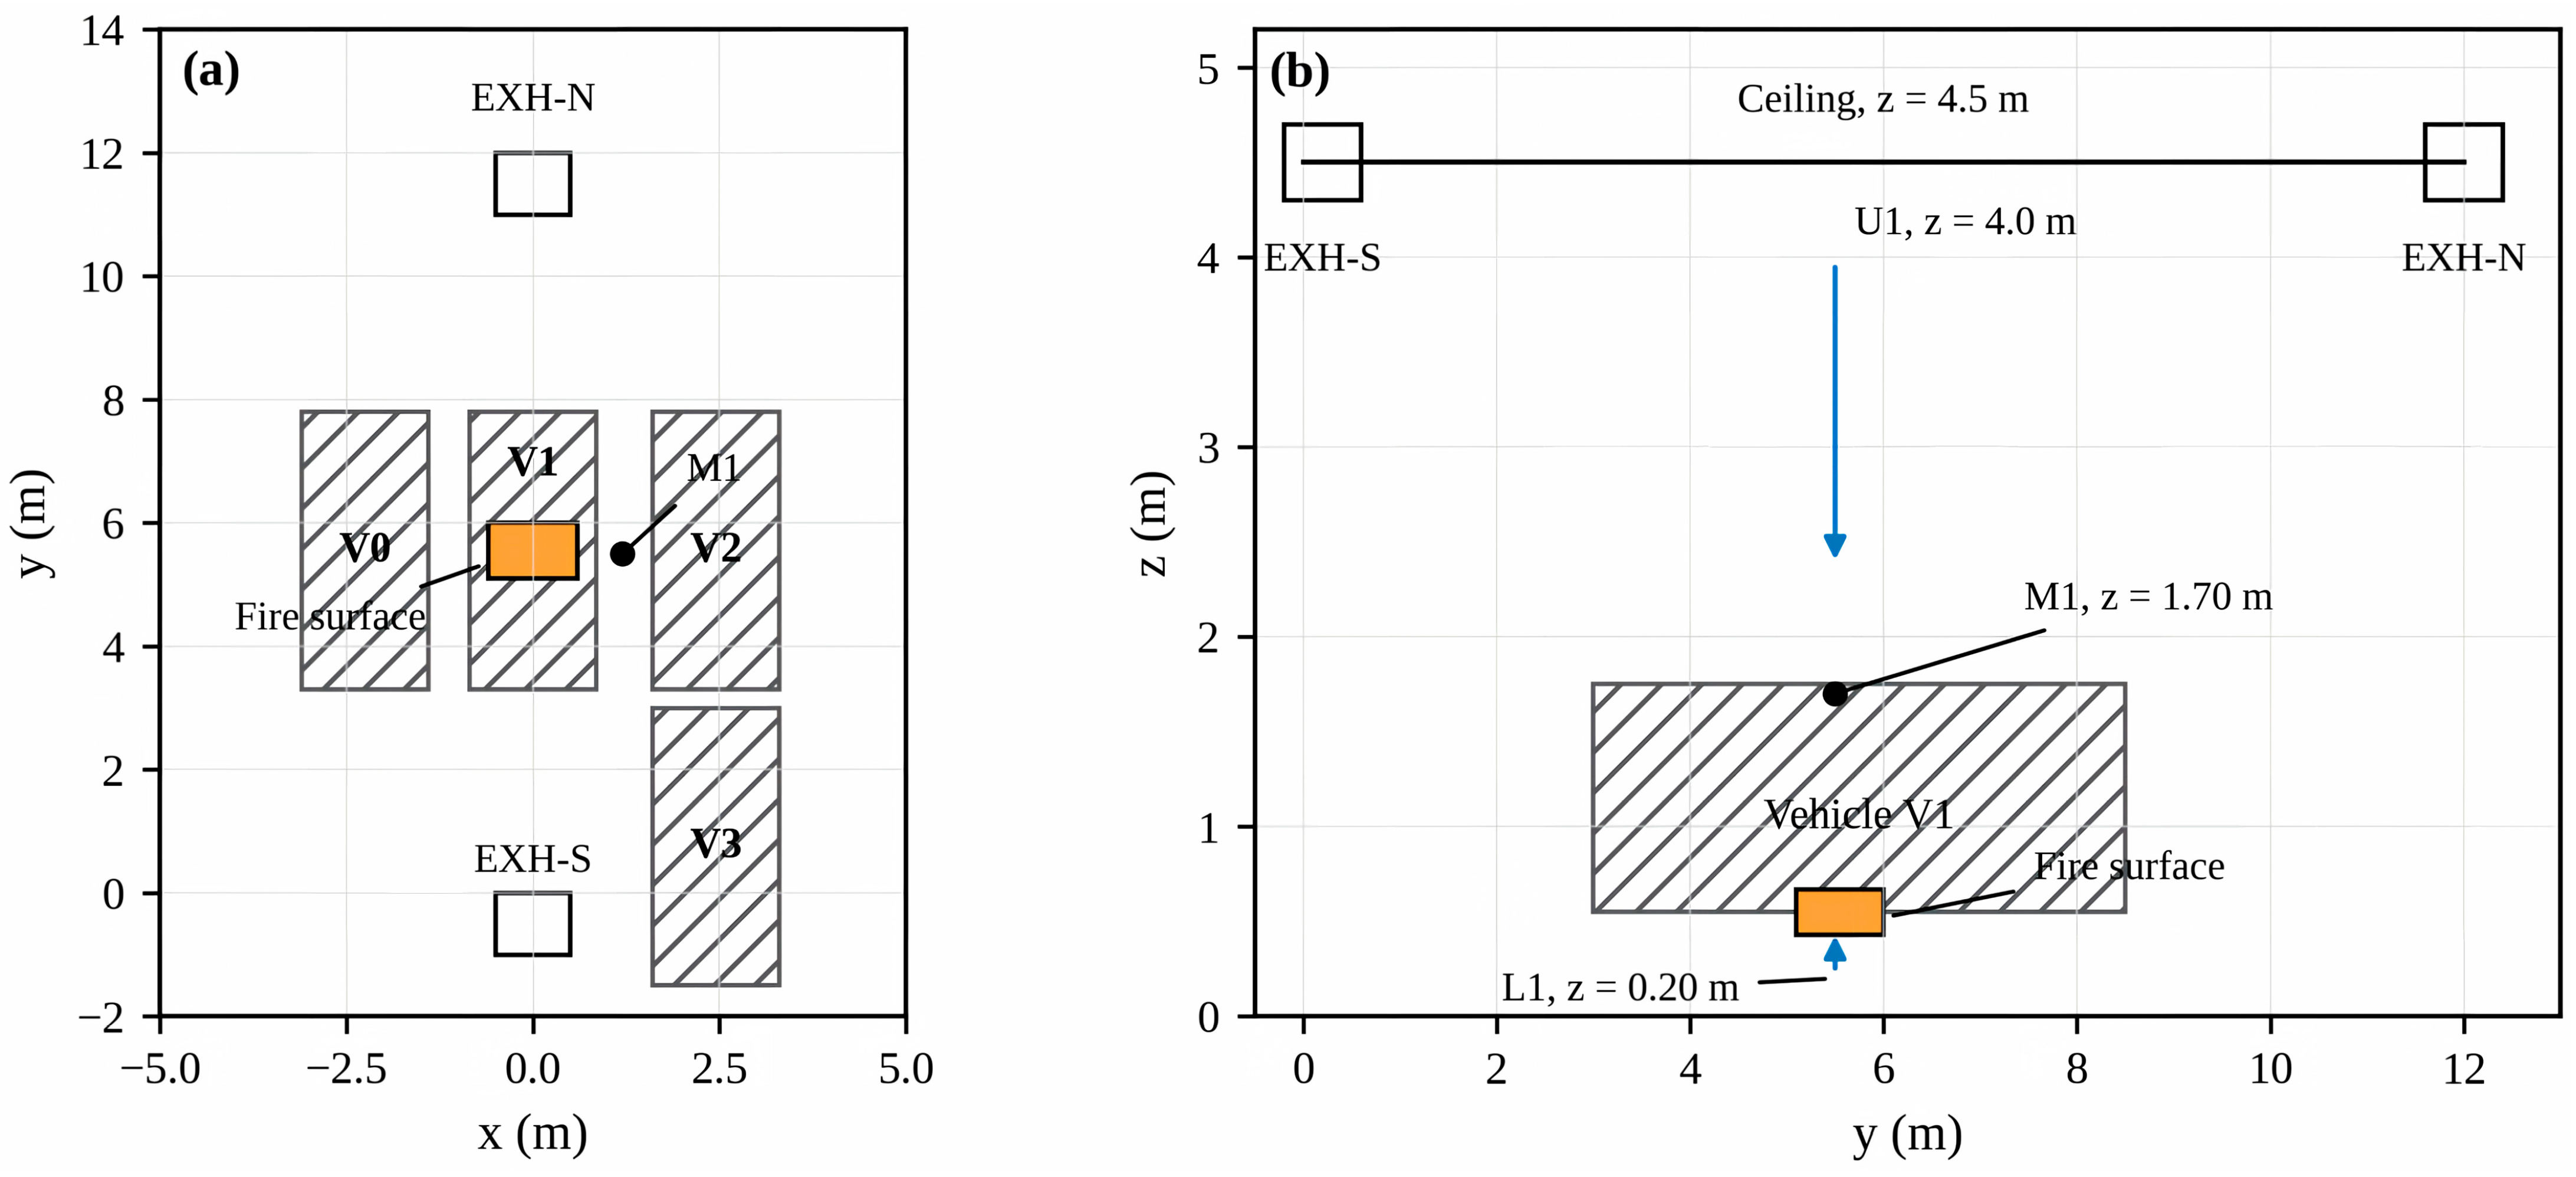
The fire-region plan and vertical section are combined in Figure 2.
Figure 2.
Fire-source region: (a) plan view showing V0–V3, the 1.20 m × 0.90 m prescribed fire surface, EXH-N, EXH-S, and M1; (b) vertical section showing the ceiling, exhaust elevation, upper device U1, lower device L1, fire surface, vehicle body, and M1 elevation.
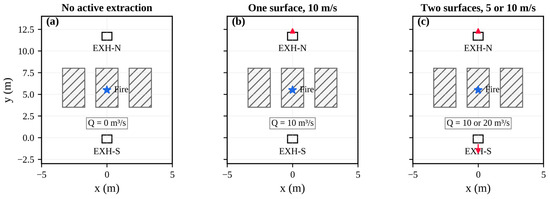
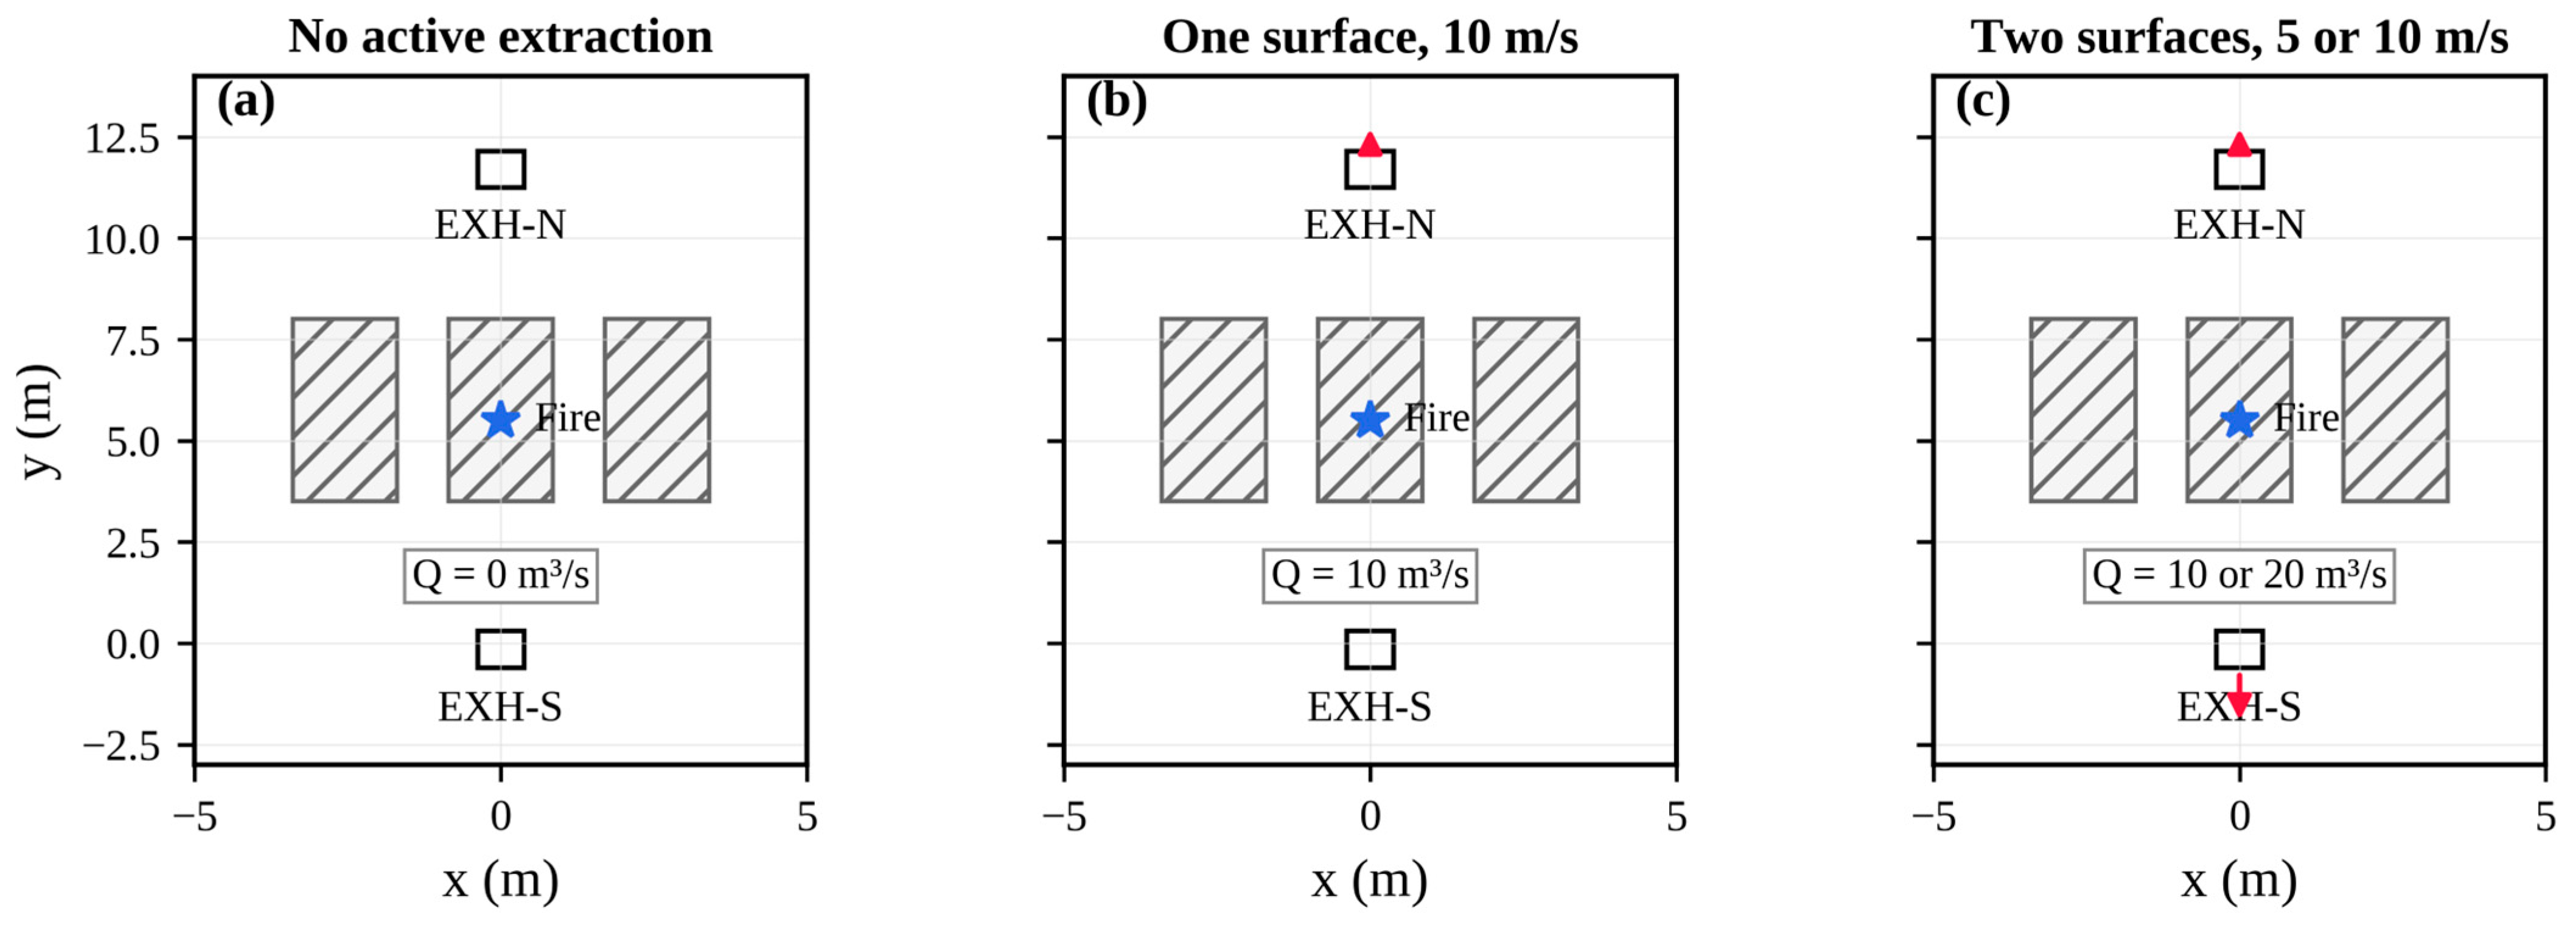
The three prescribed extraction configurations are compared in Figure 3. Geometry, fire input, and monitoring locations were unchanged; only extraction-surface activation and prescribed face velocity varied.
Figure 3.
Prescribed extraction configurations: (a) no active surface; (b) one surface at 10 m/s; and (c) two surfaces at 5 or 10 m/s. Red arrows denote imposed outward velocity at the active upper surfaces.
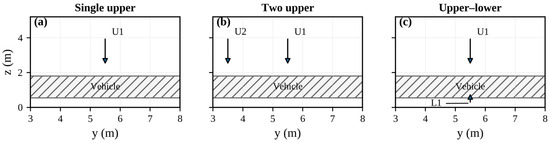
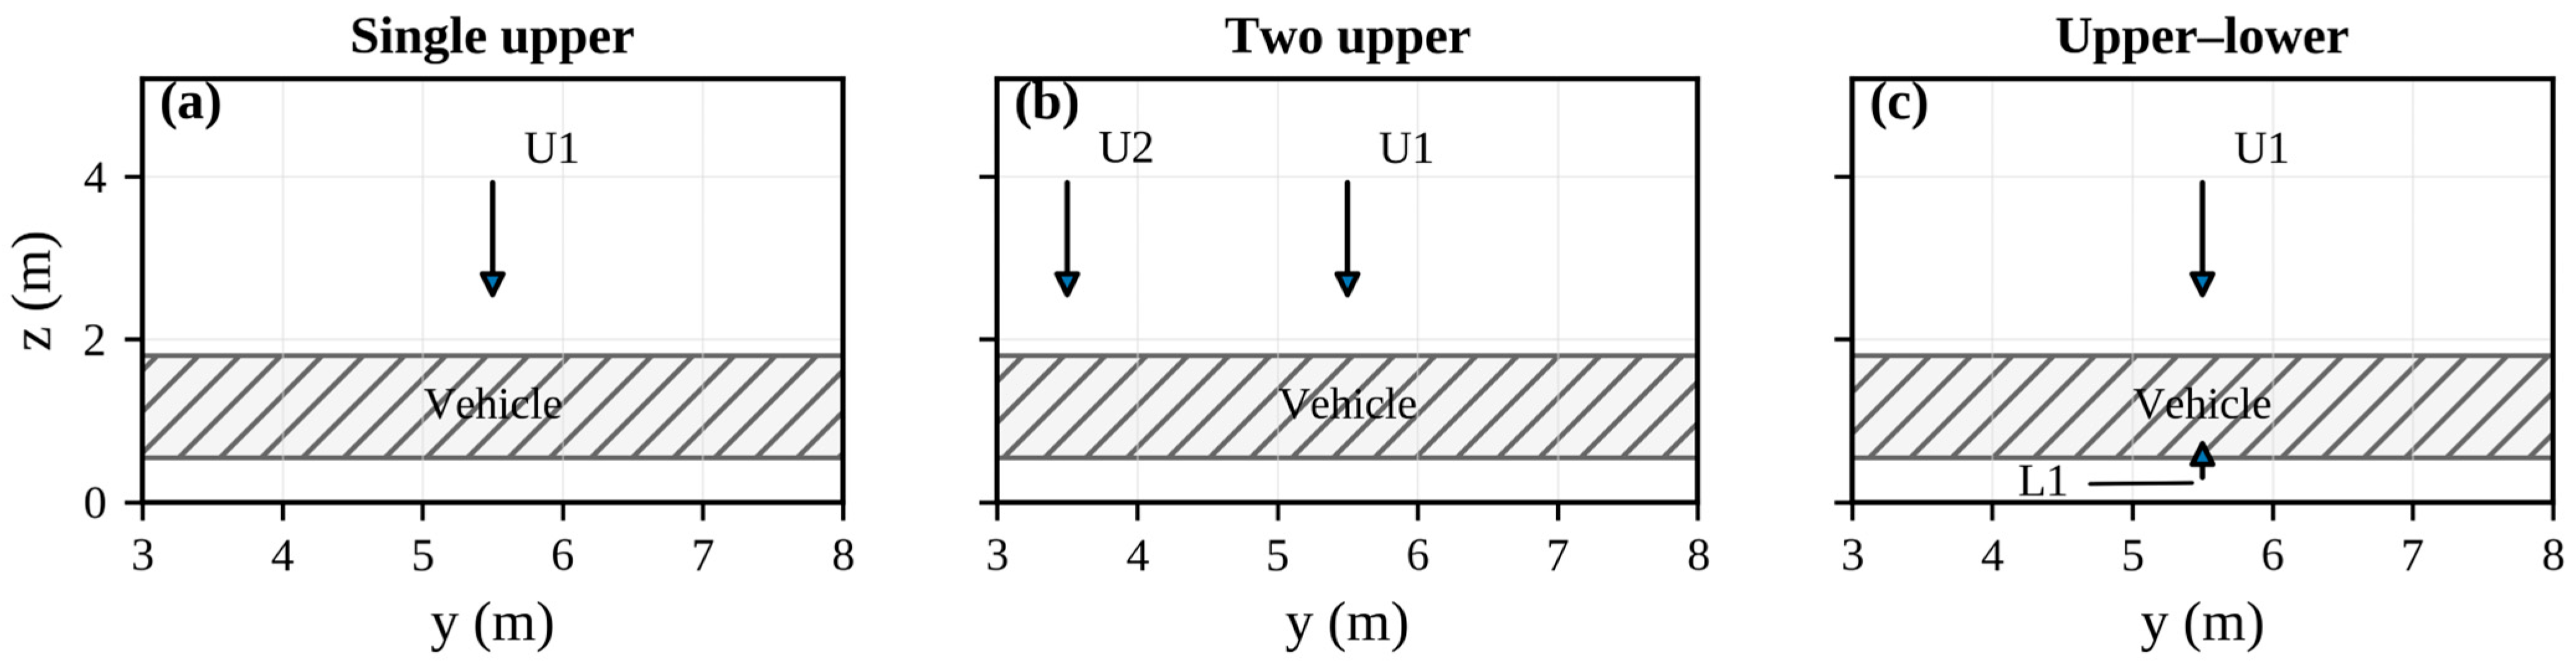
The water-spray arrangements are shown in Figure 4. Within each matched comparison, the exhaust condition and all non-investigated spray inputs were retained.
Figure 4.
Water-spray arrangements: (a) one downward upper device U1; (b) two downward upper devices U1 and U2; and (c) the upper–lower arrangement with downward U1 and upward L1.
Principal geometric features, model locations, and engineering functions are summarized in Table 1.
Table 1.
Principal geometric features, model locations, and engineering functions.
Monitoring points represent local gas conditions rather than occupant exposure zones or solid-surface temperatures. M1 is a near-fire breathing-height point located 0.60 m horizontally from the edge of the prescribed fire surface; it records gas temperature, CO mole fraction, and visibility. M2–M4 record gas temperature near the vehicle side, roof, and underside, respectively; M4 is 0.10 m below the prescribed fire surface. M5 records ceiling-region gas temperature. Coordinates and measured quantities are listed in Table 1 and illustrated in Figure 2. No spatial average, solid-surface temperature, battery temperature, or whole-vehicle value is inferred from these point outputs.
2.2. Numerical Method, Software, and Mesh Selection
The model was developed using PyroSim 2024, a graphical pre-processing and visualization interface for the Fire Dynamics Simulator (FDS). Calculations were performed using FDS version 6.9.1. FDS solves a low-Mach-number formulation for thermally driven, buoyancy-controlled fire flows and applies large eddy simulation (LES) to represent turbulent transport [22,23,24].
The initial ambient temperature and pressure were 20 °C and 101.325 kPa. Concrete boundaries were assigned a thermal conductivity of 1.8 W/(m·K) and a density of 2300 kg/m3. The high-level extraction surfaces were located at z = 4.0 m. The same values were used in all relevant comparisons.
Mesh selection was established before the parametric case analysis. For the 7 MW design-fire cap, the characteristic fire diameter was approximately 2.10 m. A 0.30 m mesh gives D*/δx ≈ 7.0 [22,23], represents the 1.20 m × 0.90 m fire surface with 4 × 3 cells, and resolves each 0.60 m column with two cells across. By contrast, the 0.50 m mesh gives D*/δx ≈ 4.2 and represents the principal fire-source and column dimensions with only about one to two cells, which is insufficient for resolving the local plume–obstruction region. The 0.20 m mesh gives D*/δx ≈ 10.5 and improves geometric resolution, but it requires 3.375 times the cell count of the 0.30 m mesh for the same three-dimensional domain and also imposes a smaller stable time step. The 0.30 m mesh was therefore selected before the formal case comparison as a resolution–cost compromise. This selection criterion does not, by itself, establish mesh independence.
In Equation (1), D* is the characteristic fire diameter; is the design-fire heat release rate; , , and are the ambient air density, specific heat at constant pressure, and absolute temperature, respectively; and g is gravitational acceleration. The nominal mesh-cell size is denoted by δx, and D*/δx is the corresponding dimensionless mesh-resolution ratio. A matched three-grid check was conducted for the two-surface 10 m/s extraction case without water application. Geometry, fire input, boundaries, extraction surfaces, monitoring coordinates, output interval, and simulation duration were unchanged, and each output file contained 1001 unsmoothed samples over 0–300 s. Complete histories, 270–300 s means, and the first downward crossing of the 10 m visibility reference were compared. Because the three fixed-point sequences were non-monotonic, formal discretization error, Richardson extrapolation, and the Grid Convergence Index (GCI) could not be determined. For quantitative comparison only, absolute relative differences were calculated against the 0.20 m result as a fine-grid comparator; the 0.20 m result was not treated as an exact solution. Computational burden is reported as cell count normalized to the 0.30 m mesh. Identical wall-clock records were not available, so normalized cell count is used only as a lower-bound cost indicator. The detailed results are reported in Section 3.2. The mesh options and selection basis are summarized in Table 2.
Table 2.
Mesh options and selection basis.
2.3. Fire-Source Representation, Combustion-Product Assumptions, and Water-Spray Parameters
The fire source was represented by an idealized engineering design fire rather than by a direct reconstruction of the irregular heat-release-rate history of a specific battery thermal-runaway event. Full-scale battery electric vehicle (BEV) fire tests conducted by Kang et al. reported peak heat release rates of 6.51–7.25 MW [4]. Accordingly, 7 MW was selected as the upper HRR cap because it lies within the experimentally reported range and is close to its upper bound. The selected value is intended to represent a relatively severe passenger BEV fire scenario for comparative numerical analysis; it should not be interpreted as a universal peak HRR for all electric vehicles. In the numerical models, the prescribed horizontal fire surface extended from x = −0.60 to 0.60 m and from y = 5.10 to 6.00 m at z = 0.50 m. The resulting fire-source area was 1.08 m2. A maximum heat release rate per unit area of 6481.48 kW/m2 was prescribed, giving an area-integrated upper HRR cap of approximately 7 MW. This surface represents an aggregated engineering heat and smoke source and does not correspond directly to the physical dimensions of the traction battery or to the instantaneous flame footprint.
To provide a reproducible transient fire input, the pre-peak growth stage was prescribed using the conventional t2 design-fire relationship [25]:
where is the prescribed heat release rate at time t and α is the fire-growth coefficient. The adopted coefficient, α = 0.04689 kW/s2, is the conventional fast-growth t2 value given in the SFPE Handbook of Fire Protection Engineering [25]. The 7 MW upper cap was selected separately with reference to the peak HRR range reported in full-scale BEV tests [4]. The resulting HRR was 4.22 MW at 300 s and 5.74 MW at 350 s, and the cap was reached at approximately 386.37 s. Both simulation groups therefore ended during the fire-growth stage. The design fire did not account for battery-cell thermal runaway, intermittent flame jets, re-ignition, variation among vehicle types, or the detailed time-dependent generation of EV-specific toxic gases.
The fire-surface extinguishing coefficient was set to 0.0 in all numerical models. Water application therefore did not reduce the prescribed HRR at the fire surface. The calculated spray effects arose from droplet–gas heat and mass transfer, evaporative cooling, and changes in plume and smoke transport. The results quantify changes in the local smoke environment and gas-phase thermal exposure, not direct suppression of the prescribed fire-source HRR or extinguishment of battery thermal runaway.
In the present CFD model, the EV-fire scenario was represented thermally by the prescribed HRR curve and spatially by an underbody-adjacent fire surface. Gas-phase combustion used the single-step polyurethane-type surrogate reaction stored in the PyroSim/FDS input, with empirical formula C6.3H7.1O2.1N1.0. The same reaction definition was retained in all 15 cases, as follows: CO yield 0.14 kg/kg surrogate fuel, soot yield 0.10 kg/kg surrogate fuel, radiative fraction 0.35, HCN yield zero, and energy release per unit mass of oxygen consumed 13,100 kJ/kg O2. In FDS, these quantities define the prescribed product yields, radiative energy fraction, and oxygen-consumption calorimetry input [22,23]. They were not fitted to the present outputs and must not be interpreted as universal chemical-product yields for EV fires.
No independent volumetric smoke-generation rate was prescribed. In FDS, the time-dependent CO and soot source terms were calculated from the prescribed fire development, reaction stoichiometry, oxygen consumption, and specified product yields, whereas visibility was calculated from the local soot concentration and the associated light extinction [22,23]. HF was not included as a transported species. Consequently, the reported CO and visibility results should be interpreted as comparative smoke-environment indicators under a common surrogate reaction rather than as a complete prediction of EV-specific fire toxicity.
A separate internal combustion engine vehicle fire case was not simulated. Accordingly, the present model does not distinguish an EV fire from a conventional vehicle fire through separate fuel chemistry or species-yield sets. The EV-specific character of the scenario is represented principally by the BEV-informed HRR cap, the underbody-adjacent source location, and the interpretation of the results in the context of battery-electric-vehicle fire hazards. Experimental studies have shown that EV and conventional vehicle fires may exhibit differences in fire development, re-ignition behavior, and toxic or corrosive emissions [1,2,3,6]. Those differences are acknowledged in the interpretation boundary but are not resolved directly by the present surrogate-fuel reaction. The standard t2 fire-growth categories and corresponding growth coefficients are summarized in Table 3.
Table 3.
Standard t2 fire-growth categories and corresponding growth coefficients [25].
Water application was represented by prescribed pressure-driven spray devices rather than a hydraulically designed automatic sprinkler network. Review of all eleven spray-model files confirmed that the main device was located at (0.00, 5.50, 4.00) m and activated when the local gas-temperature device reached 68 °C, with a latched state and zero discharge-ramp time. This is a direct numerical gas-temperature control threshold, not an RTI-based thermal-link calculation or the rated operating temperature of a physical sprinkler. Accordingly, RTI and C-factor were not active inputs [22]. In the two-device cases, the auxiliary upper or lower nozzle was linked to the main-device alarm and discharged essentially simultaneously.
All spray cases prescribed a monodisperse representative droplet diameter of 500 μm, an initial droplet velocity of 5 m/s, a spray offset of 0.05 m, and an injection rate of 5000 computational droplets (Lagrangian parcels) per second. The last quantity is a numerical parcel-sampling input and is not the physical number of water droplets discharged per second. The inner cone angle was 0°, and the investigated outer cone angles were 30°, 60°, and 90°. The model-file review confirmed that these inputs were held constant except where cone angle or device arrangement was deliberately varied. FDS represents sprays by Lagrangian particles and requires the user to prescribe the flow, spray-angle, offset, velocity, and droplet-size characteristics [22]; experimental spray-model studies further show that droplet-size and velocity characterization materially influence predicted mist flux and entrainment [26]. Because no nozzle-specific phase-Doppler or collection-density calibration was available for the present devices, the 500 μm monodisperse input is treated as a controlled numerical simplification, not as a measured commercial-nozzle distribution.
The model-defined nozzle flow coefficient K, expressed in L·min−1·bar−½, was applied through the FDS relation = K [22], where is the nominal single-device discharge in L/min and P is the operating pressure expressed in bar. The PyroSim pressure entries were 0.5 and 1.0 bar, corresponding to 0.05 and 0.10 MPa. The nominal single-device discharge rates were therefore approximately 56.6 L/min for K = 80 at 0.5 bar, 80.0 L/min for K = 80 at 1.0 bar, and 115.0 L/min for K = 115 at 1.0 bar. The two-upper and upper–lower cases each used two K = 80 devices at 1.0 bar, giving a nominal total discharge of approximately 160 L/min. These values are prescribed nozzle inputs rather than results of a pipe-network hydraulic calculation.
The water-spray matrix varied K value, operating pressure, outer cone angle, device number, device location, and discharge direction under the common two-surface 10 m/s extraction condition. The inputs are reported for reproducibility, but a comparison was treated as controlled only when pre-activation device outputs and all non-investigated inputs matched. This screen retained the two-upper and upper–lower pair for layout analysis and excluded the single-upper cases from independent pressure, K value, and cone angle conclusions. The retained pair used two K = 80 devices at 1.0 bar, a 30° outer cone angle, and a total nominal discharge of approximately 160 L/min.
2.4. Prescribed Smoke-Extraction and Water-Spray Case Matrix
Table 4 summarizes the non-full-factorial case matrix. Cases 1–4 are 300 s prescribed-extraction cases without water application. Cases 5–15 form the 350 s spray case set under two active extraction surfaces at 10 m/s. All spray cases were checked, but controlled spray conclusions are restricted to Cases 6 and 7; the remaining spray cases are not used to infer independent pressure, K value, or cone angle effects.
Table 4.
Principal numerical simulation case matrix.
The nominal imposed extraction flow was calculated from the number of active surfaces, the area of each active surface, and the prescribed normal velocity, as follows:
where is the nominal imposed volumetric flow, N is the number of active surfaces, Ae is the area of each surface, and ve is its prescribed normal velocity. Each active surface measured 1.00 m × 1.00 m. One surface at 10 m/s and two surfaces at 5 m/s therefore both gave 10 m3/s, whereas two surfaces at 10 m/s gave 20 m3/s. Normalization by the gross 10,800 m3 enclosure volume gave nominal flow-to-volume ratios of 3.33 and 6.67 h−1. These ratios are input descriptors, not measured or pressure-balanced air-change rates. All spray cases used the 20 m3/s prescribed-outflow condition.
The one-surface 10 m/s and two-surface 5 m/s cases form a nominal-flow-matched pair that differs in outflow distribution. The two-surface 10 m/s condition provides the higher prescribed outflow used for the spray cases. Although the upper locations are consistent with general smoke-removal principles [20,21], the model does not include the inlet capacity, smoke-compartment definition, duct resistance, fan curves, or controls required to assess compliance with GB 50067-2014 or GB 51251-2017. The comparison is therefore limited to the local numerical response to the imposed boundary conditions.
The principal monitoring height was 1.7 m above the floor. M1 recorded near-fire gas temperature, CO mole fraction, and visibility; M2–M4 recorded local gas temperature near the vehicle side, roof, and underside; and M5 recorded ceiling-region gas temperature.
All reported values are fixed-coordinate FDS point outputs. They are not spatial averages, solid-surface temperatures, battery temperatures, or whole-vehicle metrics. CO mole fraction was converted to parts per million using Equation (5).
The conversion is expressed as follows:
where XCO is the CO mole fraction in mol/mol. A visibility of 10 m was retained as a comparative screening reference consistent with previous evacuation-performance research under reduced-visibility conditions [27]. It is not treated as a complete life-safety or tenability criterion. The first downward crossing is determined from the first pair of consecutive samples satisfying V(tk−1) ≥ 10 m and V(tk) < 10 m and is linearly interpolated as defined in Equation (8); it is not estimated visually from the plotted curve.
2.5. Simulation Durations and Comparability Boundary
Cases 1–4 were terminated at 300 s because they were designed exclusively for prescribed-extraction comparison and did not require a post-activation water-discharge period. Cases 5–15 were extended to 350 s so that every spray case retained a complete common post-activation interval. The latest main water-spray-device activation occurred at 174.358 s, leaving 175.642 s of post-activation output and fully covering τ = 120–150 s. The 300 s and 350 s endpoints are not compared directly. Because the fast-growth t2 fire reached only 4.22 MW at 300 s and 5.74 MW at 350 s, neither interval is a steady state; both are late-stage reporting windows within the growth period.
For the retained two-device spray pair, activation-normalized time is defined by Equation (6). The principal statistic is the inclusive τ = 120–150 s arithmetic mean, which equalizes elapsed discharge time; a companion fixed-time mean over t = 320–350 s tests whether the layout conclusion depends on the temporal reference. The other spray cases were used only for input and pre-activation quality screening and are not included in causal parameter statistics. Exhaust statistics use the inclusive 270–300 s mean and the first downward crossing of the 10 m visibility reference. All calculations use the unsmoothed recorded samples without resampling.
In Equation (7), I[a,b] denotes samples whose time coordinate ξ lies in the inclusive interval [a,b], and N[a,b] is the number of samples; ξ = t for exhaust and fixed-time statistics and ξ = τ for activation-normalized statistics. The 30 s windows contained 86 recorded samples for each spray because the output interval was approximately 0.35 s. Equation (8) defines the first downward crossing of the 10 m visibility reference by linear interpolation between the first adjacent samples satisfying Vk−1 ≥ 10 m and Vk < 10 m. Equation (9) is the sample standard deviation used only to describe temporal fluctuation within one deterministic simulation; it is not a replicate-based uncertainty estimate. Equation (10) defines relative reduction R↓ for temperature or CO and relative increase R↑ for visibility. These data-reduction equations are author-defined reporting rules; the physical 10 m comparison reference remains supported by [27].
2.6. Interpretation Boundary
Interpretation is restricted to the matched comparisons defined in Section 2.2, Section 2.3, Section 2.4 and Section 2.5. The non-monotonic three-grid results preclude a mesh-independence claim. Extraction results describe local point responses to common prescribed-outflow boundaries, not pressure-balanced system performance. Single-upper spray cases are excluded from causal pressure, K value, cone angle, and device number conclusions. Because the model was not reconstructed from an experiment with matching geometry, fire input, inlet and outlet conditions, spray characteristics, and sensor locations, the published test results are used only to assess qualitative consistency of response mechanisms rather than to validate the present absolute values. At the revision stage, two routes for case-specific validation were considered: a new physical experiment matched to the present configuration, and reconstruction and rerunning of the numerical model against an established experimental benchmark. Neither route was available within the present study. The authors did not have access to a matched underground-garage EV-fire experimental platform, corresponding ventilation and spray systems, synchronized measurements, or the operational and safety conditions required for a new validation test. Furthermore, the completed and archived model cannot be modified and the full case matrix cannot be consistently rerun under a new benchmark definition because the equivalent computational environment and resources required for a complete re-simulation are not available. Consequently, revisions requiring new geometry, new inlet or outlet boundaries, additional combustion species, water-induced HRR feedback, or a different spray model could not be implemented in the present study. These items are stated explicitly as limitations rather than approximated by unmatched experiments, partial reruns, or unsupported post-processing.
3. Results and Discussion
3.1. Data-Reduction and Comparison Rules
The device-output CSV files contained 1001 unsmoothed samples per case. For the four prescribed-extraction cases, arithmetic means were calculated over t = 270–300 s, and the first downward crossing of the 10 m visibility reference was evaluated using Equation (8). Spray statistics were calculated only for the retained two-upper and upper–lower cases: primary comparisons used τ = 120–150 s means, and t = 320–350 s means provided a same-fire-age robustness check. Relative changes were assessed using Equation (10). No moving average, curve fitting, endpoint substitution, or inferential significance test was applied. Each case was one deterministic simulation rather than an independent replicate, and consecutive time samples have been serially correlated; consequently, they were not treated as independent observations for a t-test. Standard deviations describe within-window temporal fluctuation only.
3.2. Mesh-Sensitivity Check
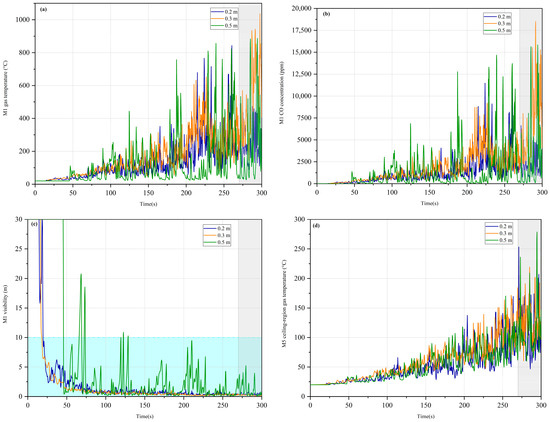
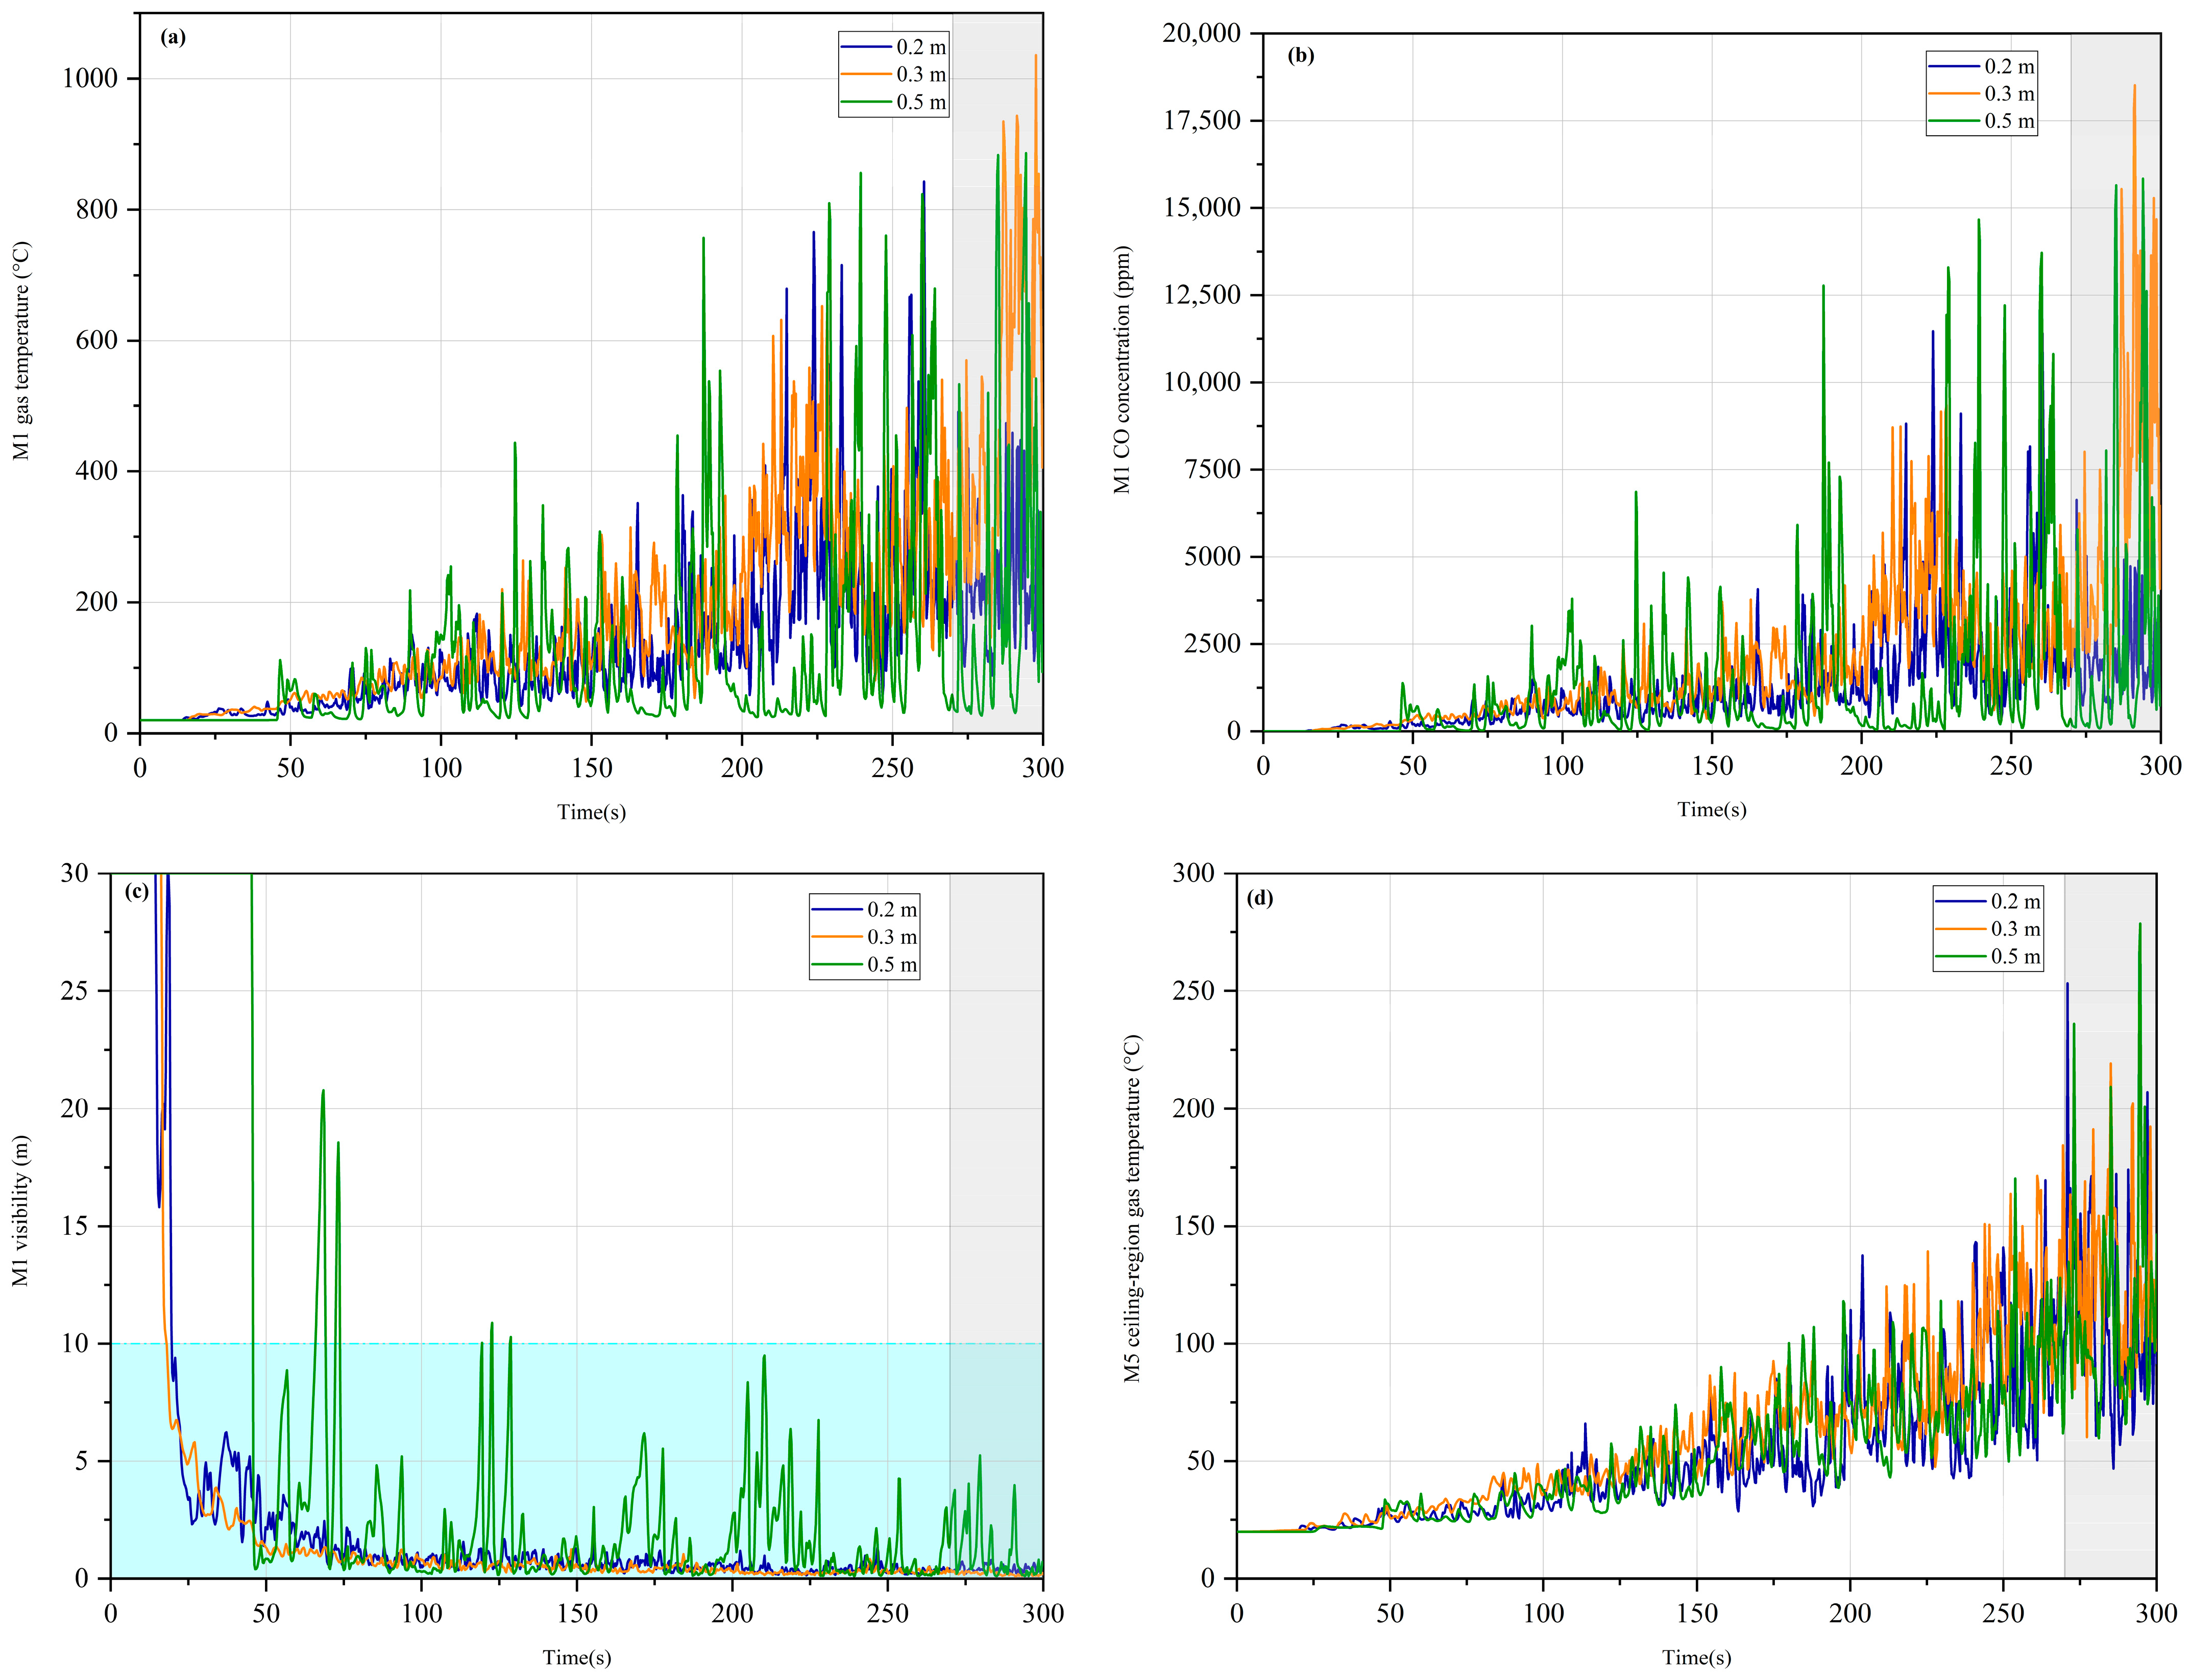
The matched 0.20, 0.30, and 0.50 m simulations used the two-surface 10 m/s extraction condition without water application. Figure 5 compares the complete unsmoothed histories at M1 and M5. Table 5 reports the 270–300 s means, first downward crossing of the 10 m visibility reference, normalized cell count, and absolute relative differences. The absolute relative difference for each output variable was calculated as Δh = |Yh − Y0.20|/|Y0.20| × 100%, where Yh denotes the value obtained using mesh size h (h = 0.30 or 0.50 m), and Y0.20 denotes the corresponding value obtained using the 0.20 m mesh as a fine-grid comparator. Because the output sequences are non-monotonic, Δh is not interpreted as an estimate of discretization error or accuracy.
Figure 5.
Unsmoothed histories for the matched 0.20, 0.30, and 0.50 m grids under the two-surface 10 m/s extraction conditions: (a) M1 gas temperature; (b) M1 CO concentration; (c) M1 visibility; and (d) M5 ceiling-region gas temperature. The gray band marks the inclusive 270–300 s averaging window. In (c), the light-blue region denotes values below it.
Table 5.
Quantitative comparison and normalized computational burden for the matched three-grid sensitivity check.
The responses were non-monotonic with mesh refinement, particularly at the fixed near-fire point M1. Relative differences between the 0.30 and 0.20 m outputs ranged from 8.5% for the first visibility crossing to 206.2% for M1 CO; the corresponding 0.50-to-0.20 m differences ranged from 4.1% for M5 temperature to 175.0% for M1 visibility. These values demonstrate sensitivity but do not define accuracy because neither the fine mesh nor any other mesh formed a converged reference sequence. The apparent proximity of the 0.50 m temperature values to the 0.20 m values is not evidence of convergence, as the visibility and crossing-time responses diverged markedly and the 0.50 m grid under-resolved the fire surface and columns. The 0.20 m grid improved geometric resolution but required 3.375 times the cell count of the 0.30 m grid and a smaller stable time step, and it did not produce a monotonic trend. The 0.30 m mesh was therefore retained on the pre-analysis resolution–cost basis stated in Section 2.2. Absolute point values are treated as mesh-sensitive estimates, and all formal case comparisons used the same 0.30 m mesh.
3.3. Response to Prescribed Smoke Extraction
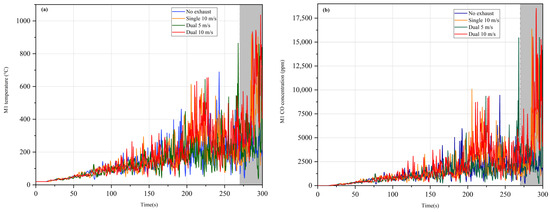
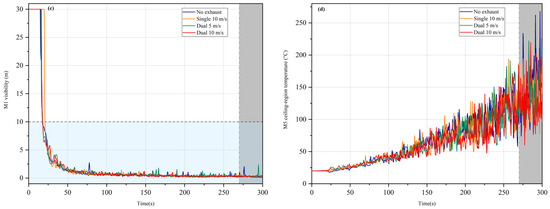
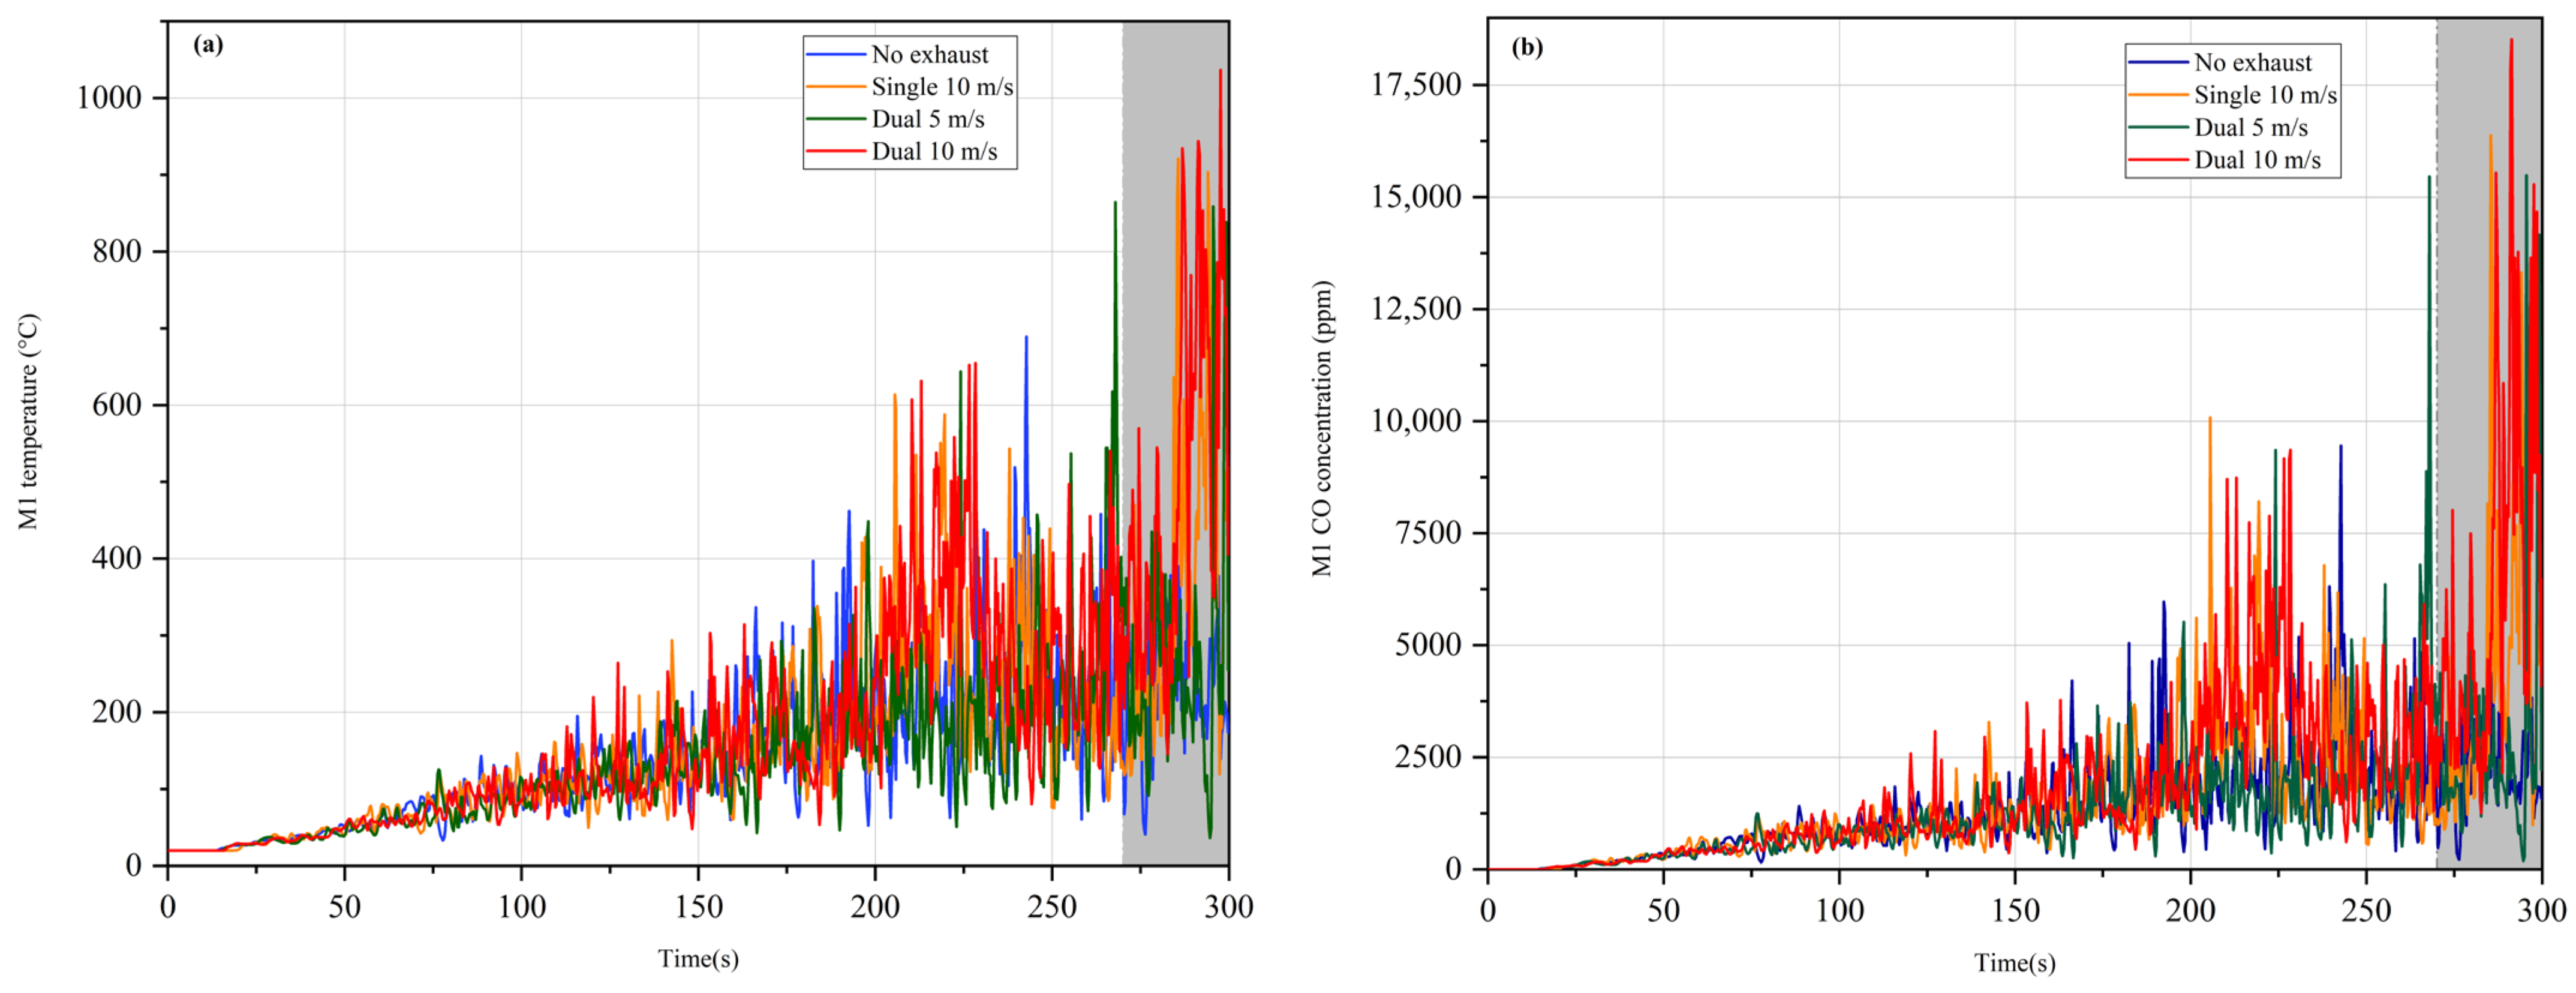
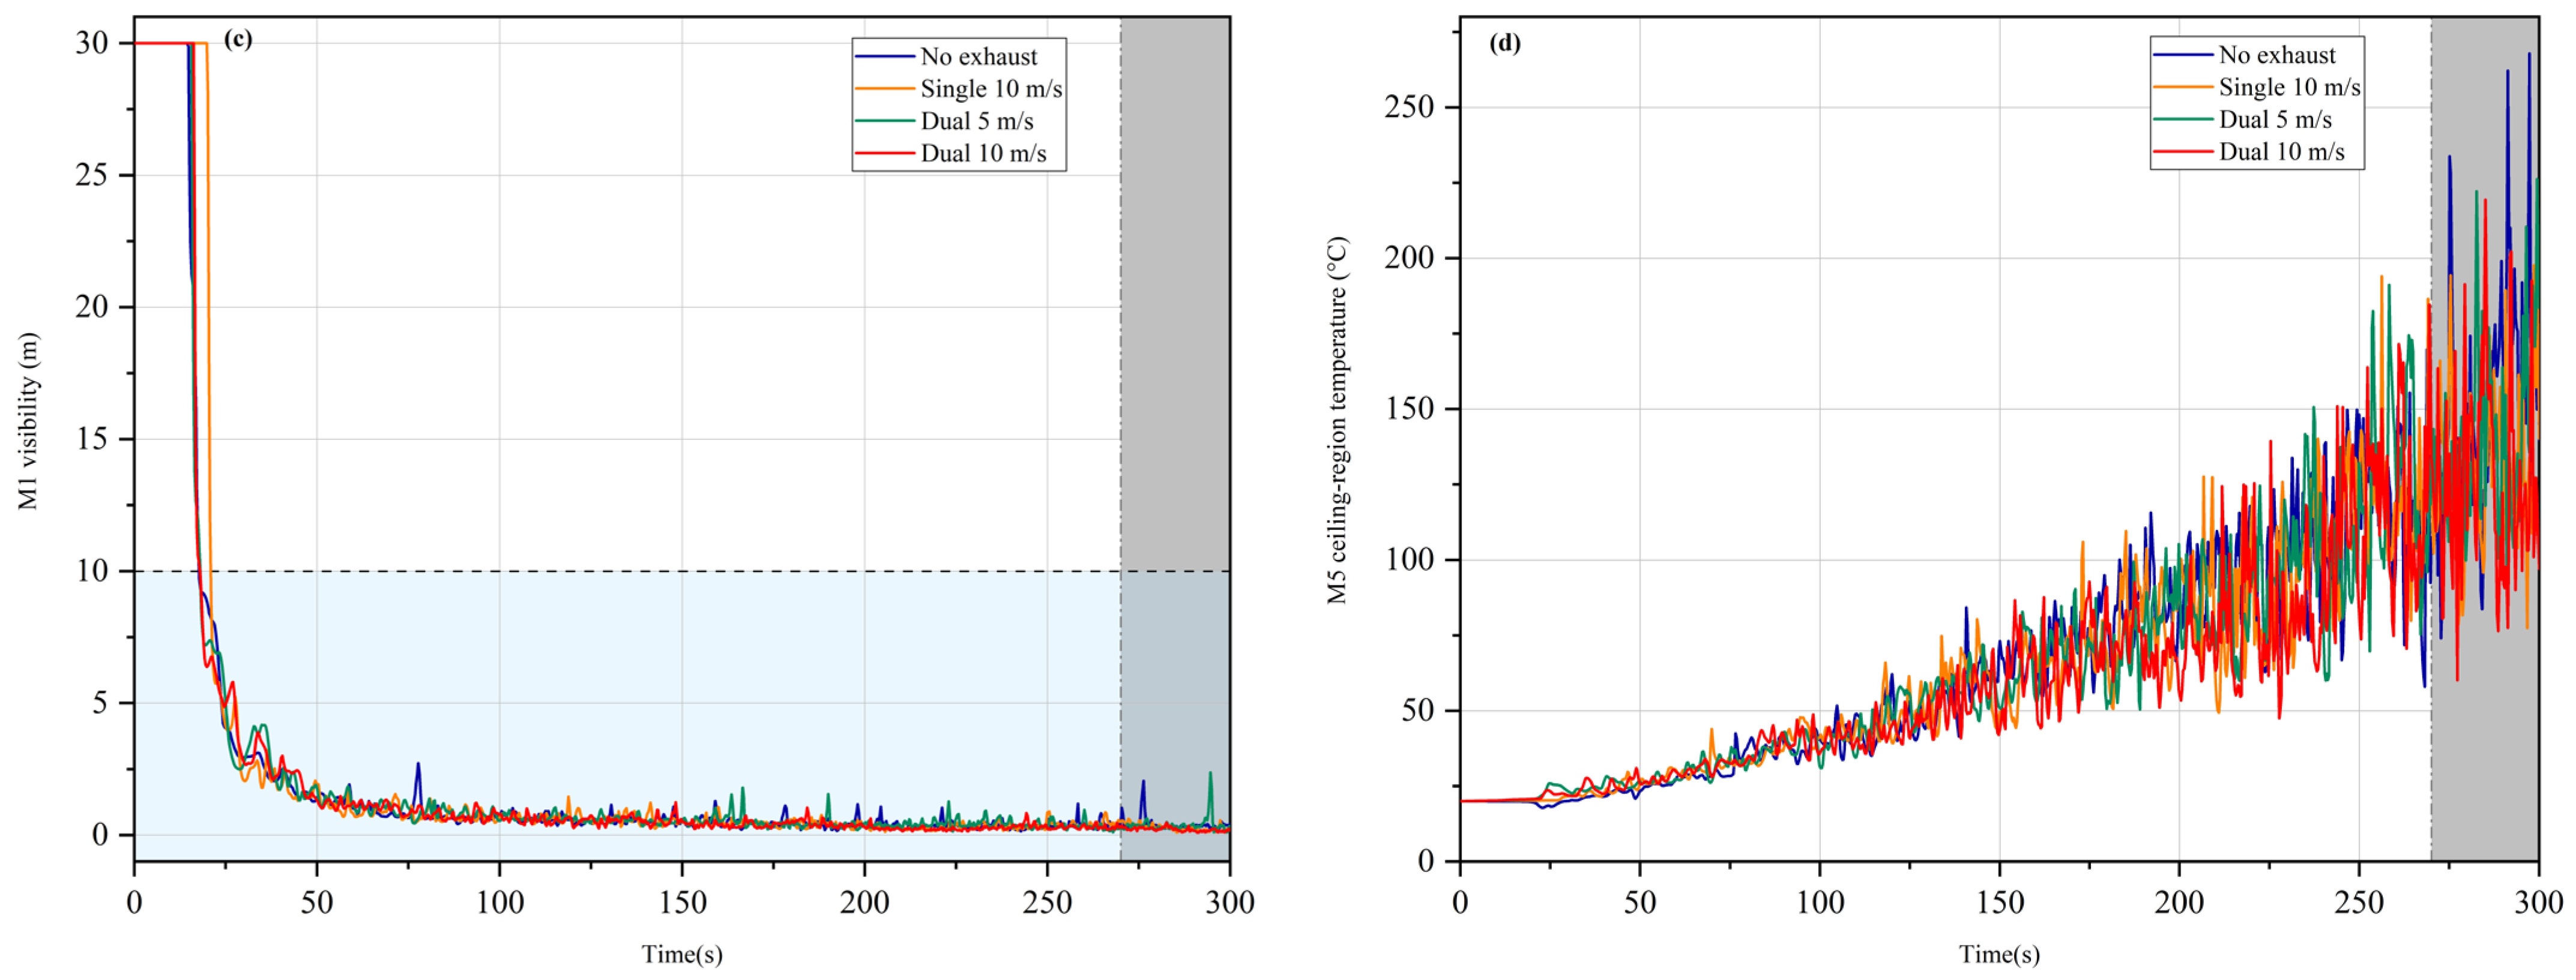
Figure 6 compares the four prescribed-extraction histories, and Table 6 summarizes the 270–300 s point statistics. At M1, a near-fire point 0.60 m from the fire-surface edge, visibility first fell below 10 m at 17.72 s with no active extraction, 20.89 s with one 10 m/s surface, 17.99 s with two 5 m/s surfaces, and 17.96 s with two 10 m/s surfaces. The one-surface 10 m/s case delayed this local crossing by about 3.2 s relative to the no-extraction case, but none of the four conditions maintained the 10 m reference at M1. These values are local responses under the common prescribed-boundary treatment described in Section 2.4.
Figure 6.
Unsmoothed point-device histories for the prescribed extraction cases at M1 and M5: (a) M1 gas temperature; (b) M1 CO concentration; (c) M1 visibility; and (d) M5 ceiling-region gas temperature. The gray band marks the inclusive t = 270–300 s averaging window. In (c), the dashed line and light-blue shading denote the 10 m comparative reference and values below it; they do not constitute a complete tenability classification.
Table 6.
Prescribed-extraction case statistics from the 270–300 s arithmetic-mean window.
The late-stage local response did not improve monotonically with nominal imposed flow. The two-surface 10 m/s case gave the lowest mean M5 gas temperature (126.5 °C) but the highest mean M1 gas temperature and CO concentration (494.4 °C and 6343.5 ppm). The no-extraction case showed lower M1 values and a higher M5 gas temperature. This contrast should not be interpreted as a global advantage of no extraction; it concerns two fixed points and is consistent with spatial redistribution of the plume and smoke. Confirming that mechanism would require velocity, pressure, mass-flow, and smoke-layer field outputs.
The nominal-flow-matched pair provides the clearest extraction comparison. One 10 m/s surface and two 5 m/s surfaces each imposed 10 m3/s. Distributing that flow over two locations reduced the 270–300 s mean M1 gas temperature from 359.5 to 267.6 °C and CO from 4095.6 to 2786.8 ppm, while visibility increased from 0.295 to 0.391 m. For the modeled geometry and monitoring location, outflow distribution affected the local response even when nominal flow was unchanged.
3.4. Spray-Case Quality Screening
The eleven spray-model files, control logs, and device-output CSV files were audited before post-activation analysis. The nine single-upper cases did not share a common pre-activation history, and the available files did not support a unique, reproducible attribution of the mismatch to one input or solver-history cause. They were excluded from causal pressure, K value, cone angle, and one-versus-two-device comparisons, irrespective of their post-activation ranking. Cases 6 and 7 were aligned over 438 samples from t = 0 to 152.959 s. Across nine common channels (spray state; M1 gas temperature, CO, and visibility; and the M2–M5 gas temperatures), the maximum absolute difference was zero at the exported numerical precision. The main-device activation time was 153.285 s in both cases, and the auxiliary-device activation time was 153.309 s. These two cases were therefore retained as the controlled spray pair. The quality-control screening and analytical use of the spray cases are summarized in Table 7.
Table 7.
Quality-control screening and analytical use of the spray cases.
No post hoc time shift, normalization, or statistical adjustment was applied to the non-matched single-device cases. They remain in the case inventory for traceability but do not support parameter-effect or optimum claims.
3.5. Matched Water-Application Arrangement
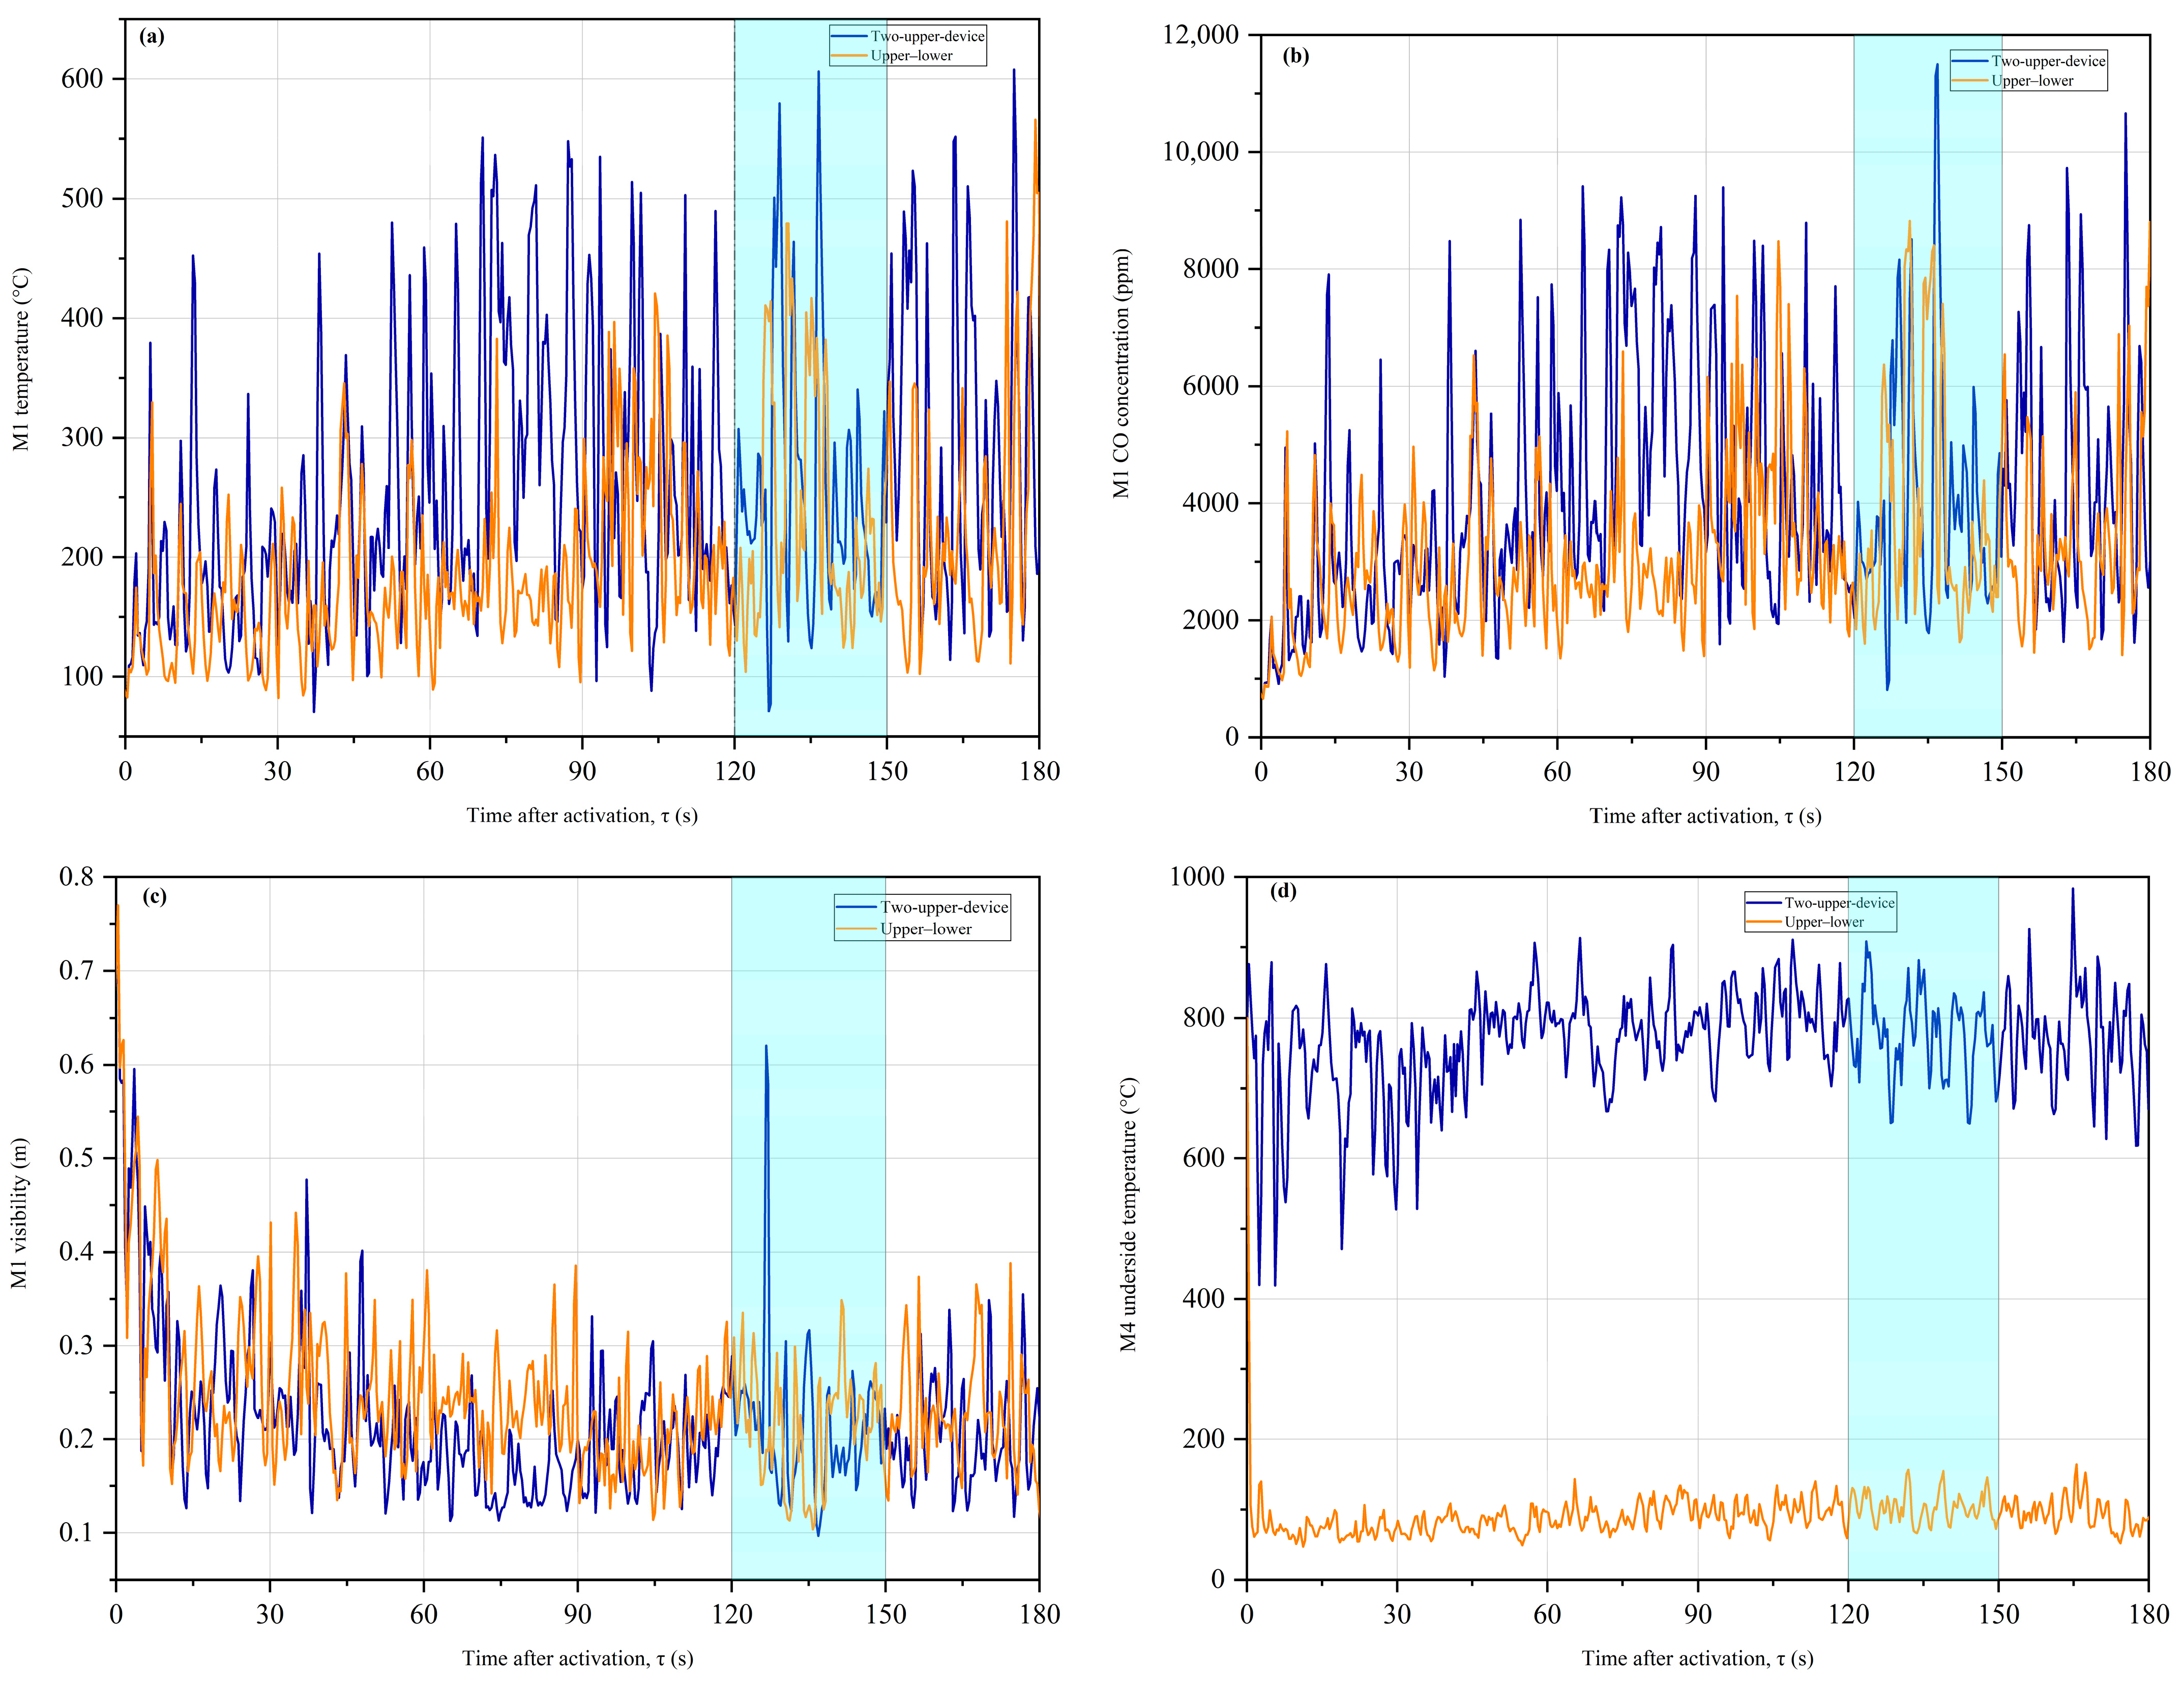
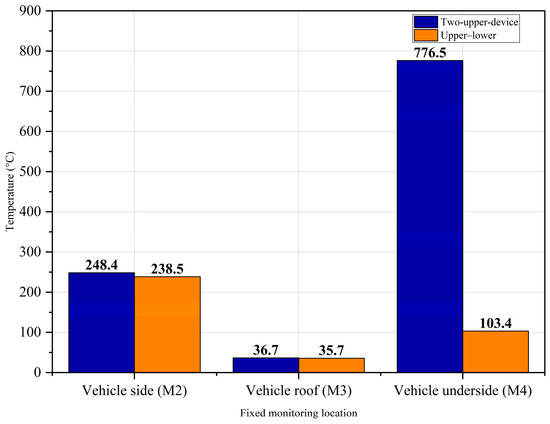
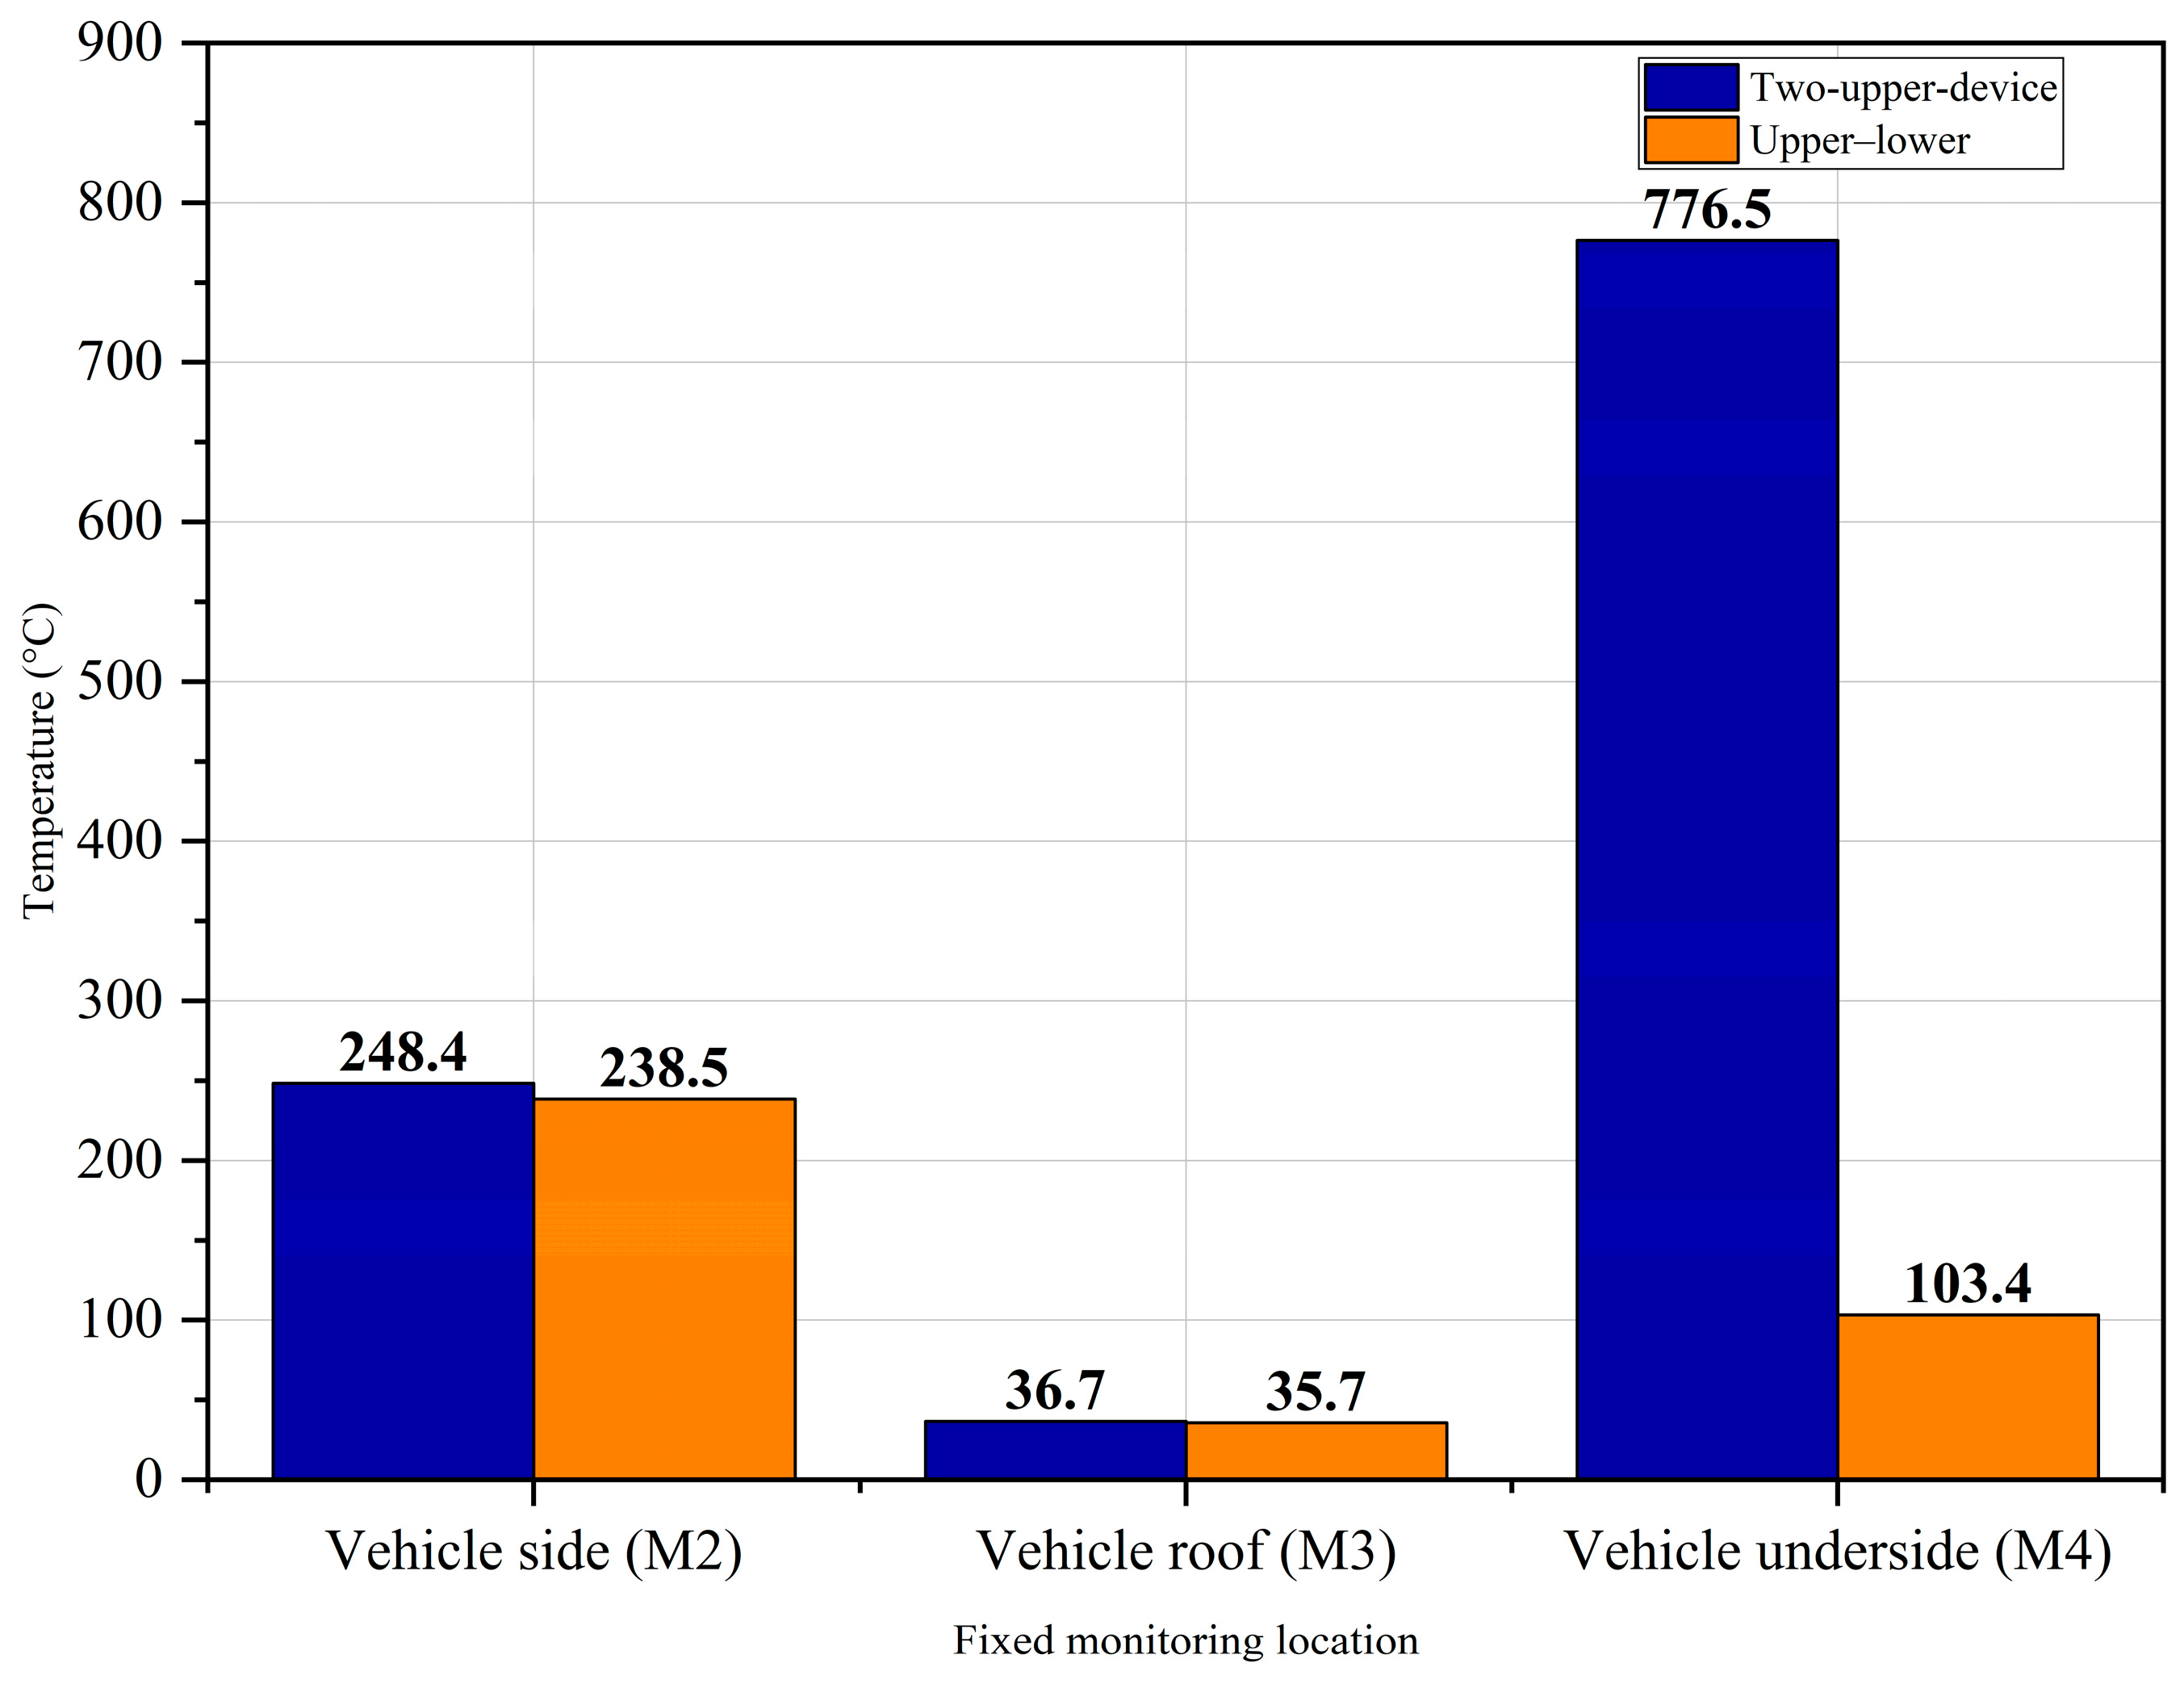
The controlled spray comparison used Cases 6 and 7 at K = 80, 1.0 bar (0.10 MPa), and a 30° outer cone angle. Both included two devices with a total nominal discharge of approximately 160 L/min, identical recorded pre-activation histories, and the same activation times. The comparison isolates the modeled effect of moving the second discharge from the upper region to z = 0.20 m beneath the vehicle and reversing its direction from downward to upward. Figure 7 presents activation-aligned histories, Figure 8 compares local gas temperatures near the vehicle, and Table 8 summarizes the τ = 120–150 s means.
Figure 7.
Matched two-device activation-aligned histories over 0 ≤ τ ≤ 180 s at K = 80, 1.0 bar (0.10 MPa), and 30°: (a) M1 gas temperature; (b) M1 CO concentration; (c) M1 visibility; and (d) M4 underside-region gas temperature. τ = 0 denotes main-device activation, and the shaded band marks the inclusive τ = 120–150 s averaging window. Curves are unsmoothed point-device outputs.
Figure 8.
Matched two-device fixed-coordinate local gas temperatures at M2, M3, and M4, reported as τ = 120–150 s arithmetic means. Values are point-device outputs, not vehicle-surface averages.
Table 8.
Matched two-device activation-normalized point statistics (τ = 120–150 s arithmetic mean).
Relative to the two-upper arrangement, the upper–lower arrangement reduced the τ-window M1 gas temperature from 260.5 to 237.1 °C (9.0%), M1 CO from 4109.9 to 3898.6 ppm (5.1%), vehicle-side-region gas temperature from 248.4 to 238.5 °C (4.0%), and M4 underside-region gas temperature from 776.5 to 103.4 °C (86.7%). The M4 value is a gas-phase point measurement 0.10 m below the prescribed fire surface; it is not the temperature of a battery or vehicle surface. M1 visibility was essentially unchanged (0.215 versus 0.216 m), and roof-region and ceiling-region gas temperatures differed by less than 1.5 °C. Relocating the second device therefore produced a strong local underside-region gas-temperature reduction without recovering the near-fire smoke environment. Section 3.6.1 compares this layout-dependent response with recent underground-garage EV-fire experiments.
The companion t = 320–350 s analysis showed the same local M4 pattern (83.0 °C for the upper–lower arrangement and 764.8 °C for the two-upper arrangement), while the M1 response deteriorated. Over this fixed-time interval, the upper–lower case gave 361.1 ± 158.1 °C and 6314.8 ± 3246.7 ppm at M1, compared with 259.3 ± 114.9 °C and 3957.4 ± 1899.8 ppm for the two-upper case. The underbody-oriented device thus produced a robust reduction in gas temperature at M4 in both time bases, but not a uniform or temporally stable improvement in the near-fire smoke environment. The standard deviations describe within-window temporal fluctuation only.
3.6. Model Credibility, Limitations, and Engineering Feasibility
3.6.1. Verification Status and External Evidence
Two routes for case-specific validation were evaluated. First, direct experimental validation would require a full-scale or reduced-scale underground-garage EV-fire experiment matched to the present geometry, fire input, physical make-up-air and extraction boundaries, obstruction layout, spray characteristics, and sensor coordinates. The present study had no access to such an experimental platform, matched ventilation and spray systems, synchronized measurements of HRR, gas temperature, CO concentration, visibility, and spray response, or the operational and safety conditions required to conduct a new EV-fire validation test. A new direct experiment could therefore not be performed. The relevant full-vehicle underground-garage experiments identified in the literature differ in one or more defining conditions and can provide external evidence for the plausibility of the modeled mechanisms, but not a one-to-one error assessment of the present absolute point values.
Second, case-specific benchmark validation would require reconstruction of a published experimental case using its geometry, measured fire input, physical inlet and extraction boundaries, obstruction layout, spray hydraulics, and sensor locations, followed by a new FDS simulation and quantitative comparison with the measured data. No identified dataset simultaneously matches the defining conditions of the present configuration. In addition, the revision is necessarily limited to the completed and archived simulation dataset; the original numerical model cannot now be modified and the complete case matrix cannot be consistently rerun under a new benchmark definition because the equivalent computational environment and resources required for a full re-simulation are not available. Partial reruns, or substitution of measurements from facilities with different geometries, ventilation paths, nozzle hydraulics, or sensor positions, would mix configuration effects with numerical error and would not constitute valid validation. Accordingly, neither direct experimental validation nor case-specific benchmark simulation was completed. The manuscript therefore makes no claim that the present absolute temperatures, concentrations, visibility values, or ventilation-system performance have been experimentally validated.
In the absence of case-specific validation, model credibility is assessed using four supporting elements: the documented FDS mathematical model and validation base [22,23,24], the matched three-grid sensitivity check, the input and pre-activation consistency audit, and comparison with relevant experiments; these are not presented as substitutes for direct validation. Deckers et al. paired full-scale closed-car-park tests with CFD and reproduced principal smoke-control trends when fire, inlet, and extraction conditions were specified [8,28]. Horváth et al. demonstrated the dependence of smoke movement on entrance flow and geometry [29]. Sikanen et al. evaluated FDS spray transport and entrainment [26], and Santangelo et al. tested water-based systems in a full-scale enclosed car park [30]. More directly, Chen et al. documented staged full-vehicle EV-fire development, vehicle-region temperature spread, thermal radiation, and multiple smoke species in an underground parking garage [16]. Their separate fine-water-mist experiment compared no-mist, top-spray, and combined top-and-bottom arrangements and found that water application reduced temperature and radiation, while gas-species responses were not uniformly improved [17]. This experimental pattern is qualitatively consistent with the present strong M4 underside-region gas-temperature reduction and the absence of recovery in M1 visibility. EV-focused studies also support directing water toward the shielded underbody region [31,32]. These sources strengthen mechanism-level credibility, but differences in geometry, fire development, inlet and outlet conditions, spray hydraulics, and sensor coordinates preclude quantitative validation of the no-inlet boundary treatment, surrogate fire chemistry, or absolute fixed-point values.
3.6.2. Sensitivity and Generalizability
Independent studies have identified HRR, fire location, ceiling and beam geometry, vehicle obstruction, extraction capacity, inlet configuration, and observation location as major influencers of car-park smoke and temperature fields [28,29,33,34,35]. Generalization is therefore limited to the present geometry, fire location, prescribed outflow surfaces, and fixed monitoring coordinates. The extraction analysis supports only relative local comparisons among cases with the same boundary treatment. The spray conclusions likewise rely only on the baseline-matched two-device pair and do not rank pressure, K value, or cone angle.
3.6.3. Engineering Feasibility of Underbody-Oriented Water Application
The lower L1 device is a conceptual upward nozzle at z = 0.20 m beneath the fire vehicle. Full-scale EV-fire studies indicate that low-level water application can improve access to the shielded underbody region [17,31,32], consistent with the direction of the M4 response. Practical implementation would require impact-protected recessed housing, resistance to blockage and corrosion, inspection and flushing access, drainage for the nominal 160 L/min discharge, protected piping, hydraulic design, and compatibility with vehicle clearance, charging equipment, electrical safety, and maintenance. These requirements were not modeled; the simulation indicates only a local gas-temperature effect.
The remaining limitations are material to interpretation. Water application does not reduce the prescribed HRR; the reaction is a fixed surrogate without HF; no ICE-vehicle comparison or spatially averaged exposure metric is included; and the case matrix is not fully factorial. The three-grid check addresses the gas-phase fire and extraction case, not independent convergence of the Lagrangian spray–gas interaction. These omissions cannot be corrected by post-processing. Adding a physical make-up-air path would change the pressure field, entrainment, plume deflection, smoke-layer transport, and extraction mass balance; all affected extraction and spray cases would therefore have to be rebuilt and rerun under a new, consistently defined ventilation system. Modelling water-induced HRR decay, EV-specific toxic species, spray-grid convergence, or direct validation would likewise require new physical inputs, a matched experiment or benchmark, and new simulations. The present study included neither the experimental conditions required to conduct a matched EV-fire validation test nor the computational conditions required to modify the archived model and consistently rerun the complete affected case matrix. Introducing these features only in selected cases, estimating their effects from the existing outputs, or comparing unmatched point measurements would destroy the controlled comparability of the matrix and would not provide scientifically defensible results. The revised study therefore retains the completed numerical dataset, states explicitly what it can and cannot support, and confines quantitative conclusions to the four common-boundary extraction cases and the baseline-matched two-device spray pair, without claims of pressure-balanced system performance, tenability, code compliance, battery extinguishment, or a general optimum.
4. Conclusions
This study screened 15 PyroSim/FDS cases and reported quantitative conclusions only for the four prescribed-extraction cases and the baseline-matched two-device spray pair. The principal conclusions are as follows:
- The 0.30 m production mesh was selected before case comparison from fire-diameter, geometric-resolution, and computational-cost criteria. The matched 0.20/0.30/0.50 m outputs were non-monotonic, so the reported differences are sensitivity measures rather than formal discretization errors; mesh independence, Richardson extrapolation, and GCI are not claimed;
- At M1, the near-fire point, all four prescribed-extraction cases crossed the 10 m visibility reference within 17.7–20.9 s, and increasing the nominal imposed flow did not produce uniform local improvement. For the nominal-flow-matched 10 m3/s pair, two 5 m/s surfaces produced lower M1 gas temperature and CO and higher visibility than one 10 m/s surface, showing that outflow distribution affected the local response;
- The nine single-upper-spray cases had non-identical pre-activation histories and were not used to infer pressure, K value, cone angle, device number, or optimum effects. No post hoc correction was applied;
- In the matched two-device comparison, moving the second device beneath the vehicle reduced the τ = 120–150 s mean M4 underside-region gas temperature from 776.5 to 103.4 °C (86.7%); the corresponding t = 320–350 s means were 764.8 and 83.0 °C. This was a localized gas-temperature effect, not a battery-temperature measurement. M1 visibility was not restored, and the fixed-time M1 smoke response did not improve uniformly. The direction of this localized effect is qualitatively consistent with recent full-vehicle underground-garage experiments comparing top-only and combined top-and-bottom fine-water-mist layouts [17];
- The model was not reconstructed from a matched experiment and contained no physical make-up-air path. Neither route for case-specific validation could be completed. This study lacked access to a matched underground-garage EV-fire experimental platform and measurements. The archived numerical model cannot be modified, and the complete case matrix could not be consistently rerun against a published benchmark under the available computational conditions. Relevant experiments therefore provide qualitative, mechanism-level corroboration only; they do not validate the absolute point values or ventilation-system performance. Unresolved requests requiring new boundaries, physical submodels, or validation data are reported as limitations rather than having been replaced by partial reruns, unmatched comparisons, or unsupported retrospective calculations. The findings apply only to the stated geometry, boundary treatment, mesh, and monitoring locations and do not establish battery-pack extinguishment, maintained tenability, code compliance, or a general optimum.
Author Contributions
H.T.: writing—original draft preparation, conceptualization, methodology, and formal analysis; D.Z.: investigation, data curation, formal analysis, and visualization X.H.: writing—review and editing. All authors have read and agreed to the published version of the manuscript.
Funding
This research received no external funding.
Institutional Review Board Statement
Not applicable.
Informed Consent Statement
Not applicable.
Data Availability Statement
The PyroSim/FDS input files, matched 0.20/0.30/0.50 m mesh-output CSV files, production-case device-output CSV files, activation logs, and channel-wise pre-activation comparability check used in the revised analysis are available from the corresponding author upon reasonable request.
Acknowledgments
The authors thank Nanjing Tech University for providing computational facilities and research support for this study.
Conflicts of Interest
The authors declare no conflicts of interest.
Abbreviations
BEV: battery electric vehicle; CFD: computational fluid dynamics; CO: carbon monoxide; EV: electric vehicle; FDS: Fire Dynamics Simulator; GCI: Grid Convergence Index; HCN: hydrogen cyanide; HF: hydrogen fluoride; HRR: heat release rate; ICE: internal combustion engine; LES: large eddy simulation; RTI: response time index.
References
- Sun, P.; Bisschop, R.; Niu, H.; Huang, X. A review of battery fires in electric vehicles. Fire Technol. 2020, 56, 1361–1410. [Google Scholar] [CrossRef] [Scilit]
- Larsson, F.; Andersson, P.; Blomqvist, P.; Mellander, B.E. Toxic fluoride gas emissions from lithium-ion battery fires. Sci. Rep. 2017, 7, 10018. [Google Scholar] [CrossRef] [PubMed]
- Lecocq, A.; Bertana, M.; Truchot, B.; Marlair, G. Comparison of the fire consequences of an electric vehicle and an internal combustion engine vehicle. In Proceedings of the 2nd International Conference on Fires in Vehicles (FIVE 2012), Chicago, IL, USA, 27–28 September 2012; pp. 183–194. [Google Scholar]
- Kang, S.; Kwon, M.; Choi, J.Y.; Choi, S. Full-scale fire testing of battery electric vehicles. Appl. Energy 2023, 332, 120497. [Google Scholar] [CrossRef] [Scilit]
- Brzezinska, D.; Bryant, P. Performance-based analysis in evaluation of safety in car parks under electric vehicle fire conditions. Energies 2022, 15, 649. [Google Scholar] [CrossRef] [Scilit]
- Hynynen, J.; Quant, M.; Pramanik, R.; Olofsson, A.; Li, Y.Z.; Arvidson, M.; Andersson, P. Electric Vehicle Fire Safety in Enclosed Spaces; RISE Report 2023:42; RISE Research Institutes of Sweden: Borås, Sweden, 2023. [Google Scholar]
- Merci, B.; Shipp, M. Smoke and heat control for fires in large car parks: Lessons learnt from research? Fire Saf. J. 2013, 57, 3–10. [Google Scholar] [CrossRef] [Scilit]
- Deckers, X.; Haga, S.; Tilley, N.; Merci, B. Smoke control in case of fire in a large car park: CFD simulations of full-scale configurations. Fire Saf. J. 2013, 57, 22–34. [Google Scholar] [CrossRef] [Scilit]
- Boehmer, H.R.; Klassen, M.S.; Olenick, S.M. Fire hazard analysis of modern vehicles in parking facilities. Fire Technol. 2021, 57, 2097–2127. [Google Scholar] [CrossRef] [Scilit]
- Liu, T.; Tao, C.; Wang, X. Cooling control effect of water mist on thermal runaway propagation in lithium ion battery modules. Appl. Energy 2020, 267, 115087. [Google Scholar] [CrossRef] [Scilit]
- Zhang, L.; Duan, Q.; Liu, Y.; Xu, J.; Sun, J.; Xiao, H.; Wang, Q. Experimental investigation of water spray on suppressing lithium-ion battery fires. Fire Saf. J. 2021, 120, 103117. [Google Scholar] [CrossRef] [Scilit]
- Li, Q.; Wang, Z.; Wang, Y.; Zhang, X. Study on the effectiveness of water mist on suppressing lithium-ion battery thermal runaway. Crystals 2023, 13, 1346. [Google Scholar] [CrossRef] [Scilit]
- Han, L.; Wang, Z.; He, X.; He, C.; Shi, X.; Yao, B. The effect of water mist strategies on thermal runaway fire suppression of large-capacity NCM lithium-ion battery. Energy Storage Sci. Technol. 2023, 12, 1664–1674. [Google Scholar] [CrossRef]
- Kang, S.; Kwon, M.; Choi, J.Y.; Choi, S. Full-Scale Fire Testing to Assess the Risk of Battery Electric Vehicle Fires in Underground Car Parks. Fire Technol. 2025, 61, 4133–4163. [Google Scholar] [CrossRef] [Scilit]
- Leone, E.; Papurello, D. Fire Safety Analysis of Alternative Vehicles in Confined Spaces: A Study of Underground Parking Facilities. Fire 2026, 9, 20. [Google Scholar] [CrossRef] [Scilit]
- Chen, B.; Yang, L.; Wei, R. Experimental Study on Fire Evolution Process of Electric Vehicles in Underground Parking Garages. Fire Technol. 2026, 62, 46. [Google Scholar] [CrossRef] [Scilit]
- Chen, B.; Yang, L.; Wei, R. Effect of Fine Water Mist System Layout on Electric Vehicle Fire Suppression in Underground Garages. Tunn. Undergr. Space Technol. 2026, 168, 107140. [Google Scholar] [CrossRef] [Scilit]
- Ove Arup & Partners Limited. T0194-Covered Car Parks: Fire Safety Guidance for Electric Vehicles; Office for Zero Emission Vehicles: London, UK, 2023.
- Babrauskas, V.; Peacock, R.D. Heat release rate: The single most important variable in fire hazard. Fire Saf. J. 1992, 18, 255–272. [Google Scholar] [CrossRef] [Scilit]
- GB 50067-2014; Code for Fire Protection Design of Garages, Motor Repair Shops and Parking Areas. China Planning Press: Beijing, China, 2014.
- GB 51251-2017; Technical Standard for Smoke Management Systems in Buildings. China Planning Press: Beijing, China, 2018.
- McGrattan, K.; Hostikka, S.; McDermott, R.; Floyd, J.; Weinschenk, C.; Overholt, K.; Vanella, M. Fire Dynamics Simulator User’s Guide, 6th ed.; NIST Special Publication 1019; National Institute of Standards and Technology: Gaithersburg, MD, USA, 2024. [CrossRef] [Scilit]
- McGrattan, K.; McDermott, R.; Hostikka, S.; Floyd, J.; Weinschenk, C.; Overholt, K.; Vanella, M. Fire Dynamics Simulator Technical Reference Guide, Volume 1: Mathematical Model, 6th ed.; NIST Special Publication 1018–1; National Institute of Standards and Technology: Gaithersburg, MD, USA, 2024. [CrossRef] [Scilit]
- McGrattan, K.; Hostikka, S.; Floyd, J.; McDermott, R.; Vanella, M. Fire Dynamics Simulator Technical Reference Guide, Volume 3: Validation, 6th ed.; NIST Special Publication 1018–3; National Institute of Standards and Technology: Gaithersburg, MD, USA, 2024. [CrossRef] [Scilit]
- Hurley, M.J.; Gottuk, D.T.; Hall, J.R., Jr.; Harada, K.; Kuligowski, E.D.; Puchovsky, M.; Torero, J.L.; Watts, J.M., Jr.; Wieczorek, C.J. (Eds.) SFPE Handbook of Fire Protection Engineering, 5th ed.; Springer: New York, NY, USA, 2016. [Google Scholar] [CrossRef] [Scilit]
- Sikanen, T.; Vaari, J.; Hostikka, S.; Paajanen, A. Modeling and simulation of high pressure water mist systems. Fire Technol. 2014, 50, 483–504. [Google Scholar] [CrossRef] [Scilit]
- Jeon, G.Y.; Kim, J.Y.; Hong, W.H.; Augenbroe, G. Evacuation performance of individuals in different visibility conditions. Build. Environ. 2011, 46, 1094–1103. [Google Scholar] [CrossRef] [Scilit]
- Deckers, X.; Haga, S.; Sette, B.; Merci, B. Smoke control in case of fire in a large car park: Full-scale experiments. Fire Saf. J. 2013, 57, 11–21. [Google Scholar] [CrossRef] [Scilit]
- Horváth, I.; van Beeck, J.; Merci, B. Full-scale and reduced-scale tests on smoke movement in case of car park fire. Fire Saf. J. 2013, 57, 35–43. [Google Scholar] [CrossRef] [Scilit]
- Santangelo, P.E.; Tarozzi, L.; Tartarini, P. Full-scale experiments of fire control and suppression in enclosed car parks: A comparison between sprinkler and water-mist systems. Fire Technol. 2016, 52, 1369–1407. [Google Scholar] [CrossRef] [Scilit]
- Ko, B.Y.; Yoo, S.H.; Choi, D.H.; Han, K.I. Full-scale fire extinguishing experiments to analyze the adaptability of firefighting facilities for electric vehicle fires in underground parking lots. Fire Sci. Eng. 2024, 38, 1–8. [Google Scholar] [CrossRef] [Scilit]
- Lecocq, A.; Bordes, A. Summary of Work on Extinguishing Li-Ion Battery Fires of Electric Vehicles; Ineris Report 212018-2809454, Version 1.0; Institut National de l’Environnement Industriel et des Risques: Verneuil-en-Halatte, France, 2024. [Google Scholar]
- Barsim, M.M.; Bassily, M.A.; El-Batsh, H.M.; Rihan, Y.A.; Sherif, M.M. Performance of impulse ventilation system in an underground car park fire: Case study. J. Build. Eng. 2020, 29, 101162. [Google Scholar] [CrossRef] [Scilit]
- Tharima, A.F.; Rahman, M.M.; Yusoff, M.Z.; Kueh, A.B.H. Multi-objective optimization of underground car park design for tenability under fire-induced smoke. Tunn. Undergr. Space Technol. 2019, 85, 220–230. [Google Scholar] [CrossRef] [Scilit]
- Luo, J.; Zhang, X.; Zhao, J.; Xu, Z. Fire experiment on temperature distribution in an underground vertical car park. Case Stud. Therm. Eng. 2019, 15, 100513. [Google Scholar] [CrossRef] [Scilit]

Disclaimer/Publisher’s Note: The statements, opinions and data contained in all publications are solely those of the individual author(s) and contributor(s) and not of MDPI and/or the editor(s). MDPI and/or the editor(s) disclaim responsibility for any injury to people or property resulting from any ideas, methods, instructions or products referred to in the content. |
© 2026 by the authors. Licensee MDPI, Basel, Switzerland. This article is an open access article distributed under the terms and conditions of the Creative Commons Attribution (CC BY) license.