


Abstract
Longitudinal ventilation is a primary smoke-control strategy in road tunnels, yet its effect on structural thermal exposure remains insufficiently quantified under full-scale conditions. This study examined whether increased airflow mitigates lining heating by lowering peak temperatures or instead redistributes thermal loading in time and space. Full-scale gasoline–diesel pool-fire experiments were conducted at the Research Centre “Zentrum am Berg” under two ventilation regimes and two fire-source elevations, while surface temperatures of protected tunnel linings were recorded continuously. Higher ventilation generally delayed peak temperatures and produced broader high-temperature plateaus, despite similar or moderately lower peak values at the lower source elevation. When the fire source was positioned closer to the tunnel ceiling, lower ventilation produced higher but shorter-lived temperature peaks, whereas stronger ventilation reduced maxima but prolonged heating. Overall, cumulative thermal exposure, quantified by a temperature–time integral, was greater under higher-airflow conditions. These results show that, within the tested range of ventilation and source-elevation conditions, peak temperature alone does not adequately represent structural fire severity and that duration-dependent exposure metrics should be included in performance-based tunnel fire design.
1. Introduction
Road tunnels are critical components of modern transport networks, yet fires in these confined environments can generate severe thermal conditions that threaten structural integrity, disrupt operation, and impose long-term socio-economic impacts [1,2]. In contrast to open-air fires, tunnel fires are governed by a strong coupling between combustion, ventilation-driven flow, and heat transfer within a restricted geometry [3,4]. These interactions control not only fire growth and smoke movement but also the magnitude, duration, and spatial distribution of thermal exposure imposed on tunnel linings. Ventilation is therefore central not only to life safety through smoke management but also to structural performance through its control of heat transfer pathways.
Previous research has shown that longitudinal ventilation governs plume behaviour and ceiling temperature fields by mediating the balance between buoyancy-driven flow and forced airflow [5]. Increasing air velocity promotes plume inclination and entrainment, redistributes heated gases downstream, and changes both the magnitude and the location of maximum ceiling temperatures [6,7,8,9,10]. Ceiling-jet, model-scale, and numerical studies further indicate that airflow controls the transition from buoyancy-dominated bidirectional smoke spread to downstream-directed flow, with corresponding changes in mass flow, temperature distribution, smoke propagation, and heat transfer beneath the ceiling [11,12]. Theoretical and experimental analyses additionally show that longitudinal smoke temperature decay depends strongly on ventilation conditions because convection, entrainment, and heat loss evolve along the tunnel axis as the flow regime changes [13]. Numerical investigations confirm that stronger longitudinal ventilation generally increases downstream plume deflection and often reduces local peak ceiling temperatures, although the effect can be modified by source elevation, ceiling proximity, and recirculation zones that locally intensify thermal exposure [14]. Together, these findings demonstrate that ventilation affects not only the magnitude of heating but also the location and duration of hot-gas interaction with structural surfaces.
Ventilation also affects the broader fire–flow–smoke interaction that determines heat transfer to tunnel linings. By regulating oxygen supply and flow–flame interaction, increased airflow can intensify combustion when enhanced oxygen transport outweighs aerodynamic cooling, whereas reduced ventilation can limit burning through oxygen depletion [15,16,17]. Confinement further enhances this behaviour, because heated tunnel boundaries and the smoke layer can increase radiative feedback to the fuel and raise the effective heat release rate relative to comparable open-air fires [3,4]. Effective fire size in tunnels therefore reflects the combined influence of ventilation conditions, fuel characteristics, and structural heat losses [5,18]. At the same time, smoke acts as a radiatively participating medium whose structural impact depends on optical thickness, temperature, and residence time beneath the ceiling [1,19]. Soot-laden layers can shield surfaces from radiation while also acting as secondary radiative sources, and investigations of the fire–structure interface indicate that heat transfer to concrete linings is often governed by radiative exchange from the coupled smoke–flame layer rather than by gas temperature alone [20,21]. Ventilation directly influences the formation, persistence, and downstream transport of this hot smoke layer through its control of plume development, entrainment, and dilution [13,22]. As a result, the structural consequences of ventilation cannot be inferred solely from temperature maxima, because the same airflow that improves smoke extraction may also alter combustion intensity and radiative exposure pathways.
The transition between ventilation-controlled regimes is commonly described using the critical velocity, defined as the minimum airflow required to prevent upstream smoke propagation [1,23,24]. This threshold captures the competition between buoyancy and forced flow, but its implications for structural heating depend on the broader tunnel geometry and fire configuration. Geometric factors such as cross-sectional shape, aspect ratio, and source–ceiling spacing modify entrainment, recirculation, and plume impingement, thereby influencing the distribution of heat transfer to tunnel boundaries [25,26,27,28,29,30]. Elevated or distributed fire sources can further alter flame–ceiling interaction, smoke stratification, ceiling-temperature distributions, and downstream smoke development by changing the plume trajectory, effective source-to-ceiling height, and airflow interaction around the source [31,32,33,34]. These geometric effects are especially important when assessing realistic tunnel scenarios, because they can shift both the location and the persistence of peak exposure even under nominally similar ventilation conditions.
Evidence from large-scale tunnel fire programmes further illustrates the severity of this interaction. The Runehamar tests showed that heavy goods vehicle cargo fires can grow rapidly to peak heat release rates above 200 MW, while the EUREKA 499 and Memorial Tunnel programmes demonstrated that ventilation conditions strongly influence both fire growth and smoke spread under realistic tunnel geometries [35,36,37]. These studies also highlight an inherent safety trade-off: longitudinal ventilation can protect the upstream side by suppressing back-layering, but it simultaneously transports smoke, heat, and combustion products downstream, where they may threaten evacuees, emergency responders, and exposed structural surfaces [1,35,38]. Under severe conditions, measured gas temperatures beneath the ceiling have exceeded 1300 °C in full-scale tests, and flame impingement can extend far downstream, creating sustained high-temperature zones capable of accelerating structural deterioration [9,37].
From a structural perspective, tunnel lining damage is governed by heating rate, temperature gradients, and exposure duration rather than peak temperature alone, making cumulative thermal load a key determinant of response [19,39]. Full-scale and laboratory studies have reported rapid temperature rise and high incident heat flux in tunnel fires, with radiative transfer playing a dominant role in temperature penetration and spalling behaviour [40]. Prolonged exposure can therefore lead to cracking, spalling, and degradation of mechanical properties even when global stability is preserved, and protective layers may delay but not eliminate such effects depending on ventilation and fire severity [41,42,43,44].
Despite extensive research on smoke control, combustion behaviour, and ceiling temperatures, direct full-scale evidence linking longitudinal ventilation to the time-resolved thermal exposure of tunnel linings remains limited. Landmark tunnel fire programmes have clarified fire growth and smoke movement in ventilated tunnels, yet relatively few studies have isolated how ventilation modifies the pathways and duration of heat transfer to structural surfaces under controlled conditions and realistic fuel configurations [35,36,37,45]. Experimental data for elevated fire sources that allow airflow beneath the burner and alter plume development are especially scarce. As a result, it remains uncertain whether longitudinal ventilation primarily mitigates structural heating by lowering temperatures or instead redistributes fire energy in time and space, thereby increasing cumulative thermal load.
Previous studies have examined fire-source elevation in relation to smoke dynamics, critical velocity, and flame merging [25,31]. Two full-scale studies by Li et al. [33,34] further demonstrated that fire-source elevation affects smoke stratification, ceiling-temperature distributions, and smoke back-layering in extra-long tunnels. The first tested diesel pool fires at three source elevations and showed that raising the fire source promoted thermal smoke stratification and increased the upstream ceiling-temperature decay coefficient, effects attributed to a shorter plume trajectory and reduced air entrainment before ceiling impingement. The second varied ambient airflow velocity, pool size, and fire-source elevation to examine transverse ceiling-temperature decay and smoke back-layering length, incorporating an effective source height into predictive correlations for both quantities. Collectively, these studies have primarily focused on smoke-control performance, smoke spreading, or gas-phase temperature behaviour rather than on the resulting thermal exposure of tunnel linings. In contrast, this study investigates full-scale structural thermal exposure in a 400 m long test tunnel using gasoline–diesel pool fires, controlled longitudinal ventilation, and different fire-source elevations. Lining surface-temperature histories and temperature–time integrals are used to evaluate both peak and cumulative thermal exposure of the tunnel lining.
This study addresses that gap through full-scale fire experiments conducted under controlled longitudinal ventilation with consistent fuel characteristics. Four gasoline–diesel pool fires were tested under two ventilation intensities and two fire-source elevations, and surface temperatures of protected tunnel linings were recorded continuously. The study compares how ventilation intensity influences time-resolved lining temperatures under two fire-source configurations that differ in source elevation and source-to-ceiling distance. The results show that longitudinal ventilation governs the temporal structure of thermal exposure more strongly than peak temperature, with higher airflow producing more sustained heating and greater cumulative thermal load. These findings clarify the dual role of longitudinal ventilation in tunnel fires and support performance-based evaluation of structural resilience.
2. Materials and Methods
2.1. Study Design
This full-scale experimental study examined how longitudinal ventilation influences the thermal response of tunnel linings subjected to pool-fire scenarios. Eight fire tests were conducted in a road–rail tunnel environment under controlled fan settings, with ventilation intensity and fire-source elevation as the primary experimental factors. Ventilation intensity was varied by operating either two or four jet fans, and source elevation by positioning the fuel-pan platform either 2.1 m or 4.1 m above the tunnel floor.
The primary measured response variable was the time history of lining surface temperature, recorded by embedded thermocouples. Secondary variables included pre-ignition ventilation velocity and ambient tunnel conditions, together with qualitative visual observations of flame and smoke development. The study focused on the thermal response of the lining and therefore did not incorporate direct measurements of heat release rate (HRR), incident heat flux, gas species concentrations, or tenability metrics.
The experimental campaign was comparative rather than fully factorial. For the baseline configuration with a 2.1 m source elevation, three tunnel cross-sections with passive fire protection were used as successive test locations and were distinguished by nominal fire-protection plaster thicknesses of 2, 3, and 4 cm. The fire-protection material (maxit ip 160 T) and the selected nominal thicknesses were defined within a broader full-scale fire-testing programme conducted at the same facility, which also evaluated the thermal-protection performance of the plaster itself. The present study reports the subset of this programme focused on the effects of longitudinal ventilation and fire-source elevation on lining thermal exposure. Accordingly, the plaster thicknesses are used only to identify the instrumented test sections, and evaluation of the fire-resistant plaster performance is outside the scope of this work. Since Tests 1–3 were conducted in the same tunnel, at the same nominal source elevation, and under paired ventilation settings, the three baseline pairs are treated as repeated comparative observations under nominally identical tunnel conditions; however, minor local variations in tunnel geometry and test location were unavoidable. For the elevated-source configuration (4.1 m), measurements were performed at the cross-section protected with the nominal 2 cm plaster layer. The results should therefore be interpreted as full-scale comparative observations obtained under controlled configurations rather than as a statistically replicated dataset.
2.2. Experimental Site
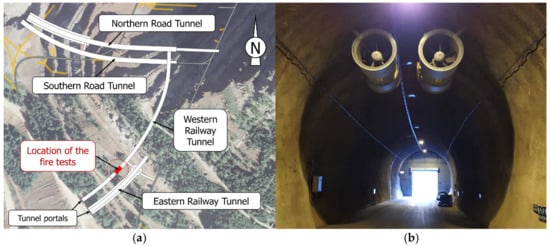
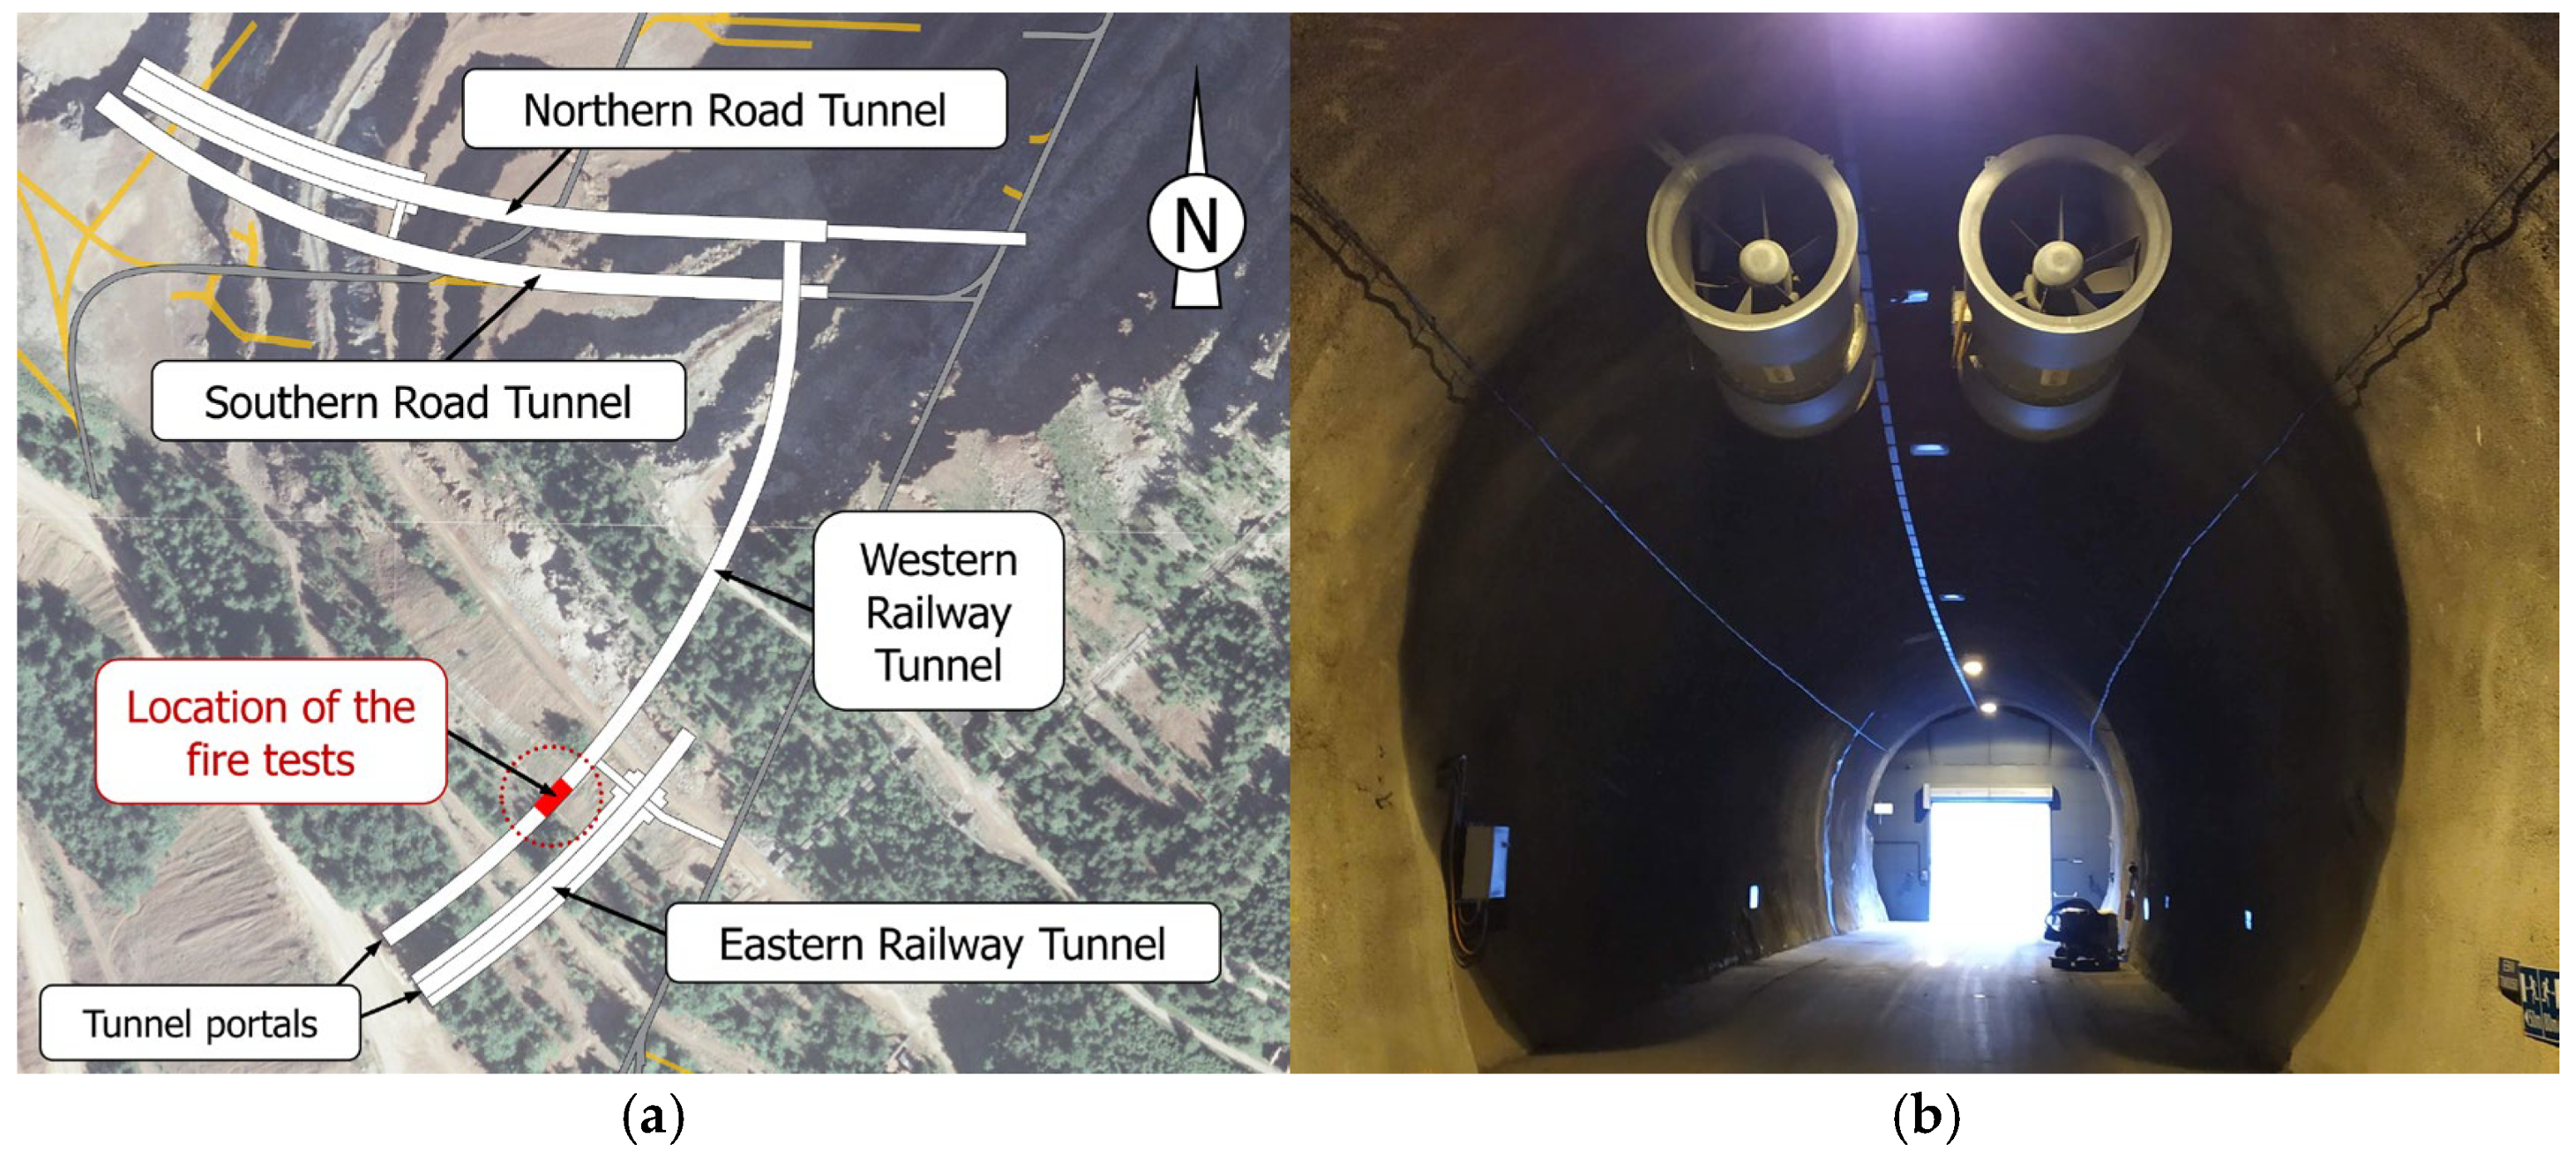
The fire tests were carried out at the Research Centre “Zentrum am Berg” (ZaB) in Eisenerz, Austria. ZaB is an underground research facility operated by the Technical University of Leoben and designed for full-scale investigations in safety, mobility, construction, and energy systems. The facility comprises two road tunnels and two railway tunnels (Figure 1a), as well as additional underground infrastructure for experimental purposes.
Figure 1.
Zentrum am Berg underground research facility: (a) tunnel system layout; (b) interior view of the Western Railway Tunnel towards the portal.
All experiments were performed in the Western Railway Tunnel, which is approximately 400 m long, 8.3 m wide, and 7.6 m high. The tunnel was designed to represent standard railway tunnel geometry. The floor is asphalted, and the tunnel lining is formed of shotcrete. Ventilation was provided by ceiling-mounted reversible jet fans positioned 50 m from the tunnel portal (Figure 1b), with an additional pair installed in the Northern Road Tunnel. Each fan has a nominal diameter of 1.12 m, a length of 3.0 m, and a maximum airflow rate of 31.4 m3/s.
2.3. Fire Scenarios and Fuel Configuration
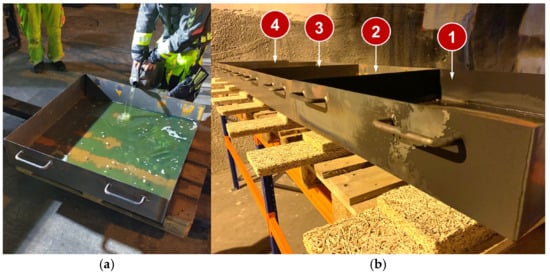
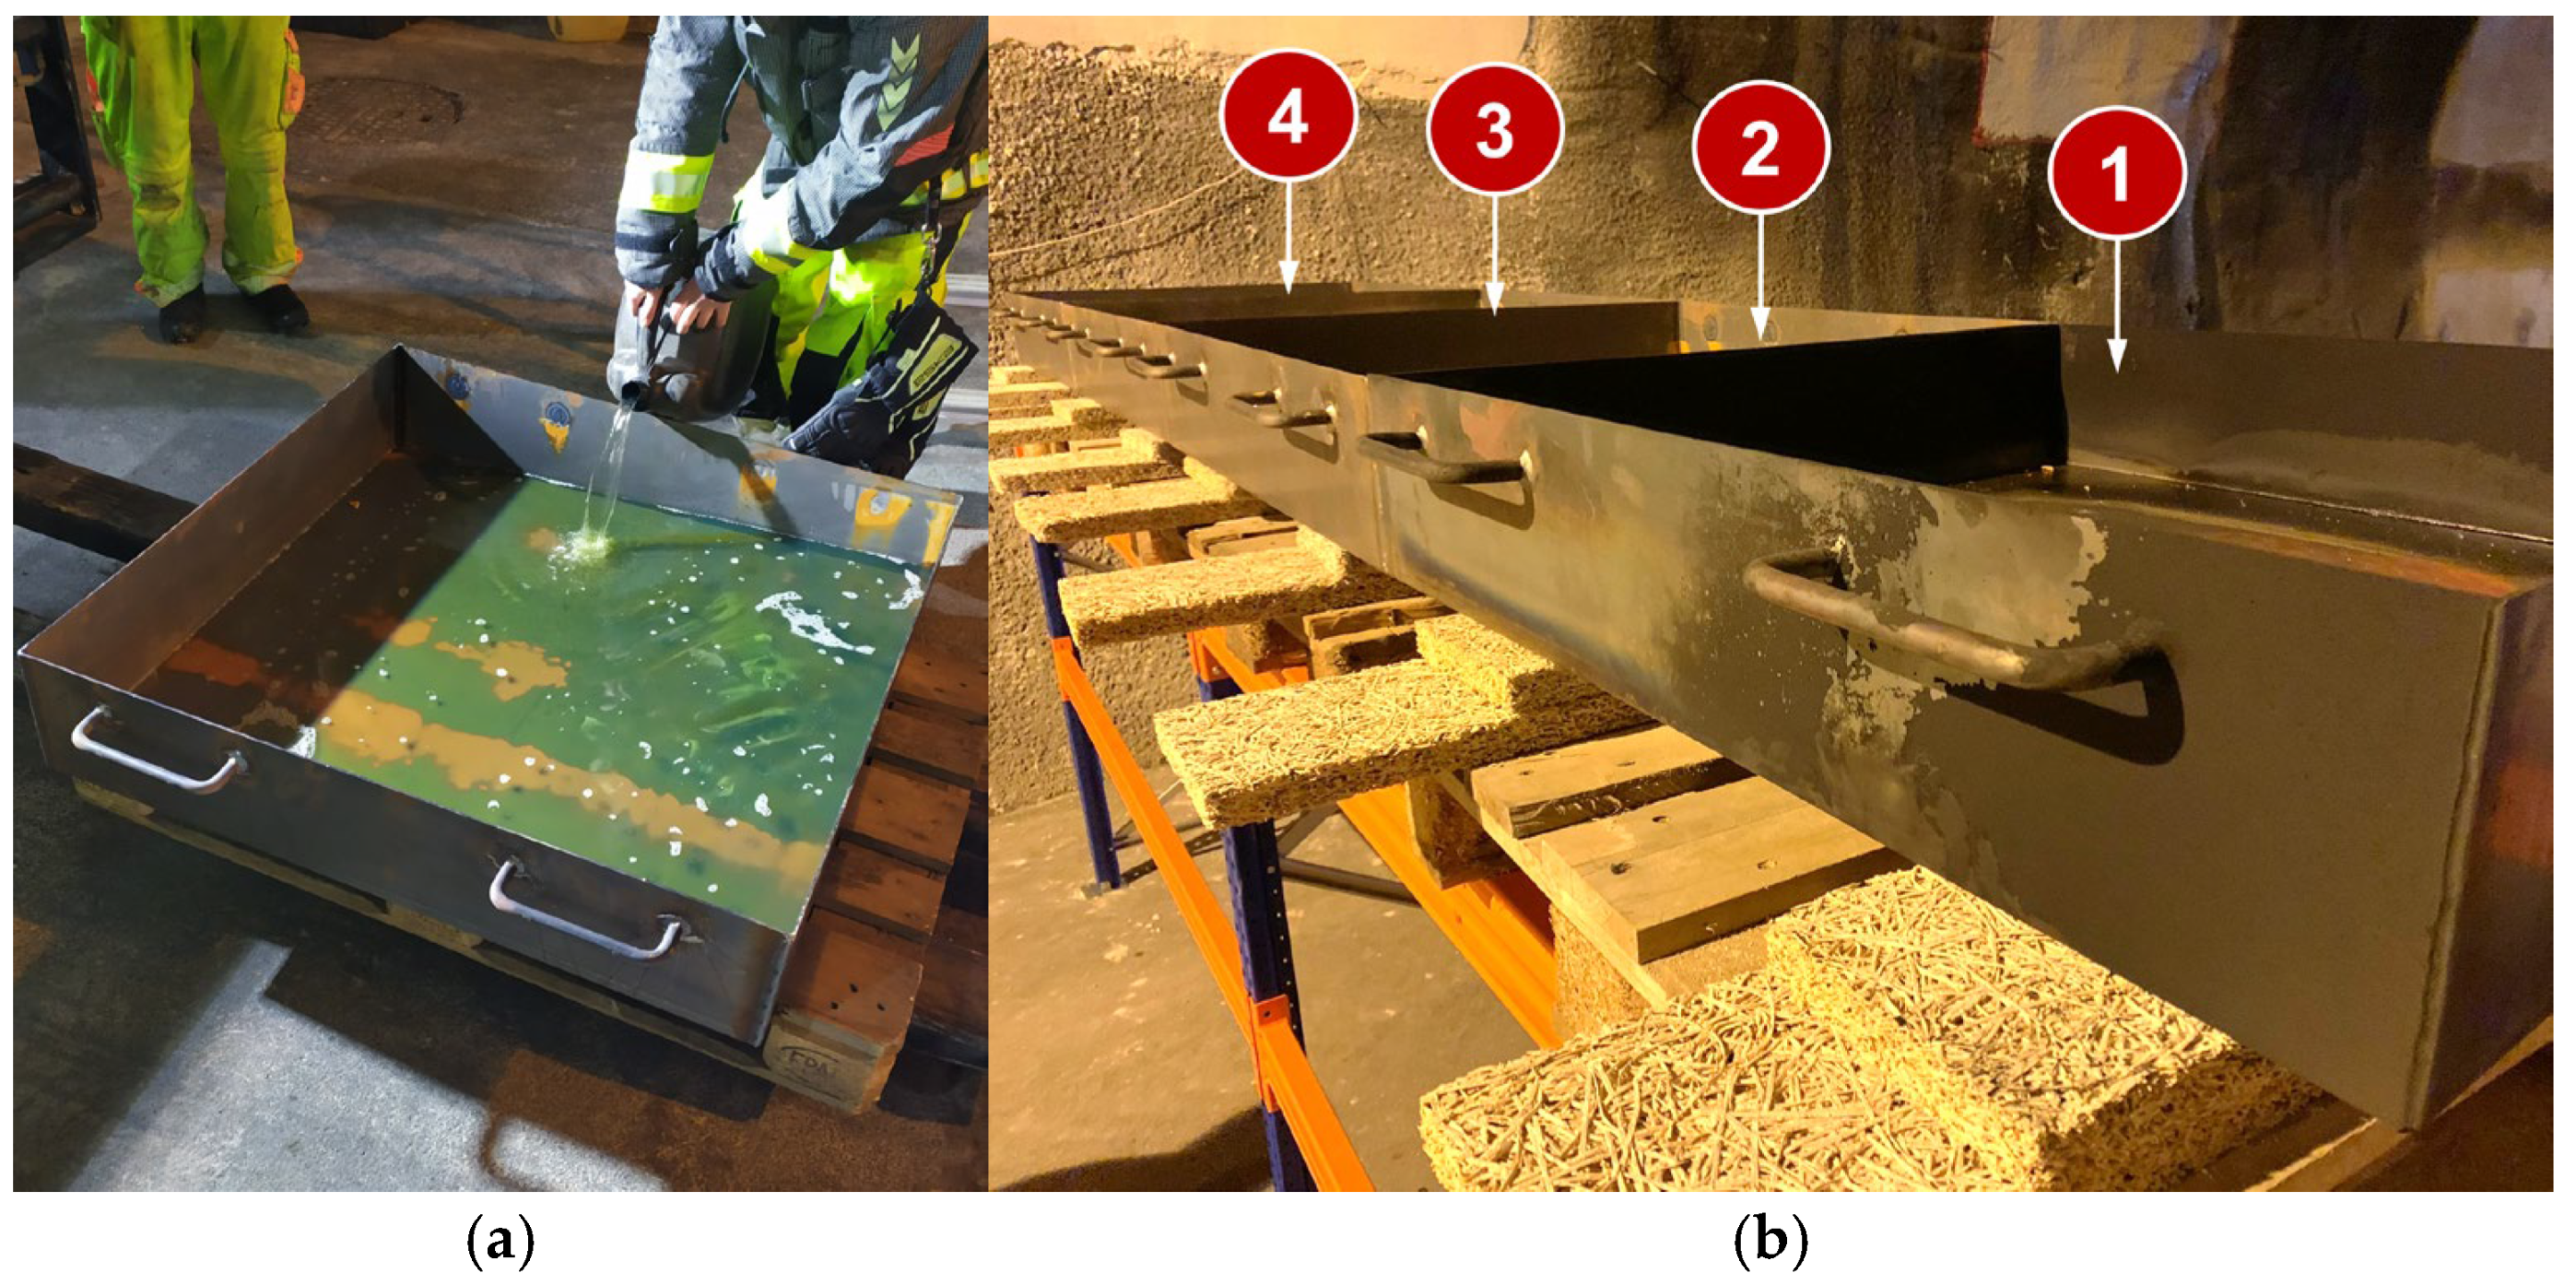
The fire scenarios consisted of liquid pool fires intended to reproduce thermal conditions representative of passenger-vehicle fires. The fuel was a gasoline–diesel mixture with a volumetric ratio of 1:4. Four square stainless-steel pans, each measuring 1 m × 1 m, were used in every test, and each pan was filled with 25 L of fuel, giving a total nominal fuel load of 100 L per experiment (Figure 2). The pans were placed directly adjacent to one another, with no intentional spacing between neighbouring edges. Ignition was performed using a portable gas torch.
Figure 2.
Preparation and positioning of fuel pans: (a) fuel loading; (b) four-pan layout in test configuration.
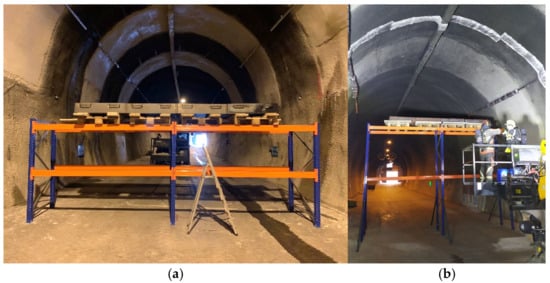
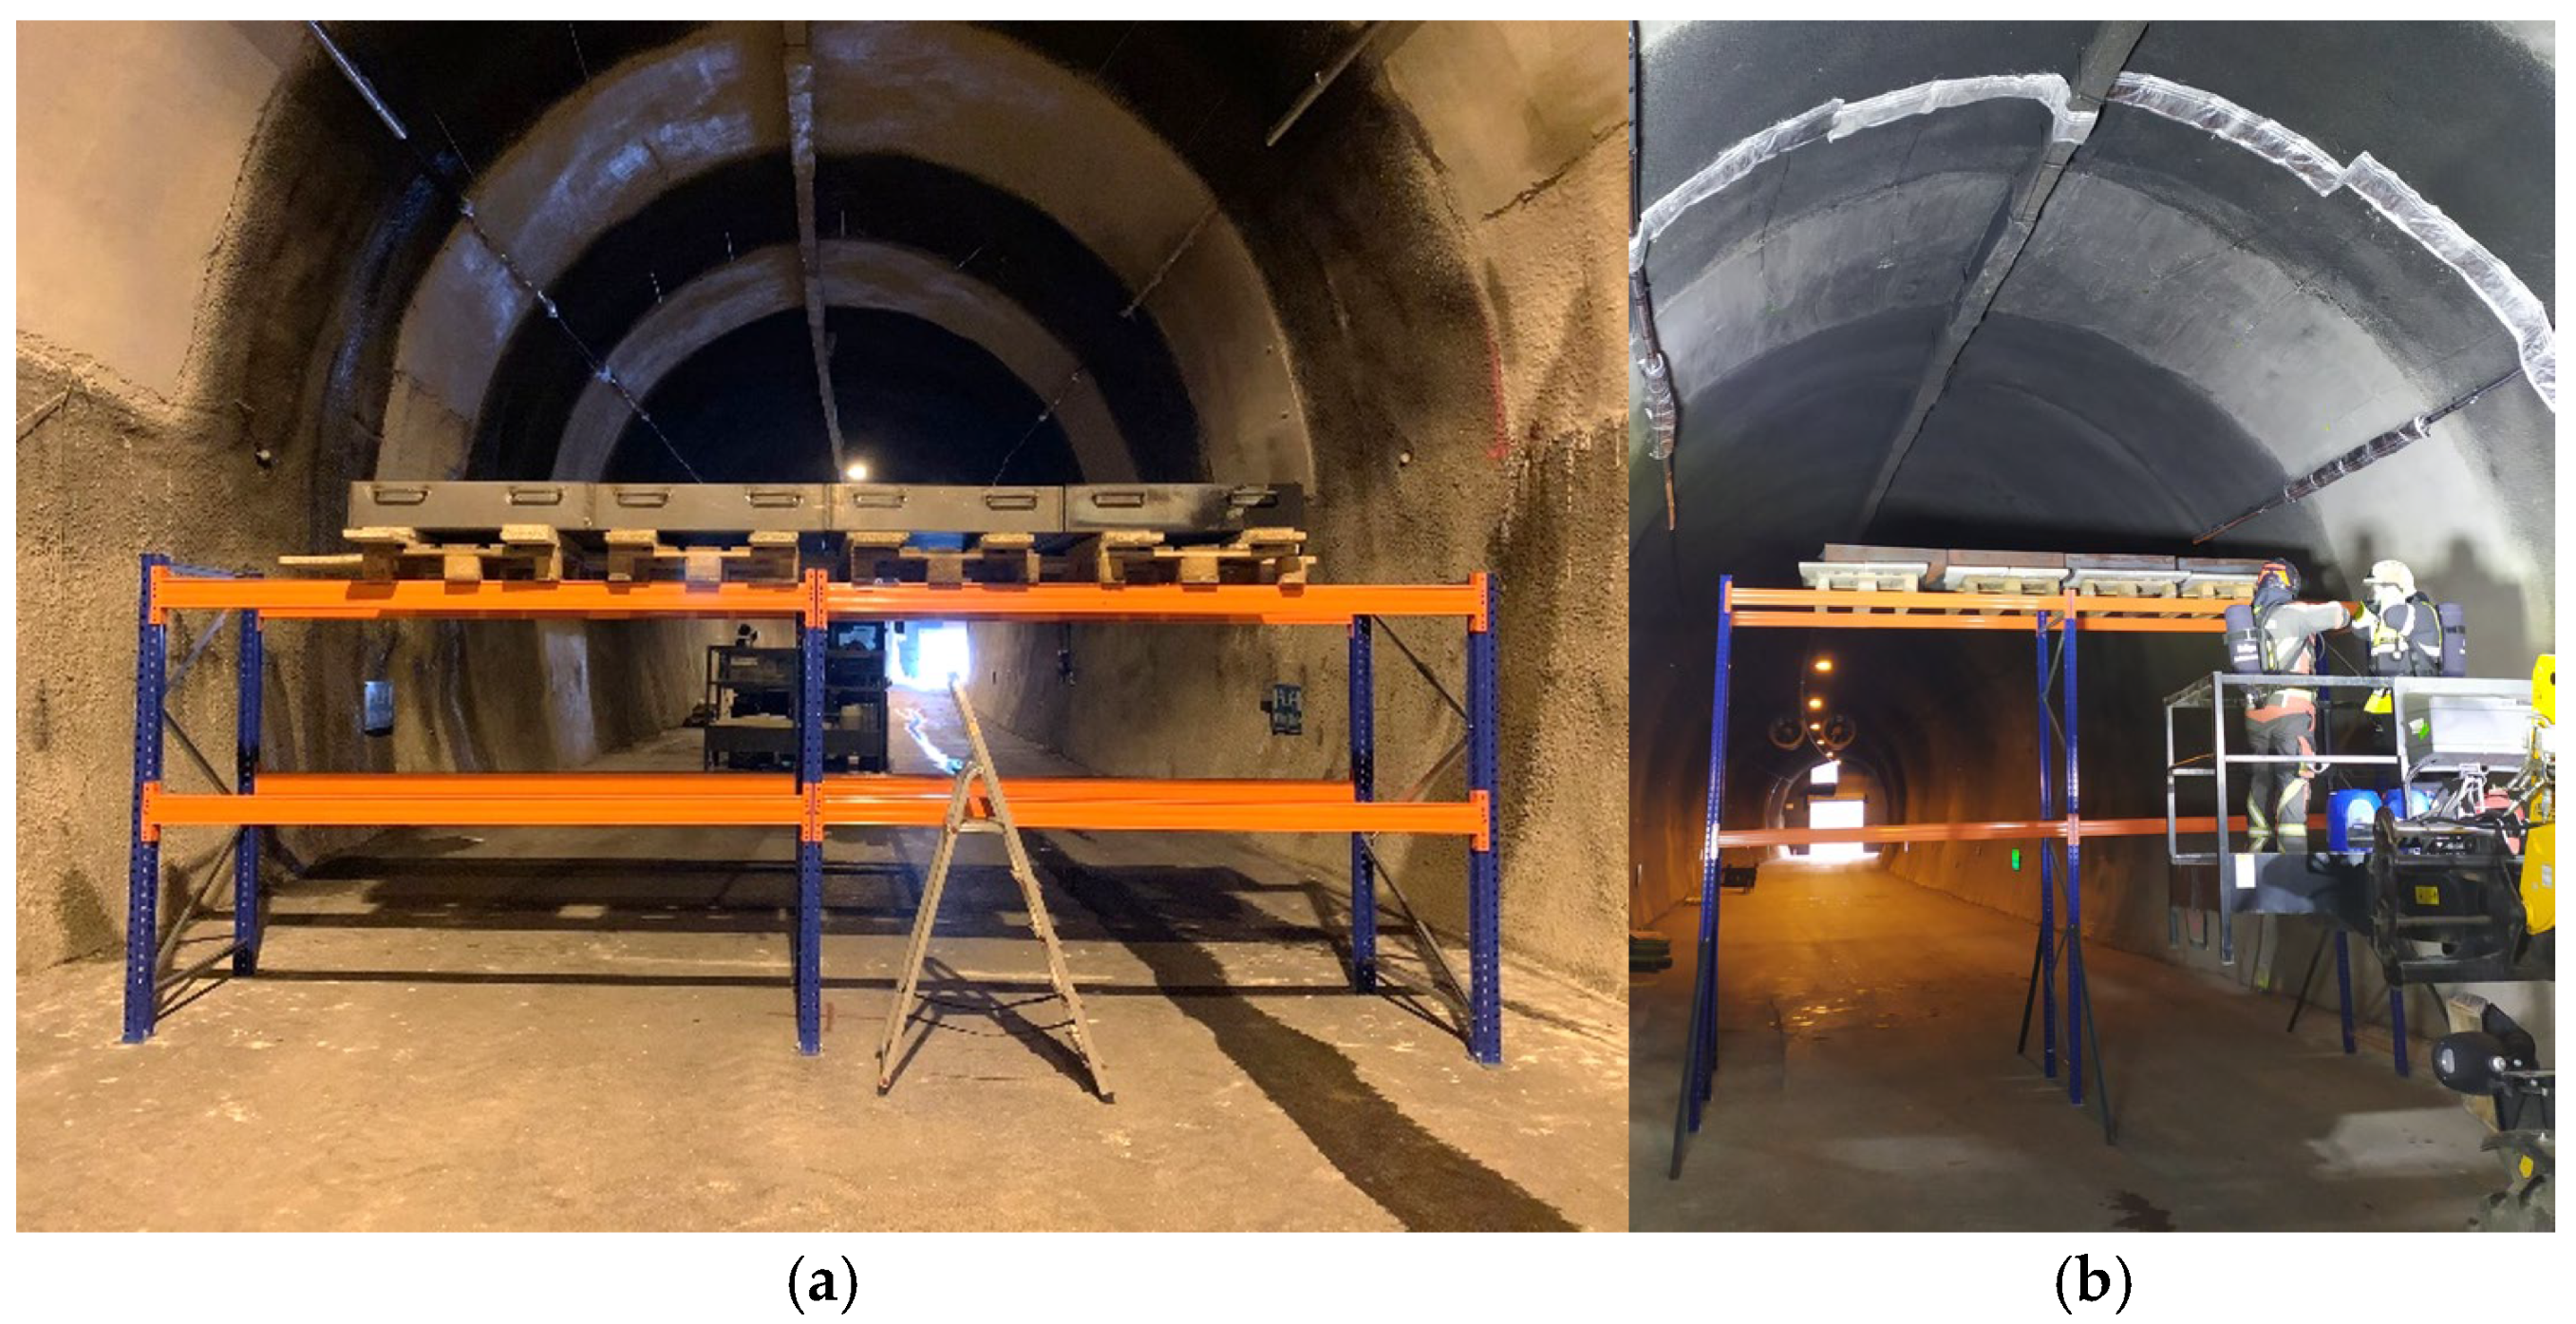
The fuel pans were arranged laterally on an elevated platform positioned 2.1 m above the tunnel floor for Tests 1–3 (Figure 3a) and 4.1 m above the floor for Test 4 (Figure 3b). The two elevations were selected primarily to establish a controlled contrast in source-to-ceiling distance, allowing the effects of plume–ceiling interaction and ventilation-driven redistribution on lining thermal exposure to be examined under an otherwise unchanged fire configuration. Representativeness of a specific vehicle or cargo configuration was considered a secondary factor rather than a direct objective. This arrangement was used to investigate the influence of fire-source elevation on plume development, smoke stratification, and heat transfer to the tunnel lining while maintaining a consistent four-pan fire footprint.
Figure 3.
Fuel pan platform configurations: (a) arrangement at 2.1 m elevation; (b) arrangement at 4.1 m elevation.
The planned maximum fire duration was 30 min; however, the actual burnout time was allowed to develop naturally in each test. Comparisons among tests therefore rely primarily on measured temperature histories and pre-ignition ventilation conditions.
The fire size was defined using a nominal heat release rate (HRR) estimated from liquid-pool burning correlations rather than direct calorimetric measurements, providing a repeatable full-scale fire scenario within the operational and safety constraints of the test facility. For the gasoline–diesel fuel mixture used in the experiments (1:4 by volume), literature values indicate an HRR per unit area of approximately 1600 kW/m2 [46]. Applied to the combined fuel surface area of 4 m2 provided by four 1 m × 1 m pans, this corresponds to a theoretical open-air peak HRR of approximately 6.4 MW. Assuming a combustion efficiency of 0.8, the nominal average HRR used to characterise the experimental fire scenario was approximately 5 MW [1]. This value lies within the range commonly adopted for representative design-fire scenarios in tunnel fire-safety guidance [47]. It should be emphasised that this value represents a nominal estimate rather than a directly measured HRR. Tunnel confinement, radiative feedback from the tunnel lining and smoke layer, interactions between adjacent fuel pans, and ventilation conditions can all influence the burning rate, causing the instantaneous and peak HRR to differ from the corresponding open-air estimate [48].
2.4. Ventilation and Ambient Measurements
Tunnel environmental conditions were monitored using multifunctional hot-wire anemometers equipped with telescopic straight probes. Air velocity, air temperature, and relative humidity in the test area were measured using VelociCalc Air Velocity Meters (models 9545 and 9630; TSI Incorporated, Shoreview, MN, USA). The relevant manufacturer specifications for these instruments are summarised in Table 1 [49,50].
Table 1.
Manufacturer specifications for the VelociCalc models 9545 and 9630.
In the preparatory phase, one-, two-, and four-fan operation modes were evaluated together with the naturally developing airflow under ambient conditions. For the present test series, the nominal ventilation condition for each experiment was established from pre-ignition measurements for the selected fan configuration.
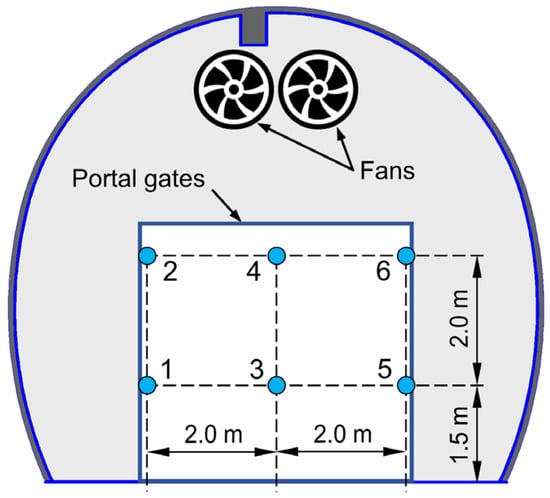
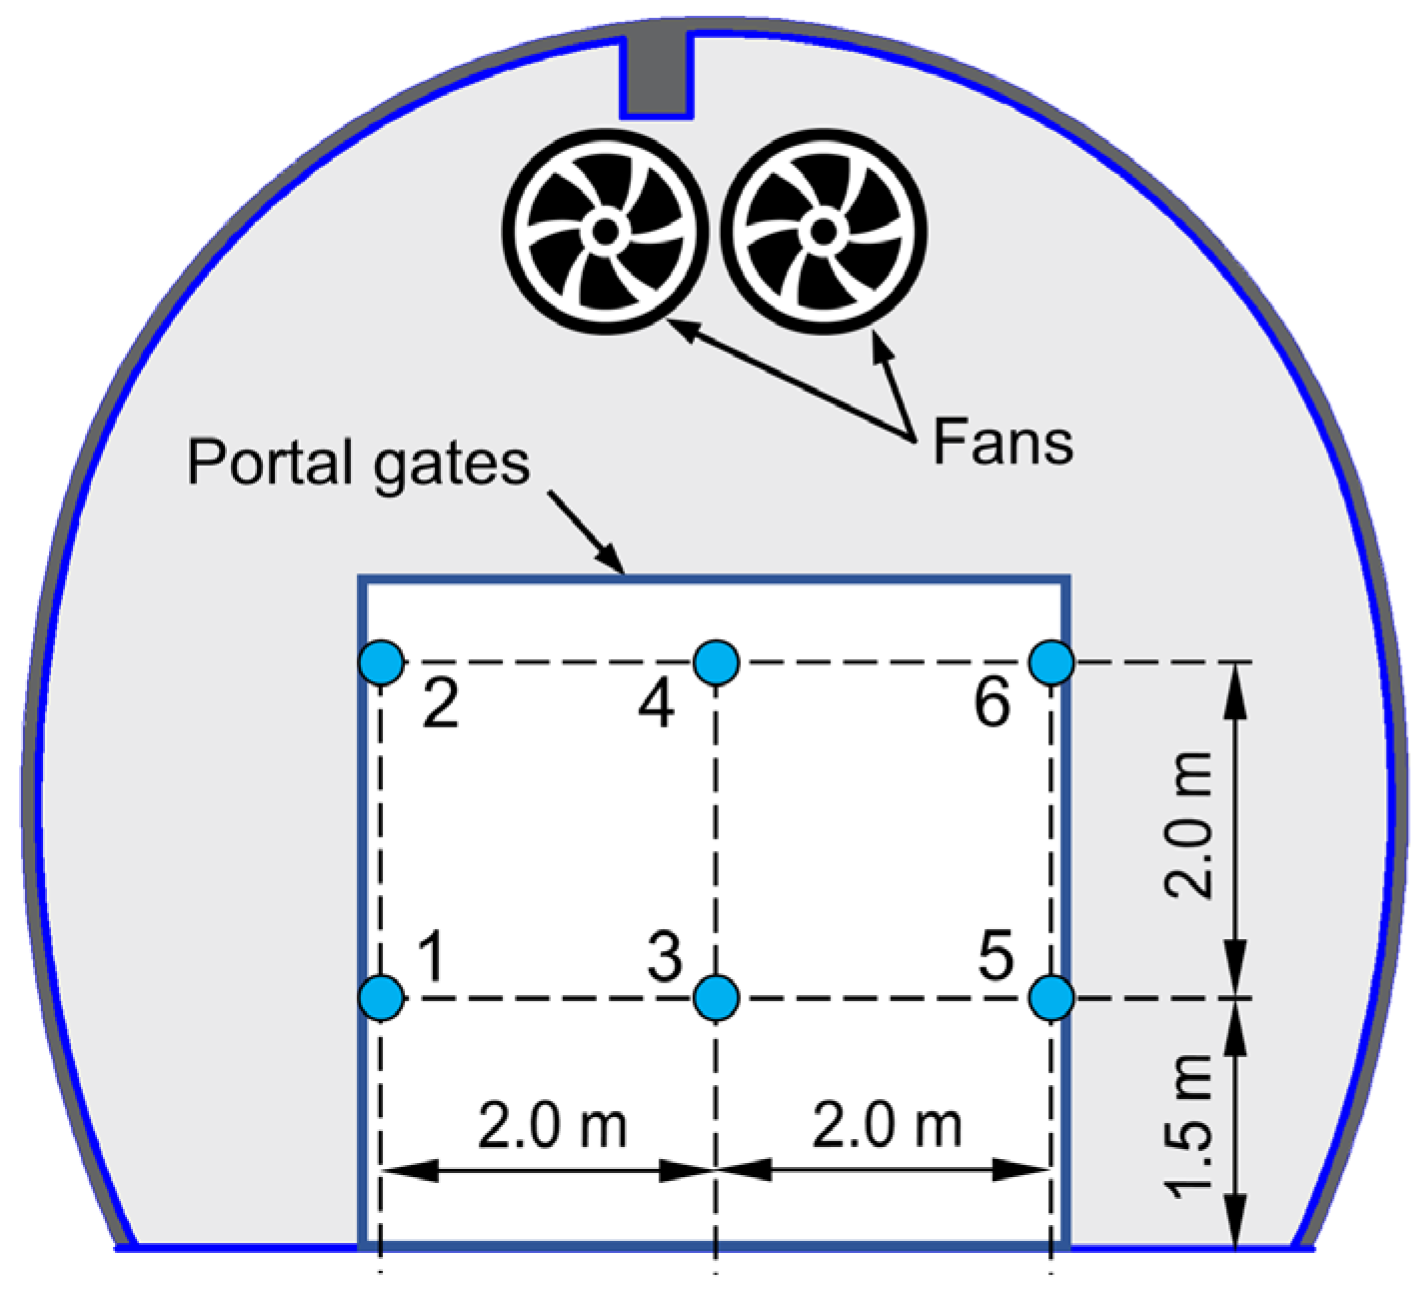
Air velocity was measured at six points across the tunnel cross-section 15 m upstream of the fire location (Figure 4). At each point, the instantaneous signal was recorded and averaged over 10 s. These six measurements were used to characterise the pre-fire ventilation field, and the reported velocity for each test represents the cross-sectional mean value for the selected ventilation condition. The fan settings selected for each test were held constant throughout the corresponding fire experiment.
Figure 4.
Measurement scheme for airflow and environmental parameters.
2.5. Tunnel Lining Protection and Temperature Measurements
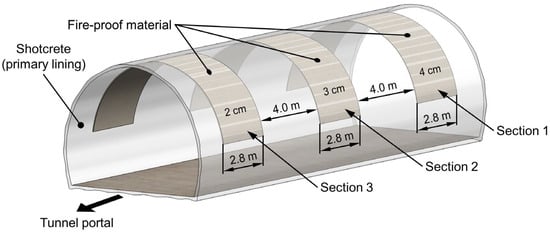
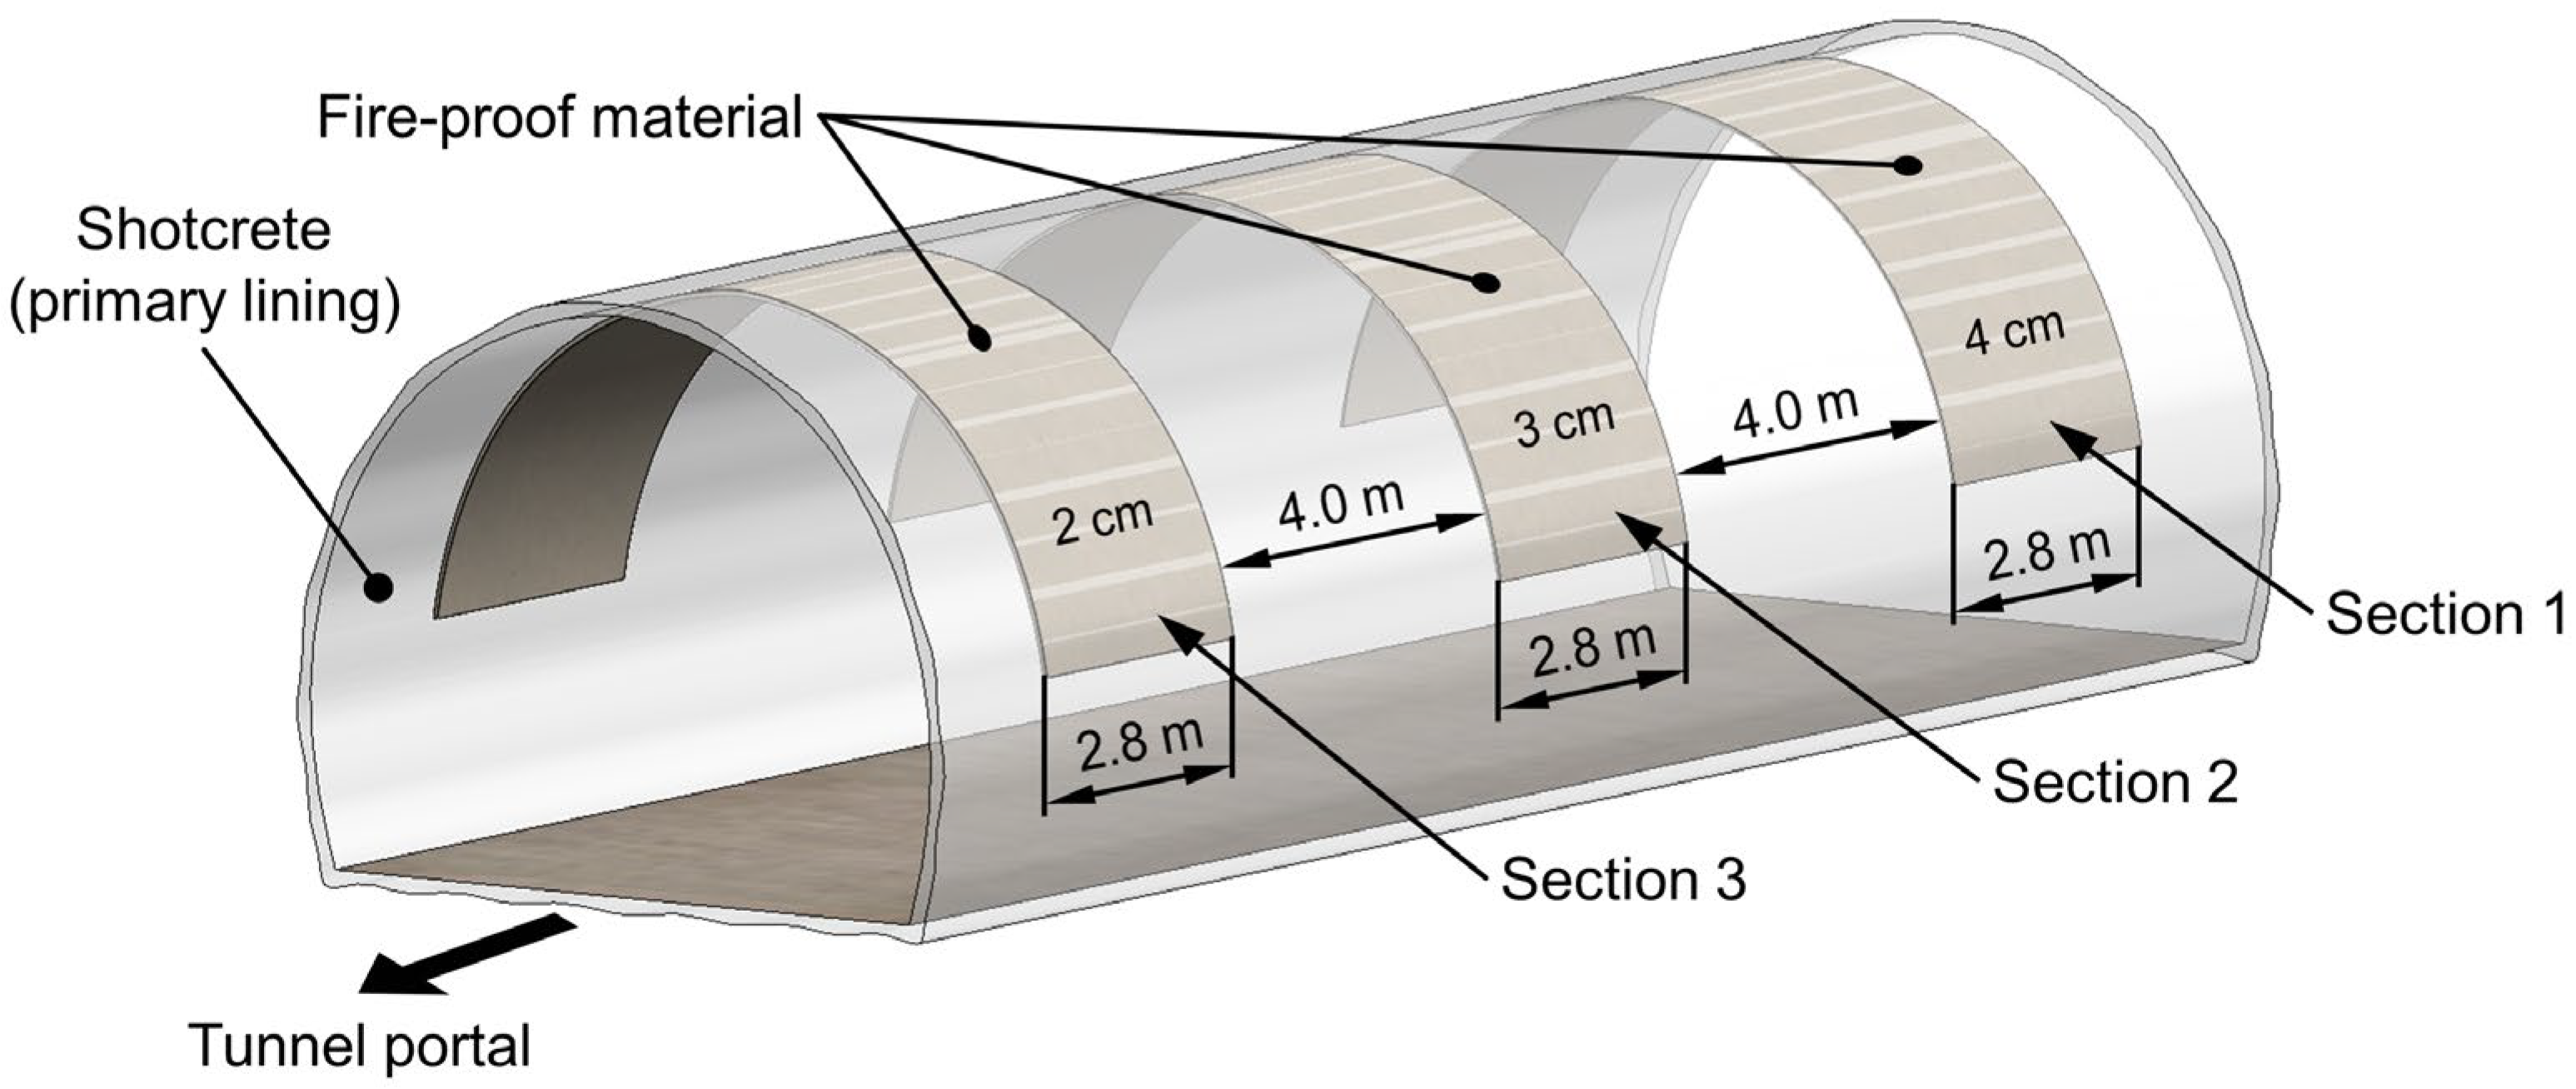
To protect the shotcrete lining from direct fire exposure, fire-resistant plaster (maxit ip 160 T) was applied to the tunnel surface in three test sections with nominal thicknesses of 2, 3, and 4 cm. Each protected section was 2.8 m wide, and adjacent sections were separated by approximately 4 m (Figure 5). These protected sections served as the instrumented measurement locations for the fire tests.
Figure 5.
Test section configuration showing the protected tunnel zones used as instrumented measurement locations.
Surface temperature was measured using eight Type K thermocouples (TC1–TC8) with 3 m Inconel-sheathed probes. The specified measurement range was −40 to 1200 °C, and temperature data were recorded at 10 s intervals with a ScreenMaster RVG200 data logger (ABB Limited, St Neots, UK). For the Type K thermocouple probes, the maximum measurement error is ±1.5 °C over the temperature range −40 to 375 °C and ±0.4% over the range 375 to 1200 °C [51].
The thermocouples were installed with the sheath aligned horizontally along the plaster surface. Each sensor was fixed with U-shaped clamps so that the 3 mm-diameter sheath remained partially embedded in the plaster. The embedment depth was approximately half the sheath diameter (about 1.5 mm), with the remaining half exposed above the surface. This mounting method was used consistently in all tests.
Surface-temperature patterns were also examined using a Dräger UCF 6000 thermal imaging camera (Drägerwerk AG & Co. KGaA, Lübeck, Germany) and a Circle-Beam infrared thermometer (TFA Dostmann GmbH & Co. KG, Wertheim, Germany), but these instruments were used only for qualitative interpretation. The embedded thermocouples provided the primary quantitative temperature dataset used in the analysis.
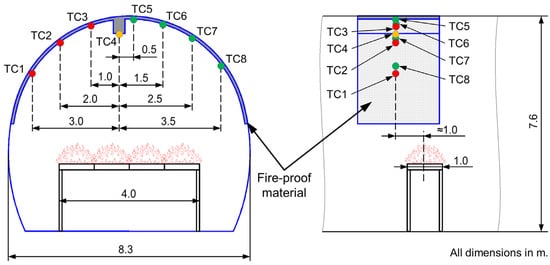
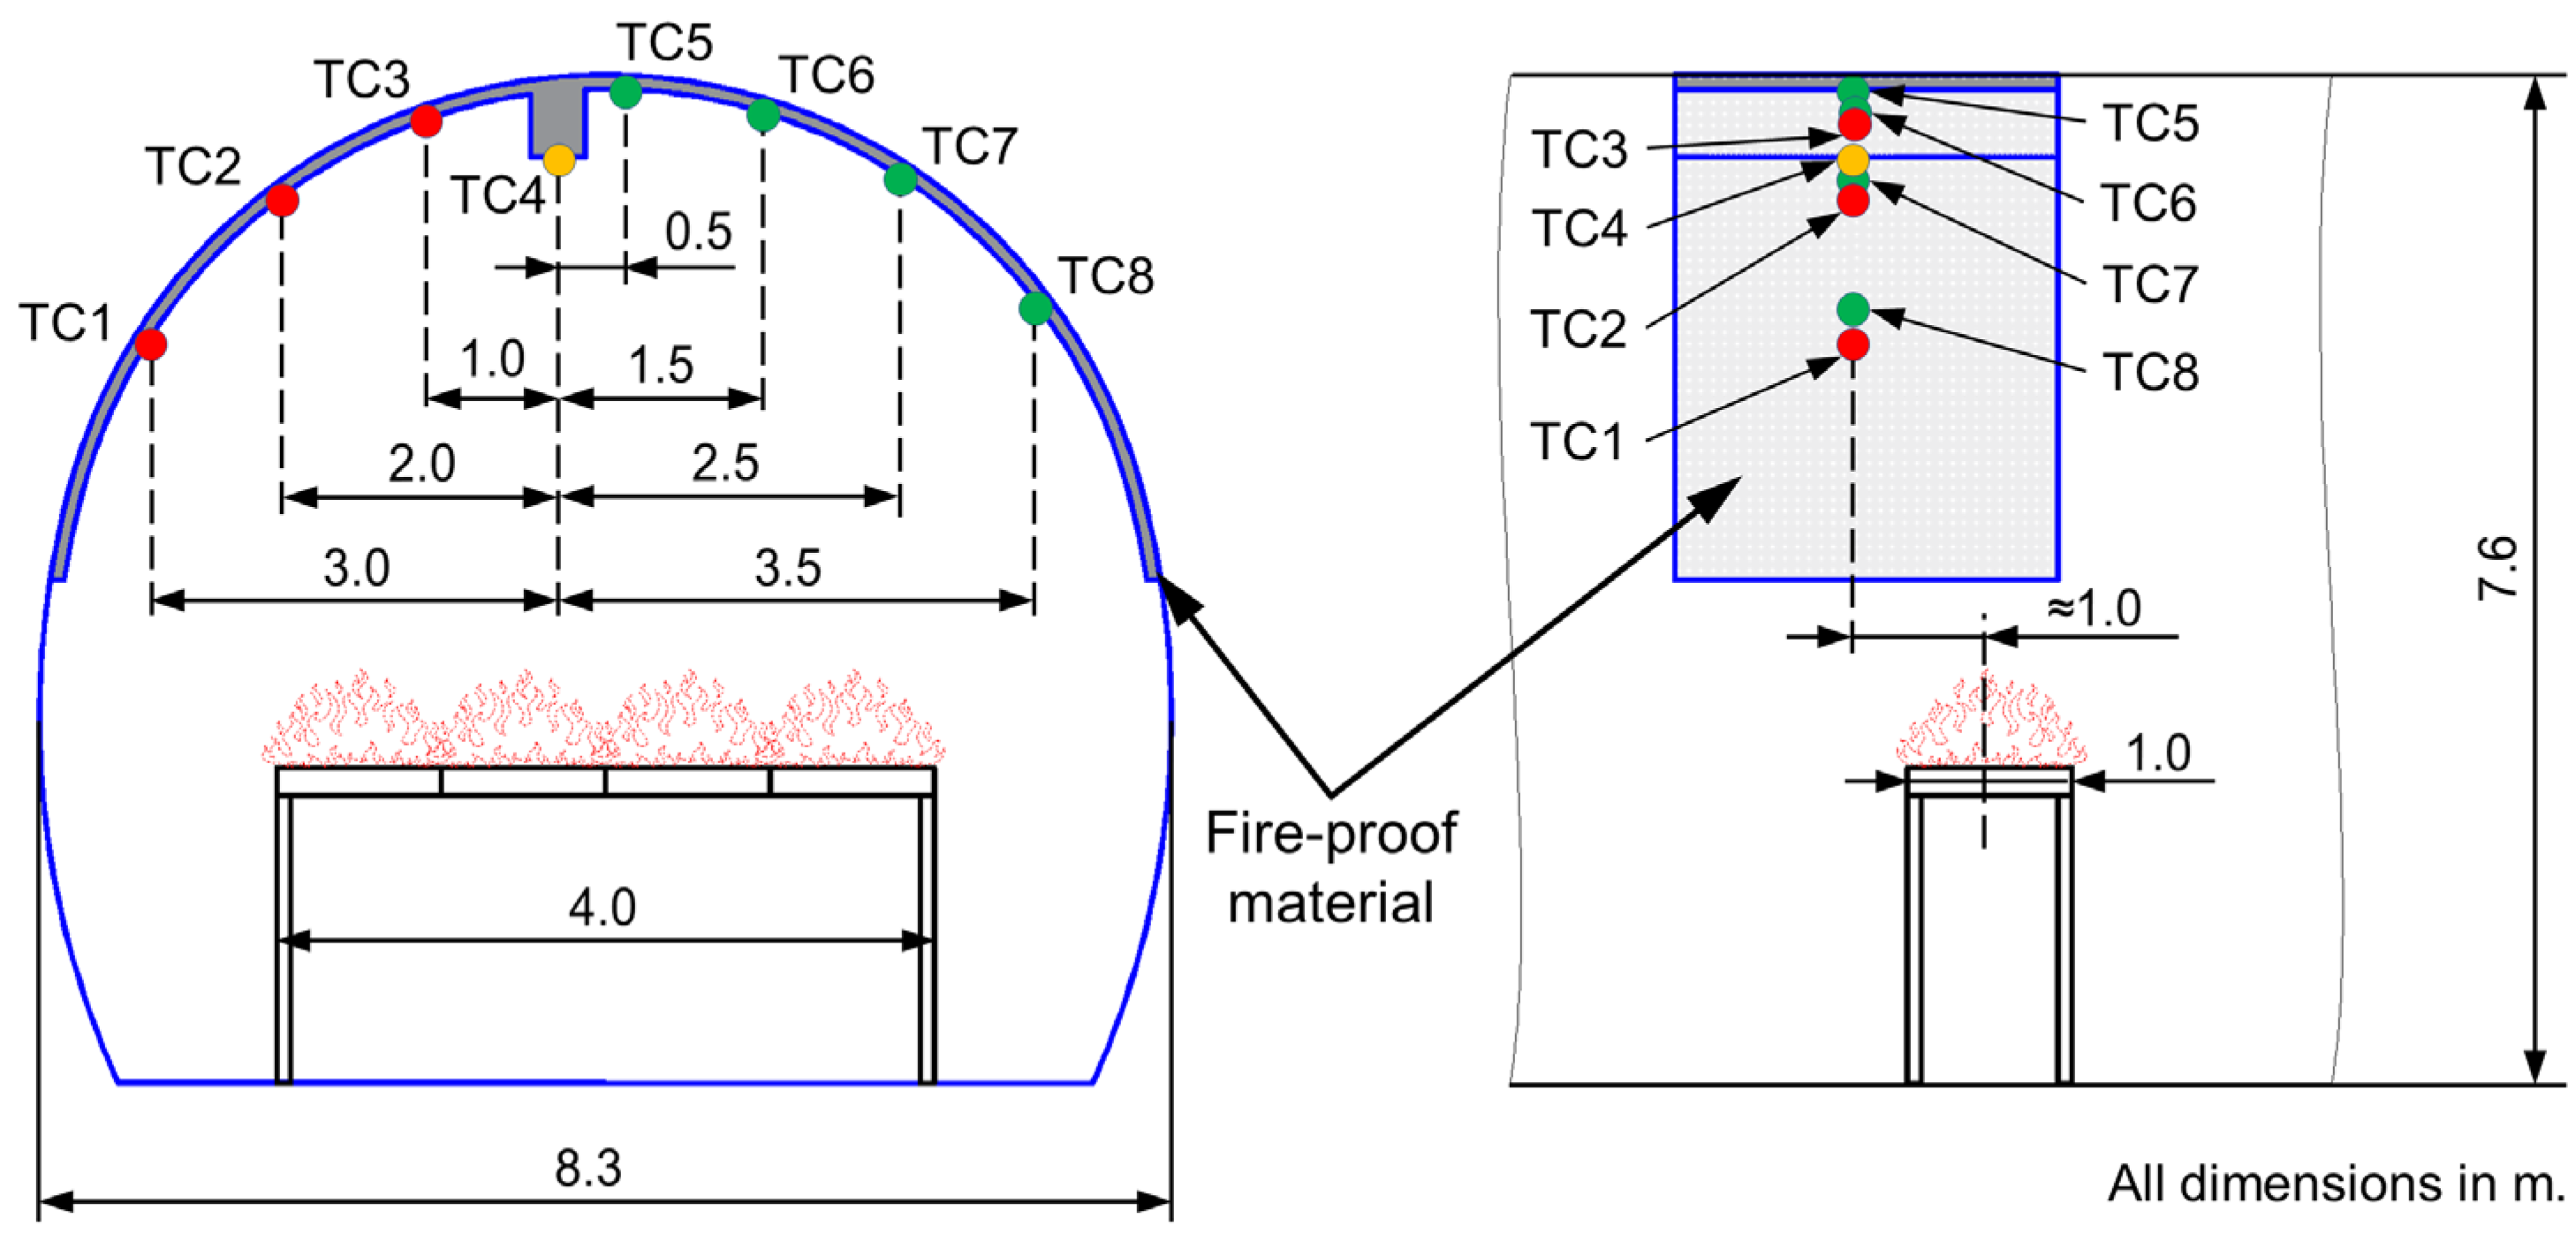
The ceiling-thermocouple location was selected on the basis of published tunnel-fire studies and preliminary tests. Previous work has shown that tunnel fires often create an extended ceiling region with relatively small longitudinal temperature variation beyond the immediate plume-impingement zone [1,6,11]. In the present configuration, the source consisted of four laterally arranged pans elevated above the floor, leaving an unobstructed pathway for longitudinal airflow beneath the fire. Published studies indicate that such elevated and laterally distributed sources can broaden the ceiling-temperature field and shift the region of near-maximum temperature slightly downstream [25,30]. Preliminary tests were therefore conducted with thermocouples placed above the burner centreline and at 0.5 m intervals downstream. The observations indicated that comparable peak temperatures occurred over an extended downstream distance once the sensors were positioned slightly beyond the immediate plume-impingement zone. On that basis, the measurement cross-section for the main tests was placed approximately 1 m downstream of the burner centreline. Within that cross-section, eight points were distributed across the upper tunnel surface on the fire-protection layer according to the fixed layout shown in Figure 6. Exact Cartesian coordinates were not surveyed separately for each point; the layout schematic defines the measurement positions used consistently in all experiments.
Figure 6.
Layout of thermocouple measurement points on the tunnel lining surface.
2.6. Test Matrix and Experimental Variables
Table 2 summarises the eight full-scale tests and their principal configurations. Each row represents one experiment. The suffixes “A” and “B” denote the lower- and higher-ventilation configurations, respectively, within a given test pair.
Table 2.
Summary of full-scale fire tests and principal configurations.
2.7. Thermal Exposure Integral Metric
Structural thermal exposure in this study is interpreted as the combined effect of the fire characteristics, including nominal fire size and source elevation, and the smoke-control conditions imposed by longitudinal ventilation. These factors jointly determine not only the peak lining temperature but also the duration and spatial distribution of heating. To complement the qualitative interpretation of the temperature histories, thermal exposure was quantified using baseline-corrected temperature–time integrals, which capture both the intensity and duration of heating and provide a quantitative basis for comparing tests with different temporal evolutions [52,53].
For each thermocouple (; ), the individual temperature–time integral was calculated as:
where is the measured surface temperature at thermocouple , is the initial baseline surface temperature recorded at the same thermocouple location prior to ignition, and and are the start and end times of the fire-exposure period.
The mean thermal exposure per thermocouple for a given test was then calculated as:
The cumulative cross-sectional thermal exposure, representing the total thermal loading across all measurement points in the instrumented cross-section, was calculated as:
Finally, the duration-normalised thermal exposure index expresses the cumulative exposure per unit fire duration, allowing comparison between tests of different lengths:
These four metrics—individual, mean, cumulative, and duration-normalised thermal exposure—are reported and used throughout Section 3.3 to compare thermal severity across tests.
3. Results and Discussion
3.1. Tunnel Ambient and Ventilation Conditions
Ambient conditions inside the tunnel remained relatively stable throughout the experimental campaign, with moderate variations in air temperature and relative humidity between test days (Table 3). These parameters define the initial environmental and thermal boundary conditions at the lining surface prior to fire exposure and provide the reference state for interpreting subsequent temperature evolution.
Table 3.
Tunnel ambient measurement results.
Measurements of lining surface temperature indicated near thermal equilibrium between the fire-protection layer and the shotcrete wall prior to testing. On the first test day, the shotcrete surface averaged 9.0 °C and the fire-protection layer 9.7 °C. During the second and third test days, the temperature difference decreased to approximately 0.3 °C, while on the fourth test day the plaster temperature (about 7.7 °C) was slightly lower than the shotcrete wall temperature of 8.2 °C, confirming near-uniform initial thermal conditions across the lining system.
A series of ventilation tests was conducted to evaluate airflow conditions within the tunnel section under different ventilation-unit configurations. The primary distinction among the ventilation conditions was that, during the first test, the naturally occurring airflow was directed into the tunnel from the portal, whereas in subsequent tests the natural flow was directed outward. A summary of the mean velocities based on six measurement points within the evaluated ventilation modes is presented in Table 4.
Table 4.
Airflow measurement results within the tunnel.
For the main fire tests, two ventilation modes were used to represent different airflow intensities within the tunnel system. In the first configuration, two fans in the Northern Road Tunnel were operated, whereas the second configuration used four fans (full ventilation mode), with two in the Northern tube and two in the Western tube; these are designated A and B, respectively. This arrangement enabled a controlled comparison of distinct ventilation regimes and their influence on the thermal loading of the fire-protection layers, providing a consistent basis for evaluating thermal response under varying airflow conditions.
3.2. Thermal Response Under Baseline and Modified Source Configurations
The fire-test results are presented first for the baseline configuration with a source elevation of approximately 2.1 m and then for the modified configuration with the elevated source at 4.1 m. Within the baseline configuration, the three cross-sections are treated as successive test locations under the same nominal fire arrangement and two ventilation regimes. This structure highlights the effect of ventilation within a common source configuration before addressing the influence of source elevation.
3.2.1. Baseline Configuration (2.1 m Source Elevation)
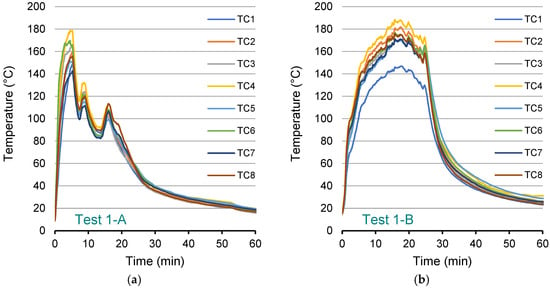
Cross-section 1 (Tests 1-A and 1-B). The initial two tests of the baseline configuration were conducted at cross-section 1. Four fuel pans containing a premixed gasoline–diesel fuel were arranged in a row on a platform positioned 2.1 m above the tunnel floor. Longitudinal ventilation was provided by two operating fans in Test 1-A and four operating fans in Test 1-B, thereby establishing two distinct ventilation regimes that governed smoke transport, plume inclination, and heat transfer to the tunnel lining. The experiments were designed to produce a nominal 30-min pool fire based on the prescribed fuel load distributed among the four pans. In practice, the duration of sustained burning varied between tests because fuel consumption was not uniform across the pans. Differences in pan geometry and deformation during heating led to uneven fuel distribution and nonsimultaneous burnout. Consequently, individual pans ceased sustained flaming at different times, resulting in a gradual reduction in the total burning surface area rather than abrupt extinction of the fire source. Fire extinction was judged by combined visual observation and thermal measurements, specifically when visible flaming had diminished to a negligible level and the lining-temperature response entered sustained decay. Under this definition, the fire ended at approximately 29 min in Test 1-A and 27 min in Test 1-B. The fire development therefore comprised an initial fully developed multi-pan burning phase followed by a decay phase characterised by progressive reduction in burning area and heat release rate.
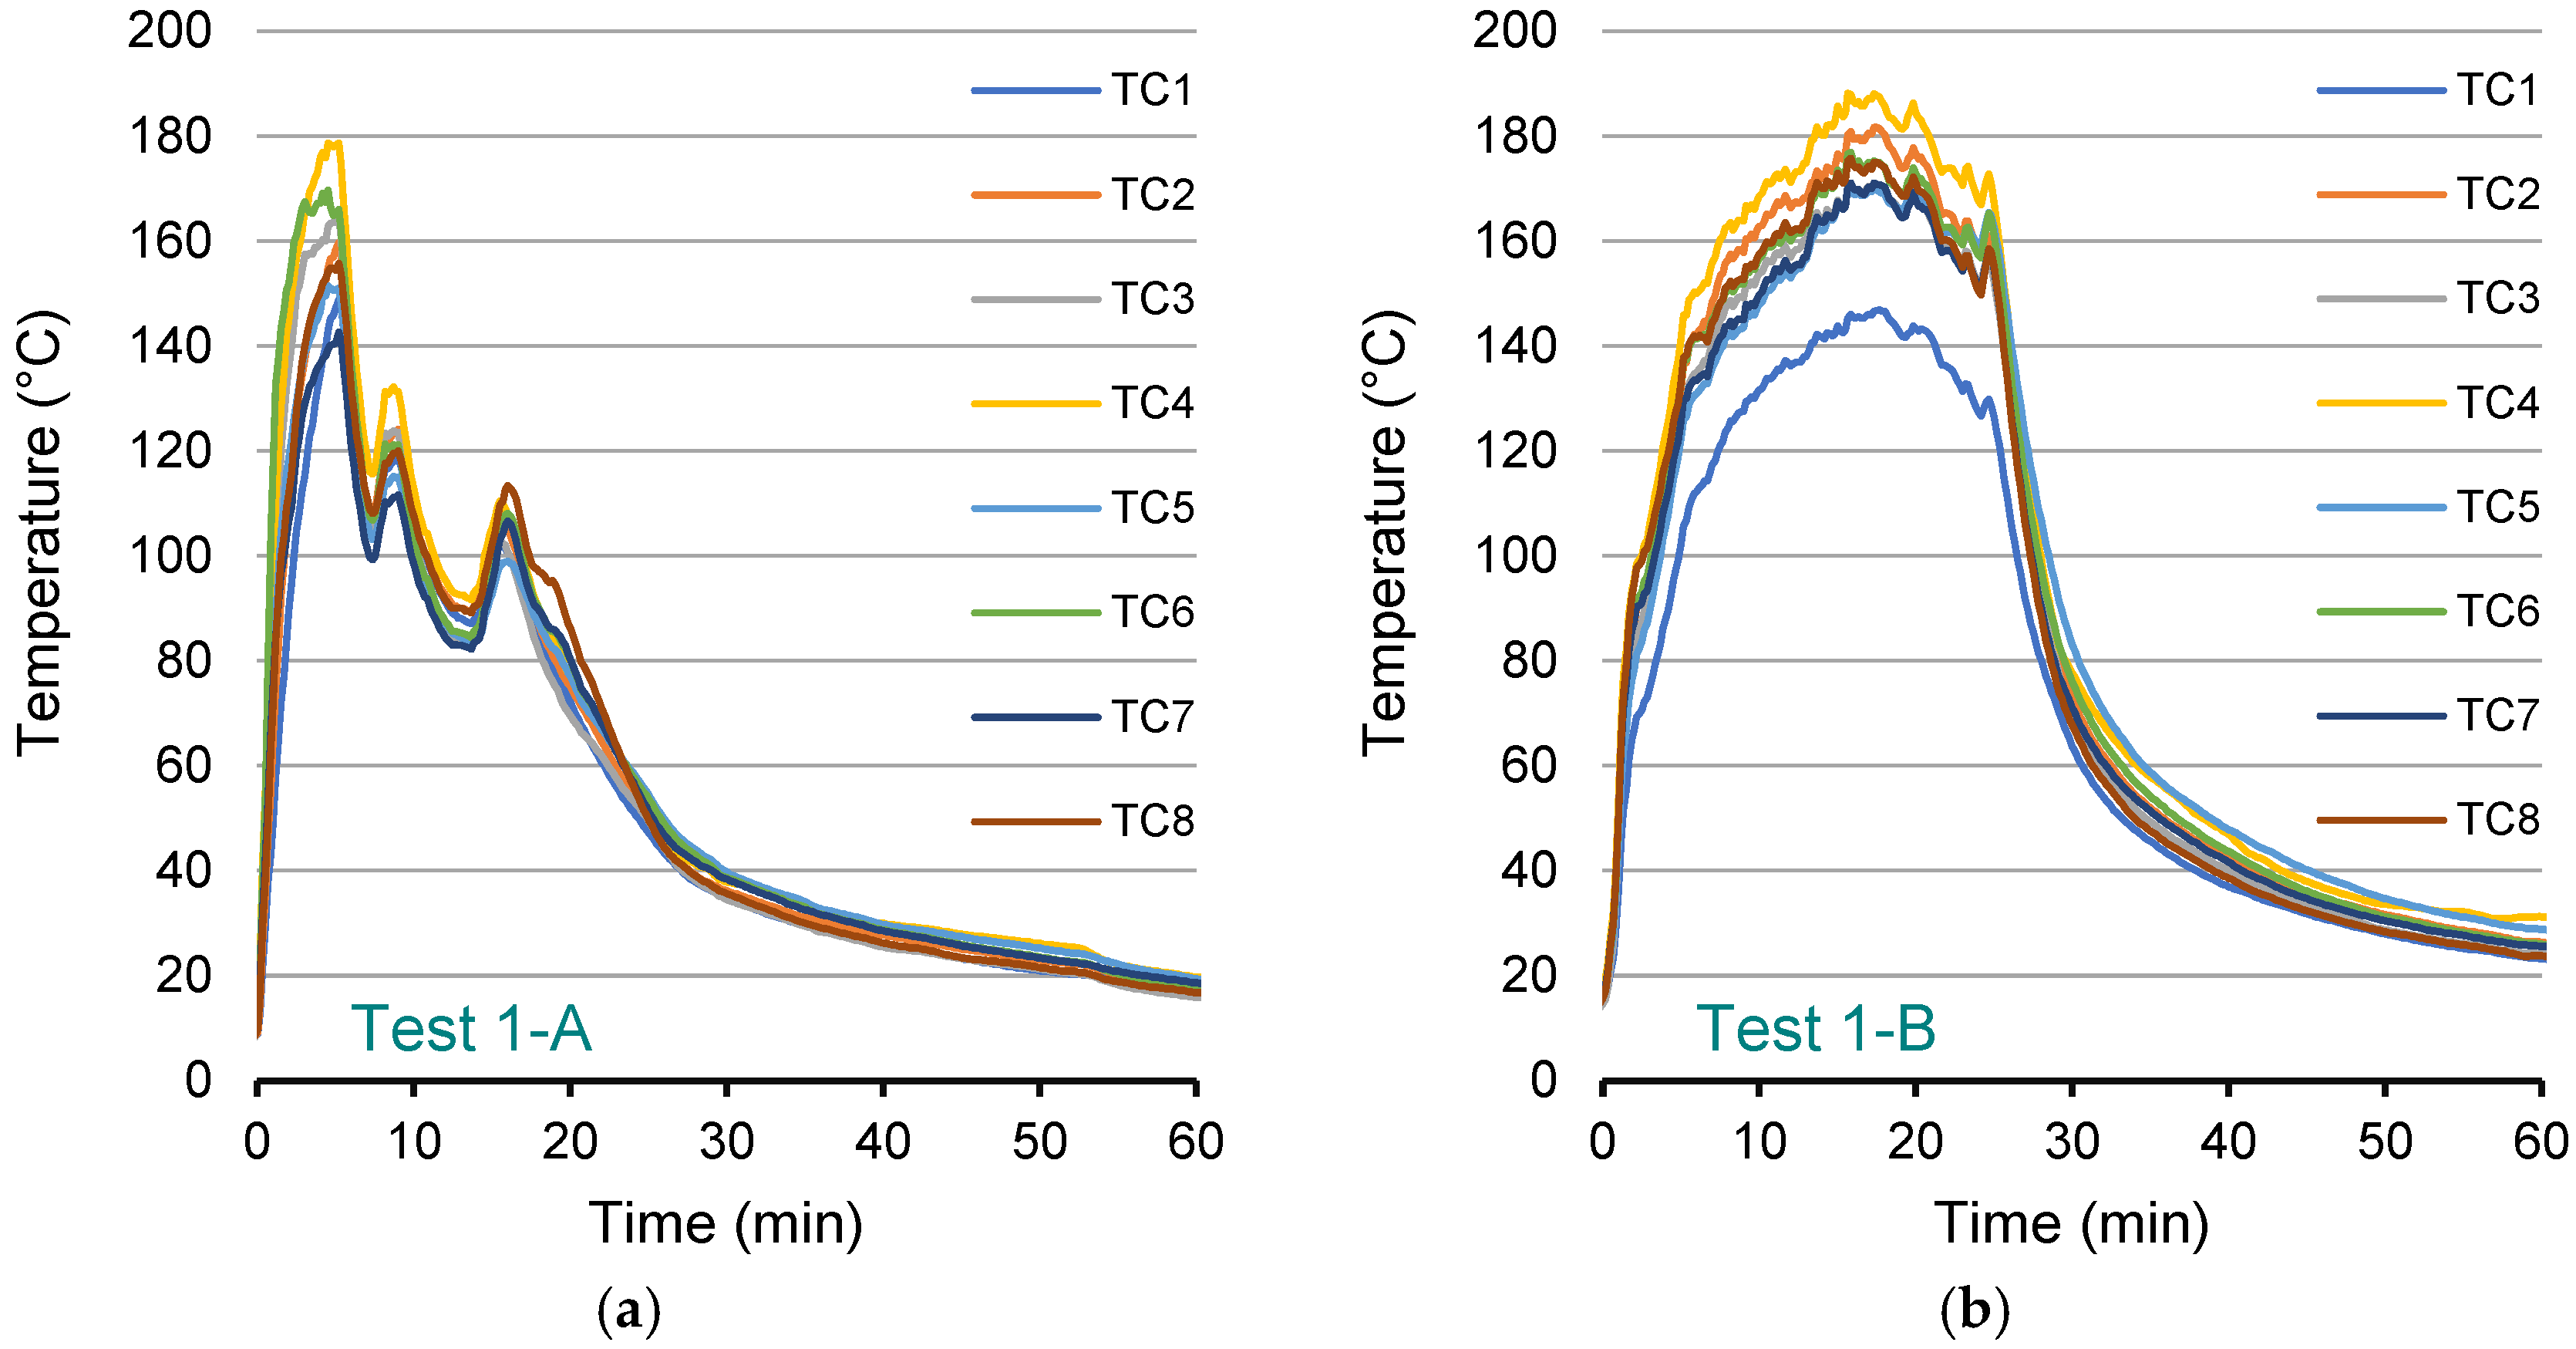
Temperature data recorded by eight thermocouples installed on the tunnel surface are presented in Figure 7 for both ventilation conditions. The measurements capture the thermal response of the tunnel lining throughout the sustained burning phase and the subsequent cooling period, enabling comparison of ventilation-influenced thermal exposure.
Figure 7.
Surface temperatures of the tunnel lining in cross-section 1: (a) Test 1-A, two-fan ventilation (0.91 m/s); (b) Test 1-B, four-fan ventilation (1.98 m/s).
In both tests, surface temperatures rose rapidly after ignition, reflecting flame spread across the fuel pans. Peak values were reached within approximately 5–6 min in Test 1-A, whereas in Test 1-B, peak temperatures occurred later, at approximately 15–18 min, indicating a delayed thermal response under increased ventilation. In Test 1-A, maximum temperatures ranged from 149 (TC1) to 179 °C (TC4), whereas in Test 1-B a broader range of 147–188 °C was recorded. TC4, located on the fire-protection layer beneath the tunnel ceiling near the centre of the cross-section, recorded the highest peak temperatures due to its proximity to the fire source and the rising flames. Following the initial rise in Test 1-A, the curves exhibit short-term fluctuations during the fully developed phase, which are consistent with transient variations in flame attachment and plume impingement potentially associated with ventilation-driven flow dynamics. In contrast, the temperature curves in Test 1-B display a more sustained plateau near peak values, indicating prolonged and more stable thermal exposure during the active burning phase. Thereafter, temperatures gradually decrease in line with progressive fuel burnout in both cases. By the end of the 60-min recording period, temperatures in both tests approached near-ambient conditions.
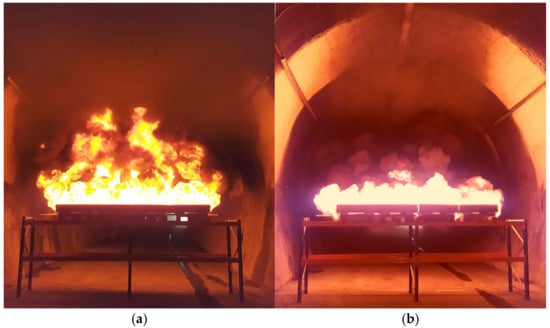
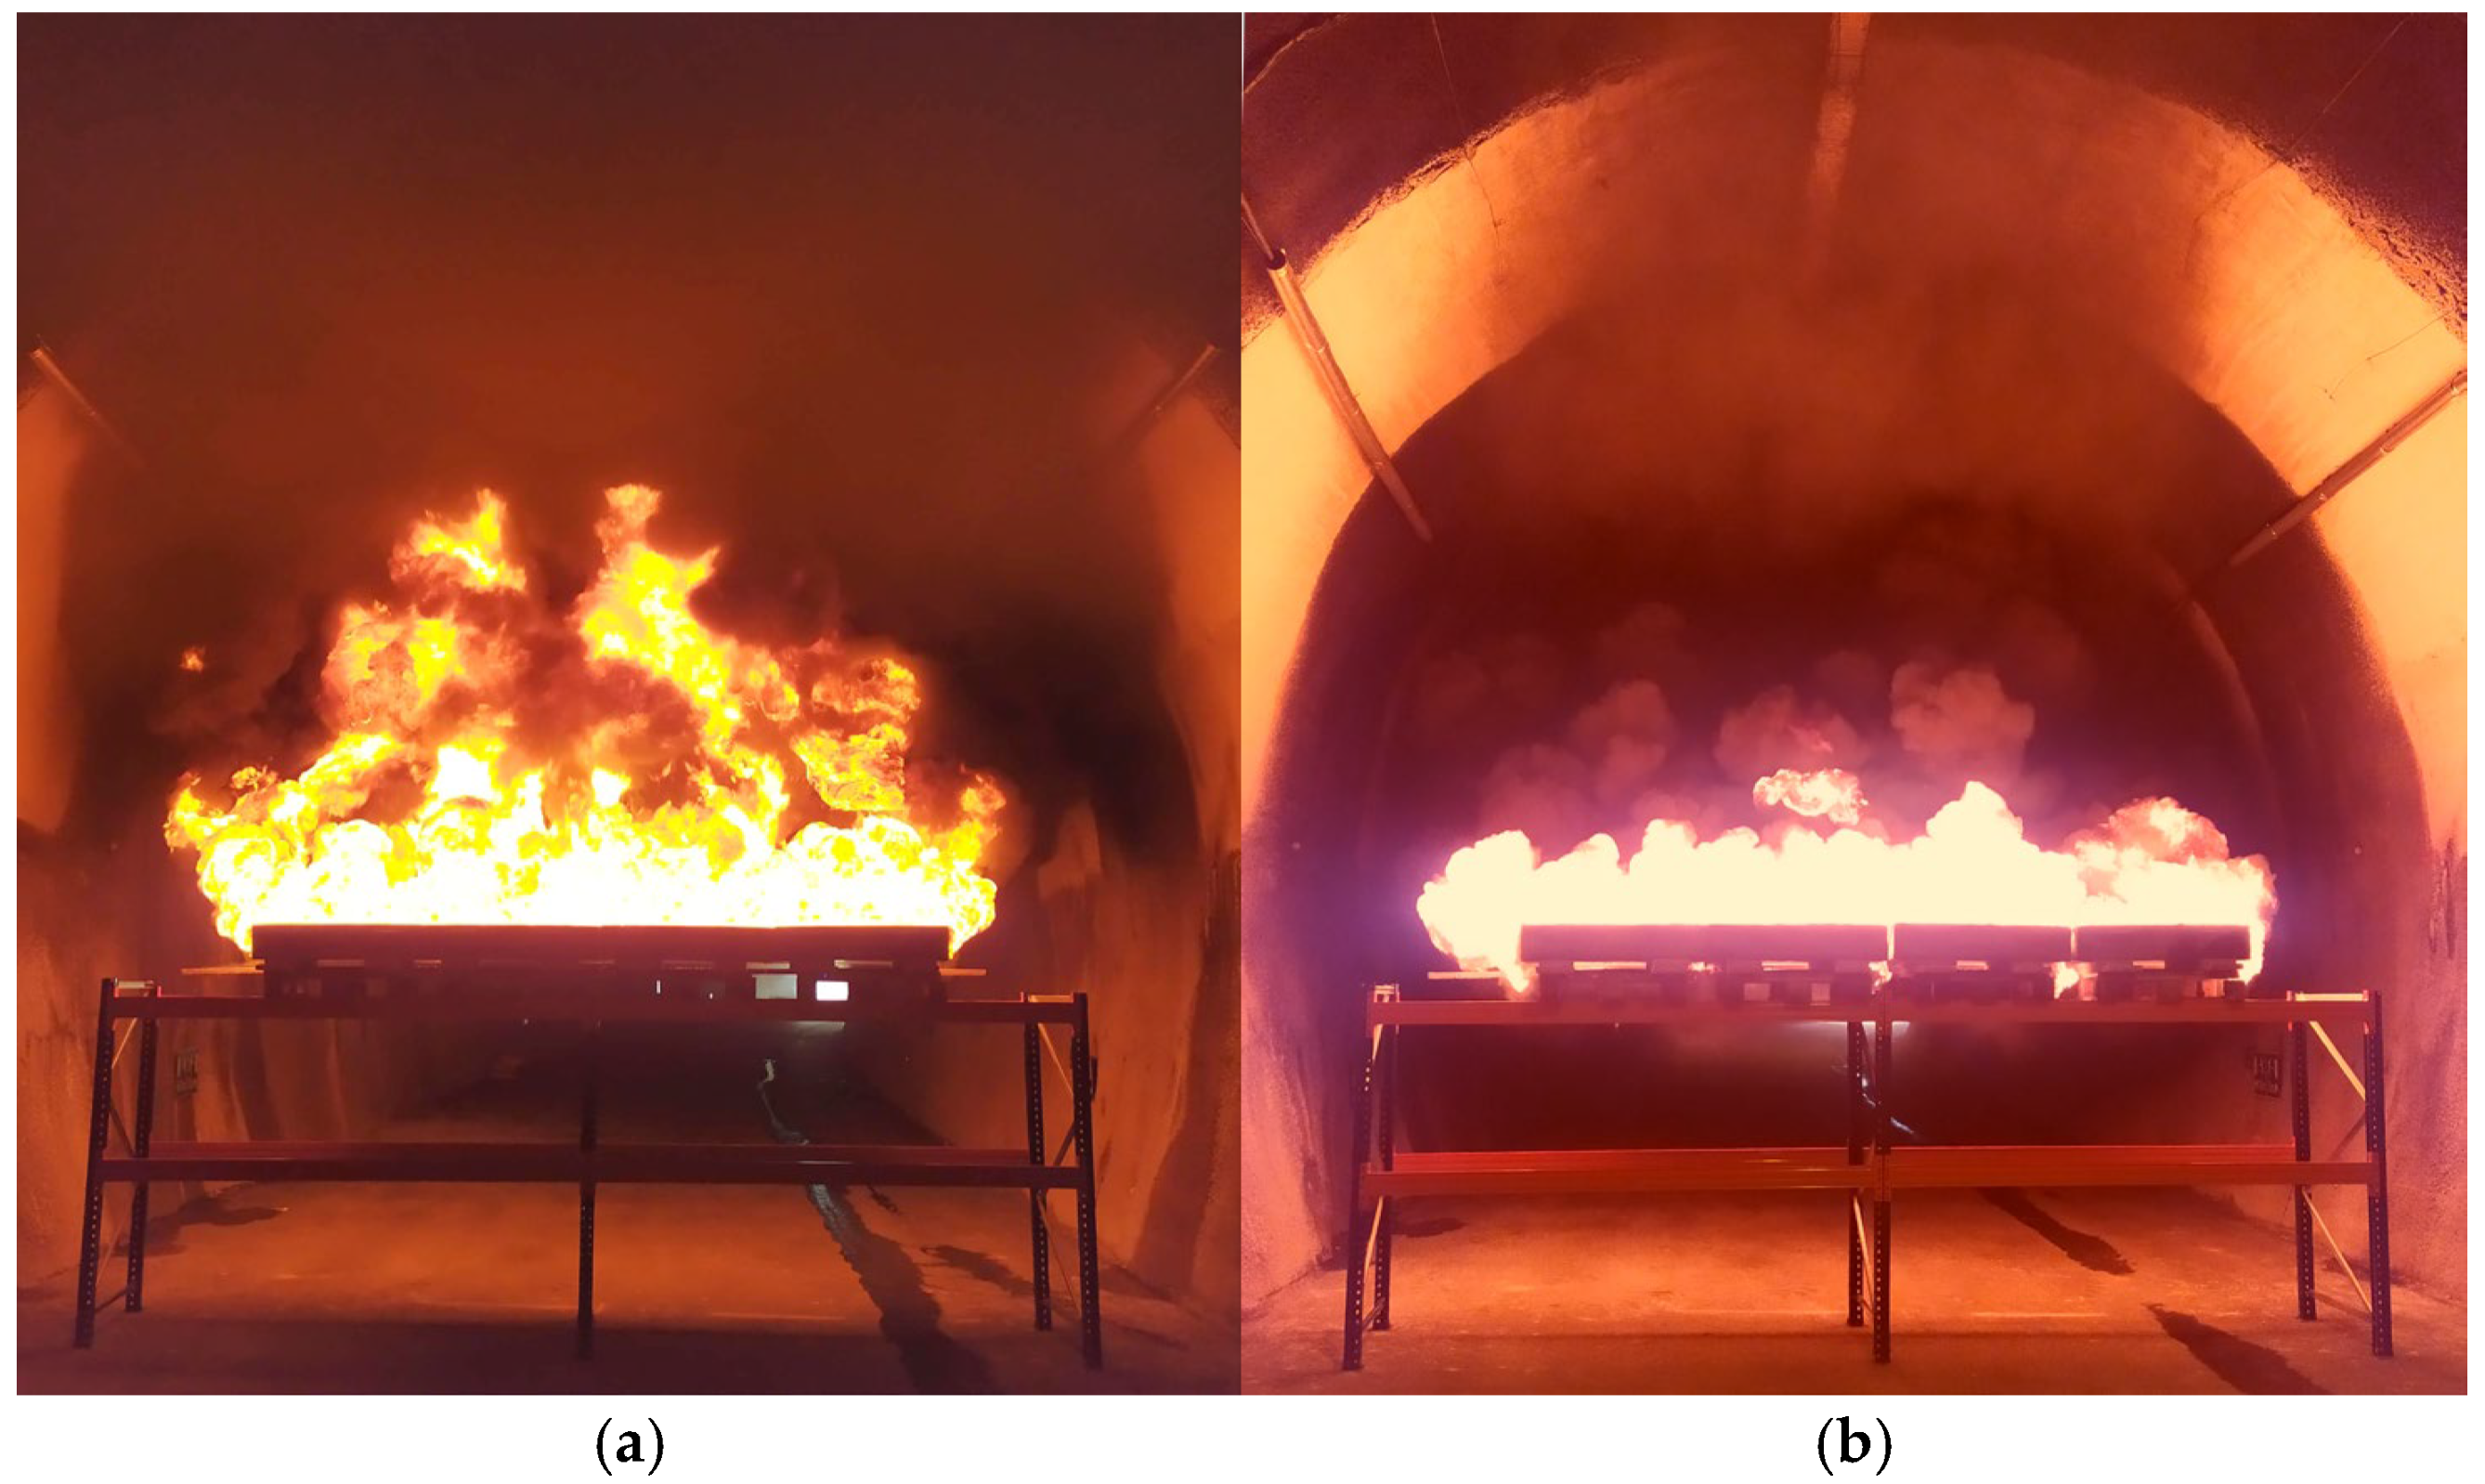
Differences in the temperature evolution between the two tests are interpreted primarily in relation to ventilation conditions. Rapid flame spread occurred shortly after ignition in both tests, with slightly delayed development in Test 1-B, consistent with enhanced convective cooling and modified flame attachment under higher longitudinal airflow. The photographs shown in Figure 8, taken approximately 2 min after ignition, capture the early stage of fire development under the respective ventilation conditions and provide visual context for the observed thermal behaviour. In Test 1-A, the lower airflow rate allowed smoke to accumulate around the fire source (Figure 8a), resulting in limited flame inclination and intense smoke production with propagation in both upstream and downstream directions. In Test 1-B, increased airflow enhanced smoke removal from the vicinity of the fire source (Figure 8b) and resulted in a more pronounced flame inclination in the direction of the ventilation flow, with the plume predominantly directed towards the tunnel portal. Nevertheless, back-layering remained observable, although with reduced intensity compared to Test 1-A.
Figure 8.
Flame and smoke behaviour in cross-section 1: (a) Test 1-A; (b) Test 1-B.
It should be noted that the elevated platform configuration further influenced this behaviour. The supporting structure allowed a portion of the longitudinal airflow to pass beneath the fuel pans, where it interacted with and was partially deflected by the rising plume. This sub-plume flow redirection altered the local momentum balance between buoyancy-driven and ventilation-driven flow, affecting plume inclination, ceiling-jet development, and the downstream distribution of hot gases. Consequently, the observed differences in temperature evolution reflect not only ventilation intensity but also the geometric coupling between source elevation and airflow redistribution.
Radiative heat transfer is a dominant mechanism in flames with characteristic dimensions exceeding 0.2 m [54]. The experimental conditions fall within this regime, where thermal radiation governs energy exchange between the fire and surrounding tunnel surfaces. Radiative transfer occurs through emission and absorption by bounding surfaces and by participating combustion products, particularly water vapour and carbon dioxide, which exhibit strong radiative properties within the wavelength range of 1 to 100 μm [54]. These gases are principal products of gasoline–diesel combustion. Under enhanced ventilation in Test 1-B, reduced smoke shielding likely allowed more direct radiative interaction between the flame and tunnel lining, which is consistent with the generally higher and more sustained surface temperatures. Conversely, in Test 1-A, partial smoke accumulation likely increased radiative attenuation, moderating the net incident heat flux at the lining surface despite comparable fuel loads.
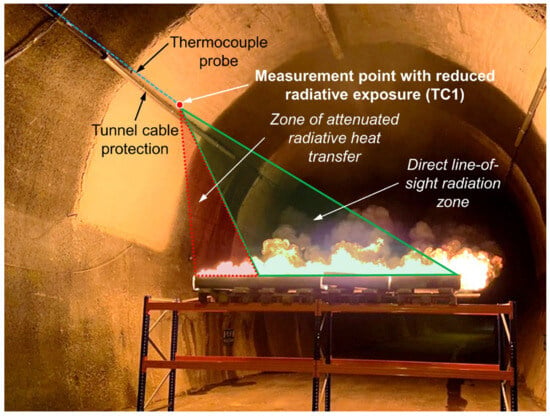
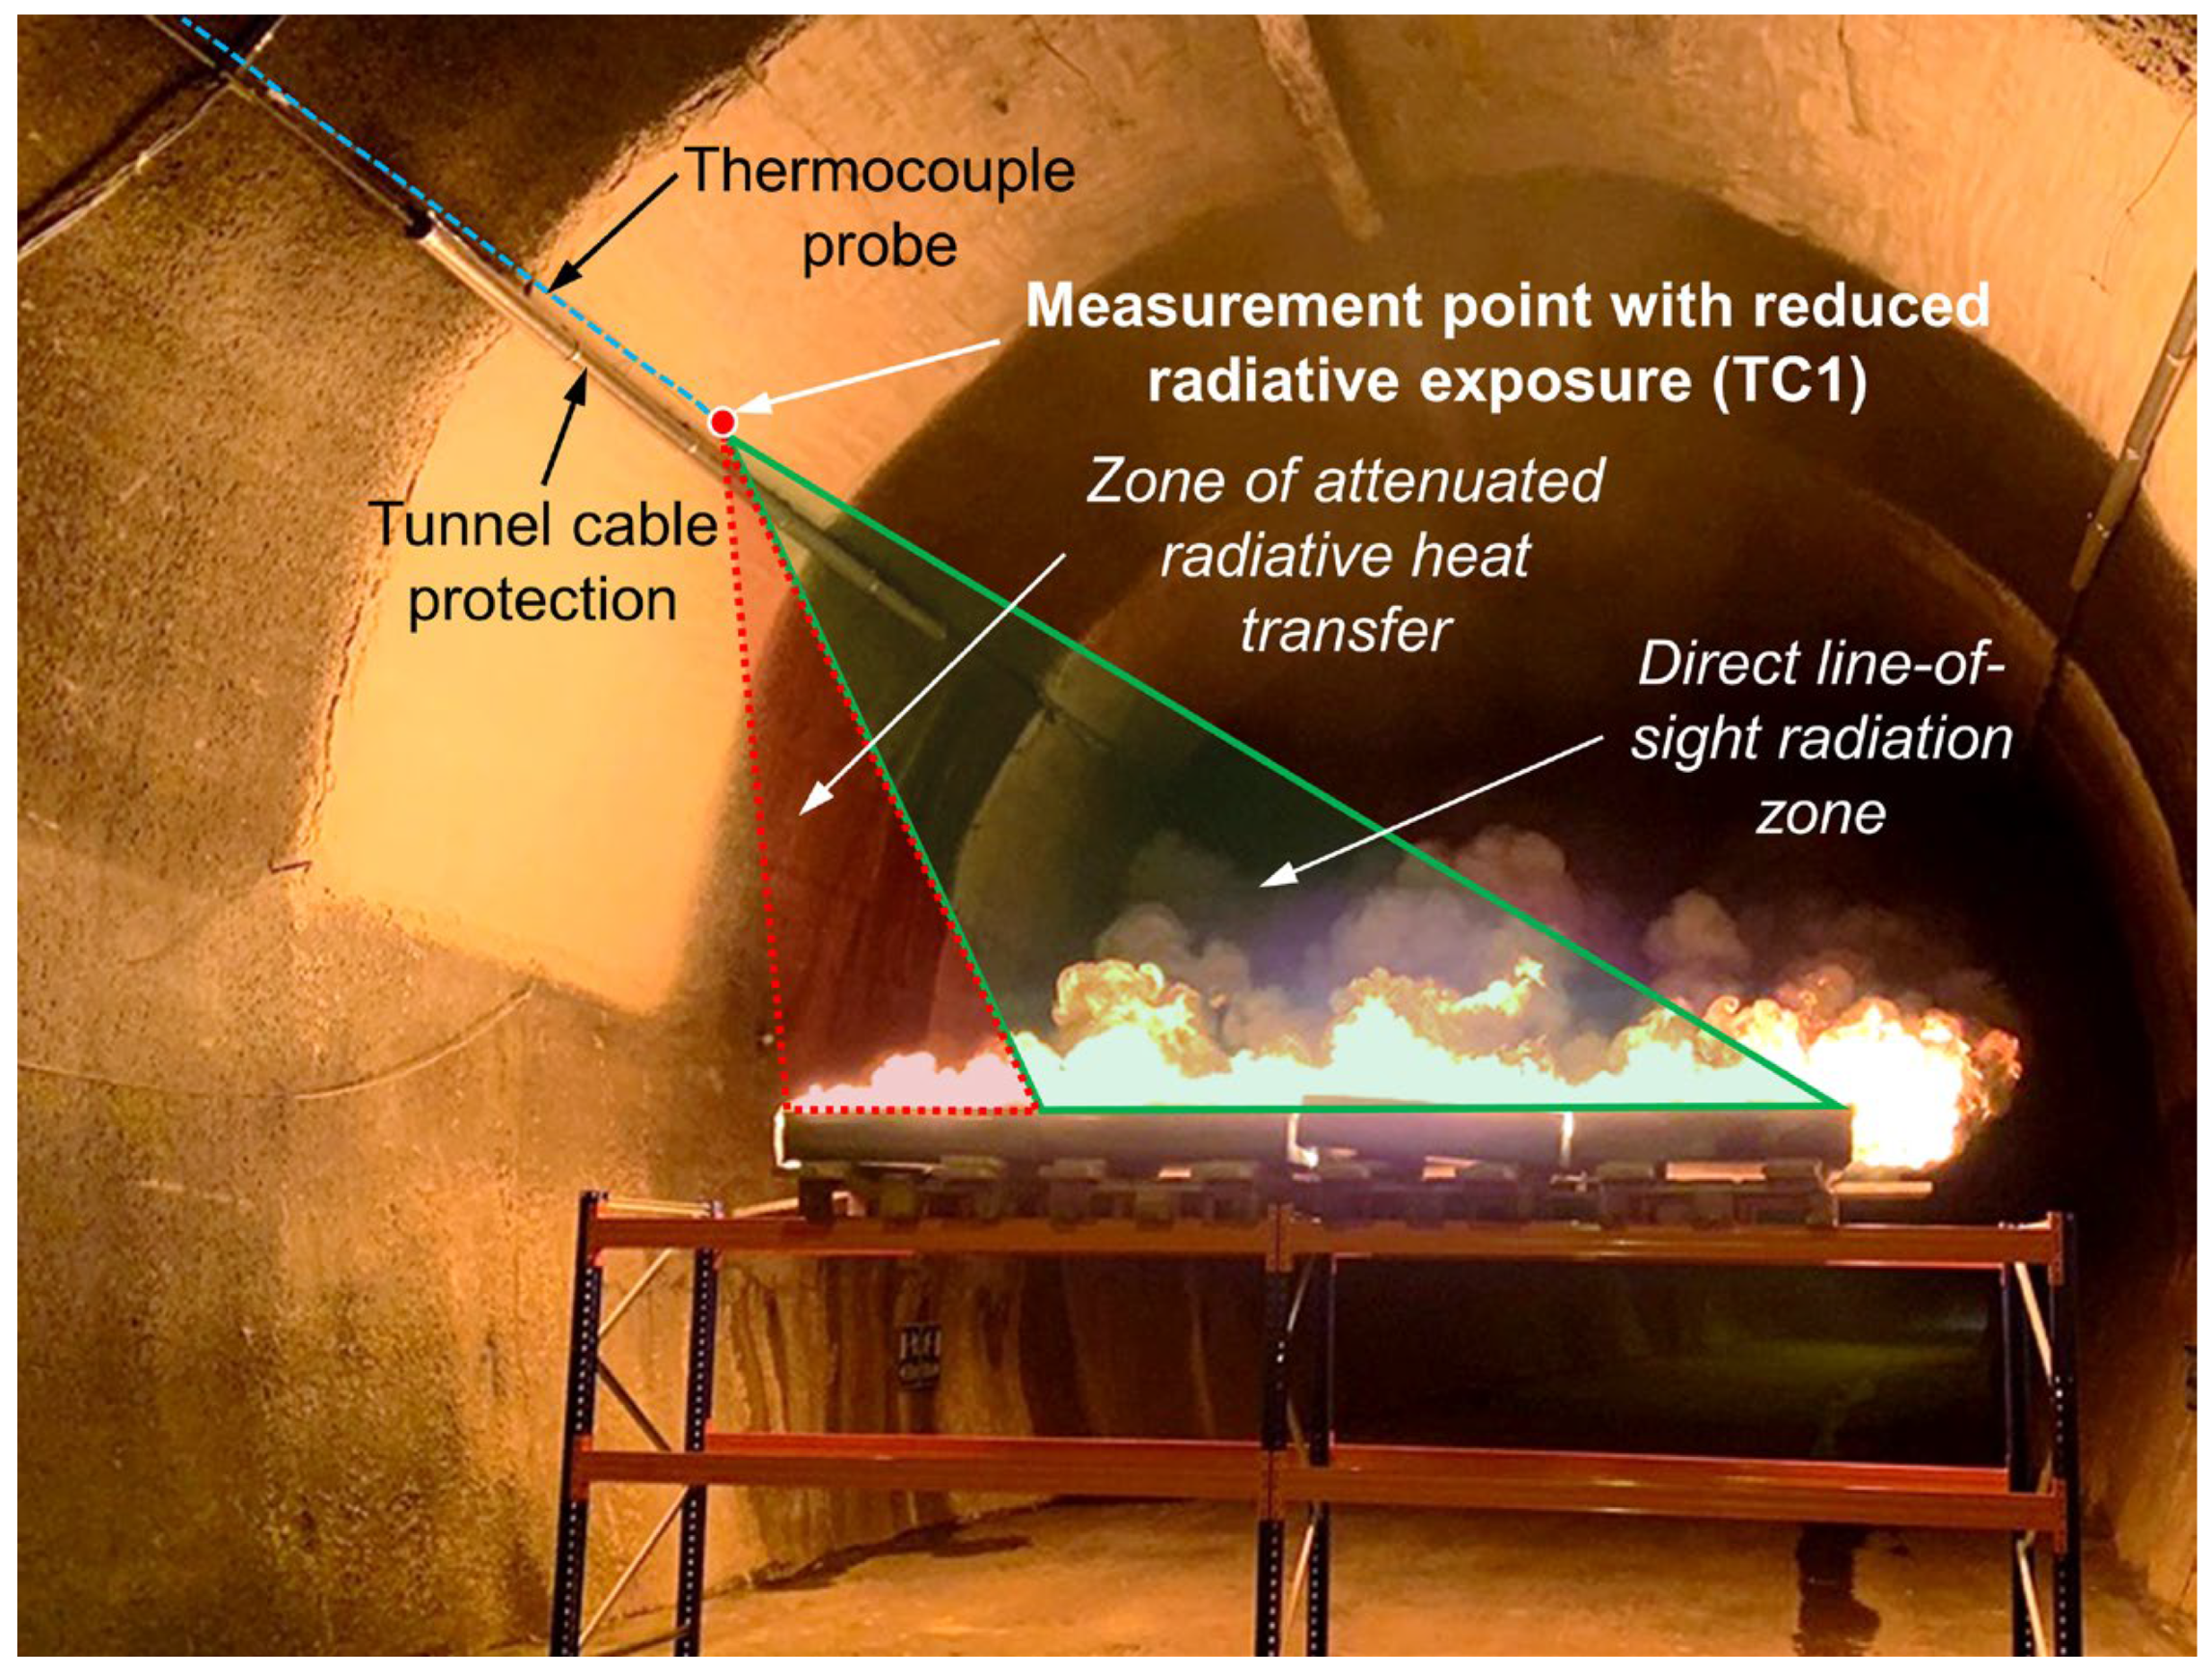
The influence of radiative exposure is evident in the temperature history of thermocouple TC1. In Test 1-B, TC1 recorded lower temperatures than the adjacent thermocouples located on the tunnel surface (Figure 8b). This behaviour is consistent with the position of TC1 near an electrical cable installation within the tunnel infrastructure (Figure 9). The protective conduit surrounding the cable partially obstructed the line of sight between the flame and the measurement location, thereby likely reducing incident radiative heat flux at the plaster surface. This localised shielding supports the interpretation that radiative transfer made an important contribution to surface heating under the tested conditions.
Figure 9.
Location of thermocouple TC1 near electrical conduit with partial radiative shielding.
During the period of highest fire intensity, oscillatory flame and plume behaviour was visually observed, characterised by intermittent fluctuations in flame attachment and smoke movement. These pulsations are interpreted as indirect evidence of thermoacoustic instabilities associated with the coupling between heat release, flow dynamics, and acoustic feedback within the confined geometry, consistent with phenomena reported in previous tunnel fire investigations [38]. No instrumented velocity measurements were available during the fire to quantify these fluctuations directly.
Cross-section 2 (Tests 2-A and 2-B). The second baseline pair was conducted at cross-section 2 under the same fire configuration and ventilation regimes as in cross-section 1. Consistent with the previously defined criterion, the end of the fire was identified at approximately 27 min in Test 2-A and 29 min in Test 2-B. The slightly longer burning duration in Test 2-B is attributed to deformation of one fuel pan during heating, which appears to have redistributed the liquid fuel towards one corner of the pan. This likely reduced the effective burning surface area and lowered the local mass loss rate, thereby prolonging the overall combustion process in this test.
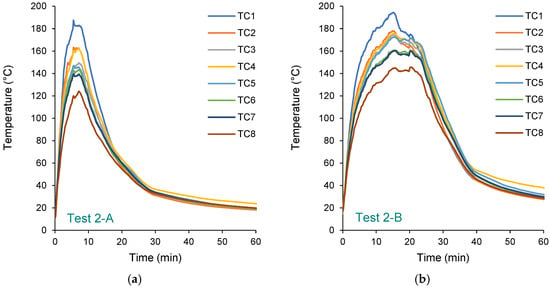
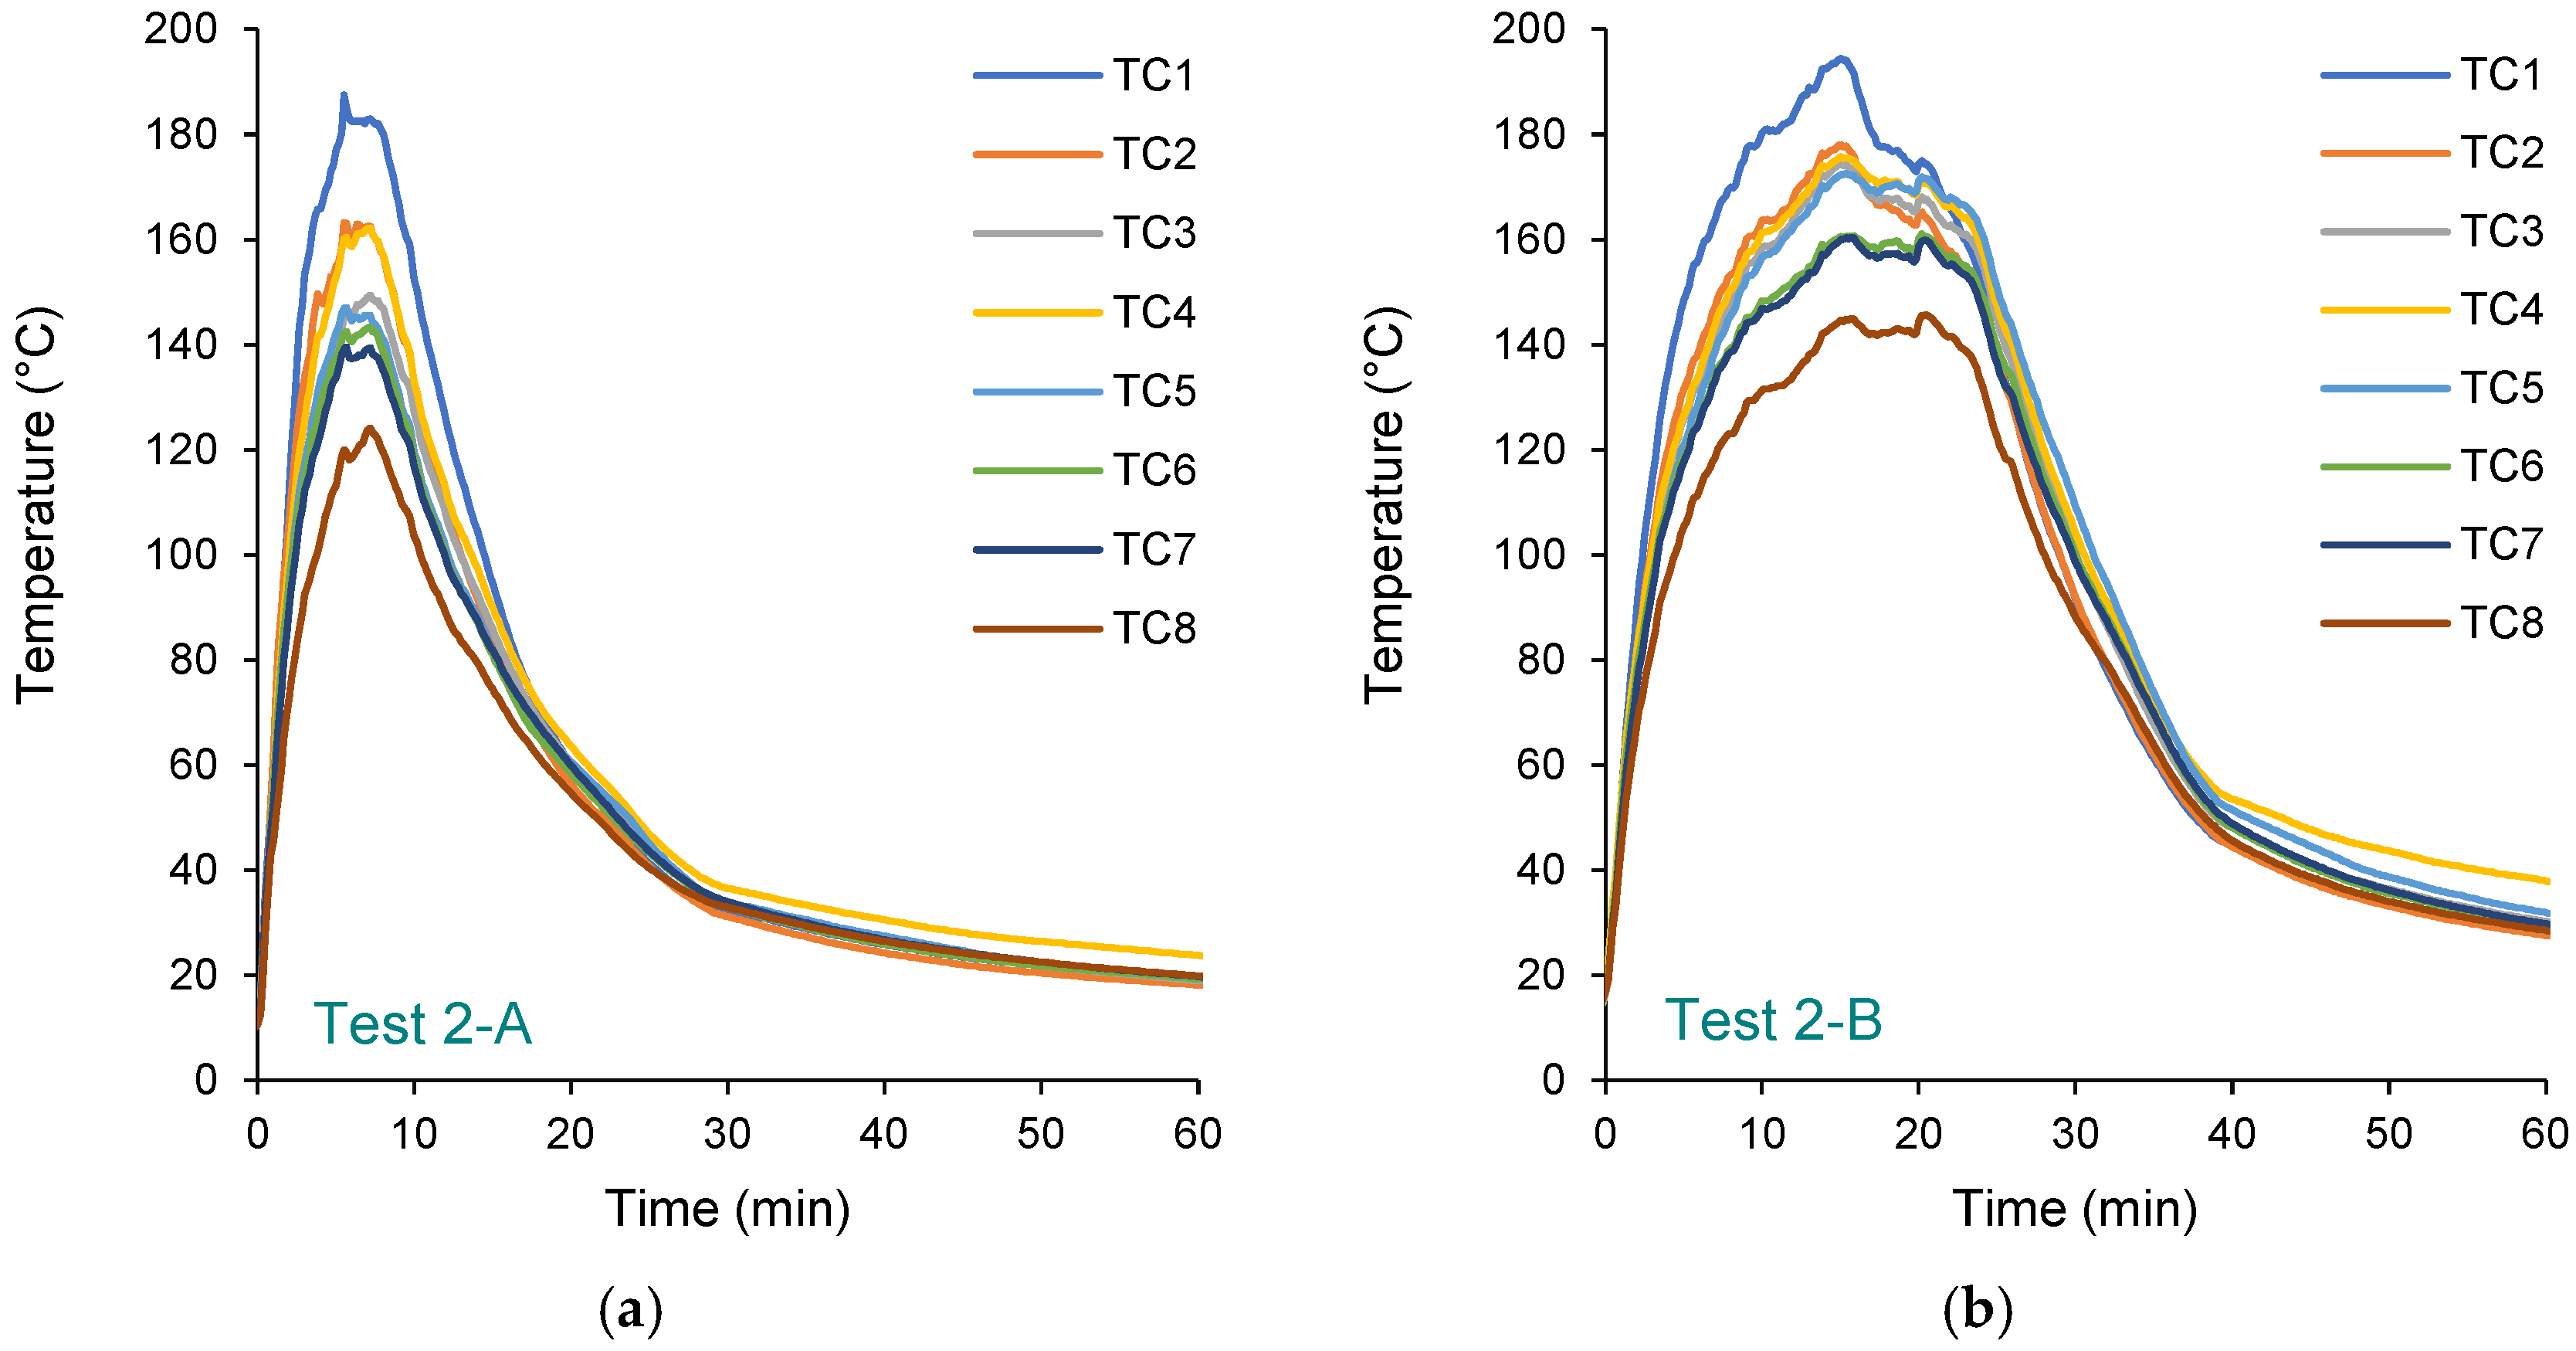
Temperature data recorded by the thermocouples are presented in Figure 10. In both tests, temperatures rose rapidly following ignition, reflecting the prompt establishment of flaming across the fuel pans. In Test 2-A, peak temperatures were reached within approximately 5–8 min, followed by a relatively sharp decline (Figure 10a). Maximum recorded temperatures ranged from 124 (TC8) to 187 °C (TC1), with noticeable variation among thermocouples associated with local differences in flame impingement and radiative exposure. After the peak period, the temperature curves exhibit a monotonic decay, which is attributed primarily to increasing smoke accumulation above the fire source and the associated attenuation of radiative heat transfer to the tunnel surface, leading to reduced net incident heat flux at the measurement locations.
Figure 10.
Surface temperatures of the tunnel lining in cross-section 2: (a) Test 2-A, two-fan ventilation (0.88 m/s); (b) Test 2-B, four-fan ventilation (1.79 m/s).
In Test 2-B, the temperature rise was more gradual, with peak values occurring later and almost simultaneously, at 15–16 min (Figure 10b). The thermocouple records display a sustained high-temperature interval prior to decay, reflecting prolonged heat release under reduced smoke attenuation conditions. Peak temperatures (146–194 °C) were of comparable magnitude to those measured in Test 2-A, while temperatures close to these peak values were sustained for a longer period, indicating more persistent thermal loading of the tunnel lining. The cooling phase commenced later than in Test 2-A and proceeded gradually.
The influence of ventilation on the temporal development of thermal exposure followed the same overall tendency observed in Test 1. Flame and smoke behaviour exhibited trends consistent with plume dynamics governed by the imposed ventilation conditions. Lower airflow produced a more vertically oriented plume and greater localised heating of the tunnel surface, whereas increased airflow enhanced plume inclination and downstream transport of hot gases. Smoke accumulation above the fire source was observed in both tests but was less pronounced under higher ventilation conditions, where the increased airflow facilitated more effective removal of combustion products while maintaining sustained thermal exposure at the tunnel surface.
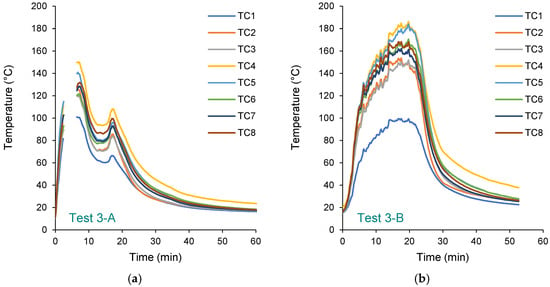
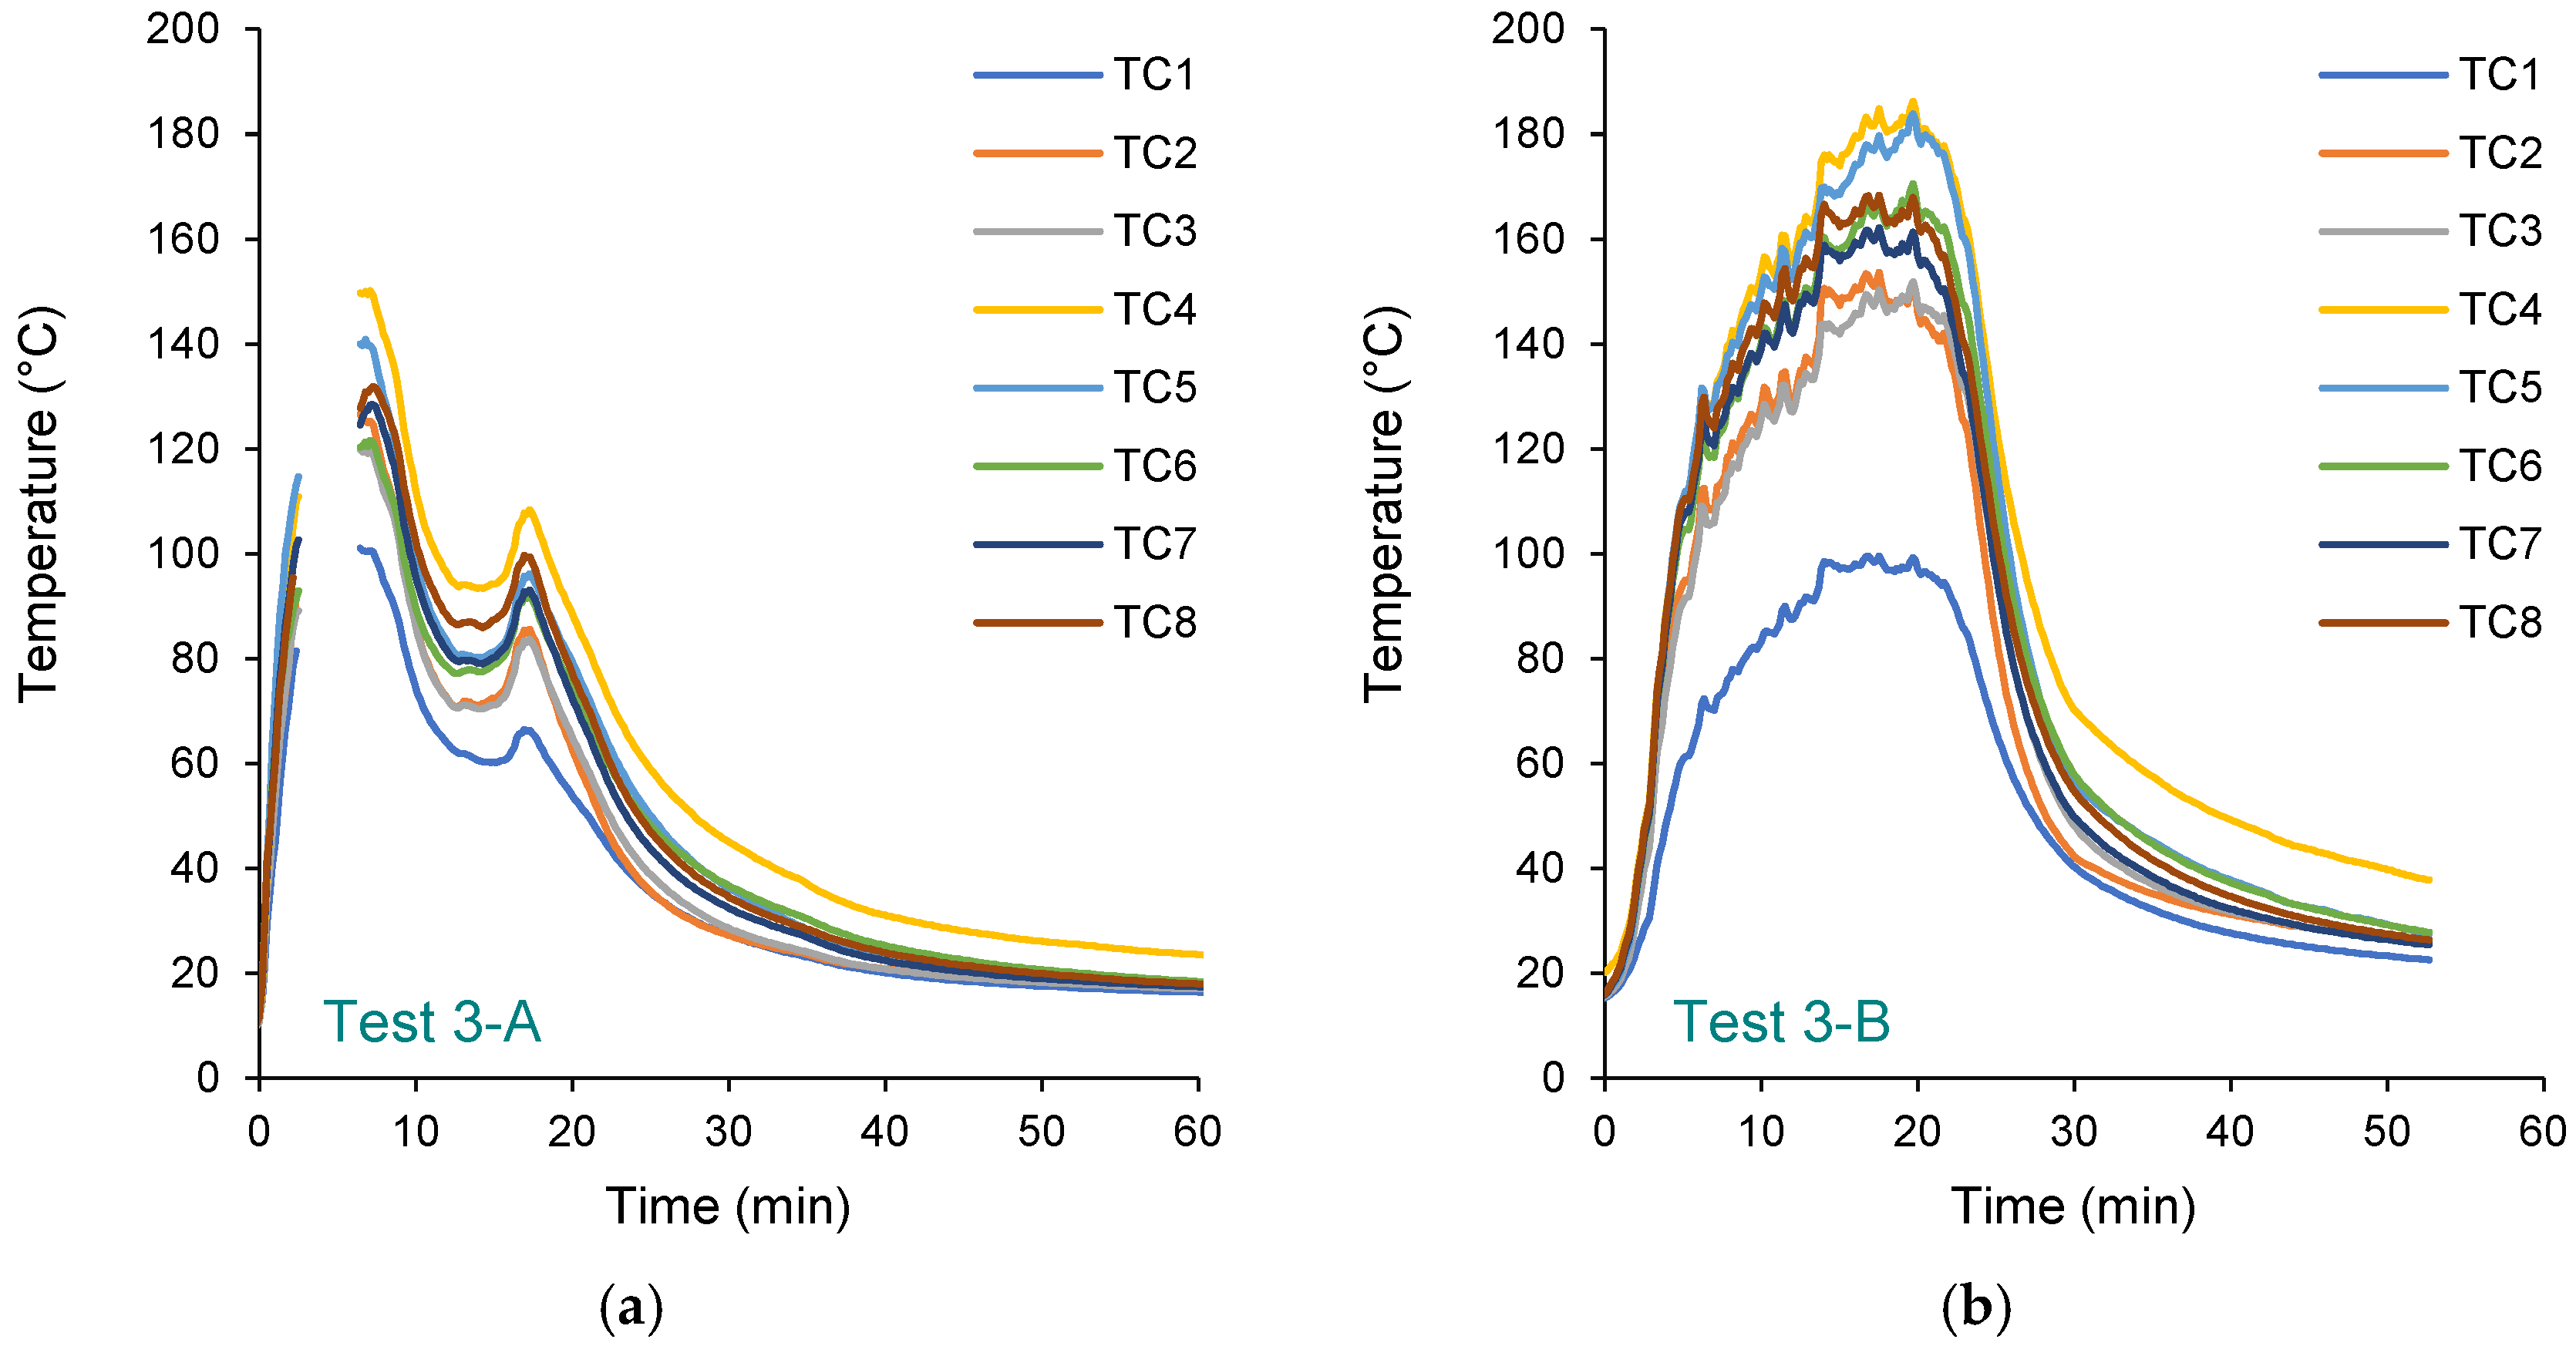
Cross-section 3 (Tests 3-A and 3-B). The final baseline pair was conducted at cross-section 3 with the same 2.1 m source elevation. The fire configuration, fuel composition, and ventilation regimes remained unchanged. Applying the established end-of-fire criterion, burning ceased at approximately 28 min in Test 3-A and 29 min in Test 3-B. Temperature data recorded by the thermocouples are presented in Figure 11. Several minutes of measurements were lost during Test 3-A due to a temporary power interruption. However, the available records capture the principal stages of heating and cooling.
Figure 11.
Surface temperatures of the tunnel lining in cross-section 3: (a) Test 3-A, two-fan ventilation (0.94 m/s); (b) Test 3-B, four-fan ventilation (1.88 m/s).
In both tests, surface temperatures increased rapidly after ignition, indicating prompt flame spread across the fuel pans. In Test 3-A, peak temperatures were reached within approximately 4–7 min (Figure 11a). Recorded maximum temperatures ranged from 101 (TC1) to 150 °C (TC4); however, the actual peak values were likely not captured because of the power interruption. In Test 3-B, the temperature rise was more gradual, consistent with the pattern observed under higher ventilation, and peak values occurred later, at approximately 17–20 min (Figure 11b). The thermocouple records show a sustained high-temperature interval before the decay phase, indicating prolonged thermal exposure under higher ventilation. Peak temperatures in Test 3-B reached 152–186 °C for thermocouples TC2–TC8, while TC1 recorded a substantially lower value of 100 °C. The consistently lower temperatures recorded by TC1 are attributed to its placement behind a protective electrical conduit, which partially limited direct radiative heat transfer from the flame. A similar shielding effect was observed in Test 1-B, where reduced smoke attenuation under higher airflow increased the contribution of line-of-sight radiation.
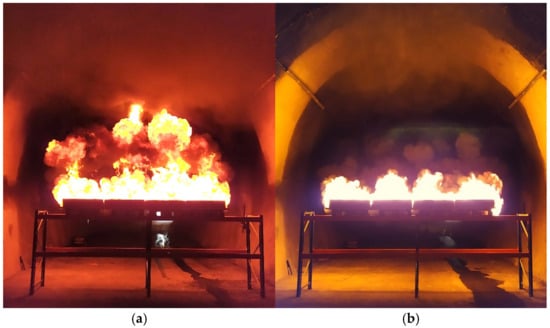
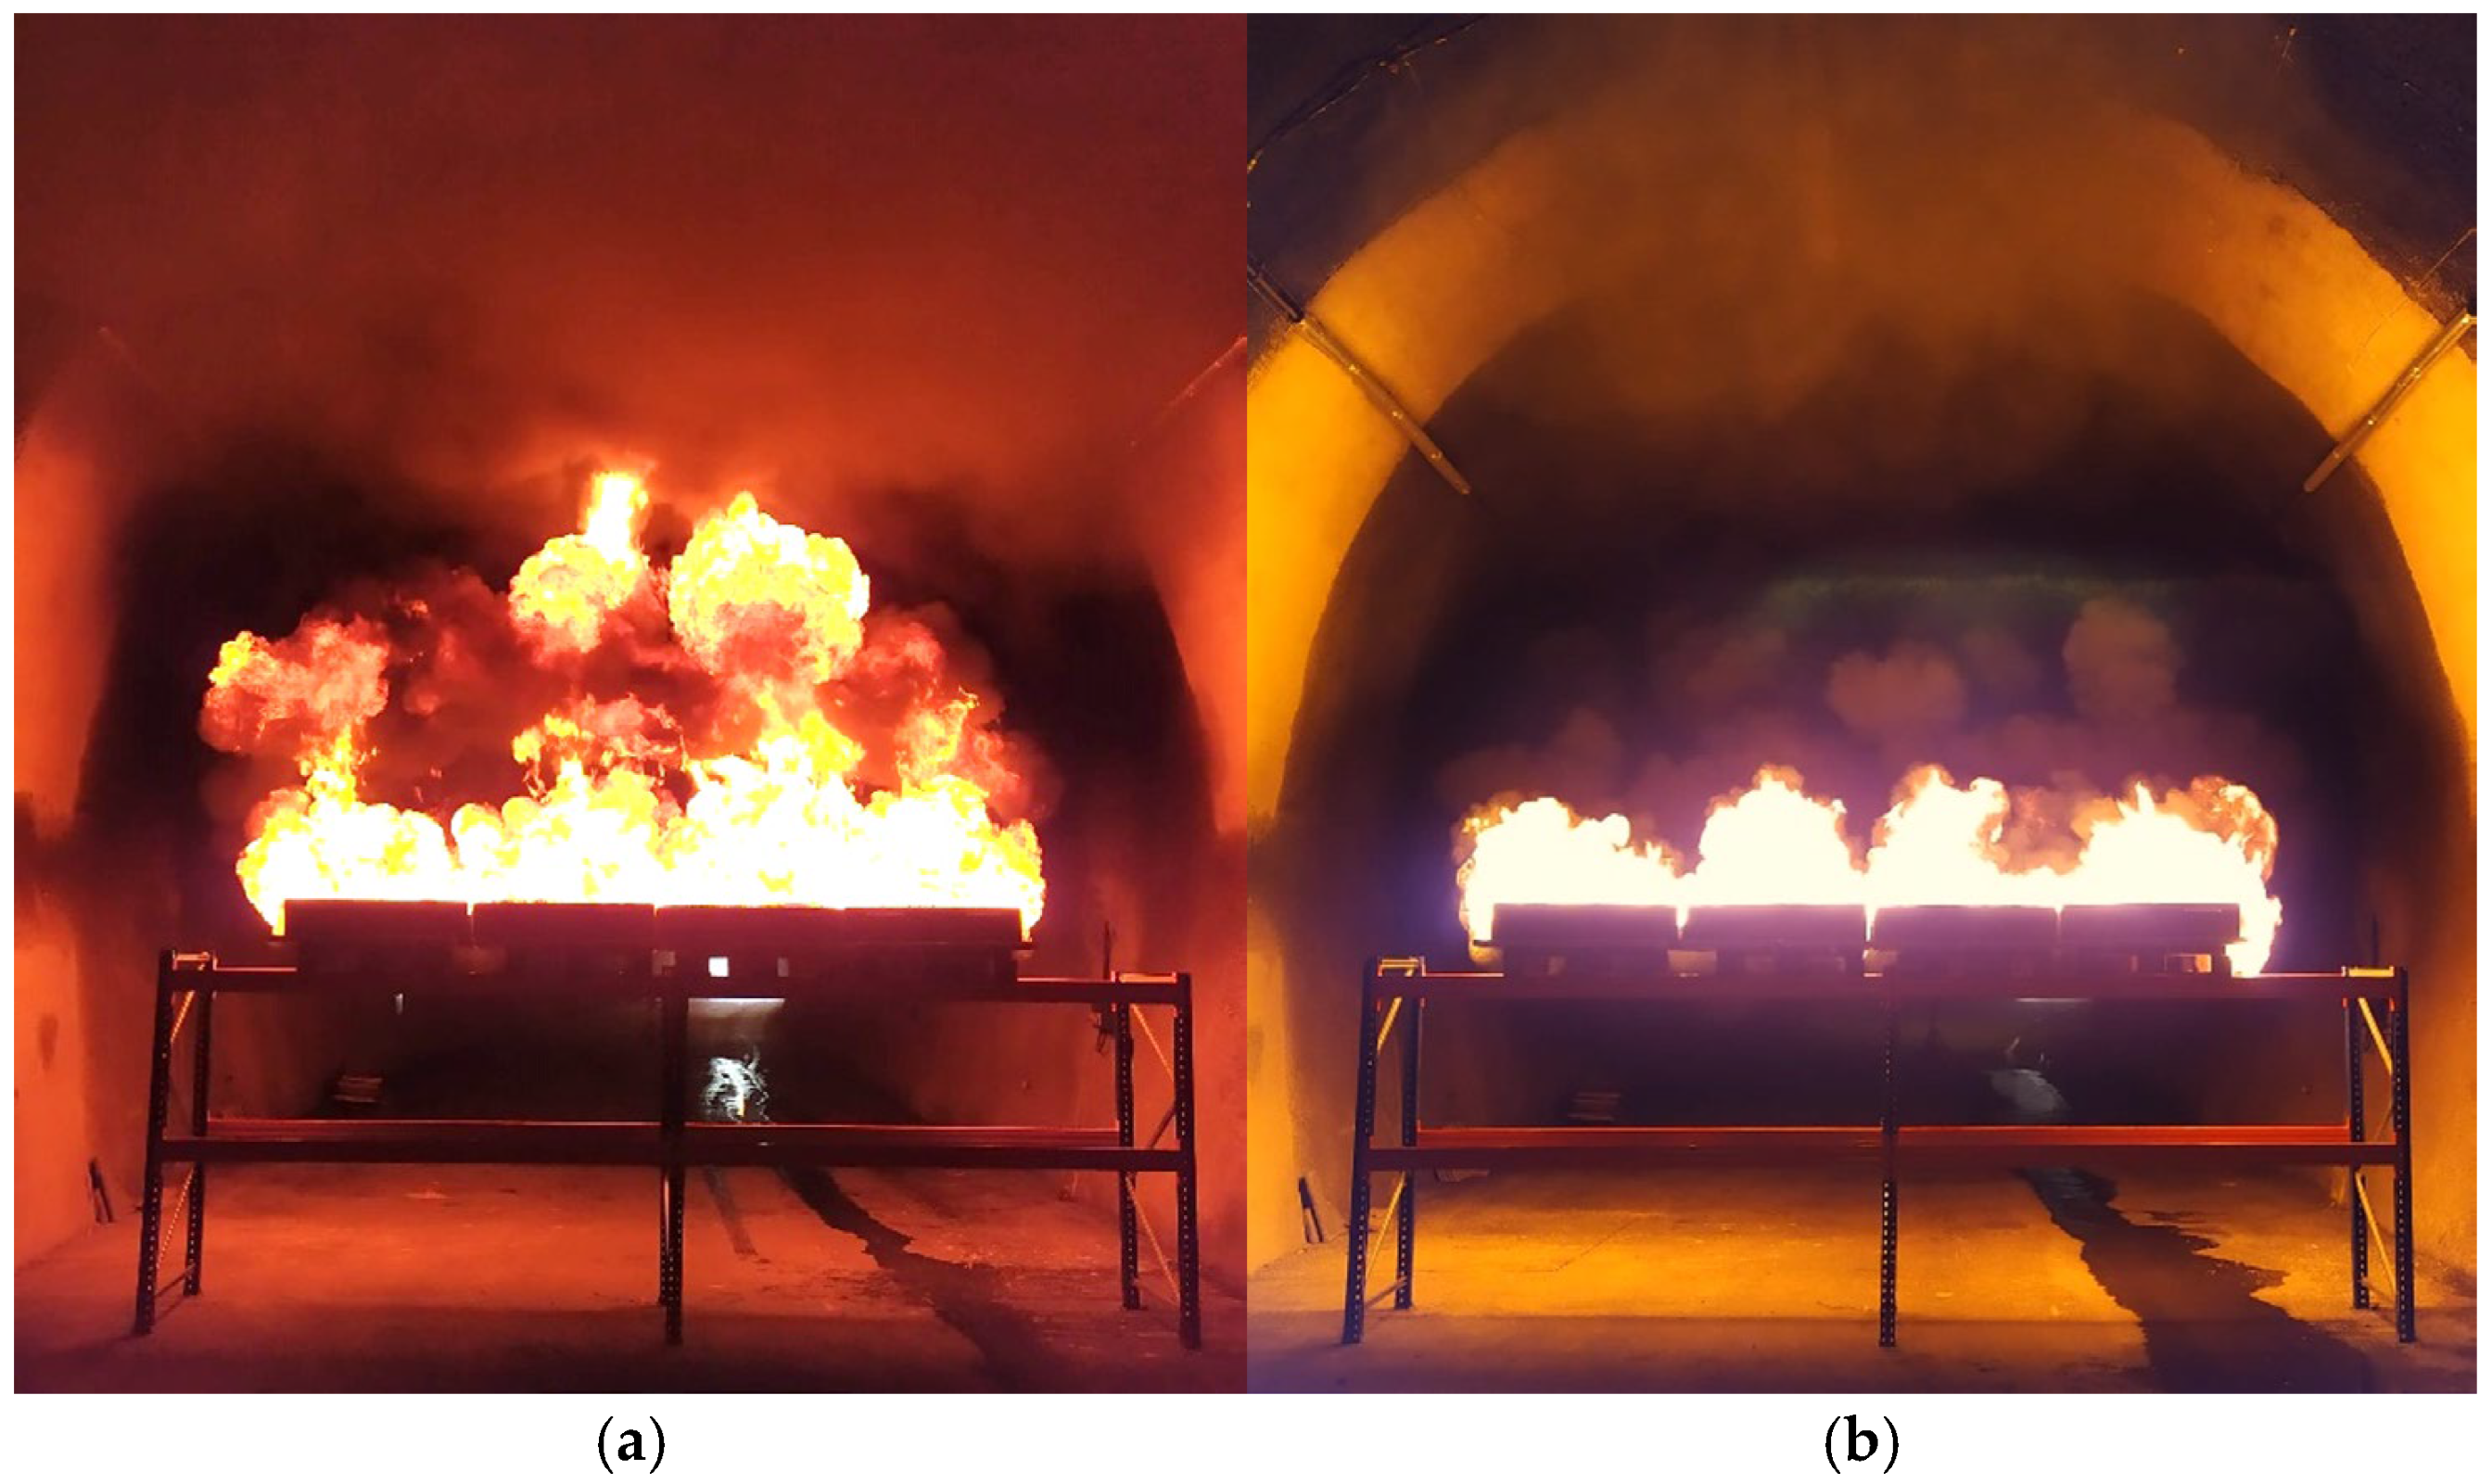
The influence of ventilation on the temporal development of fire dynamics in Test 3 followed the same overall tendency observed in the preceding test series, with increased airflow producing delayed peak temperatures and a more sustained high-temperature period. Observed flame and smoke behaviour remained consistent with ventilation-influenced plume dynamics. Smoke accumulation above the fire source was observed in both tests but was less pronounced under increased ventilation (Figure 12). The images in Figure 12 correspond to roughly 2 min after ignition, illustrating the initial development of flames and smoke under the respective ventilation regimes.
Figure 12.
Flame and smoke behaviour in cross-section 3: (a) Test 3-A; (b) Test 3-B.
3.2.2. Modified Configuration with Increased Source Elevation (4.1 m)
During the modified-configuration test series, temperature measurements were performed at cross-section 3 with the fuel pans positioned on a platform elevated to 4.1 m (Figure 3b). This configuration reduced the distance between the fire source and the tunnel lining, thereby increasing the imposed thermal load. Fire-source elevation influences fire and smoke dynamics through two coupled mechanisms: a reduced source-to-ceiling distance, which intensifies plume–ceiling interaction, and an increased sub-platform flow pathway beneath the elevated source, which allows longitudinal ventilation to interact directly with the plume base and modify its deflection and downstream development. Using the established criterion, the end of sustained burning was reached at approximately 27 min in Test 4-A and 30 min in Test 4-B.
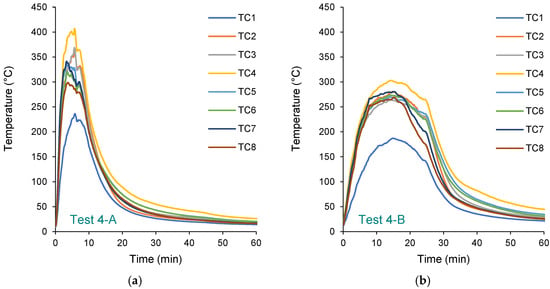
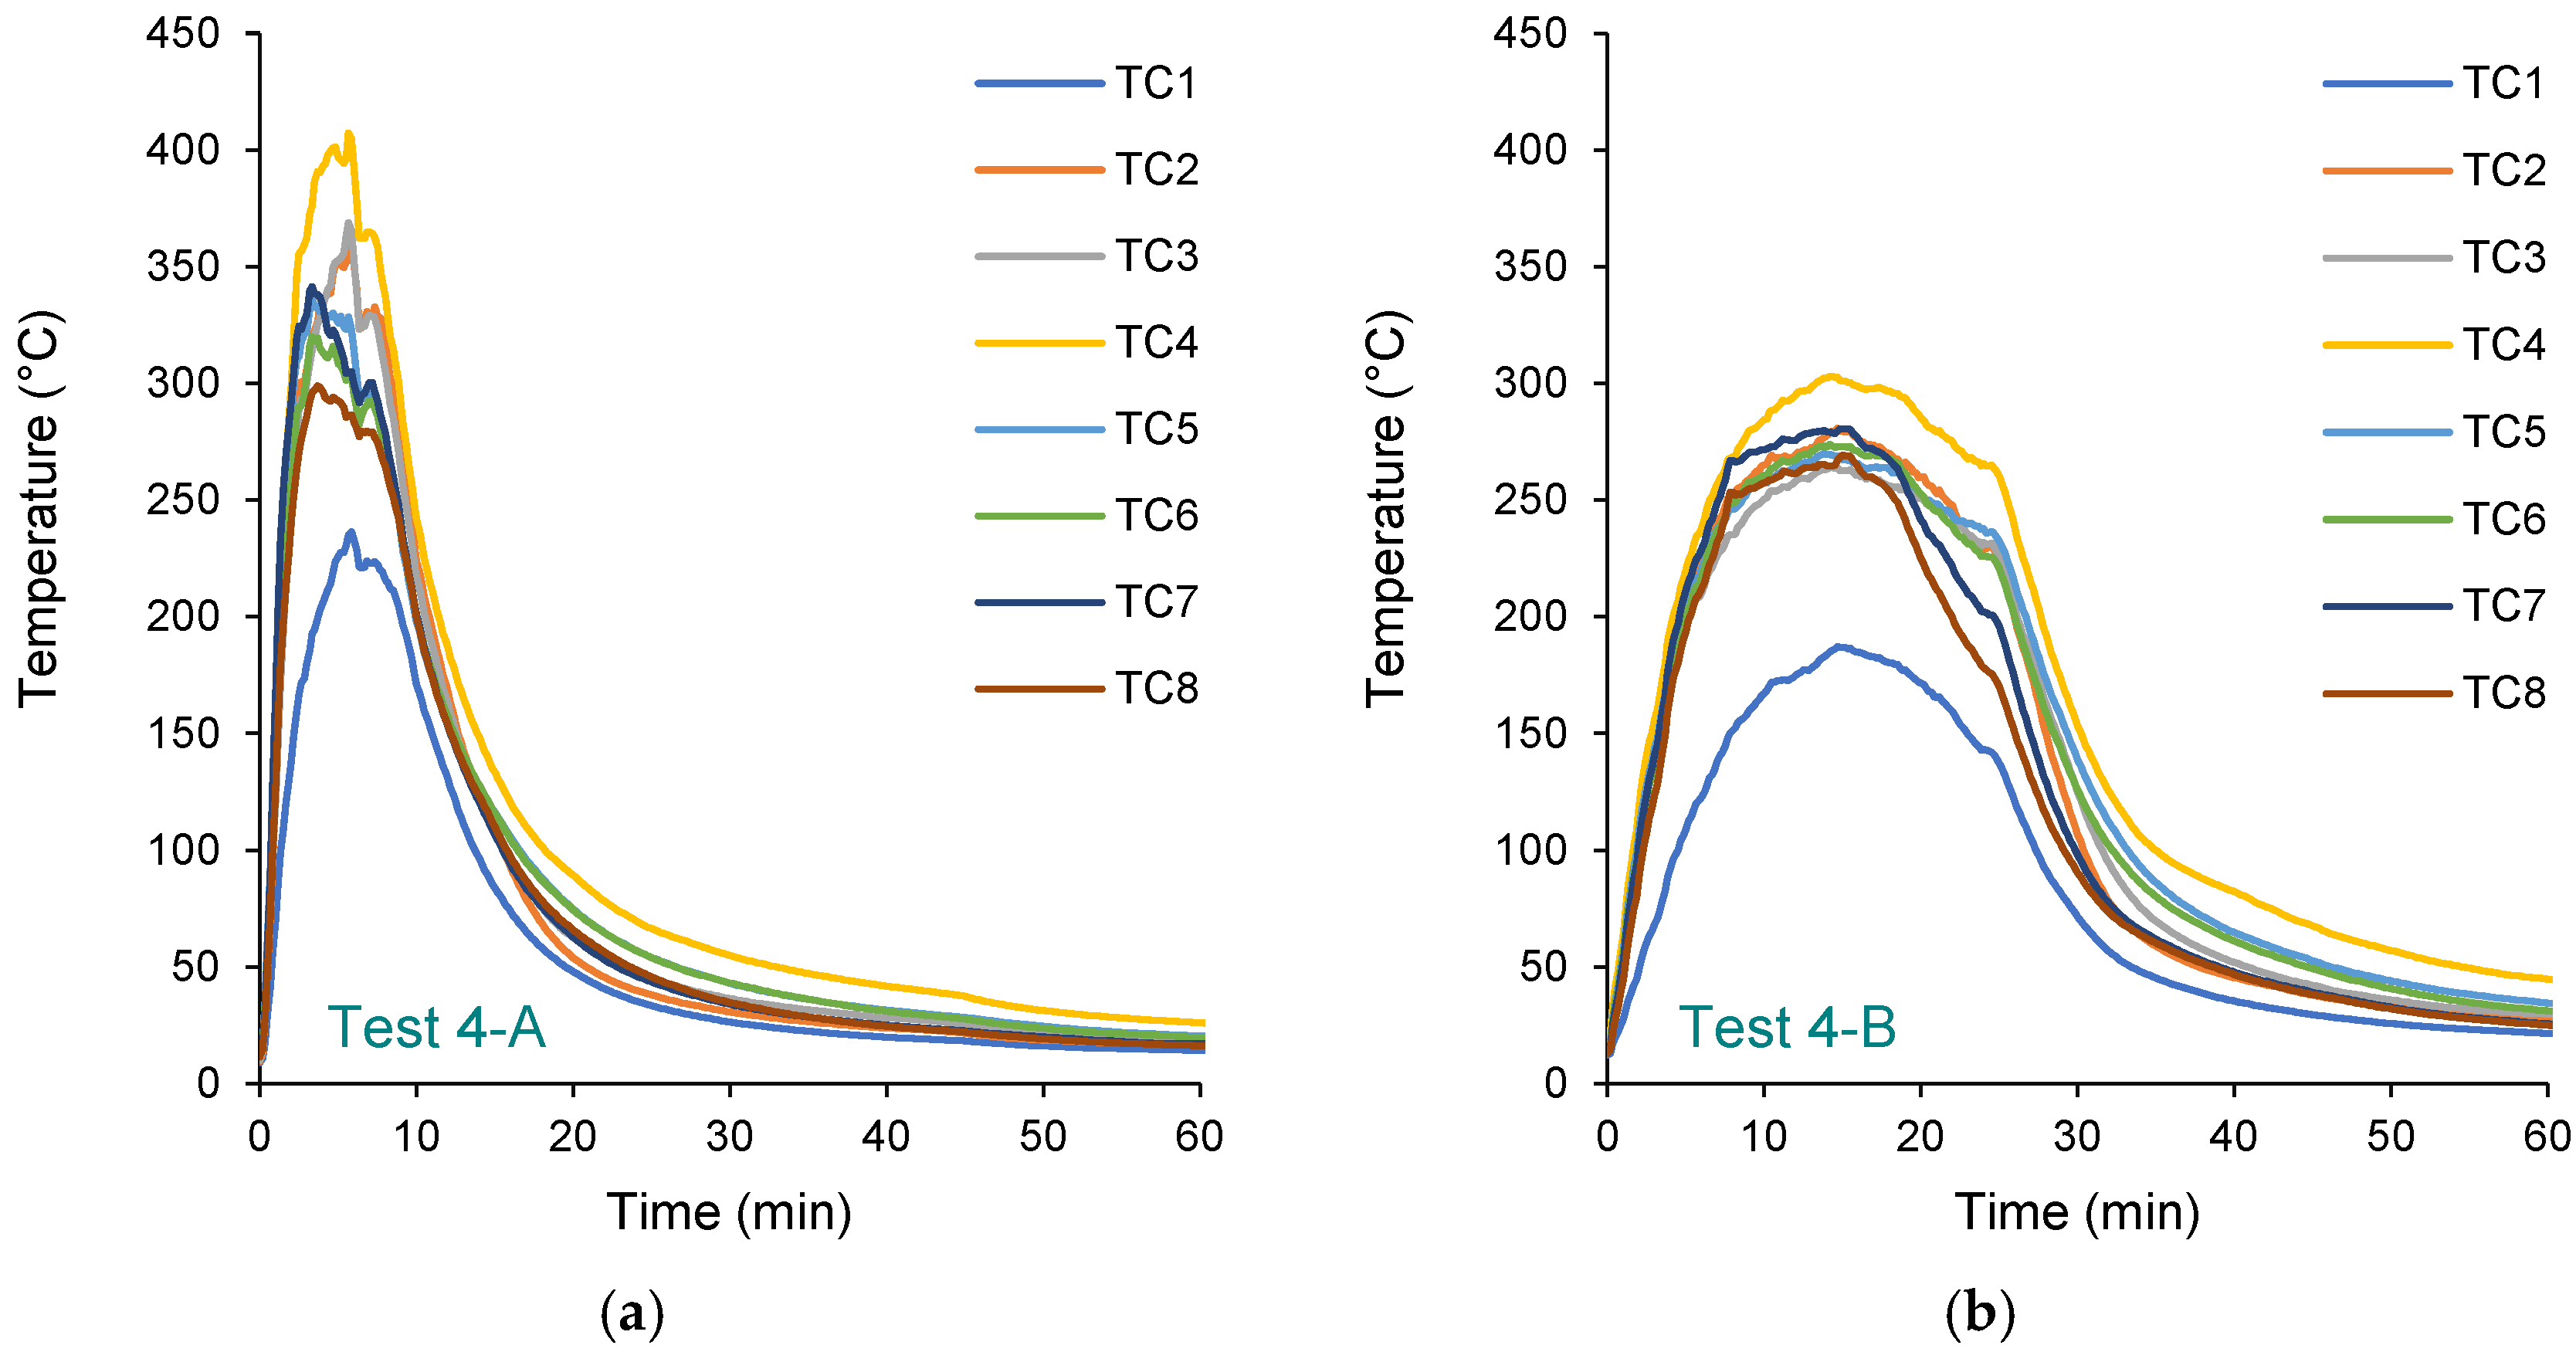
Figure 13 presents the surface temperature histories recorded by the eight thermocouples during Tests 4-A and 4-B. In both tests, temperatures increased rapidly following ignition and subsequently decreased gradually during the decay phase. However, distinct differences are observed between the two ventilation conditions. In Test 4-A, the curves exhibit sharp, well-defined peaks, with maximum temperatures ranging from 236 °C (TC1) to 407 °C (TC4), indicating intense and localised heating of the tunnel lining. In contrast, Test 4-B shows lower and broader peak profiles, with maximum temperatures generally between 187 °C (TC1) and 303 °C (TC4). The peak temperatures in Test 4-A exceed those in Test 4-B by more than 100 °C at several measurement points. Similar to Test 3, thermocouple TC1 consistently recorded the lowest temperatures among all sensors, which can be attributed to its placement behind a protective conduit installed over the tunnel’s electricity cable, resulting in partial shielding from direct thermal exposure. The higher ventilation rate in Test 4-B promoted enhanced longitudinal smoke transport and convective cooling, resulting in reduced thermal accumulation at the wall surface and a more moderated temperature evolution.
Figure 13.
Surface temperatures of the tunnel lining in cross-section 3: (a) Test 4-A, two-fan ventilation (1.35 m/s); (b) Test 4-B, four-fan ventilation (2.03 m/s).
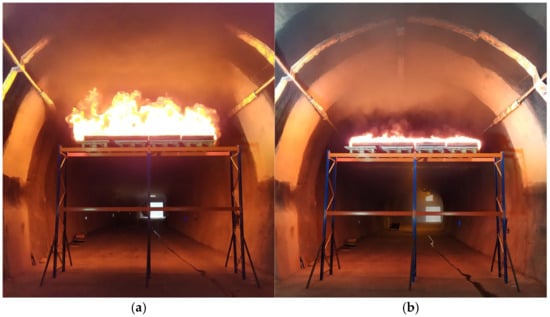
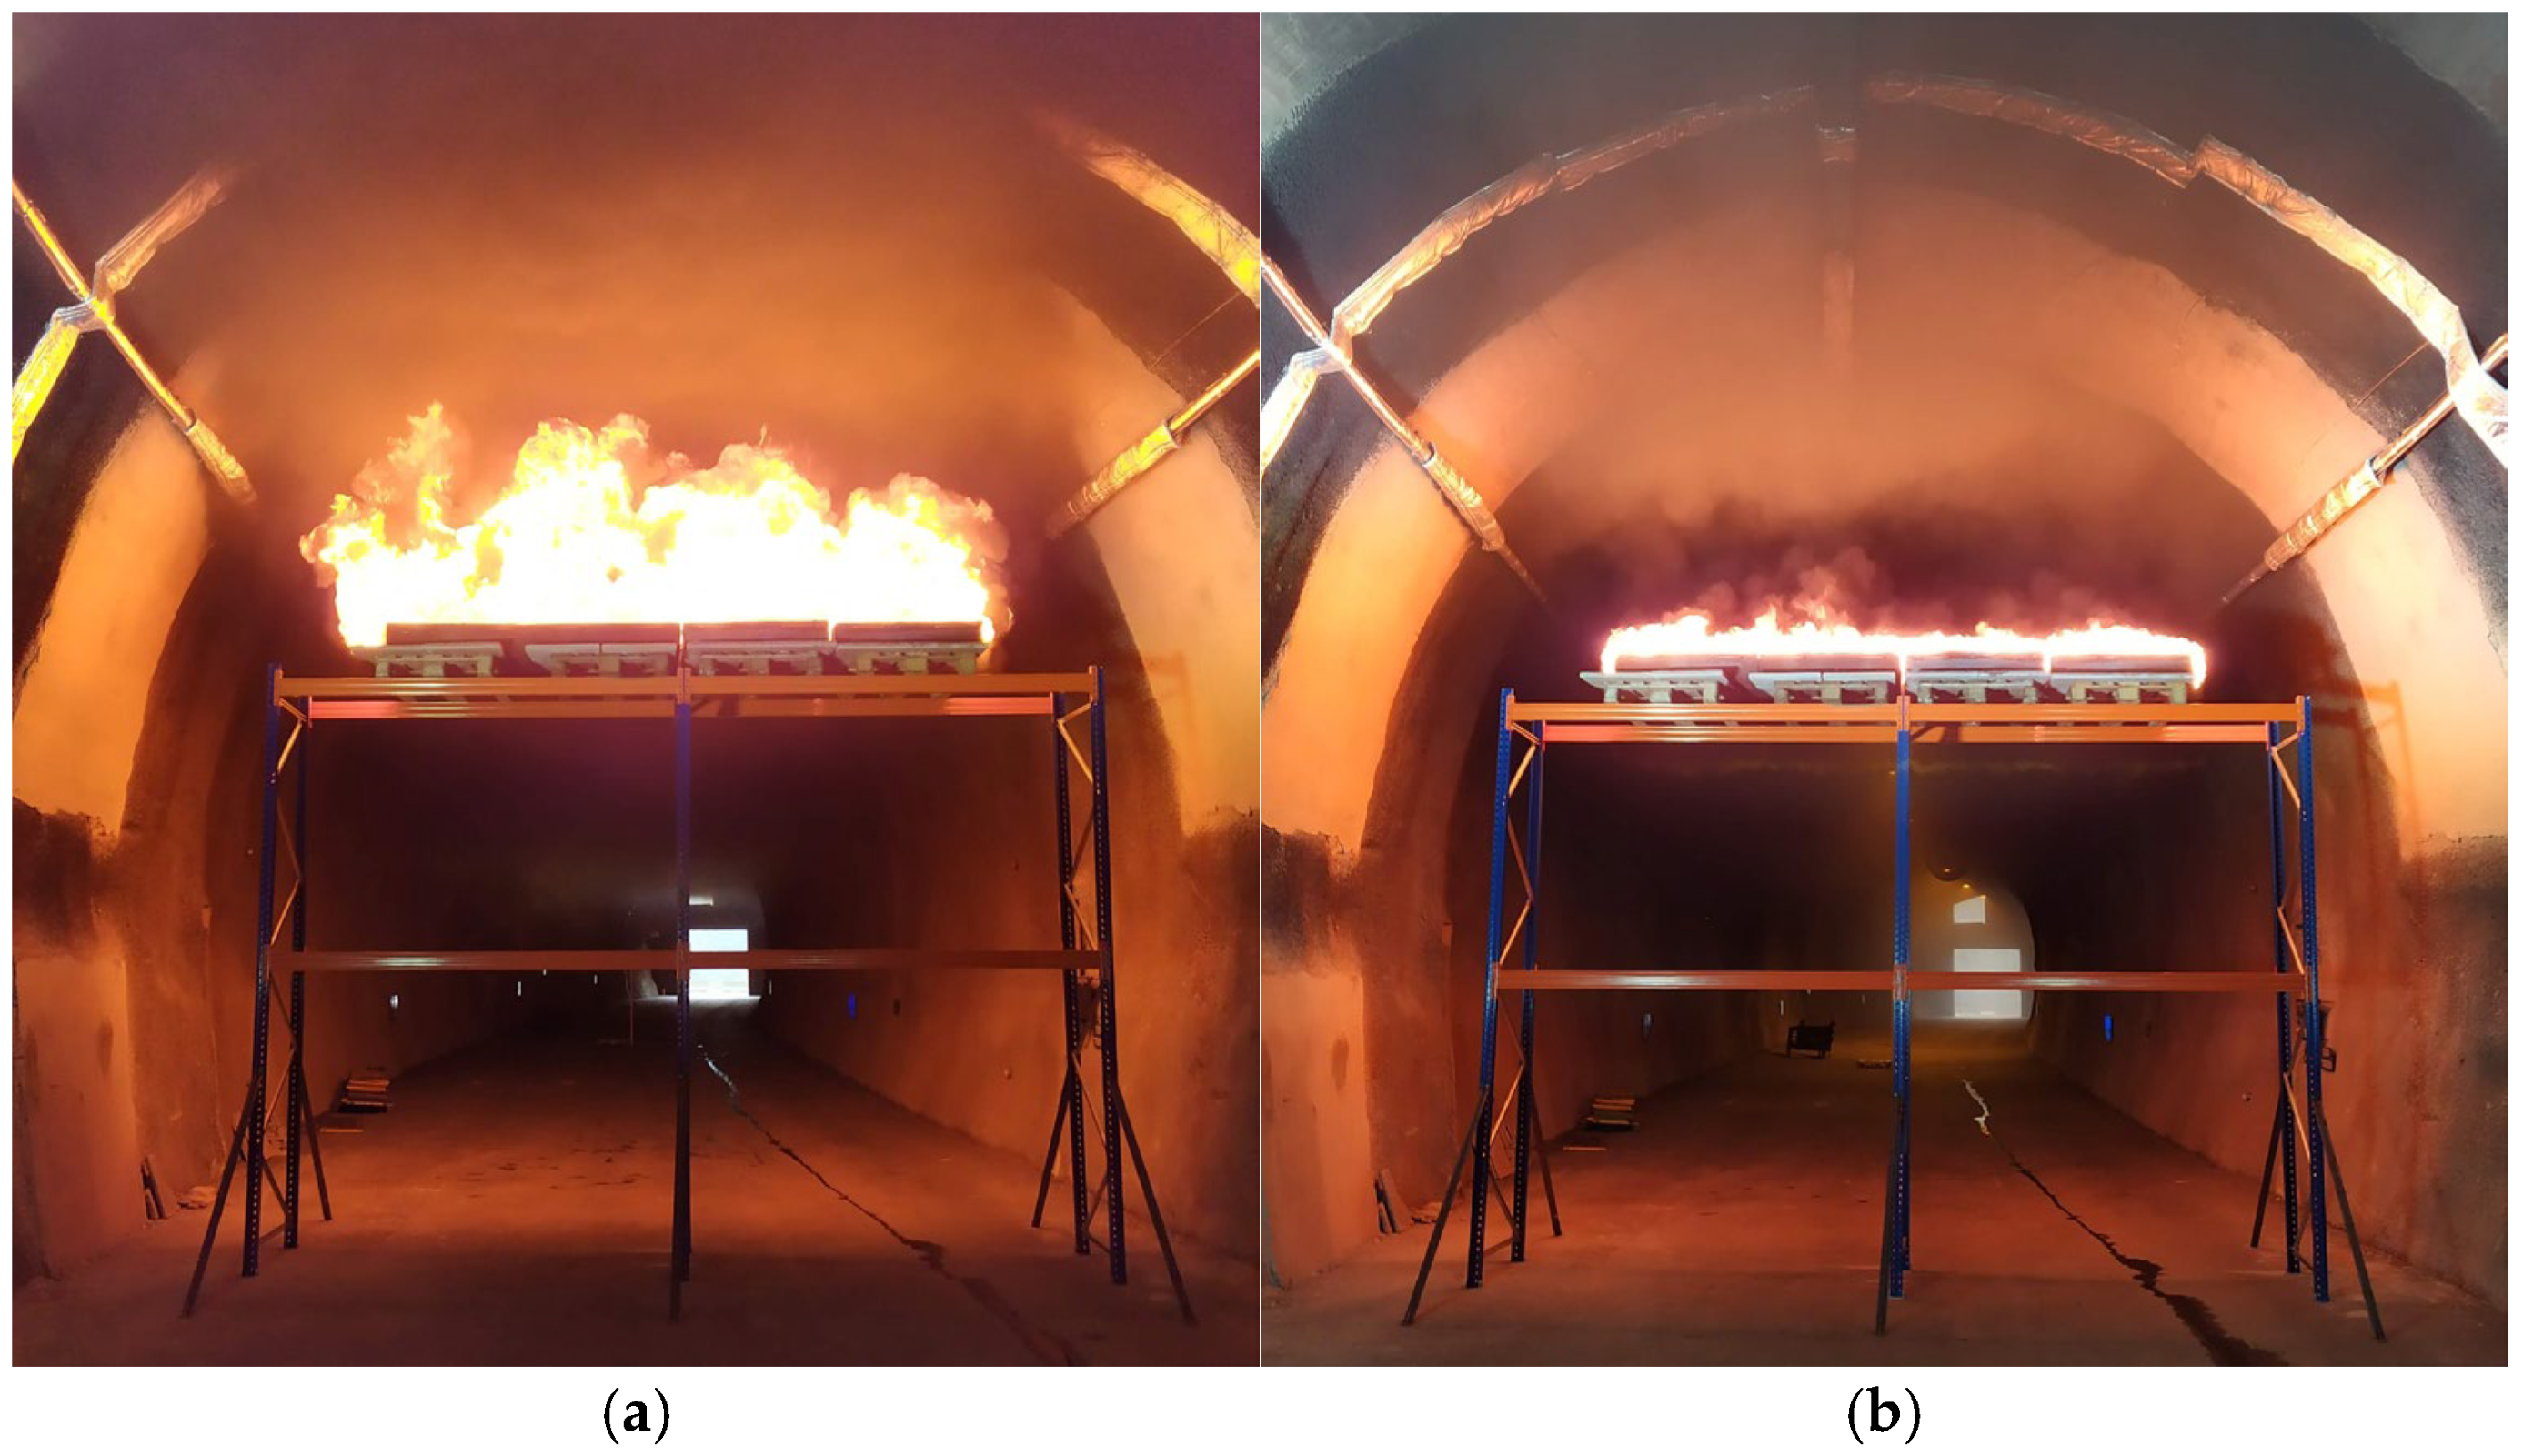
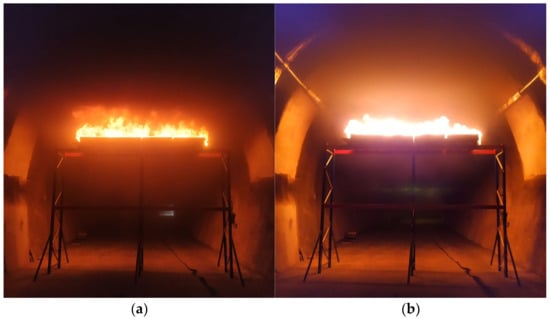
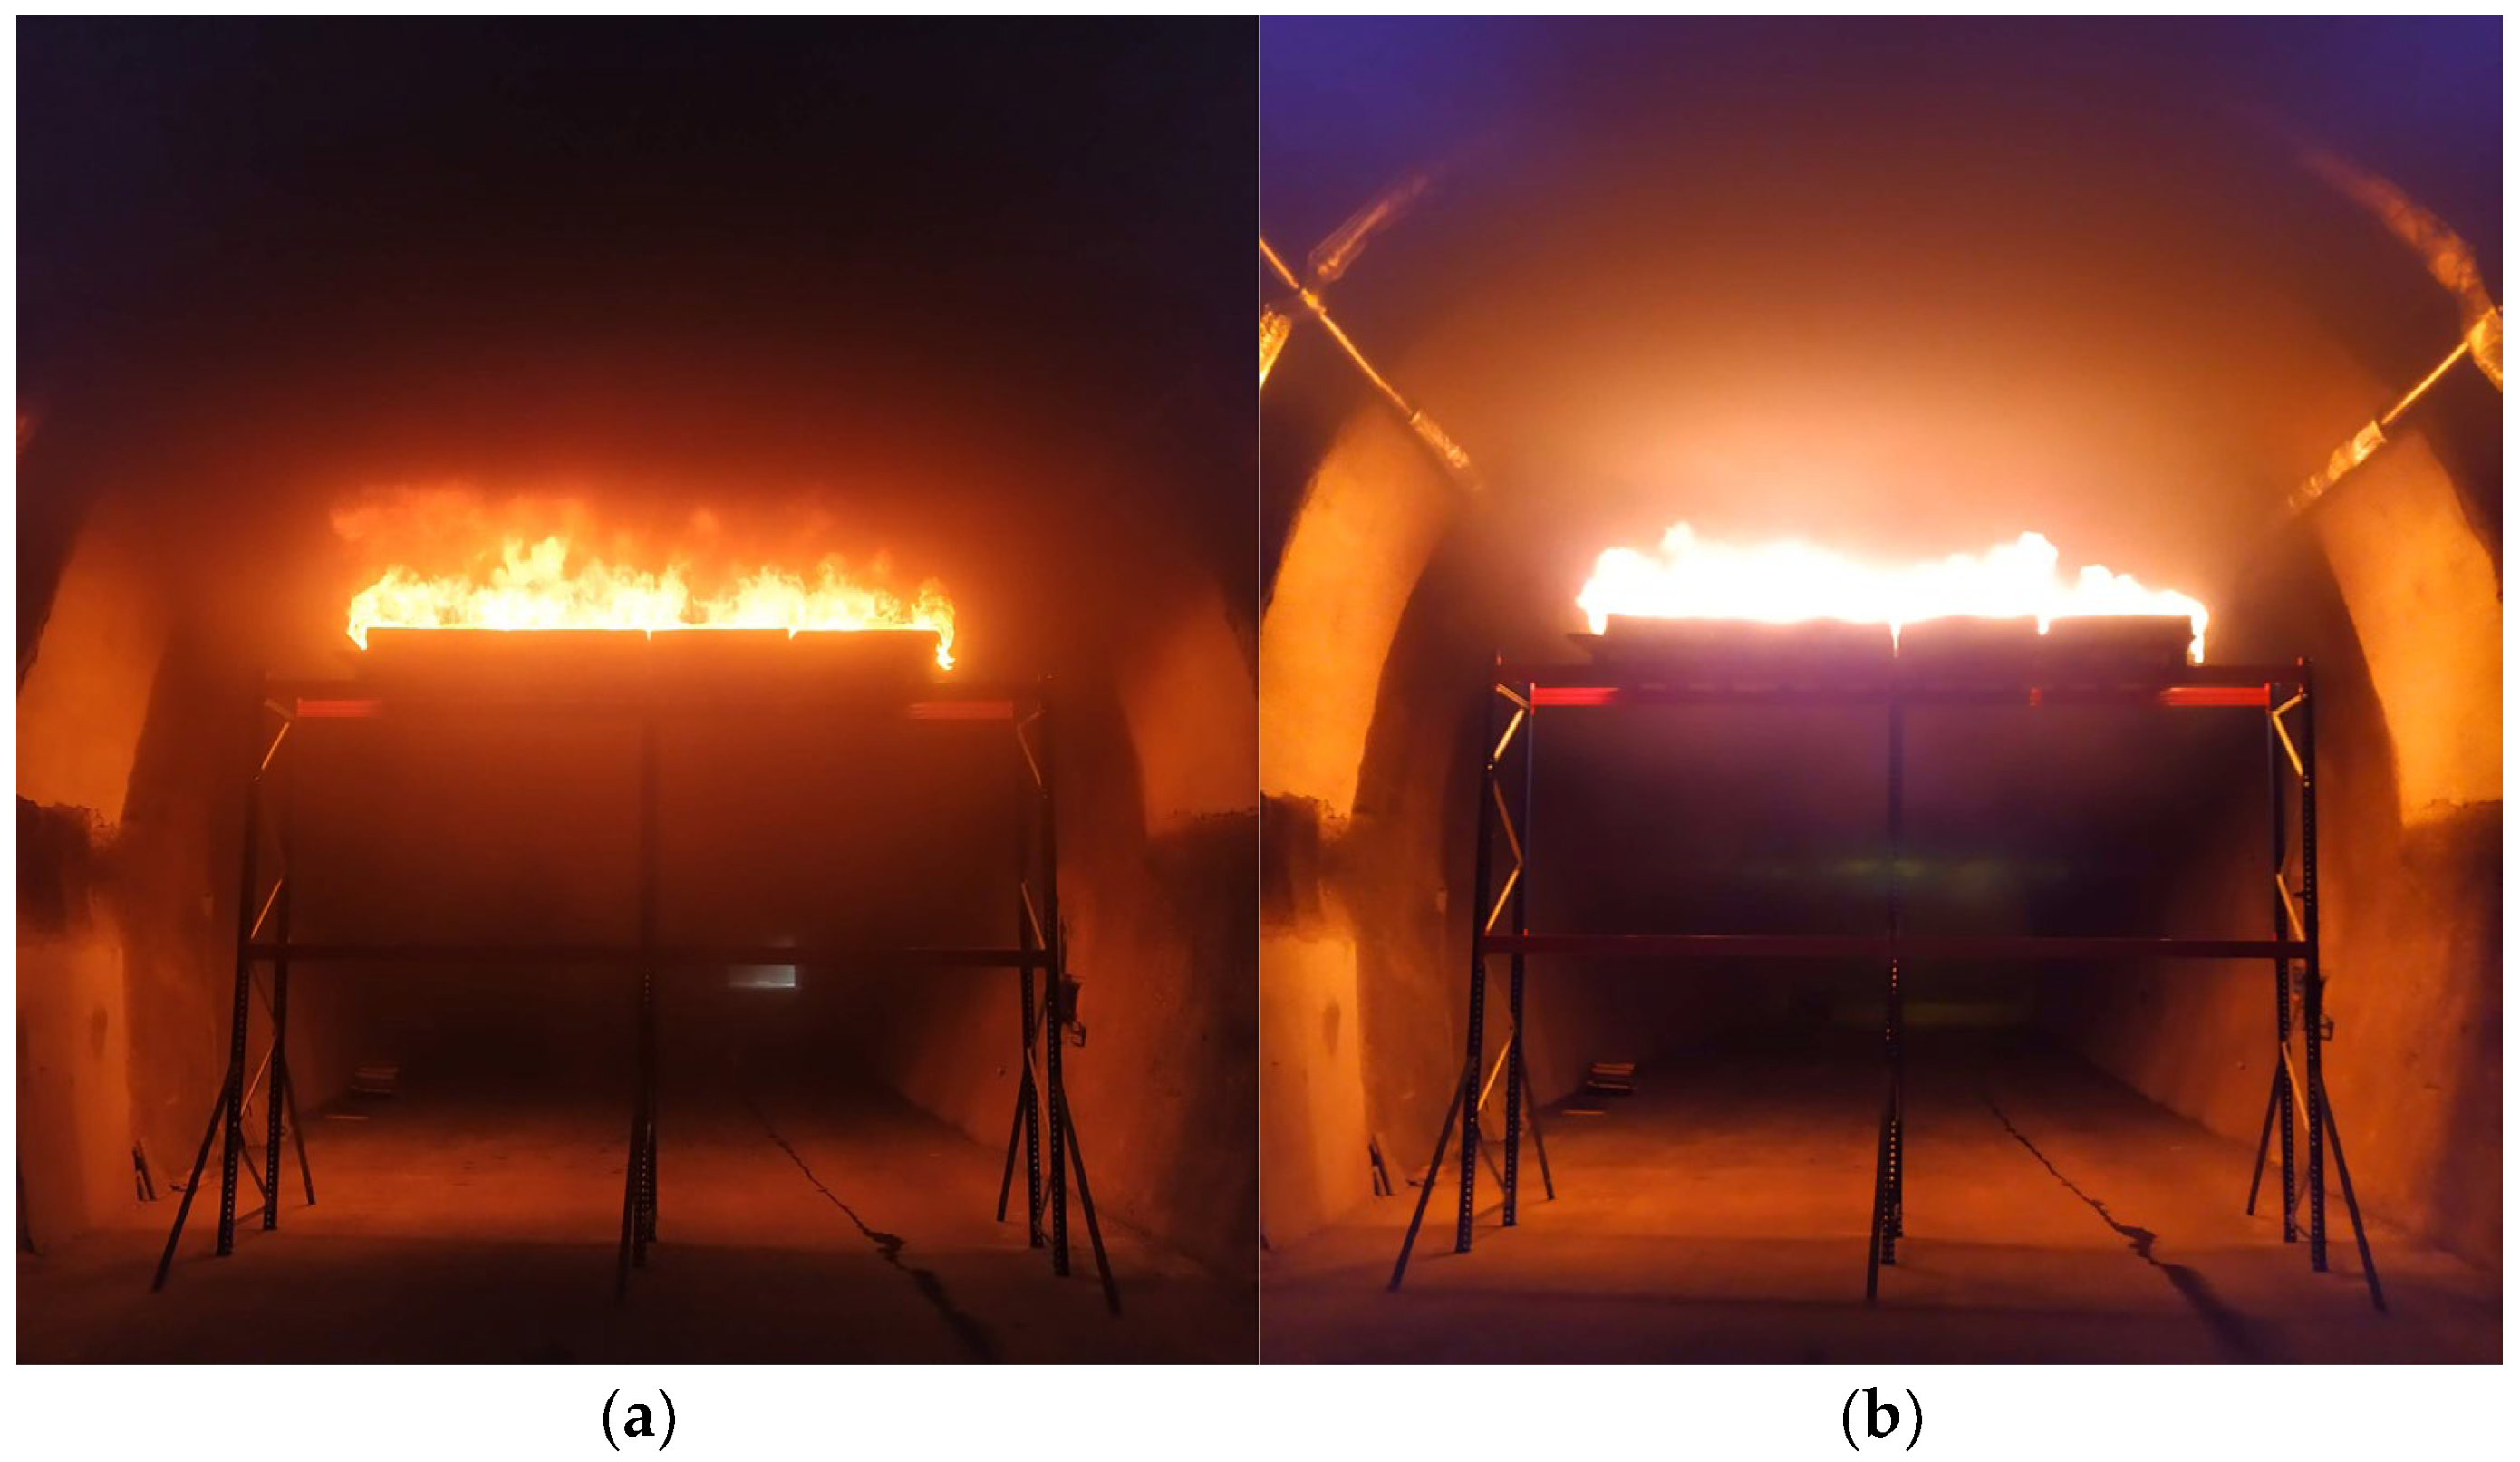
The observed flame and smoke development during these tests was consistent with the behaviour documented in the preceding experimental series. Under reduced ventilation (Test 4-A), the flames were higher and more vertically oriented above the pool pans, indicating limited plume deflection by the longitudinal airflow (Figure 14a). In contrast, full ventilation (Test 4-B) produced lower flames with a pronounced inclination towards the tunnel portal, reflecting stronger aerodynamic influence on plume trajectory and enhanced longitudinal momentum transfer (Figure 14b). The images in Figure 14 were taken approximately 2 min after ignition and show the early fire growth stage under the respective ventilation regimes.
Figure 14.
Flame and smoke behaviour in cross-section 3, 2 min after ignition: (a) Test 4-A; (b) Test 4-B.
To further illustrate the influence of ventilation on the evolving tunnel environment, Figure 15 presents later-stage conditions under both configurations. In contrast to the early fire growth stage (Figure 14), when the smoke layer was relatively thin and flame structures were sharply defined, the later images reveal substantial smoke accumulation that alters both visibility and apparent flame geometry. In Test 4-A, the scene at 7 min shows pronounced accumulation of smoke beneath the crown, occupying much of the upper tunnel cross-section and forming a dense, stratified smoke zone (Figure 15a). Such extensive smoke accumulation under reduced ventilation provides a plausible explanation for the observed moderation of burning intensity. In contrast, the image for Test 4-B at 10 min (Figure 15b) indicates a less dense and more dispersed smoke region beneath the ceiling, with noticeably improved visibility compared to Test 4-A, implying enhanced smoke dilution under higher ventilation rates.
Figure 15.
Flame and smoke behaviour in cross-section 3 at later stages of fire development: (a) Test 4-A at 7 min after ignition; (b) Test 4-B at 10 min after ignition.
Although smoke intensity varied between the two scenarios, the difference was less pronounced than in the preceding experiments. Owing to the 4.1 m elevation of the fire source, a larger unobstructed cross-sectional area beneath the fuel pans allowed a substantial fraction of the longitudinal airflow to pass below the fire. This likely intensified sub-plume interaction and promoted greater plume deflection, thereby affecting ceiling-jet formation. These observations suggest that flame behaviour was influenced not solely by the ventilation rate, but also by the elevated source position and the resulting redistribution of airflow within the tunnel cross-section. Despite the higher peak surface temperatures measured in Test 4-A, their effect was relatively short-lived. Under reduced ventilation in Test 4-A, the accumulation of combustion products above the fire likely led to the formation of a stratified upper smoke layer that attenuated radiative heat transfer to the lining through absorption, scattering, and re-emission of thermal radiation, thereby reducing the incident heat flux to the tunnel surface. In contrast, increased airflow in Test 4-B prolonged the thermal exposure of the lining by enhancing longitudinal smoke transport. Given that the structural response of concrete linings is governed primarily by cumulative heat exposure and heating duration rather than short-term peak temperatures [55,56], this interpretation is consistent with the integral metrics reported in Section 3.3 Table 5 and Table 6, which indicate greater overall thermal exposure in Test 4-B than in Test 4-A.
3.3. Cross-Test Comparison and Interpretation
The results are interpreted primarily from the thermocouple temperature–time histories in relation to the nominal ventilation condition and source geometry. Because some uncontrolled variability is inherent in full-scale fire experiments, the comparisons presented here should be read as descriptive full-scale observations rather than as strictly replicated measurements of a single deterministic response. In the baseline series, the same source elevation and ventilation pairings were examined at three successive locations within the same tunnel under otherwise similar geometric conditions. This improves confidence in the consistency of the observed trends, although it does not eliminate local variability within the tunnel. The elevated-source comparison is based on a single elevation contrast at cross-section 3 rather than a systematic multi-elevation parameter sweep and is therefore interpreted as a mechanistic full-scale comparison rather than a general elevation-scaling relationship.
The observed temperature histories can be interpreted in terms of the ventilation-flow mechanisms discussed in the Introduction. Under lower ventilation velocities, plume deflection and entrainment were more limited, favouring local smoke accumulation above the fire source and resulting in earlier, sharper temperature peaks. Under higher ventilation velocities, greater longitudinal momentum promoted plume inclination, entrainment, and downstream transport of hot gases, delaying the occurrence of peak temperatures and prolonging the heating of the protected lining. This interpretation is consistent with the broader high-temperature plateaus observed in the temperature histories and with the cumulative thermal exposure indicated by the temperature–time integral metrics defined in Section 2.7.
Potential sources of experimental variability included deformation of fuel pans, changes in effective burning area, transient smoke accumulation, flame intermittency, and local differences in the tunnel profile between test locations. Accordingly, the thermocouple records are interpreted as measures of the thermal response of the protected lining rather than direct measurements of incident heat flux. Visual observations, infrared thermometry, and thermal imaging were used to support the interpretation of fire and smoke behaviour, but they were not treated as primary quantitative variables. In Test 3-A, several minutes of temperature data were not recorded because of a temporary power interruption affecting the data logger; these missing values were not reconstructed, and the analysis was based only on the available record. Direct measurements of heat release rate and incident heat flux were not obtained in the present study, so the interpretation relies primarily on lining temperature histories and supporting visual observations.
To quantify the overall thermal severity of each test, the thermocouple temperature histories were integrated over the observed fire duration, with the integration interval defined from ignition to the end of sustained burning for the corresponding test. For each thermocouple, the baseline-corrected temperature–time integral was calculated numerically using a trapezoidal approximation after subtracting the initial lining temperature recorded prior to fire exposure. Table 5 reports these individual thermocouple integrals, which make the spatial distribution of thermal exposure explicit.
Table 5.
Individual thermocouple temperature–time integrals for the full-scale fire tests.
The sectional metrics in Table 6 were then obtained from the same set of records using the definitions in Section 2.7: the mean thermal exposure per thermocouple, the cumulative cross-sectional thermal exposure, and the duration-normalised thermal exposure index. Approximately 4 min of temperature data from Test 3-A were lost due to a temporary power interruption, which likely contributed to the relatively low integral values reported for that test in Table 5 and Table 6. In the following comparative assessment, Test 3 is therefore excluded from the quantitative baseline averaging.
Table 6.
Sectional temperature–time integral metrics for the full-scale fire tests.
These detailed values show, for example, that TC1 remained systematically lower than the other thermocouples in the higher-ventilation cases, consistent with the local shielding discussed above. The aggregated results also indicate that higher ventilation produced greater overall thermal exposure in the baseline series despite comparable peak temperatures. Considering Tests 1 and 2, which provide complete paired baseline records, the cumulative thermal exposure under the four-fan configuration was 54.8% higher than under the two-fan configuration, while the duration-normalised thermal exposure index was 55.4% higher.
The same metric also helps clarify the interpretation of Test 4. Test 4-A produced the highest local peak temperatures, which remain structurally relevant because elevated heating can degrade concrete through dehydration, thermal cracking, aggregate decomposition, and spalling, while reinforcing steel progressively loses load-bearing capacity and is commonly protected from temperatures above approximately 250–300 °C [5]. However, the cumulative thermal exposure in Test 4-B was 51.6% higher, and the duration-normalised index was 32.5% higher. The higher-ventilation case therefore imposed the greater overall thermal exposure of the lining, supporting the conclusion that peak temperature alone is insufficient to characterise structural thermal severity under the present conditions.
A comparison between the lower source-elevation series and the configuration with increased source elevation provides further quantitative insight. Using the mean values from Tests 1 and 2 as the reference, increasing the source elevation produced a 70.9% increase in cumulative thermal exposure and an 80.1% increase in the duration-normalised index under lower ventilation. Under higher ventilation, the corresponding increases were 67.4% and 53.6%, respectively. Together, the thermocouple-level and sectional metrics confirm that reducing the source-to-ceiling distance intensifies local heating and increases the overall thermal exposure of the lining.
Across the three baseline cross-sections, the same pattern emerged. Higher longitudinal ventilation delayed peak lining temperatures and produced broader high-temperature plateaus, whereas lower ventilation generated earlier and sharper peaks. The temperature–time integrals, evaluated at each thermocouple and then aggregated into mean and sectional measures, show that ventilation mainly redistributed thermal exposure in time rather than simply suppressing temperature rise. Even when peak temperatures under higher ventilation were comparable to or slightly lower than those under reduced ventilation, elevated temperatures persisted longer and produced greater cumulative thermal loading of the protected lining.
The configuration with increased source elevation modified this pattern by reducing the source-to-ceiling distance and intensifying plume interaction with the upper tunnel region. Under this condition, the lower-ventilation case produced the highest short-duration temperature peaks of the campaign, whereas the higher-ventilation case again produced more sustained thermal exposure. Visual observations are consistent with the interpretation that increased ventilation enhanced plume deflection and downstream hot-gas transport, whereas reduced ventilation favoured smoke accumulation, radiative shielding, and shorter but more localised heating. Taken together, the tests show that ventilation intensity and fire-source elevation jointly controlled the magnitude, duration, and spatial character of structural thermal exposure.
4. Conclusions
This study examined how longitudinal ventilation influences the structural thermal exposure of protected tunnel linings in full-scale fire tests under two ventilation intensities and two fire-source elevations. Across the test series, ventilation influenced the temporal structure of heating more strongly than peak temperature alone. Higher longitudinal airflow generally delayed peak lining temperatures and produced broader, more sustained high-temperature plateaus, whereas lower airflow produced earlier, sharper peaks. Even when reduced ventilation generated greater short-duration maxima, particularly at the higher source elevation, stronger ventilation maintained elevated temperatures for longer and produced more persistent thermal exposure.
The results also show that fire-source elevation modifies how ventilation influences lining heating. When the fire source was positioned closer to the tunnel crown, the lower-ventilation case produced the highest local peak temperatures of the campaign, whereas the higher-ventilation case produced a lower but longer-lasting thermal response. Visual observations suggest that these differences were associated with changes in plume deflection, smoke accumulation, and radiative attenuation. In particular, stronger ventilation appears to have promoted downstream transport of hot gases and reduced smoke shielding, whereas weaker ventilation appears to have encouraged the formation of a denser upper smoke layer that moderated line-of-sight radiation but intensified short-term local heating near the source. This interpretation is examined further with the limitations discussed below.
Overall, the findings show that, under the present full-scale test conditions and within the tested range of ventilation intensity and source elevation, longitudinal ventilation has a dual structural role in tunnel fires. It can reduce local peak temperatures while prolonging heating and redistributing thermal exposure in time and space. Peak temperature should therefore not be used as the sole indicator of structural fire severity; exposure duration and cumulative exposure should also be considered. In the present study, the temperature–time integral distinguished short-duration peak heating from more persistent thermal exposure and showed that higher ventilation increased cumulative thermal severity even when peak temperatures alone suggested a different ranking.
This study has several limitations that should be considered when interpreting the results.
First, the experimental campaign was comparative rather than fully factorial: ventilation condition and source elevation were not varied independently across a complete matrix of combinations. The three baseline cross-sections provided repeated observations under nominally identical conditions but were tested at successive locations within the same tunnel rather than as true statistical replicates. The experimental variables were also limited in range: only two longitudinal ventilation configurations were used in the fire tests, with mean pre-ignition velocities of 0.88–1.35 m/s for two-fan operation and 1.79–2.03 m/s for four-fan operation, and only two fire-source elevations, 2.1 m and 4.1 m, were tested within a single tunnel geometry, fuel mixture, and fuel load. The results should therefore be read as descriptive full-scale comparative observations rather than as strictly replicated measurements of a single deterministic response.
Second, the nominal fire size of approximately 5 MW was derived from literature correlations and applied uniformly across tests; actual burning rates likely varied between tests due to fuel-pan deformation and possible ventilation-influenced combustion effects, which could not be independently quantified without direct HRR measurement. The reported thermal-exposure comparisons are based on directly measured lining temperatures and are therefore not dependent on the accuracy of the nominal HRR estimate, although the absolute fire size of each individual test remains unverified.
Third, the interpretation that higher ventilation increased direct radiative exposure of the lining by reducing smoke shielding is consistent with measured peak-timing shifts, cumulative thermal-exposure integrals, and the differential response of the partially shielded thermocouple TC1 but was not confirmed by direct measurement of incident heat flux, smoke optical density, or gas-phase temperature.
Future work should extend this comparative dataset toward a fully factorial design and incorporate direct HRR, heat-flux, smoke-extinction, and gas-phase temperature measurements to verify and generalise the mechanisms proposed here with greater statistical confidence. Further investigations should also examine broader energy-based exposure metrics and the influence of elevated fire-source configurations and sub-plume airflow pathways on the combined convective and radiative loading of tunnel linings. Given the scarcity and cost of full-scale tunnel fire experiments, future campaigns would benefit from a more comprehensive instrumentation strategy, including heat-flux sensors, gas-phase thermocouple arrays, smoke-extinction or optical-density measurements, and direct HRR instrumentation. Such expanded datasets would enhance understanding of tunnel fire behaviour and support the development and validation of CFD models. These findings support the inclusion of duration-dependent, cumulative thermal-exposure metrics, alongside peak temperature, in performance-based approaches to tunnel structural fire design.
Author Contributions
Conceptualization, A.P. and R.G.; methodology, A.P.; formal analysis, A.P. and M.W.; investigation, A.P., M.W. and R.G.; resources, R.G.; data curation, A.P.; writing—original draft preparation, A.P.; writing—review and editing, R.G.; visualization, A.P.; supervision, R.G.; project administration, R.G.; funding acquisition, R.G. All authors have read and agreed to the published version of the manuscript.
Funding
This research was funded by the Austrian Research Promotion Agency (FFG) under the “Basisprogramm 2024” programme through the project “Sustainable Magnesium Casting” (Project No. FO999917989). The APC was funded by the Technical University of Leoben.
Data Availability Statement
The original contributions presented in the study are included in the article. Further inquiries can be directed to the corresponding author.
Acknowledgments
The authors would like to express their sincere gratitude to RAUCH Furnace Technology GmbH and Franken Maxit Mauermörtel GmbH & Co. for the professional collaboration throughout the project, including the provision of materials and technical support for tunnel lining protection applications, as well as assistance with the measurement setup. Their continuous support and successful cooperation are gratefully acknowledged.
Conflicts of Interest
The authors declare no conflicts of interest. The funders had no role in the design of the study; in the collection, analyses, or interpretation of data; in the writing of the manuscript; or in the decision to publish the results.
Abbreviations
The following abbreviations are used in this manuscript:
| ZaB | Zentrum am Berg |
| HRR | Heat release rate |
| RH | Relative humidity |
| TC | Thermocouple |
References
- Ingason, H.; Li, Y.Z.; Lönnermark, A. Tunnel Fire Dynamics; Springer: New York, NY, USA, 2015. [Google Scholar]
- Carvel, R. A review of tunnel fire research from Edinburgh. Fire Saf. J. 2019, 105, 300–306. [Google Scholar] [CrossRef] [Scilit]
- Carvel, R.O.; Beard, A.N.; Jowitt, P.W.; Drysdale, D.D. The Influence of Tunnel Geometry and Ventilation on the Heat Release Rate of a Fire. Fire Technol. 2004, 40, 5–26. [Google Scholar] [CrossRef] [Scilit]
- Carvel, R. Fire Size in Tunnels. Ph.D. Thesis, University of Edinburgh, Edinburgh, UK, September 2004. [Google Scholar]
- Beard, A.; Carvel, R. (Eds.) Handbook of Tunnel Fire Safety, 2nd ed.; ICE Publishing: London, UK, 2012. [Google Scholar]
- Lönnermark, A.; Ingason, H. The Effect of Cross-Sectional Area and Air Velocity on the Conditions in a Tunnel During a Fire; SP Report 2007:05; SP Technical Research Institute of Sweden: Borås, Sweden, 2007. [Google Scholar]
- Li, Y.Z.; Ingason, H. Position of Maximum Ceiling Temperature in a Tunnel Fire. Fire Technol. 2014, 50, 889–905. [Google Scholar] [CrossRef] [Scilit]
- Li, Y.Z.; Lei, B.; Ingason, H. The maximum temperature of buoyancy-driven smoke flow beneath the ceiling in tunnel fires. Fire Saf. J. 2011, 46, 204–210. [Google Scholar] [CrossRef] [Scilit]
- Li, Y.Z.; Ingason, H. Maximum Ceiling Temperature in a Tunnel Fire; SP Report 2010:51; SP Technical Research Institute of Sweden: Borås, Sweden, 2010. [Google Scholar]
- Yao, Y.; He, K.; Peng, M.; Shi, L.; Cheng, X. The maximum gas temperature rises beneath the ceiling in a longitudinal ventilated tunnel fire. Tunn. Undergr. Space Technol. 2021, 108, 103672. [Google Scholar] [CrossRef] [Scilit]
- Li, Y.Z.; Ingason, H. Fire-Induced Ceiling Jet Characteristics in Tunnels Under Different Ventilation Conditions; SP Report 2015:23; SP Technical Research Institute of Sweden: Borås, Sweden, 2015. [Google Scholar]
- Ingason, H.; Li, Y.Z. Model scale tunnel fire tests with longitudinal ventilation. Fire Saf. J. 2010, 45, 371–384. [Google Scholar] [CrossRef] [Scilit]
- Gong, L.; Jiang, L.; Li, S.; Shen, N.; Zhang, Y.; Sun, J. Theoretical and experimental study on longitudinal smoke temperature distribution in tunnel fires. Int. J. Therm. Sci. 2016, 102, 319–328. [Google Scholar] [CrossRef] [Scilit]
- Zhong, W.; Liu, L.; Han, N.; Gao, Z.; Zhao, J. Investigation on the maximum ceiling temperature of the weak plume impingement flow in tunnel fires under longitudinal ventilation. Tunn. Undergr. Space Technol. 2023, 131, 104821. [Google Scholar] [CrossRef] [Scilit]
- Roh, J.S.; Ryou, H.S.; Kim, D.H.; Jung, W.S.; Jang, Y.J. Critical velocity and burning rate in pool fire during longitudinal ventilation. Tunn. Undergr. Space Technol. 2007, 22, 262–271. [Google Scholar] [CrossRef] [Scilit]
- Li, L.; Mei, P.; Li, S.; Zhang, H. Effect of longitudinal ventilation on heat release rate of tunnel fires. Tunn. Undergr. Space Technol. 2012, 30, 230–232. [Google Scholar] [CrossRef] [Scilit]
- Li, Y.Z.; Fan, C.G.; Ingason, H.; Lönnermark, A.; Ji, J. Effect of cross section and ventilation on heat release rates in tunnel fires. Tunn. Undergr. Space Technol. 2016, 51, 414–423. [Google Scholar] [CrossRef] [Scilit]
- Maevski, I. Design Fires in Road Tunnels; National Academies Press: Washington, DC, USA, 2011. [Google Scholar]
- Schrefler, B.; Brunello, P.; Gawin, D.; Majorana, C.E.; Pesavento, F. Concrete at high temperature with application to tunnel fire. Comput. Mech. 2002, 29, 43–51. [Google Scholar] [CrossRef] [Scilit]
- Volpini, H.N. Thermal Exposure in Concrete Tunnels Subjected to Fire. Master’s Thesis, Delft University of Technology, Delft, The Netherlands, May 2020. [Google Scholar]
- Davidy, A. CFD Calculations of Soot Radiation Absorption Coefficients during Pool Tunnel Fire. IOSR J. Mech. Civ. Eng. 2017, 14, 36–42. [Google Scholar] [CrossRef] [Scilit]
- Wang, J.; Fang, Z.; Tang, Z.; Yuan, J. Influence of longitudinal ventilation on the mass flow rate distribution of fire smoke flow in tunnels. Tunn. Undergr. Space Technol. 2021, 112, 103938. [Google Scholar] [CrossRef] [Scilit]
- Khattri, S.K.; Log, T.; Kraaijeveld, A. A novel representation of the critical ventilation velocity for mitigating tunnel fires. Tunn. Undergr. Space Technol. 2021, 112, 103853. [Google Scholar] [CrossRef] [Scilit]
- Yousefi, M.; Yousefi, M.; Safikhani, H.; Inthavong, K.; Bamdad, K. Study of the critical velocity of the tunnels using an analytical approach. Fire Saf. J. 2021, 123, 103372. [Google Scholar] [CrossRef] [Scilit]
- Liu, Y.; Fang, Z.; Tang, Z.; Beji, T.; Merci, B. Analysis of experimental data on the effect of fire source elevation on fire and smoke dynamics and the critical velocity in a tunnel with longitudinal ventilation. Fire Saf. J. 2020, 114, 103002. [Google Scholar] [CrossRef] [Scilit]
- Savalanpour, H.; Farhanieh, B.; Afshin, H. Proposing a general formula to calculate the critical velocities in tunnels with different cross-sectional shapes. Tunn. Undergr. Space Technol. 2021, 110, 103798. [Google Scholar] [CrossRef] [Scilit]
- Zhang, T.; Wang, G.; Li, J.; Huang, Y.; Zhu, K.; Wu, K. Experimental study of back-layering length and critical velocity in longitudinally ventilated tunnel fire with various rectangular cross-sections. Fire Saf. J. 2021, 126, 103483. [Google Scholar] [CrossRef] [Scilit]
- Xu, Z.; Zhou, D.; Tao, H.; Zhang, X.; Hu, W. Investigation of critical velocity in curved tunnel under the effects of different fire locations and turning radiuses. Tunn. Undergr. Space Technol. 2022, 126, 104553. [Google Scholar] [CrossRef] [Scilit]
- Zhang, X.; Lyu, B.; Wen, J.; Huang, Y.; Zhang, Z.; Li, L. Critical velocity and back-layering length of arched tunnels with large sectional aspect ratios under different fire-source–side-wall distances. Tunn. Undergr. Space Technol. 2025, 163, 106673. [Google Scholar] [CrossRef] [Scilit]
- Chen, Y.; Feng, Q.; Zhao, Y.; Wang, P.; Zhang, Y. Ceiling temperature rise and critical ventilation velocity under the influence of burner dimensions in tunnel fires. Tunn. Undergr. Space Technol. 2024, 150, 105808. [Google Scholar] [CrossRef] [Scilit]
- Peng, W.; Zhang, W.; Zhang, S.; Xie, Q.; Ren, J.; Zhong, W. Experimental study on the effect of dual fire sources elevation on flame merging characteristics in road tunnels with natural ventilation. Tunn. Undergr. Space Technol. 2025, 155, 106238. [Google Scholar] [CrossRef] [Scilit]
- Qiu, A.; Hu, L.; Chen, L.F.; Carvel, R.O. Flame extension lengths beneath a confined ceiling induced by fire in a channel with longitudinal air flow. Fire Saf. J. 2018, 97, 29–43. [Google Scholar] [CrossRef] [Scilit]
- Li, Z.; Zhang, Y.; Jiang, H.; Tang, C.; Luo, D.; Chen, L.; Lin, Y.; Li, T. Effect of Fire Source Elevation on the Smoke Spreading Characteristics in an Extra-Long Tunnel. Fire Technol. 2024, 60, 1313–1332. [Google Scholar] [CrossRef] [Scilit]
- Li, Z.; Zhang, Y.; Cheng, Y.; Lin, Y.; Gao, Y.; Luo, D. Full-Scale Experimental Investigation and Analysis of Transverse Temperature Profile and Smoke Back-Layering Length in an Extralong Mountain Tunnel with Ambient Wind. Process Saf. Environ. Prot. 2025, 201, 107562. [Google Scholar] [CrossRef] [Scilit]
- Massachusetts Highway Department; Federal Highway Administration. Memorial Tunnel Fire Ventilation Test Program; Test Report; Massachusetts Highway Department and Federal Highway Administration: Boston, MA, USA, 1995. [Google Scholar]
- Studiensgesellschaft Stahlanwendung e.V. Fires in Transport Tunnels; Report on Full-Scale Test; EUREKA Project EU 499: FIRETUN; Studiensgesellschaft Stahlanwendung e.V.: Dusseldorf, Germany, 1995. [Google Scholar]
- Ingason, H.; Li, Y.Z.; Lönnermark, A. Runehamar tunnel fire tests. Fire Saf. J. 2015, 71, 134–149. [Google Scholar] [CrossRef] [Scilit]
- Lönnermark, A. On the Characteristics of Fires in Tunnels. Ph.D. Thesis, Lund University, Lund, Sweden, September 2005. [Google Scholar]
- Maraveas, C.; Vrakas, A.A. Design of Concrete Tunnel Linings for Fire Safety. Struct. Eng. Int. 2014, 24, 319–329. [Google Scholar] [CrossRef] [Scilit]
- Zhu, Y. Experimental and Numerical Techniques for the Investigation of the Fire Response of Tunnel Linings. Master’s Thesis, The University of Queensland, Brisbane, Australia, September 2021. [Google Scholar]
- Chen, H.; Liu, T.; You, X.; Yuan, D.; Ping, Y.; Zhang, Q. Experimental investigation on fire damage to staggered segmental lining of shield tunnel. Tunn. Undergr. Space Technol. 2023, 141, 105359. [Google Scholar] [CrossRef] [Scilit]
- Sakkas, K.; Vagiokas, N.; Tsiamouras, K.; Mandalozis, D.; Benardos, A.; Nomikos, P. In-situ fire test to assess tunnel lining fire resistance. Tunn. Undergr. Space Technol. 2019, 85, 368–374. [Google Scholar] [CrossRef] [Scilit]
- Wang, F.; Wang, M.; Huo, J. The effects of the passive fire protection layer on the behavior of concrete tunnel linings: A field fire testing study. Tunn. Undergr. Space Technol. 2017, 69, 162–170. [Google Scholar] [CrossRef] [Scilit]
- Zhu, Z.; Quiel, S.E.; Naito, C.J. Performance-Based Optimization of Passive and Active Fire Protection for the Resilience of Concrete Tunnel Liners to Vehicular Fires. Fire Technol. 2025, 61, 4685–4721. [Google Scholar] [CrossRef] [Scilit]
- Lemaire, T.; Kenyon, Y. Large Scale Fire Tests in the Second Benelux Tunnel. Fire Technol. 2006, 42, 329–350. [Google Scholar] [CrossRef] [Scilit]
- McGrattan, K.B.; Baum, H.R.; Hamins, A. Thermal Radiation from Large Pool Fires; NISTIR 6546; National Institute of Standards and Technology: Gaithersburg, MD, USA, 2000. [Google Scholar]
- PIARC. Fire and Smoke Control in Road Tunnels; Report 05.05.B; Permanent International Association of Road Congresses: Paris, France, 1999. [Google Scholar]
- Borghetti, F.; Derudi, M.; Gandini, P.; Frassoldati, A.; Tavelli, S. Tunnel Fire Testing and Modeling. The Morgex North Tunnel Experiment; Springer International Publishing: Cham, Switzerland, 2017. [Google Scholar]
- TSI Incorporated. VelociCalc® Air Velocity Meters Models 9515, 9535, 9535-A, 9545 and 9545-A. 2024. Available online: https://tsi.com/getmedia/06a2637e-0194-47fc-93d7-d663b60d995b/9515-9535-9545-VelociCalc_A4_UK_5001015-web?ext=.pdf (accessed on 2 May 2024).
- TSI Incorporated. VelociCalc®/VelociCalc® Pro Air Velocity Meter Model 9600 Series. 2024. Available online: https://tsi.com/getmedia/85b405d0-2a89-4bc6-9710-74085ec404c6/9600_Series_Veloci-Calc_Mnl_6016122A-US-web?ext=.pdf (accessed on 2 October 2024).
- ABB Measurement & Analytics. SensyTemp TSC400 Industrial Thermometer, Data Sheet. 2024. Available online: https://search.abb.com/library/Download.aspx?DocumentID=DS%2fTSC400&LanguageCode=en&DocumentPartId=&Action=Launch (accessed on 2 May 2024).
- Wickström, U. Temperature Calculation in Fire Safety Engineering; Springer International Publishing: Cham, Switzerland, 2016. [Google Scholar]
- Schabowicz, K.; Sulik, P.; Zawiślak, Ł. Identification of the Destruction Model of Ventilated Facade under the Influence of Fire. Materials 2020, 13, 2387. [Google Scholar] [CrossRef] [Scilit] [PubMed]
- DiNenno, P.J.; Drysdale, D.; Beyler, C.L.; Walton, W.D.; Custer, R.L.P.; Hall, J.R.; Watts, J.M. (Eds.) SFPE Handbook of Fire Protection Engineering, 3rd ed.; National Fire Protection Association: Quincy, MA, USA, 2002. [Google Scholar]
- de Silva, D.; Andreini, M.; Bilotta, A.; De Rosa, G.; La Mendola, S.; Nigro, E.; Rios, O. Structural safety assessment of concrete tunnel lining subjected to fire. Fire Saf. J. 2022, 134, 103697. [Google Scholar] [CrossRef] [Scilit]
- Khoury, G.A. Effect of fire on concrete and concrete structures. Prog. Struct. Mat. Eng. 2000, 2, 429–447. [Google Scholar] [CrossRef] [Scilit]

Disclaimer/Publisher’s Note: The statements, opinions and data contained in all publications are solely those of the individual author(s) and contributor(s) and not of MDPI and/or the editor(s). MDPI and/or the editor(s) disclaim responsibility for any injury to people or property resulting from any ideas, methods, instructions or products referred to in the content. |
© 2026 by the authors. Licensee MDPI, Basel, Switzerland. This article is an open access article distributed under the terms and conditions of the Creative Commons Attribution (CC BY) license.