


Abstract
In mountainous wildfire response, unmanned aerial vehicle (UAV) emergency services depend on rapidly deployable and spatially reliable vertiports. However, existing site-selection methods insufficiently support continuous UAV operations in topographically complex terrain. This study develops a geographic information system (GIS)-based framework integrating Multi-Criteria Decision-Making (MCDM) and k-medoids clustering to shift UAV vertiport planning from individual site suitability ranking to networked deployment. The framework organizes feasible vertiport candidates into sector-based support staging nodes for coordinated multi-node wildfire response. Applied to the Xichang wildfire, the selected vertiport candidates reduced the mean first-arrival time by up to 71.4% compared with existing fire stations. Under differentiated reload-time assumptions, the staging node support mode further reduced the mean sortie cycle time by up to 56.85% and increased the mean delivery capacity from 17 to 42 fire-extinguishing bombs per UAV per hour. These results indicate that combining vertiport suitability evaluation with staging node-based logistical coordination improves the spatial organization and operational efficiency of UAV-enabled wildfire suppression. The framework offers decision support for networked UAV vertiport and staging node deployment in mountainous wildfire response.
1. Introduction
In recent years, the increasing frequency of wildfires in mountainous regions has placed growing demands on the timeliness, flexibility, and forward-deployment capacity of emergency response systems [1]. Wildfires typically occur suddenly, spread rapidly, and are highly susceptible to the combined effects of terrain and weather conditions [1]. During the 2020 Xichang forest wildfire rescue operation in China, cross-regional coordination of helicopters and unmanned aerial vehicles (UAVs) significantly enhanced wildfire reconnaissance and information acquisition capabilities [2,3,4,5,6]. In several recent major wildfires in California, rugged terrain and complex meteorological conditions hindered both ground forces and aviation resources operating from fixed airfields, limiting their ability to rapidly reach core wildfire zones and intervene effectively [7,8,9,10]. Similar operational challenges have also been observed in major disaster response operations [11,12,13].
UAVs, characterized by flexible deployment, relatively low takeoff and landing requirements, and high maneuverability, have gradually emerged as a crucial technological tool for building distributed and resilient emergency response systems [14,15,16,17,18]. They have demonstrated significant potential in rescue operations, emergency communication coverage, disaster assessment, wildfire monitoring, and search-and-rescue missions [19,20,21,22,23,24,25,26,27]. With the continuous development of low-altitude aviation and related support mechanisms, the coordination among vertiport selection, UAV route planning, endurance management, and emergency support has become increasingly important for improving mission continuity and response efficiency [14,28,29,30].
GIS-based multi-criteria decision analysis (GIS-MCDA) has been widely used in spatial site selection to identify feasible areas, exclude unsuitable locations, define evaluation indicators, assign criterion weights, and rank candidate sites [31,32,33,34,35,36]. Methods such as analytic hierarchy process (AHP), technique for order preference by similarity to ideal solution (TOPSIS), and entropy weight method (EWM) are commonly applied in this process [37,38,39].
The National Aeronautics and Space Administration (NASA) vertiport considerations study indicates that takeoff-and-landing infrastructure planning should account for siting, design, safety, environmental conditions, utilities, contingency support, and operational integration [40]. Following this operational perspective, this study combines single-site selection with network-based deployment to support rational UAV resource allocation and enhance the sustained operational capability of UAVs in emergency response.
Nevertheless, existing vertiport planning concepts cannot be directly transferred to mountainous wildfire response. Most vertiport guidelines are developed for planned vertical take-off and landing (VTOL) operations in structured urban or aviation environments [41,42]. Urban vertiport planning usually emphasizes passenger demand, charging processes, ground–air transport integration, and commercial operation scenarios. In contrast, UAV vertiports in wildfire emergency scenarios are often temporary or semi-prepared support nodes rather than fully equipped commercial vertiports. Their feasibility is mainly constrained by terrain safety, fire standoff distance, road accessibility, hydrological conditions, land cover, and local terrain barriers [43,44]. In addition, mountainous wildfire response requires coordination among multiple sectors and support nodes. Therefore, the network-oriented logic of vertiport planning should be adapted to terrain-constrained emergency UAV deployment.
Current research on UAV applications in firefighting mainly focuses on remote sensing, wildfire detection, fire-front monitoring, and flight navigation [45,46]. Less attention has been paid to the pre-planning of vertiports that support continuous UAV operations before and during wildfire response [47,48]. Existing studies have provided useful foundations for GIS-based site suitability assessment, local UAV landing detection [34,35,49,50], and vertiport planning [41,42]. However, an integrated framework linking terrain-constrained vertiport screening, accessibility-network construction, staging node deployment, and multi-UAV validation for mountainous wildfire response remains insufficient. In complex mountainous environments, UAV operational effectiveness depends not only on platform performance or local landing feasibility, but also on whether suitable vertiports can be spatially connected, logistically supported, and organized into a robust deployment network.
To address the above limitations, this study proposes a GIS-based framework that extends UAV vertiport planning from individual site suitability evaluation to networked staging node deployment for sustained mountainous wildfire response. The main contributions of this study are summarized as follows:
- (1)
- A systematic evaluation framework for UAV vertiport site selection is established using GIS spatial analysis and Multi-Criteria Decision-Making (MCDM), encompassing multi-dimensional constraints—terrain, land-cover, hydrology, safety buffers, and wildfire-response proximity—and a CRiteria Importance Through Intercriteria Correlation (CRITIC)-TOPSIS suitability ranking as the primary method; rank-percentile transformation and entropy weighting are employed as comparative normalization and weighting schemes for robustness assessment, thereby providing an objective spatial foundation for safe UAV deployment and mitigating the fragmentation and subjectivity of site selection in complex mountainous environments.
- (2)
- A sector-based staging node deployment method is proposed to organize high-ranking vertiport candidates into spatially coherent operating areas and to select actual vertiport candidates as staging nodes using k-medoids and three-dimensional assignment cost, thereby establishing a support network that minimizes inter-site transit costs and ensures continuous operational capacity;
- (3)
- Fire-suppression sortie simulations are conducted to compare fire-station, ordinary vertiport, and staging node operation modes in terms of first-arrival time, cycle time, and bomb-delivery rate, demonstrating that the proposed framework significantly reduces initial response times and enhances sustained fire-suppression efficiency compared to traditional approaches.
The remainder of this paper is organized as follows. Section 2 details the study area, data sources, GIS-based vertiport screening, MCDM suitability evaluation, and the sector-based staging node allocation method. Section 3 presents the evaluation results, including the suitability ranking, staging node selection, and operational validation of fire-suppression sorties. Finally, Section 4 discusses the implications of the proposed framework, its scalability, and future research directions.
2. Materials and Methods
2.1. Emergency UAV Platforms
This study focuses on vertiport planning for large UAVs used in wildfire suppression. Unlike small portable drones, these platforms are usually used for fire-agent delivery, emergency material transport, and communication support. Wildfire suppression is often not a single-flight task. It may involve repeated delivery, return for resupply, and follow-up operations. Therefore, large firefighting UAVs require not only higher payload and endurance capacity, but also safer and larger sites with ground-support conditions.
To define the research object and its application scope, we reviewed publicly available technical documents, product specifications, news reports, and demonstration records. Over 40 global firefighting and emergency-support UAV platforms were analyzed, and their dimensional information is summarized in Appendix A.1, Table A1. Based on this review, the AutoFlight CarryAll (V2000CGF; AutoFlight, Shanghai, China) was finally selected as the reference platform for vertiport dimensional analysis in this study. Among the reviewed firefighting UAVs, it has the largest overall dimensions and a strong suppression-oriented payload capability, as it can carry 400 kg fire-extinguishing canisters [51,52].
2.2. Flow Chart of Analysis
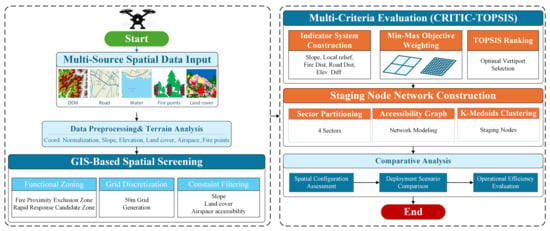
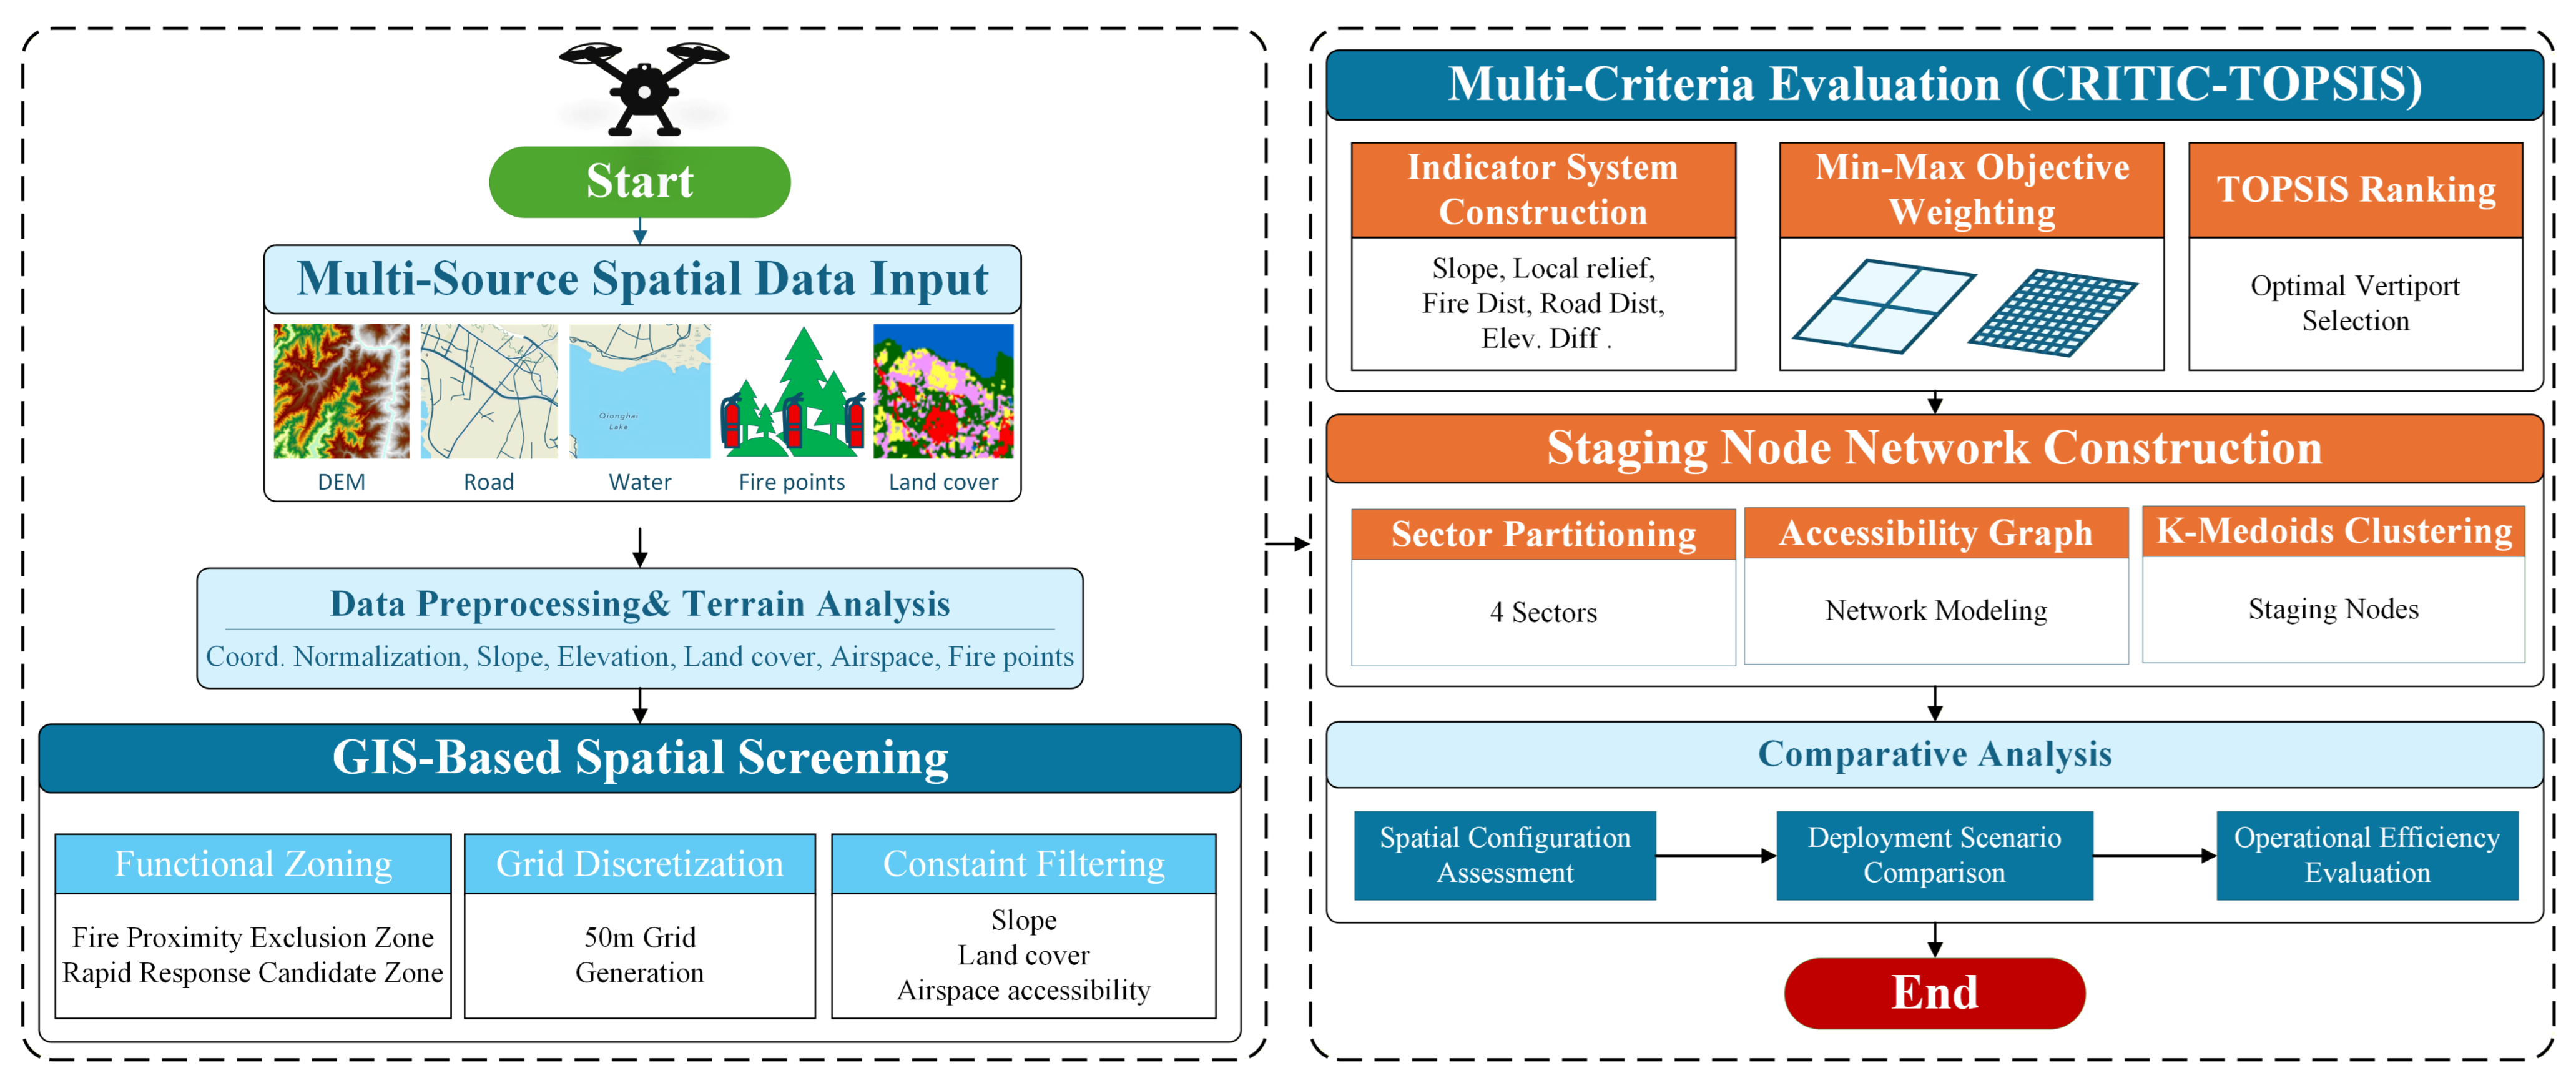
As shown in Figure 1, this study proposes a hierarchical workflow for UAV vertiport deployment in complex mountainous wildfire scenarios. First, multi-source geospatial data, including digital elevation model (DEM), road networks, water bodies, and wildfire locations, are collected and processed to derive terrain and accessibility indicators. Candidate vertiport points are generated on a regular grid, and a preliminary GIS-based feasibility screening is applied to remove unsuitable locations.
Figure 1.
Research workflow of the proposed UAV vertiport planning framework.
Next, a multi-criteria decision-making (MCDM) evaluation is performed on all feasible vertiport candidates to obtain suitability scores and rankings. The top 100 and top 200 vertiport candidates are then selected for further analysis. Following vertiport evaluation, a four-sector deployment strategy is applied. Within each sector, staging nodes are identified by minimizing the three-dimensional path cost.
Finally, an operational validation is conducted using the V2000CGF fire-suppression UAV. Three scenarios are simulated: vertiport-origin closed loop, vertiport-to-staging node transition, and staging nodes steady closed loop. Performance metrics such as flight time, sortie cycle, and bomb-delivery rate are calculated to evaluate the effectiveness of the hierarchical vertiport network.
2.3. Input Data
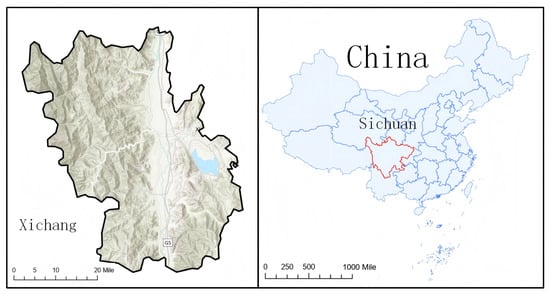
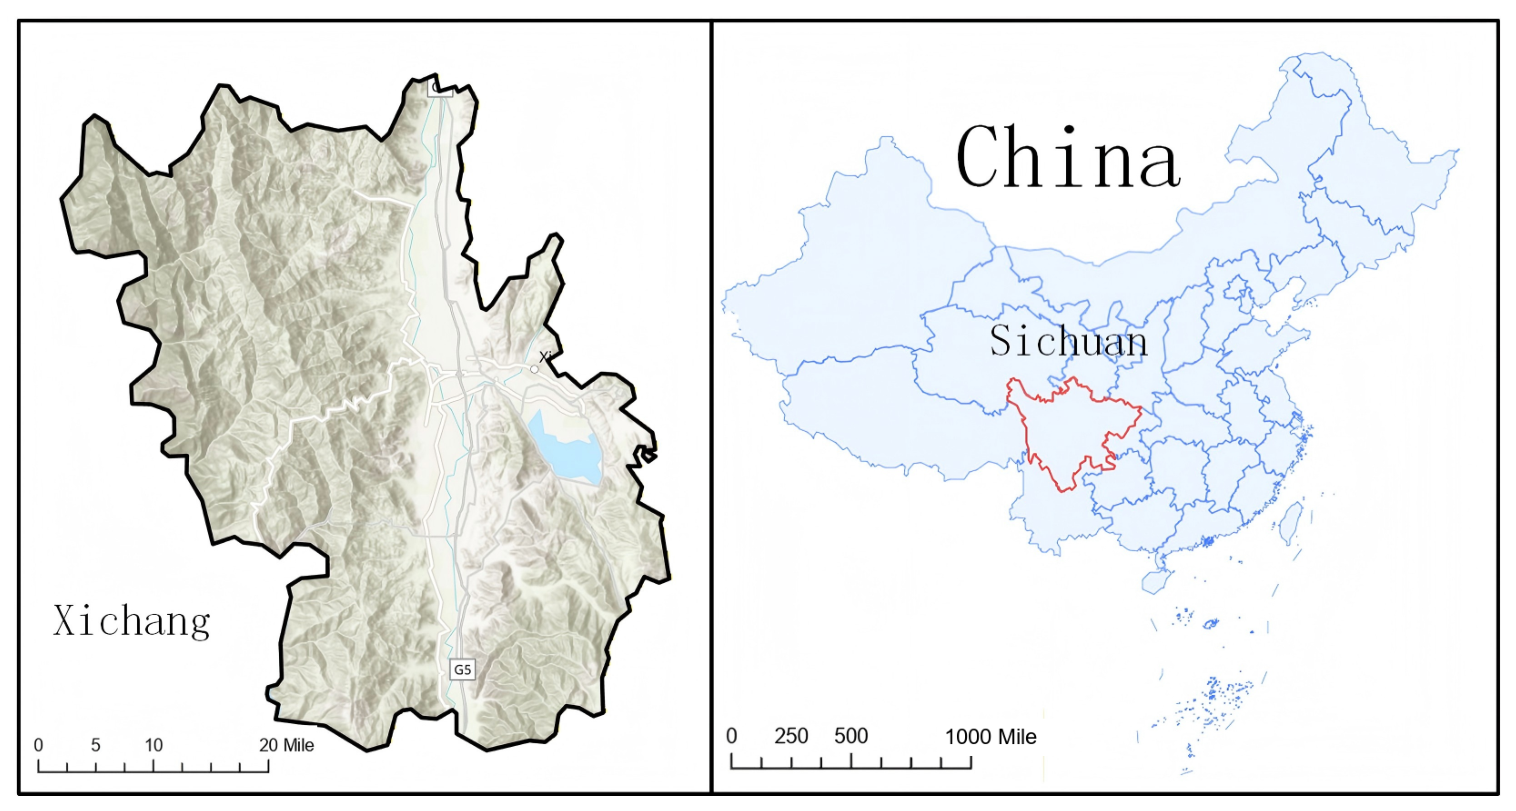
The study area is located in Xichang City, Liangshan Yi Autonomous Prefecture, Sichuan Province, China. A typical mountainous wildfire-affected area and its surrounding region were selected for analysis, covering approximately 500 km2 [3,5]. This area lies within the transitional terrain zone along the eastern edge of the Qinghai–Xizang Plateau, extending toward the mountainous region of western Sichuan. The terrain is characterized by significant topographic variability and pronounced spatial heterogeneity. The surface vegetation is primarily composed of Pinus yunnanensis and shrubs, exhibiting features of a plateau–slope composite landscape, as illustrated in Figure 2.
Figure 2.
Location of the study area.
The Xichang region faces persistent wildfire risk due to monsoon climate conditions and complex mountainous terrain. Fires in this area often start suddenly, spread rapidly, and are difficult to suppress. Steep slopes and sparse roads limit the access of ground emergency forces to the fire front. This delay may reduce the effectiveness of early response.
2.4. Data Sources and Preprocessing
This study integrated multi-source geospatial data, preprocessed all datasets in ArcGIS Pro 3.6 (Esri, Redlands, CA, USA), and unified them under the World Geodetic System 1984 Universal Transverse Mercator Zone 47 North (WGS 1984 UTM Zone 47N) coordinate system.
- (a)
- Terrain and Auxiliary Geographic Data
Digital elevation model (DEM) data provide the basic input for terrain feature extraction. In this study, the DEM was used to derive elevation, slope, and elevation variation. These variables were used to quantify the safety and operational difficulty of UAV vertiports.
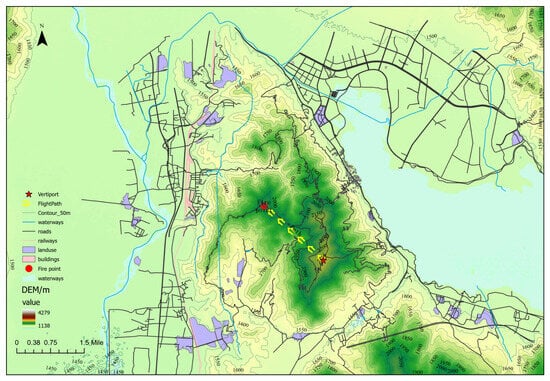
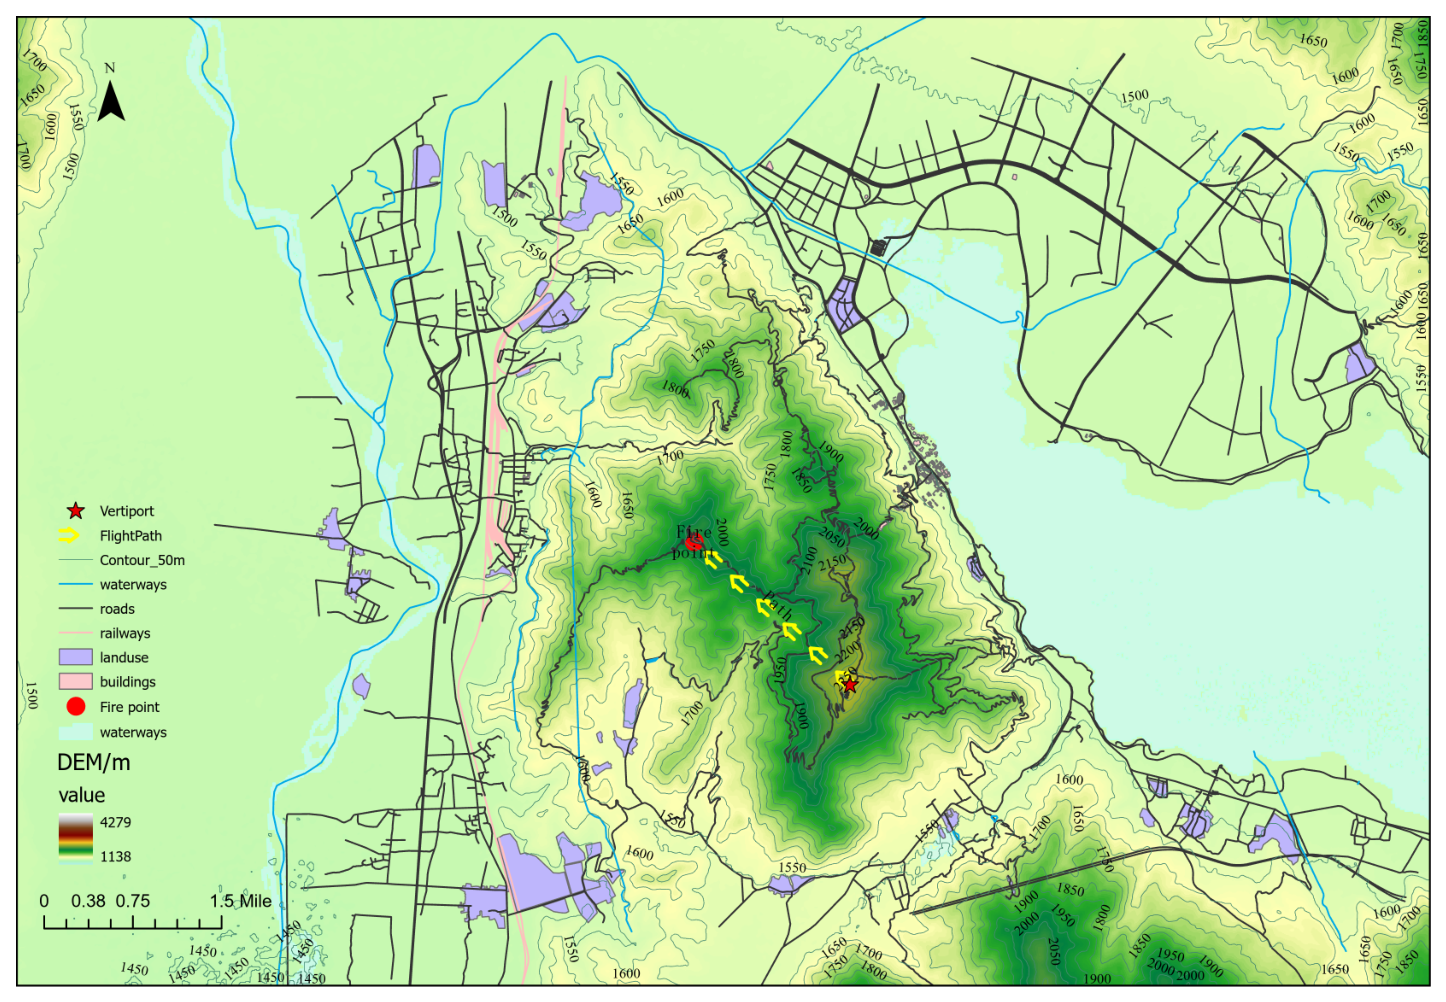
To describe the operating environment, the terrain variables were integrated with other geographic layers in the study area. These layers include 50 m contour lines, road networks, railways, land use, buildings, airports, and water bodies, as shown in Figure 3. The road network covers major highways, secondary roads, and accessible rural roads. The spatial proximity between UAV vertiports and the road network was then analyzed.
Figure 3.
Multi-source geographic information and terrain features in the study area.
- (b)
- Land-cover feasibility screening
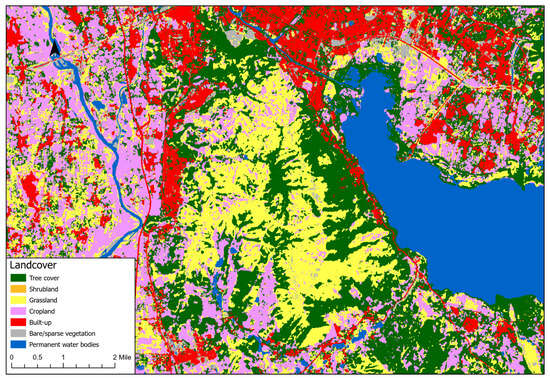
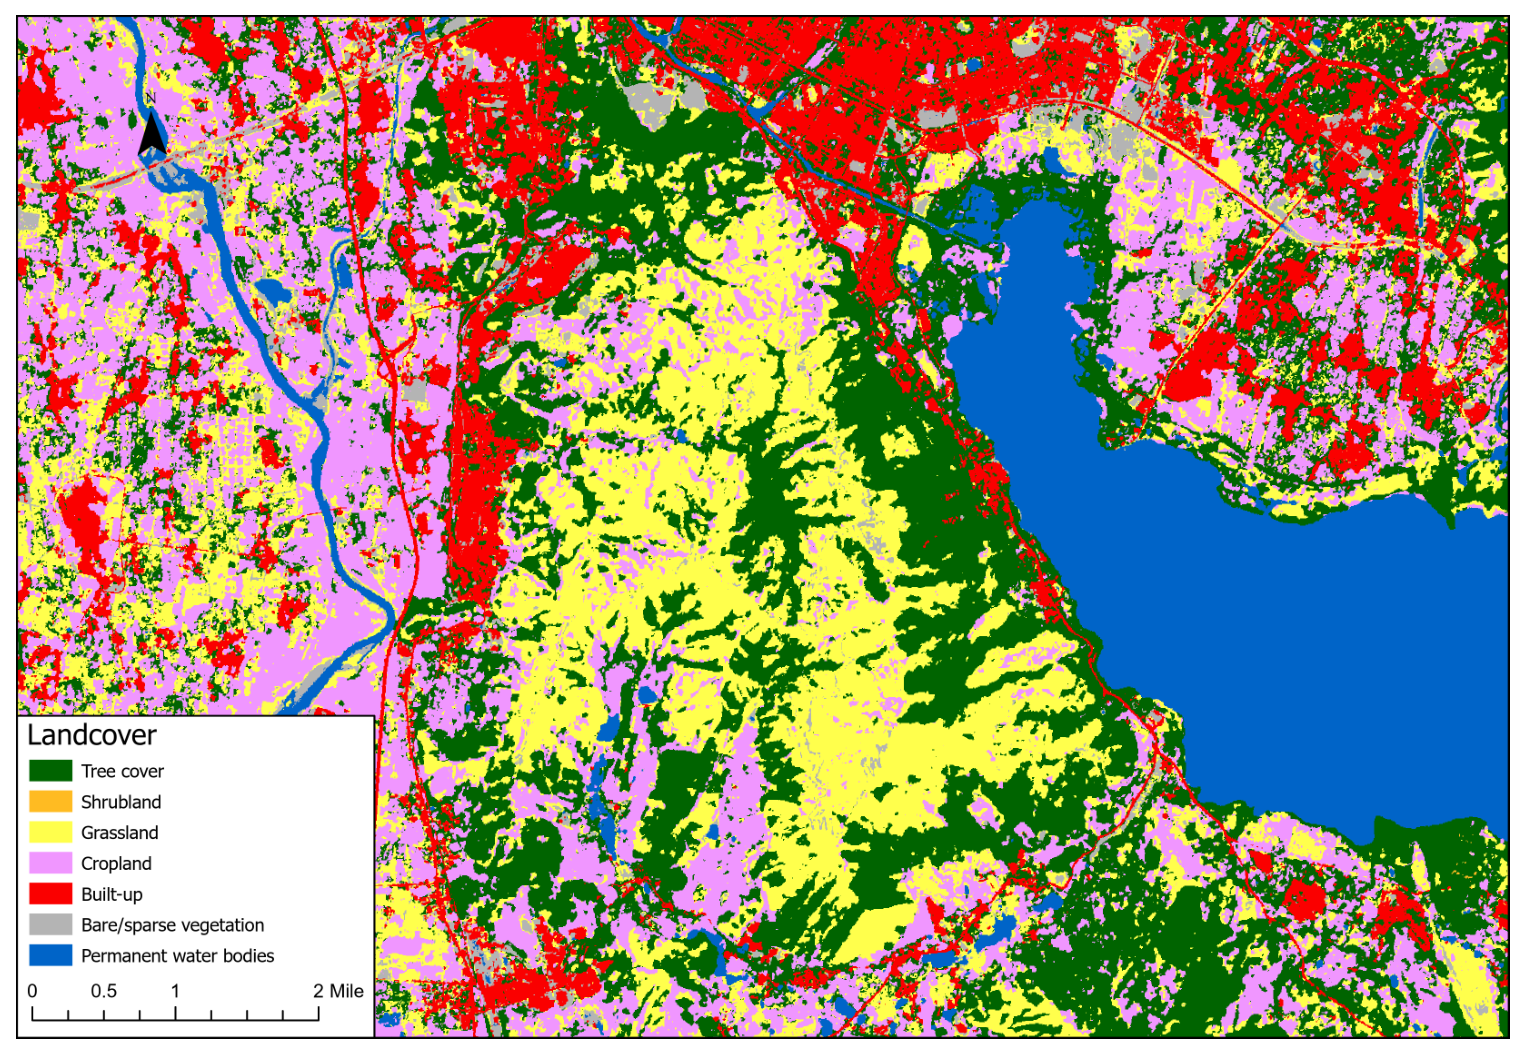
Land-cover information was obtained from the European Space Agency (ESA) WorldCover 10 m 2021 v200 product. The dataset was used to identify surface types within the candidate UAV vertiport units and to remove land-cover classes that are physically unsuitable for temporary UAV deployment. According to the land-cover classes appearing in the study area, four classes were retained as potentially feasible surface types: grassland, cropland, built-up areas, and bare/sparse vegetation. Although built-up areas may contain buildings and obstacles, they were not directly removed at this stage because the 10 m land-cover pixels in mountainous settlements may also include accessible hard-surface open spaces. The land-cover distribution of the study area is shown in Figure 4.
Figure 4.
Land cover distribution in the study area.
- (c)
- Data Preprocessing and Derivative Analysis
Multi-source data were integrated and processed in ArcGIS Pro 3.6. Derived layers were then generated to describe terrain conditions, infrastructure, environmental constraints, and airspace-related factors. These layers formed the spatial database used in the subsequent analysis. Table 1 lists the data sources used in this study.
Table 1.
Summary of input layers used in the analysis.
2.5. Key Factors for Emergency UAV Vertiport Planning
This study refers to more than 450 vertiport planning considerations collected by the NASA Advanced Air Mobility (AAM) Ecosystem Working Groups based on expert input. These considerations cover site selection, design, regulation, safety, environmental impact, social acceptance, and operational integration [40]. Among them, factors related to physical obstacles, surrounding land use, airspace, environmental conditions, mission demand, contingency, utilities, communication, and safety are relevant for UAV vertiport planning in forest wildfire response.
In addition, Huang et al. developed a systematic decision indicator system for helicopter vertiports in wildfire emergency response. The system includes four dimensions: geographical location, site conditions, meteorological factors, and obstacle limitations [44]. Although helicopters and UAVs differ in operation, this method provides useful guidance for vertiport planning in mountainous wildfire scenarios. It complements the AAM framework by considering high-frequency takeoff and landing, dynamic environments, and safety constraints.
Based on these considerations, this study reorganizes the relevant influencing factors into eight dimensions for vertiport planning under wildfire emergency scenarios, as summarized in Table 2.
Table 2.
Core factors affecting UAV vertiport planning in mountainous wildfire response.
To quantitatively evaluate these eight dimensions, this study defines five measurable indicators to assess the suitability of candidate vertiport locations. The remaining factors were not ignored, but were treated as qualitative operational considerations because they are difficult to quantify using available regional-scale spatial data. They should be further examined during detailed site design, field survey, and emergency deployment planning.
2.6. GIS-Based Site Selection Process
Functional Zoning and Service Radius
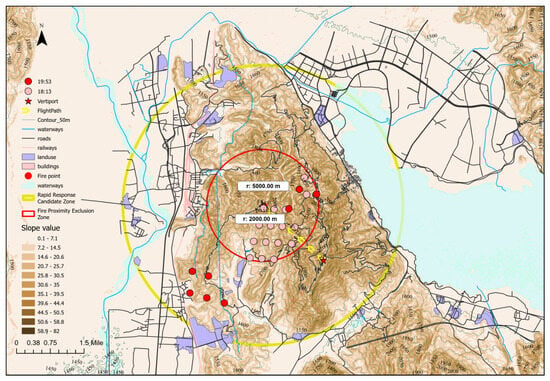
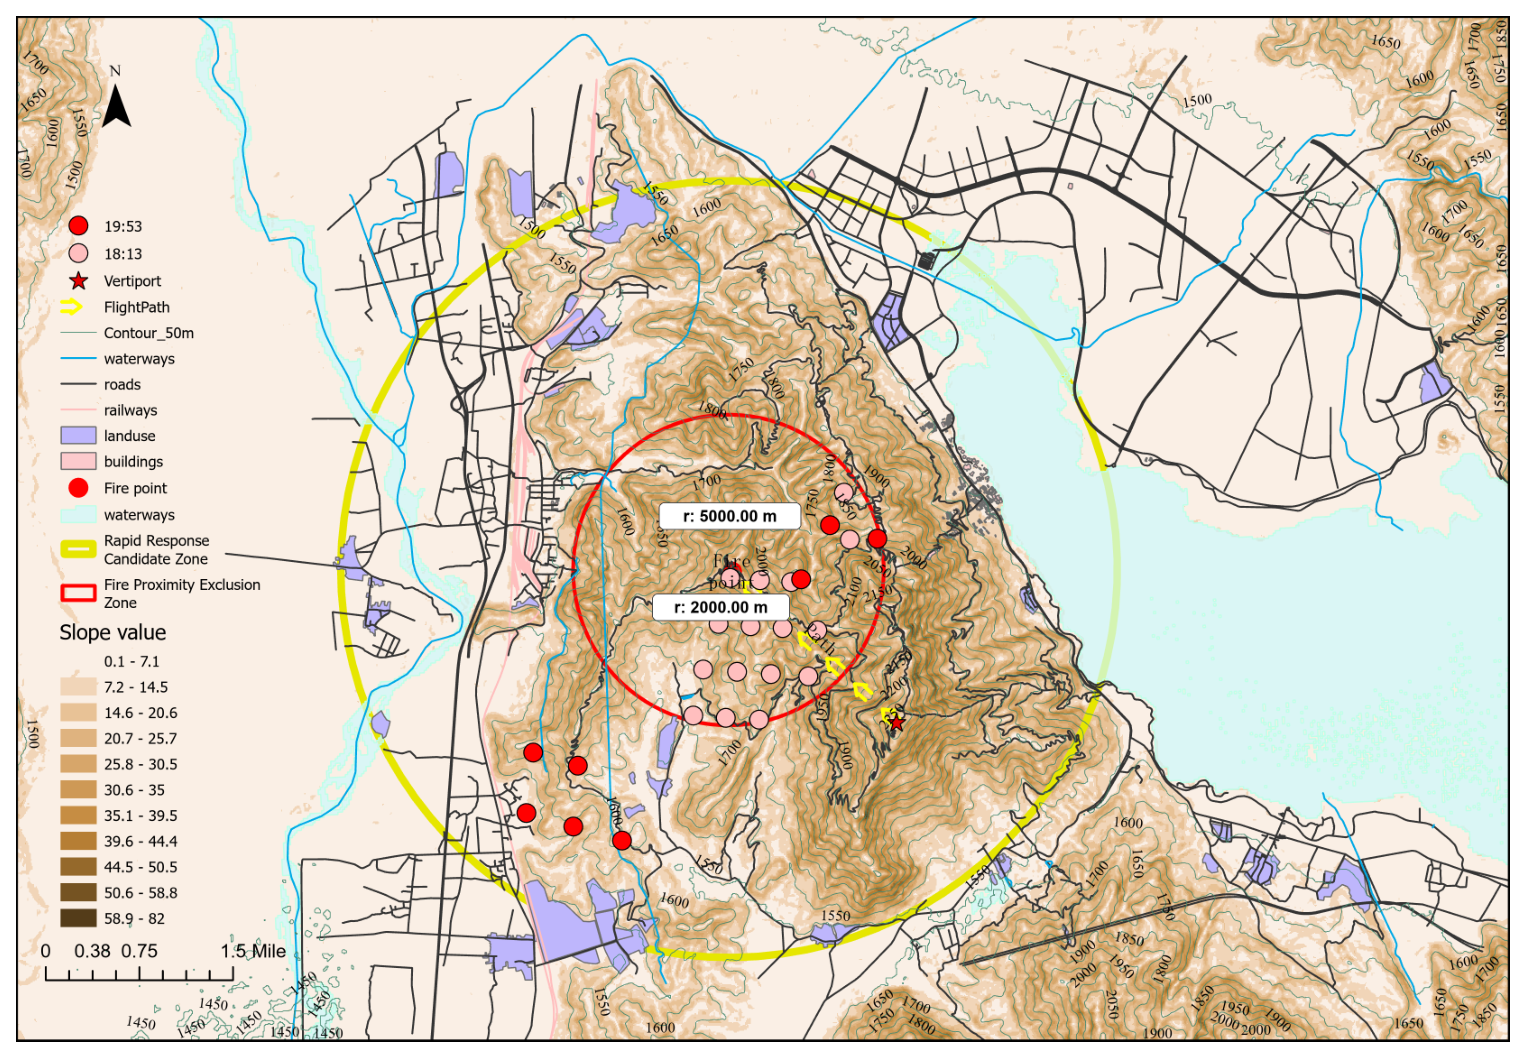
Based on the wildfire scenario and mountainous terrain of Xichang City, this study defined a distance-based functional zoning scheme for UAV vertiport planning, as shown in Figure 5.
Figure 5.
Functional zoning scheme for UAV vertiport planning.
Official active fire data were obtained from the Fire Information for Resource Management System (FIRMS) of the National Aeronautics and Space Administration (NASA). Fire points outside Xichang City were removed by spatial clipping.
Active fire points were detected at three acquisition times: 18:13, 19:53, and 19:54 (UTC+8). The fire points detected at 18:13 were mainly located within 2 km of the ignition center in Jingjiu Township. At 19:53, the detected fire points had expanded to about 5 km from the ignition center. Based on the active fire distribution, functional zones were defined around the ignition point.
The area within 0–2 km from the ignition point was defined as the Fire Proximity Exclusion Zone. This zone is close to the active fire front and may be affected by high temperature, unstable airflow, smoke, and falling debris. Therefore, this area was not considered for vertiport deployment. The 2–5 km range was defined as the Rapid Response Candidate Zone. This range corresponds to the main area of early wildfire activity observed from the satellite active fire data. To reduce low-intensity fires and potential false detections, only fire points with a fire radiative power (FRP) greater than 10 MW were retained. Finally, the data were filtered to focus on the early stage 18:13 of the 2020 “3·30” Xichang wildfire.
2.7. Candidate Landing Point Discretization Method
During wildfire emergency operations, UAV takeoff and landing procedures are susceptible to the combined effects of complex terrain, unstable near-surface air currents, and local obstacles. These factors significantly reduce the available space for safe takeoff, landing, and ground support operations. Currently, there remains a lack of specialized design specifications for UAV vertiports in mountainous wildfire emergency scenarios.
To reasonably determine the spatial scale of candidate vertiport, this paper systematically reviews existing standards, guidelines, and research related to UAV landing zones, electric vertical take-off and landing (eVTOL) vertiports, helicopter landing pads, and AAM takeoff and landing facility planning. Although these materials address different types of aircraft and application scenarios, they share a common principle: the spatial requirements for vertical takeoff and landing facilities should not be determined solely by the minimum footprint; instead, they must comprehensively consider factors such as the touchdown and lift-off area (TLOF), final approach and takeoff area (FATO), safety zones, approach and departure protection, downwash effects, space for personnel and equipment operations, and operational buffers. Relevant standard references and dimension calculation processes are provided in Appendix A.
To determine the appropriate dimensions for this functional unit, this study uses the V2000CGF firefighting eVTOL drone as a case study. This drone has the largest dimensions among available models and relatively complete public specifications.
Based on the representative external dimension of approximately 15.0 m, the minimum operational envelope calculated according to Federal Aviation Administration (FAA) Engineering Brief (EB) 105A is approximately 37.5 m. For conservative verification, the domestic technical requirements for civil vertical vertiports were also considered, under which the corresponding overall vertiport dimension is approximately 45.0 m. Therefore, a grid cell was adopted as the GIS-level spatial discretization unit for candidate UAV vertiports. This grid size exceeds both reference dimensions and provides additional space for local terrain leveling, temporary equipment deployment, material loading and unloading, personnel movement, drainage organization, and safety buffering in mountainous wildfire emergency scenarios.
2.8. Constraint Screening
Preliminary screening of the grid cells was conducted in ArcGIS Pro 3.6. The screening process considered three main constraints: terrain conditions, surface environment, and safety buffers.
Terrain slope () is an important factor reflecting local surface flatness. Relevant standards mandate slope assessment in vertiport design [53,54,55]. Acceptable slope limits vary across different UAV models and landing configurations. Previous studies on robot landing gear (RLG) and related landing configurations have shown that conventional designs are generally suitable only for ground slopes of approximately –, while specialized designs may extend the allowable slope to around [56,57]. However, such expanded limits are typically associated with site-specific engineering adaptations rather than regional-scale preliminary screening. Based on the target UAV platforms, this study defined a maximum slope threshold of . Terrain slope () was thus utilized as a macro-scale spatial screening metric. This parameter effectively filters out steep areas with high deployment risks. The process exclusively retains candidate cells with suitably gentle terrain for safe ground operations.
Surface environment screening was then performed. Permanent water bodies were removed because they cannot support UAV takeoff, landing, loading, temporary parking, or ground support operations. Land-use types that were unsuitable for these activities were also excluded.
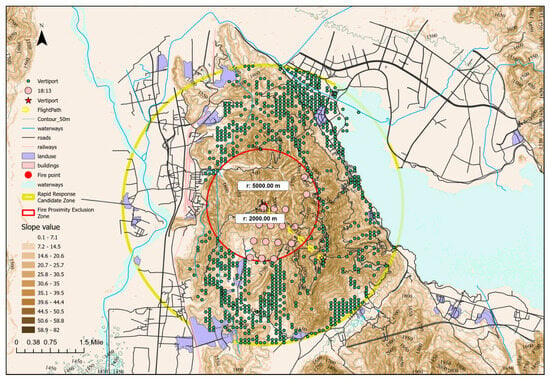
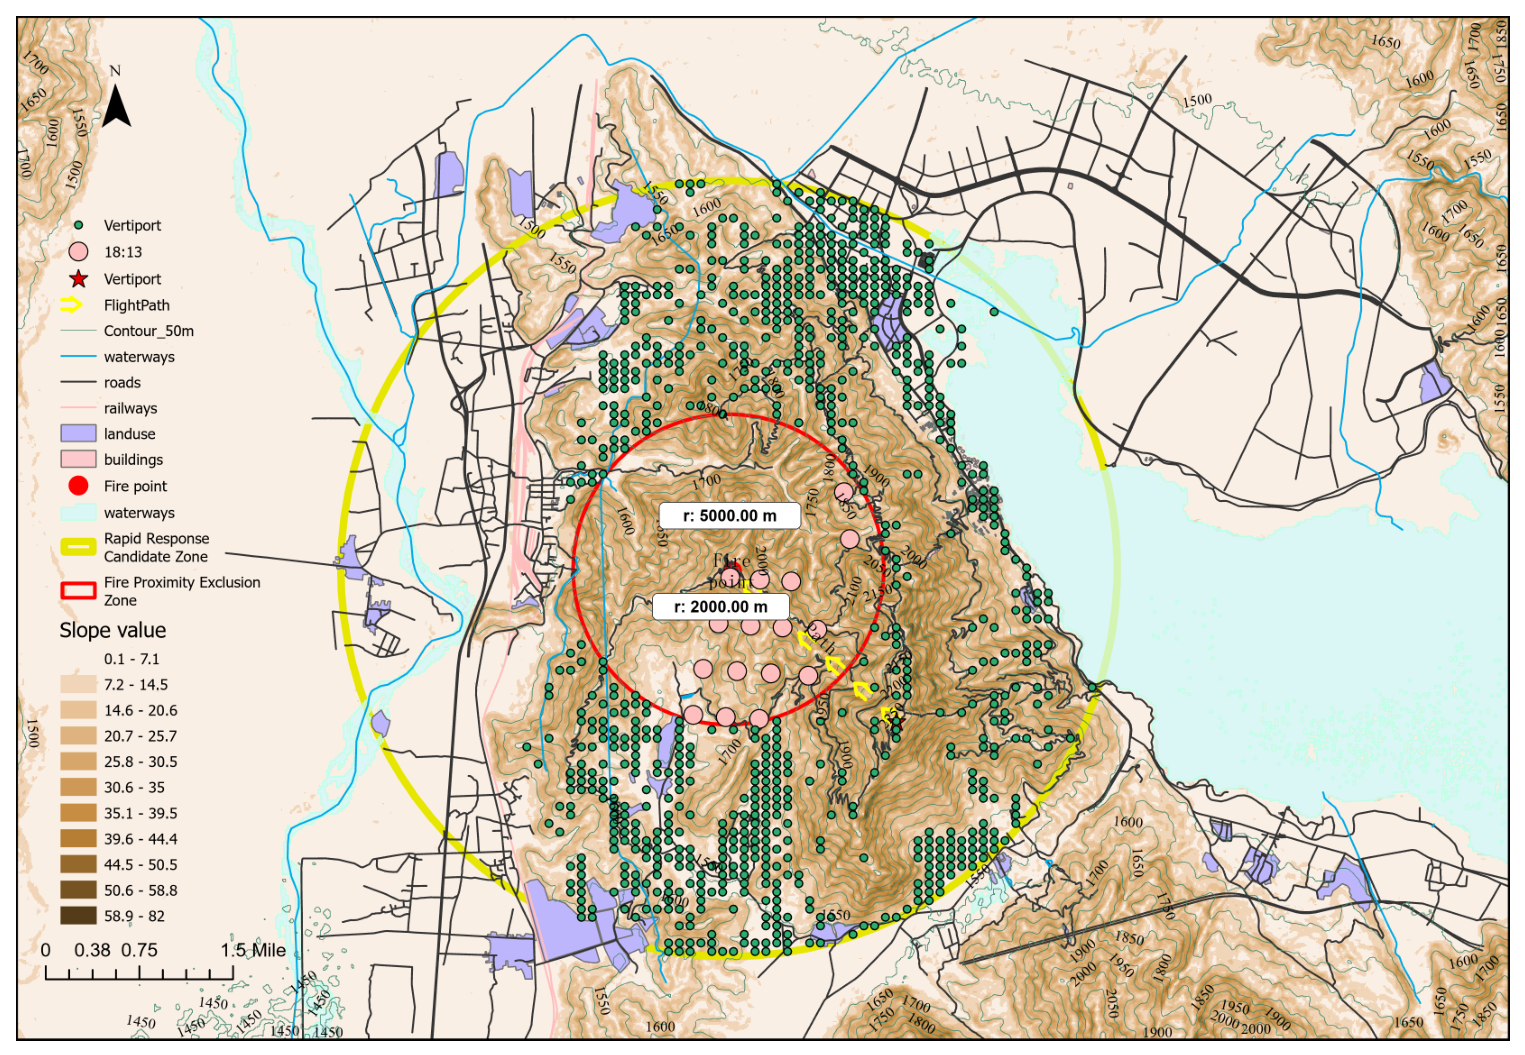
Finally, safety buffer screening was conducted. Grid cells located within railway safety buffer zones were removed. This step reduced potential risks to existing ground transport facilities, personnel safety, and emergency operations. The final screening results are shown in Figure 6.
Figure 6.
Candidate vertiport points after constraint-based screening.
2.9. MCDM Evaluation Method
2.9.1. Evaluation Index System
This study considers terrain safety, spatial accessibility, and mission response characteristics when constructing the evaluation index system. Five key evaluation indicators were selected to construct a comprehensive evaluation index system for UAV vertiports. All indicators were treated as cost-type indicators. A smaller value means better suitability. The evaluation index system is shown in Table 3.
Table 3.
Evaluation index system for UAV vertiport candidates.
2.9.2. CRITIC Weighting and Primary Ranking
The raw values were first transformed into normalized suitability values as follows:
where is the normalized suitability value of candidate i under indicator j, is the raw value, and and are the maximum and minimum values of indicator j, respectively. A larger indicates a higher suitability level.
The CRITIC method was used to determine the objective weights of the indicators. This method considers both the variation of each indicator and its conflict with other indicators. The information amount of indicator j was calculated as follows:
where is the information amount of indicator j, is the standard deviation of indicator j, is the correlation coefficient between indicators j and ℓ, and m is the number of indicators. The CRITIC weight of indicator j was then calculated as follows:
After min–max cost normalization, all normalized suitability values were treated as benefit-type indicators in TOPSIS. The weighted normalized matrix was first constructed using the CRITIC weights. The positive ideal solution and the negative ideal solution were then identified. For each candidate grid cell, the Euclidean distances to these two ideal solutions were calculated. The closeness coefficient of candidate i was calculated as follows:
where is the closeness coefficient of candidate i, is the distance to the positive ideal solution, and is the distance to the negative ideal solution. A larger indicates a higher suitability level.
2.9.3. Sensitivity Comparison
To assess the robustness of the primary ranking obtained from the Min-Max CRITIC-TOPSIS method, two alternative ranking schemes were introduced for comparison. The first comparative scheme utilized the empirical rank–percentile transformation. The second scheme employed the ordinary entropy weight method based on min–max normalized raw indicators.
In the first comparative scheme, to eliminate scale effects among the five indicators with different units, a rank–percentile transformation was applied. For each indicator, the candidate vertiport grid cells () were ranked in ascending order according to their raw values. Because all indicators were treated as cost-type, a lower raw value indicates higher suitability. The standardized suitability score was calculated as follows:
where is the suitability value of candidate i under indicator j, is the ascending rank of candidate i, and n is the number of candidates. A higher indicates higher suitability.
This transformation does not require fixed best or worst thresholds; rather, it reflects the relative position of each candidate within the study-area candidate set. These rank–percentile scores were then combined with CRITIC weights and TOPSIS to form the first comparison set.
For the entropy-weight scheme, all indicators were treated as cost-type indicators. After standardizing the raw data, the proportion of candidate i under indicator j was then calculated as follows:
The entropy value of indicator j was calculated as follows:
To avoid numerical instability caused by zero values, a small constant () is added to before calculating the logarithm.
The entropy weight of indicator j was then obtained as follows:
where denotes the entropy weight of indicator j. The candidate vertiport grid cells were ranked using the entropy weights and the normalized suitability values.
2.10. Construction of Staging Node Vertiport Networks Under Sector Constraints
In mountainous terrain, large elevation differences, ridges, valleys, and limited ground access can weaken the operational connectivity between adjacent vertiports. Some vertiports may be close in planar distance, but their connection for resource allocation and field operations may still be limited by terrain conditions. High-suitability vertiports may also be spatially dispersed. However, firefighting resources, energy supply, and ground support capacity are usually limited during emergency response. A uniform allocation of resources to all dispersed vertiports would increase the pressure on resource scheduling. It may also reduce the continuity and overall efficiency of UAV firefighting operations.
Therefore, staging nodes were introduced after the suitability ranking. These staging nodes were used to support the continuous operation of the vertiport network under regional constraints. The role of a staging node is to concentrate limited firefighting resources, energy supply, and mission support capacity within each deployment sector. Each staging node can then provide nearby vertiports with rapid and efficient replenishment and operational support. This structure helps maintain the spatial coverage of the vertiport network. It also improves resource-use efficiency and network stability in mountainous wildfire UAV response.
2.10.1. Four-Sector Spatial Partition
Four sectors were adopted as a planning-level partition to balance spatial differentiation and operational manageability. This setting divides high-suitability candidates into local support areas without causing excessive fragmentation of logistics coordination. The number of sectors can be adjusted according to wildfire scale, terrain barriers, available support resources, and command requirements in other scenarios.
To obtain spatially coherent and size-balanced sectors, the planar coordinates of high-suitability vertiport candidates were first normalized and then divided using a balanced k-means-based spatial grouping method. A contiguity check was then applied to reduce local sector mixing. If the initial grouping produced mixed local neighborhoods, a recursive median split was used as a fallback partition.
Finally, a local-neighborhood repair procedure was conducted. For each candidate, the labels of its eight nearest neighbors were examined. If at least five neighbors belonged to another sector, the candidate was reassigned to that dominant sector, provided that the sector-size deviation did not exceed two candidates.
2.10.2. Sector Based Selection of Vertiport Staging Nodes
This paper employs the k-medoids clustering method for staging node selection. Unlike k-means, k-medoids directly uses actual vertiports as centers, avoiding the generation of physically unfeasible virtual nodes.
The staging node selection was simplified as a three-dimensional distance-based support assignment. This cost considered both the planar distance and the elevation difference between candidate vertiports and candidate staging nodes. For candidate vertiport i and staging node candidate h, the assignment cost was defined as follows:
where is the assignment cost from candidate vertiport i to staging node h, is the planar distance between candidate vertiport i and staging node h, and is the absolute elevation difference between candidate vertiport i and staging node h.
The number of staging nodes in each sector was determined by the local density of candidate vertiports and the service capacity. Let denote the critical response window for initial wildfire attack. Let denote the maximum number of UAVs that a staging node can simultaneously accommodate for service. Let denote the ground servicing time. The effective cluster capacity threshold () represents the maximum number of candidate vertiports a staging node can safely manage. Including the staging node itself, is calculated as follows:
Operational characteristics and ground service requirements vary significantly across different UAV models. In this study, was set to 60 min, and was set to 2.5 min for the V2000CGF platform. The parameter was set to 1 based on the spatial constraints of the candidate vertiports. Consequently, the effective cluster capacity threshold () evaluates to 25.
Based on this capacity threshold, the number of staging nodes required in sector s was calculated as follows:
where is the number of candidate vertiports in sector s, and is the number of staging nodes selected in that sector.
For each sector s, the staging node set was selected from by minimizing the total assignment cost from all candidate vertiports to their nearest staging node:
where is the selected staging node set in sector s, is the candidate vertiport set in sector s, is a candidate staging node set satisfying and , is the number of staging nodes selected in sector s, and is the three-dimensional inter-site cost between candidate vertiport i and staging node candidate h. After the staging node set was obtained, each candidate vertiport was assigned to the nearest staging node that minimized . This produced a sector-based vertiport support structure for resource replenishment, energy supply, and local operational coordination.
2.11. Operational Validation Design
After the vertiport suitability evaluation and staging node selection, an operational validation was conducted. The purpose of this step was to test whether the selected vertiports and staging nodes could improve fire-suppression sortie efficiency. This validation did not change the vertiport ranking results. It was used only to compare different operational modes.
The V2000CGF was selected as the reference platform. The aircraft was treated as a fire-suppression UAV. Each sortie was assumed to carry four fire-extinguishing bombs. The operational parameters used in this validation are listed in Table 4. These values were used as scenario assumptions. They can be replaced by measured operational data in future work.
Table 4.
Operational assumptions used in the fire-suppression validation.
The fire point operation was simplified as a three-dimensional target-access problem. For each facility or vertiport point, the three-dimensional distance to the fire point was calculated as
where is the three-dimensional distance between point i and the fire point f, is the horizontal distance, and is the elevation difference.
Three operational modes were considered. The first mode was the fire-station closed-loop mode. In this mode, a UAV departs from an existing fire station, flies to the fire point, releases four fire-extinguishing bombs, and returns to the same fire station for reloading. The cycle time, expressed in minutes, is
where is the loaded cruise speed, is the empty return speed, is the bomb release time, and is the reload time at a fire station.
The second mode was the ordinary vertiport closed-loop mode. In this mode, a UAV departs from a vertiport candidate, flies to the fire point, releases four fire-extinguishing bombs, and returns to the same vertiport for reloading. The cycle time, expressed in minutes, is
where is the reload time at an ordinary vertiport.
The third mode was the staging node mode. This mode was divided into two stages. The first stage was a transition cycle. A UAV departs from an ordinary vertiport, flies to the fire point, and then returns to its assigned staging node. This cycle describes the transfer from a distributed vertiport point into the staging node system. The cycle time, expressed in minutes, is
where is the assigned staging node of vertiport candidate i, and is the reload time at a staging node.
After the UAV returns to the staging node, later sorties are assumed to follow a staging node closed loop. In this steady cycle, the UAV departs from the staging node, flies to the fire point, releases four fire-extinguishing bombs, and returns to the same staging node for reloading. The cycle time, expressed in minutes, is
For each mode, the sortie rate and bomb-delivery rate were calculated as
where is the sortie rate in sorties per hour per UAV, Q is the bomb-delivery rate in bombs per hour per UAV, and q is the number of fire-extinguishing bombs carried per sortie. In this study, .
3. Results
3.1. Vertiport Suitability Ranking Based on MCDM
3.1.1. Indicator Weighting Results
Using the min–max normalized suitability matrix, CRITIC-derived indicator weights, and the TOPSIS ranking model, the 847 feasible vertiport candidates retained after GIS-based constraint screening were evaluated to obtain their suitability scores and priority rankings. Table 5 summarizes the indicator weights used in the primary MinMax CRITIC–TOPSIS evaluation, the rank–percentile CRITIC–TOPSIS comparison scheme, and the entropy-weight comparison scheme.
Table 5.
Indicator weights used in the MCDM evaluation and comparison.
The primary min–max CRITIC weighting scheme assigned the highest weights to slope suitability and fire-distance suitability. This result indicates that slope suitability and fire-distance suitability provide relatively strong objective information in the CRITIC weighting stage, while the final TOPSIS ranking integrates all five criteria to determine overall suitability. This scheme was used as the primary method because CRITIC weights depend on both indicator variation and inter-indicator conflict. Applying CRITIC to the min–max normalized matrix preserves the relative differences among candidates and the correlation structure among indicators.
The rank–percentile CRITIC scheme was retained only as a comparison. The rank transformation changes the original value intervals into relative ranks. This can reduce the variation information used by CRITIC and weaken the original correlation structure. In this study, it produced more balanced weights across the five indicators. The entropy-weight method was also used as a sensitivity reference. It mainly reflects single-indicator dispersion and does not explicitly consider inter-indicator conflict. As a result, elevation-difference suitability received a dominant weight, whereas local-relief suitability received a very small weight. Therefore, the min–max CRITIC–TOPSIS result was used as the primary basis for subsequent staging node deployment, while the rank–percentile CRITIC–TOPSIS and entropy-weight results were used for sensitivity analysis.
3.1.2. Top-Ranked Candidate Characteristics
The primary ranking was obtained using the min–max normalized suitability matrix, CRITIC weights, and TOPSIS. The top 100 and top 200 candidates were extracted from this ranking. Table 6 compares the mean indicator values of all candidates, the top 100 candidates, and the top 200 candidates.
Table 6.
Mean indicator values of all candidates, top 100 candidates, and top 200 candidates.
The higher mean slope and local relief values of the Top 100 candidates reflect the trade-off mechanism of the multi-criteria ranking. The CRITIC weight represents the information contrast and conflict of an indicator, whereas the TOPSIS closeness coefficient aggregates all five indicators simultaneously. Compared with the full candidate set, the Top 100 candidates show clear advantages in fire distance, road distance, and elevation difference. These advantages offset the moderately higher slope and local relief values. In addition, all candidates had already passed the prior slope screening threshold of 20°, indicating that they remained within the predefined terrain-safety constraint. Therefore, the final ranking reflects overall operational suitability under terrain-safety constraints, rather than superiority on any single indicator.
The top-ranked candidates had higher overall suitability scores than the full candidate set. The mean primary score increased from 0.3978 for all candidates to 0.5743 for the top 100 candidates and 0.5164 for the top 200 candidates. Compared with the full candidate set, the top 100 and top 200 groups were closer to the wildfire area, closer to roads, and had lower elevation differences. The mean fire distance decreased from 3589.29 m for all candidates to 2517.18 m for the top 100 candidates and 2717.19 m for the top 200 candidates. The mean road distance decreased from 186.99 m to 96.87 m and 142.06 m, respectively. The mean elevation difference decreased from 590.28 m to 341.83 m and 451.39 m, respectively.
The top 100 candidates represent the core high-suitability candidate set. The top 200 candidates represent an extended high-suitability set for spatial inspection and staging node deployment. These candidates are planning-level results and still require site-level verification before actual deployment.
3.1.3. Sensitivity of Top Candidate Sets
A sensitivity comparison was conducted among three ranking results: the primary MinMax CRITIC–TOPSIS result, the rank–percentile CRITIC–TOPSIS result, and the entropy-weight ranking result. The overlap of the top 100 and top 200 candidate sets was measured using the Jaccard index. The results are shown in Table 7.
Table 7.
Overlap of top candidate sets under different normalization and weighting schemes.
As shown in Table 7, several high-suitability candidates were supported by different objective weighting schemes when the min–max normalized suitability matrix was used. By contrast, the rank–percentile CRITIC result showed lower overlap with the other methods. This is because rank transformation changes continuous indicator values into relative positions and may weaken the variation and correlation information used by CRITIC.
Across all three methods, 34 candidates were shared in the top 100 group and 85 candidates were shared in the top 200 group. These common candidates represent relatively stable high-suitability locations under different assumptions. Overall, the sensitivity comparison indicates that the min–max CRITIC–TOPSIS result can be used as the primary planning-level input for subsequent staging node deployment.
3.1.4. Staging Node Selection Results
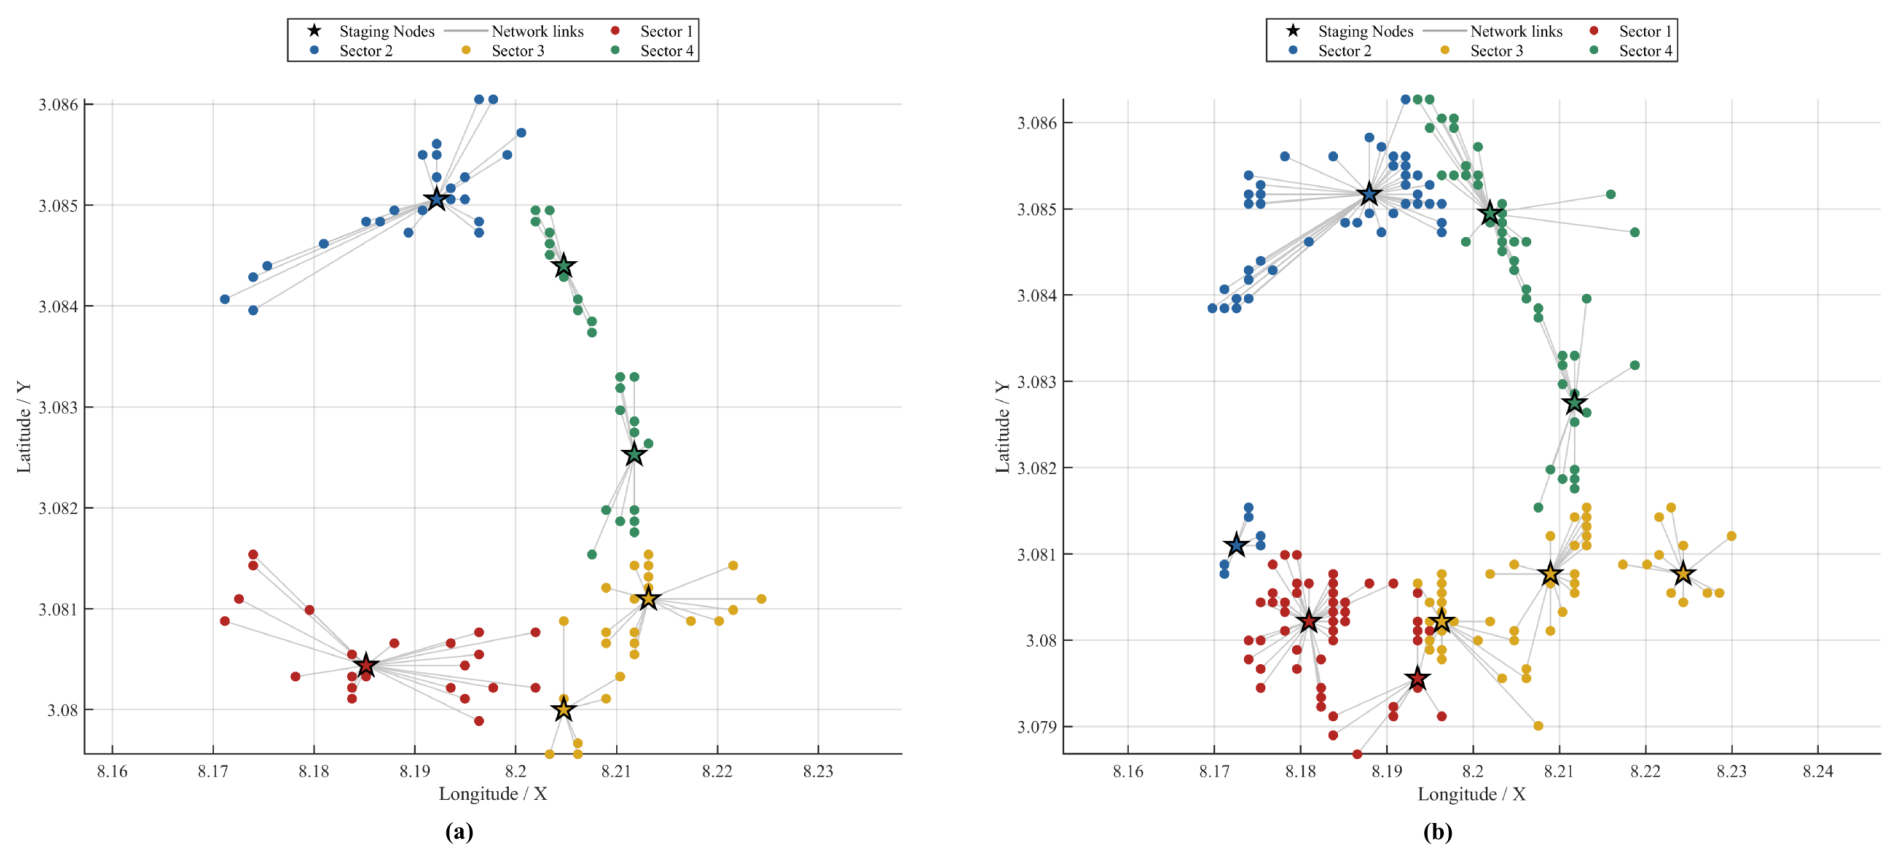
The selected staging nodes based on the primary MinMax CRITIC–TOPSIS ranking are listed in Table 8. For the top 100 subset, six staging nodes were selected. For the top 200 subset, nine effective staging nodes were used in the final assignment. All selected staging nodes were real vertiport candidates retained after the GIS-based screening and MCDM ranking process.
Table 8.
Selected staging nodes in the top 100 and top 200 candidate subsets.
The assignment results are summarized in Table 9. For the top 100 subset, the mean cost to the assigned staging node was 659.34 m, and the maximum cost was 2342.00 m. For the top 200 subset, the mean cost was 670.58 m, and the maximum cost was 2264.68 m. Although the mean assignment cost of the top 200 subset was slightly higher than that of the top 100 subset, the maximum assignment cost decreased, indicating that the expanded candidate set improved the coverage of distant candidates and reduced the most unfavorable local-support distance.
Table 9.
Summary of staging node assignment costs.
The sector-level results are shown in Table 10. In the top 100 subset, Sector 1 had the highest mean assignment cost, with a value of 912.07 m, whereas Sector 3 had the lowest mean assignment cost, with a value of 478.14 m. The maximum assignment cost occurred in Sector 2, reaching 2342.00 m. In the top 200 subset, Sector 2 had the highest mean assignment cost, with a value of 901.85 m, and also had the largest maximum cost of 2264.68 m. Sector 3 had the lowest mean assignment cost, with a value of 504.26 m. These results indicate that the spatial dispersion and terrain-related assignment burden differed among sectors, and that increasing the candidate pool mainly reduced the extreme assignment cost rather than uniformly reducing the mean cost in every sector.
Table 10.
Sector-level staging node assignment results.
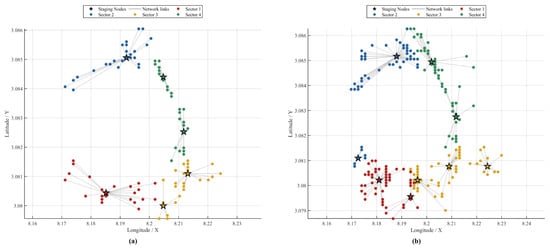
Figure 7 shows the staging node selection results for the two candidate subsets. The assignment links indicate the assigned local staging node for each candidate vertiport. The selected staging nodes provide representative support points within each deployment sector, while all staging node locations remain within the feasible vertiport candidate set.
Figure 7.
Staging node selection results based on the primary MinMax CRITIC–TOPSIS ranking: (a) top 100 candidate vertiports; (b) top 200 candidate vertiports.
3.2. Operational Validation of Deployment Modes
The validation results are shown in Table 11. Seven scenarios were evaluated. The fire-station mode used nine existing fire stations. The ordinary vertiport mode used the Top 100 and Top 200 candidate sets. The staging node mode included a transition cycle and a steady closed-loop cycle.
Table 11.
Fire-suppression sortie efficiency under different operational modes.
Table 12 compares the staging node closed-loop mode with the ordinary vertiport closed-loop mode.
Table 12.
Cycle-time reduction of the staging node closed-loop mode under differentiated reload-time assumptions.
Under the differentiated reload-time assumptions, the staging node closed-loop mode clearly improved the repeated sortie efficiency of the vertiport network. For the Top 100 set, the mean cycle time was reduced by 56.85% compared with the ordinary vertiport closed-loop mode. The bomb-delivery rate increased by 132.15%. For the Top 200 set, the mean cycle time was reduced by 55.78%, and the bomb-delivery rate increased by 127.01%.
The Top 100 staging nodes produced a slightly shorter cycle time than the Top 200 staging nodes. This indicates that the Top 100 set formed a more compact core deployment area. The Top 200 set provided a larger candidate pool, but it also included more peripheral sites. Therefore, its mean staging node cycle time was slightly longer.
To further distinguish the spatial-layout effect from the logistical-resource effect, an additional equal-reload-time test was conducted. In this controlled test, the reload time was uniformly set to 5 min for all operational modes. The results are shown in Table 13.
Table 13.
Cycle-time comparison under the equal-reload-time setting.
Under the equal-reload-time setting, the selected vertiport candidates shortened the sortie cycle time compared with the fire-station baseline. This indicates that the main spatial-siting benefit comes from deploying UAVs at high-suitability vertiport candidates closer to the wildfire area, rather than relying on existing fire stations. Meanwhile, because the UAV cruise speed used in this study is relatively high, and both ordinary vertiports and staging nodes are selected from high-suitability candidates near the fire point, the distance difference between the two modes is compressed in the total cycle time. Therefore, under equal reload conditions, the staging node closed-loop mode further slightly shortened the sortie cycle time compared with the ordinary vertiport closed-loop mode. This result indicates that the staging node configuration has a spatial layout optimization effect.
In practical emergency operations, it is usually unrealistic and costly to equip all ordinary vertiport candidates with the same level of personnel, fire-extinguishing materials, energy supply, and reload equipment. Therefore, this study uses the selected staging nodes as resource assembly points and assigns reload times consistent with their support function. This setting reduces the pressure of fully distributed resource preparation. It also reflects the advantage of networked deployment in resource organization, centralized reloading, and continuous operational support.
4. Discussion
The proposed framework integrates GIS-based vertiport selection and staging node deployment to address mountainous wildfire operations. Traditional emergency response relies solely on existing fire stations. Firefighters arrive randomly at fire zones. They conduct hurried operations. This approach typically leads to delayed first-arrival times. In contrast, the present study explicitly organizes optimal vertiport candidates into sector-based staging nodes. This organization substantially shortens the operational cycle time. It also increases the fire-extinguishing bomb-delivery rate. Effective UAV deployment must move beyond the evaluation of isolated vertiports. It must use a systematically organized local support network within spatially coherent deployment sectors.
Previous studies on UAV site-selection have largely focused on urban environments. Complex environments such as plateaus and mountainous regions remain largely underexplored. Mountainous wildfires are difficult to control. They frequently result in catastrophic ecological damage and property losses. Traditional suppression relies heavily on manual ground personnel and manned aviation. This conventional approach incurs prohibitive economic costs. It also exposes responders to extreme, life-threatening risks. In contrast, this study integrates MCDM and clustering approaches for mountainous topography. The proposed framework first pre-selects feasible landing zones. It then identifies resource assembly points within these zones to minimize logistical costs.
The limited overlap among the three ranking schemes is mainly related to their different treatments of indicator information. In the min–max CRITIC–TOPSIS scheme, the original value ranges and the correlations among indicators are retained. Therefore, the ranking is affected by both indicator contrast and inter-indicator conflict. In the entropy-weight scheme, the weights are mainly determined by the dispersion of each individual indicator. This may increase the influence of indicators with larger numerical variation. In contrast, the rank-percentile transformation converts the original indicator values into ordinal positions. This reduces the influence of absolute value differences among candidates. These differences indicate that the identification of highly suitable vertiport candidates is affected by the choice of normalization and weighting methods. Therefore, the selected candidates should be regarded as planning-level guidance. Site-level verification is still required before practical implementation.
At the same time, several limitations should be acknowledged. The current framework focuses only on the initial fire outbreak stage to demonstrate rapid deployment. It does not fully consider stochastic fire-spread dynamics. It also does not explicitly quantify other operational factors that may affect practical deployment, such as local obstacles, microclimatic conditions, and related site-specific constraints. In addition, because the ALOS PALSAR DEM has a spatial resolution of 12.5 m, local terrain relief was not used as a strict exclusion factor. It was instead included as a soft criterion in the suitability evaluation. Therefore, the results should be interpreted as planning-level guidance and should be supplemented with UAV photogrammetry, field inspection, qualitative judgment, and necessary ground leveling or obstacle clearance before actual deployment.
Although the numerical results obtained from the 2020 Xichang wildfire and the V2000CGF platform are case-specific, the proposed framework was not developed solely based on this case. Its factor system is derived from general vertiport planning considerations and wildfire emergency-response requirements. Future research will focus on expanding this planning-level static framework into dynamic operational models and examining additional representative wildfire scenarios to further evaluate the transferability and robustness of the proposed framework. Site-specific operational constraints, such as microclimatic conditions, local obstacles, and fine-scale terrain conditions, should also be incorporated. Further sensitivity analysis of different normalization, weighting, and ranking schemes could be conducted to assess the robustness of site-selection results. Extending the framework to support real-time vertiport redeployment in extreme environments is a promising direction. Such extensions would support safer and more efficient wildfire suppression.
Author Contributions
Conceptualization, Y.Z. and W.P.; methodology, Y.Z.; software, Y.Z.; validation, Y.Z. and Y.J.; formal analysis, W.P.; investigation, Y.Z. and L.L.; resources, W.P.; data curation, Q.H.; writing—original draft preparation, Y.Z.; writing—review and editing, Y.Z. and W.P.; visualization, Y.Z.; supervision, W.P.; project administration, Y.Z.; funding acquisition, W.P. All authors have read and agreed to the published version of the manuscript.
Funding
This research was funded by the National Natural Science Foundation of China, grant number U2333207, the Sichuan Provincial Civil Aviation Flight Technology and Flight Safety Engineering Technology Research Center, grant number GY2024-35D, GY2025-63E, the Henan Provincial Key Science and Technology Research Project, grant number 262102240002 and the Key Laboratory of Flight Techniques and Flight Safety, CAAC, grant number F2024KF11C.
Institutional Review Board Statement
Not applicable.
Informed Consent Statement
Not applicable.
Data Availability Statement
The data that support the findings of this study are available from the corresponding author upon reasonable request. The code that supports the findings of this study is available from the corresponding author upon reasonable request. The source materials used for this compilation are retained by the authors and can be provided upon reasonable request.
Acknowledgments
This study would like to acknowledge the support provided by the Civil Aviation Flight University of China, the Ministry of Emergency Management Southern General Station of Aerial Forest Protection.
Conflicts of Interest
The authors declare no conflicts of interest.
Abbreviations
| AAM | Advanced Air Mobility |
| AHP | Analytic Hierarchy Process |
| ALOS | Advanced Land Observing Satellite |
| ASTM | American Society for Testing and Materials |
| CAAC | Civil Aviation Administration of China |
| CRITIC | CRiteria Importance Through Intercriteria Correlation |
| DEM | Digital Elevation Model |
| EASA | European Union Aviation Safety Agency |
| ESA | European Space Agency |
| EWM | Entropy Weight Method |
| eVTOL | Electric Vertical Take-Off and Landing |
| FAA | Federal Aviation Administration |
| FATO | Final Approach and Takeoff Area |
| FIRMS | Fire Information for Resource Management System |
| FRP | Fire Radiative Power |
| GIS | Geographic Information System |
| GIS-MCDA | Geographic Information System-based Multi-Criteria Decision Analysis |
| ISO | International Organization for Standardization |
| LANCE | Land, Atmosphere Near real-time Capability for Earth observation |
| MCDM | Multi-Criteria Decision-Making |
| NASA | National Aeronautics and Space Administration |
| PALSAR | Phased Array type L-band Synthetic Aperture Radar |
| PTS-VPT-DSN | Prototype Technical Specifications for the Design of VFR Vertiports |
| RLG | Robot Landing Gear |
| S-NPP | Suomi National Polar-orbiting Partnership |
| TLOF | Touchdown and Lift-Off Area |
| TOPSIS | Technique for Order Preference by Similarity to Ideal Solution |
| UAS | Unmanned Aircraft System |
| UAV | Unmanned Aerial Vehicle |
| UTC | Coordinated Universal Time |
| UTM | Universal Transverse Mercator |
| VFR | Visual Flight Rules |
| VIIRS | Visible Infrared Imaging Radiometer Suite |
| VTOL | Vertical Take-Off and Landing |
| WGS | World Geodetic System |
Appendix A. Dimensional Basis for Vertiport Discretization
This appendix provides the reference basis and calculation process used to determine the spatial discretization scale of candidate UAV vertiports. Since there is currently no dedicated standard for UAV vertiports in mountainous wildfire emergency scenarios, this study reviews relevant standards, guidelines, and research on UAV landing areas, eVTOL vertiports, helicopter landing pads, and advanced air mobility (AAM) takeoff and landing facilities. The objective is not to design a certified vertiport or heliport, but to justify the GIS-level spatial unit used for preliminary vertiport screening.
Appendix A.1. Supplementary Comparison of UAV Platform Dimensions
Table A1.
Dimensional information of reviewed UAV platforms.
Appendix A.2. Reference Standards and Applicability
The reference documents used for the dimensional analysis are summarized in Table A2.
Table A2.
Reference documents used for candidate vertiport dimensional analysis.
Appendix A.3. Verification of the 50 m Grid Size
The V2000CGF firefighting eVTOL UAV was used as the reference platform for grid-size verification. Public information for the V2000CGF series reports a wingspan of about 14.5 m. Therefore, this study used a rounded design dimension of
This value was used only for GIS-level planning. Detailed engineering design would require manufacturer data, including landing-gear layout, rotor or propeller envelope, obstacle clearance, and site survey results.
According to FAA EB 105A, the touchdown and lift-off area (TLOF), final approach and takeoff area (FATO), and safety area can be expressed in terms of the controlling aircraft dimension as
and
Because the detailed propulsion-unit diameter of the V2000CGF is not publicly available, this study adopted a conservative approximation:
The corresponding FAA-based dimensions are therefore 15.0 m for the TLOF, 30.0 m for the FATO, and 37.5 m for the overall safety area.
A conservative domestic reference was also considered. The TLOF should contain a circle of at least , the FATO should contain a circle or square of at least , and the safety area should extend at least 5 m or beyond the FATO boundary. With , the minimum TLOF and FATO dimensions are 15.0 m and 30.0 m, respectively. The one-side safety extension is 7.5 m. Thus, the overall vertiport dimension is
The adopted grid size is
It is larger than both the FAA-based envelope of 37.5 m and the conservative domestic envelope of 45.0 m. Therefore, the 50 m × 50 m grid can be used as a GIS-level functional vertiport planning unit. It should not be interpreted as the exact touchdown surface. The extra space can support terrain preparation, equipment placement, loading and unloading, personnel movement, drainage, access, and safety buffering in mountainous wildfire operations.
References
- Pausas, J.G.; Keeley, J.E. Wildfires and global change. Front. Ecol. Environ. 2021, 19, 387–395. [Google Scholar] [CrossRef] [Scilit]
- Liu, Y.; Miao, S.; Zhang, H. Sensitivity simulations of the 30 March 2020 Xichang wildfire in Southwest China based on the WRF-Fire model. J. Meteorol. Res. 2024, 38, 826–843. [Google Scholar] [CrossRef] [Scilit]
- Cao, X.; He, K.; Hu, X.; Luo, G.; Zhou, Y.; Zhou, R.; Yang, Y.; Jin, T. Combined InSAR and optical dataset unravelling the characteristics of hillslope erosion in burned areas in Xichang, China. Catena 2024, 242, 108123. [Google Scholar] [CrossRef] [Scilit]
- Cao, X.; Hu, X.; Han, M.; Jin, T.; Yang, X.; Yang, Y.; He, K.; Wang, Y.; Huang, J.; Xi, C.; et al. Characteristics and predictive models of hillslope erosion in burned areas in Xichang, China, on March 30, 2020. Catena 2022, 217, 106509. [Google Scholar] [CrossRef] [Scilit]
- Sichuan Provincial People’s Government. Investigation Report on the “3·30” Forest Fire in Xichang, Liangshan Prefecture. 21 December 2020. Available online: https://www.sc.gov.cn/10462/10464/13722/2020/12/21/76441b52bf034463946b09f61876d3f9.shtml (accessed on 29 March 2026).
- Christensen, B.R. Use of UAV or remotely piloted aircraft in fire management. N. Z. J. For. Sci. 2015, 45, 16. [Google Scholar] [CrossRef] [Scilit]
- McConnell, K.; Mueller, J.T.; Burow, P.B.; St. Denis, L.A. Urban areas in the United States experience substantial wildfire impacts. Commun. Earth Environ. 2026, 7, 352. [Google Scholar] [CrossRef] [Scilit] [PubMed]
- Keeley, J.E.; Syphard, A.D. California wildfires: Fuel-dominated vs. wind-dominated fires. Fire Ecol. 2019, 15, 24. [Google Scholar] [CrossRef] [Scilit]
- Katuwal, H.; Dunn, C.J.; Calkin, D.E. Characterising resource use during wildfire suppression. Int. J. Wildland Fire 2017, 26, 604–614. [Google Scholar] [CrossRef] [Scilit]
- Bayham, J.; Belval, E.J.; Thompson, M.P.; Dunn, C.; Stonesifer, C.S.; Calkin, D.E. Weather, risk, and resource orders on large wildland fires in the Western US. Forests 2020, 11, 169. [Google Scholar] [CrossRef] [Scilit]
- Wall, T.; Steinberg, M.; Shew, D. Community-led rebuilding after wildfires. Nat. Sustain. 2025, 8, 326. [Google Scholar] [CrossRef] [Scilit]
- Pretorius, I.; Sturman, A.; Strand, T.; Katurji, M.; Pearce, G. A Meteorological Study of the Port Hills Fire, Christchurch, New Zealand. J. Appl. Meteorol. Climatol. 2020, 59, 263–280. [Google Scholar] [CrossRef] [Scilit]
- Seeley, M.; Hede, H.; Bylart, M.; Rodwell, J. Diagnosing the institutional forces impacting Australia’s aerial firefighting capability. Sustainability 2023, 15, 1636. [Google Scholar] [CrossRef] [Scilit]
- Pan, W.; He, Q.; Huang, Y.; Qin, L. Four-dimensional trajectory planning for UAV systems. IEEE Access 2023, 11, 81113–81123. [Google Scholar] [CrossRef] [Scilit]
- Zhang, M.; Wang, H.; Lun, Y.; Yang, Z.; Wang, Y. Multi-UAV efficient cooperative forest fire patrol in 3-D mountain environments. IEEE Trans. Aerosp. Electron. Syst. 2025, 61, 15737–15756. [Google Scholar] [CrossRef] [Scilit]
- Zhu, J.; Liu, Y.; Liang, X.; Liu, F. Comparative Calculation of Spectral Indices for Post-Fire Changes Using UAV Visible/Thermal Infrared and JL1 Imagery in Jinyun Mountain, Chongqing, China. Forests 2025, 16, 1147. [Google Scholar] [CrossRef] [Scilit]
- Keerthinathan, P.; Amarasingam, N.; Hamilton, G.; Gonzalez, F. Exploring unmanned aerial systems operations in wildfire management: Data types, processing algorithms and navigation. Int. J. Remote Sens. 2023, 44, 5628–5685. [Google Scholar] [CrossRef] [Scilit]
- Erdelj, M.; Natalizio, E.; Chowdhury, K.R.; Akyildiz, I.F. Help from the sky: Leveraging UAVs for disaster management. IEEE Pervasive Comput. 2017, 16, 24–32. [Google Scholar] [CrossRef] [Scilit]
- Xu, Q.; Zhang, R.; Qiu, Z.; Meng, F. FirePM-YOLO: Position-Enhanced Mamba for YOLO-Based Fire Rescue Object Detection from UAV Perspectives. Sensors 2026, 26, 2064. [Google Scholar] [CrossRef] [Scilit] [PubMed]
- Burhanuddin, L.A.B.; Liu, X.; Deng, Y.; Challita, U.; Zahemszky, A. QoE Optimization for Live Video Streaming in UAV-to-UAV Communications via Deep Reinforcement Learning. IEEE Trans. Veh. Technol. 2022, 71, 5358–5370. [Google Scholar] [CrossRef] [Scilit]
- Chen, J.; Ren, H.; Zhou, Q.; Li, H. Fast unfolding-based rescue planning. IEEE Trans. Autom. Sci. Eng. 2025, 22, 18750–18760. [Google Scholar] [CrossRef] [Scilit]
- Akhloufi, M.A.; Couturier, A.; Castro, N.A. Unmanned Aerial Vehicles for Wildland Fires: Sensing, Perception, Cooperation and Assistance. Drones 2021, 5, 15. [Google Scholar] [CrossRef] [Scilit]
- Twidwell, D.; Allen, C.R.; Detweiler, C.; Higgins, J.; Laney, C.; Elbaum, S. Smokey Comes of Age: Unmanned Aerial Systems for Fire Management. Front. Ecol. Environ. 2016, 14, 333–339. [Google Scholar] [CrossRef] [Scilit]
- Yucesoy, E.; Balcik, B.; Coban, E. Drones in disaster response: A review. Int. Trans. Oper. Res. 2025, 32, 545–589. [Google Scholar] [CrossRef] [Scilit]
- Lyu, M.; Zhao, Y.; Huang, C.; Huang, H. UAVs for search and rescue: A survey. Remote Sens. 2023, 15, 3266. [Google Scholar] [CrossRef] [Scilit]
- Silvagni, M.; Tonoli, A.; Zenerino, E.; Chiaberge, M. Multipurpose UAV for search and rescue operations in mountain avalanche events. Geomat. Nat. Hazards Risk 2017, 8, 18–33. [Google Scholar] [CrossRef] [Scilit]
- McRae, J.N.; Gay, C.J.; Nielsen, B.M.; Hunt, A.P. Using an unmanned aircraft system (drone) to conduct a complex high altitude search and rescue operation: A case study. Wilderness Environ. Med. 2019, 30, 287–290. [Google Scholar] [CrossRef] [Scilit] [PubMed]
- Pan, W.J.; Wang, Y.D.; Zhang, Y.B. Thoughts on test flight capacity construction and airspace governance for the low-altitude industry chain. Bull. Natl. Nat. Sci. Found. China 2026, 40, 85–94. (In Chinese) [Google Scholar] [CrossRef] [Scilit]
- Pan, W.; Gao, J.; Wang, X.; Zuo, Q.; Tan, S. Urban drone stations siting optimization based on hybrid algorithm of MILP and machine learning. Heliyon 2024, 10, e32928. [Google Scholar] [CrossRef] [Scilit] [PubMed]
- Pan, W.; Huang, Y.; Yin, Z.; Qin, L. Optimal collaborative scheduling of multi-aircraft types for forest fires general aviation rescue. Aerospace 2023, 10, 741. [Google Scholar] [CrossRef] [Scilit]
- Yesilnacar, M.I.; Süzen, M.L.; Kaya, B.Ş.; Doyuran, V. Municipal solid waste landfill site selection for the city of Şanliurfa-Turkey: An example using MCDA integrated with GIS. Int. J. Digit. Earth 2012, 5, 147–164. [Google Scholar] [CrossRef] [Scilit]
- Nuhu, S.K.; Manan, Z.A.; Wan Alwi, S.R.; Md Reba, M.N. Roles of geospatial technology in eco-industrial park site selection: State-of-the-art review. J. Clean. Prod. 2021, 309, 127361. [Google Scholar] [CrossRef] [Scilit]
- Çolak, H.E.; Baykal, T.M.; Genç, N. Multicriteria decision and sensitivity analysis support for optimal airport site locations. Ann. GIS 2023, 29, 441–468. [Google Scholar] [CrossRef] [Scilit]
- Kim, M.S.; Hong, W.H.; Lee, Y.H.; Baek, S.C. Selection of take-off and landing sites for firefighter drones using GIS-based multi-criteria model. Drones 2022, 6, 412. [Google Scholar] [CrossRef] [Scilit]
- Malczewski, J. GIS-based multicriteria decision analysis: A survey of the literature. Int. J. Geogr. Inf. Sci. 2006, 20, 703–726. [Google Scholar] [CrossRef] [Scilit]
- Malczewski, J.; Rinner, C. GIS-MCDA for group decision making. In Multicriteria Decision Analysis in Geographic Information Science; Springer: Berlin, Germany, 2015; pp. 223–247. [Google Scholar] [CrossRef] [Scilit]
- Kalyan, S.; Bansal, P.; Kumar, S. A novel hybrid AHP-entropy weighted dynamic network DEA framework. Expert Syst. Appl. 2026, 296, 129137. [Google Scholar] [CrossRef] [Scilit]
- Behzadian, M.; Khanmohammadi Otaghsara, S.; Yazdani, M.; Ignatius, J. A state-of-the-art survey of TOPSIS applications. Expert Syst. Appl. 2012, 39, 13051–13069. [Google Scholar] [CrossRef] [Scilit]
- Chen, P. Effects of the entropy weight on TOPSIS. Expert Syst. Appl. 2021, 168, 114186. [Google Scholar] [CrossRef] [Scilit]
- Mendonca, N.; Murphy, J.R.; Patterson, M.D.; Alexander, R.; Juárez, G.; Harper, C. Advanced air mobility vertiport considerations: A list and overview. In Proceedings of the AIAA Aviation Forum, Chicago, IL, USA, 27 June–1 July 2022. [Google Scholar]
- Federal Aviation Administration. Engineering Brief No. 105A: Vertiport Design, Supplemental Guidance to Advisory Circular 150/5390-2D, Heliport Design; Federal Aviation Administration: Washington, DC, USA, 2024. Available online: https://www.faa.gov/airports/engineering/engineering_briefs/eb_105a_vertiports (accessed on 17 May 2026).
- European Union Aviation Safety Agency. Prototype Technical Specifications for the Design of VFR Vertiports for Operation with Manned VTOL-Capable Aircraft Certified in the Enhanced Category; EASA: Cologne, Germany, 2022. Available online: https://www.easa.europa.eu/en/document-library/general-publications/prototype-technical-design-specifications-vertiports (accessed on 17 May 2026).
- National Wildfire Coordinating Group. NWCG Standards for Helicopter Operations, PMS 510; National Wildfire Coordinating Group: Boise, ID, USA, 2023.
- Huang, Y.; Zeng, C.; Pan, W.; Wang, R.; Yin, Z.; Li, Y.; Huang, S. A decision indicator system for takeoff and landing site selection of bucket firefighting helicopters in wildfire emergency response. Fire 2026, 9, 148. [Google Scholar] [CrossRef] [Scilit]
- Ollero, A.; Martínez-de-Dios, J.R.; Merino, L. Unmanned aerial vehicles as tools for forest-fire fighting. For. Ecol. Manag. 2006, 234, S263. [Google Scholar] [CrossRef] [Scilit]
- Sun, H.; Xu, R.; Luo, J.; Cheng, H. Review of the application of UAV edge computing in fire rescue. Sensors 2025, 25, 3304. [Google Scholar] [CrossRef] [Scilit] [PubMed]
- Yang, L.; Wang, L. Optimization-based selection of landing sites for UAVs. Expert Syst. Appl. 2022, 204, 117582. [Google Scholar] [CrossRef] [Scilit]
- Lu, M.; Liao, X.; Yue, H.; Huang, Y.; Ye, H.; Xu, C.; Huang, S. Optimizing distribution of droneports for emergency monitoring of flood disasters in China. J. Flood Risk Manag. 2020, 13, e12593. [Google Scholar] [CrossRef] [Scilit]
- Ayhan, B.; Kwan, C.; Um, Y.-B.; Budavari, B.; Larkin, J. Semi-Automated Emergency Landing Site Selection Approach for UAVs. IEEE Trans. Aerosp. Electron. Syst. 2019, 55, 1892–1906. [Google Scholar] [CrossRef] [Scilit]
- Park, J.; Kim, Y.; Kim, S. Landing site searching and selection algorithm development using vision system and its application to quadrotor. IEEE Trans. Control Syst. Technol. 2015, 23, 488–503. [Google Scholar] [CrossRef] [Scilit]
- AutoFlight. CarryAll Product Specifications; AutoFlight: Shanghai, China, 2023; Available online: https://autoflight.com/assets/uploads/files/autoflight-carryall-specs-062023.pdf (accessed on 17 May 2026).
- AutoFlight. AutoFlight’s Electric Autonomous Firefighting Aircraft; AutoFlight: Shanghai, China. Available online: https://www.autoflight.com/en/news/firefighting/ (accessed on 17 May 2026).
- Civil Aviation Administration of China. Technical Requirements for Civil Vertical Takeoff and Landing Sites (Draft); Civil Aviation Administration of China: Beijing, China, 2024. Available online: https://www.caac.gov.cn/PHONE/HDJL/YJZJ/202406/t20240614_224462.html (accessed on 29 March 2026). (In Chinese)
- European Union Aviation Safety Agency. Special Condition for VTOL and Means of Compliance; EASA: Cologne, Germany, 2024. Available online: https://www.easa.europa.eu/en/document-library/product-certification-consultations/special-condition-vtol (accessed on 18 August 2025).
- Guangzhou Municipal Government. Technical Guidelines for Low-Altitude Vertical Takeoff and Landing Facilities; Guangzhou Municipal Government: Guangzhou, China, 2025. Available online: https://www.gz.gov.cn/gzzcwjk/m_detail.html?id=170979 (accessed on 29 March 2026). (In Chinese)
- León, B.; Rimoli, J.J.; Di Leo, C.V. Ground and flight tests of an unmanned rotorcraft with cable-driven robotic landing gear. J. Am. Helicopter Soc. 2021, 66, 1–10. [Google Scholar] [CrossRef] [Scilit]
- Kabganian, M.; Hashemi, S.M. MDO of Robotic Landing Gear Systems: A Hybrid Belt-Driven Compliant Mechanism for VTOL Drones Application. Drones 2025, 9, 434. [Google Scholar] [CrossRef] [Scilit]
- China Air Transport Association. Technical Requirements for Electric Vertical Takeoff and Landing Aircraft Takeoff and Landing Sites; China Air Transport Association: Beijing, China, 2024; Available online: https://chinaairports.org.cn/uploads/file/20240604/1717479725377314.pdf (accessed on 24 May 2026).
- ISO 5491:2023; Vertiports—Infrastructure and Equipment for Vertical Take-Off and Landing (VTOL) of Electrically Powered Cargo Unmanned Aircraft Systems (UAS). International Organization for Standardization: Geneva, Switzerland, 2023. Available online: https://www.iso.org/standard/81313.html (accessed on 24 May 2026).
- O’Reilly, P.E.; Rahimi, R.A.; Marques, J.L.R.; Babadopulos, M.A.F.A.L. Vertiport ventures: Assessing operational feasibility for eVTOL integration in São Paulo’s helipad and heliport infrastructure. J. Mark. Anal. 2025, 13, 873–884. [Google Scholar] [CrossRef] [Scilit]
- ASTM F3423-22; Standard Specification for Vertiport Design. ASTM International: West Conshohocken, PA, USA, 2022.

Disclaimer/Publisher’s Note: The statements, opinions and data contained in all publications are solely those of the individual author(s) and contributor(s) and not of MDPI and/or the editor(s). MDPI and/or the editor(s) disclaim responsibility for any injury to people or property resulting from any ideas, methods, instructions or products referred to in the content. |
© 2026 by the authors. Licensee MDPI, Basel, Switzerland. This article is an open access article distributed under the terms and conditions of the Creative Commons Attribution (CC BY) license.