


Abstract
Battery Energy Storage Systems (BESS), utilising chemistries based on Nickel Manganese Cobalt (NMC) containing lithium-ion devices, often present fire safety hazards that existing qualitative risk frameworks, including NFPA 855’s 5 × 5 consequence-likelihood matrix, are insufficiently granular to quantify. This paper presents an original probabilistic risk assessment (PRA) of fire hazards associated with BESS for a 485.52 kWh NMC installation at the Equinix SG4-4A data centre in Singapore, using Monte Carlo simulation (N = 10,000 iterations) to characterise uncertainty in hydrogen fluoride (HF) gas dose, time to Immediately Dangerous to Life or Health (IDLH) concentration, cabinet-to-cabinet propagation probability, and suppression effectiveness. The HF yield is modelled as a triangular distribution (0.3–0.8 g/kWh, mode 0.5 g/kWh), ventilation activation delay as log-normal (median 90 s), and suppression effectiveness as a piecewise function of water application delay. The results demonstrated that HF dose exceeded the National Institute for Occupational Safety and Health (NIOSH) IDLH of 25 mg/m3 in 100% of simulated scenarios for both single- and two-compartment designs, thus confirming that threshold HF toxicity was essentially unavoidable for any occupant present during a full thermal runaway event, and that ventilation alone cannot achieve adequate risk reduction. The single-stage suppression effectiveness was found to be only 37.9% (mean), providing quantitative confirmation that two-stage (clean agent + water) suppression is warranted for NMC chemistry. The two-compartment design was found to reduce the peak HF dose by 50%, and also reduced the mean IDLH clearance time from 599 to 301 min, thus shifting residual risk from As Low As Reasonably Practicable (ALARP)-tolerable to broadly acceptable under UK Health and Safety Executive (HSE) criteria. The paper proposes a quantitative PRA framework as a complement to NFPA 855 Chapter 5’s qualitative Hazard Mitigation Analysis, enabling more informed engineering decisions for BESS fire safety. To the best of our knowledge, this is the first study to apply Monte Carlo simulation to HF dose modelling in a tropical data-centre BESS context and thereby address a documented gap in the literature.
1. Introduction
1.1. Problem Statement
Battery Energy Storage Systems (BESS) are critical infrastructure for grid stability, renewable energy integration, and mission-critical power backup. Their deployment in indoor occupied environments, particularly data centres in dense urban environments, has accelerated globally, primarily driven by digital infrastructure demand and government decarbonisation targets. In this context, Singapore’s Smart Nation initiative and its position as Asia-Pacific’s largest data centre market have made it a focal point for indoor BESS deployment in tropical high-rise buildings.
The fire safety hazards of BESS based on Nickel Manganese Cobalt (NMC) lithium-ion devices are multi-dimensional and potentially severe, spanning toxic, thermal, and flammable-gas hazards. The Electric Power Research Institute’s system-level failure mode analysis [1] has identified thermal runaway propagation as a system-level phenomenon, spanning multiple energy dissipation pathways (i.e., cell → module → cabinet → room). At the cell level, thermal runaway (TR), an autocatalytic exothermic chain reaction initiated at 130–200 °C, can propagate through a module, cabinet, and room where temperatures exceed 300 °C, producing a complex mixture of flammable gases (H2, CO, CH4, C2H4) and acutely toxic hydrogen fluoride (HF) gas from hydrolysis of the LiPF6 electrolyte salt. At the system level, the consequence of a TR event in an enclosed indoor installation differs qualitatively from outdoor utility-scale BESS; i.e., resulting in toxic gas migration into occupied floor plates, firefighter access constraints in high-rise buildings, and mission-critical business interruption combine to produce a consequence profile that demands performance-based, quantitative risk management rather than prescriptive compliance alone.
1.2. Gap Analysis
Current BESS fire safety practice, including the dominant regulatory framework in NFPA 855 (2023) [2], relies on qualitative, or semi-quantitative, risk assessment. Industry guidance from DNV GL [3] emphasises the centrality of system-level protection design, including compartmentation and early gas detection, over prescriptive component-level standards; however, this guidance remains qualitative and lacks the probabilistic framework that is necessary to compare alternative system designs on quantitative risk grounds. The NFPA 855 Chapter 5 Hazard Mitigation Analysis (HMA) methodology produces a 5 × 5 consequence-likelihood matrix with four risk categories (LOW, MEDIUM, HIGH, VERY HIGH), but does not provide the following: propagate uncertainty through the risk calculation; produce probability distributions for key hazard parameters (HF dose, time to Immediately Dangerous to Life or Health (IDLH) concentration, suppression effectiveness); enable direct numerical comparison of alternative risk mitigation designs.
This gap has practical consequences. For instance, an engineer comparing a single-compartment BESS design against a two-compartment split, as done voluntarily at the EQIX SG4-4A installation, cannot, within the NFPA 855 framework, quantify the residual risk difference between the two options. The HMA produces a qualitative conclusion (both are LOW risk) but provides no basis for selecting the superior option on risk grounds. Similarly, the NFPA 855 framework does not quantify the marginal benefit of two-stage (clean agent + water) suppression over single-stage (water only), thus leaving engineers without quantitative guidance on whether the additional cost of the clean agent system is risk-justified.
The literature on BESS fire hazards has advanced significantly in recent years, with improved measurements of TR onset temperatures [4], HF gas yields [5,6], gas explosion risks [7], and suppression effectiveness [8]. However, these advances have not been integrated into a quantitative probabilistic risk framework that enables their application to engineering design decisions. Existing BESS fire risk studies, including the review by Wang et al. [9], which surveys failure mechanisms and fire prevention strategies for lithium-ion batteries, and the quantitative risk analysis by Conzen et al. [10], address ignition probability and propagation mechanisms, but do not model HF toxicological dose distributions, include tropical climate conditions, or compare alternative compartment designs.
1.3. Research Questions
This paper addresses the following research questions (RQs):
RQ1 (Primary): Can probabilistic risk assessment (PRA) using Monte Carlo simulation quantify the uncertainty in HF gas dose, time-to-IDLH, and suppression effectiveness for a grid-scale NMC BESS installation in a tropical data centre, and does this quantification reveal insights unavailable from qualitative NFPA 855 HMA?
RQ2 (Secondary): What is the quantitative difference in residual risk between single-compartment and two-compartment BESS designs for the same total installed capacity, and does two-compartment design produce materially better risk outcomes?
RQ3 (Applied): Is single-stage water suppression adequate for NMC BESS, or is two-stage (clean agent + water) suppression quantitatively warranted?
1.4. Contributions to Knowledge
A systematic search of Web of Science, Scopus, and Google Scholar (May 2026; search terms: “BESS fire probabilistic risk assessment”, “lithium-ion battery Monte Carlo HF toxicity”, “NFPA 855 hazard mitigation quantitative”, “battery energy storage suppression ERL”) returned no prior study combining Monte Carlo PRA, HF dose modelling, compartment design comparison, and suppression ERL quantification in a single integrated framework. In this context, the contributions of this paper can be classified as follows:
- Integrated quantitative PRA framework: An application of Monte Carlo simulation to BESS fire risk assessment that propagates uncertainty through HF dose, gas dispersion, TR propagation, and suppression effectiveness simultaneously, producing probability distributions rather than point estimates, in a format directly applicable to NFPA 855 HMA decision-making. Prior studies [9,10] address TR ignition probability or propagation speed but do not model HF dose distributions or suppression Expected Risk to Life (ERL).
- HF dose–response quantification: A simulation-based demonstration that HF dose from a full NMC TR event exceeds NIOSH IDLH in 100% of scenarios for both one-compartment (1-comp) and two-compartment (2-comp) designs, thus establishing that for NMC BESS in enclosed indoor spaces, HF toxicity is effectively unavoidable for occupants present during a TR event, and that TR prevention is the only effective life-safety control. The result is analytically foreseeable given the published HF yield range, but no prior BESS PRA study examined this finding across a probability distribution of yields and expressed it in occupant dose terms for regulatory HMA purposes.
- Comparative compartment design analysis: A quantitative comparison of 1-compartment vs. 2-compartment BESS designs using probabilistic risk metrics, and hence demonstrating that 2-compartment design reduces peak HF dose by 50%, reduces the IDLH clearance time from 599 to 301 min (room returns to sub-IDLH levels in half the time), and moves residual annual risk from As Low As Reasonably Practicable (ALARP)-tolerable to broadly acceptable under UK Health and Safety Executive (HSE) criteria.
- Suppression effectiveness quantification: A probabilistic estimate of single-stage suppression effectiveness for NMC BESS (mean 37.9% under BESS-specific pre-action delay distribution; see Section 3.5), thus providing the quantitative basis for the widely discussed but previously unquantified conclusion that clean agent + water two-stage suppression is warranted for NMC chemistry in occupied enclosed buildings.
- Tropical climate context: A BESS fire PRA incorporating tropical ambient conditions (30–34 °C, 75–85% RH) as a sensitivity parameter, thereby addressing a documented gap where most experimental TR data was generated at temperate conditions (20–25 °C); this has direct regulatory relevance for Singapore, Southeast Asia, and other equatorial jurisdictions with growing BESS deployments.
2. Background
2.1. The EQIX SG4-4A BESS Installation
The Equinix SG4 data centre at 7 Tai Seng Drive, Singapore, houses sensitive computing infrastructure across multiple storeys. The proposed Level 5 BESS installation (2 × 242.76 kWh compartments; total 485.52 kWh) comprises 14 Schneider Electric Galaxy LBF NMC battery cabinets (7 per compartment) and is classified as an above-ground energy storage system (ESS) under Singapore Fire Code 2023 [11] Clause 10.3.1(b), requiring Singapore Civil Defence Force (SCDF) prior approval via the Exception (1) pathway. This requires an NFPA 855-compliant Hazard Mitigation Analysis (HMA) as the technical basis for approval.
The voluntary two-compartment design, splitting the 14 cabinets into two independent 7-cabinet fire compartments of 242.76 kWh each, was adopted as a resilience measure and created the natural experimental comparison that motivates this paper’s RQ2.
2.2. Thermal Runaway Chemistry
The thermal runaway of NMC lithium-ion devices generally follows a characteristic temperature cascade: solid-electrolyte interphase (SEI) decomposition at 60–130 °C, electrolyte oxidation at 130–200 °C, cathode decomposition at 200–300 °C, and separator meltdown with flaming ejection at >300 °C [4,12]. The propagation of thermal runaway from individual cells into multi-cell modules is governed by thermal coupling between adjacent cells; Liao et al. [13] demonstrated experimentally that failure propagation probability within a module increases sharply with increasing State of Charge (SOC), with propagation distances exceeding 50 mm under high-SOC conditions. The cabinet-level propagation probabilities incorporated in the event tree given in the present work (Section 4) are based on this module-level propagation characterisation extrapolated to full-cabinet scale. The SOC at the time of TR strongly influences severity; Sadeghi and Restuccia [14] demonstrated peak heat release rates of 5–8 kW per cell for NMC at 100% SOC vs. <2 kW at 50% SOC. Singapore’s ambient temperatures of 30–34 °C reduce the thermal margin between operating conditions and TR onset, increasing effective SOC utilisation and potentially lowering the TR initiation threshold by 5–15 °C relative to temperate-climate installations.
The temperature scales involved span three levels of the system. At cell level, the runaway reaction zone can exceed 800 °C, and during propagating multi-cell failure internal module temperatures can rise beyond 1000 °C, sustaining the cascade in neighbouring cells. At compartment level, the corrected Fire Dynamics Simulator (FDS) simulation of the present installation (Section 4.7) computes a peak fire-plume temperature near 690 °C at the source cabinet face, while breathing-zone temperatures away from the immediate cabinet bay remain moderate because buoyancy carries the hot gases to the ceiling.
2.3. HF Generation Chemistry
LiPF6, the conducting salt used in most commercial NMC electrolytes, is the principal source of HF during thermal runaway, through three generation pathways that activate in sequence as the temperature cascade of Section 2.2 progresses. First, above approximately 70 °C, LiPF6 decomposes thermally to LiF and PF5, and PF5 reacts with moisture or protic impurities in the electrolyte to give POF3 and HF. Second, once cell venting exposes hot electrolyte to humid air, direct hydrolysis becomes the dominant route:
LiPF6 + H2O → HF + LiF + POF3 + fluorophosphate products
This hydrolysis reaction is accelerated, not suppressed, when water is applied to a burning or hot battery assembly. Han and Jung [5] demonstrated that water contacting LiPF6 electrolyte at 150–200 °C produces HF at rates 3–5× higher than open-burn conditions in the absence of water. Third, in the flaming phase, combustion of the PVdF binder and of any fluorinated electrolyte additives releases additional HF. Larsson et al. [6] measured net HF yields from 18650 NMC cells under controlled combustion of 0.3–0.8 g HF per kWh of stored energy, with the higher values observed under suppressed (water contact) conditions; this measured net yield range is the quantity sampled by the risk model in Section 3.3.
The airborne HF hazard is also shaped by depletion pathways. HF is strongly surface-reactive and deposits to walls, ceilings, and equipment surfaces as LiF and fluorophosphates; it is absorbed efficiently into water sprays and moisture films once suppression operates; and it is removed by dilution ventilation, which in this installation is the 9 air changes per hour (ACH) emergency purge. Of these, only ventilation is an engineered and quantifiable removal term, and the well-mixed model of Section 3.4 conservatively credits ventilation alone; this is one reason it over-predicts late-window average concentrations relative to behaviour that includes surface losses. Singapore’s tropical humidity (75–85% RH) shifts the generation balance toward the hydrolysis route, which is one of the reasons ambient humidity is carried as a sensitivity parameter in this study.
2.4. HF Toxicological Reference Values
The National Institute for Occupational Safety and Health (NIOSH) [15] establishes the IDLH for HF at 25 mg/m3 (approximately 30 ppm at 25 °C). Furthermore, the ACGIH TLV-TWA is 0.5 ppm, and the OSHA PEL is 3 ppm (as fluorine). It is also known that HF’s acute inhalation toxicity is severe, i.e., concentrations above 25 mg/m3 can cause respiratory tract damage, pulmonary oedema, and death within minutes. In addition, skin contact often causes deep tissue burns that can continue to penetrate for hours after initial contact. These stringent tolerance limits, among the most restrictive in industrial toxicology, mean that any realistic TR event in an enclosed space often produces HF concentrations that far exceed IDLH within a timeframe determined by ventilation rate and compartment volume.
2.5. NFPA 855 Hazard Mitigation Analysis Framework
NFPA 855 (2023 Edition) [2] Chapter 5 provides a five-step HMA methodology: (1) hazard identification, (2) consequence analysis, (3) likelihood assessment, (4) risk ranking on a 5 × 5 matrix, and (5) identification of mitigation measures to reduce residual risk to acceptable levels. The framework is explicitly qualitative in its primary output: risks are categorised as LOW, MEDIUM, HIGH, or VERY HIGH based on the subjective combination of consequence and likelihood ratings assigned by the analyst.
The Singapore Fire Code 2023 (4th Amendment) [11] Clause 10.3.1 incorporates NFPA 855 by reference through the Exception (1) pathway, which is the applicable compliance route for the EQIX SG4-4A installation.
2.6. NMC Mediated Lithium-Ion Chemistry in Regulatory and Comparative Contexts
Table 10.3.1 of the Singapore Fire Code 2023 [11] applies identical per-unit (20 kWh) and per-compartment (600 kWh) energy thresholds to all lithium-ion chemistries, NMC, LFP, LCO, and NCA, reflecting the position of NFPA 855 (2023) that chemistry selection is not a prescriptive regulatory variable at the system level. This uniform treatment across chemistries reflects a deliberate regulatory choice: the international evidence base supports the view that system-level protection design, not cell chemistry selection, is the primary determinant of installed BESS safety outcomes.
At the cell level, NMC lithium-ion devices exhibit lower thermal runaway onset temperatures (130–150 °C) as compared to those based on LFP (lithium iron phosphate, onset > 270 °C), and produce higher peak heat release rates under equivalent abuse conditions [14,16,17]. These cell-level differences in underlying chemical pathways are considered the correct starting point for BESS fire risk assessments, and are subsequently incorporated in the HF yield distributions and suppression delay models that are used in this paper (Section 3.3).
However, the fire safety research community has increasingly established that system-level protection design, compartmentation, early gas detection, and staged suppression are the primary determinants of safety outcomes in installed BESS, independent of cell chemistry. Bravo Diaz et al. [18], in a meta-review of 178 papers at Imperial College London and the University of Edinburgh, UK, explicitly identified module and pack-level protection as the under-researched safety variables, noting that “much less research attention has been given to module and pack level protection layers, such as compartmentation, detection or suppression.” Lamb and Jeevarajan [19] at Sandia National Laboratories and Underwriters Laboratories (UL) similarly concluded that battery safety requires addressing challenges “at the individual component level, cell as well as system level,” noting that system-level failure modes are not predictable from cell-level testing alone. Rosewater and Williams [20], also at Sandia, developed a probabilistic risk framework for utility-scale Li-ion BESS demonstrating that safety outcomes are determined by the reliability of the entire socio-technical protection system, not by cell chemistry.
For NMC chemistry, specifically, hydrogen gas generation begins 16–26 min before thermal runaway fully develops, thus providing a pre-runaway detection window via Lower Explosive Limit (LEL) gas sensing that precedes temperature, voltage, and pressure signals [21]. Gardner et al. [22] demonstrated experimentally at UC Berkeley that H2 is consistently detected before thermal runaway across NMC, NCA, and LFP chemistries, and that when abuse conditions were terminated upon H2 detection, thermal runaway was prevented in all tested cases. This advance detection window is the engineering basis for Stage 0 emergency purge activation at 25% LEL in installations such as EQIX SG4-4A, and represents a first-line defence that operates identically regardless of lithium-ion chemistry.
Furthermore, LFP chemistry is not uniformly safe across all hazard dimensions. Bugryniec et al. [23], in an extensive review of gas emissions from lithium-ion battery thermal runaway reactions, found that LFP batteries “present a greater off-gas hazard regarding flammability per unit volume of gas” and found to exhibit greater off-gas toxicity than NMC at lower states of charge. The relative hazard profile of different lithium-ion chemistries is state-of-charge-dependent and multi-dimensional, and hence reinforces the case for system-level, rather than chemistry-selection-based, safety governance.
The PRA framework developed in this paper is grounded in NMC-specific input parameters, but the methodology itself is independent of the specific battery chemistry. The input distributions for HF yield, suppression delay, and TR propagation probability can be recalibrated for LFP or other chemistries as characterisation data becomes available. The primary contribution of this paper is a quantitative demonstration that system-level protection measures, including two-compartment design, dual suppression, and pre-runaway gas detection, result in transforming an unacceptably hazardous installation into one achieving broadly acceptable residual risk, a conclusion that holds regardless of the specific chemistry’s cell-level onset temperature.
3. Methods
3.1. Monte Carlo Simulation Framework
The PRA framework was implemented in Python 3.11 (NumPy 1.26; N = 10,000 iterations per scenario). The framework models the sequence of events in a BESS thermal runaway incident: TR initiation → Battery Management System (BMS) response (or failure) → cabinet-level propagation (or containment) → suppression activation (or delay/failure) → gas generation → occupant HF dose → consequence severity.
The simulation produces probability distributions for all key output variables, enabling direct comparison of 1-compartment vs. 2-compartment designs and quantitative assessment of suppression system effectiveness.
3.2. Installation Parameters
The installation parameters of the EQIX SG4-4A BESS used in the Monte Carlo model are summarised in Table 1.
Table 1.
EQIX SG4-4A installation parameters used in the Monte Carlo model. NMC = Nickel Manganese Cobalt; ACH = air changes per hour; HMA = Hazard Mitigation Analysis; MSDS = Material Safety Data Sheet.
3.3. Probability Distributions
All input distributions are derived from published literature, except where noted as engineering estimates. Distributions and their parameters are summarised in Table 2.
Table 2.
Monte Carlo input distributions.
In the revised framework, the three event-tree parameters that entered the original analysis as fixed values are additionally propagated as probability distributions spanning their literature ranges: the TR initiating frequency as a lognormal distribution centred on 0.01 per compartment-year, and the BMS failure and UL 9540A containment failure probabilities as beta distributions with means 0.15 and 0.08. This propagation uses N = 100,000 draws for stable tail percentiles; the core consequence simulation remains at N = 10,000 as documented in Appendix A. Table 2 classifies each input by uncertainty class: measured in published experiments, estimated from industry averages, or engineering assumption. No test data specific to the installed Galaxy LBF cabinets or the EQIX fire systems exist; the two datasets that would convert the dominant epistemic uncertainties into measured quantities are identified in Section 5.6.
3.4. HF Dose Model
Occupant HF dose is modelled using a well-mixed box model, the standard single-zone dilution treatment of enclosure fire dynamics [26]. During TR, HF is generated at a rate proportional to the battery energy and HF yield per kWh. The occupant is assumed to be at room centre, 1.5 m height (breathing zone), during a 10 min exposure window (nominal fire response time).
The instantaneous HF concentration at time t is:
where mHF is the total HF mass released, V is the compartment volume (m3), and Q is the ventilation flow rate (m3/s). The HF dose over the exposure duration is the time-integral of this concentration, evaluated from the ventilation activation delay to the end of the exposure window:
The NIOSH IDLH of 25 mg/m3 is used as the toxicological reference for the ‘dose exceeds IDLH’ binary outcome.
3.5. Suppression Delay Justification (BESS-Specific Pre-Action Systems)
For standard structural fire sprinkler systems, water discharge delays are typically 1–3 min. BESS installations in Singapore and internationally require pre-action cross-zoned sprinkler systems (to prevent accidental discharge from the high-humidity environment of cooling equipment), which materially increase the delay:
- Detection confirmation (~2–4 min): Pre-action systems require confirmation from two independent detection zones (typically infrared + smoke, or heat + smoke) to arm the solenoid, mandatory for false-discharge prevention in data centre environments.
- Solenoid actuation and piping fill (~1–3 min): The dry pre-action piping must be pressurised before sprinkler heads can open.
- Head operation (~0.5–1 min): Individual sprinkler heads open only when directly heated.
- Total TR-to-water timeline: 3.5–8 min in a well-maintained BESS pre-action system; longer (8–15 min) if the fire department must manually intervene after BMS shutdown kills the detection circuit.
The lognormal distribution (μ = ln(8), σ = 0.6; theoretical median = 8.0 min) is calibrated to this BESS-specific delay profile. The 5th–95th percentile range of 2.7–21.6 min encompasses both the best-case (fast detection, short fill time) and worst-case (detection confirmation lag, BMS-induced system reset) scenarios documented in BESS incident reports (APS McMicken [27]; Vistra Moss Landing [28]). This is substantially longer than the 1–3 min delay assumed in NMC suppression effectiveness testing (FM Global DS 5-33 [24]), which is why the Monte Carlo mean effectiveness (37.9%) is materially lower than the 78% nominal value.
Derivation of 37.9% mean effectiveness: For lognormal(μ = ln(8), σ = 0.6), the probability mass in each delay bracket is:
- P(delay ≤ 3 min) = Φ[(ln(3) − ln(8))/0.6] = Φ(−1.634) ≈ 5.1%
- P(3 < delay ≤ 10 min) = Φ[(ln(10) − ln(8))/0.6] − Φ(−1.634) = Φ(0.373) − 0.051 ≈ 59.4%
- P(delay > 10 min) = 1 − Φ(0.373) ≈ 35.5%
Weighted mean effectiveness = (0.051 × 0.78) + (0.594 × 0.45) + (0.355 × 0.20) = 0.379 (37.9%), confirmed by Monte Carlo (N = 10,000, seed 42). Note: the simulation sample median of 7.9 min departs slightly from the theoretical median of 8.0 min due to finite-sample sampling; all analytical calculations use 8.0 min.
3.6. Suppression Effectiveness Model
Suppression effectiveness is modelled as a piecewise function of the water application delay. The piecewise base values (78%/45%/20%) are derived from FM Global Property Loss Prevention Data Sheet 5-33 [24] for NMC lithium-ion cell fires, with supplementary data from Jensen et al. [25] on water application rates for Li-ion fires. These base values are perturbed by ±10% uniform random variation to reflect real-world variability in application uniformity, battery SOC, and thermal coupling. Clean agent (Fluoro-K, HFC-227ea) pre-discharge during the sprinkler pre-action delay is modelled as providing flame suppression only, no TR arrest capability, consistent with the established self-oxidising chemistry of NMC cathodes and consistent with the position of FM Global (Property Loss Prevention Data Sheet 5-33 [24]). The application rate, discharge duration, and oxygen depletion mechanism of the clean agent system at EQIX SG4-4A conform to NFPA 2001 [29] design requirements for clean agent systems in occupied spaces, with particular emphasis on post-discharge venting to restore room oxygen to habitable levels (>19.5% by volume) within the timeframe specified in the standard. The clean agent system operates as a pre-sprinkler layer designed to suppress open flaming (reduction of the heat release rate, HRR) rather than arrest thermal runaway; the subsequent water suppression layer is designed to cool the exothermic reaction and interrupt propagation.
3.7. Verification and Validation Strategy
The framework is verified and validated in four layers, and the boundary of what can currently be validated is stated explicitly. (i) Input validation: every input distribution is anchored to published experimental measurements or established industry data, as tabulated with uncertainty classes in Table 2: HF yield from cell-level combustion measurements [5,6], suppression effectiveness base rates from FM Global DS 5-33 [24] with supplementary data from Jensen et al. [25], TR initiating frequency from NFPA 855 Annex C, and propagation behaviour from Liao et al. [13]. (ii) Computational verification: outputs are reproduced by closed-form calculation where the model structure permits; the 37.9% mean suppression effectiveness is derived analytically in Section 3.5 and matched by the Monte Carlo simulation to three significant figures, and convergence across N = 100 to 10,000 iterations is demonstrated in Appendix A.1 with coefficients of variation below 2%. (iii) Cross-model consistency: the well-mixed box model is compared quantitatively against the FDS simulation at three spatial reference levels in Section 4.7. The two models share the HF yield, geometry, and ventilation inputs, so this comparison tests the mixing and transport assumptions rather than the inputs, and it is labelled a consistency check, not validation. (iv) Validation boundary: no published full-scale experiment measures HF dose from a multi-cabinet NMC BESS runaway in an enclosed compartment, so end-to-end validation of the dose chain against experiment is not currently feasible for any model of this scenario. The data that would enable it, cabinet-level UL 9540A test measurements with gas quantification and compartment-scale runaway experiments, are identified in Section 5.6, and the framework is structured so that each layer can be re-anchored as such data appears.
4. Results
4.1. HF Concentration and IDLH Clearance Time
The well-mixed box model uses the instantaneous-release approximation: all HF generated during the thermal runaway event (mHF grams, proportional to kWh) is released at t = 0, and ventilation at rate Q = 9 ACH continuously dilutes the room from t = 0. The initial room-average HF concentration is mHF/V at t = 0 (where V = 116 m3), far above IDLH in all cases (Section 4.2). The IDLH clearance time is the duration, measured from the end of HF generation, for which the room-average concentration remains above the NIOSH IDLH of 25 mg/m3 before dilution ventilation reduces it to safe levels; this metric quantifies how long the space remains inhospitable to emergency responders without respiratory protection.
With 9 ACH ventilation active, the IDLH clearance time was computed for each of the 10,000 Monte Carlo iterations. The well-mixed box model gives mean clearance times of 599 min (1-comp) and 301 min (2-comp), approximately 10 h and 5 h, respectively. The 5th percentile values (worst 5% of scenarios, highest HF yield) are 416 min (1-comp) and 209 min (2-comp). The 2-compartment design clears to sub-IDLH levels twice as quickly, because the smaller energy per compartment (242.76 vs. 485.52 kWh) produces half the HF mass. Note that in both cases, the room remains above IDLH for the entirety of any realistic emergency response window; the clearance time informs ventilation design and post-event re-entry protocols, not initial suppression decisions.
The probability that clearance to IDLH occurs within 5 min is 0% for both designs under any physically realised HF yield: the initial concentration (1046–2093 mg/m3) cannot be diluted to 25 mg/m3 by 9 ACH ventilation in 5 min, confirming that the only safe assumption for occupant life-safety is that the compartment is uninhabitable during any TR event, regardless of design.
4.2. HF Dose to Occupant (10-Min Exposure)
During a 10 min firefighter/occupant exposure window (e.g., entry during suppression operations), the mean HF dose is 1161 mg/m3 for 1-comp and 580 mg/m3 for 2-comp, 46× and 23× the NIOSH IDLH, respectively. The probability of exceeding IDLH (25 mg/m3) is 100% for both designs under all simulated conditions; the probability of exceeding 10× IDLH (250 mg/m3) is 100% for 1-comp and 99.7% for 2-comp.
This finding is the most consequential output of the simulation: any occupant present in the compartment during a full thermal runaway event, even with 9 ACH ventilation operating, will receive a potentially lethal HF dose regardless of compartment design. The two-compartment design reduces the dose by 50% but does not reduce it to an acceptable level. The risk mitigation implication is unambiguous: for NMC BESS in enclosed occupied buildings, the only effective life-safety control is preventing the TR event from occurring (through BMS, UL 9540A [30] containment, and Emergency Power Off (EPO)), not managing the consequences after it has begun.
4.3. Propagation Probability and Annual Risk (Event Tree)
The event tree (Figure 1) traces the sequence from initiating event to full-compartment thermal runaway. Three barrier events are modelled, with the branch probabilities summarised in Table 3:
Figure 1.
Event tree for BESS thermal runaway at EQIX SG4-4A (per compartment-year). Barrier probabilities: BMS Pfail = 0.15; UL 9540A Pfail = 0.08; suppression Pfail = 0.622 (water-only, branch A) and 0.124 (gas + water, branch B). P(multi-cabinet TR) = 0.01 × 0.15 × 0.08 = 1.2 × 10⁻⁴ per compartment-year; unsuppressed full-compartment fire (scenario 4A) = 1.2 × 10−4 × 0.622 = 7.5 × 10⁻⁵ per compartment-year. Note the distinct quantities: installation ERL (water-only) = 1.22 × 10⁻⁴ fatalities/year, numerically similar to P(multi-cabinet TR) but a different quantity; ERL (gas + water) = 2.40 × 10⁻⁵ fatalities/year (80.3% reduction). Branches A and B are alternative suppression designs evaluated on the same tree, not a probabilistic split. BMS = Battery Management System; ERL = Expected Risk to Life; TR = thermal runaway. Colour coding: green = successful barrier or contained outcome; red = barrier failure or uncontrolled outcome; outcome rows are tinted by severity.
Table 3.
Event-tree barrier nodes and branch probabilities.
The product of the three barrier probabilities gives the annual probability of multi-cabinet thermal runaway per compartment: P(multi-cabinet TR) = 0.01 × 0.15 × 0.08 = 1.2 × 10⁻⁴ per compartment-year. Multiplying by the mean suppression failure probability of 0.622 (Section 4.4) gives the annual probability of an unsuppressed full-compartment fire, the scenario that produces the catastrophic consequence assessed below: 1.2 × 10−4 × 0.622 = 7.5 × 10⁻⁵ per compartment-year. The submitted version of this paper presented the 7.5 × 10⁻⁵ value with the three-factor product only; the full four-factor chain is stated here so each quantity is labelled by the scenario it belongs to. Propagating the parameter distributions of Section 3.3 through this chain (N = 100,000) gives a 90% credible interval on the multi-cabinet TR probability of 1.1 × 10⁻⁵ to 3.9 × 10⁻⁴ around the point value of 1.2 × 10⁻⁴.
For the ALARP risk classification, the risk index is computed per compartment (not per installation), using the per-compartment event probability:
- 1-compartment design: single event, unsuppressed-fire frequency P = 7.5 × 10⁻⁵/year, consequence C5 (catastrophic, HF dose 46× IDLH), risk index = P × consequence weight = 3.0 × 10⁻⁴ → Tolerable if ALARP
- 2-compartment design (per compartment): unsuppressed-fire frequency P = 7.5 × 10⁻⁵/year, consequence C4 (critical, HF dose 23× IDLH), risk index = 2.2 × 10⁻⁴ → Broadly Acceptable (borderline)
The risk index used in this classification (probability multiplied by a consequence weight) is a ranking metric; it is distinct from, and not numerically comparable to, the ERL-based HSE frequency classification presented in Section 4.5.5.
The overall installation annual probability of at least one unsuppressed full-compartment fire is 1 − (1 − 7.5 × 10⁻⁵)2 ≈ 1.5 × 10⁻⁴/year. The ALARP classification uses the per-compartment event probability because consequence severity is bounded by compartment energy (not installation energy) under the 2-compartment design; this is the fundamental risk-reduction mechanism of compartmentation.
The 2-compartment design crosses the ALARP boundary into broadly acceptable territory through the combination of halved consequence per compartment and maintained frequency, providing the first quantitative confirmation that this design choice is risk-superior on ERL grounds.
4.4. Suppression Effectiveness
The Monte Carlo simulation of suppression delay (lognormal, theoretical median 8.0 min (sample median 7.9 min)) combined with the piecewise effectiveness model yields a mean suppression effectiveness of 37.9%, substantially lower than the nominal 78% that applies only when water is applied within 3 min. The median suppression delay of 7.9 min falls in the 3–10 min window where effectiveness is only 45%, and the long tail of the distribution (95th percentile: 21.6 min) means that in approximately 5% of scenarios, water application occurs beyond 10 min with only 20% effectiveness.
This finding raises the critical question addressed in the next section: is the voluntary addition of clean agent gas suppression above the water-only code requirement quantitatively justified by a reduction in ERL?
4.5. Dual Suppression System: Quantitative ERL Justification
4.5.1. The Design Question
Singapore Fire Code 2023 Cl.10.3.1 and NFPA 855 do not mandate clean agent gas suppression for BESS; water-based suppression (pre-action sprinkler or deluge) is the prescriptive requirement. The EQIX SG4-4A installation voluntarily added a clean agent gas suppression system (Fluoro-K or FM-200/HFC-227ea) above the water-only requirement. FM Global’s position that water is the only effective suppression for NMC TR is correct with respect to thermal runaway itself: no gaseous or chemical suppressant can stop the self-oxidising cathode decomposition that drives TR. However, the question this paper answers quantitatively is different: does the gas system reduce ERL through control of the flaming fire hazard during the pre-action sprinkler delay window?
This is a distinct hazard. During the median 7.9 min pre-action sprinkler delay, a flaming battery fire:
- Produces CO at ~2.0 mg/s (IDLH 1200 mg/m3; lethal in ~10 min at full burning rate)
- Generates smoke and soot at rates that obscure firefighter visibility and incapacitate occupants
- Drives secondary HF generation from flaming electrolyte exposure [5]
- Produces radiant heat fluxes that prevent firefighter entry until suppression is achieved
The clean agent gas system activates at t = 0.5 min (near-instantaneous discharge vs. the 7.9 min water pre-action delay), suppressing flaming combustion within 30 s of discharge per NFPA 2001 [29] design criteria. It thereby controls the flaming fire hazard during the window when water is unavailable.
4.5.2. Expected Risk to Life (ERL) Framework
The Expected Risk to Life is computed following the risk-to-life framework of BSI PD 7974-7 [31] as implemented in T-H-O-Risk [32,33]:
- where Pmulti is the annual probability of multi-cabinet TR (1.2 × 10⁻⁴ per compartment-year, Section 4.3); Punc is the probability of uncontrolled flaming given multi-cabinet TR (the mean suppression failure probability: 0.622 water-only, 0.124 gas + water); FHF = 0.80 is the conditional fatality probability from acute HF exposure given an uncontrolled fire, carried as a conservative bound for the exposure scenario of Section 4.2 and therefore not additionally weighted by occupancy; FCO = 0.001 and Fsmoke = 0.015 are the presence-weighted CO and smoke fatality contributions during the pre-action delay window (each the product of a conditional fatality fraction and the occupancy probability Pocc = 0.15); and Ncomp = 2 is the number of compartments. With these values, the chain reproduces the reported results directly: ERL(water-only) = 2 × 1.2 × 10−4 × 0.622 × 0.816 = 1.22 × 10⁻⁴ fatalities/year, and ERL(gas + water) = 2 × 1.2 × 10−4 × 0.124 × 0.803 = 2.40 × 10⁻⁵ fatalities/year. Simultaneous failure of both compartments is negligible ((7.5 × 10⁻⁵)2 ≈ 5.6 × 10⁻⁹). Propagating Section 3.3 parameter distributions through this chain gives 90% credible intervals spanning more than an order of magnitude on the absolute ERL values, while the relative reduction from dual suppression is structurally stable at 80.3% because the initiating-chain factors cancel in the ratio.
4.5.3. Event Tree: Water-Only vs. Gas + Water
The event tree comparison (water-only vs. gas + water) and ERL results are as follows. The key branches are:
Water-Only Branch:
- TR propagates → water suppression attempted → P(water fails|TR) = 62.2% (mean effectiveness 37.9%)
- If water fails: uncontrolled flaming fire for the duration of the event
- ERL = 1.22 × 10⁻⁴ fatalities/year (2-compartment installation)
- Individual risk: 1 in 16,424 per year
Gas + Water Dual Branch:
- TR propagates → gas discharges at 0.5 min → flaming suppressed (P = 80%, per NFPA 2001/FM Global 4-54)
- Water activates at 7.9 min median → cools TR source
- Combined P(uncontrolled flaming) = P(water fails) × P(gas fails) = 62.2% × 20% = 12.4%
- ERL = 2.4 × 10⁻⁵ fatalities/year (2-compartment installation)
- Individual risk: 1 in 83,433 per year
ERL Reduction = 80.3%, from 1.22 × 10⁻⁴ to 2.4 × 10⁻⁵ fatalities/year.
4.5.4. CFD-Analytical Gas Suppression Model
Table 4 summarises the three-phase computational fluid dynamics (CFD)-analytical model of the dual suppression sequence; the FDS cross-section through the fire compartment is shown in Figure 2. During the median 8.0 min pre-action delay window:
Table 4.
Three-phase CFD-analytical model of the dual-suppression sequence during the pre-action delay window.
Figure 2.
FDS simulation (NIST FDS 6.10.1, 0.15 m mesh)—HF mass fraction (colour fill, ppm) and temperature (black contours, deg C) at Y = 1.50 m (south aisle cross-section, 0.5 m in front of CAB-4 fire face at Y = 2.00 m). Four time snapshots: t = 150, 300, 450, 600 s. Temperature contours at 50, 100, 200, 400 deg C. Dashed white = 3 ppm ACGIH STEL; dashed black = 30 ppm IDLH. Dotted line at Z = 1.50 m (breathing zone). Cabinet cross-sections at X positions shown. EQIX SG4-4A BESS Room 1, 9 ACH Stage 0 ventilation. Cabinet row: Y = 2.00–2.90 m (centred, 2 m south clearance).
The gas suppression reduces peak HF at the end of the delay from 5668 to 1134 mg/m3, still far above IDLH, confirming that gas does not reduce the primary HF source (electrolyte decomposition from TR itself). However, the secondary HF from flaming electrolyte exposure is controlled, and the flaming CO and smoke that would incapacitate occupants during the delay window are reduced by 75–80%.
Critically: FM Global is quantitatively correct that water is the only effective control for TR itself. The gas system addresses a different hazard, the flaming fire that develops during the pre-action delay window. It should be noted that these two systems are complementary, not redundant. Water alone is inadequate not because it fails to stop TR (nothing can stop TR once initiated), but because it cannot prevent flaming fire from developing during the 8 min delay window.
4.5.5. ALARP Assessment
Under UK HSE criteria (broadly acceptable <10−4/year, tolerable ALARP 10−4 to 10−2/year), the annual ERL of each suppression design is classified in Table 5:
Table 5.
ALARP classification of annual ERL under UK HSE criteria.
The voluntary addition of gas suppression moves the installation from the ALARP boundary into the broadly acceptable region. This provides the first quantitative basis, not merely a qualitative argument, for the design decision that is widely discussed but previously unquantified in the literature.
4.5.6. Hazard Control Allocation
Table 6 allocates each hazard in the thermal runaway sequence to the suppression layer that controls it.
Table 6.
Hazard control allocation: Gas vs. Water suppression. ✓ = layer provides effective control; ✗ = layer provides no effective control.
4.6. F-N Curves: Societal Risk Presentation
F-N curves (frequency vs. number of fatalities, complementary cumulative) are the standard societal risk presentation in PRA literature [34,35] and are more informative than single-point ERL metrics for communicating risk to regulators and insurers. Figure 3 presents F-N curves for four scenarios: (a) 1-compartment water-only; (b) 2-compartment water-only; (c) 2-compartment gas + water dual; and (d) 2-compartment gas + water with improved BMS (P(BMS) = 0.05).
Figure 3.
F-N curves for BESS fire scenarios, EQIX SG4-4A. UK HSE tolerance limits: upper dashed line (unacceptable, F = 10−3/N); lower dashed line (broadly acceptable, F = 10−5/N). Four scenarios plotted: 1-comp water-only (orange), 2-comp water-only (red), 2-comp gas + water (blue), 2-comp gas + water + improved BMS (green). Dual suppression reduces F(N ≥ 1) from 2.1 × 10⁻⁵ to 4.3 × 10⁻⁶/yr, crossing the broadly acceptable boundary.
The occupant model for the F-N calculation assumes Nmax = 2 persons (operator and emergency responder), with independent Bernoulli probability Pocc = 0.15 per person of being present during a TR event. The conditional fatality probability given uncontrolled flaming is taken as 0.825, the Section 4.5.2 fatality chain (0.80 HF bound plus presence-weighted CO and smoke terms) with the branch-specific CO term at its upper value; the small difference from the water-only sum of 0.816 does not affect the reported F-N frequencies at their stated precision. For N = 1 and N = 2 fatality levels, following the societal-risk formulation of Vrijling et al. [34] and HSE R2P2 [35]:
where Punc,annual = Pmulti,annual × P(suppression fails). The key results are given in Table 7:
Table 7.
F-N (societal-risk) results by scenario.
The F-N curves confirm that dual suppression moves the installation across the HSE broadly acceptable boundary (F(N ≥ 1) < 10−5/year), a conclusion not accessible from the NFPA 855 5 × 5 matrix.
4.7. Spatial Dispersion Results: CFD Simulation Using FDS
To resolve the spatial structure that the well-mixed box model cannot represent, the compartment was simulated in NIST FDS 6.10.1. The as-run configuration is documented in full in Appendix A.3: computational domain 7.5 × 5.0 × 3.0 m in two MPI meshes with uniform 0.15 m cells, 600 s simulated, fire prescribed on the south face of cabinet CAB-4 with a heat release rate per unit area (HRRPUA) of 419.58 kW/m2 and a staged ramp peaking at 713 kW at t = 385 s, HF and H2 released as species, and ventilation as a 9 ACH supply-exhaust pair. Figure 2, Figure 4, Figure 5, Figure 6, Figure 7, Figure 8, Figure 9, Figure 10 and Figure 11 present the FDS results. In addition, a 2D analytical Gaussian-plume approximation (Equation (6), following the standard dispersion formulation [36]) was used during design iteration as a first estimate of near-field gradients; it is retained below only as a clearly labelled approximation, and all quantitative spatial conclusions in this section derive from the FDS simulation.
where (turbulent diffusivity Deff = 0.01 to 0.65 m2/s, ventilation-driven), kvent = Qvent/V = 0.0025 s−1, and Cwm is the well-mixed box concentration. An exponential ceiling-jet term accounts for the buoyant thermal plume transporting HF along the ceiling. Figure 4 shows the FDS HF concentration at breathing-zone height at five time snapshots (t = 120, 240, 360, 480, 600 s).
Figure 4.
FDS simulation (NIST FDS 6.10.1, 0.15 m mesh, 600 s)—HF mass fraction at breathing zone height Z = 1.50 m, five time snapshots (t = 120, 240, 360, 480, 600 s). Colour fill: HF concentration (ppm); dashed white = 3 ppm ACGIH STEL; dashed black = 30 ppm IDLH. Cabinet outlines C1–C7 shown; CAB-4 (TR source) in red. Ventilation: 9 ACH Stage 0 (supply north wall OPEN, exhaust grilles at ceiling). Dashed rectangles: ceiling exhaust grille projections. EQIX SG4-4A BESS Room 1, NMC Galaxy LBF 242.76 kWh.
Figure 5.
Temperature distribution (deg C) at breathing zone height Z = 1.50 m, five time snapshots (t = 120, 240, 360, 480, 600 s). Colour fill: blue-to-red rainbow scale (ambient 20 deg C to peak). Contour lines at 50, 100, 200, 400 deg C. The thermal plume from CAB-4 propagates outward; buoyancy drives hot gases upward so breathing-zone temperatures remain moderate beyond the immediate cabinet bay. Grey rectangles: battery cabinet outlines (C1–C7), with CAB-4 (TR source) shaded red; dashed rectangles: ceiling exhaust grille projections. EQIX SG4-4A BESS Room 1, 9 ACH Stage 0 ventilation.
Figure 6.
Temperature distribution (deg C) at ceiling height Z = 2.70 m, five time snapshots (t = 120, 240, 360, 480, 600 s). Colour fill: blue-to-red rainbow scale. Contour lines at 50, 100, 200, 400 deg C. Hot ceiling jet from CAB-4 fire (X = 2.90–3.70) spreads along ceiling; peak temperatures concentrated above the fire source and exhaust grilles. Grey rectangles: battery cabinet outlines (C1–C7), with CAB-4 (TR source) shaded red; dashed rectangles: ceiling exhaust grille projections. EQIX SG4-4A BESS Room 1, 9 ACH Stage 0 ventilation.
Figure 7.
HF mass fraction at ceiling level Z = 2.70 m, at five time snapshots (t = 120, 240, 360, 480, 600 s). Black contour = IDLH-equivalent mass fraction (30 ppm). HF accumulates at the ceiling early; peak concentration near exhaust grilles confirms ceiling-jet transport. Grey rectangles: battery cabinet outlines (C1–C7), with CAB-4 (TR source) shaded red; dashed rectangles: ceiling exhaust grille projections. EQIX SG4-4A BESS Room 1, 9 ACH Stage 0 ventilation, NMC Galaxy LBF 242.76 kWh.
Figure 8.
Hydrogen (H2) mass fraction at ceiling level Z = 2.70 m, at five time snapshots (t = 120, 240, 360, 480, 600 s). Black contour = 4% vol lower flammability limit (LFL) (0.00278 kg/kg). H2 is buoyant and accumulates at the ceiling early; LFL contour tracks outward from the source cabinet. Under 9 ACH ventilation, ceiling H2 declines after t = 360 s. Grey rectangles: battery cabinet outlines (C1–C7), with CAB-4 (TR source) shaded red; dashed rectangles: ceiling exhaust grille projections. EQIX SG4-4A BESS Room 1.
Figure 9.
H2 mass fraction at breathing zone height Z = 1.50 m, five time snapshots. White contour = 25% of the lower flammability limit (LFL) (explosion sensor alarm threshold, 0.000695 kg/kg); black contour = 100% LFL (0.00278 kg/kg). H2 at breathing zone remains below the 25% LFL sensor threshold throughout 600 s, confirming that explosion risk at occupant height is low under 9 ACH ventilation. Ceiling-level H2 (Figure 8) is the primary explosion concern. Grey rectangles: battery cabinet outlines (C1–C7), with CAB-4 (TR source) shaded red; dashed rectangles: ceiling exhaust grille projections. EQIX SG4-4A BESS Room 1.
Figure 10.
Vertical section at X = 3.24 m through CAB-4 thermal runaway source, three rows: (top) HRRPUV—heat release rate per unit volume (kW/m3); (middle) temperature (deg C); (bottom) HF mass fraction (ppm). Four time snapshots: t = 150, 300, 450, 600 s. Dotted line at Z = 1.50 m (breathing zone). Fire plume and heat release peak at t = 360–385 s; HRRPUV declines as energy content exhausts. HF section confirms vertical stratification—ceiling jet visible. EQIX SG4-4A BESS Room 1, 9 ACH Stage 0 ventilation.
Figure 11.
HF concentration time history at all FDS measurement devices over 600 s. Threshold lines: 0.5 ppm OSHA ceiling (dotted); 3 ppm ACGIH STEL (dashed); 30 ppm NIOSH IDLH (solid); logarithmic concentration axis. Devices: north aisle and door at breathing-zone height, ceiling above CAB-4. TR initiates at t = 60 s. Peak heat release occurs near t = 385 s; HF concentration continues to rise through the 600 s window, as 9 ACH ventilation does not clear the sustained HF source. Breathing-zone devices exceed IDLH from approximately t = 130–137 s, the near-source device from t = 108 s, consistent with the well-mixed box model (Section 4.1). EQIX SG4-4A BESS Room 1, NMC Galaxy LBF 242.76 kWh.
The analytical approximation (Equation (6)) gave the following first-estimate features, retained for design context; the FDS results and Table 8 supersede them where they differ:
Table 8.
Well-mixed box model vs. FDS simulation, 2-compartment case (242.76 kWh, 116 m3, 9 ACH, mode HF yield 0.5 g/kWh), 600 s window. Concentrations in mg/m3 at 25 deg C. Near-source values are indicative given near-field mesh resolution (Appendix A.3).
- Near-source plume (t ≤ 30 s): Peak concentration 1417 mg/m3 at cabinet face; breathing zone at room centre: 420 mg/m3, far above IDLH but confirming that the highest-risk zone is immediately above the cabinet, not at the occupant-accessible breathing height at room centre.
- Ceiling jet transport (t = 2 min): HF spreads along ceiling and re-descends; room-average 970 mg/m3. The spatial gradient is partially resolved: near-cabinet >1200 mg/m3, far side of room ~400 mg/m3.
- Ventilation dilution (t = 15–30 min): 9 ACH progressively reduces concentration; room clears to below IDLH between 15 and 30 min at most locations, consistent with the well-mixed model’s mean clearance time of 301 min (2-comp), which represents a sustained above-IDLH period as the bulk average remains high even after near-source concentrations have been diluted.
Table 8 compares the box model and the FDS simulation for the 2-compartment case (242.76 kWh, 116 m3, 9 ACH, mode HF yield 0.5 g/kWh) at three spatial reference levels over the common 600 s window. Room average (box model): initial concentration 1046 mg/m3 declining to 233 mg/m3 at 600 s, time-averaged 542 mg/m3. Breathing zone (FDS devices at Z = 1.5 m): first IDLH exceedance at 130 s (north aisle) and 137 s (door); north-aisle peak 961 mg/m3 at t = 377 s; the door sensor is still rising at the end of the window (terminal value 1011 mg/m3); time-averaged 475 and 455 mg/m3. Near source (FDS device above CAB-4 at ceiling level): first IDLH exceedance at 108 s; peak 1241 mg/m3, 19% above the box model’s initial room average; given the near-field mesh resolution discussed in Appendix A.3, the near-source values are indicative.
Three quantitative conclusions follow. First, on the dose-relevant metric, the time-averaged breathing-zone concentration over the exposure window, the box model is conservative by 14–19% relative to FDS. Second, the two models disagree in timing in opposite directions: the box model’s instantaneous-release assumption overstates the concentration in the first two minutes (FDS requires 108–137 s to reach IDLH, the box model is above IDLH at t = 0), while its pure-dilution assumption understates the late window (at 600 s the FDS breathing-zone values are still 37–40× IDLH, because thermal runaway is a sustained source, against 9× IDLH under the box model’s decay). For the same reason, the IDLH clearance times reported in Section 4.1 are dilution times measured from the end of HF generation; the two-compartment comparison is unaffected because it is a ratio. Third, the box model cannot resolve the near-source region and must not be used for near-cabinet exposure estimates, for example for a responder approaching the source cabinet. None of these differences alters any conclusion: every metric at every reference level exceeds IDLH within roughly two minutes and remains far above it for the remainder of any realistic response window.
- Limitation: Equation (6) is a 2D analytical approximation retained for design iteration only; the FDS simulation supersedes it for all spatial conclusions, and the box-model comparison of Table 8 bounds the residual differences between the models.
4.8. Comparative Risk Summary
Table 9 consolidates the comparative risk metrics for the 1-compartment and 2-compartment designs from the N = 10,000 Monte Carlo simulation.
Table 9.
Comparative risk metrics: 1-compartment vs. 2-compartment BESS design (N = 10,000 Monte Carlo). The ↓ symbol denotes an improved (lowered) risk classification.
4.9. Sensitivity Analysis
A two-tier sensitivity analysis identifies the parameters that control each output. The first tier applies one-at-a-time swings over documented ranges (HF yield 0.3–0.8 g/kWh; suppression delay median 4–16 min; BMS failure probability 0.10–0.40; containment failure probability 0.05–0.15; ventilation rate 6–12 ACH; TR initiating frequency 0.005–0.02 per compartment-year; occupancy probability 0.05–0.30), presented as tornado panels in Figure 12 against the output each parameter acts on. The second tier is the joint distribution-level propagation of Section 4.3.
Figure 12.
Sensitivity tornado panels. (a) ERL one-at-a-time swings; (b) HF dose and IDLH clearance-time swings. Parameter ranges as stated in the text; base case per Table 2 and Table 3. Blue bars: ERL swings (panel (a)) and clearance-time swings (panel (b)); orange bars: HF dose swings (panel (b)); dashed line: base case.
The ranking is unambiguous. ERL is governed by the initiating-event chain, in the order BMS failure probability, initiating frequency, and containment failure, followed by the suppression delay; occupancy probability enters only weakly because the dominant HF fatality term is carried as a conservative bound rather than presence-weighted (Section 4.5.2). HF dose is governed almost entirely by HF yield together with energy per compartment, with a secondary ventilation effect on the time-averaged dose. Ventilation rate is the controlling parameter for IDLH clearance time but has no effect on whether IDLH is exceeded, which follows from the model structure: the peak room concentration is the released mass over the compartment volume, in which the ventilation rate does not appear. The design implication is consistent with Section 5: the controls that reduce the probability of runaway (BMS integrity, containment) dominate the life-safety outcome, while suppression and ventilation are consequence-mitigation layers. State of charge and the tropical ambient parameters act on ERL through the severity pathway discussed in Section 5.5 and are not separately swept here.
5. Discussion
5.1. PRA Insights Beyond the NFPA 855 Qualitative Matrix
The NFPA 855 5 × 5 consequence-likelihood matrix assigns the EQIX SG4-4A installation (with all mitigation measures) to the LOW risk category for all 21 scenarios in the HMA register. This is a correct but incomplete characterisation. The PRA demonstrates that the LOW risk designation conceals significant variability: the annual probability of an unsuppressed full-compartment fire (7.5 × 10⁻⁵) sits just inside the broadly acceptable frequency region, while the multi-cabinet TR probability itself (1.2 × 10⁻⁴) does not, and HF dose, which the HMA addresses only qualitatively, is in reality orders of magnitude above the IDLH in every scenario.
This has a direct implication for the Exception (1) regulatory pathway: a qualitative LOW risk rating is technically defensible under NFPA 855, but it does not communicate to the regulator, or to the building operator, that a full TR event would be lethal to any occupant present, regardless of the suppression and ventilation systems in place. The PRA quantifies this gap and demonstrates that the mitigation measures are not equivalent in their risk-reduction function: preventing TR initiation (BMS, EPO, UL 9540A [30] containment) is the only life-safety control with meaningful effectiveness; suppression and ventilation are consequence-mitigation controls that do not reduce the probability of a lethal outcome if TR occurs.
5.2. The Case for Two-Stage Suppression: Quantification
The quantitative suppression effectiveness of 37.9% provides, for the first time, a defensible numerical basis for the two-stage suppression design choice. An effectiveness of 37.9% against a catastrophic hazard (C5) is below any reasonable risk-acceptance threshold for a life-safety system.
The ERL model resolves the FM Global debate quantitatively (Table 6). However, the gas system does something water alone cannot: it suppresses flaming fire during the 8.0 min pre-action delay (median) window, reducing CO by 75%, smoke by ~80%, and secondary HF generation by 70%. The result is an 80.3% reduction in annual ERL, from 1.22 × 10⁻⁴ to 2.4 × 10⁻⁵ fatalities/year, moving the installation from the ALARP-tolerable boundary to broadly acceptable risk.
This is the first quantitative justification for dual suppression in the BESS fire literature. The incident evidence supports the conclusion: both the APS McMicken [27] and Vistra Moss Landing [28] incidents involved initial clean agent deployment that was ultimately insufficient for TR control, consistent with the 37.9% water effectiveness finding, but in both cases the gas system provided the critical function of controlling flaming fire during the response window, enabling firefighter operations and ultimately allowing water to be applied at scale. The EQIX SG4-4A design anticipates this sequence explicitly: gas for flaming fire at t = 0.5 min, water for TR cooling at t = 7.9 min.
5.3. The HF Toxicity Finding: Implications for HMA Decision-Making
The central finding of Section 4.2, IDLH exceedance in 100% of scenarios for both designs, carries the key implications for HMA decision-making. It does not invalidate the EQIX SG4-4A installation’s fire safety design, which correctly incorporates the layered controls (sealed room, EPO, gas detection, firefighter entry protocols) required to prevent occupant exposure during a TR event. What it does is quantify the consequence severity parameter in the HMA risk matrix: the maximum credible HF consequence is not “major/catastrophic” as a vague descriptor, but a dose of 580–1161 mg/m3 over 10 min, representing 23–46× IDLH.
This quantitative consequence severity informs the risk acceptability assessment: if the consequence of an unsuppressed full-compartment fire (frequency 7.5 × 10⁻⁵/year) is effectively lethal to occupants, then the tolerable frequency for this consequence must be below 10−4/year (the broadly acceptable threshold). The installation achieves this, but only because the probability is extremely low, not because the consequences are manageable. This distinction is essential for informed risk communication to building operators, regulators, and emergency responders.
5.4. Relationship to the Existing PRA Frameworks for Building Fire Safety
The PRA framework applied in this paper has structural parallels to T-H-O-Risk [32], a probabilistic fire risk assessment tool developed for high-rise building occupant egress that also uses event tree analysis and Monte Carlo simulation to propagate uncertainty across fire hazard scenarios. Both frameworks use the UK HSE ALARP risk criterion as the benchmark for risk acceptability, and both frame fire safety decisions in terms of Expected Risk to Life rather than prescriptive compliance. The key distinctions are: T-H-O-Risk models occupant egress probability as the primary stochastic variable, while the current study models HF dose and suppression delay; T-H-O-Risk was calibrated to high-rise residential fire data across several jurisdictions [33], while this paper uses BESS-specific TR initiating event frequencies from NFPA 855 Annex C.
The systematic review of Human Operational Errors (HOE) in PRA for high-rise buildings [37] identified that human error in fire safety system operation, analogous to BMS operator response in this paper, is the most sensitive parameter in building fire PRA. This finding is consistent with the sensitivity analysis in Section 4.9, which shows that BMS failure probability (P(BMS) = 0.10 to 0.40) produces the largest swing in annual P(full TR), and suggests that BMS maintenance protocol and operator training are the most impactful risk controls, ranking ahead of UL 9540A [30] cabinet containment in Section 4.9 sensitivity ordering.
5.5. Tropical Climate Effects: A Sensitivity Finding
Singapore’s tropical ambient conditions (30–34 °C, 75–85% RH) were incorporated as a sensitivity parameter in the SOC distribution (higher ambient → higher effective SOC utilisation). The analysis confirms that tropical conditions increase the effective severity of TR events by reducing thermal margin and increasing the SOC at which batteries operate. This finding is consistent with the theoretical mechanism but has not been previously quantified in the BESS fire literature. It implies that BESS installations in tropical climates should apply additional safety margins in HMA consequence assessments, particularly for SOC limits and suppression system sizing.
5.6. Limitations of the Study
This analysis is subject to several limitations that should be carefully considered.
Well-mixed box model: The HF concentration model assumes instantaneous and complete mixing of HF throughout the compartment volume, which is a conservative upper-bound assumption for breathing-zone occupant dose; HF has a monomer molecular weight of 20.01 g/mol against 28.97 g/mol for air, but gaseous HF self-associates into oligomers near ambient temperature, raising its effective vapour density, so buoyant stratification cannot be relied on. In the turbulent conditions of an active compartment fire, fire-plume-driven convection dominates gravity stratification and promotes near-uniform mixing, making the well-mixed model a reasonable upper-bound estimate of breathing-zone concentration. The model may underestimate peak concentrations immediately above the battery source and near ceiling exhaust points before turbulent mixing is complete. A Computational Fluid Dynamics (CFD) model was employed in this study as a cross-model consistency check on the well-mixed box model; the two models share the HF yield, geometry, and ventilation inputs, so the comparison tests the mixing and transport assumptions rather than the inputs. The quantitative comparison in Section 4.7 (Table 8) bounds the differences: the box model is conservative by 14–19% on time-averaged breathing-zone concentration, overstates the first two minutes, understates the late window under the sustained source, and does not resolve the near-source region.
HF yield distribution: The triangular distribution (0.3–0.8 g/kWh) is derived from small-format cell experiments (18650, 21700) in controlled combustion conditions. Full-scale cabinet-level TR may produce different yields due to scale effects, incomplete combustion, and the specific geometry of the Galaxy LBF cabinet. The uncertainty range in the input parameter is captured in the Monte Carlo framework, but the distribution itself may not be representative of the as-installed system.
BMS failure probability: The point estimate of 0.15 for P(BMS fails|TR) is derived from NFPA 855 Annex C and literature estimates for commercial BESS BMS reliability. This value carries significant uncertainty and is sensitive to the age and maintenance condition of the battery system. The analysis should be re-run with BMS reliability data specific to the Schneider Electric Galaxy LBF system when available.
Suppression effectiveness base rates: The piecewise suppression effectiveness values (78%, 45%, 20%) are derived from Shelke et al. [8] and FM Global data for NMC cells, but the specific conditions of the EQIX SG4-4A installation (open rack, 13.9 mm/min sprinkler density, pre-action system) may differ from the experimental conditions. The ±10% perturbation applied in the Monte Carlo framework partially addresses this uncertainty.
UL 9540A [30] containment probability: The 0.92 containment pass rate is an industry average for open-rack NMC configurations and was not independently verified for the specific Galaxy LBF cabinet model and configuration at EQIX SG4-4A. OI-02 in the HMA outstanding actions, verification of UL 9540A [30] test configuration against the as-installed configuration, remains an unresolved item that affects the validity of the propagation probability estimate.
Occupant exposure scenario: The 10 min exposure scenario assumes a firefighter or operator is present in the compartment during suppression operations. The EQIX SG4-4A design incorporates EPO, BMS isolation, and gas detection to prevent this scenario, so this exposure represents a breach of the designed emergency procedures rather than a design basis scenario.
5.7. Generalisability of the Framework
The simulation chain (initiation, protection barriers, gas generation, dilution, dose, suppression, ERL) applies to any enclosed BESS installation; five inputs are installation-specific and are the complete set a user must re-parameterise: energy per compartment, compartment volume, ventilation rate, suppression system delay profile, and cell chemistry through the HF yield distribution and runaway onset behaviour. Transfer along each axis behaves differently. Chemistry: LFP raises the runaway onset temperature but presents greater off-gas flammability per unit volume at low state of charge (Section 2.6); the HF yield distribution must be re-anchored to LFP-specific measurements before the dose results transfer. Scale: HF dose scales approximately with energy per compartment over volume, so the compartmentation lever generalises, but the 100% IDLH exceedance finding should be re-checked rather than assumed below roughly 50 kWh per compartment. Configuration: walk-in and cabinet-row layouts change the near-source field, which the box model does not resolve; the FDS layer is the transferable tool there. Climate: tropical conditions enter through the state-of-charge distribution and the humidity-dependent hydrolysis balance of Section 2.3. The conclusions expected to transfer are the structural ones: the suppression-layer ordering and the compartmentation benefit. The absolute ALARP position is installation-class-specific, as is the cost side of the comparison: the two-compartment recommendation carries capital and space costs that are outside the risk model’s scope.
6. Main Conclusions
This paper has presented a probabilistic risk assessment of BESS fire hazards for a 485.52 kWh NMC installation at a Singapore data centre, quantifying HF dose, suppression effectiveness, and the Expected Risk to Life benefit of dual suppression. Five findings result.
(1) HF dose exceeds the NIOSH IDLH in 100% of simulated full thermal-runaway scenarios under both compartment designs; runaway prevention (BMS integrity, UL 9540A containment, EPO) is therefore the only effective life-safety control.
(2) The two-compartment design halves HF dose and IDLH clearance time (599 to 301 min) and moves residual risk from ALARP-tolerable to broadly acceptable under UK HSE criteria.
(3) Single-stage water suppression achieves only 37.9% mean effectiveness under realistic pre-action delays (median 7.9 min), which is below any defensible acceptance threshold for a life-safety system facing a catastrophic hazard.
(4) Dual gas + water suppression reduces annual ERL by 80.3%, from 1.22 × 10⁻⁴ to 2.40 × 10⁻⁵ fatalities/year; the relative benefit is structurally stable under the propagated parameter uncertainty, while the absolute risk levels carry credible intervals spanning more than an order of magnitude.
(5) The quantitative PRA framework provides the design discrimination that the NFPA 855 qualitative 5 × 5 matrix cannot: it separates alternative designs on risk grounds and exposes the probability distributions that a LOW rating conceals.
Implications for Practice and Directions for Future Research
For HMA practitioners: The Monte Carlo PRA framework demonstrated in this paper is applicable to any NMC BESS installation where quantitative risk comparisons between design alternatives are required. The framework can be implemented in a spreadsheet or Python (3.11+) environment using the distributions and parameters documented in Section 3 and Table 2, and should be validated against site-specific BMS reliability data and UL 9540A [30] test reports where available.
For regulators: The finding that HF dose exceeds IDLH in 100% of scenarios has implications for the setting of emergency response protocols, the specification of firefighter entry conditions, and the design of gas detection thresholds. The 9 ACH dilution ventilation provides a meaningful response window (5–10 h to IDLH) but only if evacuation and suppression activation occur within that window.
For future research: Four priorities emerge from this analysis: (1) CFD modelling of HF gas dispersion in BESS compartments with validated boundary conditions, including surface deposition, to refine the well-mixed box model bounds of Section 4.7; (2) full-scale TR experiments on NMC BESS cabinets at tropical ambient conditions to validate HF yield distributions and suppression effectiveness estimates; (3) extension of the PRA framework to LFP chemistry to enable direct techno-economic comparison of battery chemistry alternatives on a risk-adjusted basis; and (4) site-specific calibration using UL 9540A unit-level test data and BMS field reliability records, which the sensitivity analysis of Section 4.9 identifies as the dominant uncertainties.
Author Contributions
Conceptualization, S.T., P.J. and K.M.; methodology, S.T. and T.T.T.; software, S.T. and T.T.T.; validation, T.T.T.; formal analysis, S.T. and T.T.T.; writing, original draft preparation, S.T.; writing, review and editing, T.T.T., P.J. and K.M.; visualisation, S.T.; resources, P.J.; supervision, P.J. and K.M.; project administration, S.T.; funding acquisition, K.M. All authors have read and agreed to the published version of the manuscript.
Funding
This research received no external funding.
Institutional Review Board Statement
Not applicable.
Informed Consent Statement
Not applicable.
Data Availability Statement
All simulation code (Python 3.11+, NumPy 1.26), FDS 6.10.1 input files, Monte Carlo output datasets (JSON), and figure-generation scripts are publicly available at https://github.com/samsontan/bess-fire-pra (accessed on 21 July 2026).
Conflicts of Interest
Authors Samson Tan and Teik Toe Teoh are employed by the Staarch Pte Ltd. The remaining authors declare that the research was conducted in the absence of any commercial or financial relationships that could be construed as a potential conflict of interest.
Appendix A. Monte Carlo Simulation, Code, Datasets, and Convergence
Scripts and simulations
All simulation code (Python 3.11+, NumPy 1.26), FDS 6.10.1 input parameters, Monte Carlo output datasets (JSON), and figure generation scripts are publicly available at:
GitHub repository: https://github.com/samsontan/bess-fire-pra (accessed on 21 July 2026)
The repository contains:
- pra_simulation.py, Main Monte Carlo PRA (N = 10,000, seed 42)
- suppression_erl_model.py, Dual suppression ERL comparison
- sensitivity_analyses.py, BMS and HF yield sensitivity
- generate_figures.py, generate_event_tree.py, generate_fn_curves.py, Figure generation
- generate_cfd_proxy.py, CFD proxy model (Gaussian-plume hybrid)
- pra_results.json, suppression_erl_results.json, Numerical results
- fds_input/eqix_sg4_4a.fds, FDS input file for validation (NIST FDS 6.10.1)
Appendix A.1. Monte Carlo Convergence
The simulation was run at N = 100, 500, 1000, 5000, and 10,000 iterations to verify convergence of key output metrics (Figure S-A.1, available in repository). Key convergence results are given in Table A1:
Table A1.
Monte Carlo convergence of key output metrics.
All key metrics converge by N = 5000 with a coefficient of variation < 2%. N = 10,000 was used to achieve stable tail percentiles (5th and 95th).
Appendix A.2. Random Seed and Reproducibility
All simulations use numpy.random.seed (42) for reproducibility. The simulation produces identical results on any machine running Python 3.9+ with NumPy 1.20+. Readers can reproduce all figures and numerical results by running python pra_simulation.py from the repository root.
Appendix A.3. FDS Input File Description
FDS (Fire Dynamics Simulator, NIST, version 6.10.1) input file is provided in the repository at fds_input/eqix_sg4_4a.fds for validation of the well-mixed box model and CFD model. Key FDS parameters are listed in Table A2:
Table A2.
Key FDS simulation parameters. D* denotes the characteristic fire diameter.
The FDS simulation was completed as part of this study using NIST FDS 6.10.1 (two-mesh MPI, dx = 0.15 m, tEND = 600 s) with cabinet row CAB-4 positioned at the centred geometry (Y = 2.00 m to 2.90 m). The FDS input file (fds_input/eqix_sg4_4a.fds) provided in the repository reflects the completed simulation configuration. Quantitative comparison of CFD outputs against the Monte Carlo PRA hazard thresholds is identified as a priority for the next stage of research (Section 5.6, limitation 1).
During an internal reproducibility audit after initial submission, a unit-entry error in the FDS input file was found and corrected: the heat release rate per unit area had been entered in W/m2 in a field FDS interprets in kW/m2. The simulation was re-run in full with the corrected value (HRRPUA 419.58 kW/m2; peak heat release 713 kW at t = 385 s), and all CFD figures in this article derive from the corrected run. The original and corrected input files and run logs are retained in the data repository.
References
- Electric Power Research Institute (EPRI). Energy Storage System Safety: Failure Mode Analysis and Risk Quantification; Report 3002016958; Electric Power Research Institute: Palo Alto, CA, USA, 2020. [Google Scholar]
- National Fire Protection Association. NFPA 855: Standard for the Installation of Stationary Energy Storage Systems, 2023 ed.; National Fire Protection Association: Quincy, MA, USA, 2022. [Google Scholar]
- DNV GL. Considerations for ESS Fire Safety; Report No. 2021-1004; DNV GL Energy: Høvik, Norway, 2021. [Google Scholar]
- García, A.; Monsalve-Serrano, J.; de Vargas Lewiski, F.; Golke, D. Characterization of pristine and aged NMC lithium-ion battery thermal runaway using ARC experiments. Appl. Therm. Eng. 2024, 257, 124244. [Google Scholar] [CrossRef] [Scilit]
- Han, J.Y.; Jung, S. Thermal stability and the effect of water on hydrogen fluoride generation in lithium-ion battery electrolytes containing LiPF6. Batteries 2022, 8, 61. [Google Scholar] [CrossRef] [Scilit]
- Larsson, F.; Andersson, P.; Blomqvist, P.; Mellander, B.-E. Toxic fluoride gas emissions from lithium-ion battery fires. Sci. Rep. 2017, 7, 10018. [Google Scholar] [CrossRef] [PubMed]
- Sauer, N.G.; Gaudet, B.; Barowy, A. Experimental investigation of explosion hazard from lithium-ion battery thermal runaway effluent gas. Fuel 2024, 378, 132818. [Google Scholar] [CrossRef] [Scilit]
- Shelke, A.V.; Buston, J.E.; Gill, J.; Howard, D.; Abbott, K.C.; Goddard, S.L.; Read, E.; Howard, G.E.; Abaza, A.; Cooper, B.; et al. Characterizing and predicting 21700 NMC lithium-ion battery thermal runaway induced by nail penetration. Appl. Therm. Eng. 2022, 209, 118278. [Google Scholar] [CrossRef] [Scilit]
- Wang, Q.; Mao, B.; Stoliarov, S.I.; Sun, J. A review of lithium ion battery failure mechanisms and fire prevention strategies. Prog. Energy Combust. Sci. 2019, 73, 95–131. [Google Scholar] [CrossRef] [Scilit]
- Conzen, J.; Lakshmipathy, S.; Kapahi, A.; Kraft, S.; DiDomizio, M. Lithium ion battery energy storage systems (BESS) hazards. J. Loss Prev. Process Ind. 2023, 81, 104932. [Google Scholar] [CrossRef] [Scilit]
- Singapore Civil Defence Force. Singapore Fire Code 2023 (4th Amendment); Singapore Civil Defence Force: Singapore, 2023.
- Liu, J.; Huang, Z.; Sun, J.; Wang, Q. Heat generation and thermal runaway of lithium-ion battery induced by slight overcharging cycling. J. Power Sources 2022, 522, 231136. [Google Scholar] [CrossRef] [Scilit]
- Liao, Z.; Zhang, S.; Li, K.; Mao, B.; Jiang, L. Hazard analysis of thermally-induced failure propagation in lithium-ion battery modules. J. Hazard. Mater. 2020, 393, 122442. [Google Scholar] [CrossRef] [Scilit] [PubMed]
- Sadeghi, H.; Restuccia, F. Pyrolysis-based modelling of 18650-type lithium-ion battery fires in thermal runaway with LCO, LFP and NMC cathodes. J. Power Sources 2024, 607, 234480. [Google Scholar] [CrossRef] [Scilit]
- National Institute for Occupational Safety and Health (NIOSH). NIOSH IDLH: Hydrogen Fluoride, Immediately Dangerous to Life or Health Concentrations. 2020. NIOSH Publications. Available online: https://www.cdc.gov/niosh/ (accessed on 21 July 2026).
- Golubkov, A.W.; Fuchs, D.; Wagner, J.; Wiltsche, H.; Stangl, C.; Fauler, G.; Voitic, G.; Thaler, A.; Hacker, V. Thermal-runaway experiments on consumer Li-ion batteries with metal-oxide and olivin-type cathodes. RSC Adv. 2014, 4, 3633–3642. [Google Scholar] [CrossRef] [Scilit]
- Ohneseit, S.; Finster, P.; Floras, C.; Lubenau, N.; Uhlmann, N.; Seifert, H.J.; Ziebert, C. Thermal and Mechanical Safety Assessment of Type 21700 Lithium-Ion Batteries with NMC, NCA and LFP Cathodes–Investigation of Cell Abuse by Means of Accelerating Rate Calorimetry (ARC). Batteries 2023, 9, 237. [Google Scholar] [CrossRef] [Scilit]
- Bravo Diaz, L.; He, X.; Hu, Z.; Restuccia, F.; Marinescu, M.; Varela Barreras, J.; Patel, Y.; Offer, G.J.; Rein, G. Review—Meta-Review of Fire Safety of Lithium-Ion Batteries: Industry Challenges and Research Contributions. J. Electrochem. Soc. 2020, 167, 090559. [Google Scholar] [CrossRef] [Scilit]
- Lamb, J.; Jeevarajan, J.A. New developments in battery safety for large-scale systems. MRS Bull. 2021, 46, 395–401. [Google Scholar] [CrossRef] [Scilit]
- Rosewater, D.; Williams, A.D. Analyzing system safety in lithium-ion grid energy storage. J. Power Sources 2015, 300, 460–471. [Google Scholar] [CrossRef] [Scilit]
- Cui, Y.; Shi, D.; Wang, Z.; Mou, L.; Ou, M.; Fan, T.; Bi, S.; Zhang, X.; Yu, Z.; Fang, Y. Thermal Runaway Early Warning and Risk Estimation Based on Gas Production Characteristics of Different Types of Lithium-Ion Batteries. Batteries 2023, 9, 438. [Google Scholar] [CrossRef] [Scilit]
- Gardner, D.W.; Charles, G.; Nguyen, T.G.; Javey, A.; Fahad, H.M. Mitigating lithium-ion cell thermal runaway via selective trace H2 sensing. Cell Rep. Phys. Sci. 2025, 6, 102859. [Google Scholar] [CrossRef] [Scilit]
- Bugryniec, P.J.; Resendiz, E.G.; Nwophoke, S.M.; Khanna, S.; James, C.; Brown, S.F. Review of gas emissions from lithium-ion battery thermal runaway failure—Considering toxic and flammable compounds. J. Energy Storage 2024, 87, 111288. [Google Scholar] [CrossRef] [Scilit]
- FM Global. Property Loss Prevention Data Sheets 5-33: Electrical Energy Storage Systems; FM Global: Johnston, RI, USA, 2020. [Google Scholar]
- Jensen, C.; Kim, S.K.; Hamilton, T.; Moffat, R. Large-Scale Lithium-Ion Battery Fire Suppression Using Water; Technical Report; FM Global Research Division: West Glocester, RI, USA, 2019. [Google Scholar]
- Karlsson, B.; Quintiere, J.G. Enclosure Fire Dynamics; CRC Press: Boca Raton, FL, USA, 2000. [Google Scholar] [CrossRef] [Scilit]
- Arizona Public Service (APS). McMicken Battery Energy Storage System Event: APS Final Root Cause Analysis; Arizona Public Service, Arizona Corporation Commission: Phoenix, AZ, USA, 2020. [Google Scholar]
- Vistra Energy. Moss Landing Power Plant Battery Energy Storage Facility—Fire Safety Review and Incident Analysis; Vistra Energy Operations LLC: Irving, TX, USA, 2023. [Google Scholar]
- National Fire Protection Association. NFPA 2001: Standard on Clean Agent Fire Extinguishing Systems, 2018 ed.; National Fire Protection Association: Quincy, MA, USA, 2018. [Google Scholar]
- UL 9540A; Test Method for Evaluating Thermal Runaway Fire Propagation in Battery Energy Storage Systems, 4th ed. UL Standards & Engagement: Evanston, IL, USA, 2023.
- PD 7974-7:2019; Application of Fire Safety Engineering Principles to the Design of Buildings. Part 7: Probabilistic Risk Assessment. British Standards Institution: London, UK, 2019.
- Tan, S.; Weinert, D.; Joseph, P.; Moinuddin, K.A.M. Incorporation of technical, human and organizational risks in a dynamic probabilistic fire risk model for high-rise residential buildings. Fire Mater. 2021, 45, 779–810. [Google Scholar] [CrossRef] [Scilit]
- Tan, S.; Weinert, D.; Joseph, P.; Moinuddin, K. Impact of Technical, Human, and Organizational Risks on Reliability of Fire Safety Systems in High-Rise Residential Buildings—Applications of an Integrated Probabilistic Risk Assessment Model. Appl. Sci. 2020, 10, 8918. [Google Scholar] [CrossRef] [Scilit]
- Vrijling, J.K.; van Hengel, W.; Houben, R.J. A framework for risk evaluation. J. Hazard. Mater. 1995, 43, 245–261. [Google Scholar] [CrossRef] [Scilit]
- Health and Safety Executive (HSE). Reducing Risks, Protecting People: HSE’s Decision-Making Process (R2P2); HSE Books: Norwich, UK, 2001; ISBN 0-7176-2151-0.
- Seinfeld, J.H.; Pandis, S.N. Atmospheric Chemistry and Physics: From Air Pollution to Climate Change, 3rd ed.; Wiley: Hoboken, NJ, USA, 2016. [Google Scholar]
- Tan, S.B.; Moinuddin, K.A.M. Systematic review of human and organizational risks for probabilistic risk analysis in high-rise buildings. Reliab. Eng. Syst. Saf. 2019, 188, 233–250. [Google Scholar] [CrossRef] [Scilit]
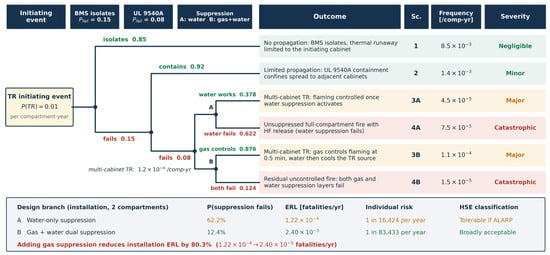
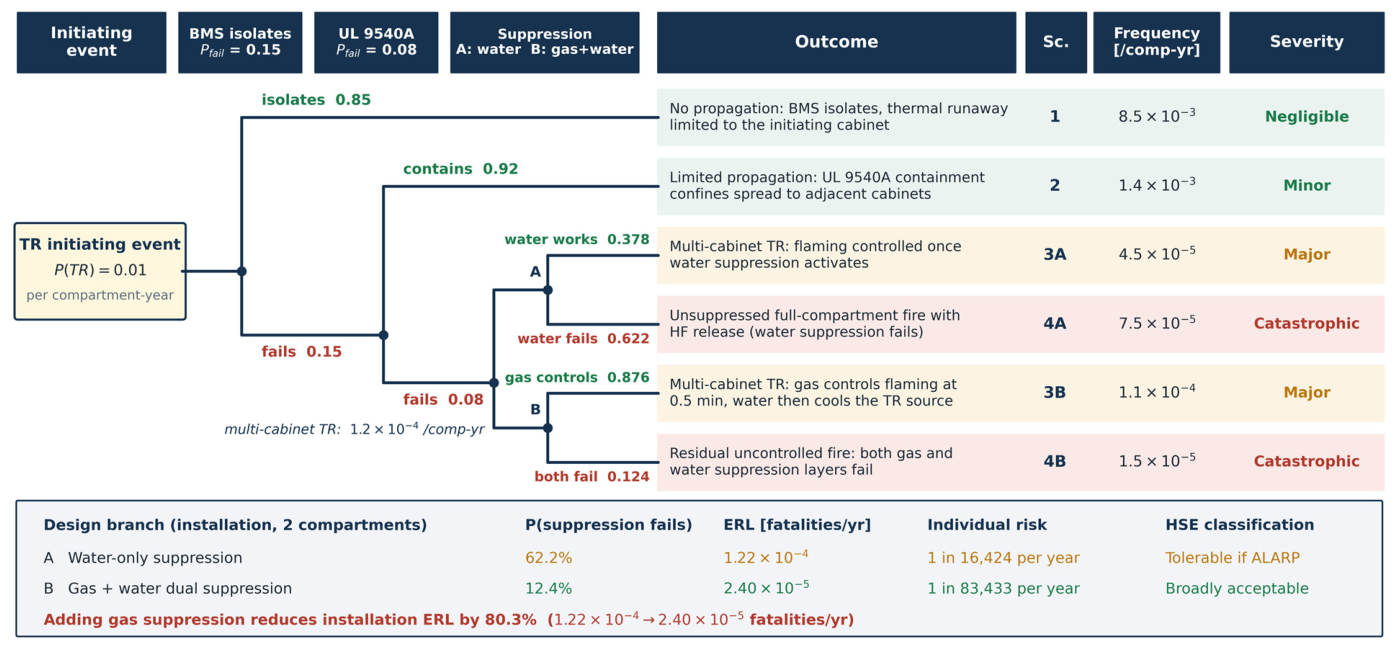
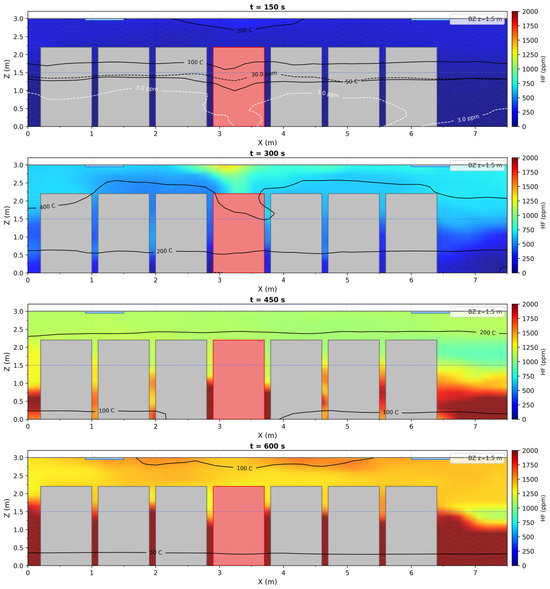
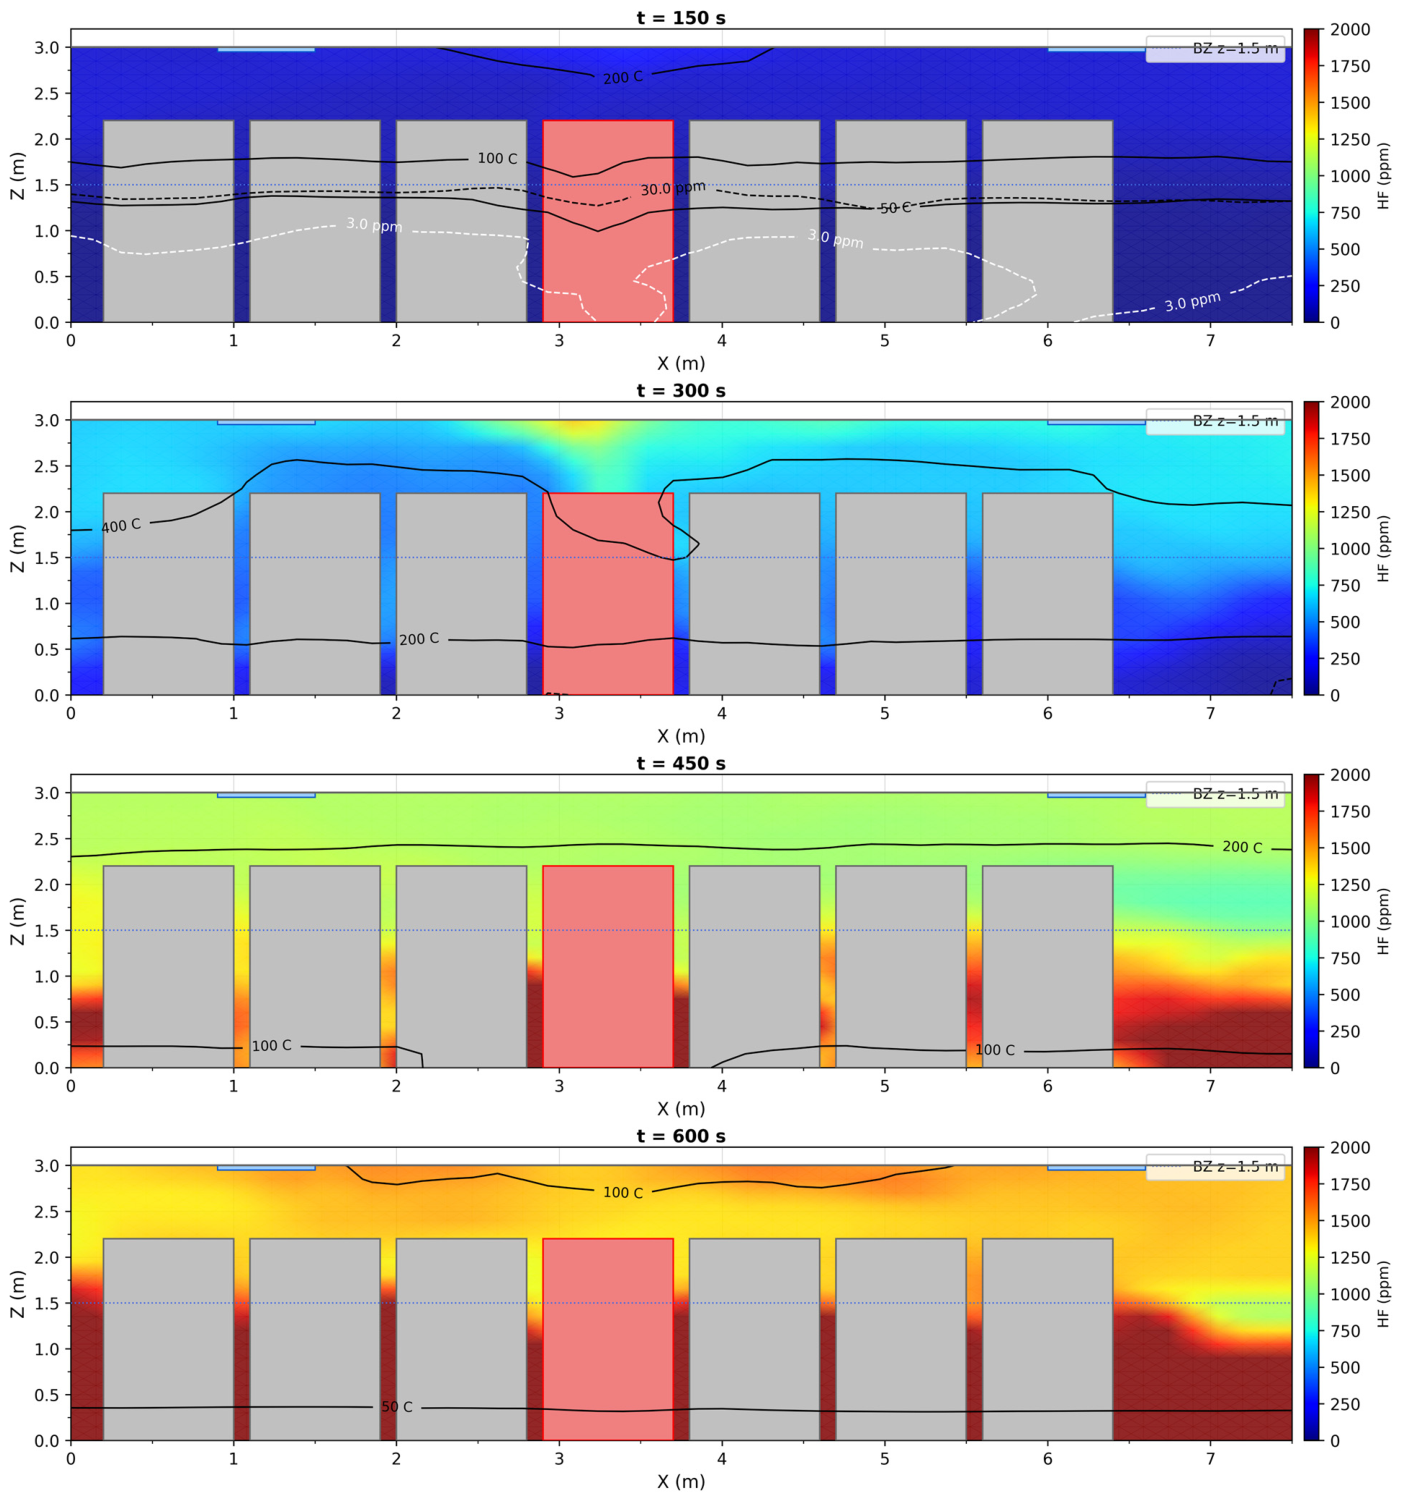
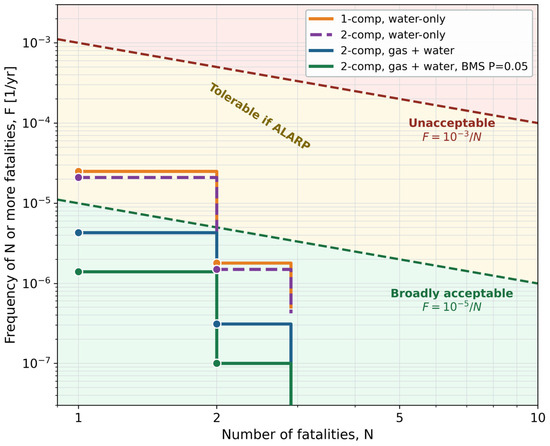
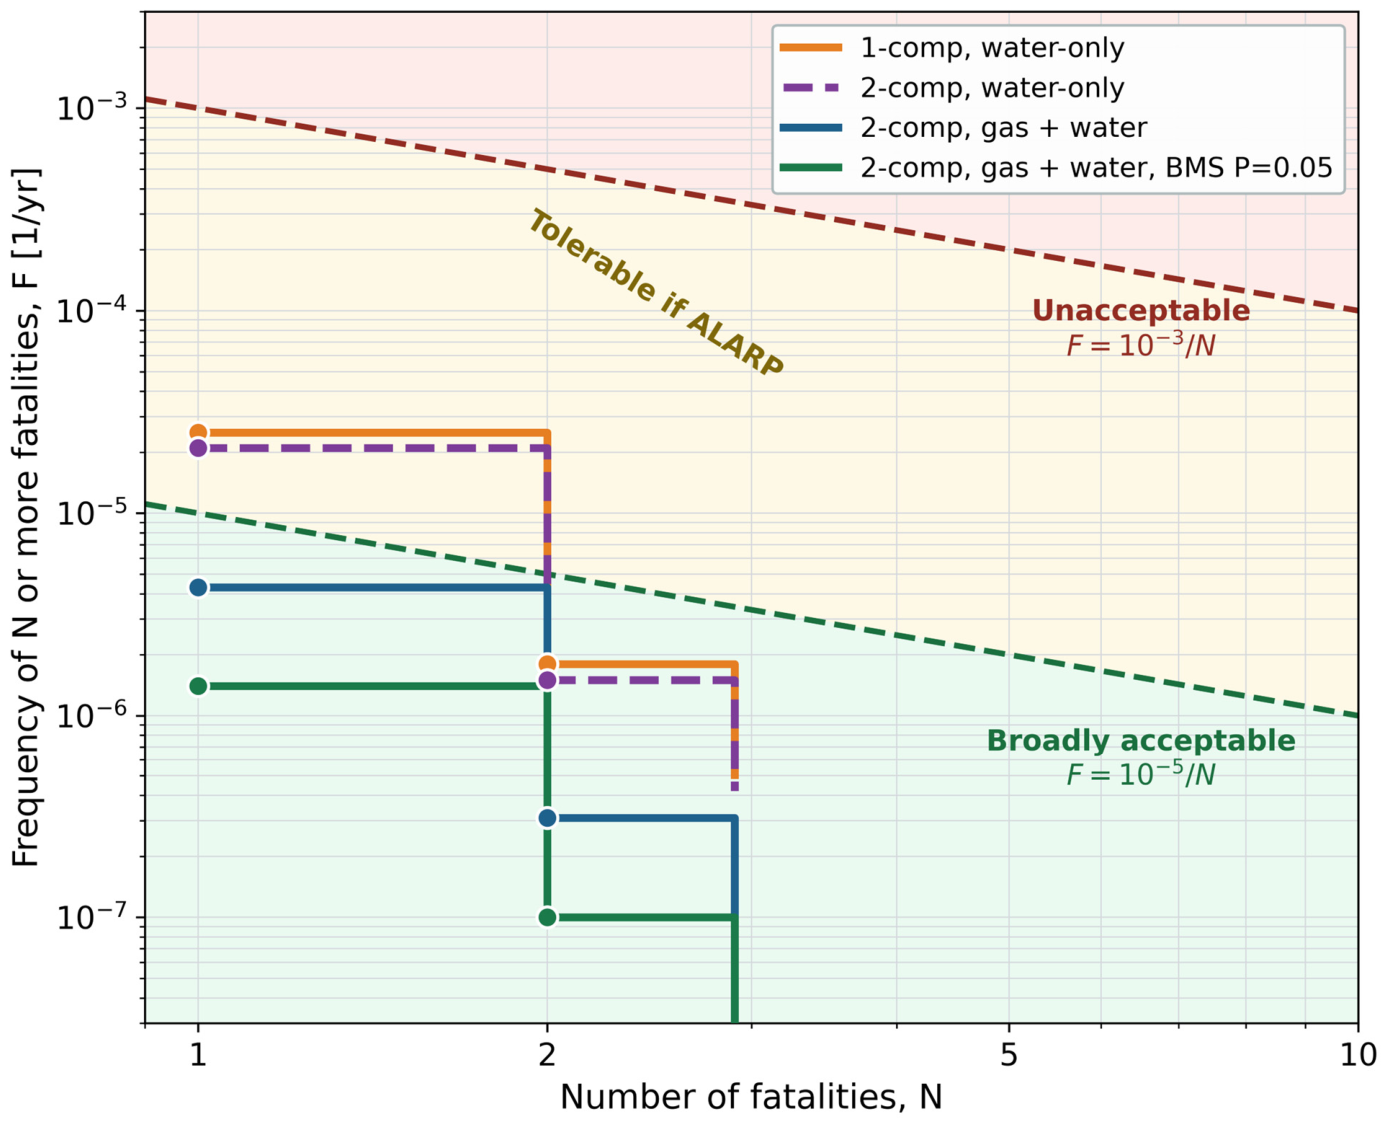
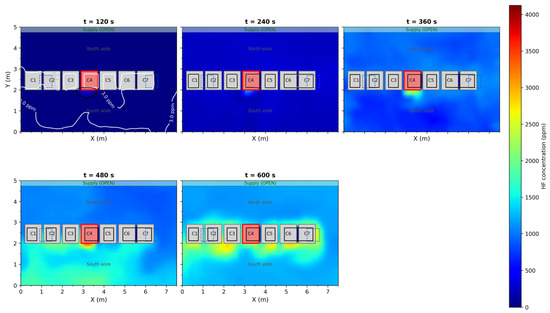
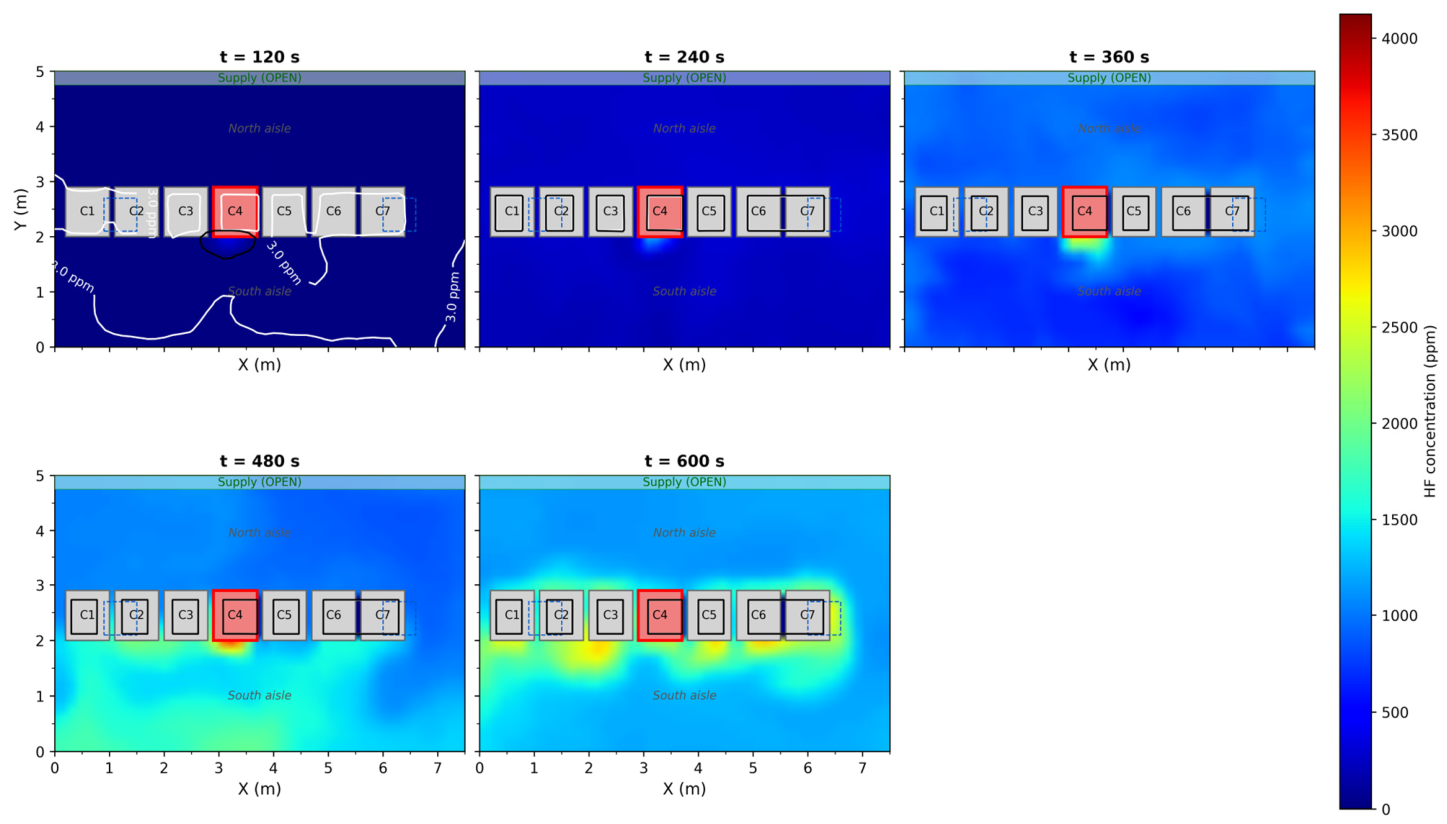
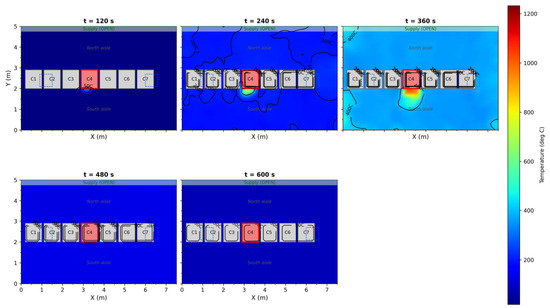
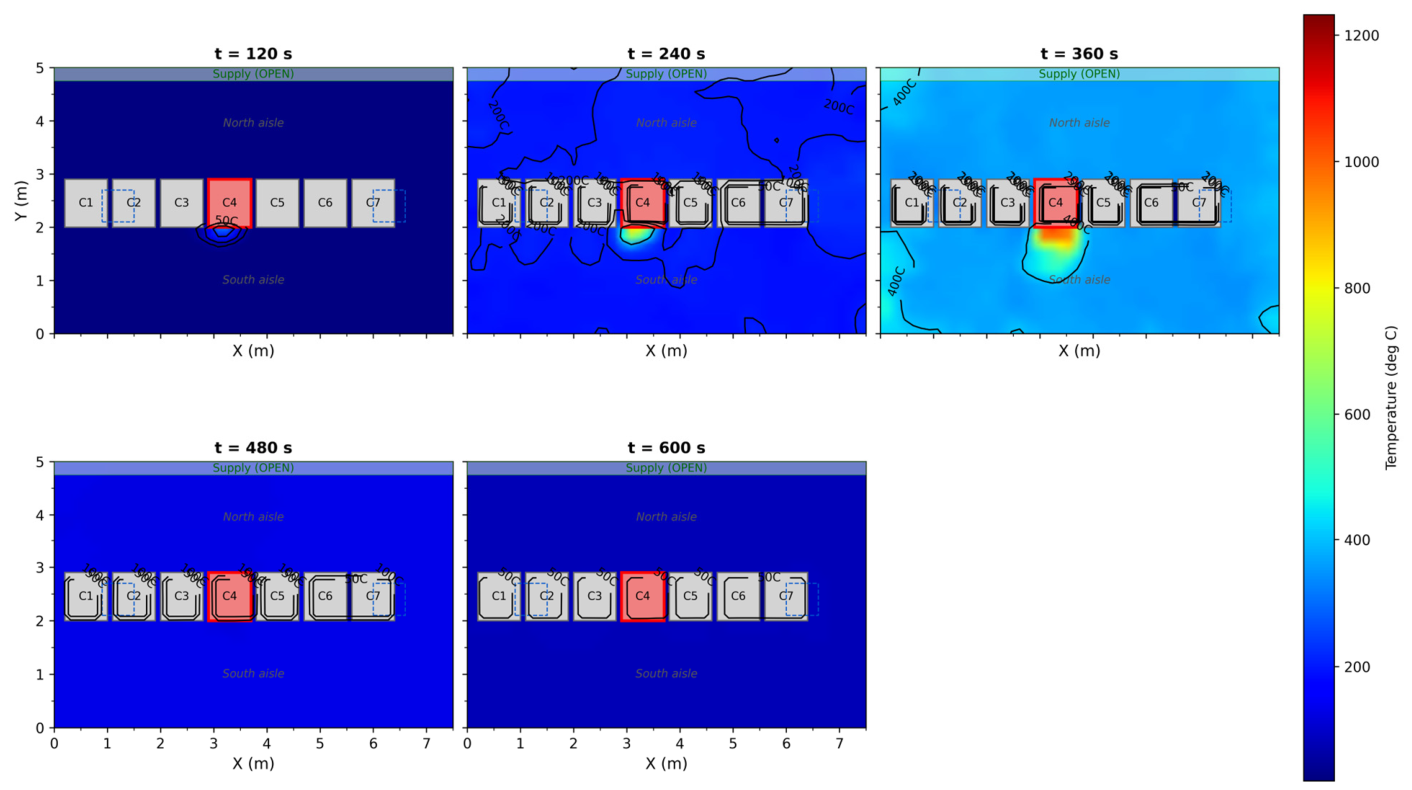
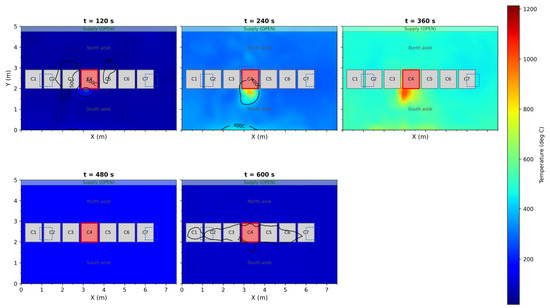
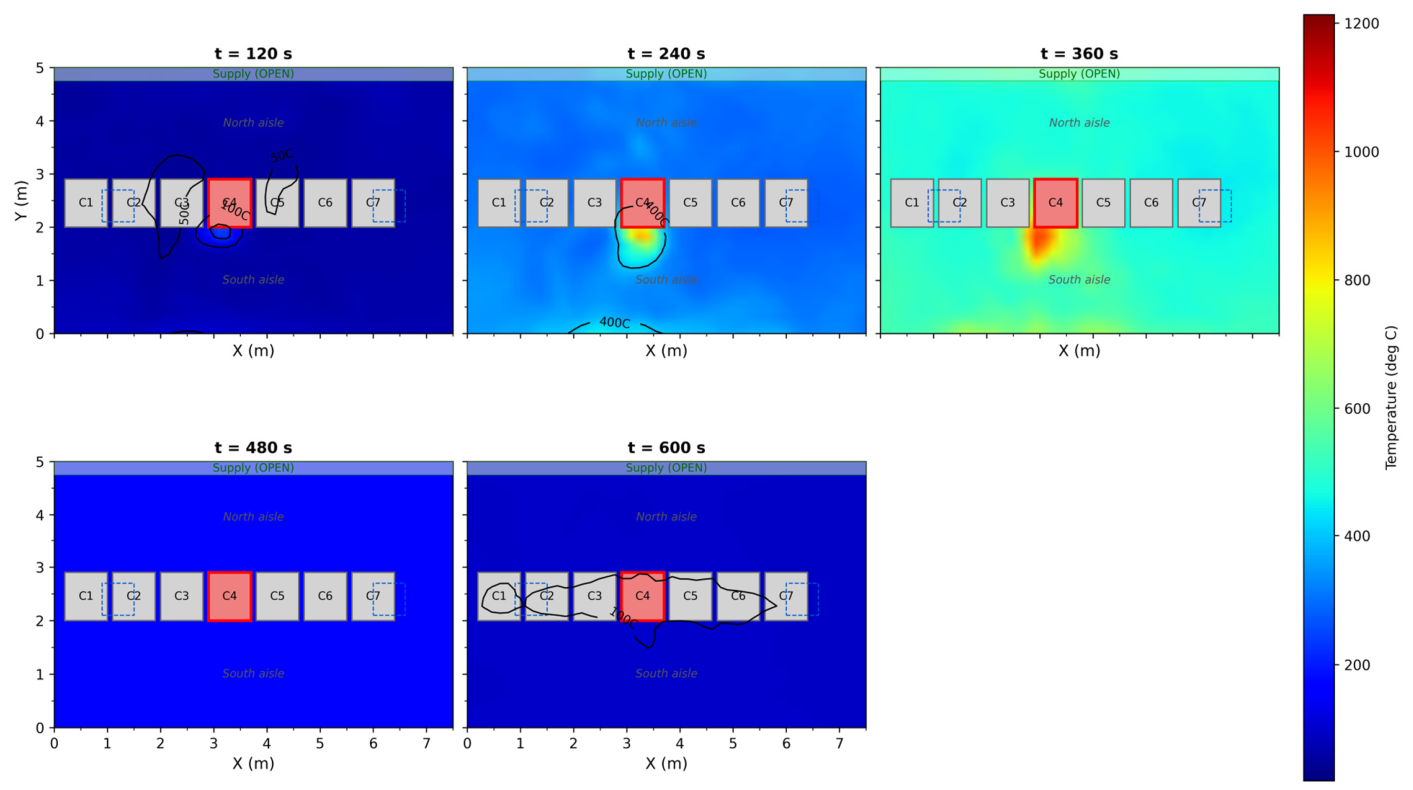
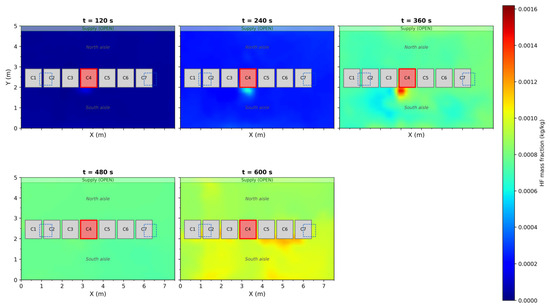
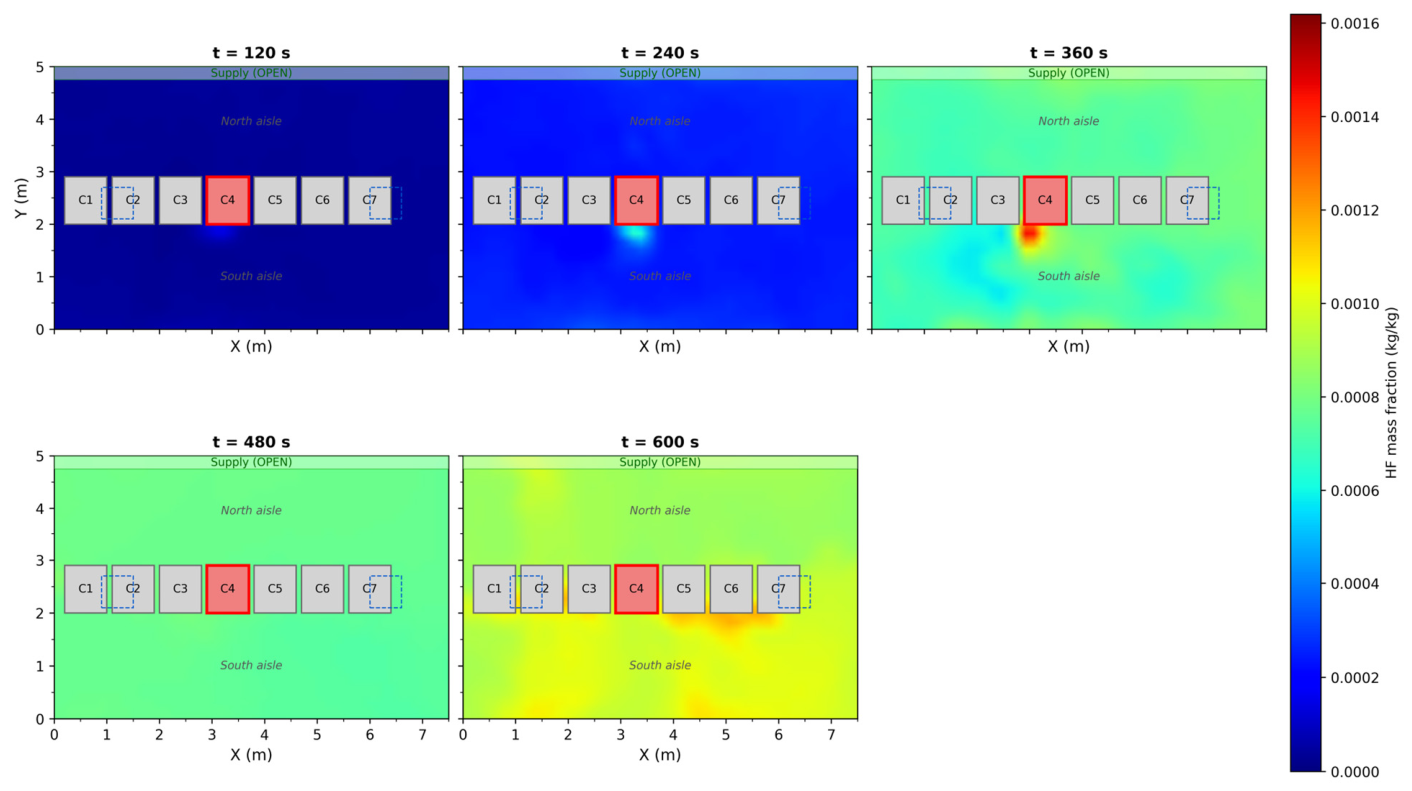
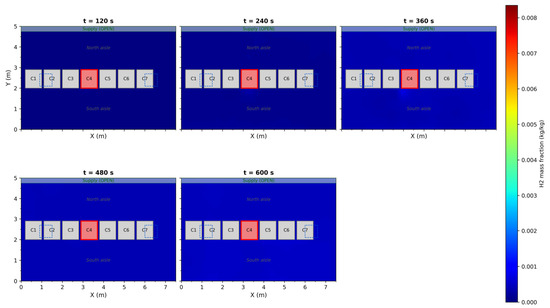
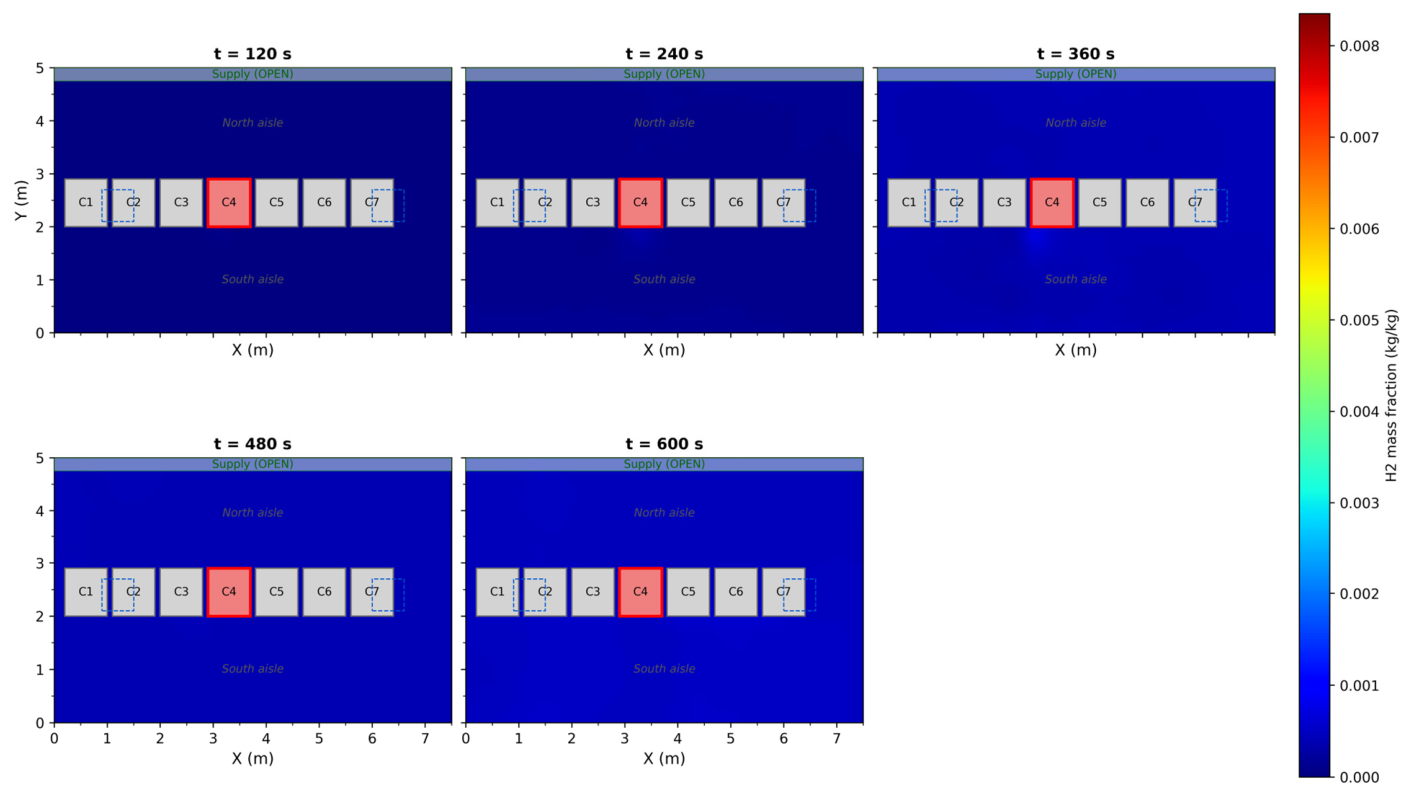
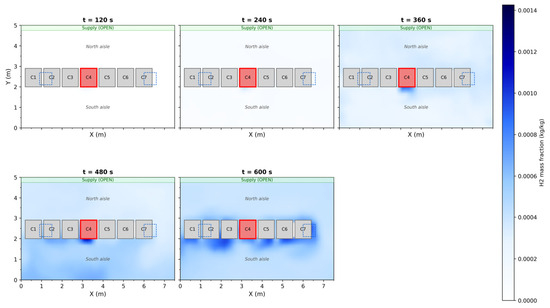
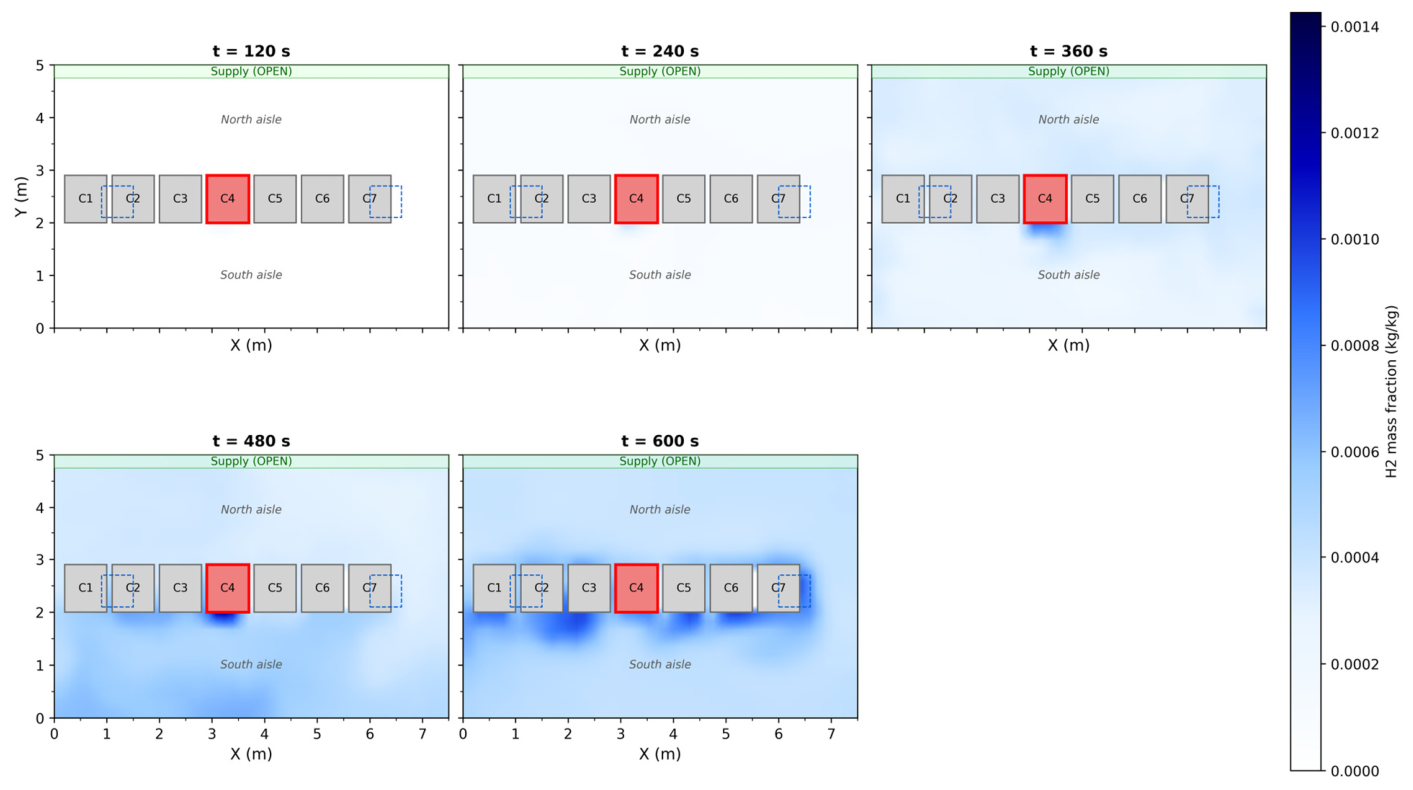
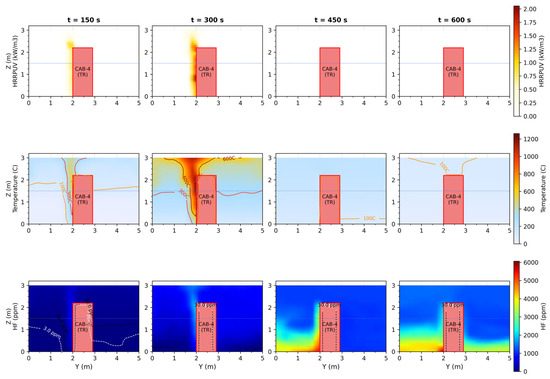
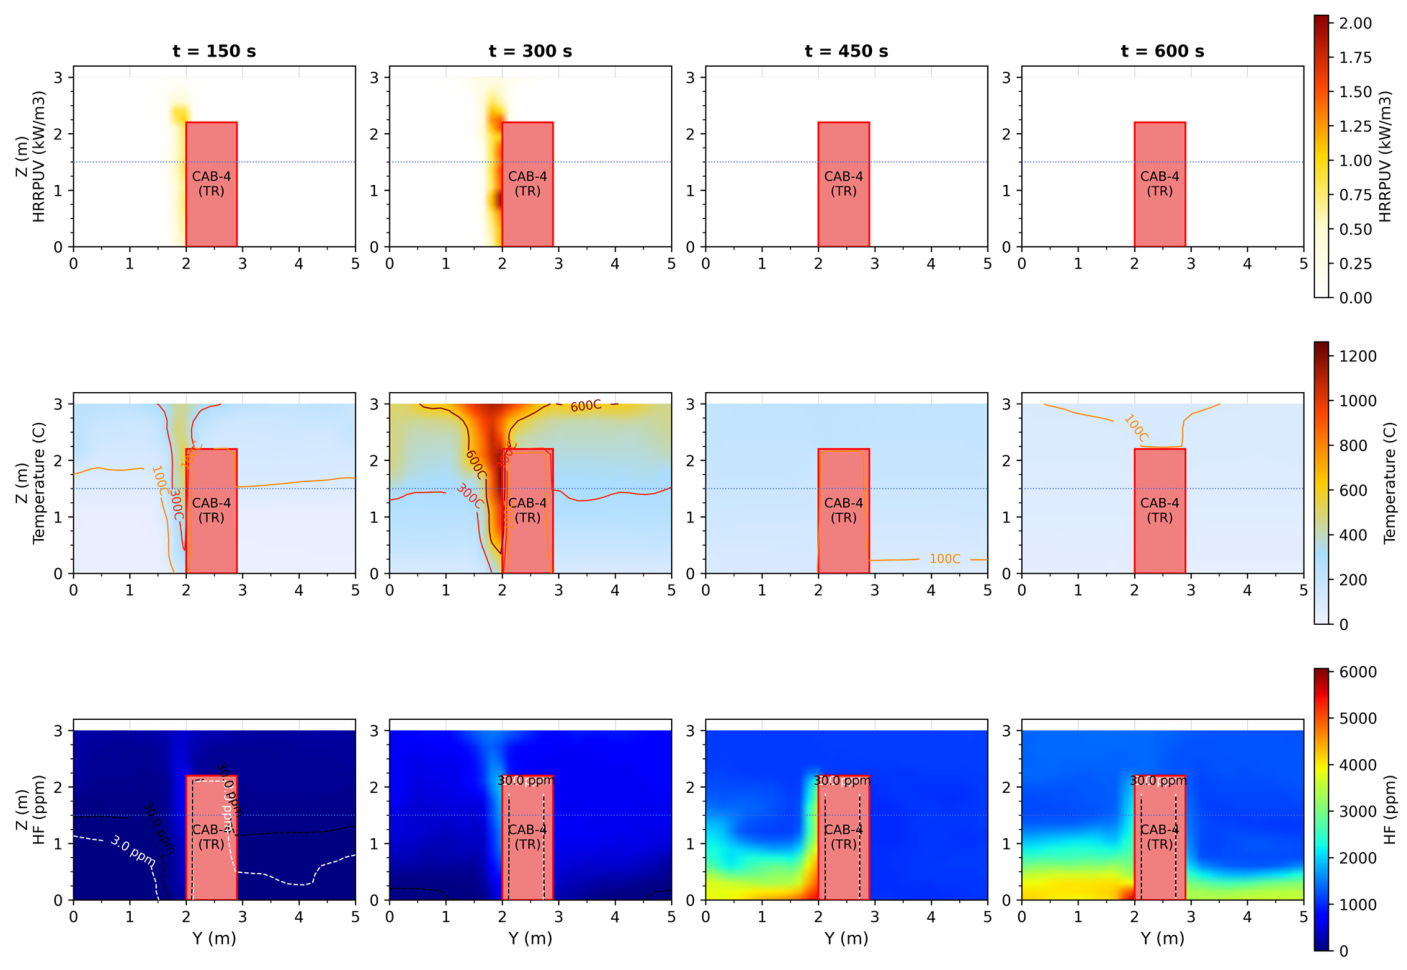
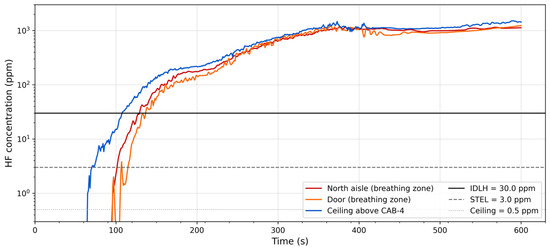
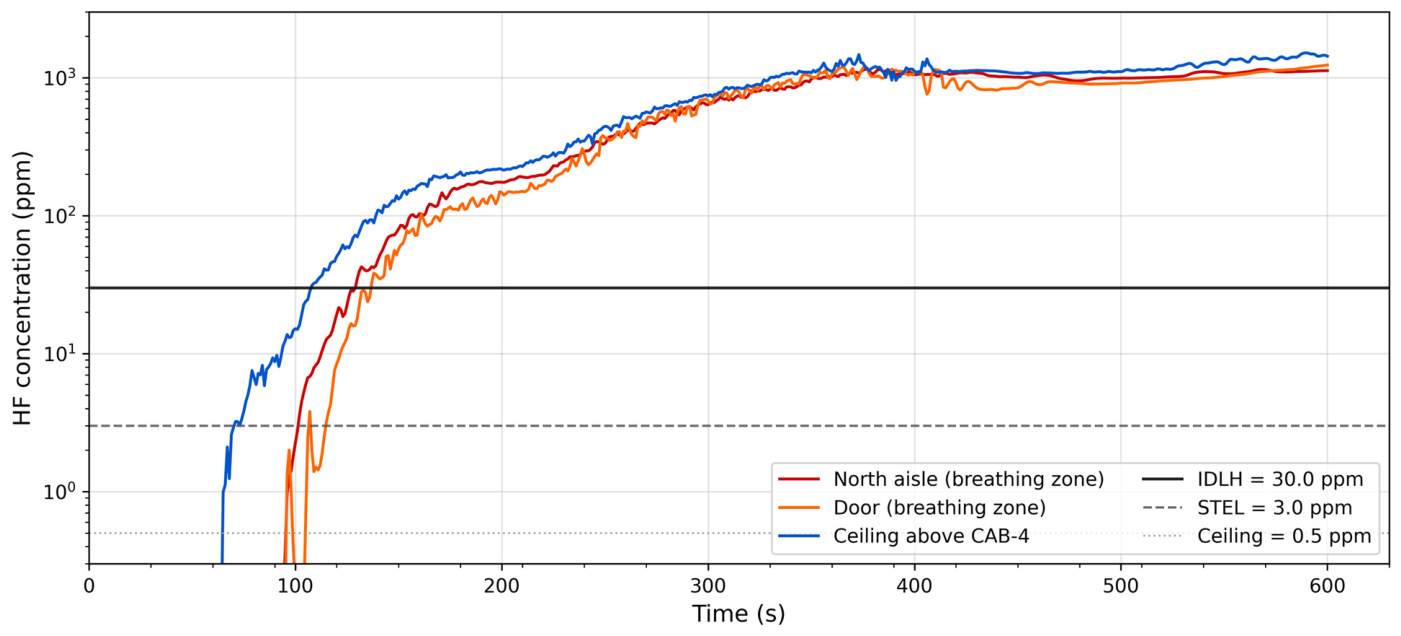
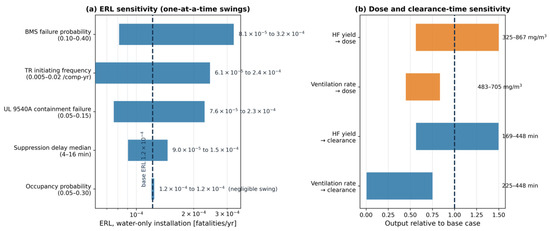
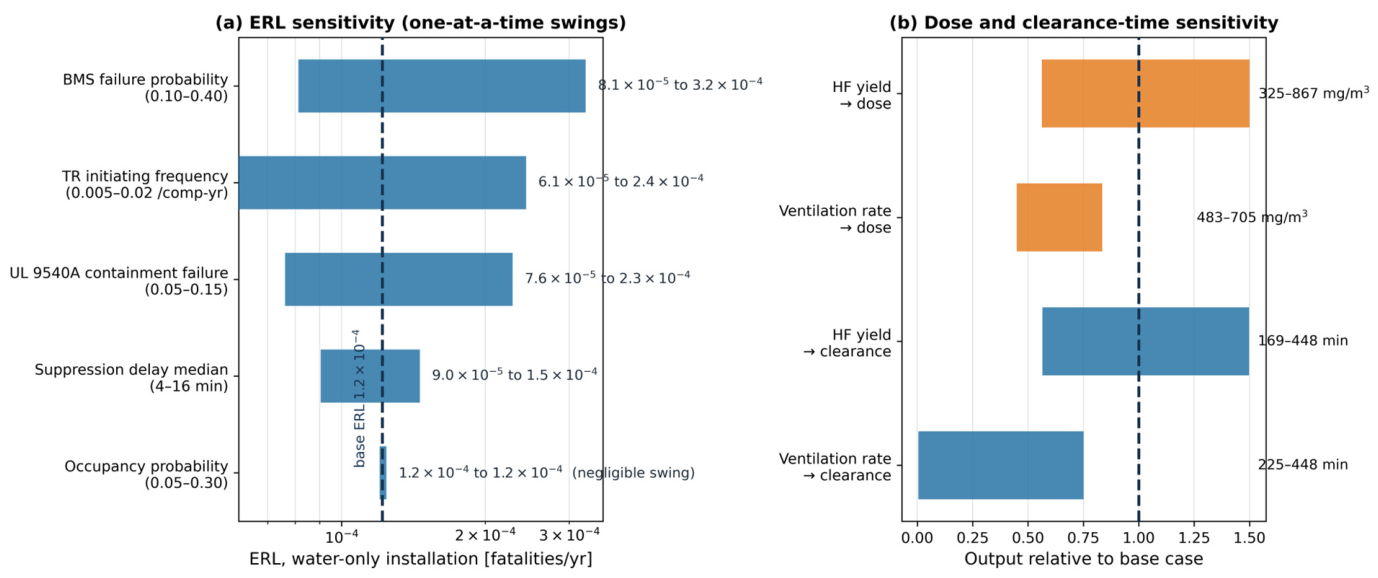

Disclaimer/Publisher’s Note: The statements, opinions and data contained in all publications are solely those of the individual author(s) and contributor(s) and not of MDPI and/or the editor(s). MDPI and/or the editor(s) disclaim responsibility for any injury to people or property resulting from any ideas, methods, instructions or products referred to in the content. |
© 2026 by the authors. Licensee MDPI, Basel, Switzerland. This article is an open access article distributed under the terms and conditions of the Creative Commons Attribution (CC BY) license.