Article

Impact of Six Large Fires on Air PM10 Concentration in Sardinia (Italy)

National Research Council of Italy, Institute of BioEconomy (CNR IBE), 07100 Sassari, Italy
*
Author to whom correspondence should be addressed.
Fire 2026, 9(8), 317; https://doi.org/10.3390/fire9080317
Submission received: 30 April 2026 / Revised: 8 July 2026 / Accepted: 20 July 2026 / Published: 28 July 2026
(This article belongs to the Special Issue The Impact of Wildfires on Climate, Air Quality, and Human Health)

Abstract

Forest fires are a recurring disturbance in Mediterranean ecosystems, but they also impact air quality and public health, particularly given recent trends towards increasingly widespread and extreme fires. This study analyzed six large fires that occurred in Sardinia, Italy, between 2009 and 2021, in order to evaluate their impact on ground-level PM10 concentrations and to investigate the influence of fire size, fuel type, and meteorological conditions. The analysis included data on fire perimeters and land cover, meteorological conditions, smoke plume trajectory simulations using HYSPLIT, satellite imagery, and PM10 concentration measurements from the regional air quality monitoring network. The six case studies differed markedly in terms of burned area, vegetation composition, duration, and weather context. The results showed that the extent of the fire is likely not the most significant factor influencing the increase in PM10 observed in the days following the fires. The most pronounced increases in PM10 concentrations were recorded during the Isili and Montiferru fires, which differed in burned area but were similar in terms of fuel composition, dominated by forest and shrubland vegetation. These factors, together with favorable atmospheric conditions for plume transport and particulate matter deposition, likely contributed to the observed increases in PM10, including exceedances of WHO and national daily limit values. By contrast, Bonorva, Ittiri, and Borore showed limited or no clear accumulation of PM10, despite large burned areas in some cases. These findings suggest that the effects of wildfires on air quality in the Mediterranean region can be influenced by several features, such as meteorological conditions, biomass burned, area burned, severity and intensity of fires. Furthermore, the observed exceedance of WHO thresholds highlights the need to integrate public health considerations into wildfire risk management in the Mediterranean basin.

1. Introduction

Fire is an integral part of many ecosystems around the world, including the Mediterranean basin, where for millennia it has played an important ecological role, contributing, together with other anthropogenic and/or natural factors, to biodiversity and the shape of landscapes [1,2]. In the Mediterranean Basin, fire has been used by humans as a management tool since early times. Not all fires need to be extinguished, but when they become uncontrollable and destructive, they can be an important disturbance agent by causing significant losses to ecosystems, farms, anthropic values and, sometimes, human lives [3,4,5,6,7,8].
In Southern Europe, recent seasons have highlighted the vulnerability of the territory to large and extreme wildfire events [9]. The summer of 2022 will be remembered as one of the worst fire seasons, with more than 0.5 million hectares affected by wildfires [10]. Between 2020 and 2022, in Greece, Italy, Spain, and southern France, the average area affected by each fire was significantly larger than in the previous decade, due to the occurrence of large fires or mega-fires that exceeded the firefighting capacity of the authorities [10]. Furthermore, in 2025, the total area burned across the European Union exceeded 1 million 46 hectares, with Spain and Portugal accounting for most of these surfaces. This represents a substantial increase from the previous record, which was set in 2017, and it marks the most extensive area burned since the early 2000s [11].
The occurrence of large wildfires and megafires causes direct damage to the environment, human structures, productive activities, and people in the affected area. In addition, fires have a significant impact in terms of emissions, releasing directly into the atmosphere particulate matter (PM10 and PM2.5) along with hundreds of volatile organic compounds (VOCs) and gaseous compounds (e.g., NOX, CO, CH4). The quantity and composition of emissions can vary from fire to fire as a function of the amount and type of fuel, meteorology, and burning conditions [8,12,13,14,15] and can have effects on air quality and public health over a much larger area than that directly affected by the fire [8,16,17,18,19,20].
Many studies reported that exposure to elevated levels of particulate matter is linked to increased risk of respiratory and cardiovascular diseases. Wildfire smoke causes cough, asthma, wheeze, and eye irritation, inflammation, and oxidative stress in the lungs, resulting in increases in use of respiratory medication, higher risk of hospitalization, and cancer risk among firefighters [21,22,23,24,25]. Several authors have investigated patterns of wildfires and fire emissions at various temporal and spatial scales [8,19]. Over the past two decades, many studies have focused on the western United States; for instance, Wiedinmyer and Hurteau [26] reported that, during 2001–2008, CO2 emissions from wildfires in 11 western U.S. states were particularly high from July through October, with a peak in August [26]. More recently, decadal air quality trends in western U.S. urban centers were linked with wildland fire activity during the months of August and September for the years 2000–2019 [27]. Other authors reported that, in recent years, smoke from large fires has caused extreme concentrations of PM2.5 and O3 in the U.S. and in Central and South America [13,28,29,30,31,32].
In the Euro-Mediterranean region, the available studies on wildfires and fire emissions are more limited. However, the increase in the frequency of large fires recorded in recent years, especially in southern Europe and often close to large urban areas, has led several authors to investigate this type of impact [33,34,35,36,37,38,39]. Most fire emissions studies attempted to estimate the impact of wildfires on air quality using modeling approaches, remote sensing, or a combination of both [14,40,41]. Fernandez et al. [40] estimated the atmospheric emissions resulting from the Portuguese wildfires of 2017 with a high-resolution methodology and compared them with satellite data, showing good agreement in terms of total values. Barbosa et al. [41] assessed the influence of wildland fire emissions on the concentration of PM2.5, its effect on population health and the related costs, between 2015 and 2018 in Portugal using the open-source chemistry transport model EMEP/MSC-W. However, at present there are few studies conducted in Mediterranean regions on the impact of wildfires on air quality based on ground-level measurements of PM10, PM2.5, and other gases (CO, O3, NO2, SO) [42,43,44,45,46,47]. Some studies reported elevated PM10 concentrations during periods characterized by large wildfires and megafires. For example, Oliveira et al. [43] identified a clear relationship between PM10 concentrations and the extent of burned areas during the severe 2017 fire season in central Portugal, with the highest particulate matter levels occurring in June and October, coinciding with the most intense wildfire episodes. Similarly, Castagna et al. [38] documented the influence of wildfire emissions on air quality in southern Italy, reporting increased PM10 concentrations during the summer months, particularly in association with wildfire events. More recently, Barros et al. [46] investigated the relationship between total burned area and monthly PM10 and PM2.5 concentrations in northern Portugal over the period 2019–2022. Likewise, Sopčić et al. [47] examined particulate matter and carbonaceous compound concentrations during a wildfire event that occurred near the Adriatic coast of Croatia, reporting increases in both particulate mass and carbonaceous pollutants during the fire event.
The present work analyses six cases of large fires that occurred on the island of Sardinia (Italy) in the last 20 years. It investigates the meteorological context, possible fire plume air trajectories, and PM10 concentration at ground level. The main aim of this study is to provide useful information for assessing the impact of wildfires on the actual increase of PM10 at ground level in Sardinia, in order to evaluate potential public health risks to populations exposed to fires on the island. Specific objectives are: (i) to verify whether there were increases in ground-level PM10 concentrations during the six fires, which were characterized by different sizes, fuels, and weather conditions; and (ii) to investigate if the type of fuel and vegetation involved, the extent of the area burned, and the meteorological conditions during the fires could have influenced the ground-level presence and concentration of PM10 in areas near the fire or affected by the smoke plume in the days following the fire.

2. Materials and Methods

2.1. Study Site

Sardinia (Italy) is located in the western part of the Mediterranean Sea (38°51′ N–41°15′ N latitude; 8°8′ E–94 9°50′ E longitude) and it is the second largest island in the Mediterranean basin. The population, about 1.5 million inhabitants, is mainly concentrated around the metropolitan areas of Cagliari and Sassari, respectively, located in the south and north-west part of the island. The human presence increases from late spring to early fall due to the tourist flows, which are mostly concentrated in the coastal areas; The Sardinia Regional Department of Tourism has estimated that more than 20 million presences were recorded in 2025. The physical geography of the island is characterized by a significant presence of hills and low mountains (the highest elevation peak is 1850 m a.s.l.). The climate is mainly Mediterranean, with the highest temperatures and an important drought period during the summer months, particularly in some southern portions of the island. The mean annual temperature ranges between ~8 °C in the mountain areas and ~17 °C along the coasts, whereas during the summer season maximum temperatures often exceed 30 °C. Annual precipitation varies from ~400 mm in the coastal areas to ~1100 mm in the mountains.
According to datasets from the Sardinia Forest Service, Sardinia recorded an average of 2900 fire ignitions per year from 2003 to 2022. About 90% of fires occurred from June to September, peaking in July in terms of both ignitions and area burned. Overall, the data showed large interannual variability in fire ignitions and burned area. During years with extreme fire weather conditions, the annual area burned can exceed 30,000 hectares (e.g., 44,800 ha in 2009 and 34,400 ha in 2007) [48]. The largest impacts are driven by a few large fires. About 0.6% of fires exhibited an area burned larger than 100 hectares and accounted for approximately 57% of the total area burned. It is important to consider that tourist flows and fire occurrence and spread are higher during the warmest months of the year—both coinciding with the June–September period—thereby increasing both anthropogenic and natural emission sources. In addition, there is also a potential background level of emissions associated with industrial activities, which operate year-round and are unevenly distributed across the island; the Sardinia air quality monitoring network was established to monitor the impact of these industrial activities on emissions.

2.2. Data Sources

The fire events that have been investigated in this study were selected based on several criteria: availability of air quality data for the period in which the events occurred; area burned larger than 2000 ha; variety of the vegetation types covered by the fire, and therefore different types and loads of biomass burned; and, finally, proximity (less than 100 m) of at least a section of the fire perimeter to urban or wildland-urban interface (WUI) areas.
Other information about the ignition point, fire perimeters and area burned, date and time of fire ignition and extinction, was provided by different sources: the Sardinian Regional Forest Service (CFVA), personal communication from witnesses who observed and followed the event, or taken from the “Rural and Forest Fire Reports” edited by the Sardinia Autonomous Region [49,50,51].
We used either the 2008 Sardinian Land Cover map [52], the 2012 Corine Land Cover map [53], or the 2017 Land Cover Map of Europe [54] to determine the vegetation affected by fire, depending on when the single event happened.
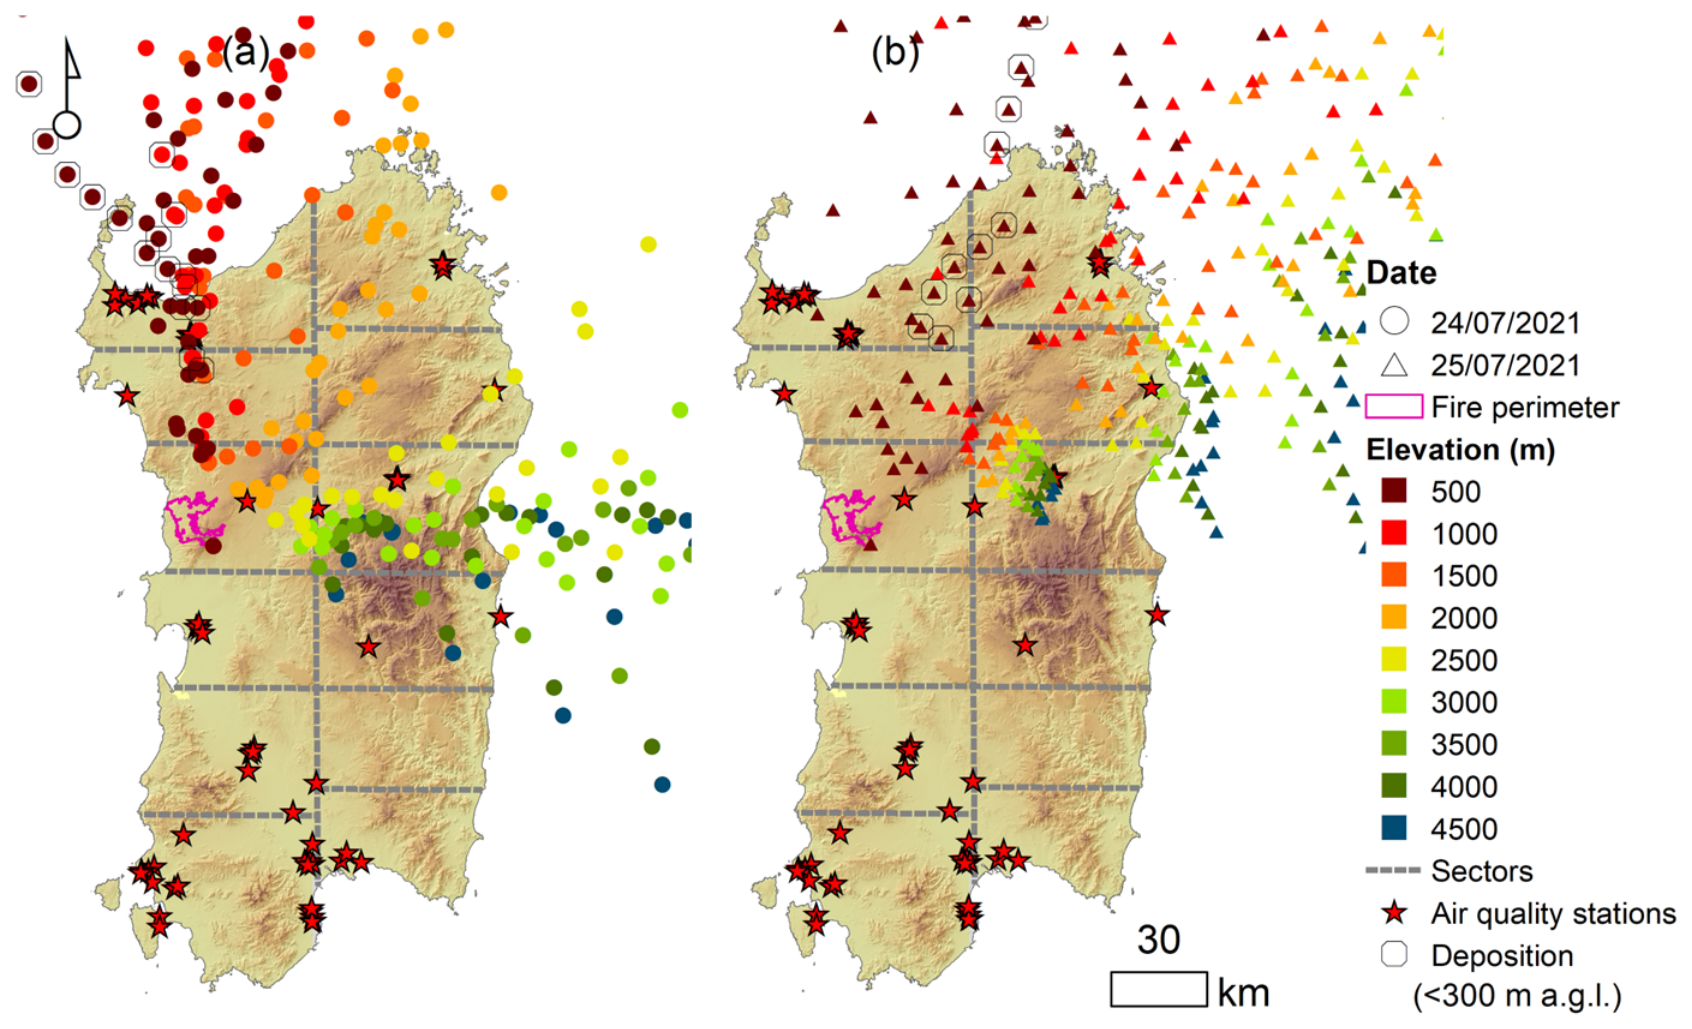
Overall, we analyzed six large fires that occurred in Sardinia from 2009 to 2021 (Figure 1a): Bonorva, Ittiri, Isili, Paulilatino, Borore, and Montiferru.
PM10 concentration data were provided by the monitoring stations of the Air quality monitoring network of the Regional Environment Protection Agency of Sardinia [55]. The air quality monitoring network of Sardinia is a system of monitoring stations distributed throughout the island, designed to continuously measure and analyze the levels of air pollutants (PM10, PM2.5, NO2, O3, and SO2) in order to protect public health and the environment.
The positioning of the air quality stations was primarily dictated by the detection of the impacts of the main industrial hubs, which are located near the main cities and industrial centers (Figure 1b).
Samples were collected using a Skypost Tecora apparatus (TCR Tecora, Cogliate, Italy) with up to 50 L min−1 flow rate capacity and a sampling head of 2.3 m3 h−1 in agreement with the UNI EN 12341:2014 [56] and DM60 [57] norms. PM10 concentration is the daily sum (from 00:00 am to 12:00 pm), expressed in µg/m3 d−1.
Unfortunately, the series of data relative to PM2.5, NO2, O3, and SO2 collected from the air quality monitoring network was not very representative because it was often incomplete and discontinuous. Therefore, the concentrations of these chemical compounds were not analyzed in this study, which focuses on the impact of fires on air quality exclusively in terms of PM10 concentrations.
To easily monitor the movement of smoke produced by each fire and evaluate the concentrations of pollutants measured by the air quality stations involved, we divided the Sardinian territory into 12 quadrants between North, Central, and South (Figure 1b).
It is well known that PM10 concentrations, both atmospheric and ground-level, result from the interaction of multiple emission sources, such as industrial activities, human presence, Saharan dust, and wildfires. Therefore, it is difficult to identify a single baseline for each station or to attribute a peak in particulate matter concentration to a single source, such as a wildfire, with certainty. To overcome this difficulty, we only considered PM10 increases attributable to a fire if they met the following criteria:
(a)
The difference from the concentrations the day before the fire exceeded the standard deviation value calculated for the months surrounding the fire.
(b)
The value exceeded at least the 85th percentile of the same data series.
(c)
The value was classified as an outlier according to the accepted statistical method Interquartile Range (IQR) [58,59].
The synoptic conditions associated with each fire event were also investigated. The atmospheric field data were taken from the NCEP Climate Forecast System Reanalysis (CFSR) with a spatial resolution of 0.5° × 0.5°. Maps of temperature at 850 hPa and air masses were downloaded at the synoptic scale from WetterZentrale [60].

2.3. Fire Description

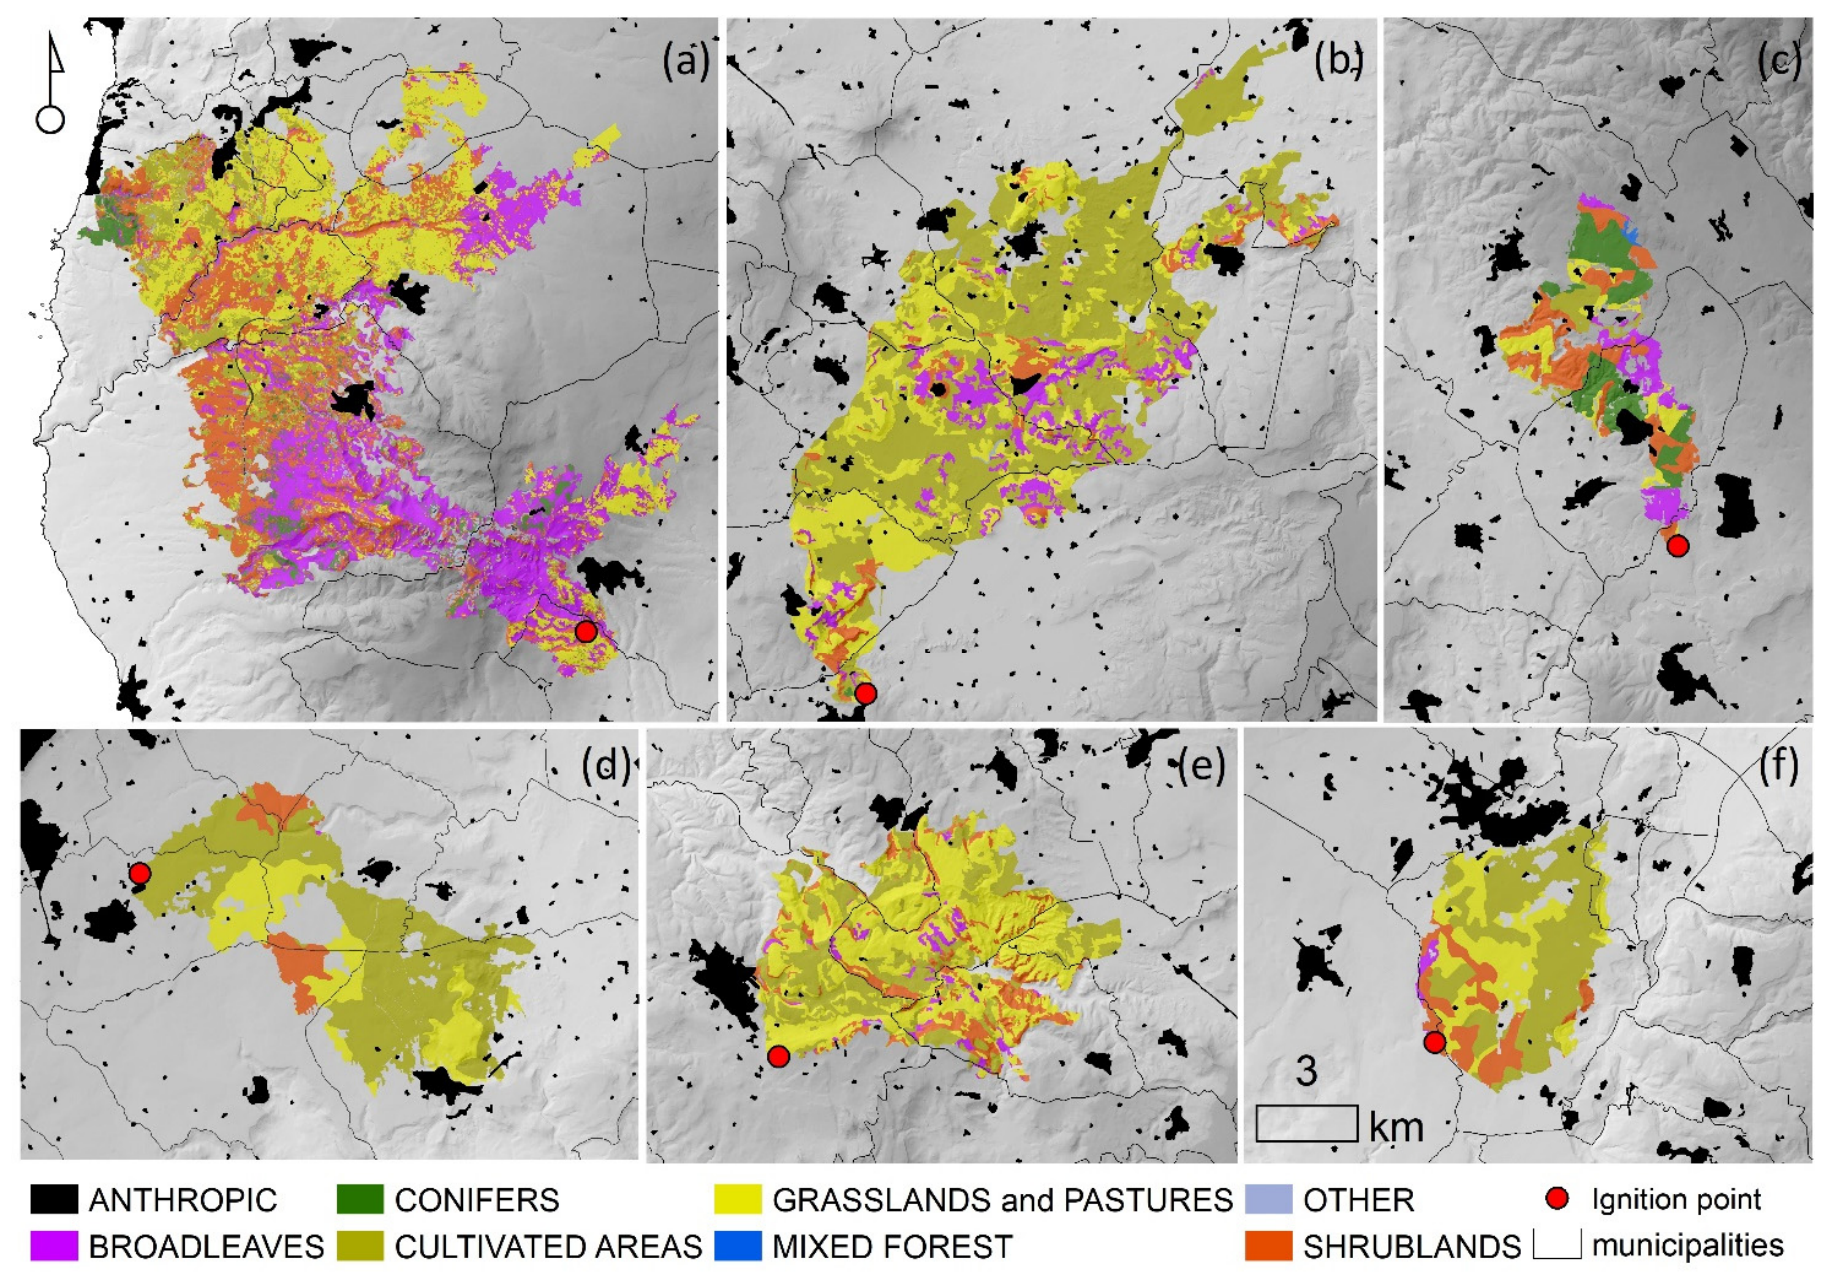
The Bonorva fire started near the village of Bonorva (Northwestern Sardinia) in the early morning (05:00 am) of 23 July 2009, and spread fast across nearly 10,551 hectares, reaching buildings and villages. The fire was extinguished by 10:00 am of 24 July, after about 30 h. It affected agropastoral ecosystems represented by grasslands, pastures and croplands for about 75%, and by broadleaf forests and shrubs for about 25% (Table 1 and Figure 2b).
The Ittiri fire started on 23 July 2009, about 8 h later than the Bonorva fire and spread for more than 5000 hectares. Most of the final fire area, which was mainly covered by grassland, pastures and cropland (82%), burned during the first 24 h (Table 1 and Figure 2e).
The fires of Isili and Paulilatino (Central Sardinia) occurred on the same day (7 August 2013), 3 h apart from each other: 12:00 am and 03:00 pm, respectively. The main vegetation types characterizing the two burned areas were cropland and grassland (30% and 53%, respectively) for the Paulilatino fire (Table 1 and Figure 2f), and broadleaf with conifer forests and shrubland (45% and 32%, respectively) for the Isili fire (Figure 2c).
The Borore fire (located in Central Sardinia) started on 1 July 2016 at 02:00 pm and was extinguished on the night of 2 July. It burned about 4300 hectares, mainly of grasslands, pastures, and cropland (about 90% in total) (Table 1 and Figure 2d).
The Montiferru fire spread from a road that connects two villages (Bonarcado and Santu Lussurgiu), in Western Sardinia. The ignition occurred in the late afternoon of 23 July 2021. With about 13,200 ha of land burned, this event was the largest fire recorded in Sardinia in the last 35 years, and one of the largest at the National level of all time. About 70% of the final fire area, that is approximately 9000 ha over 13,000 ha, burned between 06:00 pm and 12:00 pm on 24 July. It threatened several inhabited centers and burned both silvopastoral farms and houses located in the WUI areas [61]. The Montiferru fire affected a variety of forest and rural ecosystems, mainly represented by forest and shrubs (about 59%), herbaceous vegetation (about 28%) and cultivated areas (about 13%) (Table 1 and Figure 2a).

2.4. Fire Plume Trajectories

To investigate the impacts of fire plumes on air particulate concentration, the likely trajectories of smoke particles released by each fire were calculated through the HYSPLIT model (Hybrid Single-Particle Lagrangian Integrated Trajectory) developed by NOAA’s Air Resources Laboratory [62].
The HYSPLIT model is a system designed to estimate the trajectories, dispersion, and deposition patterns of gaseous and particulate pollutants. It utilizes meteorological grid data obtained from re-analyses of weather forecasting models [63,64].
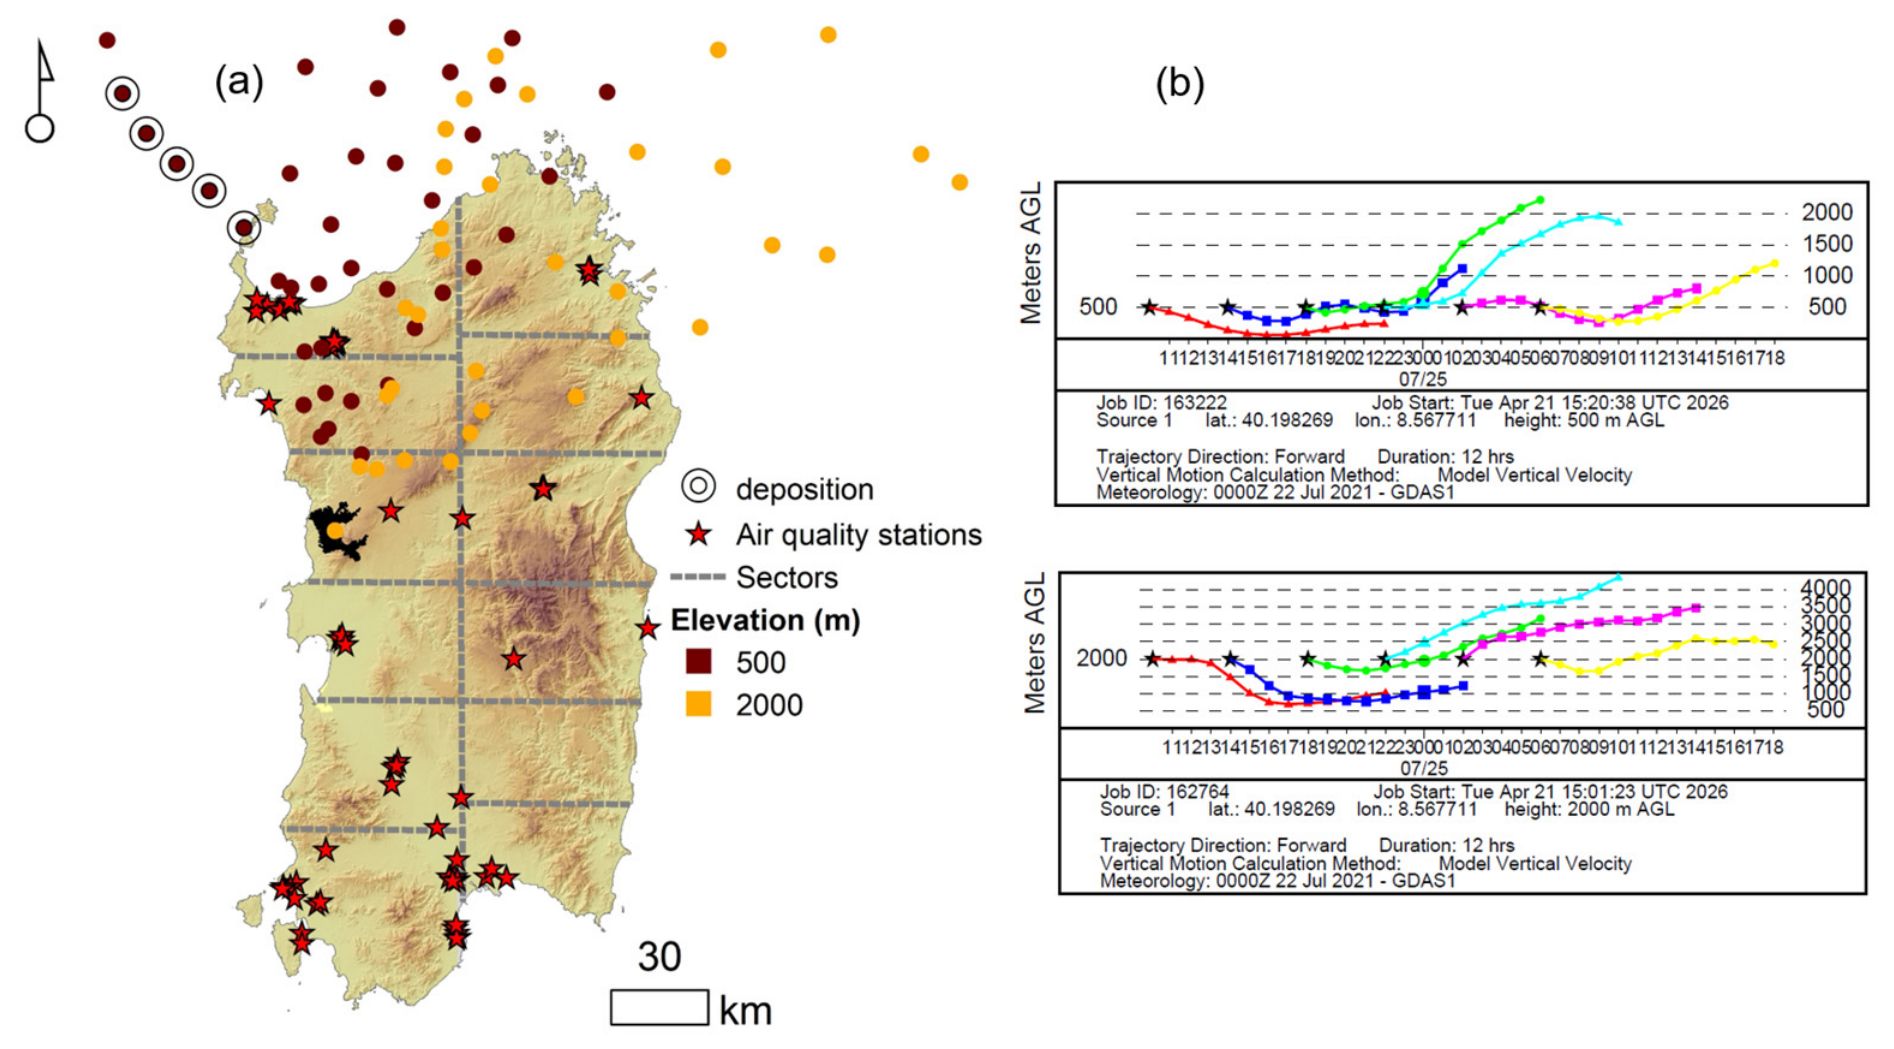
In normal mode, for each simulated trajectory, the model calculates, at fixed time intervals, the coordinates and height above ground level (a.g.l.) of the air mass moving through the atmosphere from the source. To consider changes in weather conditions during the event, we ran a simulation every two hours for a total of 12 simulations over 24 h. As the source of fire plumes, we considered the centroid of the burned areas. Photographs or quantitative data allowing the estimation of smoke plume height were not available for the analyzed fires. The only available estimate concerned the Montiferru fire, the largest and most intense of the six events considered, for which the plume height was reported to be approximately 4500 m a.g.l. [65,66]. To account for the absence of plume-height information, each simulation was repeated using emission sources at different heights above ground level (from 500 m to 4500 m a.g.l. at 500 m intervals). The estimated plume height of the Montiferru fire was adopted as the upper limit of this range. This approach allowed us to account for all possible trajectories and the dispersal of air masses over the territory and to include all stations where particles could have been deposited on the ground, avoiding the exclusion of potential fallout.
Finally, for each simulated trajectory, coordinates and height a.g.l. of the air mass moving in the atmosphere from the source were calculated every hour. We assumed a probable impact of particulate matter at ground level when simulations envisaged descents of air masses at altitudes lower than 300 m above sea level (Figure A1).
To verify the direction of the fire plume and to check the possible contemporary presence in the atmosphere of sand and dust from the Sahara, we also used MODIS satellite images on board the Aqua satellite as well as the Visible Infrared Imaging Radiometer Suite (VIIRS) corrected reflectance imagery on board the joint NASA/NOAA Suomi National Polar-orbiting Partnership (Suomi NPP) satellite. Satellite images were retrieved through the Worldview tool (https://worldview.earthdata.nasa.gov/ (accessed on 17 April 2026) from NASA’s Earth Observing System Data and Information System (EOSDIS). Furthermore, the spatial direction of the Montiferru fire smoke plume has been investigated using CO measurements from the TROPOspheric Monitoring Instrument (TROPOMI) on board the Copernicus Sentinel-5 Precursor satellite.

3. Results

3.1. Bonorva and Ittiri Fires (23 July 2009)

3.1.1. Meteorological Conditions at Synoptic Scale

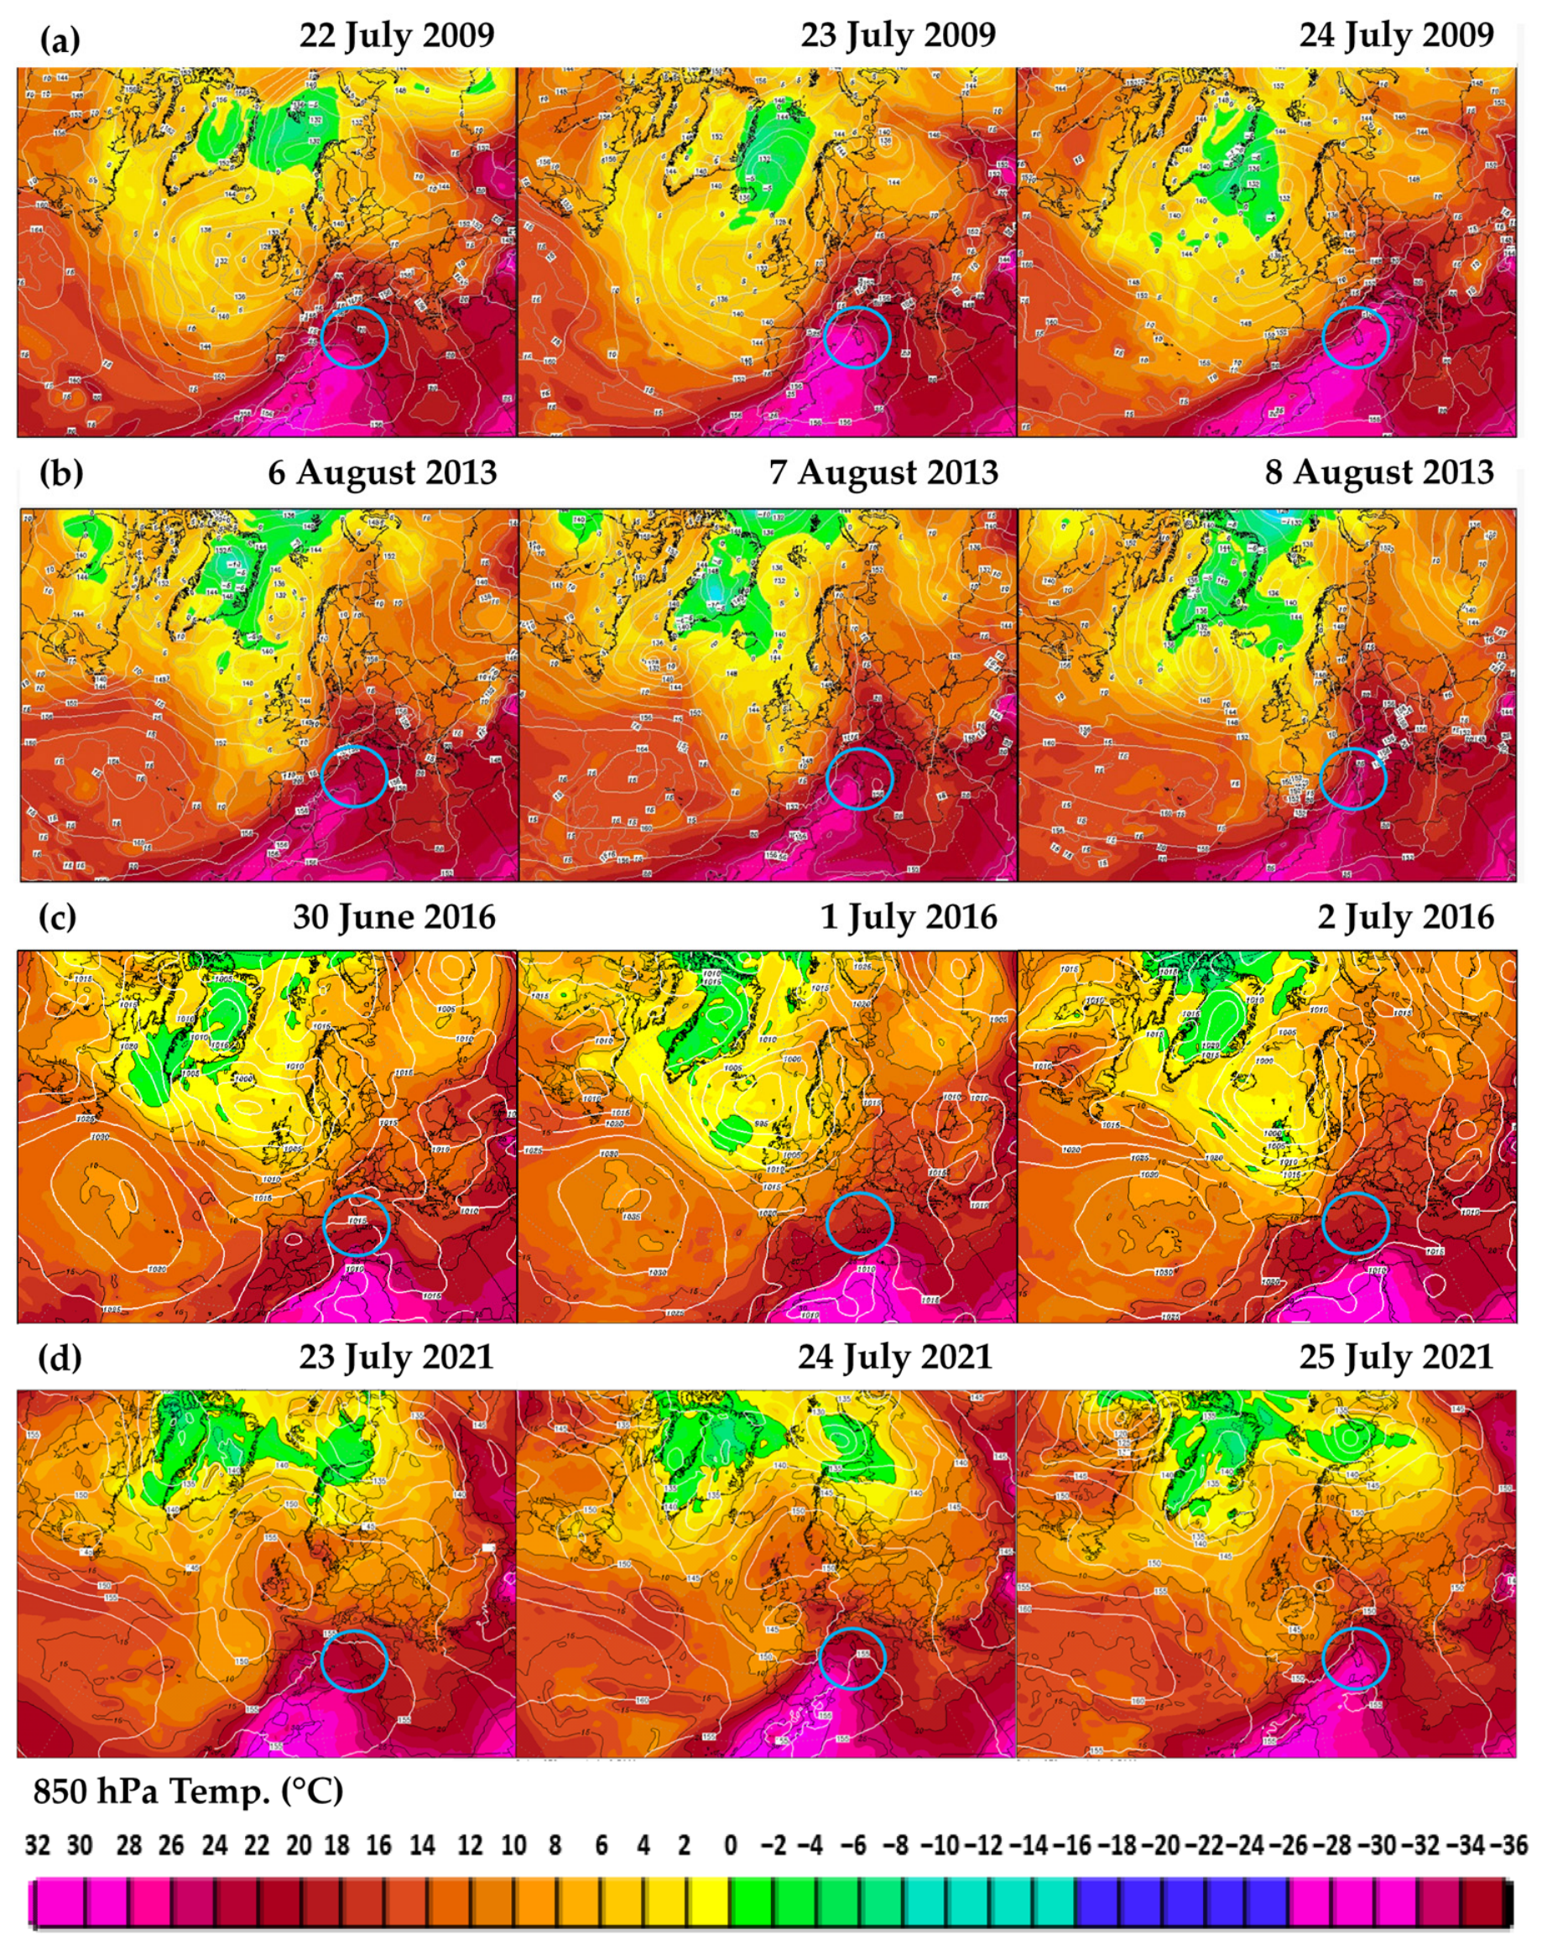
The days preceding the fire events were characterized by two low and two high-pressure structures. The two low-pressure systems were roughly located on the same meridians. The northernmost one was the Icelandic Low, a semipermanent low-pressure system located in the North Atlantic between Iceland and southern Greenland; the thermal low of the second one was centered over the Algerian desert (Figure 3a). The two high-pressure, placed along the same parallels, were the permanent high-pressure system over the Azores (the Azores High) and a high-pressure cell positioned on the central Mediterranean. On 22 July, the day before the fire occurrence, the weak channel between the two low-pressure cells rotated in a SW-NE direction, intensifying the heat flow on the central-western Mediterranean and causing an increase in temperatures. The isotherm at 850 hPa reached 28 °C. During the day of the fire and the day after (23 and 24 July, respectively), maximum temperatures exceeding 40 °C and minimum temperatures exceeding 25 °C (28.7 °C in the southern part of the island) were recorded on about half of the entire island territory. These thermal anomalies seem to be only partly related to the numerous and large fires that broke out on the same days in Sardinia. The two peaks of 46.9 °C and 46.8 °C registered in Sardinia were, in fact, reached at two municipalities located too far from the sites of fires to be considered a direct consequence of the events. On the other side, some of the fires associated with the advection of warm air may also have had a partial role in lowering the local value of relative humidity on 23 July, which reached levels below 20% on the whole island. It is important to underline how the thermal wind generated by the warm advection implied an increase with altitude of the western component of the flow; therefore, the prevailing surface wind direction was Southeast while already at an altitude of 850 hPa the direction was Southwest (also see Figure A2).

3.1.2. Fire Plume Trajectories and PM10 Concentration

The Bonorva and Ittiri fires both occurred on the same day.
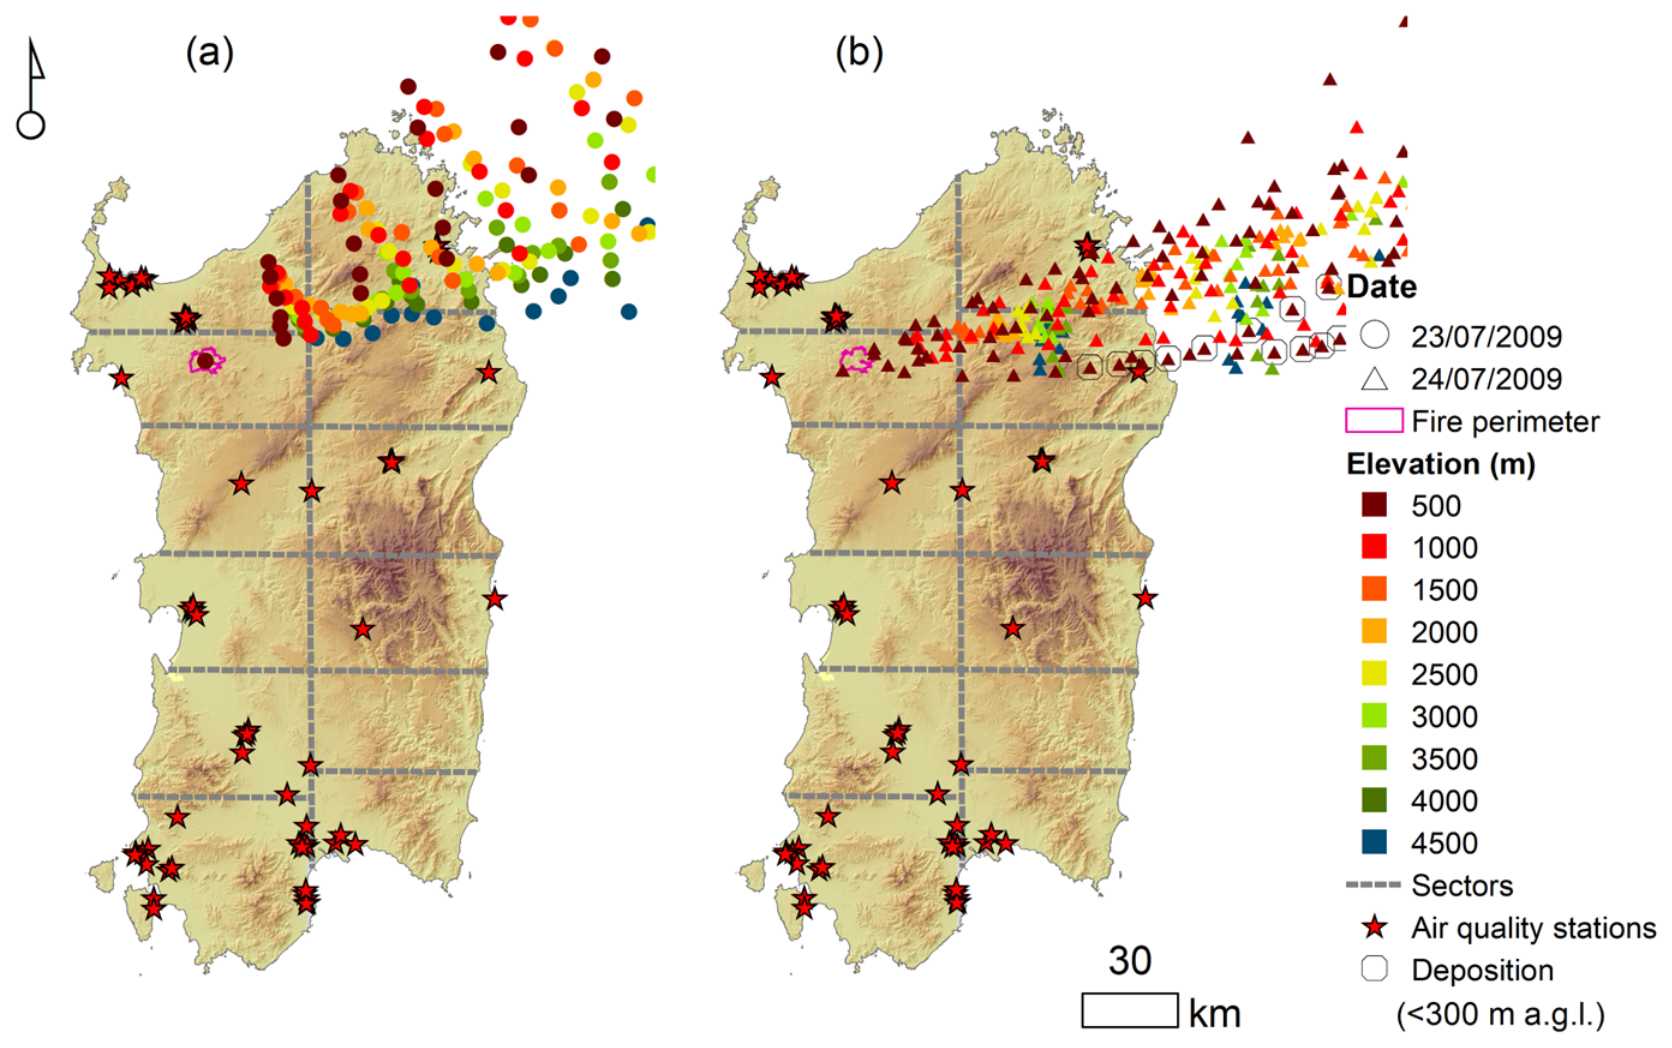
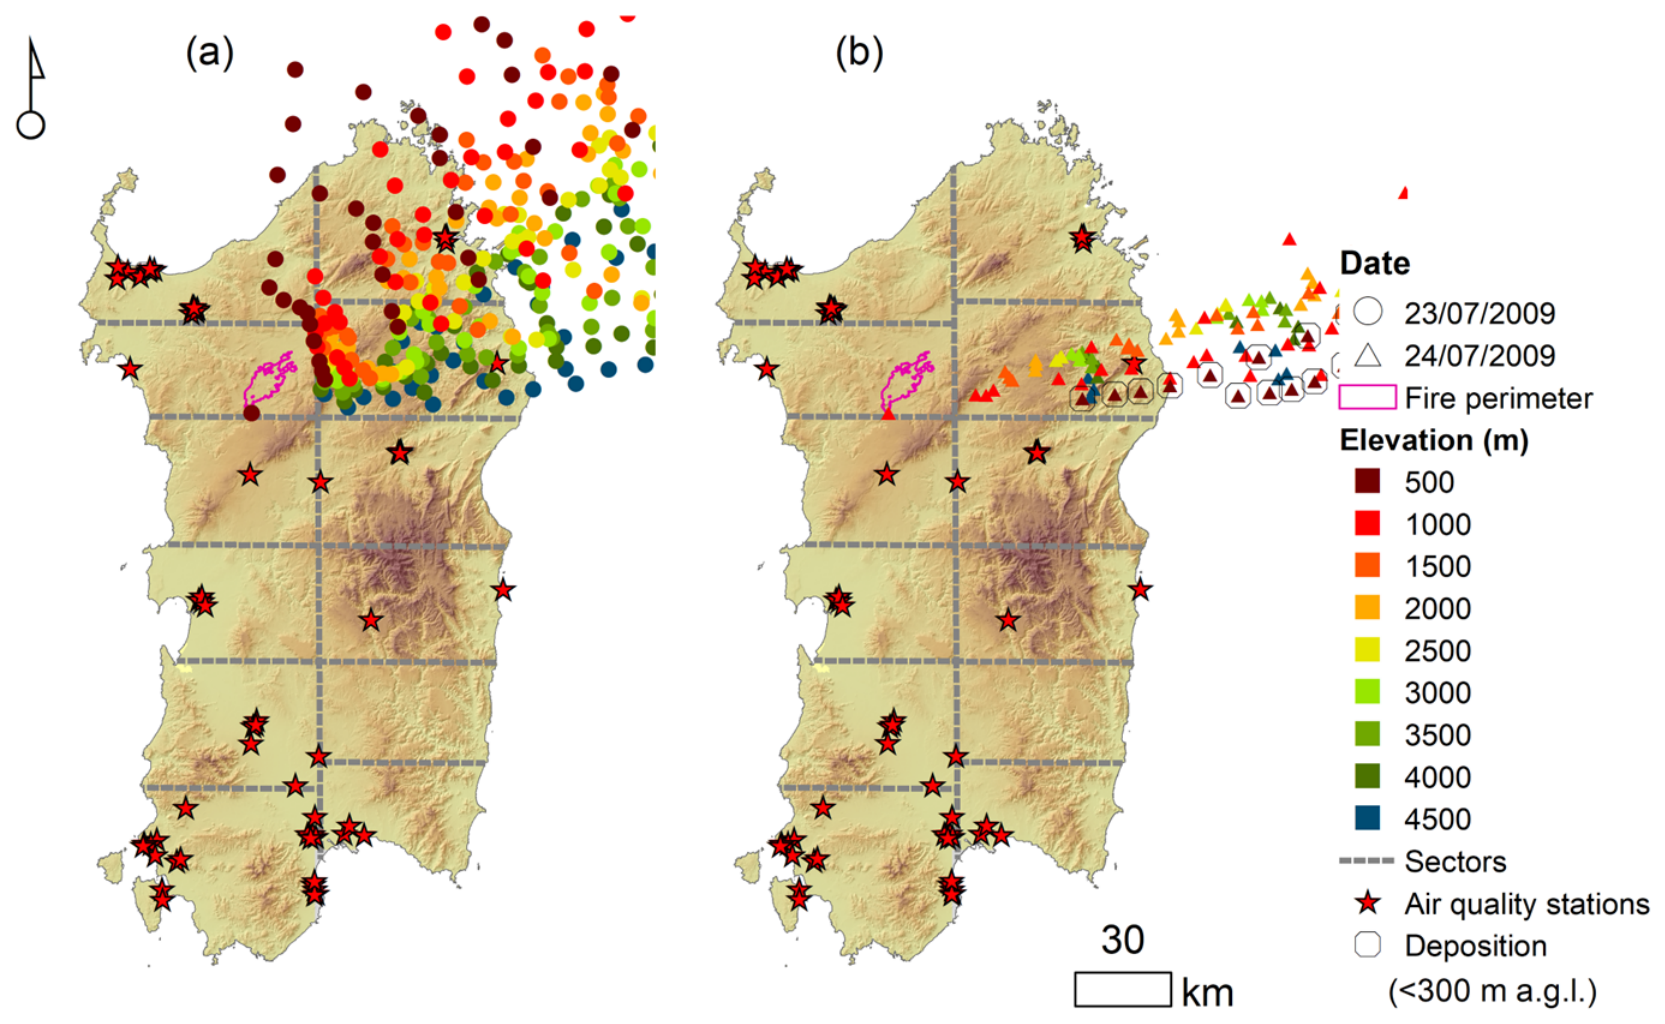
The simulations conducted on 23 and 24 July 2009 indicated the northeastern sector of Sardinia (quadrants N2 and N3) as the area most affected by the passage of smoke (Figure 4 and Figure 5). For the Ittiri fire, a possible subsidence of air masses, with consequent deposition of particulate matter at ground level, was predicted by the HYSPLIT model on 24 July only in simulations where the plume origin was assumed to be below 500 m a.g.l. (Figure 4). In particular, the model predicted a probable particulate deposition between 7:00 am and 01:00 pm UTC on 24 July in the area near the northeastern coast of the island (quadrant N3) and between 10:00 am and 02:00 pm UTC directly on the sea. Neither the simulations performed on the first day nor those on the second day—assuming the plume source was located above 500 m a.s.l.—indicated any potential impact of particulate matter on the island.
Based on the HYSPLIT simulations, air-quality monitoring stations located in the N1, N2 and N3 sectors were identified as potentially affected by increases in PM10 concentrations. Unfortunately, one of the stations, in the N3 sector, expected to be most impacted by particulate deposition (CENSN1), was out of service; consequently, no PM10 data are available from this site. Overall, the functioning stations potentially affected by the fire plume trajectory are located within a distance range of 9.8 (CENS12) to 75.4 km (CEOLB1) from the Ittiri fire perimeter (Table A1).
In any case, no clear increase in PM10 compared to the values recorded on the days before and after the event was observed for any of the other stations. A slight increase in particulate matter was observed on 26 July; however, the absence of fires in the surrounding areas on both 25 and 26 suggests that this increase cannot be attributed to active fire events (Table 2).
The second fire occurred within the municipality of Bonorva, igniting at 03:00 am UTC on 23 July—four hours prior to the Ittiri fire—and persisted until 10:00 pm UTC on 24 July.
The area potentially affected by smoke transport was larger than that of the Ittiri fire. Likely due to slightly different meteorological conditions in the early morning of 23 July, some simulated trajectories also indicated smoke dispersion into the N1 quadrant (Figure 5).
As observed for the Ittiri fire, during the second day the smoke trajectories were directed towards the east (quadrant N3) while the northbound component, evident the previous day, disappeared (Figure 5). The HYSPLIT model predicted no particulate deposition on the first day of the event. Probable fallout was predicted by the model, assuming the source of the smoke at altitude 500 (a.g.l.), between 7:00 am UTC and 10:00 am UTC on 24 July near the coast in quadrant N3, and from 11:00 am UTC to 03:00 pm UTC directly at sea. The air quality stations potentially affected by particulate fallout coincided with those analyzed for the Ittiri fire and, as already seen in that case, did not report any accumulation of PM10 on the days when the fire was in progress; their distance from the fire perimeter falls within the range of 26.5 km (CENS16) to 60.4 km (CEOLB1) (Table A1).
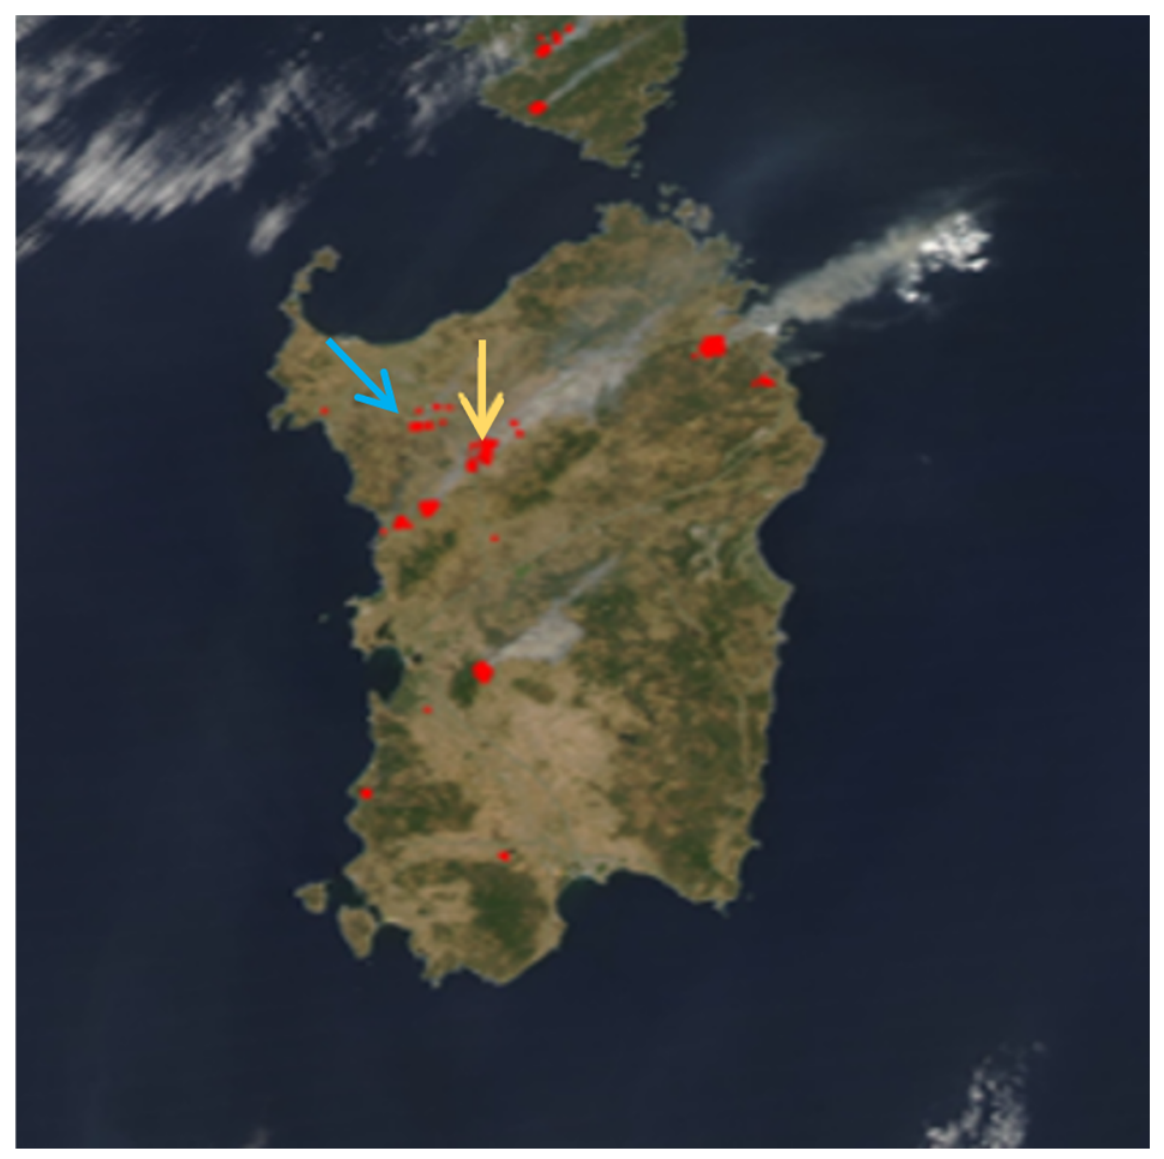
Satellite imagery corroborates the HYSPLIT-predicted trajectories, showing smoke transport toward the N2 quadrant on 23 July and toward the N3 quadrant on 24 July, with a less pronounced northerly component than on the previous day (Figure A2). No inference can be made from carbon monoxide concentrations, as data for those days are unavailable.

3.2. Isili and Paulilatino Fires (7–8 August 2013)

3.2.1. Meteorological Conditions at Synoptic Scale

The days preceding the events were characterized by a perturbation extended to the entire Atlantic part of Europe and by a high pressure spreading from the central part of the continent to the central-eastern Mediterranean (Figure 3b). This situation generated a hot westerly airflow into the Italian regions, causing a sort of heat wave in conditions of low-gradient high pressure and therefore with low winds.
The day of 7 August started with a surface pressure maximum positioned in the southern Tyrrhenian Sea and the deepening of a baric minimum north of the Balearic Islands. During the following day, the minimum evolved southward and at first did not interrupt the flow of warm air on a synoptic scale (at the pressure altitude of 850 hPa the isothermal line of 25 °C was observed with flow from SW at altitude and from SE on the surface) until the end of the day when a NW flow was generated causing a marked drop in temperatures. The rotation of the winds was followed by an Atlantic perturbation which, in the lower layers, triggered a flow of humid and unstable air with widespread thunderstorm activity over Sardinia.
On 7 and 8 August, surface air temperature widely exceeded 40 °C, with maximum peaks of 43.8 °C, while the minimum temperature did not drop below 25.0 °C in most of the island (Figure 3b). However, both days were characterized by the occurrence of many fires, which could probably have had some influence on the air temperature. On 7 August, the minimum relative humidity was less than 20% on about 90% of the island, with values ranging between 7% and 9% in many localities.

3.2.2. Fire Plume Trajectories and PM10 Concentration

The Isili and Paulilatino fires both occurred on the same day. The Isili fire started around 10:00 UTC on 7 July 2013 and continued the following day until 18:00 UTC on 8 July 2013.
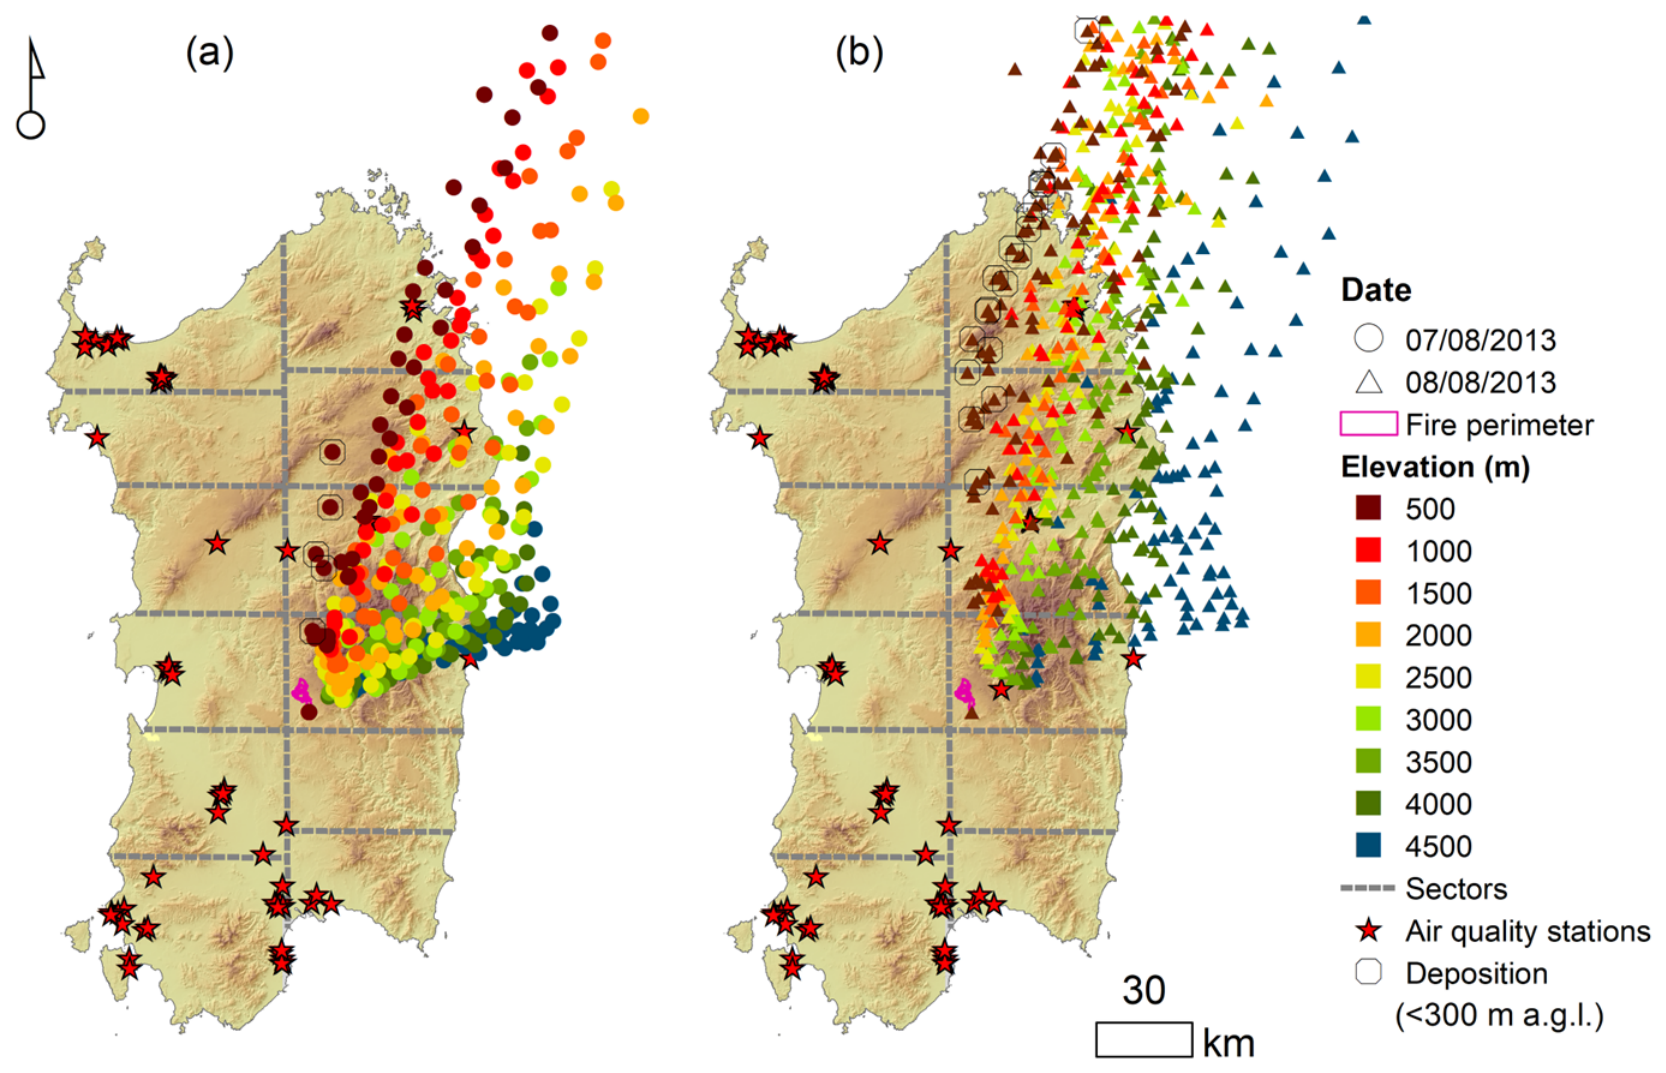
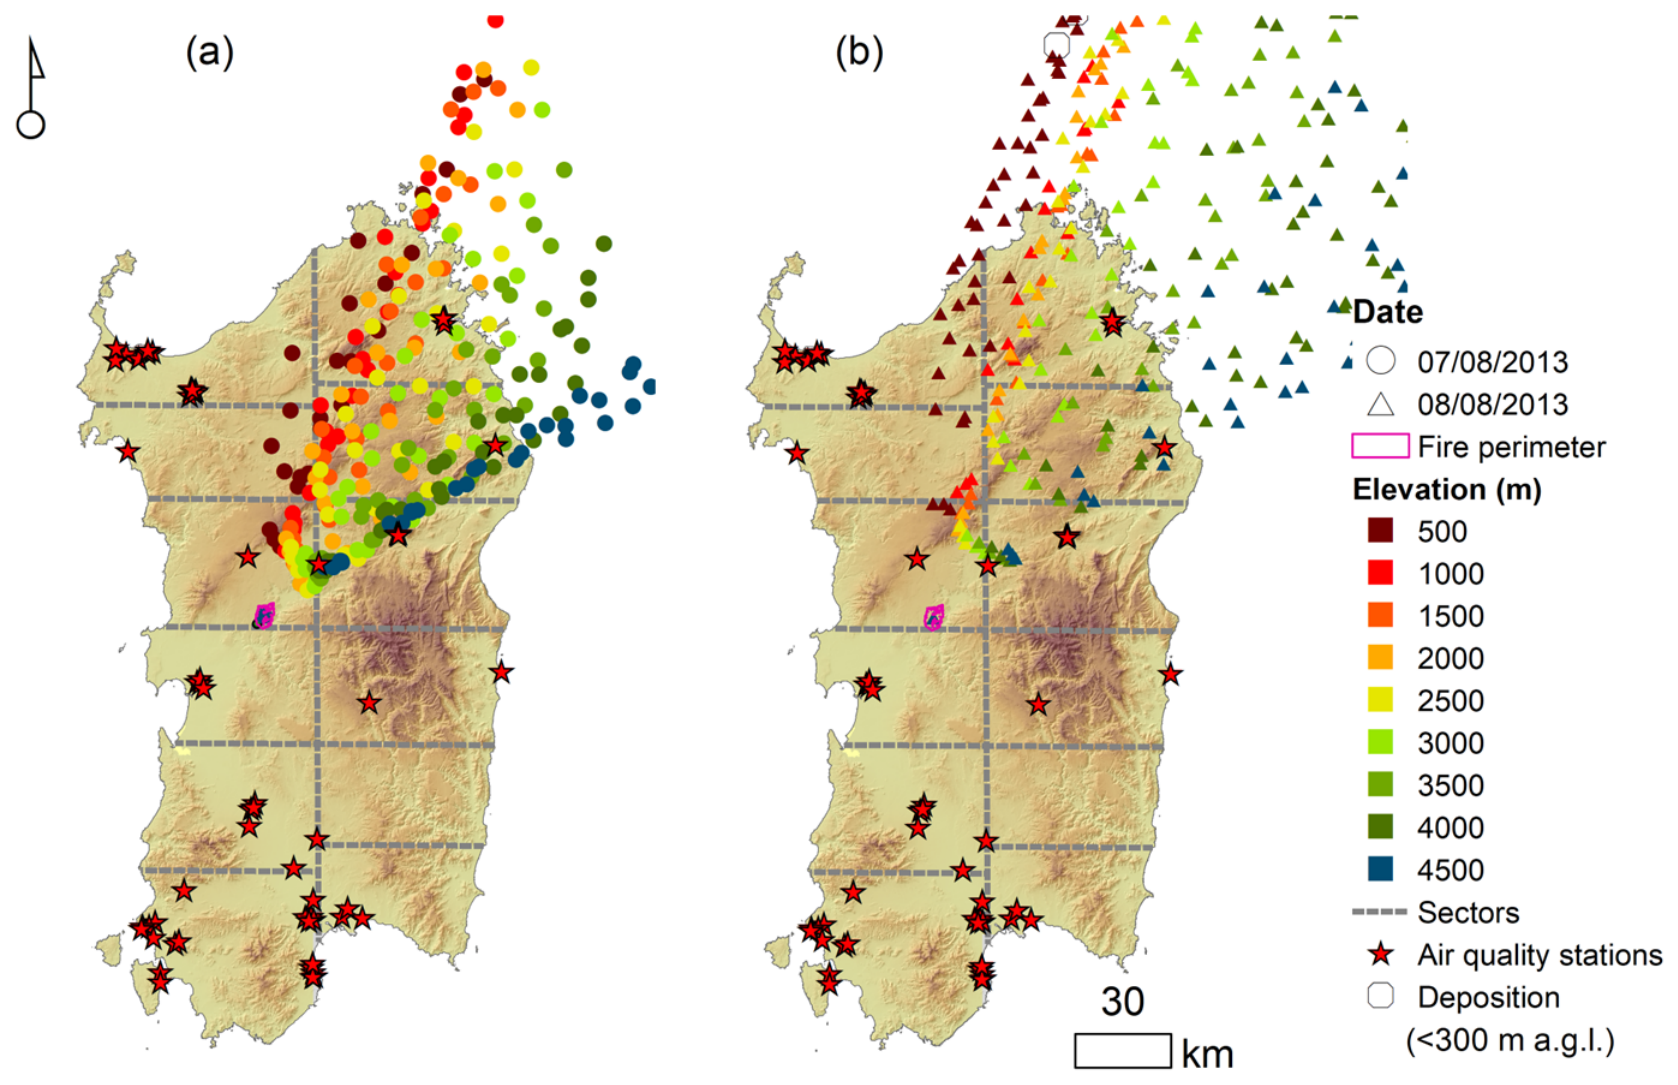
The simulations conducted on 7 and 8 July 2013 indicated the northern and eastern sectors of Sardinia (quadrants N2, N3, C2 and C3) as the area most affected by smoke passage (Figure 6). The areas affected by smoke transit varied according to the altitudes selected as the source of the smoke. In fact, with altitudes below 2500 m a.g.l., the direction of the smoke was constantly northwards; above these altitudes, the trajectories were oriented eastwards during the first hours of the event (from 10:00 am UTC to 05:00 pm UTC), while starting from 06:00 pm UTC, a change in the direction of the wind at high altitude caused a change in the directions of the trajectories towards the north (Figure 6).
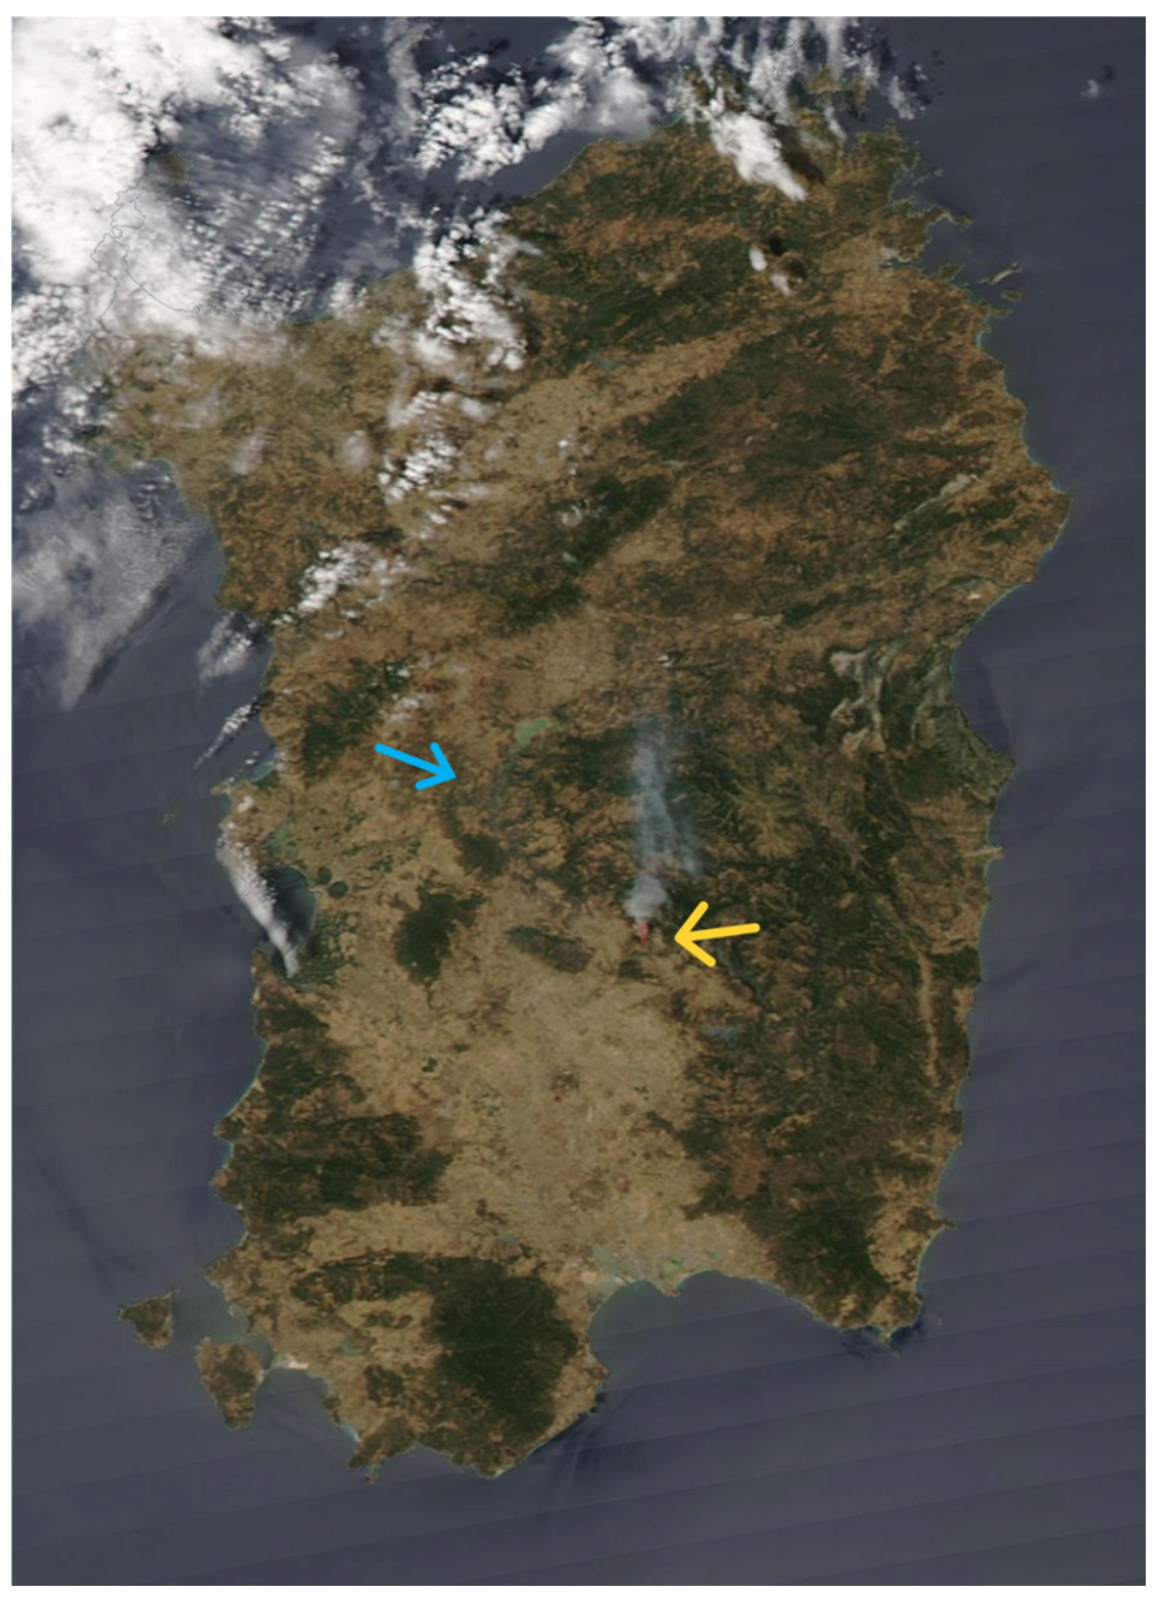
A possible descent of air masses, with consequent deposition of particulate matter at ground level, was predicted by the HYSPLIT model for both days, but only in simulations where the smoke origin was assumed to be below 500 m a.g.l. In particular, the model predicted a probable particulate deposition between 08:00 pm and 10:00 pm UTC on 7 July and at 04:00 am UTC on 8 July, extending from the central part of the island towards the northern coast. In contrast, simulations assuming a source altitude above 500 m a.g.l. did not indicate any potential impact of particulate matter on the island’s territory. Satellite imagery confirms HYSPLIT’s predicted trajectories, showing smoke transport towards Northern Sardinia (quadrant C2, C3, N2 and N3) (Figure A3).
Based on the trajectories simulated by HYSPLIT, seven stations (CENOT3; CENNU1; CENNU2; CENS10; CEOLB1, CENSN1 and CENSE0) of the air monitoring network were identified as being likely to be affected by a possible increase in the concentration of PM10, located within a range from the fire of 9.3 (CENSE0) to 122 km (CEOLB1) (Table A1). On 7 and 8 July, for all three quadrants N3, C2 and C3, an increase in PM10 was observed compared to the values recorded the day before the event (Table 3).
The greatest increases of PM10 cumulated values were observed on 8 July in the C2 quadrant with increments of 28.8, 27.0 and 20.5 µg/m3 d−1 at CENOT3, CENNU1 and CENNU2, respectively (Table 3). Anomalous increases in more than 14 µg/m3 d−1 were also observed at CENSN1 in the quadrant N3 and at CENSE0 in the quadrant C3. No increase was observed at the CENS10 station.
The second fire occurred in the territory of the municipality of Paulilatino on the same day, started at 03:00 am (01:00 am UTC) on 7 July, i.e., nine hours before the Isili fire, and lasted until 04:00 am (02:00 am UTC) on 8 July, i.e., 16 h before the end of the Isili fire. The area potentially affected by the passage of smoke was mainly concentrated in the northwestern part of the island (N2 and N3 quadrants) (Figure 7), and the distance of the operative air quality stations potentially affected by the fire plume falls within a range between 19 km (CENOT3) and 104 km (CEOLB1) (Table A1). Unlike the Isili fire, probably due to differences in the timing of the two events, the HYSPLIT model predicted no particulate deposition for the Paulilatino fire on the first day of the event. On 8 July, assuming a smoke source at 500 m a.g.l, the model indicated probable fallout occurring offshore. Consequently, the increases in particulate matter observed at the monitoring stations overflown by smoke from the Paulilatino fire are most likely attributable to the Isili fire (Table 3).

3.3. Borore Fire (1 July 2016)

3.3.1. Meteorological Conditions at Synoptic Scale

The days preceding the event, a high-pressure cell connected to the Azores High was positioned in the central Mediterranean, guaranteeing weak atmospheric stability. On 1 July, on the central Adriatic Sea, cyclogenesis was underway on the downwind side of the Alps (Figure 3c). This condition generated a weak perturbation. Over Sardinia, a decrease in pressure created weak conditions of more marked instability in the lower troposphere with respect to the middle-high troposphere. In addition, the Haines index [67], which is related to the probability that a fire develops in conditions of weak wind but of vertical instability, reached the maximum value of 6. This air instability could have been one of the reasons why a large fire developed despite low wind speeds and normal relative humidity levels.

3.3.2. Fire Plume Trajectories and PM10 Concentration

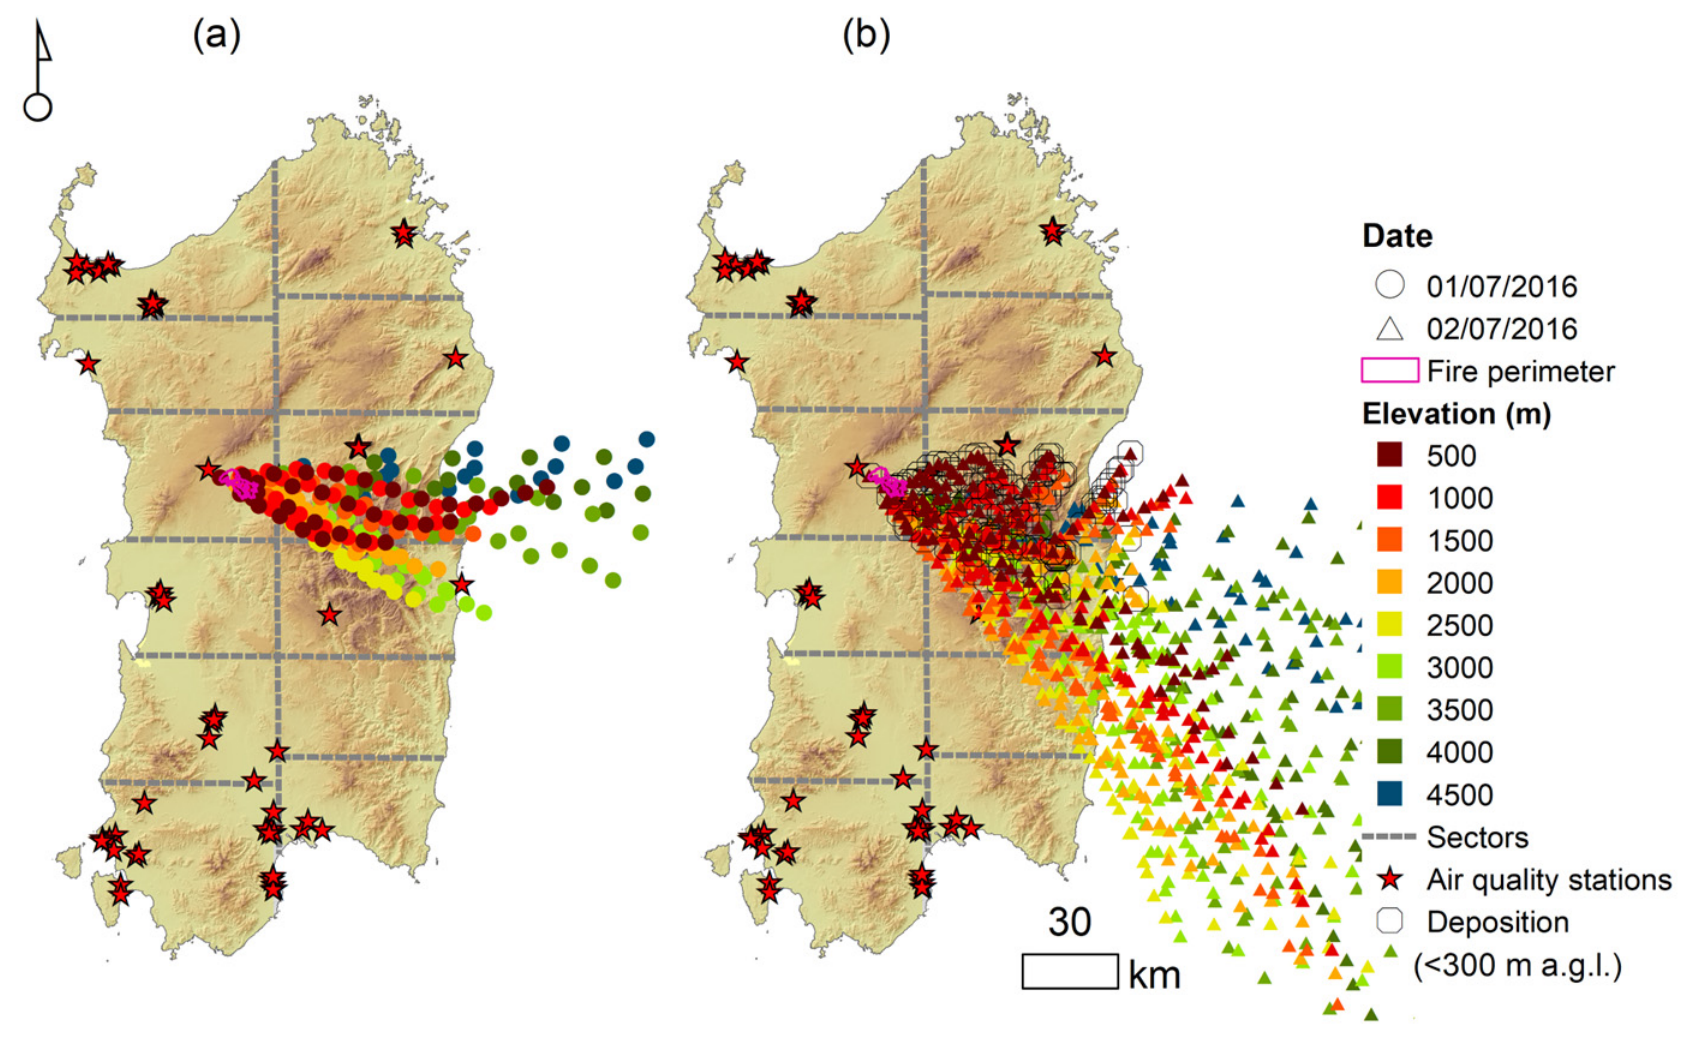
Regarding the Borore fire (starting at 02:00 pm, 12:00 UTC, on 1 July and ending at 12:00 pm, 10:00 pm UTC, on 2 July 2016), all the simulations performed with HYSPLIT indicated Central–Eastern Sardinia (quadrant C1 and C2) as potentially affected by the passage of smoke and particulates produced by the fire on the first day of the event (Figure 8). The following day, the direction of smoke seemed to have rotated in a south-eastern direction, also affecting quadrant C3 and partially quadrant S2. The model predicted a probable descent of the air masses and a consequent fallout of particulate matter at ground level between 11:00 pm UTC on 1 July and 02:00 pm UTC on 2 July in the central-eastern quadrant of the island (quadrant C1 and C2), exclusively in the simulations in which the smoke origin was assumed to be below 2500 m a.g.l. (Figure 8). None of the other simulations conducted on both days of the event indicated possible particulate fallout on the island.
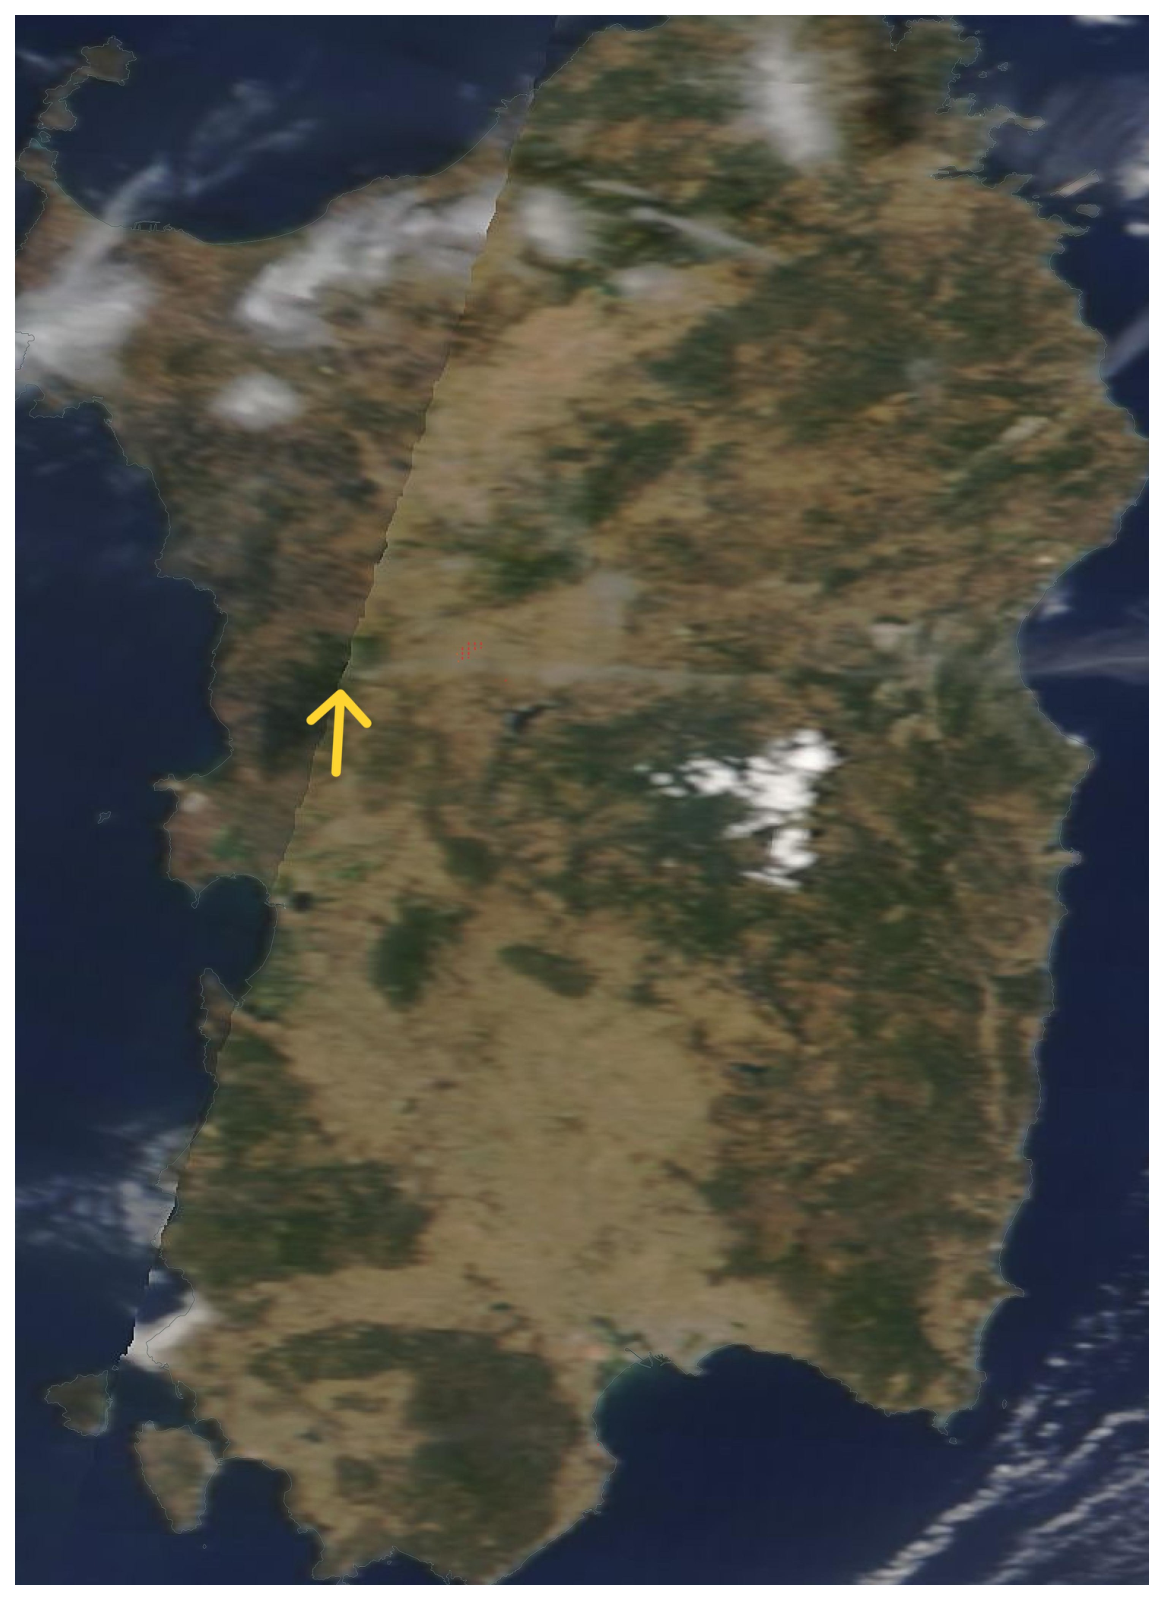
The analysis of the satellite images for the two days allowed us to confirm the directions of the trajectories simulated by HYSPLIT, mainly for the first day of the event, for which it is indeed possible to clearly identify the direction of the smoke towards the east (Figure A4). In contrast, on the second day (2 July) no fire plume seems identifiable in the area.
Based on the simulations from HYSPLIT, we identified five stations (CENMA1, CENOT3, CENNU1, CENNU2, CENSE0 in the C1, C2 and C3 sectors) of the air monitoring network that could have been affected by a possible increase in the concentration of PM10. All the stations fall within a fairly short distance between 7.3 (CENOT3 station) and 43.5 km (CENSE0 station) from the fire perimeter (Table A1).
However, an increase in PM10 was observed on 2 July for CENSE0 (32.3 µg/m3 d−1) and CENOT3 (23.7 µg/m3 d−1) stations compared to the values recorded on the days before and after the event (Table 4).

3.4. Montiferru Fire (24–25 July 2021)

3.4.1. Meteorological Conditions at Synoptic Scale

On 22 July at midday, the European synoptic weather situation was characterized by three main baric structures: a perturbation positioned northwest of Spain, a ridge extended from North Africa to the Central Western Mediterranean and to England (geopotential over Sardinia between 588 gpdam and 590 gpdam at 500 hPa) and a weakening trough stretched over Eastern Europe (Figure 3d). The synoptic evolution during the following days showed a slow eastward movement of the above-mentioned structures.
Sardinia was positioned on the border between a sub-tropical flow extending in a WE direction from North Africa to the Eastern Mediterranean and a cold air mass of polar origin with higher water vapor content over Central and Western Europe.
This frame caused a growing SW flow toward Sardinia of relatively warm and very dry air (for elevation higher than 900 hPa). This condition remained substantially unchanged until the afternoon of July 25, when the approaching ascending branch of an Atlantic perturbation brought lower temperatures with widespread cloudiness. Therefore, temperatures at the baric altitude of 850 hPa ranged between 20 and 24 °C over the entire island on 23 and 24 July, with further increases on 25 July (24–28 °C) (Figure 3d).
Considering low levels and the surface troposphere, on 24 July a synoptic flow from the southeast prevailed over the thermal circulation. The warming of the 850 hPa layer over the entire regional territory resulted in very high ground temperatures (T > 37 °C) and relative humidity between 20% and 30% for most of the island. The direction of the SE-E surface flow had an important influence on the development of the fire that occurred in the north–central part of the island. In fact, the air flow reached the northern part of the island after having warmed up and dried due to having crossed the internal part of the territory.
Moderate-to-high intensity winds were widely observed (about 10 m s−1) all over the island. During the night of 24 July to 25 July, as the ascending branch of the Atlantic perturbation approached, and the 28 °C line appeared at 850 hPa, a southwesterly wind rotation occurred, while on 25 July, diurnal breeze and nighttime variable winds appeared.
This weak depression wave caused the advection of moist air in the mid-high troposphere from the Sardinian Sea over the burning landscape. In particular, between about 6000 m and 7000 m a.s.l. closeness of the actual and dew point temperatures implied conditions near saturation and, consequently, cloud formation while the lower atmospheric layers were particularly dry. On 25 July at 12:00 am UTC, closeness to saturation increased to 6000 m (from about 5000 m to 11,000 m a.s.l), enhancing the possibility of precipitation. Some light rains were indeed recorded in the first hours of 25 July in Northern Sardinia; an additional increase in water vapor at low levels was also due to the fire activity in the Montiferru area. It can be supposed that in the observed remarkably dry-adiabatic boundary layer conditions, precipitation could not have reached the ground. Also, it is possible that the thermodynamic configuration of the troposphere drove the formation of a dry microburst with consequently anomalous erratic fire behavior, with the further possibility of synergistic interaction with the dynamics of the ongoing fire.

3.4.2. Fire Plume Trajectories and PM10 Concentration

Regarding the Montiferru fire, simulations performed with the HYSPLIT model using different elevations of smoke sources at different time intervals indicated Central–Northern Sardinia as the area most affected by the passage of smoke and particulate matter produced by the fire (Figure 9).
The areas probably affected by smoke transit can vary depending on the altitudes that were selected as smoke sources. In fact, when starting source altitudes between 500 and 2000 m a.g.l. were considered, the sectors of the island most affected by the passage of fumes were N1, N2, N3, N4 and C1 while, above these altitudes, there was a variation in the directions of the trajectories towards east with a probable involvement of eastern parts of the central area of the island (C2 and C3 sectors).
Possible particulate fallout at ground level was only observed in simulations in which the smoke origin was assumed to be below 1000 m. In particular, the model predicted a probable fallout of fire emissions on the northwestern coast of the island (quadrant N1) between 02:00 pm UTC and 07:00 pm UTC on 24 July (Figure 9). A further probable fallout of particulate matter was predicted by the model between 07:00 am and 11:00 am UTC on 25 July between quadrants N1, N2 and N3 (Figure 9). Simulations using altitudes above 1000 m a.g.l. as the point of origin of smoke did not indicate air masses falling at ground level.
Based on the trajectories simulated by HYSPLIT, 15 stations (CENPT1, CENSS03, CENSS04, CENSS12, CENSS16, CENSS2, CENS10, CEOLB1, CENSN1, CEALG1, CENMA1, CENNU1, CENNU2, CENOT3, CENSE0) of the air monitoring network were identified as being likely to be affected by a possible increase in the concentration of PM10 and combustion-related compounds that occurred during the fire. These stations fall within a wide range of distances from the fire perimeter, from 9.4 km (CENMA1 station) to 102 km (CEOLB1 station) (Table A1). On 24, 25 and 26 July for all three quadrants N1, N2 and N3, an increase in PM10 was observed compared to the values recorded the day before the event (Table 5).
The greatest increases of PM10 cumulative values were observed on 25 and 26 July in the N1 and N2 sectors. An increase of more than 11 µg/m3 d−1 was observed by all stations on 25 July, with increments of 21.6, 22.3 and 31.3 µg/m3 d−1 at CENPT1, CENSS12 and CENSS16, respectively (Table 5).
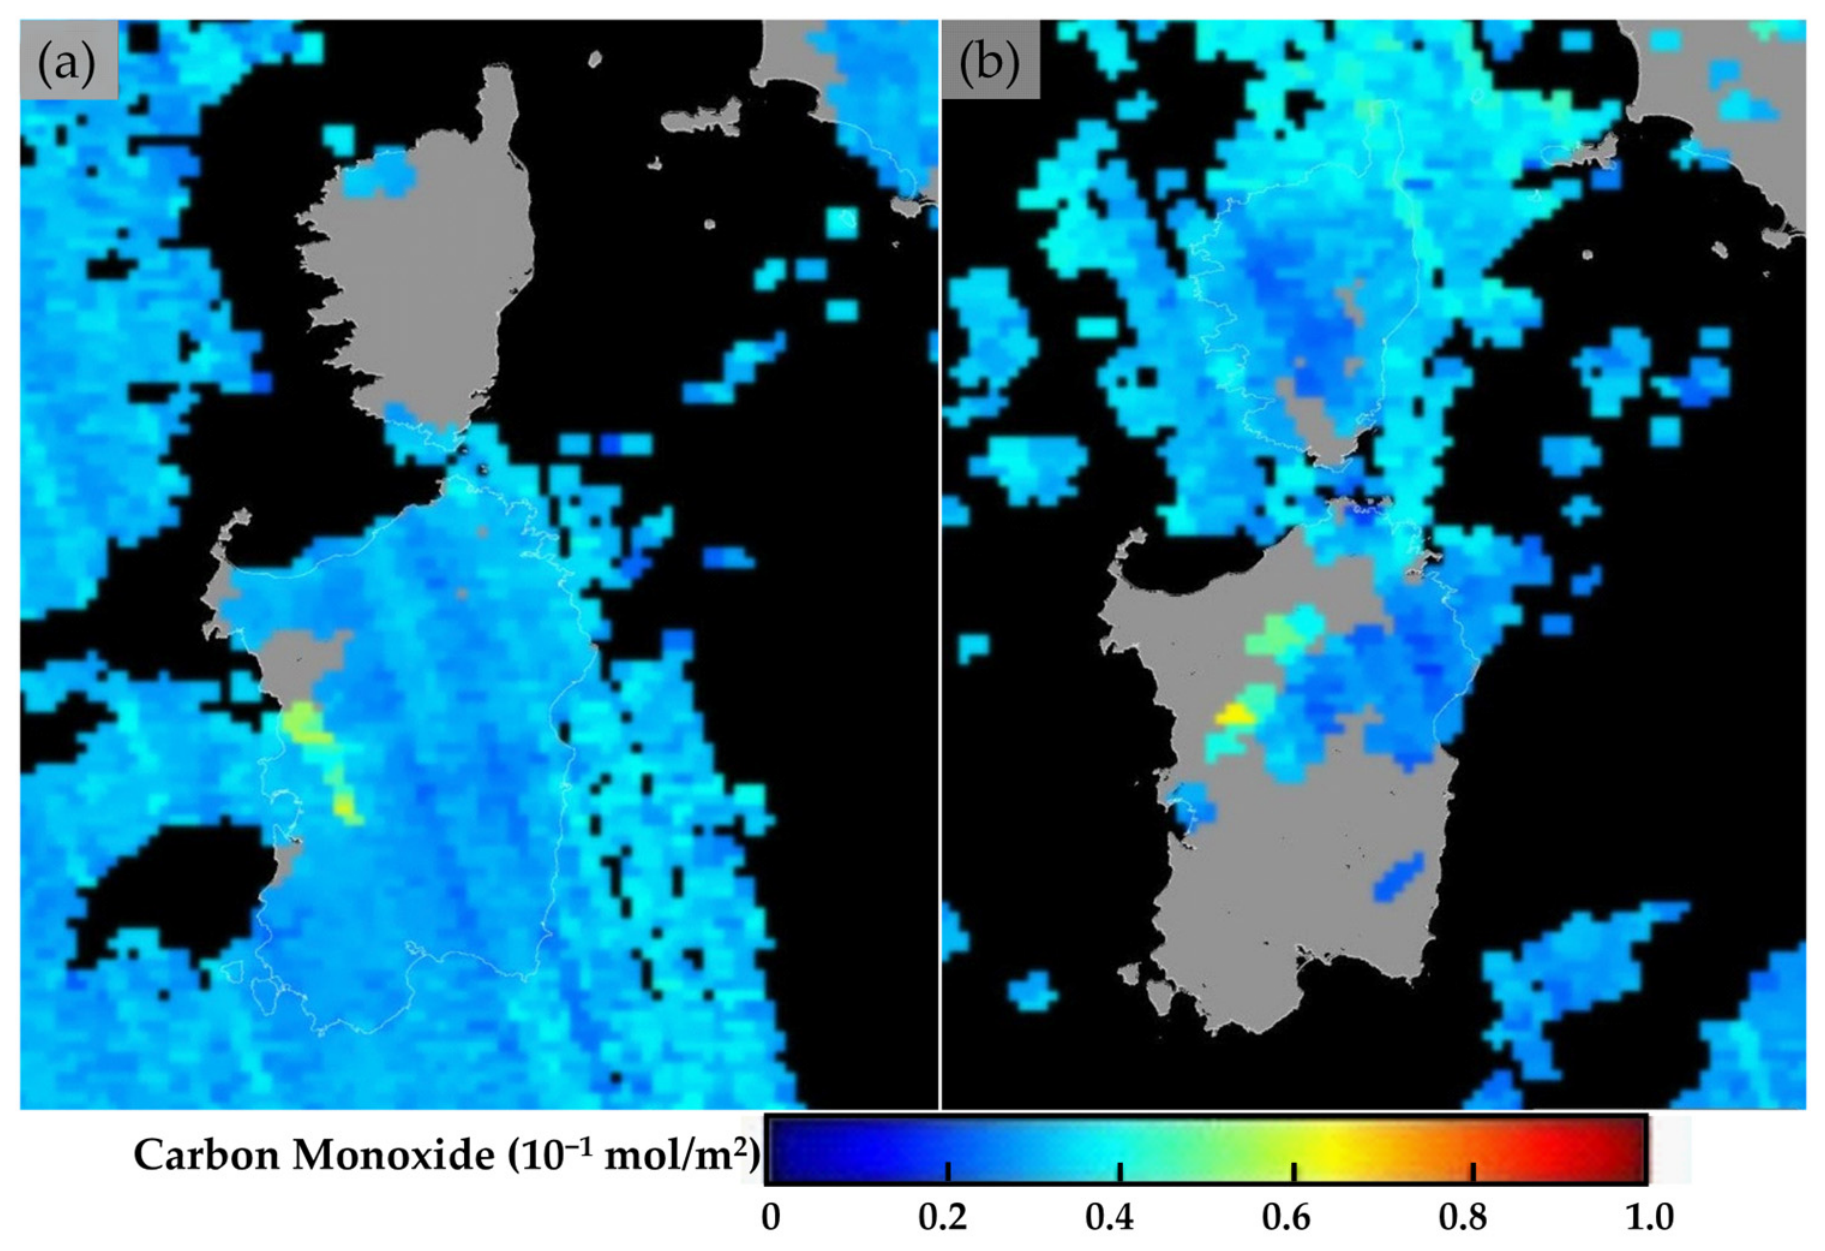
The analysis of the satellite images did not allow the direction of the smoke to be clearly identified due to the cloudiness present on both days. However, the correctness of the smoke trajectories heading north on the first day and pointing north-east on the second day, simulated by the HYSPLIT model, is confirmed by the analysis of the images showing the concentration of CO recorded by the satellite during the event (Figure A5).

4. Discussion and Conclusions

The primary objective of this work was to improve understanding of the impact of wildfires on ground-level PM10 concentrations in Sardinia to provide relevant information for assessing potential health risks for populations exposed to wildfire smoke. Specifically, we verified whether increases in ground-level PM10 concentrations occurred during six wildfire events characterized by different sizes, fuel types, and meteorological conditions, and we explored the possible influence of fire size, fuel type, and weather conditions on the presence and concentration of PM10 in areas near the fire or affected by the smoke plume in the days following the fire.
The amount of particulate matter emitted into the atmosphere, the height of the convective column, transport pathways, and fallout of particles all depend, in fact, on the interaction of various factors. These include the amount of biomass burned, the intensity of the fire, atmospheric conditions (e.g., stability, instability, wind intensity, and direction), and the size of the particulate matter [68].
Analysis of the results shows that the six investigated fires differ in terms of synoptic meteorological conditions taking place before and during the events, as well as in terms of size, duration, behavior, and fuel type. This diversity of case studies provided a solid basis for the present investigation.
Examination of the synoptic maps indicates that, although the overall atmospheric patterns in 2009 and 2013 were not directly comparable, the meteorological conditions on the days when the fires developed were broadly similar (Figure 3). In both cases, the days were characterized by flows of warm air masses from the southeast, with very high ground temperatures (over 40 °C) and temperatures of about 28 °C at 850 hPa, as well as very low relative air humidity. The warm advection implied an increase in the western component of the flow with altitude; therefore, the prevailing surface wind direction was southeast, while winds at upper levels were from the southwest. The 2013 days differed slightly from the 2009 days, mainly due to lower average wind speeds than on 23 and 24 July 2009.
The general synoptic situation during the Montiferru fire differed from that observed in the four cases described above. Nevertheless, it likewise promoted the advection of hot air of African origin, resulting in meteorological conditions quite comparable to those in the other events: near-surface temperatures exceeding 37 °C, relative humidity below 30%, and medium-to-high-intensity winds (about 10 m s−1) from the southeast with a marked rotation towards the southwest and west as altitude increased. On the following day, the wind intensity decreased and turned into a breeze regime.
In contrast, the general synoptic situation and weather conditions during the Borore fire in 2016 (27–28 July) were completely different from those in the other five cases. In this case, the fire developed in the presence of very weak winds from the west and northwest, with relative humidity and air temperatures in line with seasonal averages.
All the fires, with the exception of the one in Borore, occurred under conditions characterized by a common factor: Sardinia was located at the boundary between a local low-pressure area and a local high-pressure area, where continental-scale pressure patterns were not crucial in this dynamic. Thus, there were no high-pressure differences between the two areas and, consequently, no particularly strong winds. On the other hand, the western position of the low-pressure system and, at the same time, the eastern position of the high-pressure system relative to Sardinia generated a southerly flow of dry air from Africa, which, although it acquired some moisture after passing over the Mediterranean Sea, exhibited very high temperatures and low humidity since its passage over Sardinian territory for more than 100 km. This is consistent with the findings of Salis et al. [48], who observed southerly and southwesterly winds during the events responsible for 50% of the burned area in Sardinia. It is noteworthy that the same mechanism is described in the article by Paschalidou et al. [69], in which a northern advection over Greek territory is generated due to the inverse position of low and high pressure. Some analogies can also be found in the article by Duane et al. [70], where three conditions of the six weather patterns associated by the authors to the Catalonian fire regime (i.e., Scandinavian through, Atlantic through, and South intrusion) are similar to mechanisms observed in Sardinia. In particular, the “South intrusion” weather pattern is characterized by the appearance of a ridge originating in North Africa (High Sahara) that moves northward toward Europe, carrying very dry continental air masses and generating “heat waves” under conditions of light winds.
The analyzed fires also showed marked differences in both burned areas and vegetation types. In terms of size, Montiferru was the largest event (~13,200 ha), followed by Bonorva (~10,551 ha), Ittiri (~5000 ha), and Borore (~4300 ha), while Paulilatino (~3000 ha) and Isili (~2120 ha) were smaller but showed contrasting vegetation patterns. Most fires (Bonorva, Ittiri, Paulilatino, Borore) predominantly affected agropastoral landscapes, with grasslands, pastures, and croplands exceeding 65–85%. In contrast, Isili was mainly characterized by forests and shrublands (up to ~75%), while Montiferru stands out for its heterogeneity, involving a wide mix of herbaceous vegetation, shrubs, and forests with a predominance of forest and shrubland (about 60%).
The initial hypothesis was that PM10 concentrations, in addition to weather conditions, depend on both the extent of the burned area and the number of fires occurring in surrounding areas, as well as on fuel type. Therefore, in large-scale fires dominated by trees and Mediterranean shrubland, a more pronounced particulate matter deposition was expected compared to smaller fires or those dominated by pasture or grass fuels.
The amount of biomass burned, which governs the total energy released during combustion, represents a key determinant of plume rise [71,72,73]. In general, as the amount of biomass consumed increases, the release of heat increases, causing the plume to rise. However, this process is also influenced by the heat release rate or fire intensity. So that when large quantities of biomass burn rapidly, the resulting high heat release rate (i.e., fire intensity) tends to cause particulate matter and aerosols to rise upward. In contrast, lower-intensity generates weaker convective forcing, resulting in lower injection heights and increased near-surface concentrations [74,75]. This relationship is strongly influenced by weather conditions [76]. In addition to fire intensity, atmospheric and wind conditions also exert strong control over plume dynamics. Atmospheric stability determines the resistance to vertical motion: stable layers or temperature inversions can limit plume rise, while unstable conditions favor stronger vertical mixing [77,78]. Wind speed also influences plume evolution by tilting the smoke column and modifying the effective injection height and horizontal dispersion of aerosols [76,79]. Finally, the microphysical properties of emitted particles, particularly their size and mass, influence how long they persist in the atmosphere and how long it takes them to fall out. Fine particles have low gravitational settling velocities and can remain suspended for days or weeks, particularly if they are emitted at a high altitude. Heavier particles, on the other hand, settle more quickly. Therefore, the fallout time of aerosols and their potential for long-range transport is determined by the combined effects of biomass consumption, emission height, atmospheric dynamics, and particle size.
The air parcel trajectories simulated by the HYSPLIT model were fully consistent with the observed meteorological conditions during the six large fires examined. By performing multiple simulations with different start times and emission heights, we were able to capture the potential variability in smoke dispersion associated with temporal changes in wind speed and direction, as well as vertical wind structure. In addition, analysis of satellite imagery of smoke plumes, combined with CO observations from satellite sensors, confirmed the likely smoke transport pathways predicted by HYSPLIT during the events. The strong agreement between model outputs and satellite observations enabled the reliable identification of air-quality monitoring stations suitable for investigating particulate matter fallout during the fire episodes.
Analysis of the trajectory results indicates that, in most cases, the locations identified by HYSPLIT as being most likely to be affected by particulate matter fallout generally showed good agreement with the variations in PM10 levels as recorded by individual ground-level stations.
For example, in the case of the Isili fire, for which the model predicted a probable particulate deposition between 7 and 8 July from the central part of the island toward the northern coast, increases in PM10 concentrations compared to the day preceding the fire were observed in almost all stations affected by the smoke plume, within a range of 14.3 to 28.8 µg/m−3 d−1. It is worth noting that, for the Paulilatino fire, HYSPLIT predicted air mass deposition over the sea rather than over the island. Therefore, the increase in particulate matter concentration recorded by monitoring stations, and the consequent impact on air quality in the surrounding area, can reasonably be attributed primarily to the Isili fire, while the contribution from the simultaneous Paulilatino event remains highly uncertain.
A clear effect on particulate matter concentrations in areas surrounding the fire was also observed for the Montiferru event (24–25 July 2021). At the stations identified by HYSPLIT as likely to be affected by descending air masses, an increase in PM10 concentration was observed across all northern quadrants on 25 July, and across both northern and central quadrants on 26 July, with peak increases of 31.3 µg/m−3 d−1 at station CENS16 on 25 July and 38.5 µg/m−3 d−1 at station CENNU1. The higher PM10 concentrations and the longer duration of particulate fallout observed in the Montiferru fire compared to the Isili fire can be mainly attributed to fire size rather than fuel type. In both cases, fuels were characterized by a significant woody and shrub component relative to herbaceous vegetation, resulting in higher fire intensity, greater biomass burned, and heavier particulate emissions. However, the Montiferru fire, being six times larger than the Isili fire and of longer duration, led to substantially greater biomass consumption and particulate emissions into the atmosphere.
The situation was different for the fires in Bonorva and Paulilatino. In the case of Bonorva, the fire was comparable in size to the Montiferru fire, but the type of fuel was markedly different, consisting of around 75% pasture and agricultural vegetation. This resulted in lower biomass consumption and likely lighter particulate emissions. A similar consideration applies to the Paulilatino fire, where the limited presence of forest and shrub fuel (less than 20%) and the smaller fire size suggest a significantly lower amount of particulate matter emitted into the atmosphere. In addition, meteorological conditions led the model to predict air mass deposition in coastal areas or directly over the sea, limited to 24 July. These assumptions provide a rationale for the observed outcomes concerning PM10 concentrations at the stations in question, where no substantial increase in PM10 was detected at any station in comparison to the values observed on the days preceding and following the event. Although a weak increase in particulate matter was observed on 26 July, the total absence of fires in the surrounding areas on 25 and 26 July suggests that this increase is unlikely to be attributable to active fires. Therefore, in this specific case, the absence of particulate deposition over the island can be attributed to the combined effect of atmospheric conditions, which influenced air mass transport at higher altitudes, and the extent and type of fuel involved in the fire, which directly affect both the amount of biomass burned and the physical properties of emitted particles.
The Borore fire (starting on 1 July 2016) developed under unusual meteorological conditions characterized by weak winds, normal relative humidity, and low-level atmospheric instability. In addition, the burned vegetation consisted mainly of fine fuels, such as pasture herbs and grasses, resulting in limited biomass consumption and the emission of lighter particles tending to remain suspended in the atmosphere. The absence of significant PM10 accumulation during this event can therefore be explained by the combined effect of meteorological conditions and fuel characteristics, which likely favored the injection of fine particles at higher altitudes, where they remained suspended rather than depositing over the island.
When analyzing the potential impact of the examined fires on human health, it emerges that, despite the large size of some events, well above the average for summer fires in Sardinia (e.g., Bonorva and Montiferru fires) and/or the presence of heavy fuel types such as dense shrubland and forest (e.g., Montiferru and Isili fires), the PM10 levels recorded by monitoring stations were not always particularly critical.
Current Italian air quality legislation [80], implementing EU Directive 2008/50/EC [81], sets a daily PM10 limit value of 50 µg/m−3 d−1 (not to be exceeded more than 35 times per year) and an annual mean concentration limit of 40 µg/m−3 d−1. The World Health Organization (WHO) recommends a slightly lower daily limit of 45 µg/m−3 d−1 [82].
To the best of our knowledge, there are not many studies in the literature that report measured ground-level PM10 concentrations during individual fire events. Most studies conducted in Mediterranean environments involving fires of a comparable size to those analyzed here report either estimated PM10 values using modeling approaches or remote sensing or a combination of both [14,40]. Others used PM10 monitoring instruments based on different measurement principles than those employed in the present study [42]. Other authors, on the other hand, have analyzed trends in PM10 concentrations during fire seasons or during periods of intense fire activity [45,46,83,84]. In the present study, we estimated the wildfire impact using real, ground-based measurements from air-quality monitoring stations on the days of the events, rather than relying on average summer-month data or fire emission estimates derived from emission models. Nevertheless, a review of the studies available in the literature, reporting measured ground-level PM10 concentrations during individual wildfire events, shows an order of magnitude of daily PM10 concentrations consistent with values recorded at similar monitoring stations located in southern Italy, Portugal, and Croatia during the fire season [38,43,46,47].
Barros et al. [46] observed that, during wildfire events exceeding 100 ha in northern Portugal, PM10 concentrations remained consistently below 30 µg/m−3 d−1 and below the WHO threshold, except for a single event during which PM10 reached 66.5 µg/m−3 d−1. Oliveira et al. [43] reported increases in daily PM10 concentrations ranging from 48 to 85 µg/m−3 between 17 and 24 June, during large fires that burned more than 45,000 ha in Portugal. Sopčić et al. [47] reported that, during a fire event on 30 July 2024, maximum daily PM10 and PM2.5 concentrations reached 45.8 µg/m−3 d−1 and 30.8 µg/m−3 d−1, respectively the day after the event.
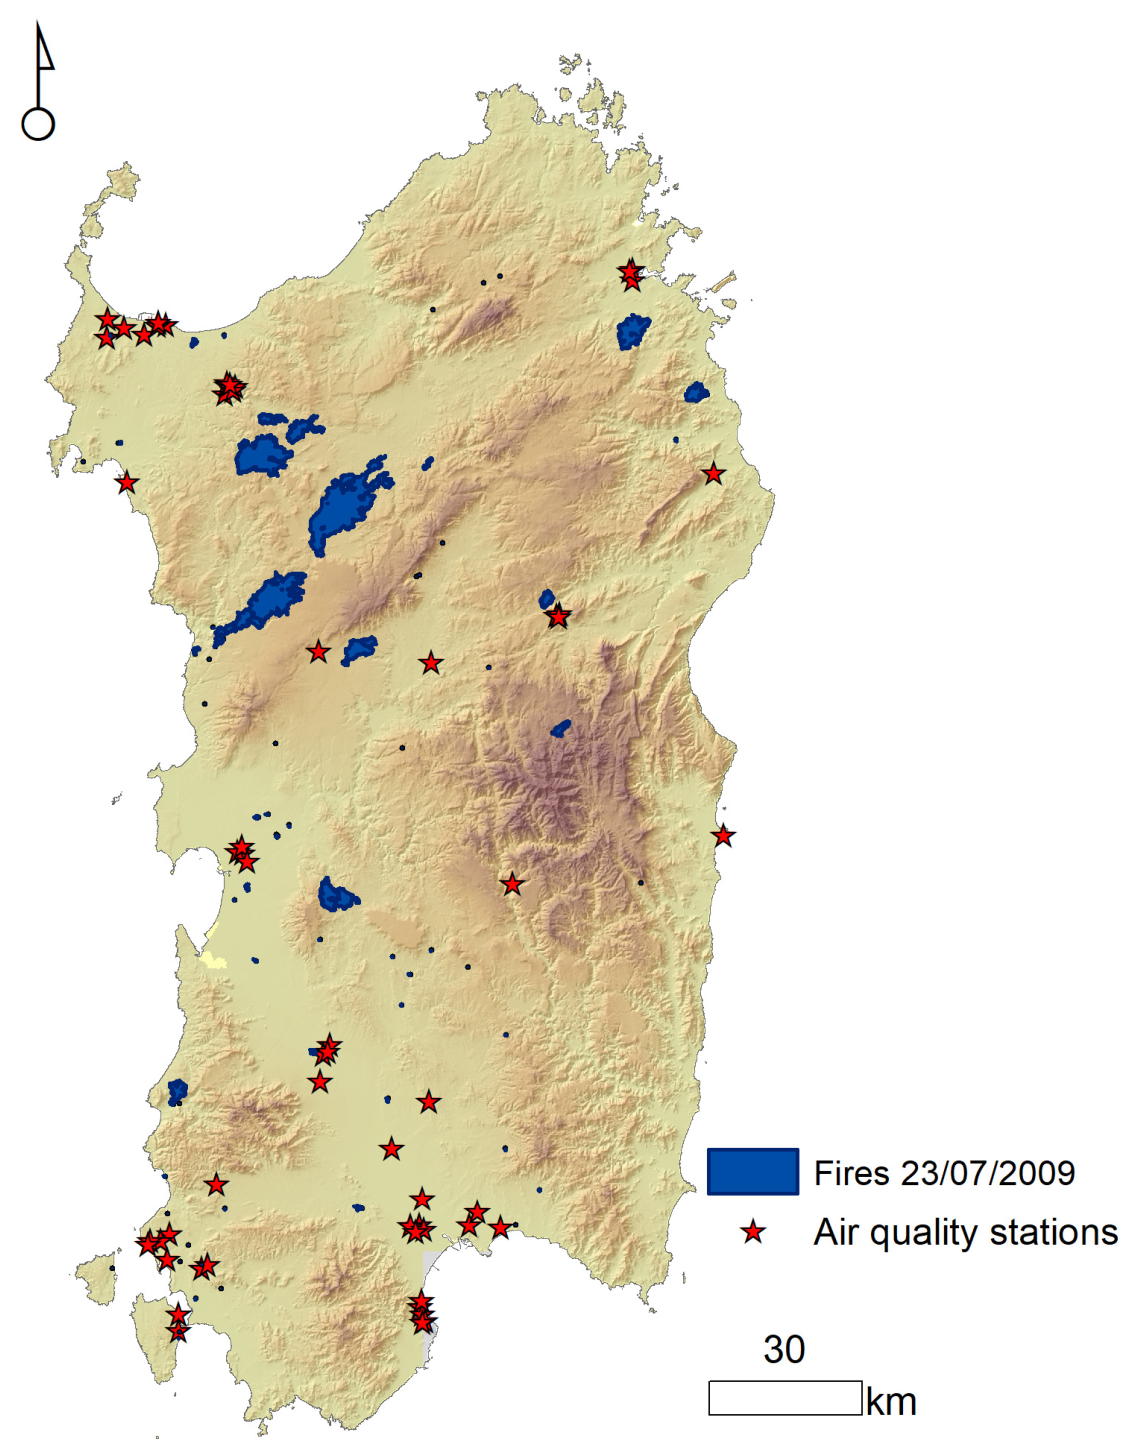
Regarding the events studied in this paper, our results indicate that PM10 concentrations recorded by the available air quality stations never exceeded the threshold values defined by Italian legislation and the WHO during the Borore, Bonorva, and Ittiri fires, despite the fact that the Bonorva fire covered an area of more than 10,000 hectares. There is a degree of uncertainty regarding a possible exceedance of the threshold, as one of the stations most affected by particulate fallout (CENSN1) was out of order. Consequently, a more substantial accumulation of PM10 at that location cannot be ruled out. Conversely, multiple fires occurred on that day in the same area (70 fire events occurred on 23 July, burning 85% of the monthly area burned—about 34,000 ha over 39,880 ha). If the combination of meteorological conditions and fuel characteristics had favored particulate deposition, an increase in PM10 concentrations would likely have been detected at surrounding stations as well (Figure A6).
Exceedances of the WHO (45 µg/m3 d−1) threshold values were instead recorded on 8 August 2013 in two monitoring stations (CENNU1 and CENOT3) following the fires that occurred in Isili and Paulilatino on 7–8 August 2013. In CENNU1, the concentration value of PM10 was also higher than the Italian threshold (50 µg/m−3). Isili fire is 54 km away from CENNU1 and 40 km from CENOT3, while the Paulilatino fire is 44 km away from CENNU1 and 19 km from CENOT3.
Although these events involved smaller burned areas compared to Bonorva, the Isili fire was likely characterized by a greater amount of consumed biomass.
A more extensive particulate fallout, both in spatial and temporal terms, and affecting a larger number of stations with exceedance of critical thresholds, was observed for the Montiferru fire. In this case, the WHO daily limit was exceeded in six stations on 26 July, while concentrations above 50 µg/m−3 were recorded at station CENNU2 on 26 July and at station CENSS16 on two consecutive days (25 and 26 July). The distance of these stations from the fire ranged from 9.4 km (CENMA1) to 93.7 km (CENSN1). Unlike the large fires that burned several days in the United States, impacting air quality with short- and long-term implications [13,85], the fires analyzed in this study do not produce medium- or long-term emission impacts. Their impact is primarily limited to the period directly associated with the active fire and the following days, and air quality typically recovers relatively quickly once the fire has been extinguished. Pollutant levels may exceed threshold limits in the immediate vicinity of active fires, but the location of available stations in this study does not allow us to verify this aspect.
However, it should be noted that this type of analysis involves a certain degree of uncertainty regarding the actual contribution of wildfires to increased airborne particulate matter concentrations compared to other sources of emissions. In addition to industrial activities, there are other sources of emissions in Sardinia that may have contributed to the presence of PM10 in the air, such as the particularly high tourist presence during the summer and episodes of Saharan dust transport, especially in late spring and summer. In conclusion, these results confirm that, in addition to atmospheric conditions—which influence both the injection height of particulate matter and air mass transport, thereby affecting whether deposition occurs over land or sea—the accumulation of PM10 at ground level is also strongly controlled by the combined effect of fuel type and burned area extent.
With specific reference to Sardinia, the limited impact of fires on air quality can be attributed to two factors. The first is related to atmospheric conditions. Unstable synoptic conditions can favor intense winds at all levels. This leads to rapid fire growth and dispersion of the smoke plume. Combined with the size of the island itself, this increases the likelihood of particulate matter falling into the sea, beyond the island’s coastline. More stable synoptic conditions could promote local smoke accumulation, but the smaller resulting fires produce less particulate matter. Additionally, the presence of coastal sea-breeze circulations can enhance smoke transport and dispersion, thereby reducing the effects of stable synoptic conditions. Furthermore, from a climatological point of view, 65% of days in Sardinia record, on average, a wind intensity higher than 8.0 m s−1 [86]. Thus, the windy conditions typical of Sardinia, as well as the absence of narrow valleys and steep slopes in its orography, make events similar to those observed in the Alps or western North America, where nocturnal inversions trap smoke in valleys, rare.
The second factor is related to the characteristics of wildfires in Sardinia, particularly their average size and duration, and the types of fuel involved. Fires covering more than 10,000 to 15,000 hectares and lasting more than two days are rare in Sardinia and are considered extremely severe. The territory’s orographic characteristics, mosaic land use patterns, and horizontal fuel load discontinuity tend, in general, to contain fire growth. Additionally, the Sardinian regional wildfire suppression system is based on an initial attack strategy that minimizes the probability of fire escalation and tends to reduce the extent of burned areas [87]. It is therefore likely that the combination of these factors has prevented the occurrence of events of comparable size, intensity, and duration to those that occurred in Portugal in 2017, where a single wildfire burned over 241,000 hectares in less than 24 h [88], or in Greece in 2023, where the Evros fire burned over 93,000 hectares and lasted more than 10 days [84].
On the other hand, increased fuel accumulation and continuity at the landscape scale due to land abandonment processes and fire exclusion policies, combined with an increased frequency and intensity of extreme weather conditions and a prolonged fire season (exacerbated by climate change and global warming), are expected to increase the intensity and frequency of extreme fire events (similar to the Montiferru event) across the entire Mediterranean basin. Consequently, this will further increase fire emissions and the impact on air quality. In this context, it is therefore becoming increasingly urgent to recognize the need to incorporate human health considerations into forest management and ecological planning.

Author Contributions

Conceptualization, A.C. and G.P.; methodology, V.B., G.P. and C.S.; validation, M.C. and M.S.; formal analysis, V.B., M.C., G.P. and C.S.; investigation, V.B., G.P. and C.S.; data curation, B.A., M.C., C.S. and M.S.; writing—original draft preparation, G.P.; writing—review and editing, B.A., V.B., M.C., G.P., C.S. and M.S.; visualization, C.S.; supervision, G.P. and V.B.; funding acquisition, B.A. All authors have read and agreed to the published version of the manuscript.

Funding

This research was funded by the CRITERIA Project (grant no. B53D23029500001), funded by the Italian Ministry of Education, University and Research (MUR) under the EU Next Generation Program (PNRR–PRIN); the MED-Star2 (grant no. B83C24005570007) Project, funded by the EU under the cross-border “Programma Italia–Francia Marittimo” 2021–2027. The contract of Dr. Carla Scarpa is funded by the FIRE-ADAPT Project (grant no. J53C24003100001), funded by the Italian Ministry of Education, University and Research (MUR) under the PRIN 2022 Program.

Institutional Review Board Statement

Not applicable.

Informed Consent Statement

Not applicable.

Data Availability Statement

The data used in this study are available upon reasonable request from the authors.

Acknowledgments

The authors thank the Sardinia Forest Service for providing wildfire data, and the Regional Environment Protection Agency of Sardinia for providing air quality data. The authors thank Pierpaolo Zara for managing the administrative procedures necessary to cover the cost of MDPI Article Processing Charges.

Conflicts of Interest

The authors declare no conflicts of interest.

Appendix A

Appendix A.1. Methods

As said in the Materials and Methods Section, the duration of a fire can vary greatly, and weather conditions may also change during that time. To consider changes in weather conditions during the event, we ran a simulation every two hours for a total of 12 simulations over 24 h. In addition, because data on the height of the column of smoke was not available, each simulation was repeated at different heights above ground level. Finally, we assumed a probable impact of particulate matter at ground level when simulations envisaged descents of air masses at altitudes lower than 300 m above ground level.
Figure A1 illustrates a simplified example of the simulations performed for each fire. These simulations account for potential changes in weather conditions and the heights the smoke column may reach during the event. Figure A1 also shows graphs of how the altitude of the air masses changes over time in each simulation. Specifically, we present the results of two simulations of the Montiferru fire, considering two smoke plume heights (500 m and 2000 m) and weather conditions at four-hour intervals from the time the fire started. In the example shown, fallout of air masses below 300 m at ground level occurs only in the simulation with a 500 m smoke plume, approximately 6 h after the fire began. Therefore, in this case, the model predicts that particulate matter will likely fall directly into the sea.
Figure A1. Example of results from HYSPLIT simulations. (a) Positions over time of the air masses originating from the point where the fire started, considering two different heights of the smoke column: 500 m (red dots) and 1000 m (yellow dots). (b) Start time (4 h intervals) of each simulation (black stars) and the altitude of the air masses at 1 h intervals from the start of each simulation (colored symbols) for the two assumed heights of the smoke plume (500 m at the top and 1000 m at the bottom).
Fire 09 00317 g0a1

Appendix A.2. Results

Table A1. Distance between each air quality monitoring station and the perimeter of the six fires. Only the distances for stations that were affected by the passage of the fire plume are displayed.
Distance (km)
SectorStation NameIttiriBonorvaIsiliPaulilatinoBororeMontiferru
N1CENPT127.545.1 63.4
CENSS0328.547.0 62.6
CENSS0428.246.1 63.6
CENSS1210.327.3 48.1
CENSS139.928.1
CENSS1610.726.7 49.4
CENSS1710.126.6
CENSS233.452.6 64.1
N2CENS1075.159.8121.2102.9 101.5
CEOLB175.460.4122.7104.1 102.4
N3CENSN1 93.385.6 93.7
N4CEALG1 36.1
C1CENMA1 4.69.4
C2CENNU1 54.044.433.655.8
CENNU2 54.445.134.356.5
CENOT3 40.818.97.329.8
C3CENSE0 9.439.343.656.6
Figure A2. A satellite picture of fire detection and plume spatial direction of fires occurred on 23 July 2009 [89]. The yellow arrow points to the Bonorva fire; the blue arrow points to the Ittiri fire.
Fire 09 00317 g0a2
Figure A3. A satellite picture of fire detection and plume spatial direction of fires that occurred on 7 August 2013 [89]. The yellow arrow points to the Isili fire; the blue arrow points to the Paulilatino fire.
Fire 09 00317 g0a3
Figure A4. A satellite picture of fire detection and plume spatial direction of fires occurred on 1 July 2016 [89]. The yellow arrow points to the Borore fire.
Fire 09 00317 g0a4
Figure A5. Spatial detection of CO concentrations and dispersion derived from the TROPOMI onboard Sentinel-5P during the first (a) and the second (b) day of the Montiferru wildfire event (24 and 25 July 2021). The image was obtained from JSTAR Mapper [90].
Fire 09 00317 g0a5

Appendix A.3. Discussion

Figure A6. Fire events occurred on 27 July 2009 and perimeters of fires larger than 0.10 ha (source: Sardinian Regional Forest Service fire database).
Fire 09 00317 g0a6

References

  1. He, T.; Lamont, B.B.; Pausas, J.G. Fire as a key driver of Earth’s biodiversity. Biol. Rev. 2019, 94, 1983–2010. [Google Scholar] [CrossRef] [PubMed]
  2. McLauchlan, K.K.; Higuera, P.E.; Miesel, J.; Rogers, B.M.; Schweitzer, J.; Shuman, J.K.; Tepley, A.J.; Varner, J.M.; Veblen, T.T.; Watts, A.C. Fire as a fundamental ecological process: Research advances and frontiers. J. Ecol. 2020, 108, 2047–2069. [Google Scholar] [CrossRef]
  3. Keeley, J.E.; Bond, W.J.; Bradstock, R.A.; Pausas, J.G.; Rundel, P.W. Fire in Mediterranean Ecosystems: Ecology, Evolution and Management; Cambridge University Press: Cambridge, UK, 2011. [Google Scholar]
  4. Ribeiro, L.M.; Rodrigues, A.; Lucas, D.; Viegas, D.X. The impact on structures of the Pedrogao Grande Fire Complex in June 2017 (Portugal). Fire 2020, 3, 57. [Google Scholar] [CrossRef]
  5. Molina-Terrén, D.M.; Xanthopoulos, G.; Diakakis, M.; Ribeiro, L.M.; Caballero, D.; Delogu, G.M.; Viegas, D.X.; Silva, C.A.; Cardil, A. Analysis of forest fire fatalities in Southern Europe: Spain, Portugal, Greece and Sardinia (Italy). Int. J. Wildland Fire 2019, 28, 85–98. [Google Scholar] [CrossRef]
  6. Costa, H.; De Rigo, D.; Libertà, G.; Houston Durrant, T.; San-Miguel-Ayanz, J. European Wildfire Danger and Vulnerability in a Changing Climate: Towards Integrating Risk Dimensions; EUR 30116 EN; Publications Office of the European Union: Luxembourg, 2020. [Google Scholar] [CrossRef] [PubMed]
  7. Forzieri, G.; Girardello, M.; Ceccherini, G.; Spinoni, J.; Feyen, L.; Hartmann, H.; Beck, P.S.A.; Camps-Valls, G.; Chirici, G.; Mauri, A.; et al. Emergent vulnerability to climate-driven disturbances in European forests. Nat. Commun. 2021, 12, 1081. [Google Scholar]
  8. Xu, Q.; Westerling, A.L.; Baldwin, W.J. Spatial and temporal patterns of wildfire burn severity and biomass burning-induced emissions in California. Environ. Res. Lett. 2022, 17, 11500. [Google Scholar] [CrossRef]
  9. Keeping, T.; Garcia Garcia, D.; Trigo, R.; Santos, F.L.M.; Barnes, C.; Vahlberg, M.; Meyer, R.; Otto, F. Extreme Fire Weather Conditions in Spain and Portugal Now Common due to Climate Change; Imperial college London: London, UK, 2025. [Google Scholar] [CrossRef] [PubMed]
  10. Sedano, F.; San-Miguel-Ayanz, J.; Broglia, M.; Durrant, T.; Boca, R.; Maianti, P.; Jacome Felix Oom, D.; Branco, A.; De Rigo, D.; Suarez-Moreno, M.; et al. Forest Fires in Europe, Middle East and North Africa 2024; Publications Office of the European Union: Luxembourg, 2025. [Google Scholar] [CrossRef]
  11. Sedano, F.; Maianti, P.; Boca, R.; Suarez-Moreno, M.; Broglia, M.; Rigo, D.d.; Roglia, E.; Branco, A.; San-Miguel-Ayanz, J.; Durrant, T.; et al. Advance Report on Forest Fires in Europe, Middle East and North Africa 2025; Publications Office of the European Union: Luxembourg, 2026; Available online: https://data.europa.eu/doi/10.2760/3859043 (accessed on 17 April 2026).
  12. Prichard, S.J.; Kennedy, M.C.; Andreu, A.G.; Eagle, P.C.; French, N.H.; Billmire, M. Next-generation biomass mapping for regional emissions and carbon inventories: Incorporating uncertainty in wildland fuel characterization. J. Geophys. Res.-Biogeosci. 2019, 124, 3699–3716. [Google Scholar] [CrossRef]
  13. Jaffe, D.A.; O’Neill, S.M.; Larkin, N.K.; Holder, A.L.; Peterson, D.L.; Halofsky, J.E.; Rappold, A.G. Wildfire and prescribed burning impacts on air quality in the United States. J. Air Waste Manag. 2020, 70, 583–615. [Google Scholar] [CrossRef] [PubMed]
  14. Scarpa, C.; Bacciu, V.; Ascoli, D.; Costa-Saura, J.M.; Salis, M.; Sirca, C.; Marchetti, M.; Spano, D. Estimating annual GHG and particulate matter emissions from rural and forest fires based on an integrated modelling approach. Sci. Total Environ. 2023, 907, 167960. [Google Scholar] [CrossRef] [PubMed]
  15. Vicente, E.D.; Figueiredo, D.; Gonçalves, C.; Kováts, N.; Hubai, K.; Sainnokhoi, T.A.; Vicente, A.; Oliveira, H.; Lopes, I.; Alves, C. Toxicological Screening of PM2.5 from Wildfires Involving Different Biomass Fuels. Environ. Pollut. 2025, 370, 125887. [Google Scholar] [CrossRef] [PubMed]
  16. Reid, C.E.; Jerrett, M.; Tager, I.B.; Petersen, M.L.; Mann, J.K.; Balmes, J.R. Differential respiratory health effects from the 2008 northern California wildfires: A spatiotemporal approach. Environ. Res. 2016, 150, 227–235. [Google Scholar] [CrossRef] [PubMed]
  17. Mueller, S.; Tarnay, L.; O’Neill, S.; Rause, S. Apportioning Smoke Impacts of 2018 Wildfires on Eastern Sierra Nevada Sites. Atmosphere 2020, 11, 970. [Google Scholar] [CrossRef]
  18. O’Neill, S.M.; Diao, M.; Raffuse, S.; Al-Hamdan, M.; Barik, M.; Jia, Y.; Reid, S.; Zou, Y.; Tong, D.; West, J.J.; et al. A multi-analysis approach for estimating regional health impacts from the 2017 Northern California wildfires. J. Air Waste Manag. 2021, 71, 791–814. [Google Scholar] [CrossRef] [PubMed]
  19. D’Evelyn, S.M.; Jung, J.; Alvarado, E.; Baumgartner, J.; Caligiuri, P.; Hagmann, R.K.; Henderson, S.B.; Hessburg, P.F.; Hopkins; Spector, J.T. Wildfire, smoke exposure, human health, and environmental justice need to be integrated into forest restoration and management. Curr. Environ. Health Rep. 2022, 9, 366–385. [Google Scholar] [CrossRef] [PubMed]
  20. Barjeste Vaezi, R.; Martin, M.R.; Hosseinpour, F. Impacts of Wildfire Smoke Aerosols on Radiation, Clouds, Precipitation, Climate, and Air Quality. Atmos. Environ. X 2025, 26, 100322. [Google Scholar] [CrossRef]
  21. Liu, J.C.; Pereira, G.; Uhl, S.A.; Bravo, M.A.; Bell, M.L. A systematic review of the physical health impacts from non-occupational exposure to wildfire smoke. Environ. Res. 2015, 136, 120–132. [Google Scholar] [CrossRef] [PubMed]
  22. Aguilera, R.; Corringham, T.; Gershunov, A.; Benmarhnia, T. Wildfire smoke impacts respiratory health more than fine particles from other sources: Observational evidence from Southern California. Nat. Commun. 2021, 12, 1493. [Google Scholar] [CrossRef] [PubMed]
  23. Sritharan, J.; Kirkham, T.L.; MacLeod, J.; Marjerrison, N.; Lau, A.; Dakouo, M.; Logar- Henderson, C.; Norzin, T.; DeBono, N.L.; Demers, P.A. Cancer risk among firefighters and police in the Ontario workforce. Occup. Environ. Med. 2022, 79, 533–539. [Google Scholar] [CrossRef] [PubMed]
  24. Gili, J.; Viana, M.; van Drooge, B.L. Passive sampling of atmospheric polycyclic aromatic hydrocarbons by silicone wristbands during wildland fires. Atmos. Environ. 2025, 362, 121564. [Google Scholar] [CrossRef]
  25. Rizzo, L.V.; Rizzo, M.C.F. Wildfire smoke and health impacts: A narrative review. J. Pediatr. 2025, 101, S56–S64. [Google Scholar] [CrossRef] [PubMed]
  26. Wiedinmyer, C.; Hurteau, M.D. Prescribed fire as a means of reducing forest carbon emissions in the western United States. Environ. Sci. Technol. 2010, 44, 1926–1932. [Google Scholar] [CrossRef] [PubMed]
  27. Wilmot, T.Y.; Hallar, A.G.; Lin, J.C.; Mallia, D.V. Expanding number of Western US urban centers face declining summertime air quality due to enhanced wildland fire activity. Environ. Res. Lett. 2021, 16, 054036. [Google Scholar] [CrossRef]
  28. Gong, X.; Kaulfus, A.; Nair, U.; Jaffe, D.A. Quantifying O3 impacts in urban areas due to wildfires using a generalized additive model. Environ. Sci. Technol. 2017, 51, 13216–13223. [Google Scholar] [CrossRef] [PubMed]
  29. Laing, J.R.; Jaffe, D.A. Wildfires Are Causing Extreme PM Concentrations in the Western United States. EM Air Waste Management Association’s Magazine for Environmental Managers, 18–23 June 2019. Available online: https://drive.google.com/file/d/1-hydrQvIWr4BJHXL4WyD6NgUTDnzVxAc/view (accessed on 17 April 2026).
  30. Mass, C.F.; Ovens, D. The Northern California wildfires of 8–9 October 2017: The role of a major downslope wind event. B Am. Meteorol. Soc. 2019, 100, 235–256. [Google Scholar] [CrossRef]
  31. Lu, H.; Xie, M.; Wang, N.; Liu, B.; Jiang, J.; Zhuang, B.; Zhang, Y.; Wu, M.; Yang, J.; Lv, K.; et al. The contribution of fires to PM2.5 and population exposure in the Asia Pacific region. Atmos. Chem. Phys. 2025, 25, 10141–10158. [Google Scholar] [CrossRef]
  32. Rojano, R.E.; Arregoces, H.A.; Restrepo, G. Interannual variations in PM10 and PM2.5 due to wildfires in four air quality monitoring networks in the Colombian Caribbean. Environ. Chall. 2025, 21, 101360. [Google Scholar] [CrossRef]
  33. Carvalho, A.; Monteiro, A.; Flannigan, M.; Solman, S.; Miranda, A.I.; Borrego, C. Forest fires in a changing climate and their impacts on air quality. Atmos. Environ. 2011, 45, 5545–5553. [Google Scholar] [CrossRef]
  34. Martins, H. Urban compaction or dispersion? An air quality modelling study. Atmos. Environ. 2012, 54, 60–72. [Google Scholar] [CrossRef]
  35. Miranda, A.I.; Martins, V.; Cascão, P.; Amorim, J.H.; Valente, J.; Borrego, C.; Ferreira, C.J.; Cordeiro, C.R.; Viegas, D.X.; Ottmar, R. Wildland smoke exposure values and exhaled breath indicators in firefighters. J. Toxicol. Environ. Health Sci. 2012, 75, 831–843. [Google Scholar] [CrossRef] [PubMed]
  36. Turquety, S.; Menut, L.; Bessagnet, B.; Anav, A.; Viovy, N.; Maignan, F.; Wooster, M. APIFLAME v1. 0: High-resolution fire emission model and application to the Euro-Mediterranean region. Geosci. Model Dev. 2014, 7, 587–612. [Google Scholar] [CrossRef]
  37. Faustini, A.; Alessandrini, E.R.; Pey, J.; Perez, N.; Samoli, E.; Querol, X.; Cadum, E.; Perrino, C.; Ostro, B.; Ranzi, A.; et al. Short-term effects of particulate matter on mortality during forest fires in Southern Europe: Results of the MED-PARTICLES Project. Occup. Environ. Med. 2015, 72, 323–329. [Google Scholar] [CrossRef] [PubMed]
  38. Castagna, J.; Senatore, A.; Bencardino, M.; D’Amore, F.; Sprovieri, F.; Pirrone, N.; Mendicino, G. Multiscale assessment of the impact on air quality of an intense wildfire season in southern Italy. Sci. Total Environ. 2021, 761, 143271. [Google Scholar] [CrossRef] [PubMed]
  39. Koukouli, M.E.; Pseftogkas, A.; Karagkiozidis, D.; Mermigkas, M.; Panou, T.; Balis, D.; Bais, A. Extreme wildfires over Northern Greece during Summer 2023–Part B. Adverse effects on regional air quality. Atmos. Res. 2025, 320, 108034. [Google Scholar] [CrossRef]
  40. Fernandes, A.P.; Lopes, D.; Sorte, S.; Monteiro, A.; Gama, C.; Reis, J.; Menezes, I.; Osswald, T.; Borrego, C.; Almeida, M.; et al. Smoke emissions from the extreme wildfire events in central Portugal in October 2017. Int. J. Wildland Fire 2022, 31, 989–1001. [Google Scholar] [CrossRef]
  41. Barbosa, J.V.; Nunes, R.A.O.; Alvim-Ferraz, M.C.M.; Martins, F.G.; Sousa, S.I.V. Health and economic burden of wildland fires PM2.5-related pollution in Portugal—A longitudinal study. Environ. Res. 2024, 240, 117490. [Google Scholar] [CrossRef] [PubMed]
  42. Adame, J.A.; Lope, L.; Hidalgo, P.J.; Sorribas, M.; Gutiérrez-Álvarez, I.D.; del Águila, A.; Saiz-Lopez, A.; Yela, M. Study of the exceptional meteorological conditions, trace gases and particulate matter measured during the 2017 forest fire in Doñana Natural Park, Spain. Sci. Total Environ. 2018, 645, 710–720. [Google Scholar] [CrossRef] [PubMed]
  43. Oliveira, M.; Delerue-Matos, C.; Pereira, M.C.; Morais, S. Environmental Particulate Matter Levels during 2017 Large Forest Fires and Megafires in the Center Region of Portugal: A Public Health Concern? Int. J. Environ. Res. Public Health 2020, 17, 1032. [Google Scholar] [CrossRef] [PubMed]
  44. Castagna, J.; Senatore, A.; Bencardino, M.; Mendicino, G. Concurrent influence of different natural sources on the particulate matter in the central mediterranean region during a wildfire season. Atmosphere 2021, 12, 144. [Google Scholar] [CrossRef]
  45. Tarín-Carrasco, P.; Augusto, S.; Palacios-Peña, L.; Ratola, N.; Jiménez-Guerrero, P. Impact of large wildfires on PM10 levels and human mortality in Portugal. Nat. Hazards Earth Syst. Sci. 2021, 21, 2867–2880. [Google Scholar] [CrossRef]
  46. Barros, B.; Oliveira, M.; Morais, S. Air Pollution and Health Impacts of Wildfire Seasons: Insights from Northern Portugal. Water Air Soil Pollut. 2025, 236, 406. [Google Scholar] [CrossRef]
  47. Sopčić, S.; Godec, R.; Prskalo, H.; Pehnec, G. Impact of a Summer Wildfire Episode on Air Quality in a Rural Area Near the Adriatic Coast. Fire 2025, 8, 299. [Google Scholar] [CrossRef]
  48. Salis, M.; Arca, B.; Del Giudice, L.; Palaiologou, P.; Alcasena-Urdiroz, F.; Ager, A.; Fiori, M.; Pellizzaro, G.; Scarpa, C.; Schirru, M.; et al. Application of simulation modeling for wildfire exposure and transmission assessment in Sardinia, Italy. Int. J. Disaster Risk Reduct. 2021, 58, 102189. [Google Scholar] [CrossRef]
  49. Nudda, G.; Botti, P.; Tola, F.; Chessa, M.; Diana, G.; Cocco, S.; Masnata, C.; Delogu, G.; Giannasi, M.P.; Mavuli, S.; et al. Rapporto sugli Incendi Boschivi e Rurali in Sardegna. Anno 2014; Regione Autonoma Della Sardegna–Assessorato Alla Difesa dell’Ambiente: Cagliari, Italy; Centro Euro-Mediterraneo sui Cambiamenti Climatici: Lecce, Italy, 2015; p. 74. [Google Scholar]
  50. Nudda, G.; Botti, P.; Tola, F.; Chessa, M.; Diana, G.; Cocco, S.; Masnata, C.; Congiu, F.; Delogu, G.; Giannasi, M.P.; et al. Rapporto sugli Incendi Boschivi e Rurali in Sardegna. Anno 2015; Regione Autonoma Della Sardegna–Assessorato Alla Difesa dell’Ambiente: Cagliari, Italy, 2016; p. 80. [Google Scholar]
  51. Nudda, G.; Botti, P.; Tola, F.; Chessa, M.; Diana, G.; Cocco, S.; Masnata, C.; Congiu, F.; Delogu, G.; Giannasi, M.P.; et al. Rapporto sugli Incendi Boschivi e Rurali in Sardegna. Anno 2016; Regione Autonoma Della Sardegna–Assessorato Alla Difesa dell’Ambiente: Cagliari, Italy, 2017; 211p. [Google Scholar]
  52. UDS_2008—Sardinia Land Use Map 2008. Carta Uso Suolo 2008. Sardegna Geoportale. Available online: https://www.sardegnageoportale.it/index.php?xsl=2420&s=40&v=9&c=14480&es=6603&na=1&n=100&esp=1&tb=14401 (accessed on 17 April 2026).
  53. EEA 2012—Corine Land Cover (2012). Available online: https://www.eea.europa.eu/data-and-maps/data/clc-2012-raster/link (accessed on 17 April 2026).
  54. Malinowski, R.; Lewiński, S.; Rybicki, M.; Gromny, E.; Jenerowicz, M.; Krupiński, M.; Nowakowski, A.; Wojtkowski, C.; Krupinski, M.; Krätzschmar, E.; et al. Automated production of a land cover/use map of Europe based on Sentinel-2 imagery. Remote Sens. 2020, 12, 3523. [Google Scholar] [CrossRef]
  55. ARPAS Air Quality Monitoring Stations. Available online: https://portal.sardegnasira.it/ricerca-stazioni-di-misura (accessed on 17 April 2026).
  56. UNI EN 12341:2014; Aria ambiente—Metodo gravimetrico di riferimento per la determinazione della concentrazione in massa di particolato sospeso PM10 o PM2.5. UNI: Rome, Italy, 2014.
  57. Legislative Decree 2 April 2002, n. 60. Available online: https://www.normattiva.it/atto/caricaDettaglioAtto?atto.dataPubblicazioneGazzetta=2002-04-13&atto.codiceRedazionale=002G0089&tipoDettaglio=originario (accessed on 17 April 2026).
  58. Tukey, J. Exploratory Data Analysis; Addison-Wesley Pub. Co.: Reading, MA, USA, 1977. [Google Scholar]
  59. Dallah, D.; Sulieman, H.; Al Zaatreh, A.; Kamalov, F. Empirical Evaluation of the Relative Range for Detecting Outliers. Entropy 2025, 27, 731. [Google Scholar] [CrossRef] [PubMed]
  60. WetterZentrale. Available online: https://www.wetterzentrale.de/ (accessed on 17 April 2026).
  61. European Commission; Joint Research Centre; San-Miguel-Ayanz, J.; Durrant, T.; Boca, R.; Maianti, P.; Libertà, G.; Oom, D.; Branco, A.; De Rigo, D.; et al. Advance Report on Forest Fires in Europe, Middle East and North Africa 2024; Publications Office of the European Union: Luxembourg, 2025; Available online: https://data.europa.eu/doi/10.2760/1264626 (accessed on 17 April 2026).
  62. Stein, A.F.; Draxler, R.R.; Rolph, G.D.; Stunder, B.J.B.; Cohen, M.D.; Ngan, F. NOAA’s HYSPLIT atmospheric transport and dispersion modeling system. Bull. Am. Meteorol. Soc. 2015, 96, 2059–2077. [Google Scholar] [CrossRef]
  63. Miranda, A.I.; Marchi, E.; Ferretti, M.; Millan, M.M. Forest fires and air quality issues in Southern Europe. Dev. Environ. Sci. 2008, 8, 209–231. [Google Scholar] [CrossRef]
  64. Draxler, R.R. The use of global and mesoscale meteorological model data to predict the transport and dispersion of tracer plumes over Washington, DC. Weather Forecast. 2006, 21, 383–394. [Google Scholar] [CrossRef]
  65. Almeida, M.; Ribeiro, L.M.; Alves, D.; Viegas, D.; Pinto, V.V.; Marques, R.; Gomes, A.; Ballereau, D.; Lahaye, S.; Matile, R.; et al. 2023 Analysis of 2021 Critical Wildfire Events in the Mediterranean Region; EUR 31638 EN; Publications Office of the European Union: Luxembourg, 2023. [Google Scholar] [CrossRef] [PubMed]
  66. Pinna, M.T.; Cuccu, M.G.; Giannasi, M.P.; Casula, A.; Cabiddu, S. The 2021 Montiferru Wildfire, Sardinia (Italy): Analysis of a Large Wildfire. Environ. Sci. Proc. 2022, 17, 108. [Google Scholar] [CrossRef]
  67. Potter, B.E.; Winkler, J.A.; Wilhelm, D.F.; Shadbolt, R.P.; Bian, X. Computing the low-elevation variant of the Haines index for fire weather forecasts. Weather Forecast. 2008, 23, 159–167. [Google Scholar] [CrossRef][Green Version]
  68. Paugam, R.; Wooster, M.; Freitas, S.; Val Martin, M. A review of approaches to estimate wildfire plume injection height within large-scale atmospheric chemical transport models. Atmos. Chem. Phys. 2016, 16, 907–925. [Google Scholar] [CrossRef]
  69. Paschalidou, A.K.; Kassomenos, P.A. What are the most fire-dangerous atmospheric circulations in the Eastern-Mediterranean? Analysis of the synoptic wildfire climatology. Sci. Total Environ. 2016, 539, 536–545. [Google Scholar] [CrossRef] [PubMed]
  70. Duane, A.; Brotons, L. Synoptic weather conditions and changing fire regimes in a Mediterranean environment. Agric. For. Meteorol. 2018, 253, 190–202202. [Google Scholar] [CrossRef]
  71. Lavoué, D.; Liousse, C.; Cachier, H.; Stocks, B.J.; Goldammer, J.G. Modeling of carbonaceous particles emitted by boreal and temperate wildfires at northern latitudes. J. Geohys Res. 2000, 105, 26871–26890. [Google Scholar] [CrossRef]
  72. Trentmann, J.; Andreae, M.O.; Graf, H.F.; Hobbs, P.V.; Ottmar, R.D.; Trautmann, T. Simulation of a biomass-burning plume: Comparison of model results with observations. J. Geophys. Res. 2002, 107, AAC 5-1–AAC 5-15. [Google Scholar] [CrossRef]
  73. Trentmann, J.; Luderer, G.; Winterrath, T.; Fromm, M.D.; Servranckx, R.; Textor, C.; Herzog, M.; Graf, H.F.; Andreae, M.O. Modeling of biomass smoke injection into the lower stratosphere by a large forest fire (Part I): Reference simulation. Atmos. Chem. Phys. 2006, 6, 5247–5260. [Google Scholar] [CrossRef]
  74. Andreae, M.O.; Merlet, P. Emission of trace gases and aerosols from biomass burning. Glob. Biogeochem. Cycles 2001, 15, 955–966. [Google Scholar] [CrossRef]
  75. Freitas, S.R.; Longo, K.M.; Trentmann, J.; Latham, D. Sensitivity of 1-D smoke plume rise models to the inclusion of environmental wind drag. Atmos. Chem. Phys. 2010, 10, 585–594. [Google Scholar] [CrossRef]
  76. Val Martin, M.; Logan, J.A.; Kahn, R.A.; Leung, F.Y.; Nelson, D.L.; Diner, D.J. Smoke injection heights from fires in North America: Analysis of 5 years of satellite observations. Atmos. Chem. Phys. 2010, 10, 1491–1510. [Google Scholar] [CrossRef]
  77. Kahn, R.A.; Li, W.H.; Moroney, C.; Diner, D.J.; Martonchik, J.V.; Fishbein, E. Aerosol source plume physical characteristics from space-based multiangle imaging. J. Geohys Res. 2007, 112, D11205. [Google Scholar] [CrossRef]
  78. Val Martin, M.; Kahn, R.A.; Logan, J.A.; Paugam, R.; Wooster, M.; Ichoku, C. Space-based observational constraints for 1-D fire smoke plume-rise models. J. Geohys Res. 2012, 117, D22204. [Google Scholar] [CrossRef]
  79. Freitas, S.R.; Longo, K.M.; Chatfield, R.; Latham, D.; Silva Dias, M.A.F.D.; Andreae, M.O.; Prins, E.; Santos, J.C.; Gielow, R.; Carvalho, J.A., Jr. Including the sub-grid scale plume rise of vegetation fires in low resolution atmospheric transport models. Atmos. Chem. Phys. 2007, 7, 3385–3398. [Google Scholar] [CrossRef]
  80. Legislative Decree 13 August 2010, n. 155. Available online: https://www.normattiva.it/uri-res/N2Ls?urn:nir:stato:decreto.legislativo:2010;155 (accessed on 17 April 2026).
  81. European Parliament. Directive 2008/50/EC of the European Parliament and of the Council of 21 May 2008 on ambient air quality and cleaner air for Europe. Off. J. Eur. Union 2008, 152, 1–44. [Google Scholar]
  82. World Health Organization. WHO Global Air Quality Guidelines: Particulate Matter (PM2.5 and PM10), Ozone, Nitrogen Dioxide, Sulfur Dioxide and Carbon Monoxide; World Health Organization: Geneva, Switzerland, 2021. [Google Scholar]
  83. Duarte, R.M.; Duarte, A.C. Health Effects of Urban Atmospheric Aerosols. Atmosphere 2023, 14, 309. [Google Scholar] [CrossRef]
  84. Gidarakou, M.; Papayannis, A.; Mylonaki, M.; Kralli, E.; Eleftheratos, K.; Fountoulakis, I.; Zografou, O.; Diapouli, E.; Gini, M.I.; Vratolis, S.; et al. Exceptional wildfire smoke over Greece in summer 2023: A synergistic study of aerosol optical-microphysical and UVB radiative impacts. Atmos. Chem. Phys. 2026, 26, 4313–4339. [Google Scholar] [CrossRef]
  85. Burke, M.; Childs, M.L.; de la Cuesta, B.; Qiu, M.; Li, J.; Gould, C.F.; Heft-Neal, S.; Wara, M. The contribution of wildfire to PM2.5 trends in the USA. Nature 2023, 622, 761–766. [Google Scholar] [CrossRef] [PubMed]
  86. Arpa Sardegna. Available online: https://www.sar.sardegna.it/pubblicazioni/notetecniche/nota2/pag004.asp (accessed on 17 April 2026).
  87. Salis, M.; Ager, A.A.; Finney, M.A.; Arca, B.; Spano, D. Analyzing spatiotemporal changes in wildfire regime and exposure across a Mediterranean fire-prone area. Nat. Hazards 2014, 71, 1389–1418. [Google Scholar] [CrossRef]
  88. Lopes, D.; Menezes, I.C.; Reis, J.; Coelho, S.; Almeida, M.; Viegas, D.X.; Borrego, C.; Miranda, A.I. The Short-Term Impacts of the 2017 Portuguese Wildfires on Human Health and Visibility: A Case Study. Fire 2024, 7, 342. [Google Scholar] [CrossRef]
  89. FIRMS—Fire Information for Resource Management System. Available online: https://firms.modaps.eosdis.nasa.gov/ (accessed on 17 April 2026).
  90. JSTAR Mapper. Available online: https://www.star.nesdis.noaa.gov/jpss/mapper/ (accessed on 29 April 2026).
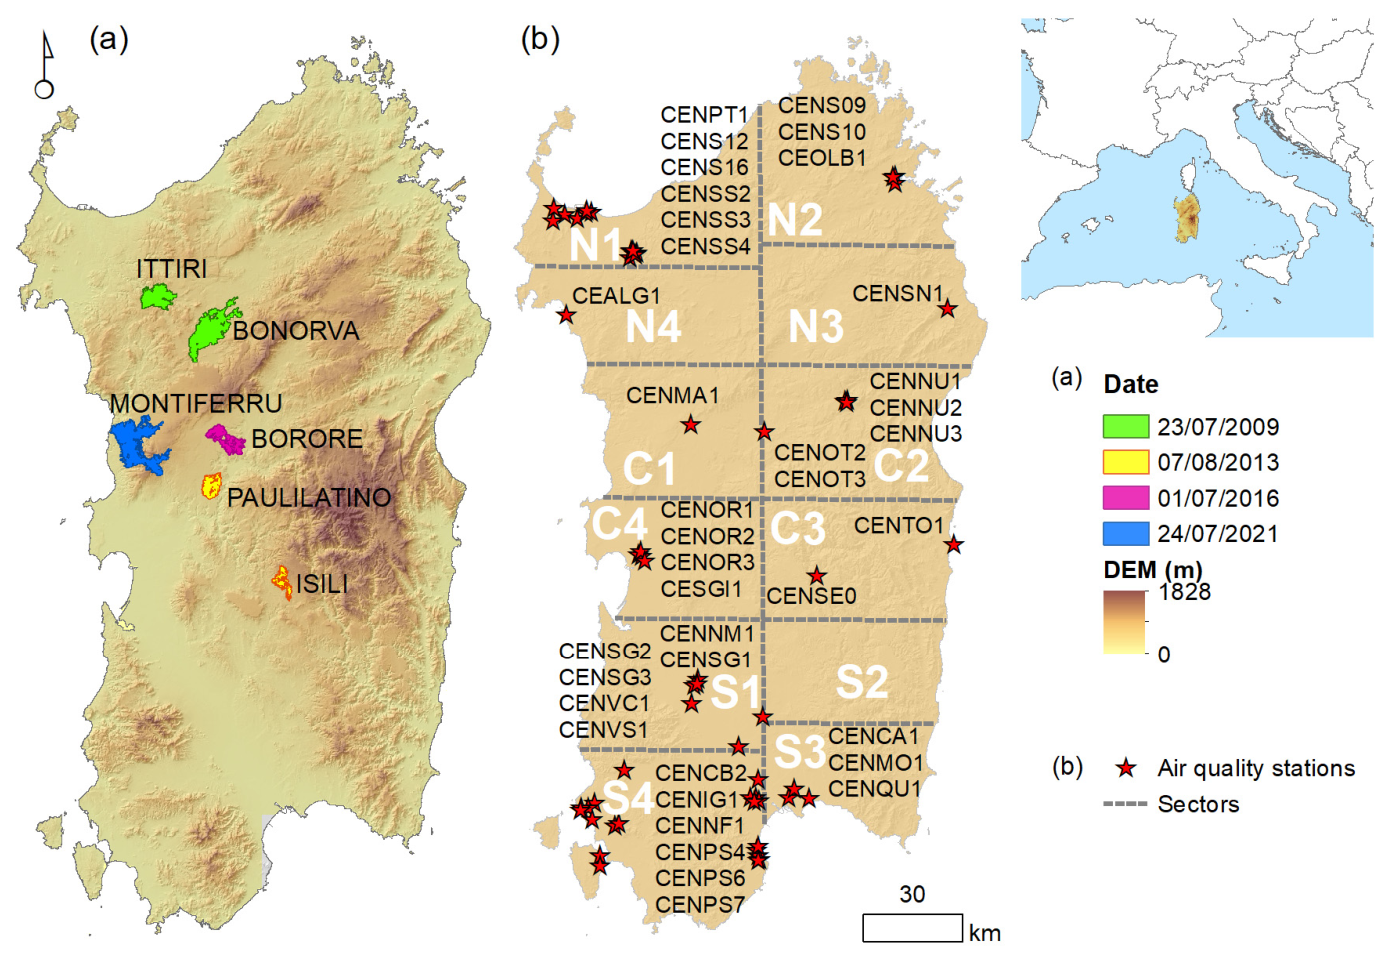
Figure 1. (a) Location of the six large fires and their burning areas; (b) location of air quality stations (red stars) of the air quality control network of the Regional Environment Protection Agency of Sardinia identified by their station names, and divided by sectors (gray dashed lines). Codes in white represent the northern (N1, N2, N3, N4), central (C1, C2, C3, C4), and southern sectors (S1, S2, S3, S4) of the island. Codes in black are the names of the stations located in each sector.
Fire 09 00317 g001
Figure 2. Final fire perimeter and land use classes before the event: Montiferru (a); Bonorva (b); Isili (c); Borore (d); Ittiri (e); Paulilatino (f). The main villages and towns in the proximity of the event are in black (anthropic).
Fire 09 00317 g002
Figure 3. Air temperatures (in °C) at 850 hPa (about 1500 km above the sea level) during the six investigated fires, for the day before the event—on the left, the day of the fires—on the center, and the day before the fire event—on the right: (a) Bonorva and Ittiri—22–24 July 2009; (b) Isili and Paulilatino—6–7 August 2013; (c) Borore—30 June–2 July 2016; (d) Montiferru—23–25 July 2021. In the light blue circle, the location of the island of Sardinia. Images were obtained from Wetterzentrale [58].
Fire 09 00317 g003
Figure 4. Fire plume trajectories and probable particulate depositions for the first (a) and the second day (b) of the Ittiri fire. Circled symbols indicate the possible location of particulate deposition.
Fire 09 00317 g004
Figure 5. Fire plume trajectories and probable particulate depositions for the first (a) and the second day (b) of the Bonorva fire. Circled symbols indicate the possible location of particulate deposition.
Fire 09 00317 g005
Figure 6. Fire plume trajectories and probable particulate depositions for the first (a) and the second day (b) of the Isili fire. Circled symbols indicate the possible location of particulate deposition.
Fire 09 00317 g006
Figure 7. Fire plume trajectories and probable particulate depositions for the first (a) and the second day (b) of the Paulilatino fire. Circled symbols indicate the possible location of particulate deposition.
Fire 09 00317 g007
Figure 8. Fire plume trajectories and probable particulate depositions for the first (a) and the second day (b) of the Borore fire. Circled symbols indicate the possible location of particulate deposition.
Fire 09 00317 g008
Figure 9. Fire plume trajectories and probable particulate depositions for the first (a) and the second day (b) of the Montiferru fire. Circled symbols indicate the possible location of particulate deposition.
Fire 09 00317 g009
Table 1. Total burned area and vegetation composition (percentages) classified into land-cover categories for each fire event.
(ha)(%)
Fire NameTotal Area BurnedBroadleavesConifersCultivated AreasGrasslands and PasturesMixed ForestShrublands
Bonorva10,550.219.30.164.510.3 5.8
Ittiri5130.74.6 47.034.8 13.6
Isili2124.814.630.47.714.70.831.8
Paulilatino3010.11.2 52.929.0 16.8
Borore4287.90.0 66.224.4 9.4
Montiferru12,543.826.94.812.827.8 27.8
Table 2. PM10 concentration (µg/m3 d−1) detected by the air quality stations, identified by their station names, for the Bonorva and Ittiri fires and standard deviation values for the period: 21 July–26 July 2009. Fire icons indicate days when the fires were active. In bold and italic, the data of the day before the events. The values underlined identify an increase in PM10 compared to the day before the fire greater than the standard deviation value; * indicates PM10 concentration values higher than 85° percentile; ** identify PM10 concentration values classified as an anomaly according IQR method.
Sardinian Quadrants and Station Names
N1
DAYCENPT1CENSS03CENSS04CENSS12CENSS13
21 July 2009 37.20 19.50
22 July 200910.908.6011.9010.908.10
Fire 09 00317 i00123 July 200911.308.507.808.808.70
Fire 09 00317 i00124 July 200914.2012.109.7011.508.90
25 July 200918.0015.80 *14.3011.6013.40
26 July 200928.0030.4012.0010.60
StdDev July–August5.36.73.71.44.8
N1N2
DAYCENSS16CENSS17CENSS2CENS10CEOLB1
21 July 200916.80 26.0033.50
22 July 200912.009.1811.9010.7010.50
Fire 09 00317 i00123 July 200911.406.126.2013.7013.70
Fire 09 00317 i00124 July 200915.9012.009.8010.7022.00
25 July 200915.3011.2414.9014.3013.10
26 July 200926.80 7.4046.6041.30
StdDev July–August7.02.84.47.37.4
Table 3. PM10 concentration (µg/m3 d−1) detected by the air quality stations, identified by their station names, for the Isili and Paulilatino fires and standard deviation values for the period: 5 August–10 August 2013. Fire icons indicate days when the fires were active. In bold and italic, the day before the fire events; The values underlined identify an increase in PM10 compared to the day before the fire greater than the standard deviation value; * indicates PM10 concentration values higher than 85° percentile; ** identifies PM10 concentration values classified as an anomaly according to the IQR method.
Sardinian Quadrants and Station Names
N2N3C2C3
DAYCENS10CEOLB1CENSN1CENNU1CENNU2CENOT3CENSE0
5 August 201337.00 16.7816.1613.6113.6013.48
6 August 201323.2015.9014.1125.7617.9516.5016.02
Fire 09 00317 i0017 August 201324.2017.8022.78 *27.6124.70 *33.40 **19.78
Fire 09 00317 i0018 August 201326.8933.4628.36 **52.52 **38.45 **45.30 **32.43 **
9 August 201324.79 15.0515.3618.0910.1014.36
10 August 201340.1030.1011.8319.3519.4216.1019.39
StdDev
July–August
11.913.64.05.54.75.24.2
Table 4. PM10 concentration (µg/m3 d−1) detected by the air quality stations, identified by their station names, for the Borore fire and standard deviation values for the period: 29 June–4 July 2016. Fire icons indicate days when the fire was active. In bold and italic, the day before the fire event. The values underlined identify an increase in PM10 compared to the day before the fire greater than the standard deviation value; * indicates PM10 concentration values higher than 85° percentile; ** identifies PM10 concentration values classified as an anomaly according to the IQR method.
Sardinian Quadrants and Station Names
CIC2C3
DAYCENMA1CENNU1CENNU2CENOT3CENSE0
29 June 20168.6019.259.6412.2013.30
30 June 201611.3019.928.5914.3014.80
Fire 09 00317 i0011 July 201616.10 *20.0513.0018.1018.20
Fire 09 00317 i0012 July 201618.60 *13.8411.5323.70 **32.30 **
3 July 201611.0014.1611.0617.6021.20
4 July 201612.1012.989.9013.009.40
StdDev June–July3.34.85.63.75.3
Table 5. PM10 concentration (µg/m3 d−1) detected by the air quality stations, identified by their station names, for the Montiferru fire and standard deviation values for the period: 22–27 July 2021. Fire icons indicate days when the fires were active. In bold and italic, the day before the event. The values underlined identify an increase in PM10 compared to the day before the fire greater than the standard deviation value; * indicates PM10 concentration values higher than 85° percentile, ** identifies PM10 concentration values classified as an anomaly according to the IQR method.
Sardinian Quadrants and Station Names
N1N2
DAYCENPT1CENSS03CENSS04CENSS12CENSS16CENSS2CENS10CEOLB1
22 July 202116.9019.6017.5012.6023.9012.6012.8013.90
23 July 202115.0015.9015.0014.9023.3015.4014.3012.80
Fire 09 00317 i00124 July 202123.8021.9018.2029.6033.0020.7018.1019.80
Fire 09 00317 i00125 July 202136.60 **27.10 *26.70 *37.20 **54.60 **27.80 *29.70 *29.40 *
26 July 202138.90 **22.3025.40 * 50.30 **25.10 *30.00 *28.70 *
27 July 202124.7022.0020.0019.4035.7017.7028.9028.70
StdDev July–August6.55.65.19.113.36.28.78.0
N3N4C1C2C3
DAYCENSN1CEALG1CENMA1CENNU1CENNU2CENOT3CENSE0
22 July 202121.98 11.609.0817.6320.8013.00
23 July 202116.3713.4016.5010.3223.7121.7012.90
Fire 09 00317 i00124 July 202121.8229.3023.0042.72 **23.3621.6010.70
Fire 09 00317 i00125 July 202130.6536.40 ** 43.6437.2031.30
26 July 202143.76 *32.10 *45.80 **48.82 **56.14 *44.50 *34.40
27 July 202136.8922.3026.4026.0542.0630.5027.30
StdDev July–August8.78.320.416.021.119.423.3
Disclaimer/Publisher’s Note: The statements, opinions and data contained in all publications are solely those of the individual author(s) and contributor(s) and not of MDPI and/or the editor(s). MDPI and/or the editor(s) disclaim responsibility for any injury to people or property resulting from any ideas, methods, instructions or products referred to in the content.