Article

Fire Spread Simulation Modeling to Assess Wildfire Hazard and Exposure to Communities in Northern Iran


1
Faculty of Agriculture and Natural Resources, University of Mohaghegh Ardabili, Ardabil 56199-11367, Iran
2
National Research Council of Italy, Institute of BioEconomy (CNR IBE), 07100 Sassari, Italy
*
Author to whom correspondence should be addressed.
Fire 2026, 9(4), 176; https://doi.org/10.3390/fire9040176
Submission received: 28 January 2026 / Revised: 10 April 2026 / Accepted: 16 April 2026 / Published: 21 April 2026
(This article belongs to the Special Issue The Impact of Wildfires on Climate, Air Quality, and Human Health)

Abstract

We analyzed wildfire hazard profiles across the Hyrcanian temperate forests of northern Iran (Guilan Province) by simulating a large set of wildfires with FlamMap MTT. We first derived geospatial data on terrain, fuel models, weather conditions, and historical wildfire occurrence (1992–2022) for the study area. We stratified fire weather conditions and fuel moisture based on the bioclimatic classification of the study area, considering observed extreme fire weather, as well as observed and random fire ignition locations for the simulations. The wildfire simulations were used to estimate burn probability (BP), conditional flame length (CFL), fire size (FS), and crown fire probability (CFP). BP ranged from 0 to 5.0 × 10⁻², with mean values of 1.3 × 10⁻³ and 1.1 × 10⁻³ for observed and random scenarios, respectively. The mean value of CFL from random ignition simulations (0.78 m) was substantially higher than that obtained in the observed ignition simulations (0.54 m), ranging from 0 to 6.75 m. We evidenced significant differences between observed and random ignition simulations for all wildfire hazard metrics. The highest wildfire hazard profiles were observed in the Cold-Mountainous bioclimatic zone under the random ignition simulations. On average, the annual number of anthropic structures threatened by wildfires ranged from 97 (observed scenario) to 123 (random scenario). This research provides detailed and spatially explicit fire hazard and exposure maps to inform fire modeling, land management, and policy actions.

1. Introduction

Wildfires represent one of the main natural disturbances affecting forest and rural ecosystems around the globe. The multiple roles of wildfires largely vary across time and space, as they can regulate ecosystem processes, shape the pathways of ecological composition, structure, and function, and affect the interactions between environmental and human systems [1,2]. Wildfires occur when three conditions are met: a source of ignition, available fuels, and weather conditions that favor fire spread [3]. After the ignition, propagation and behavior of wildfires are affected by numerous complex interactions among weather, fuel properties and conditions, and topography [4,5]. Within these factors, weather conditions are the most fluctuating element and can affect short-term wildfire behavior and likelihood [6,7]. The links between weather elements and fire spread and behavior have been extensively researched [8,9]. Understanding fire–weather relations is of crucial importance for forest and wildfire risk management, especially considering current and future climate changes and the rise in extreme wildfire occurrences [10,11]. Wildfires are also highly dependent on spatial ignition patterns, which influence, for instance, burn probability, landscape proneness, and the exposure of values to fires [12,13]. A number of studies investigated the impact of ignition patterns on wildfire spread and behavior across different regions and indicated that the ignition density and probability layers can significantly impact the spatial forecasts of wildfire spread and behavior simulations [14,15,16,17,18].
Wildfire spread modeling studies have analyzed, at numerous spatial scales and for different ecosystems and fuel types, how past, current, and future conditions influence wildfire hazard [19,20,21,22]. Nowadays, there are several models and simulators available that focus on wildfire behavior [23,24,25,26,27]. Recent developments in assessing wildfire hazard have been achieved through the application of fire spread models [28,29,30,31], including the minimum travel time (MTT) algorithm-based models [32], which is an efficient fire simulation algorithm capable of modeling thousands of fires over extensive regions [22,33]. The MTT algorithm is also integrated into the FlamMap modeling system [26], which is utilized to forecast and assess the spatial variability of wildfire behavior while maintaining uniform environmental conditions throughout a landscape or to investigate how fire weather scenarios impact wildfire behavior [34,35,36].
The MTT algorithm was also implemented through some case studies in temperate forests to quantify landscape-level hazard components of wildfire risk [37,38], climate change influences on wildfire hazards [39,40], and the effects of fuel treatments on fire hazard [41,42,43]. Although wildfires play critical roles in shaping temperate forest ecosystems, and their activity is expected to rise around the globe in response to climate change, fire hazard quantification and mapping in temperate regions have been relatively limited to a few studies. Moreover, primary data and information to enable comprehensive analysis in temperate forests are neither well known nor systematically collected [44,45], in some cases due to the lack of resources for the agencies responsible for forest management. Meanwhile, these forests serve as critical habitats for biodiversity and are crucial for delivering numerous ecosystem services [46].
To assess wildfire hazard in the temperate Hyrcanian forests of northern Iran, we simulated thousands of wildfire events across the landscape and bioclimatic zones under extreme fire weather and fuel moisture conditions. We examined the influence of observed versus random ignition locations on fire patterns, mapped the wildland–anthropic interface (WAI), and quantified wildfire exposure in these areas. This approach provides a tool for identifying key fire risk sources and informing mitigation strategies, offering insights applicable to landscape-level fire management in temperate forests.

2. Materials and Methods

2.1. Study Area

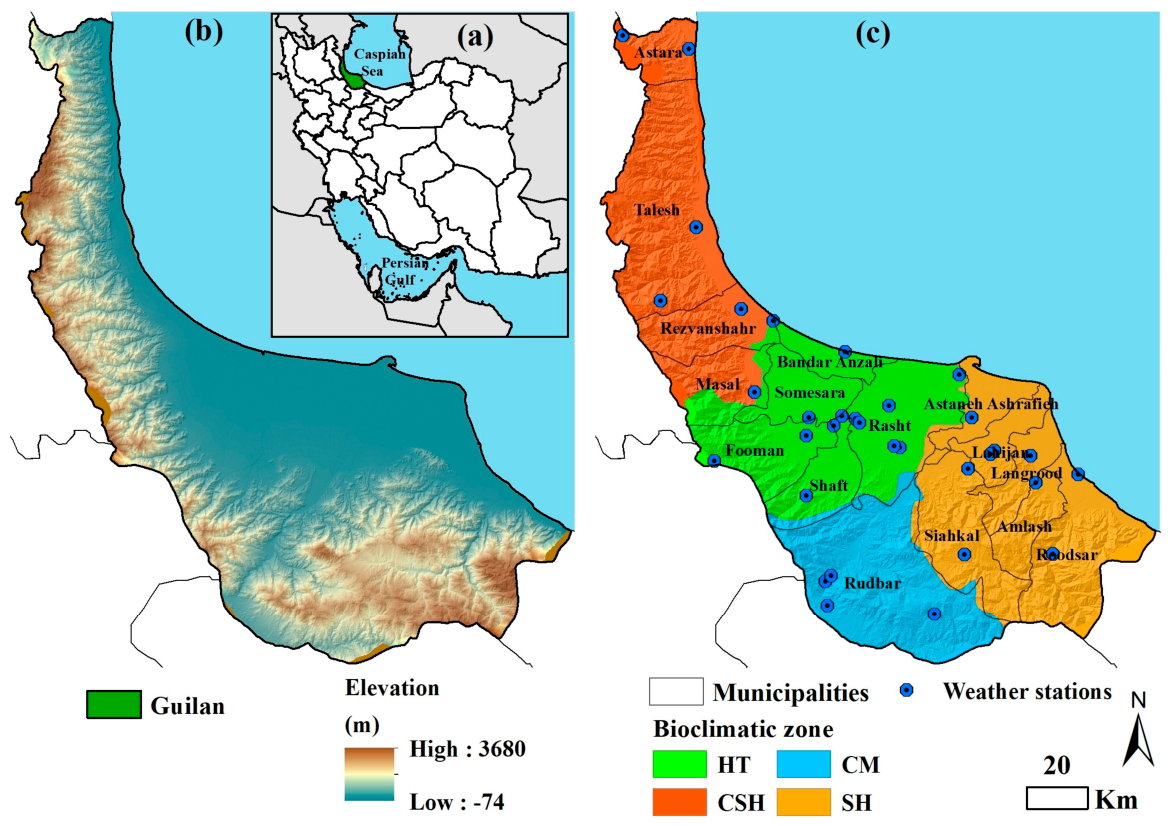
The Province of Guilan, situated in northern Iran and lying south of the Caspian Sea, constitutes around 1% of Iran’s total land area (14,044 km2, Figure 1a). The terrain elevation ranges from −74 m to 3680 m a.s.l. (Figure 1b). The temperate climate of the Province is influenced by the height and direction of Alborz and Talesh mountains, the proximity to the Caspian Sea, the movement of northern and western air masses, local winds (e.g., Garmij (Foehn winds)), and dense forest cover. The area has high atmospheric relative humidity due to its location near the Caspian Sea. The average annual temperature is approximately 16.5 °C and ranges from 15 °C in the south to 18 °C in the center. The annual rainfall in the study area is 1100 mm on average, with minimum values (240 mm) in the south and peaks of 1430 mm in the center. Based on differences in climate and topography features, the Province of Guilan was divided into the following four bio-climatic zones: Humid-Temperate (HT), Cold-Semi-Humid (CSH), Cold-Mountainous (CM), and Semi-Humid (SH) [47] (Figure 1c; Table 1).
On average, from 1992 to 2022, the study area experienced 70 wildfires per year. The overall burned area across the study area was about 25,600 ha, and the mean annual burned area was about 790 ha (Table 2). The SH zone experienced approximately 33% of the total fire ignitions, followed by the CSH (26%), HT (24%), and CM (17%) zones. For each zone, we obtained the ratio of burned area to fire number as a proxy to infer the flammability of the landscape over time [50]. The highest burned area/fire number ratio was observed in the CM zone (12.7), followed by the HT zone (12); the ratio for the whole study area was 11.3. For comprehensive information about the wildfire regime and activity in the study area, refer to Appendix A.1.1.

2.2. Input Data for Modeling

We gathered a set of geospatial data, such as topographic and Land Use and Land Cover (LULC) data, to be used for FlamMap MTT [24]. Topographic data were derived from 30 m SRTM DEM [51]. Aspect and slope maps were created from the DEM (using the Spatial Analyst Extension in ArcMap 10.8, ESRI).
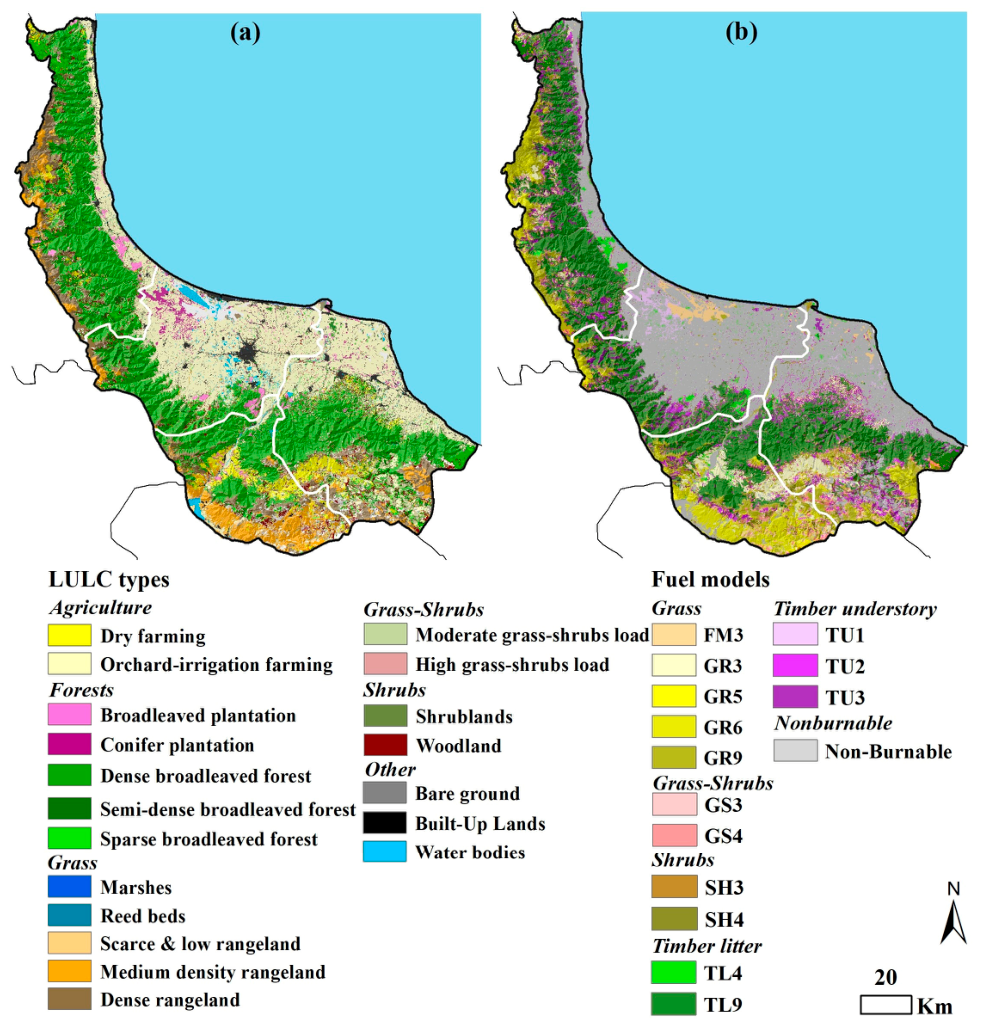
A total of 19 LULC types were first derived from satellite images (Landsat-8 OLI/TIRS L1TP for October 2021) and discriminated following the method described in Appendix A.1.2. After producing the LULC map, we developed the surface fuel model map (Figure 2b) by assigning either a custom fuel model [43,52] or one of the standard fuel models [53,54] to each LULC class in the study area. The corresponding surface fuel values and standard model assignments are listed in Table 3, which includes the 40 Fire Behavior Fuel Models (FBFM40) [53] and the 13 Fire Behavior Fuel Models (FBFM13) [54]. For custom fuel models, field data for each fuel parameter—surface fuel model, crown base height (m), and canopy height (m)—were collected following established protocols [43].
Additionally, the 2021 canopy cover (%) map was derived from Landsat-8 imagery through the application of the Forest Canopy Density (FCD) model in ENVI, a well-established approach that integrates vegetation indices and biophysical parameters to estimate canopy closure with improved accuracy over heterogeneous forest conditions.
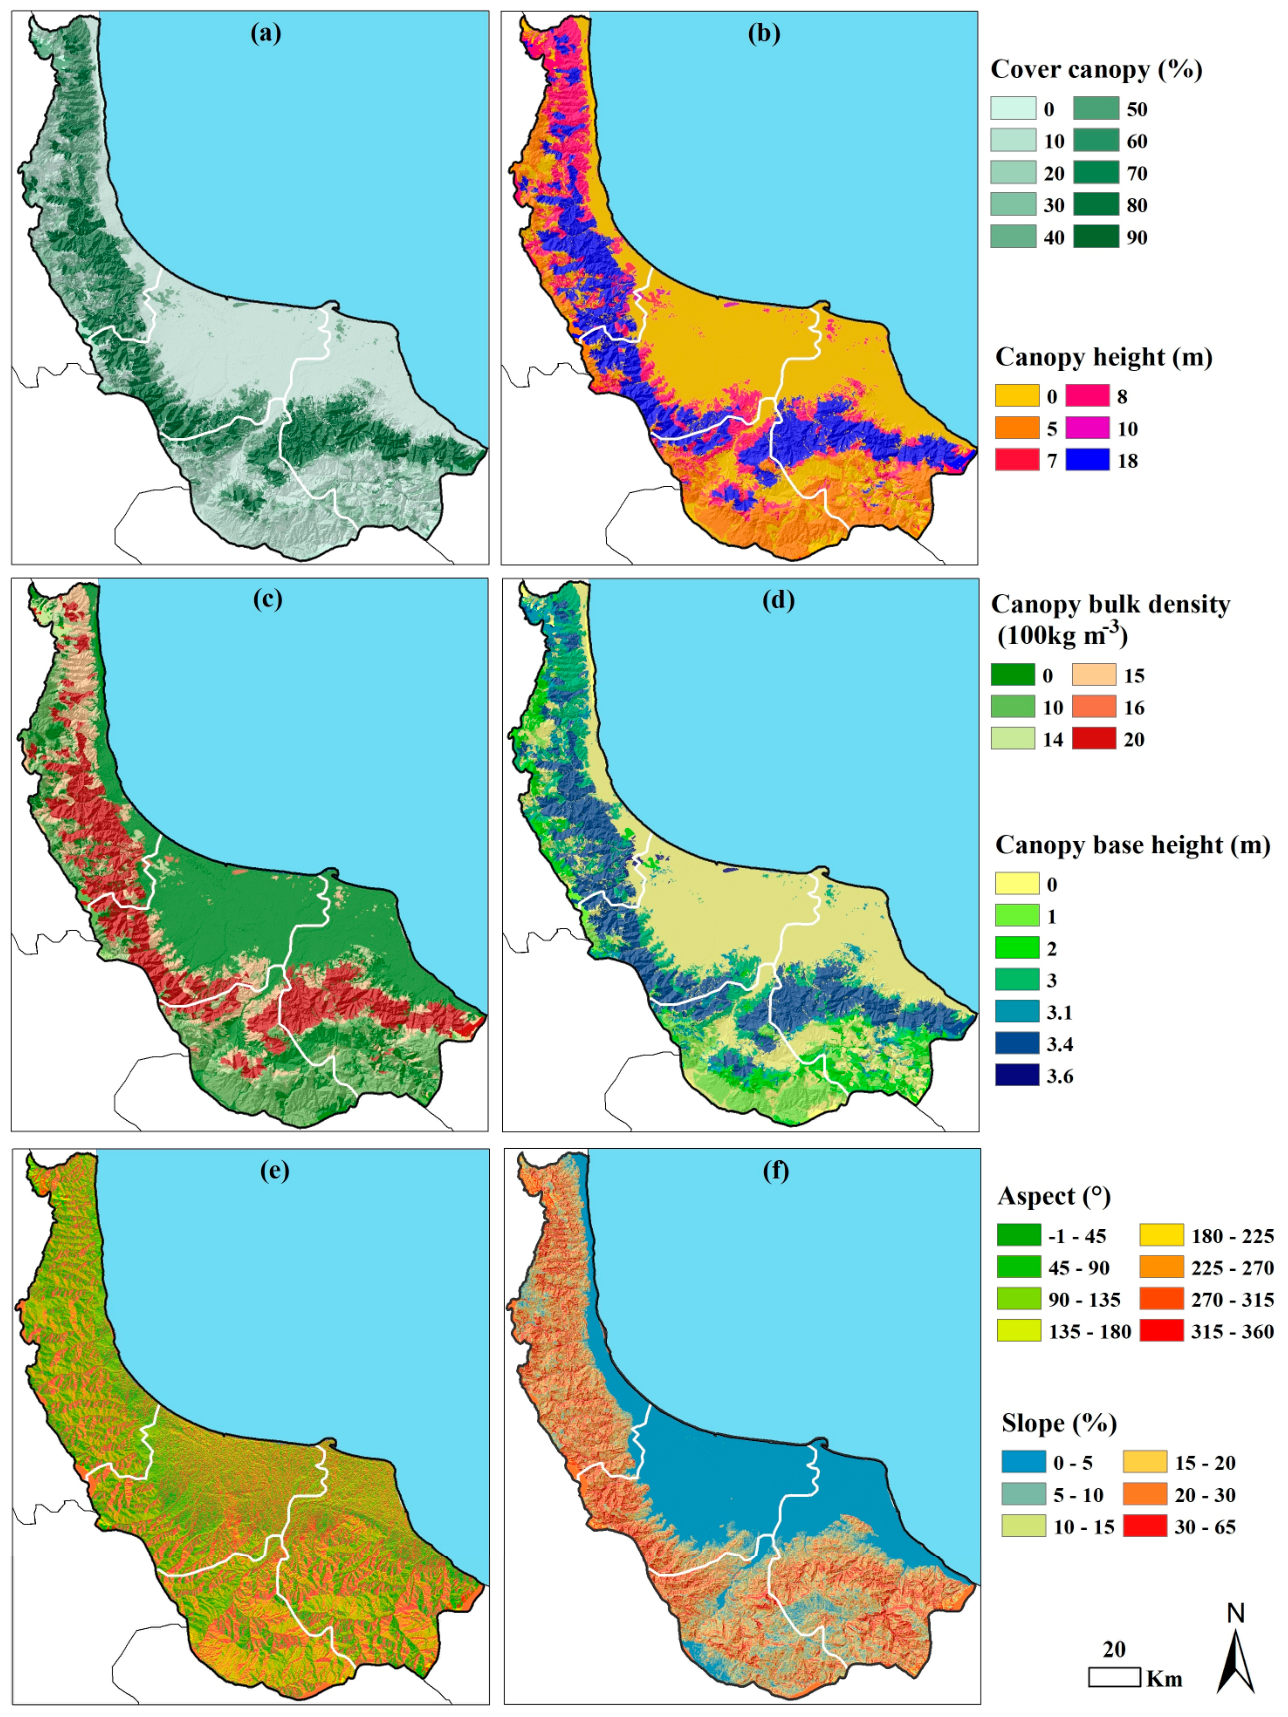
Although the DTM, land-cover, and canopy cover maps were originally derived at 30 m resolution, all layers were resampled to 100 m to ensure consistency with field-based fuel parameters and to maintain computational stability during FlamMap simulations. Accordingly, a landscape raster layer (LCP file) with 100 m resolution was then prepared as input for FlamMap, incorporating topography along with surface and canopy fuel characteristics (Figure A3 in Appendix A). This landscape file was kept constant across all simulation scenarios.

2.3. Fire Weather Conditions

To run FlamMap MTT, we generated a set of wind and fuel moisture files. We analyzed weather data for the most relevant months (December–February and June–August) of the wildfire season, considering gridded data and station observations for 1992–2022. We used daily weather records from local weather stations (Figure 1). The “meteoland 2.2.6.” software package was used in R [55] and offers a variety of tools for estimating daily weather conditions, both current and future. This package provides functionalities for (1) daily weather interpolation that considers topographic effects, and (2) bias correction for specific weather series (such as climate model outputs). Meteorological data spanning 31 years were interpolated at a spatial resolution of 1 km to match the spatial representativeness of meteorological observations and avoid introducing unsupported fine-scale variability. In contrast, terrain and fuel layers were maintained at 100 m resolution to capture landscape heterogeneity relevant to fire spread. Given the steady-state assumptions of FlamMap MTT, this resolution mismatch is not expected to significantly affect landscape-scale hazard patterns, although it may smooth fine-scale variability in fire behavior.
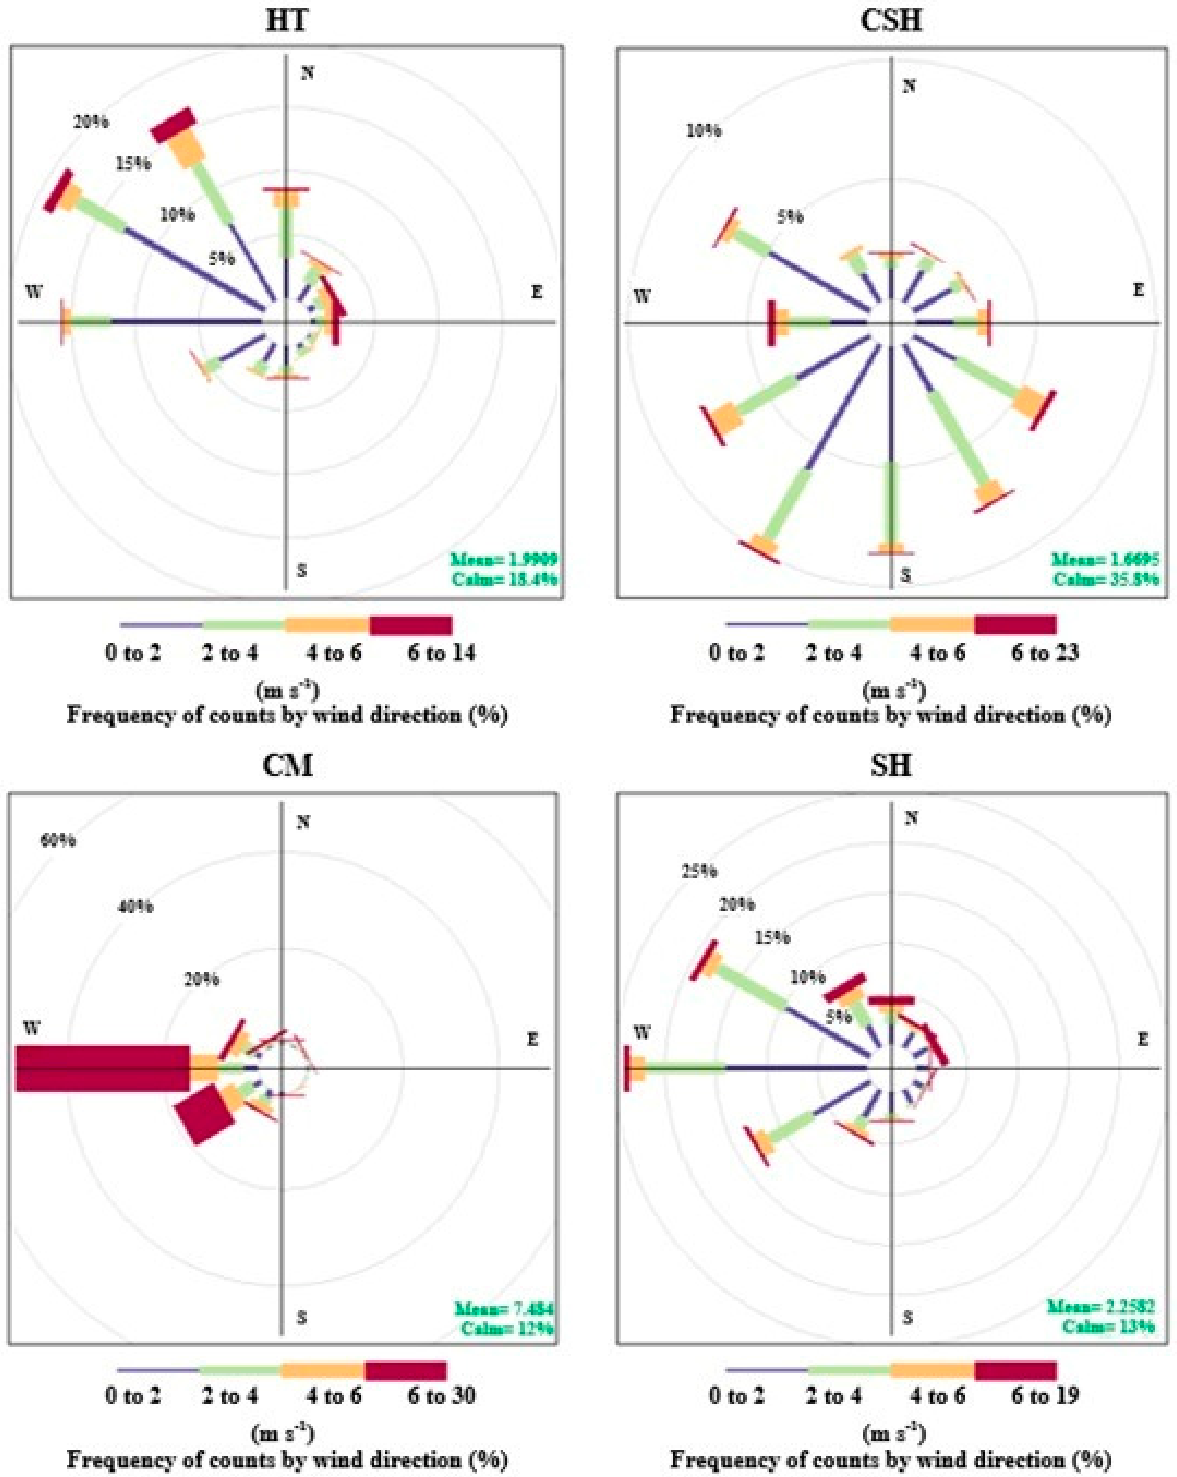
Additionally, fuel moisture was determined using the Nelson Dead Fuel Moisture Model [56] alongside the National Fire Danger Rating System (NFDRS) [57], with moisture values calculated for the three time-lag size classes of 1-h (0–0.63 cm), 10-h (0.63–2.54 cm), and 100-h (2.54–7.62 cm). Weather and fuel moisture parameters were calculated for all bioclimatic zones under extreme fire weather conditions (Table 4), which refer to the 97th percentile of historical NFDRS values. In other words, we replicated fire weather conditions linked to large wildfire incidents, which represented less than 10% of fire ignitions but accounted for over 70% of the total burned area during the study period. Additionally, prevailing wind conditions were specified in terms of speed and direction for each simulation scenario (Table 4; Figure A4 in Appendix A).

2.4. Wildfire Simulations

We used the MTT algorithm embedded in FlamMap to quantify and map wildfire hazard in the study area, with hazard defined as the likelihood and potential intensity of fire occurrence, as distinct from wildfire risk, which also includes exposure and vulnerability of assets. FlamMap models the interactions among fuels, weather, topography, and spatial patterns of ignition, and simulates fire behavior. The calibration of FlamMap was already done in the study area and presented in previous works [58,59]. These studies showed that the fires modeled corresponded well to observed fire behaviors, especially for herbaceous fuel types. Furthermore, the standard fuel models developed by Scott and Burgan [53] yielded more accurate simulated fires than those of Anderson [54].
FlamMap MTT was implemented using previously calibrated fuel models for the study area, combined with topographic and canopy inputs. Simulations were performed under extreme fire weather conditions, using 10,000 ignition points and a fixed burn duration of 6 h, assuming steady-state environmental conditions. This fixed fire duration reflects a standardized active burning period commonly observed for large fire events in the study area. Although fire duration can affect absolute fire size, the study aims to assess relative spatial hazard patterns under consistent assumptions. No sensitivity analysis of burn duration was conducted, and this is acknowledged as a limitation.
To assess the influence of spatial ignition patterns on fire predictions, empirical ignition data were used to generate an ignition probability grid, which was compared with a random ignition scenario. Two ignition scenarios were therefore developed to evaluate differences between historical and randomly assigned ignitions and their effects on wildfire hazard patterns, as well as to identify areas where human activities or natural sources may dominate ignition occurrence [14]. Based on historical ignition records across the study area, an observed (OBS) annual ignition density grid was derived following the method described in Appendix A.1.1. In parallel, a random (RND) ignition grid was generated by uniformly distributing ignition points across all burnable cells without weighting by landscape factors such as fuel type or elevation. This RND scenario represents an unbiased spatial distribution of ignitions and serves as a baseline for comparison with the observed ignition pattern.
For both OBS and RND ignition grids, we simulated 10,000 wildfire events and maintained a constant burning duration of 6 h, which corresponds to the usual duration of substantial fire sizes observed in the study area. In this context, FlamMap MTT simulations work under steady-state assumptions (meaning environmental conditions stay the same for each event during the simulation) and cannot account for the dynamic changes in wildfire behavior and spread that may result from fluctuations in weather and fuel moisture.
Under extreme weather conditions (Table 3), for the OBS and RND scenarios, we estimated a set of wildfire hazard metrics, including burn probability (BP), conditional flame length (CFL, m), fire size (FS, ha), and crown fire probability (CFP). All wildfire simulations were performed at 100 m resolution while considering steady weather and fuel moisture conditions for each simulated event. Fire suppression activities affecting fire duration and size were not considered.

2.5. Wildland–Anthropic Interface (WAI) Mapping

The wildland–anthropic interface (WAI) is a term commonly used in areas that experience wildfires. In this study, the term WAI is used instead of the more commonly used Wildland–Urban Interface (WUI) to better reflect the rural context of the study area. WAI refers to areas where wildland vegetation interacts with human presence, including dispersed settlements and agricultural lands, and therefore extends beyond strictly urban environments.
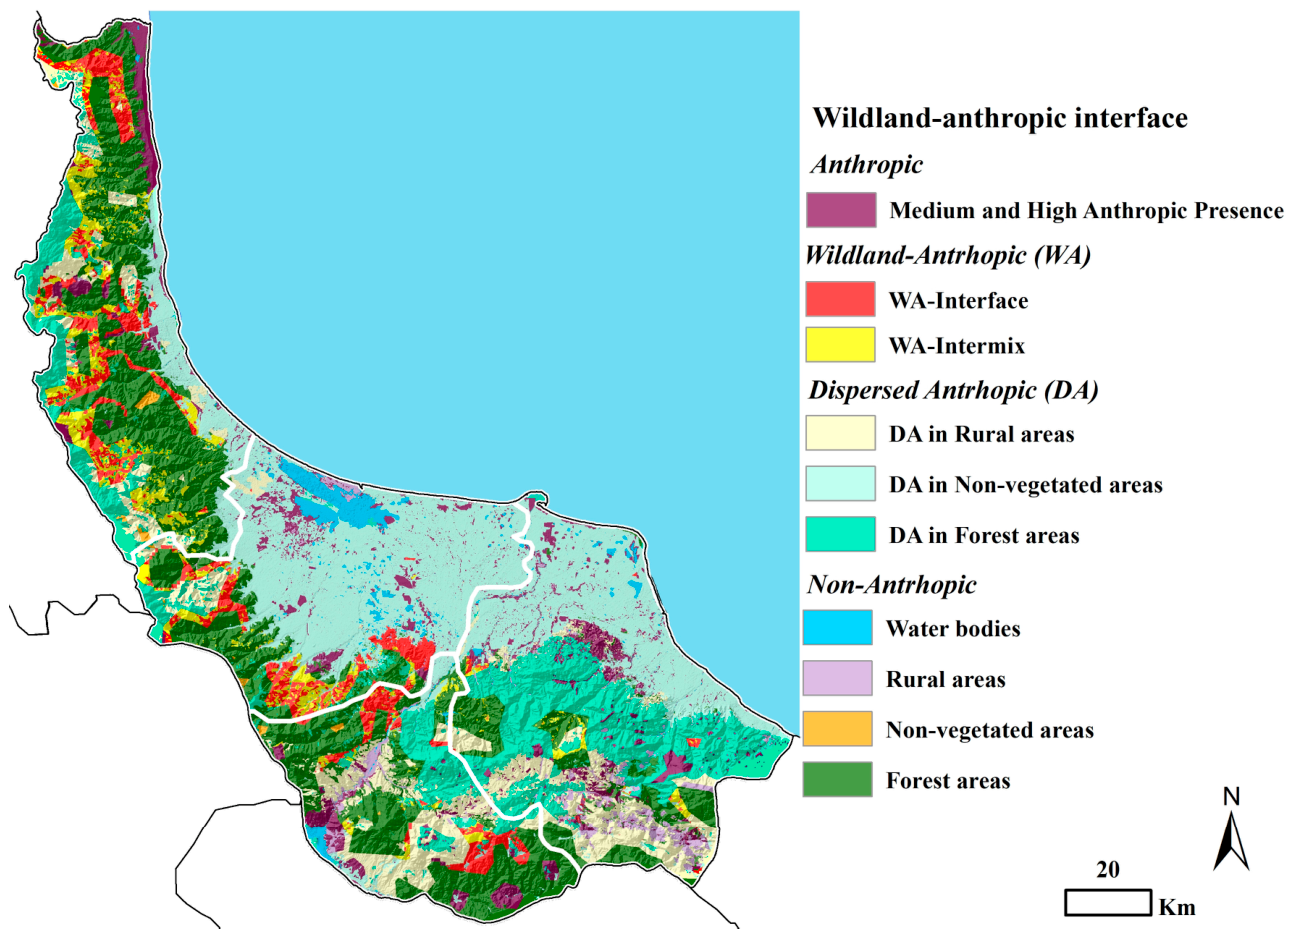
The increasing risk of WAI fires due to housing growth in recent decades emphasizes the necessity of creating methodologies for mapping and characterizing WAI [60]. While WAI areas have been mapped globally [61], across the United States [62,63], regions of Europe [64], and other areas such as South Africa [65] and Argentina [66], Iran does not have a WAI map to date. In this study, using the generated LULC types, wildland and urban lands were extracted to characterize the WAI in the northern region of Iran. WAI areas were defined as zones in which anthropic structures, including isolated buildings, industrial and commercial structures, are located in or near wildland vegetation. Anthropic structures were obtained from OpenStreetMap (OSM) building shapefiles [49]. These structures were reclassified according to individual housing location, structure density, vegetation cover, and percent area coverage, determining the main LULC types (non-vegetated areas, rural, forest, and water bodies). Furthermore, the most intense wildfires were identified by determining a 2 km buffer from dense and contiguous forest areas (>5 km2). These layers were combined to derive the 100 m WAI raster map, which was divided into four groups: (1) anthropic; (2) wildland–anthropic (WA); (3) dispersed anthropic (DA); and (4) non-anthropic [67,68]. Finally, the total area (ha) and percentage of the WAI classes were calculated relative to the total study area. In addition, the number of structures and wildfire-threatened structures (y−1) for the WAI classes were extracted.

2.6. Wildfire Hazard Analysis

An analysis of wildfire hazard was conducted to evaluate various wildfire simulations performed using different spatial reference layers. Initially, the analysis was performed at the landscape scale, using the wildfire simulation results generated for the entire study area to summarize the fire hazard potential for both OBS and RND simulations. The focus then shifted to analyzing the four bioclimatic zones and the five primary fuel types present in the study area. To achieve this, we intersected the simulation results with the reference layers and computed the mean values of BP, CFL, FS, and CFP. Finally, we identified the structures that were most at risk from wildfires within the study area. As detailed in Section 2.5, we created a WAI map using building shapefiles from OSM [49], and we intersected the centroids and polygons of buildings with the wildfire simulation outputs. This approach enabled the identification of structures most at risk from wildfire based on their exposure to areas with high burn probability. Exposure was defined using a threshold of BP > 0.01, representing locations with a non-negligible likelihood of burning under the modeled conditions and consistent with thresholds applied in previous studies [28,67]. Burn probability was selected as it directly reflects ignition likelihood; however, alternative metrics such as conditional flame length (e.g., CFL > 2.4 m) could also be applied [69]. The selected threshold influences the spatial extent of exposure and should therefore be interpreted as scenario-dependent. In this study, CFL is used as the primary metric of fire behavior, serving as a proxy for fire intensity, which physically represents the rate of energy release, while flame length provides an operational, model-derived indicator of fire behavior severity.
Differences in wildfire hazard values between the OBS and RND scenarios were calculated for each output variable, and statistical comparisons were performed using the nonparametric Wilcoxon signed-rank test. The analysis was conducted at the grid-cell level using paired hazard metric values, with each raster cell treated as a sampling unit. This approach was selected due to the paired structure of the data and the non-normal distribution of variables, which persisted even after log transformation. Although spatial autocorrelation in raster data may violate the independence assumption of the test, the analysis is intended to assess overall distributional differences between scenarios rather than independent samples. This limitation is acknowledged, and results are interpreted in the context of spatially structured data.

3. Results

3.1. Wildfire Hazard at the Landscape Level

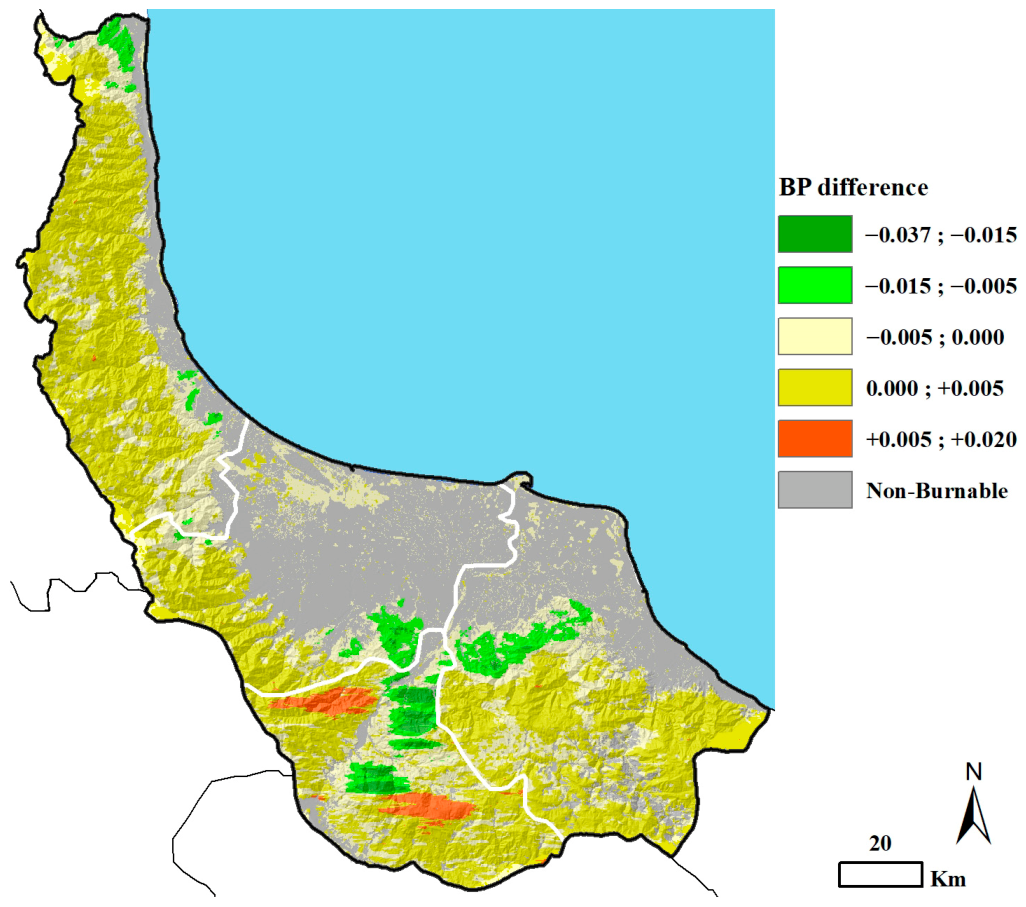
The analysis showed significant differences in all simulation outputs based on the OBS and RND ignition point densities under extreme fire weather conditions. For example, the spatial differences in BP values between OBS and RND simulations throughout the study area are presented in Figure 3. Specifically, RND BP values were higher than OBS BP (positive values in Figure 3) in about 18% of burnable fuels, especially in dense broadleaved forests and dense rangelands in the southern regions, which are characterized by low historical fire ignition likelihood. On the contrary, RND BP values were lower than OBS BP, primarily located in the central part of the study area (negative values in Figure 3). In about 61% of burnable fuels, the differences in BP between RND and OBS ignition patterns were limited. We applied the Wilcoxon signed-rank test to assess whether there were significant variations in BP values between the OBS and RND scenarios. The results indicated that the differences between the two simulations were statistically significant (p-value < 0.001).
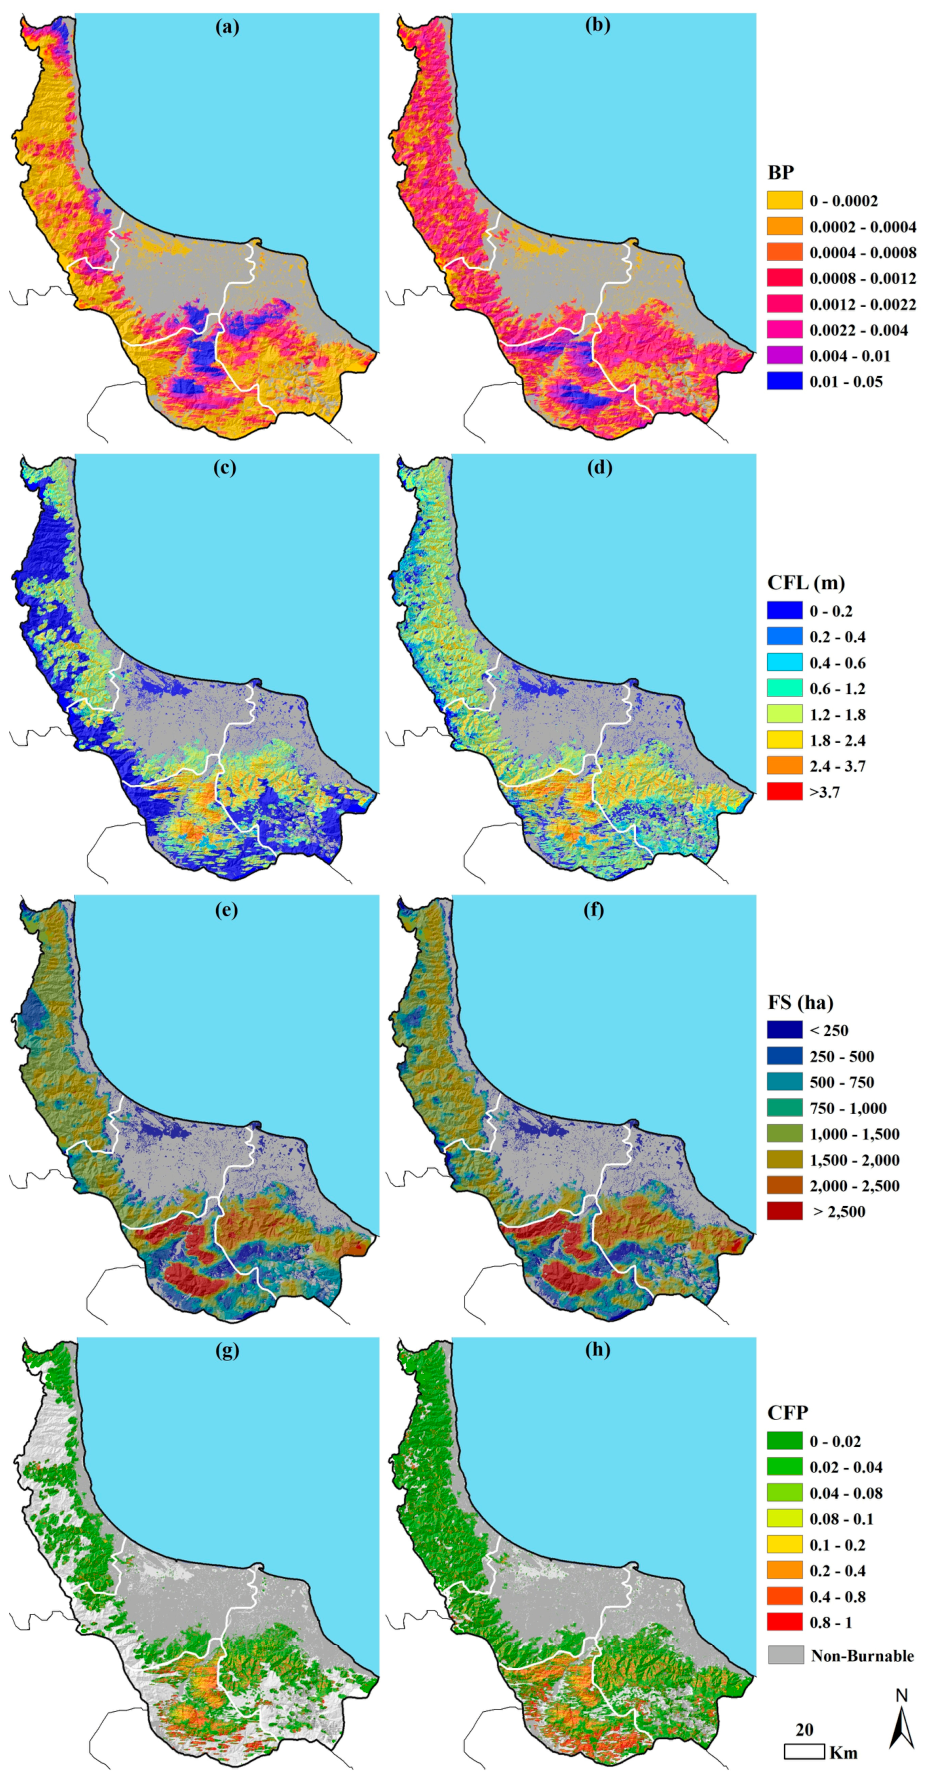
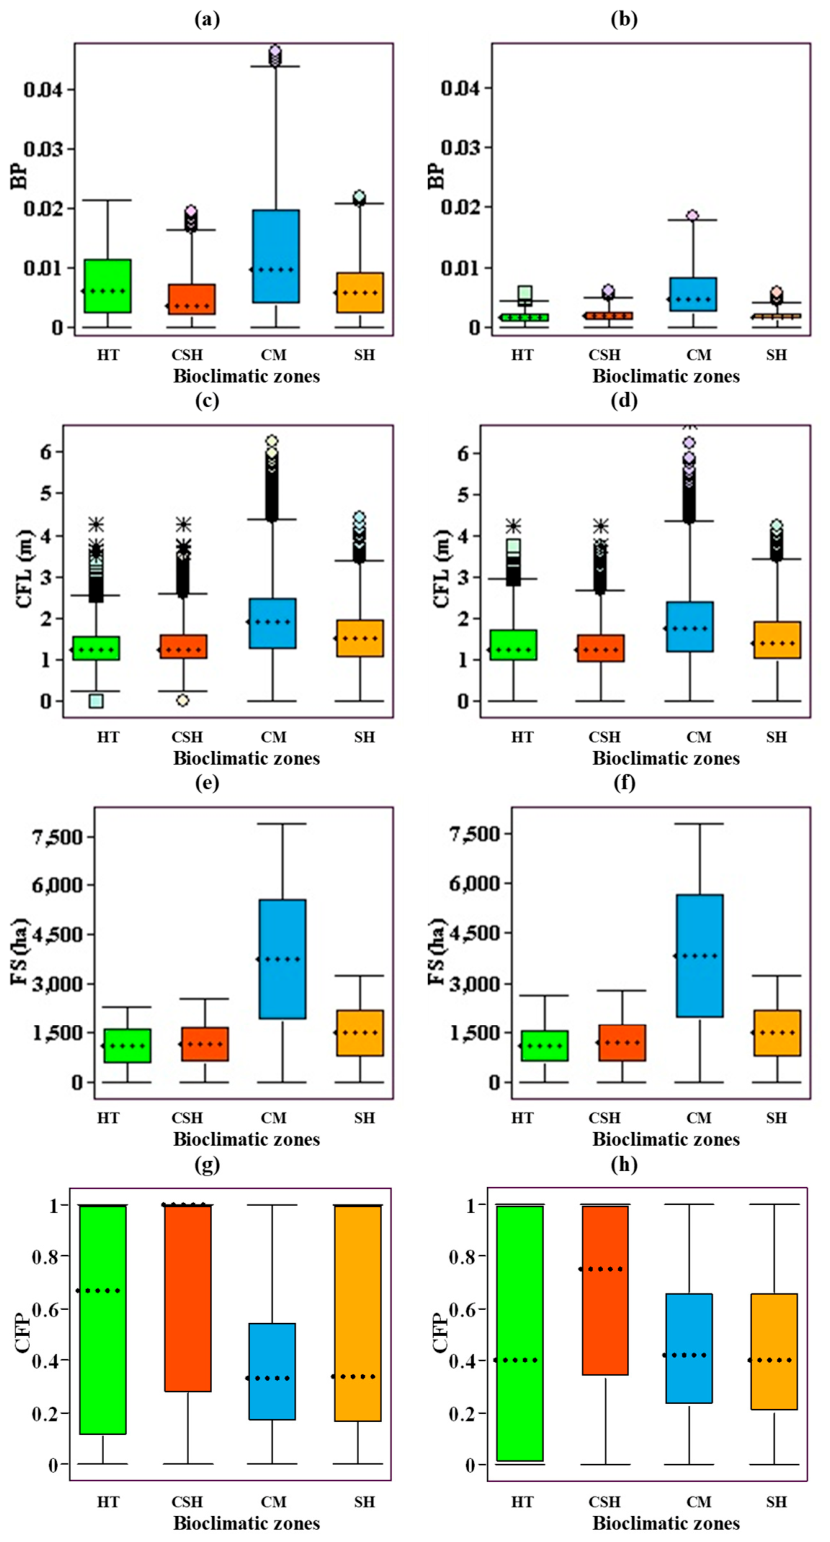
Across the study area, focusing on BP simulations (Figure 4a,b), the OBS scenario highlighted a mean BP close to 1.3 × 10⁻³; most of the study area (~60%) exhibits relatively low BP values (<2 × 10⁻⁴; Table 5). Under the RND scenario, the average BP (1.1 × 10⁻³) was lower compared to the OBS scenario, and about 38% of the study area exhibited low BP values (<2 × 10⁻⁴). The highest BP values (>0.01) were recorded in fewer than 4% of the study area for both OBS and RND simulations, primarily situated in the central–southern zone of the region.
The average CFL values were 0.54 m and 0.78 m for the OBS and RND scenarios, respectively (Table 5). Under the OBS scenario (Figure 4c), low CFL (<1.2 m) and moderate CFL (1.2–2.4 m) values were observed in almost 77% and 19.5% of the study area, respectively. High CFL (>2.4 m) values, a reference threshold typically used to assess challenges in fire suppression [69], covered approximately 3.5% of the study area. Under the RND scenario (Figure 4d), low CFL values covered 68% of the study area. About 27.5% and 4.4% of the study area presented moderate and high CFLs, respectively, associated with high BPs (>0.01). High burn severity potential is primarily concentrated in the south-central part of the region. In contrast, low flame length values dominate the rest of the region.
The spatial analysis of FS indicates that large portions of the study area (34%) have a relatively low potential for originating large fires (<250 ha; Figure 4e,f) for both OBS and RND scenarios. The highest FS values (>1000 ha) were recorded in almost 42% of the region, primarily focused in the south-central pixels. The average FS values were 917 ha and 960 ha for the OBS and RND simulations, respectively (Table 5).
Guilan has historically been very little affected by crown fires. This was confirmed by our simulations, which evidenced a low mean CFP (0.094) for the OBS scenario (Table 5). In more detail, the highest CFP values (>0.1) were focused in small areas (16%) of the southern portions of Guilan (Figure 4g). Under the RND scenario, the study area presented a slightly higher mean CFP (0.103) than in the OBS simulations, and about 17% of the study area had CFP > 0.1 (Figure 4h).

3.2. Wildfire Hazard at the Bioclimatic Zones Level

The highest mean BP values (3.4 × 10⁻³ and 3.1 × 10⁻³ under the OBS and RND scenarios, respectively) were observed in the Cold-Mountainous (CM) zone. In this area, peaks in BP were concentrated in the Rudbar municipality, bordering the municipalities of Rasht and Siahkal (Figure 1c), with values between 0.01 and 0.05 (Figure 4a). Lower mean BP values were observed in the Humid-Temperate (HT), Semi-Humid (SH), and Cold-Semi-Humid (CSH) zones, with values ranging from 5 × 10⁻⁴ to 1.2 × 10⁻³ (Table 5) for both fire ignition location simulations.
The RND scenario exhibited the highest mean CFL values compared to the OBS scenario across all bioclimatic zones (Table 5). For instance, in the CM zone, the average CFL increased from 0.93 m (OBS scenario) to about 1.2 m (RND scenario), and the mean CFL exceeded the critical value of 2.4 m in the Rudbar municipality due to high fuel loads and complex topography.
The CM bioclimatic zone had notably higher mean FS values (>1500 ha) under both scenarios tested. Regarding the other bioclimatic zones, under the OBS scenario, the mean FS values of 411, 1046, and 828 ha correspond to the HT, CSH, and SH zones, respectively (Table 5).
The CM bioclimatic zone also showed the highest mean CFP (0.234 and 0.257 for OBS and RND simulations, respectively), significantly higher than the mean values presented by the other zones. Under the OBS scenario, CFP mean values of the HT, CSH, and SH zones were 0.035, 0.032, and 0.075, respectively. Under the RND scenario, mean CFP values were comparatively higher than those obtained with OBS simulations for all bioclimatic zones (Table 5).
Boxplots depicting the spread of the descriptive fire hazard outcomes (BP, CFL, FS, and CFP) across the bioclimatic zones demonstrate significant variability (Figure 5).

3.3. Wildfire Hazard Among Fuel Types

Five main fuel types have been identified (Table 3), and the proportion of burned areas for each fuel type under the two fire ignition scenarios is presented in Table A1 of Appendix B. Timber litter accounted for the highest mean annual burned area (385.6 ha yr−1 and 461.6 ha yr−1 for the OBS and RND fire ignition simulations, respectively). For both OBS and RND scenarios, the simulations revealed that most wildfires affected timber litter fuels (about 47.5%), followed by timber understory (about 32.5%). Grass, grass-shrubs, and shrubs received about 12.2%, 2.5%, and 5.2% of all fires, respectively. The burned area resulting from ignitions on each main fuel type was not proportional to the overall area occupied by each fuel type (i.e., timber understory: 9.7% of land cover vs. 32.5% of total area burned; grass: 20.3% of land cover vs. 12.2% of total area burned) (Table A1).
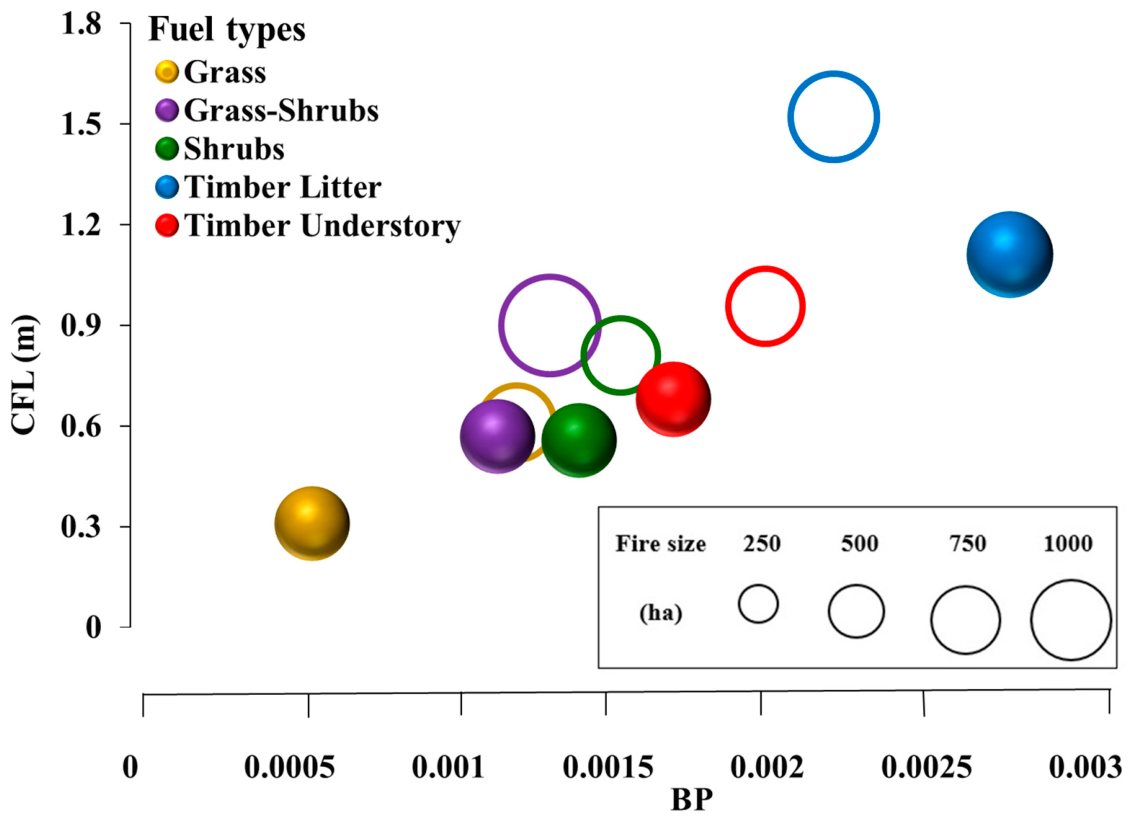
Figure 6 presents scatterplots comparing average BP with average CFL (m) for the main fuel types in the region across the two simulated scenarios. The differences among and within fuel types in spatial pattern and magnitude, depending on the reference scenarios, are considerable. Fire hazard values were limited in grass (0.31 m CFL and BP 6 × 10⁻⁴), especially in the OBS scenario. We observed the highest average values of CFL (1.5 m) and BP (2.2 × 10⁻³) for timber litter (the most “flammable fuel”), and CFL (0.96 m) and BP (1.9 × 10⁻³) for timber understory (the second in terms of “flammability”), under the RND scenario. Fires in shrubs (0.81 m CFL and BP 1.5 × 10⁻³) and grass-shrubs (0.9 m CFL and BP 1.3 × 10⁻³) showed moderate fire hazard values under the RND scenario.

3.4. Wildfire Exposure at Wildland Anthropic Interface (WAI) Level

The WAI map for the whole study area is presented in Figure 7. The predominant WAI type is dispersed anthropic (DA, 53.2%), consisting of non-vegetated areas (26%), forest areas (16.7%), and rural areas (10.5%). Regarding the anthropic area, 6.6% of Guilan is covered by this class. The total area of wildland–anthropic zones (WA) is about 152,000 ha, which corresponds to 10.8% of the land area. Of this area, about 85,000 ha are classified as WA-Interface (6% of the study area), and about 67,000 ha are classified as WA-intermix (4.8% of the study area). Finally, non-anthropic areas occupy 29.3% of the region (Table A2).
We analyzed the number of WAI structures exposed to wildfires considering high burn probabilities (>0.01) for the OBS (observed) and RND (random) fire ignition simulations (Table 6). In WAI areas, the number of structures threatened by simulated wildfires for the bioclimatic zones and the whole study area is shown in Table 5. The total exposure in the region is 97 and 123 threatened structures (0.41% and 0.52% of the total number of structures) for the OBS and RND fire ignition locations, respectively.
The WAI types that showed the highest number of structures threatened by wildfires were the dispersed anthropic class (DA; 41% and 38%) and the wildland–anthropic class (WA; 36% and 40%) for the RND and OBS fire scenarios, respectively. Under the RND scenario, the DA class comprised approximately 41% of the overall fire exposure of structures, mostly in rural areas (22%), followed by non-vegetated areas (16%) and forest areas (3%). About 36% of the structures exposed to wildfires were in the wildland–anthropic class (WA), including WA-Interface (10%) and WA-Intermix (26%). The remaining threatened structures (23%) were concentrated in anthropic areas. Under the OBS scenario, the proportions of threatened structures were 38%, 40%, and 22% for DA, WA, and anthropic areas, respectively.
Regarding the bioclimatic zones, the most exposed zone (52 threatened structures) was the Semi-Humid (SH) zone under the RND scenario. Under the OBS scenario, the number of structures threatened by wildfires ranged from 17 in the Cold-Semi-Humid (CSH) zone to 40 in the SH zone.

4. Discussion

4.1. Wildfire Hazard

We analyzed wildfire hazard in the fire-prone Hyrcanian temperate forests of northern Iran under observed (OBS) and random (RND) ignition scenarios, considering extreme fire weather conditions. Under the OBS scenario, approximately 3.7% of the landscape was classified as high burn probability (BP > 0.01), ~23% showed moderate to high conditional flame lengths (CFL > 1.2 m), ~41.5% had large fire sizes (FS > 1000 ha), and 16% exhibited high crown fire probability (CFP > 0.1) (Figure 4). RND simulations produced higher values for CFL, FS, and CFP, though BP remained similar to OBS (Table 5). The higher wildfire hazard values observed in the RND scenario can be attributed to the broader spatial distribution of ignition locations, which allows fires to initiate in areas with more favorable combinations of fuel continuity, topographic complexity, and wind exposure. In contrast, observed ignitions are more spatially clustered. Differences in BP between the OBS and RND scenarios were evaluated using the spatial average across all grid cells, though other approaches, such as point sampling, could also be applied [70]. The results highlight significant spatial differences between OBS and RND outputs, consistent with previous studies [14,17], while emphasizing that ignition effects interact with fuels, topography, and weather [71]. Although RND scenarios may introduce spatial errors, OBS ignitions better capture interactions among landscape variables for more accurate BP estimation [16]. However, with climate change increasing fire likelihood in historically unburned areas, relying solely on OBS points may underestimate emerging hazards, underscoring the value of incorporating alternative ignition scenarios.
Our findings indicate that more than 90% of the study area shows an estimated BP lower than 0.01 for both OBS and RND scenarios. These low BP values are associated with previously burned areas, marshes, and reed beds, which can withstand low-intensity fires, especially when soil moisture is high and there is a low potential for fire ignitions in sparsely populated areas. On the contrary, less than 4% of Guilan has the potential to produce high BP (>0.01). Three of the 16 municipalities (i.e., Rudbar, Siahkal, and Astara) showed a significant density of high BP values. Areas with higher BPs are found close to the southern boundary of the region and are associated with elevation, population density, and broadleaved forest land cover. Specifically, dense broadleaved forests above 500 m exhibit higher BP than lowland forests, reflecting the combined influence of ignition density, fuel characteristics, and terrain. Steep slopes and continuous, dense fuels promote fire spread, while elevation-related patterns indicate that mountainous areas experience more intense fire behavior due to stronger wind regimes and terrain-driven effects that enhance fire propagation. This result aligns with earlier research highlighting the connections between BP and elevation [72,73]. In contrast, Rogeau and Armstrong [74] found that an increase in elevation is related to reduced BP in forests. BP values are uniform across the mountainous landscapes located in the two distinct sectors of the mountain range, i.e., east and west of the region. Furthermore, the southern edge of the region is mainly defined by unmanaged forests and lower population density, which are subject to higher BP. Similarly, Bountzouklis et al. [75] and Joshi et al. [76] indicated that BP increased in sparsely populated areas with continuous forest cover. However, Sjöström and Granström [77] observed a beneficial effect of population density on BP. Overall, fire characteristics, including BP patterns, can differ significantly and are affected by numerous environmental factors in the area.
Low values of average fire intensities (CFL ≤ 1.2 m) were recorded in about 77% and 68% of the region for the OBS and RND scenarios, respectively (Figure 4). Most of Guilan Province showed moderate values of CFL (1.2–2.4 m) for both ignition scenarios (19.5% and 27.5% of the region for the OBS and RND simulations, respectively). The spatial distribution of low CFL values was mostly associated with the presence of grass fuels, particularly scarce and low rangeland and medium-density rangeland.
As a result, the predicted CFL map shows a notable distinction between the low fire intensities observed in flat areas, especially along the southern coast of the Caspian Sea, covered by lowland grassland and sparsely vegetated areas, compared with the mid-elevation areas of the region. In contrast, less than 5% of the region has high fire intensities (CFL > 2.4 m) for both OBS and RND scenarios. CFL values exceeding 2.4 m are primarily found in the center and south of Guilan. These high CFL values are located mainly in the Rudbar municipality in southern Guilan due to high fuel loads and complex topography (Figure 4). As highlighted by Wade [78], CFLs constantly fluctuate with topography and fuel variations in the fire environment and changes in weather conditions, particularly wind speed and wind direction. Similarly, Valencia et al. [79] found that high burn severities mainly involve areas with high fuel loads.
FS analysis shows that high FS values (>1000 ha) are situated in the municipality of Rudbar (Figure 4), which also coincides with the region exhibiting the highest historical ignition probability (Figure A1a). These values were linked to complex topographical features and substantial fuel loads, particularly in the south-central part of the region. Conversely, flat terrains featuring grasslands and sparse vegetation showed lower FS values. The regions to the north and west exhibit the lowest average FS values, falling below 250 ha. These areas are dominated by built-up and agricultural LULC types, which are likely the limiting factors determining fire growth. This finding agrees with results reported by Bruni et al. [36] for wildfires in north-western Portugal.
Correspondingly, the spatial distribution of FS is marked by a preference for relatively low values, whereas the southern sector of the region shows the highest FS values, forming three extensive patches in dense broadleaved forests at altitudes of 250–1500 m. These findings are most likely the result of the combined effects of various factors driving high FS values in temperate broadleaved forests within the study area. For instance, these forests, during autumn leaf fall and under warm southern winds (the so-called “Garmij”), are highly vulnerable to wildfire [43].
The results indicated that CFP was low despite the extreme fire weather conditions, primarily due to lower values of canopy fuel characteristics. The study area mainly represents uneven-aged forest stands, where canopy bulk density ranges from 0 to 20 × 10−2 kg m−3 (mean 8.5 × 10⁻² kg m−3) and canopy base height from 0 to 3.6 m (mean 2.4 m). This finding substantially aligns with the results of Mitsopoulos and Dimitrakopoulos [80], who reported that in uneven-aged stands, the characteristics of the lower canopy fuels were reduced, which decreased the likelihood of crown fires. Within the study area, fire propagation was generally constrained to surface fuels across the majority of forested regions. According to Jahdi et al. [43], the historical fire regime in the Hyrcanian forests of Iran is characterized by surface fires; therefore, the vulnerability of different forests to the onset and spread of crown fires is minimal. However, under extreme fire weather conditions, about 16% (OBS scenario) and 17% (RND scenario) of the study area had high CFP values (>0.1), with crown fire–prone areas primarily concentrated in the southern regions extending eastward.

4.2. Wildfire Hazard Among Fuel Types

Simulations revealed that most fires (80%) during 1992–2022 burned in timber litter and timber understory fuel types. The highest burned area among non-timber fuels occurred in the grass fuel type (12.2%), especially in the GR3 (dry farming, 6.7%) fuel model. Although fires in dry farming areas affect smaller surfaces than those in natural landscapes [81], in this agricultural type, inappropriate dry farming practices are typically associated with landscape alterations and anthropogenic fires [82]. In addition, under climate change-driven increases in drought conditions, fires increasingly burn dry and open landscapes and agricultural areas. Consequently, the burned area affected by ignitions from different fuel types did not correlate proportionally with the overall area occupied by each fuel type.
Furthermore, scatterplots comparing average BP to average CFL (m) for the main fuel types indicated that simulations showed the lowest fire hazards in grass, grass-shrubs, and shrubs. However, timber litter and timber understory types showed the highest fire hazards. In these fuel types within temperate broadleaved forests, the combination of warmer and drier summer conditions has resulted in increased forest growth at higher elevations, high fuel loads primarily because of large loads of dead and down woody debris (DWD), and increased vulnerability to wildfires during Foehn winds in the lee of mountain ranges [43].
The large amount of DWD in these natural forests can result from the implementation of the “forest rest” strategy [83], under which industrial logging was prohibited for ten years. Similarly, several studies suggest that broadleaved forests are more likely to experience fires [84,85]. Grünig et al. [86] reported changes in wildfire patterns in Europe in recent years, showing increased fire activity and burned areas in temperate broadleaved forests compared to the Mediterranean biome. For instance, more than 50% of the overall burned area in Europe in 2020 occurred in temperate broadleaved forests. This aligns with recent findings identifying the “spring window” period following snowmelt and preceding leaf budding as a time when broadleaved forests are relatively more favorable to fires [87]. In contrast, several studies have highlighted that wildfires occurring in broadleaved forests generally tend to be less extensive and intense, mainly due to higher fuel moisture values and lower flammability [88,89].

4.3. Wildfire Exposure to WAI

The wildland–anthropic interface (WAI) map of Guilan Province (Figure 7) shows clear spatial contrasts between the southern coastal municipalities (especially in the Humid-Temperate (HT) zone) and the other municipalities. Most WAI areas were concentrated along the southern coast of the Caspian Sea. In the Caspian Sea region of Iran, accelerated population growth and associated urbanization, industrial development, and, more recently, intensive tourism have occurred near or within the Hyrcanian forests [90]. In other words, northern Guilan comprises WAI totaling approximately 240 km in linear extent.
The comparison of wildfire exposure results in WAI areas between the two fire ignition scenarios revealed that the RND scenario had higher exposure estimates, with 123 threatened structures compared to 97 under the OBS scenario (Table 6). The proportion of threatened structures distributed among different WAI classes varies across the study area, with most exposure concentrated in the wildland–anthropic (WA) and dispersed anthropic (DA) classes. Of the six WAI classes analyzed, DA in non-vegetated areas contained the highest number of structures (10,263; Table A2). However, the majority of threatened structures were located within the WA-intermix class (29 and 32 for the OBS and RND scenarios, respectively), aligning with findings from earlier research [91,92]. Based on the study by Syphard et al. [93], two WA types (interface and intermix) were associated with burned structures compared to other WUI classes, and more burned buildings were found in the WA-intermix instead of the WA-interface, similar to this study. In the study area, a low number of structures mostly dispersed in wildlands combined with the highest fire exposure (i.e., BP > 0.01) levels, a result validated by earlier research [29,94]. This result contrasts with the findings of Argañaraz et al. [92], where most structures were located in areas with elevated BP values. These results provide a spatial and quantitative measure of the buildings threatened by fires and allow us to identify regions where structures meet with hazardous wildlands and vegetative fuels [64].

4.4. Limitations and Uncertainty

While this study provides a comprehensive assessment of wildfire hazard under extreme conditions, several limitations should be acknowledged. The simulations were conducted using a single extreme fire weather scenario (97th percentile NFDRS) to represent severe fire environments. Wind speed was spatially differentiated across bioclimatic zones, with higher values assigned to mountainous areas to account for terrain-driven effects. Although this approach is appropriate for evaluating wildfire hazard under critical conditions, the use of a single scenario may influence the magnitude of simulated fire behavior; incorporating multiple weather scenarios or conducting sensitivity analyses would improve the robustness of the results.
In addition, independent quantitative validation of the simulated outputs was not performed due to limitations in the availability and spatial consistency of historical fire data, as well as the scenario-based design of the simulations. The FlamMap model was previously calibrated in earlier studies; therefore, the present work focuses on its application to assess relative wildfire hazard patterns rather than on model validation or the reconstruction of individual fire events. Despite the absence of formal validation, the spatial distribution of simulated burn probability shows general agreement with areas of historically frequent fire occurrence, particularly in forested and mountainous regions. Accordingly, the results should be interpreted as relative, landscape-scale indicators of wildfire hazard under controlled simulation conditions, rather than as validated predictive outputs.

5. Conclusions

The findings of this research emphasize the significance of choosing ignition locations for model wildfires with spatial precision. The patterns of wildfire hazards in the region were primarily influenced by the spatial distribution of ignition points, fuel moisture levels, and wind conditions, including speed and direction. Significant differences were found between observed and random ignition scenarios, with the random one exhibiting higher average values for CFL, FS, and CFP, while the observed scenario had a higher average BP. Among different fuel types, fires in timber litter and timber understory are expected to pose the highest hazard levels, whereas grass, grass-shrub, and shrub fuels indicate the lowest hazard levels. A modeling framework for estimating wildfire hazards in fuel types, ignition location change patterns, and weather change scenarios is described. Historical wildfires may provide reliable fire hazard values. Although historical wildfires can yield dependable fire hazard data, the limited number of years available is inadequate for mapping fire hazards at a scale necessary for informed fire management decisions. Therefore, a fire database is needed to generate input data for realistic fire modeling. However, our findings suggest that simulated landscape hazards can provide actionable insights about which landscape locations are particularly vulnerable to burns. From this perspective, this research provides a strategic decision-support tool to enhance wildfire management at the landscape level in fire-prone Hyrcanian temperate forests.

Author Contributions

Conceptualization, R.J.; methodology, R.J., L.D.G. and M.S.; validation, R.J. and L.D.G.; formal analysis, R.J. and L.D.G.; investigation, R.J., L.D.G., M.S.; data curation, R.J. and L.D.G.; writing—original draft preparation, R.J. and L.D.G.; writing—review and editing, R.J., L.D.G. and M.S.; visualization, R.J. and L.D.G.; supervision, M.S. All authors have read and agreed to the published version of the manuscript.

Funding

This study received support from the University of Mohaghegh Ardabili. A part of the methodology was developed through the FirEUrisk project (Grant agreement ID: 101003890), which was financed by the EU as part of the ‘H2020-EU.3.5.—SOCIETAL CHALLENGES—Climate action, Environment, Resource Efficiency and Raw Materials’ Programme; the CRITERIA Project (grant no. B53D23029500001), which was funded by the Italian Ministry of Education, University and Research (MIUR) through the EU Next Generation Program (PNRR—PRIN); and the FIRE-ADAPT Project (grant no. 101086416), which received funding from the EU Marie Skłodowska-Curie Action.

Institutional Review Board Statement

Not applicable.

Informed Consent Statement

Not applicable.

Data Availability Statement

The original contributions presented in this study are included in the article. Further inquiries can be directed to the corresponding author.

Conflicts of Interest

The authors declare no conflicts of interest.

Appendix A

Appendix A.1. Methods

Appendix A.1.1. Wildfire Regime and Activity

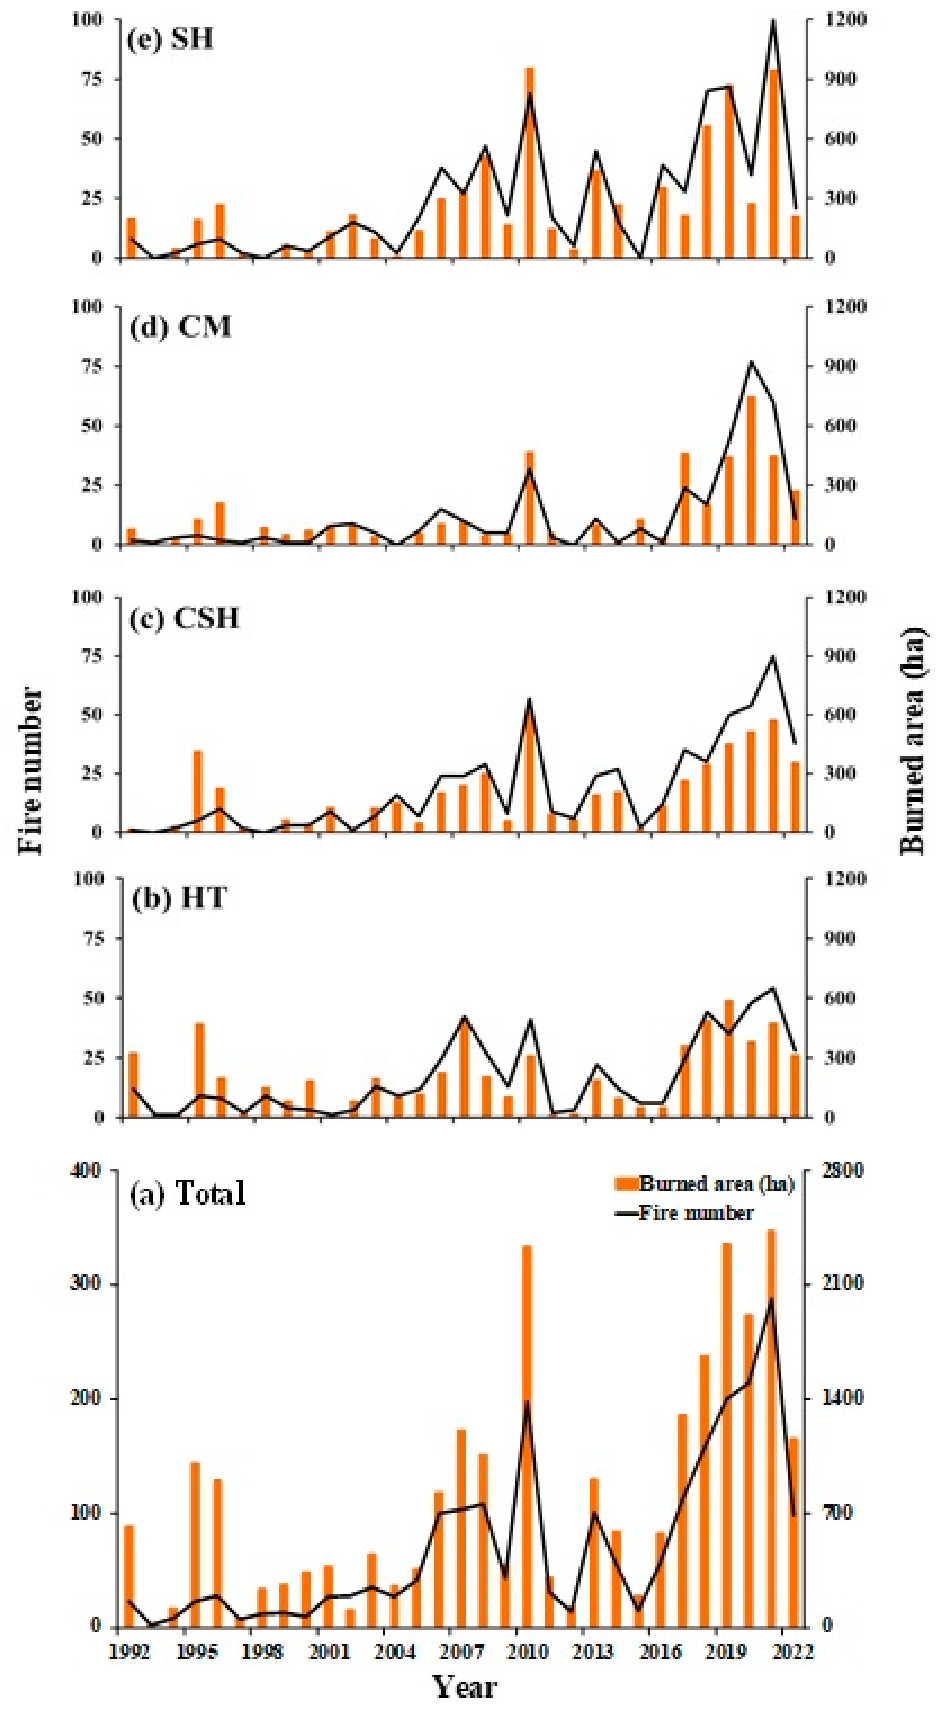
Based on the data collected, 2249 wildfire locations were identified as reliable and accurate inventory records (Figure A1). The most significant number of wildfires (287), together with the largest share of burned area (2427 ha), were recorded in 2021. In general, during 2017–2021, a significant increase in burned area and the number of fires was observed compared to previous years. Furthermore, 2010 was one of the worst years for firefighting in Guilan, when 2328 ha were burned (Figure A2).
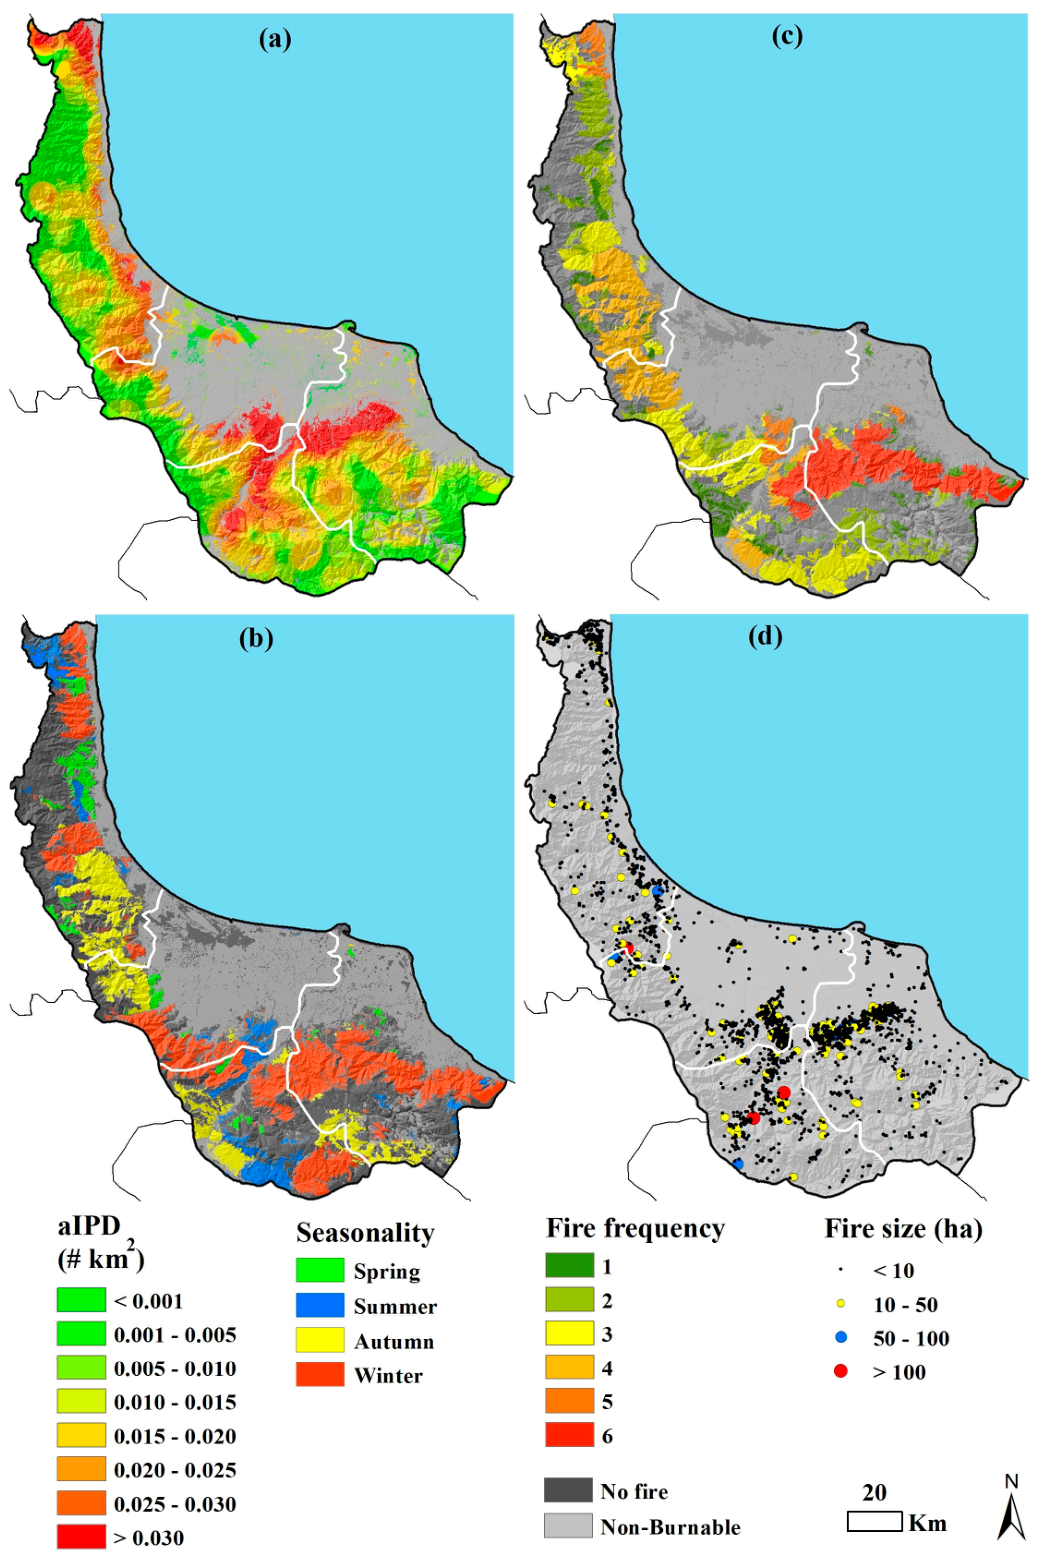
Wildfire regime components, including annual fire ignition point density (aIPD, # km−2), fire seasonality, fire frequency (number of fires), and fire sizes, were extracted for the study area for the period 1992–2022. The aIPD was derived by interpolating historical ignition points using an inverse distance weighting (IDW) algorithm with a fixed 5 km radius. This approach provides a computationally efficient representation of spatial ignition patterns while preserving local spatial variability and limiting excessive smoothing. Although kernel density estimation (KDE) is commonly used in similar applications, IDW was adopted as it represents relative spatial weighting without requiring bandwidth calibration. The ignition density grid was generated at 100 m resolution to maintain consistency with the spatial resolution of the landscape inputs used in FlamMap. The interpolated values were subsequently normalized to a probability surface by scaling them such that their sum across all burnable cells equals one, ensuring a valid spatial probability distribution for ignition sampling.
The resulting aIPD exhibited pronounced spatial variability (Figure A1a), with the highest values (>0.03) concentrated in the south-central part of the study area. Overall, the Cold-Mountainous (CM) and Semi-Humid (SH) zones exhibited the highest ignition density.
In addition, fire seasons were determined according to the burn date derived from the regional fire dataset as March–May (spring), June–August (summer), September–November (autumn), and December–February (winter) (Figure A1b). Winter months represent 51% of the total area, extending from west to east of the province. Accordingly, 8%, 13%, and 28% of the study area experienced fires during spring, summer, and autumn, respectively. The Cold-Semi-Humid (CSH) zone attained the highest occurrence of autumn fires, while the other three zones experienced fires mostly in winter. In general, most fires (>70%) have historically occurred between December and February and between June and August, which were labeled as the fire season in the region to quantify weather data for fire simulations.
Moreover, the distribution of fire frequency was calculated for the historical fire perimeters in the study area (Figure A1c). Fires most frequently occur in the east-central region; however, the largest fires occurred mainly in the southern region (Figure A1d), where aIPD is also higher. The SH zone historically experienced frequent fires (Figure A1c). Most fires were of small size, with less frequent large fires; large fires (>50 ha) accounted for only 2.1% of the total number of fires but represented 15.4% of the total burned area. Frequent small fires (<10 ha) accounted for 65.3% and 35% of the total number of fires and burned area, respectively. Medium fires (10–50 ha) resulted in 32.6% and 50% of the total number of fires and burned area, respectively.
Figure A1. Spatial patterns of annual fire ignition point density (aIPD, # km2; (a)), fire seasonality (b), fire frequency (c), and fire sizes (ha (d)) in four different bioclimatic zones in the study area, derived from 2249 historical fire events occurred during the 1992–2022 study period. White lines separate the four bioclimatic zones in the study area.
Fire 09 00176 g0a1
Figure A2. Fire number and burned area (ha) for the total area (a) and each bioclimatic zone (be) by year (1992–2022).
Fire 09 00176 g0a2
Figure A3. Raster layers produced to run FlamMap MTT: canopy cover (% (a)), canopy height (m (b)), canopy bulk density (100 kg m−3 (c)), canopy base height (m (d)), aspect (° (e)), and slope (% (f)). White lines separate the four bioclimatic zones in the study area. Elevation and fuel model raster layers were presented in the main text.
Fire 09 00176 g0a3
Figure A4. Wind Roses for daytime wind speed and direction during fire season (December–February and June–August) from 1992 to 2022 for each of the bioclimatic zones in the study area.
Fire 09 00176 g0a4

Appendix A.1.2. Fuel Mapping Methodology

This section provides methodological details supporting the LULC classification described in the main text. LULC-type data were first derived from satellite images (Landsat-8 OLI/TIRS L1TP for October 2021) and were analyzed using ENVI 5.6 software. The pre-processing steps for these images included radiometric calibration and atmospheric correction using the FLAASH method, which converts the brightness values of every pixel into true reflectances as if they had been measured on the ground [95]. Furthermore, to remove cloud cover from these images, we used the FMASK algorithm [96]. Next, composite images were generated, and the contrast of the satellite images was enhanced.
Then, in supervised classification, a training data set was identified that shows different LULC types. These LULC types were selected by field surveys, such as forests, rangelands, water bodies, dry farming, orchard irrigation farming, bare ground, and built-up lands. These regions were detected utilizing the Support Vector Machine (SVM) supervised classification method, a popular machine learning-based approach currently in use [97]. Reference for selecting appropriate training samples for machine learning classification of Landsat images was obtained from Google Earth images and the LULC map of the region from the Management and Planning Organization of Guilan Province [98].
A total of 1000 ground truth points were randomly selected, with 200 reference points used to assess the accuracy of the classification. The overall accuracy (0.91) and Kappa coefficient (0.88) were calculated using the classification error matrix and the Ground Truth ROIs tool in ENVI. Following the analysis of the satellite image, 19 LULC types were recognized in the research area (Figure 2a).

Appendix B

Table A1. Mean annual burned area (ha yr−1) and percentage of burned areas for main fuel types (burnable LULC (land use/land cover) types (=975,585.3 ha (69.5%) of the study area; Figure 2) considering OBS (observed) and RND (random) fire ignition location simulations.
Fuel TypeLULC ClassesArea (ha)Area (%)Fire Ignition Scenario
OBSRND
Mean BA (ha yr−1)Percentage of BAMean BA (ha yr−1)Percentage of BA
GrassMarshes & Reed beds15,336.21.097.510.9210.200.90
Dry farming56,155.14.0053.906.6660.906.61
Scarce & low rangeland7138.20.512.620.334.100.46
Medium density rangeland90,838.46.4720.232.4824.002.54
Dense rangeland115,878.88.2514.421.7818.511.71
Total Grass285,346.720.3298.6912.17117.7112.23
Grass-ShrubsModerate grass-shrubs load24,637.81.759.911.2111.601.35
High grass-shrubs load24,449.31.7410.371.2812.301.32
Total Grass Shrubs49,087.13.5020.282.5023.902.67
ShrubsShrublands3559.40.251.540.193.300.41
Woodland50,209.13.5840.775.0247.404.90
Total Shrubs53,768.53.8342.315.2250.705.31
Timber litterBroadleaved plantation 20,828.71.4855.866.8965.906.60
Dense broadleaved forest430,023.130.62329.7440.69395.7040.66
Total Timber litter450,851.832.10385.6047.58461.6047.27
Timber understoryConifer plantation 13,640.60.9717.892.4221.502.71
Sparse broadleaved forest62,188.74.43133.2416.45150.1015.05
Semi-dense broadleaved forest60,701.94.32110.9813.67141.7014.77
Total Timber understory136,531.29.72262.1132.54313.3032.52
Study area 975,585.369.47809.00100.00967.21100.00
Table A2. Total area (ha) and percentage, and number (#) of structures of the wildland–anthropic interface (WAI) classes (Figure 7) for the bioclimatic zones and the whole study area.
WAIBioclimatic ZonesTotal
HTCSHCMSH
Area (ha)Area (%)Str. (#)Area (ha)Area (%)Str. (#)Area (ha)Area (%)Str. (#)Area (ha)Area (%)Str. (#)Area (ha)Area (%)Str. (#)
Anthropic
Medium and High Anthropic Presence20,3035.6680 22,2015.948117,7387.324933,0967.9402493,3386.65434
Wildland–Anthropic (WA)
WA Interface25,0446.996 40,02710.79317,5277.21821070.53984,7056246
WA Intermix14,7454.1176 41,74111.1121861242.529944921.1451267,1024.86205
Dispersed Anthropic (DA)
DA in Forest Areas16,6434.64 54,31014.5933,95013.927129,20530.77234,10716.747
DA in Rural Areas14,9404.151 29,1097.8645,99218.912657,85313.71183147,89510.51366
DA in Non-Vegetated Areas196,00553.96447 36,9929.888610,8714.569121,77728.92861365,6462610,263
Non-Anthropic
Water Bodies22,6736.2-4180.1-34211.4 38220.9-30,3342.2-
Rural Areas33320.9-1860-56422.3 17,8374.2-26,9971.9-
Non-Vegetated Areas7320.2-23640.6-9120.4 -0-40080.3-
Forest Areas49,29413.6-148,21939.5-101,48441.6 51,27212.2-350,26824.9-
Total WAI
Total WAI363,7111007454 375,5671002693243,662100788421,46110012,6261,404,40010023,561

References

  1. Kobziar, L.N.; Hiers, J.K.; Belcher, C.M.; Bond, W.J.; Enquist, C.A.; Loudermilk, E.L.; Miesel, J.R.; O’Brien, J.J.; Pausas, J.G.; Hood, S.; et al. Principles of fire ecology. Fire Ecol. 2024, 20, 39. [Google Scholar] [CrossRef]
  2. McLauchlan, K.; Higuera, P.E.; Miesel, J.; Rogers, B.M.; Schweitzer, J.; Shuman, J.K.; Tepley, A.J.; Varner, J.M.; Veblen, T.T.; Adalsteinsson, S.A.; et al. Fire as a fundamental ecological process: Research advances and frontiers. J. Ecol. 2020, 108, 2047–2069. [Google Scholar] [CrossRef]
  3. Moritz, M.A.; Morais, M.E.; Summerell, L.A.; Carlson, J.M.; Doyle, J. Wildfires, complexity, and highly optimized tolerance. Proc. Natl. Acad. Sci. USA 2005, 102, 17912–17917. [Google Scholar] [CrossRef]
  4. Benson, R.P.; Roads, J.O.; Weise, D.R. Chapter 2 climatic and weather factors affecting fire occurrence and behavior. Dev. Environ. Sci. 2008, 8, 37–59. [Google Scholar] [CrossRef]
  5. Holsinger, L.; Parks, S.A.; Miller, C. Weather, fuels, and topography impede wildland fire spread in western US landscapes. For. Ecol. Manag. 2016, 380, 59–69. [Google Scholar] [CrossRef]
  6. Pereira, M.G.; Parente, J.; Amraoui, M.; Oliveira, A.; Fernandes, P.M. The role of weather and climate conditions on extreme wildfires. In Extreme Wildfire Events and Disasters—Root Causes and New Management Strategies; Elsevier: Amsterdam, The Netherlands, 2020; pp. 55–72. [Google Scholar] [CrossRef]
  7. Cruz, M.G.; Alexander, M.E. The 10% wind speed rule of thumb for estimating a wildfire’s forward rate of spread in forests and shrublands. Ann. For. Sci. 2019, 76, 44. [Google Scholar] [CrossRef]
  8. Chen, R.; He, B.; Quan, X.; Lai, X.; Fan, C. Improving Wildfire Probability Modeling by Integrating Dynamic-Step Weather Variables over Northwestern Sichuan, China. Int. J. Disaster Risk Sci. 2023, 14, 313–325. [Google Scholar] [CrossRef]
  9. Giannaros, T.M.; Papavasileiou, G. Changes in European fire weather extremes and related atmospheric drivers. Agric. For. Meteorol. 2023, 342, 109749. [Google Scholar] [CrossRef]
  10. Seneviratne, S.I.; Zhang, X.; Adnan, M.; Badi, W.; Dereczynski, C.; Di Luca, A.; Ghosh, S.; Iskandar, I.; Kossin, J.; Lewis, S.; et al. Weather and Climate Extreme Events in a Changing Climate. In Climate Change 2021: The Physical Science Basis. Contribution of Working Group I to the Sixth Assessment Report of the Intergovernmental Panel on Climate Change; Masson-Delmotte, V., Zhai, P., Pirani, A., Connors, S.L., Péan, C., Berger, S., Caud, N., Chen, Y., Goldfarb, L., Gomis, M.I., et al., Eds.; Cambridge University Press: Cambridge, UK; New York, NY, USA, 2021; pp. 1513–1766. [Google Scholar] [CrossRef]
  11. Jones, M.W.; Kelley, D.I.; Burton, C.A.; Di Giuseppe, F.; Barbosa, M.L.F.; Brambleby, E.; Hartley, A.J.; Lombardi, A.; Mataveli, G.; McNorton, J.R.; et al. State of Wildfires 2023–2024. Earth Syst. Sci. Data 2024, 16, 3601–3685. [Google Scholar] [CrossRef]
  12. Syphard, A.D.; Radeloff, V.C.; Keuler, N.S.; Taylor, R.S.; Hawbaker, T.J.; Stewart, S.I.; Clayton, M.K. Predicting spatial patterns of fire on a southern California landscape. Int. J. Wildland Fire 2008, 17, 602–613. [Google Scholar] [CrossRef]
  13. D’Este, M.; Ganga, A.; Elia, M.; Lovreglio, R.; Giannico, V.; Spano, G.; Colangelo, G.; Lafortezza, R.; Sanesi, G. Modeling fire ignition probability and frequency using Hurdle models: A cross-regional study in Southern Europe. Ecol. Process. 2020, 9, 54. [Google Scholar] [CrossRef]
  14. Bar-Massada, A.; Alcasena, F.; Schug, F.; Radeloff, V.C. The wildland—Urban interface in Europe: Spatial patterns and associations with socioeconomic and demographic variables. Landsc. Urban. Plan. 2023, 235, 104759. [Google Scholar] [CrossRef]
  15. Salis, M.; Ager, A.; Arca, B.; Finney, M.A.; Bacciu, V.; Duce, P.; Spano, D. Assessing exposure of human and ecological values to wildfire in Sardinia, Italy. Int. J. Wildland Fire 2013, 22, 549–565. [Google Scholar] [CrossRef]
  16. Keeley, J.E.; Syphard, A.D. Historical patterns of wildfire ignition sources in California ecosystems. Int. J. Wildland Fire 2018, 27, 781–799. [Google Scholar] [CrossRef]
  17. Villarreal, M.L.; Norman, L.M.; Yao, E.H.; Conrad, C.R. Wildfire probability models calibrated using past human and lightning ignition patterns can inform mitigation of post-fire hydrologic hazards. Geomat. Nat. Hazards Risk 2022, 13, 568–590. [Google Scholar] [CrossRef]
  18. Bonner, S.R.; Hoffman, C.M.; Linn, R.R.; Tinkham, W.T.; Atchley, A.L.; Sieg, C.H.; Varner, J.M.; O’Brien, J.J.; Hiers, J.K. Forest structural complexity and ignition pattern influence simulated prescribed fire effects. Fire Ecol. 2024, 20, 82. [Google Scholar] [CrossRef]
  19. Anderson, W.R.; Cruz, M.G.; Fernandes, P.M.; McCaw, L.; Vega, J.A.; Bradstock, R.A.; Fogarty, L.; Gould, J.; McCarthy, G.; Marsden-Smedley, J.B.; et al. A generic, empirical-based model for predicting rate of fire spread in shrublands. Int. J. Wildland Fire 2015, 24, 443–460. [Google Scholar] [CrossRef]
  20. Ager, A.A.; Day, M.A.; Palaiologou, P.; Houtman, R.; Ringo, C.; Evers, C. Cross-Boundary Wildfire and Community Exposure: A Framework and Application in the Western US; USDA Forest Service, Rocky Mountain Research Station: Fort Collins, CO, USA, 2019. [CrossRef]
  21. Cruz, M.G.; Cheney, N.P.; Gould, J.S.; McCaw, W.L.; Kilinc, M.; Sullivan, A.L. An empirical-based model for predicting the forward spread rate of wildfires in eucalypt forests. Int. J. Wildland Fire 2022, 31, 81–95. [Google Scholar] [CrossRef]
  22. Salis, M.; Del Giudice, L.; Alcasena-Urdiroz, F.; Jahdi, R.; Arca, B.; Pellizzaro, G.; Scarpa, C.; Duce, P. Assessing cross-boundary wildfire hazard, transmission, and exposure to communities in the Italy-France Maritime cooperation area. Front. For. Glob. Change 2023, 6, 1241378. [Google Scholar] [CrossRef]
  23. Finney, M.A. FARSITE: Fire Area Simulator-Model Development and Evaluation; U.S. Department of Agriculture, Forest Service, Rocky Mountain Research Station: Fort Collins, CO, USA, 2004.
  24. Finney, M.A. An overview of FlamMap fire modeling capabilities. In Fuels Management-How to Measure Success, Proceedings RMRS-P-41; Andrews, P.L., Butler, B.W., Eds.; USDA Forest Service, Rocky Mountain Research Station: Fort Collins, CO, USA, 2006; pp. 213–220. [Google Scholar]
  25. Arca, B.; Ghisu, T.; Casula, M.; Salis, M.; Duce, P. A web-based wildfire simulator for operational applications. Int. J. Wildland Fire 2019, 28, 99. [Google Scholar] [CrossRef]
  26. Trucchia, A.; D’Andrea, M.; Baghino, F.; Fiorucci, P.; Ferraris, L.; Negro, D.; Gollini, A.; Severino, M. PROPAGATOR: An operational cellular-automata based wildfire simulator. Fire 2020, 3, 26. [Google Scholar] [CrossRef]
  27. Voltolina, D.; Cappellini, G.; Apuani, T.; Sterlacchini, S. Pyros: A raster–vector spatial simulation model for predicting wildland surface fire spread and growth. Int. J. Wildland Fire 2024, 33, WF22142. [Google Scholar] [CrossRef]
  28. Salis, M.; Arca, B.; Del Giudice, L.; Palaiologou, P.; Alcasena-Urdiroz, F.; Ager, A.; Fiori, M.; Pellizzaro, G.; Scarpa, C.; Schirru, M.; et al. Application of simulation modeling for wildfire exposure and transmission assessment in Sardinia, Italy. Int. J. Disaster Risk Reduct. 2021, 58, 102189. [Google Scholar] [CrossRef]
  29. Palaiologou, P.; Kalabokidis, K.; Day, M.A.; Ager, A.A.; Galatsidas, S.; Papalampros, L. Modelling fire behavior to assess community exposure in Europe: Combining open data and geospatial analysis. ISPRS Int. J. Geo Inf. 2022, 11, 198. [Google Scholar] [CrossRef]
  30. Scott, J.H.; Short, K.C.; Finney, M.; Gilbertson-Day, J.; Vogler, K.C. FSim: The Large-Fire Simulator—Guide to Best Practices Version 0.3.1; Missoula Fire Sciences Lab: Missoula, MT, USA, 2018. [Google Scholar]
  31. Aparício, B.A.; Benali, A.; Pereira, J.M.C.; Sá, A.C.L. MTTfireCAL Package for R—An Innovative, Comprehensive, and Fast Procedure to Calibrate the MTT Fire Spread Modelling System. Fire 2023, 6, 219. [Google Scholar] [CrossRef]
  32. Finney, M.A. Fire growth using minimum travel time methods. Can. J. For. Res. 2002, 32, 1420–1424. [Google Scholar] [CrossRef]
  33. Ager, A.A.; Vaillant, N.M.; Finney, M.A. Integrating fire behavior models and geospatial analysis for wildland fire risk assessment and fuel management planning. J. Combust. 2011, 2011, e572452. [Google Scholar] [CrossRef]
  34. Sá, A.C.L.; Aparicio, B.; Benali, A.; Bruni, C.; Salis, M.; Silva, F.; Marta-Almeida, M.; Pereira, S.; Rocha, A.; Pereira, J. Coupling wildfire spread simulations and connectivity analysis for hazard assessment: A case study in Serra da Cabreira, Portugal. Nat. Hazards Earth Syst. Sci. 2022, 22, 3917–3938. [Google Scholar] [CrossRef]
  35. Kudláčková, L.; Poděbradská, M.; Bláhová, M.; Cienciala, E.; Beranová, J.; McHugh, C.; Finney, M.; Novotný, J.; Zahradníček, P.; Štěpánek, P.; et al. Using FlamMap to assess wildfire behavior in Bohemian Switzerland National Park. Nat. Hazards 2023, 120, 3943–3977. [Google Scholar] [CrossRef]
  36. Bruni, C.; Aparicio, B.; Lourenço, B.; Marta-Almeida, M.; Benali, A.; Barreiro, S.; Rocha, A.; Sá, A.C.L. Wildfire exposure and risk in pulp paper companies’ plantations under extreme weather conditions: A case study in North-Western Portugal. Int. J. Disaster Risk Reduct. 2024, 100, 104064. [Google Scholar] [CrossRef]
  37. Heisig, J.; Olson, E.; Pebesma, E. Predicting Wildfire Fuels and Hazard in a Central European Temperate Forest Using Active and Passive Remote Sensing. Fire 2022, 5, 29. [Google Scholar] [CrossRef]
  38. Alhaj-Khalaf, M.W.; Shataee Joibary, S.; Jahdi, R.; Bacciu, V. Improved forest fire spread mapping by developing custom fire fuel models in replanted forests in Hyrcanian forests, Iran. For. Syst. 2021, 30, e008. [Google Scholar] [CrossRef]
  39. Vilà-Vilardell, L.; Keeton, W.S.; Thom, D.; Gyeltshen, C.; Tshering, K.; Gratzer, G. Climate change effects on wildfire hazards in the wildland-urban-interface—Blue pine forests of Bhutan. For. Ecol. Manag. 2020, 461, 117927. [Google Scholar] [CrossRef]
  40. Dye, A.W.; Reilly, M.J.; McEvoy, A.; Lemons, R.; Riley, K.L.; Kim, J.B.; Kerns, B.K. Simulated future shifts in wildfire regimes in moist forests of Pacific Northwest, USA. Geophys. Res. G Biogeosci. 2024, 129, e2023JG007722. [Google Scholar] [CrossRef]
  41. Sidman, G.; Guertin, D.P.; Goodrich, D.C.; Thoma, D.; Falk, D.; Burns, I.S. A coupled modelling approach to assess the effect of fuel treatments on post-wildfire runoff and erosion. Int. J. Wildland Fire 2016, 25, 351–362. [Google Scholar] [CrossRef]
  42. Alcasena, F.J.; Ager, A.A.; Bailey, J.D.; Pineda, N.; Vega-García, C. Towards a comprehensive wildfire management strategy for Mediterranean areas: Framework development and implementation in Catalonia, Spain. J. Environ. Manag. 2019, 231, 303–320. [Google Scholar] [CrossRef] [PubMed]
  43. Jahdi, R.; Salis, M.; Alcasena, F.; Del Giudice, L. Assessing the Effectiveness of Silvicultural Treatments on Fire Behavior in the Hyrcanian Temperate Forests of Northern Iran. Environ. Manag. 2023, 72, 682–697. [Google Scholar] [CrossRef]
  44. Stoof, C.R.; Kok, E.; Cardíl, A.; van Marle, M.J.E. In temperate Europe, fire is already here: The case of The Netherlands. Ambio 2024, 53, 604–623. [Google Scholar] [CrossRef]
  45. San-Miguel-Ayanz, J.; Durrant, T.; Boca, R.; Libertà, G.; Branco, A.; de Rigo, D.; Ferrari, D.; Maianti, P.; Artes, V.; Oom, D.; et al. Advance Report on Forest Fires in Europe, Middle East and North Africa 2024; Publications Office of the European Union: Luxembourg, 2025. [Google Scholar]
  46. Brockerhoff, E.G.; Barbaro, L.; Castagneyrol, B.; Forrester, D.I.; Gardiner, B.; González-Olabarria, J.R.; O’BLyver, P.; Meurisse, N.; Oxbrough, A.; Taki, H.; et al. Forest biodiversity, ecosystem functioning and the provision of ecosystem services. Biodivers. Conserv. 2017, 26, 3005–3035. [Google Scholar] [CrossRef]
  47. Fallah Ghalhari, G.A.; Asadi, M.; Entezari, A. Climate Mapping of Guilan Province by Using Multi Variable Methods. J. Geogr. Cartogr. 2016, 19, 235–251. Available online: https://geoplanning.tabrizu.ac.ir/article_4478.html (accessed on 19 June 2024). (In Persian)
  48. Statistical Centre of Iran. Iran Population and Housing Census 2016; Statistical Centre of Iran: Tehran, Iran, 2016. [Google Scholar]
  49. The Openstreetmap Data Files, Europe. 2024. Available online: https://www.geofabrik.de/ (accessed on 23 October 2024).
  50. Silveira, V.F.; Silva-Junior, C.H.L.; Anderson, L.O.; Aragão, L.E.O.C. Amazon fires in the 21st century: The year of 2020 in evidence. Glob. Ecol. Biogeogr. 2022, 31, 2026–2040. [Google Scholar] [CrossRef]
  51. Farr, T.G.; Rosen, P.A.; Caro, E.R.; Crippen, R.E.; Duren, R.M.; Hensley, S.; Kobrick, M.; Paller, M.; Rodriguez, E.; Roth, L.; et al. The Shuttle Radar Topography Mission. Rev. Geophys. 2007, 45, RG2004. [Google Scholar] [CrossRef]
  52. Jahdi, R.; Salis, M.; Alcasena, F.J.; Arabi, M.; Arca, B.; Duce, P. Evaluating landscape-scale wildfire exposure in northwestern Iran. Nat. Hazards 2020, 101, 911–932. [Google Scholar] [CrossRef]
  53. Scott, J.H.; Burgan, R.E. Standard Fire Behavior Fuel Models: A Comprehensive Set for Use with Rothermel’s Surface Fire Spread Model; USDA Forest Service, Rocky Mountain Research Station: Fort Collins, CO, USA, 2005.
  54. Anderson, H.E. Aids to Determining Fuel Models for Estimating Fire Behavior; USDA Forest Service, Intermountain Forest and Range Experiment Station: Ogden, UT, USA, 1982.
  55. De Cáceres, M.; Martin-StPaul, N.; Turco, M.; Cabon, A.; Granda, V. Estimating daily meteorological data and downscaling climate models over landscapes. Environ. Model. Softw. 2018, 108, 186–196. [Google Scholar] [CrossRef]
  56. Nelson, R.M., Jr. Prediction of diurnal change in 10-h fuel stick moisture content. Can. J. For. Res. 2000, 30, 1071–1087. [Google Scholar] [CrossRef]
  57. Deeming, J.E.; Burgan, R.E.; Cohen, J.D. The National Fire-Danger Rating System, 1978; Department of Agriculture, Forest Service, Intermountain Forest and Range Experiment Station: Ogden, UT, USA, 1977; Volume 39.
  58. Jahdi, R.; Salis, M.; Darvishsefat, A.A.; Mostafavi, M.A.; Alcasena, F.; Etemad, V.; Lozano, O.; Spano, D. Calibration of FARSITE simulator in northern Iranian forests. Nat. Hazards Earth Syst. Sci. 2015, 15, 443–459. [Google Scholar] [CrossRef]
  59. Jahdi, R.; Salis, M.; Darvishsefat, A.A.; Alcasena, F.; Mostafavi, M.A.; Etemad, V.; Lozano, O.M.; Spano, D. Evaluating fire modelling systems in recent wildfires of the Golestan National Park, Iran. Forestry 2016, 89, 136–149. [Google Scholar] [CrossRef]
  60. Gonzalez, S.; Ghermandi, L. How to define the wildland-urban interface? Methods and limitations: Towards a unified protocol. Front. Environ. Sci. 2024, 11, 1284631. [Google Scholar] [CrossRef]
  61. Schug, F.; Bar-Massada, A.; Carlson, A.R.; Cox, H.; Hawbaker, T.J.; Helmers, D.; Hostert, P.; Kaim, D.; Kasraee, N.K.; Martinuzzi, S.; et al. The global wildland–urban interface. Nature 2023, 621, 94–99. [Google Scholar] [CrossRef]
  62. Radeloff, V.C.; Hammer, R.B.; Stewart, S.I.; Fried, J.S.; Holcomb, S.S.; McKeefry, J.F. The wildland–urban interface in the United States. Ecol. Appl. 2005, 15, 799–805. [Google Scholar] [CrossRef]
  63. Radeloff, V.C.; Helmers, D.P.; Kramer, H.A.; Mockrin, M.H.; Alexandre, P.M.; Bar-Massada, A.; Butsic, V.; Hawbaker, T.J.; Martinuzzi, S.; Syphard, A.D.; et al. Rapid growth of the US wildland–urban interface raises wildfire risk. Proc. Natl. Acad. Sci. USA 2018, 115, 3314–3319. [Google Scholar] [CrossRef]
  64. Bar-Massada, A.; Syphard, A.D.; Hawbaker, T.J.; Stewart, S.I.; Radeloff, V.C. Effects of ignition location models on the burn patterns of simulated wildfires. Environ. Model. Softw. 2011, 26, 583–592. [Google Scholar] [CrossRef]
  65. Christ, S.; Schwarz, N.; Sliuzas, R. Wildland urban interface of the City of Cape Town 1990–2019. Geogr. Res. 2022, 60, 395–413. [Google Scholar] [CrossRef]
  66. Sanucci, C.; Gonzalez, S.; Ghermandi, L. Mapping the Wildland-Urban Interface from Houses Location and Terrain Slope in Patagonia, Argentina. Environ. Sci. Proc. 2022, 22, 14. [Google Scholar] [CrossRef]
  67. Del Giudice, L.; Arca, B.; Scarpa, C.; Pellizzaro, G.; Duce, P.; Salis, M. The wildland-anthropic interface raster data of the Italy-France maritime cooperation area (Sardinia, Corsica, Tuscany, Liguria, and Provence-Alpes-Côte d’Azur). Data Brief 2021, 38, 107355. [Google Scholar] [CrossRef]
  68. Alcasena, F.J.; Evers, C.R.; Vega-Garcia, C. The wildland-urban interface raster dataset of Catalonia. Data Brief 2018, 17, 124–128. [Google Scholar] [CrossRef]
  69. Scott, J.H. A deterministic method for generating flame-length probabilities. In Proceedings of the Fire Continuum-Preparing for the Future of Wildland Fire, Missoula, MT, USA, 21–24 May 2018; Hood, S.M., Drury, S., Steelman, T., Steffens, R., Eds.; Proceedings RMRS-P-78; U.S. Department of Agriculture, Forest Service, Rocky Mountain Research Station: Fort Collins, CO, USA, 2020; pp. 195–205. [Google Scholar]
  70. Zong, X.; Tian, X.; Wang, X. An optimal firebreak design for the boreal forest of China. Sci. Total Environ. 2021, 781, 146822. [Google Scholar] [CrossRef]
  71. Syphard, A.D.; Keeley, J.E. Location, timing and extent of wildfire vary by cause of ignition. Int. J. Wildland Fire 2015, 24, 37–47. [Google Scholar] [CrossRef]
  72. Elia, M.; Giannico, V.; Lafortezza, R.; Sanesi, G. Modeling fire ignition patterns in Mediterranean urban interfaces. Stoch. Environ. Res. Risk Assess. 2019, 33, 169–181. [Google Scholar] [CrossRef]
  73. Shang, C.; Wulder, M.A.; Coops, N.C.; White, J.C.; Hermosilla, T. Spatially-Explicit Prediction of Wildfire Burn Probability Using Remotely-Sensed and Ancillary Data. Can. J. Remote Sens. 2020, 46, 313–329. [Google Scholar] [CrossRef]
  74. Rogeau, M.P.; Armstrong, G.W. Quantifying the effect of elevation and aspect on fire return intervals in the Canadian Rocky Mountains Armstrong GW. For. Ecol. Manag. 2017, 384, 248–261. [Google Scholar] [CrossRef]
  75. Bountzouklis, C.; Fox, D.M.; Di Bernardino, E. Environmental factors affecting wildfire-burned areas in southeastern France, 1970–2019. Nat. Hazards Earth Syst. Sci. 2022, 22, 1181–1200. [Google Scholar] [CrossRef]
  76. Joshi, K.P.; Adhikari, G.; Bhattarai, D.; Adhikari, A.; Lamichanne, S. Forest fire vulnerability in Nepal’s Chure region: Investigating the influencing factors using generalized linear model. Heliyon 2024, 10, e28525. [Google Scholar] [CrossRef]
  77. Sjöström, J.; Granström, A. Human activity and demographics drive the fire regime in a highly developed European boreal region. Fire Saf. J. 2023, 136, 103743. [Google Scholar] [CrossRef]
  78. Wade, D.D. Flame Descriptors. SFE Fact Sheet 2013-6. Southern Fire Exchange. 2 p. 2013. Available online: https://www.frames.gov/contact (accessed on 18 June 2024).
  79. Valencia, A.; Melnik, K.O.; Kelly, R.J.; Jerram, T.C.; Wallace, H.; Aguilar-Arguello, S.; Katurji, M.; Pearce, H.G.; Gross, S.; Strand, T. Mapping fireline intensity and flame height of prescribed gorse wildland fires. Fire Saf. J. 2023, 140, 103862. [Google Scholar] [CrossRef]
  80. Mitsopoulos, I.D.; Dimitrakopoulos, A.P. Canopy fuel characteristics and potential crown fire behavior in Aleppo pine (Pinus halepensis Mill.) forests. Ann. For. Sci. 2007, 64, 287–299. [Google Scholar] [CrossRef]
  81. Moreno, M.; Bertolín, C.; Arlanzón, D.; Ortiz, P.; Ortiz, R. Climate change, large fires, and cultural landscapes in the mediterranean basin: An analysis in southern Spain. Heliyon 2023, 9, e16941. [Google Scholar] [CrossRef]
  82. Sánchez-García, C.; Revelles, J.; Burjachs, F.; Euba, I.; Expósito, I.; Ibáñez, J.; Schulte, L.; Fernández-López de Pablo, J. What burned the forest? Wildfires, climate change and human activity in the Mesolithic—Neolithic transition in SE Iberian Peninsula. CATENA 2023, 234, 107542. [Google Scholar] [CrossRef]
  83. Natural Resources and Watershed Management Organization (FRWO) of Iran (2017) Forests of Iran. Available online: https://frw.ir/en/page/2206/forest (accessed on 17 October 2024). (In Persian)
  84. Huang, Y.J.; Momohara, A.; Li, S.F.; Ji, X.P.; Qiu, J.; Jia, L.B.; Hu, J.J.; Ji, Y.H.; Zhou, Z.K. Wildfire associated with a deciduous broadleaved forest from the Neogene Baoshan Basin at the southeastern margin of the Tibetan Plateau. J. Palaeogeogr. 2023, 12, 448–462. [Google Scholar] [CrossRef]
  85. Tran, B.N.; Tanase, M.A.; Bennett, L.T.; Aponte, C. High-severity wildfires in temperate Australian forests have increased in extent and aggregation in recent decades. PLoS ONE 2020, 15, e0242484. [Google Scholar] [CrossRef] [PubMed]
  86. Grünig, M.; Seidl, R.; Senf, C. Increasing aridity causes larger and more severe forest fires across Europe. Glob. Change Biol. 2023, 29, 1648–1659. [Google Scholar] [CrossRef]
  87. Parisien, M.A.; Barber, Q.E.; Flannigan, M.D.; Jain, P. Broadleaf tree phenology and springtime wildfire occurrence in boreal Canada. Glob. Change Biol. 2023, 29, 6106–6119. [Google Scholar] [CrossRef]
  88. Park, J.; Moon, M.; Green, T.; Kang, M.; Cho, S.; Lim, J.; Kim, S.J. Impact of tree species composition on fire resistance in temperate forest stands. For. Ecol. Manag. 2024, 572, 122279. [Google Scholar] [CrossRef]
  89. Zhao, J.; Yue, C.; Wang, J.; Hantson, S.; Wang, X.; He, B.; Li, G.; Wang, L.; Zhao, H.; Luyssaert, S. Forest fire size amplifies postfire land surface warming. Nature 2024, 633, 828–834. [Google Scholar] [CrossRef]
  90. Alipour, H.; Olya, H.G.T.; Hassanzadeh, B.; Rezapouraghdam, H. Second home tourism impact and governance: Evidence from the Caspian Sea region of Iran. Ocean Coast. Manag. 2017, 136, 165–176. [Google Scholar] [CrossRef]
  91. Bruno, B.; Sandra, O.; Mário, C.; Jorge, R. Mapping the wildland-urban interface at municipal level for wildfire exposure analysis in mainland Portugal. J. Environ. Manag. 2024, 368, 122098. [Google Scholar] [CrossRef]
  92. Argañaraz, J.P.; Radeloff, V.C.; Bar-Massada, A.; Gavier-Pizarro, G.I.; Scavuzzo, C.M.; Bellis, L.M. Assessing wildfire exposure in the Wildland-Urban Interface area of the mountains of central Argentina. J. Environ. Manag. 2017, 196, 499–510. [Google Scholar] [CrossRef]
  93. Syphard, A.D.; Rustigian-Romsos, H.; Keeley, J.E. Multiple-scale relationships between vegetation, the wildland–urban interface, and structure loss to wildfire in California. Fire 2021, 4, 12. [Google Scholar] [CrossRef]
  94. Hawbaker, T.J.; Henne, P.D.; Vanderhoof, M.K.; Carlson, A.R.; Mockrin, M.H.; Radeloff, V.C. Changes in wildfire occurrence and risk to homes from 1990 through 2019 in the Southern Rocky Mountains, USA. Ecosphere 2023, 14, e4403. [Google Scholar] [CrossRef]
  95. Lantzanakis, G.; Mitraka, Z.; Chrysoulakis, N. Comparison of physically and image based atmospheric correction methods for Sentinel-2 satellite imagery. In Proceedings of the Fourth International Conference on Remote Sensing and Geoinformation of the Environment; SPIE: Bellingham, WA, USA, 2017. [Google Scholar] [CrossRef]
  96. Qui, S.; He, B.; Zhu, Z.; Liao, Z.; Quan, X. Improving Fmask cloud and cloud shadow detection in mountainous area for Landsats 4–8 images. Remote Sens. Environ. 2017, 199, 107–119. [Google Scholar] [CrossRef]
  97. Awad, M.; Khanna, R. Support Vector Machines for Classification. In Efficient Learning Machines; Apress: Berkeley, CA, USA, 2015. [Google Scholar] [CrossRef]
  98. The Management and Planning Organization of Guilan Province, Iran. 2016. Available online: https://gilan.mporg.ir/ (accessed on 18 May 2024). (In Persian)
Figure 1. Map of study area, Guilan Province (14,044 km2), in northern Iran: (a) elevation map (m a.s.l.) (b) and 16 municipalities with weather station locations (c).
Fire 09 00176 g001
Figure 2. LULC (land use/land cover) types (a) and fuel models (fuel model codes and parameters are provided in Table 3) (b) of the study area. White lines separate the four bioclimatic zones in the study area.
Fire 09 00176 g002
Figure 3. Difference in BP values obtained from simulations with random (RND) and observed (OBS) fire ignitions. White lines separate the four bioclimatic zones in the study area.
Fire 09 00176 g003
Figure 4. Burn probability (BP (a,b)), conditional flame length (CFL (m); (c,d)), fire size (FS (ha) (e,f)), and crown fire probability (CFP (g,h)) for OBS (observed (a,c,e,g)) and RND (random (b,d,f,h)) fire ignition location simulations, under extreme fire weather conditions. White lines separate the four bioclimatic zones in the study area.
Fire 09 00176 g004
Figure 5. Box plot of burn probability (BP; (a,b)), conditional flame length (CFL (m); (c,d)), fire size (FS (ha); (e,f)), and crown fire probability (CFP; (g,h)) distribution in different bioclimatic zones for OBS (observed; (a,c,e,g)) and RND (random; (b,d,f,h)) fire ignition location simulations under extreme fire weather conditions. The dotted line is the median value. Outliers (values beyond 1.5 × the interquartile range (IQR) from Q1 or Q3) are shown as distinct symbols, with different marker shapes (e.g., stars, diamonds, circles) indicating datasets or categories (e.g., OBS vs. RND).
Fire 09 00176 g005
Figure 6. Scatterplots of average burn probability (BP) and average conditional flame length (CFL, m) for the main fuel types in the study area, for OBS (observed; plain fill, no line) and RND (random; plain line, no fill) ignition scenarios. Bubble size represents the average fire size (FS, ha).
Fire 09 00176 g006
Figure 7. Wildland–anthropic interface (WAI) map of the Guilan Province. White lines separate the four bioclimatic zones in the study.
Fire 09 00176 g007
Table 1. Overview of the main characteristics of the bioclimatic zones of the study area.
Bioclimatic ZoneHT
(Humid-Temperate)
CSH
(Cold-Semi-Humid)
CM
(Cold-Mountainous)
SH
(Semi-Humid)
Total
MunicipalitiesBandar Anzali, Somesara, Rasht, Shaft, FoomanMasal, Rezvanshahr, Talesh, AstaraRudbarAstaneh Ashrafieh, Lahijan, Roodsar, Langrood, Amlash, Siahkal-
Size (ha)363,710375,567243,662421,4611,404,400
Inhabitants (2016)1,367,597414,42094,720653,9592,530,696
Population density (people per km2)27017250225180
Anthropic structures count7454269378812,62623,561
Elevation
(m a.s.l.)
−74 to 3039−43 to 319841 to 2745−41 to 3680−74 to 3680
Mean annual precipitation (mm)1430130024012501100
Mean annual temperature (°C)17.815.915.716.316.5
Main LULC types (>10% zonal area)Orchard-irrigation farming (49%) and Dense broadleaved forests (19%)Dense broadleaved forests (47%), Dense rangeland (13%), and Orchard-irrigation farming (12%)Dense broadleaved forests (29%), Medium density rangeland (21%), Dense rangeland (11%), and Dry farming (10%)Orchard-irrigation farming (31%) and Dense broadleaved forests (27%)Dense broadleaved forests (31%) and Orchard-irrigation farming (26%)
Inhabitant data refer to Iran’s Population and Housing Census [48]. Anthropic structures were derived from the buildings shapefiles available on Open Street Map [49]. Weather data were derived from the weather stations (Figure 1; 1992–2022). Main LULC types were derived from Figure 2.
Table 2. Wildfire regime characteristics (1992–2022) across the four bioclimatic zones of the study area. Values in parenthesis show the incidence of each bioclimatic zone (in percentage) in terms of total fire number and burned area.
Bioclimatic ZoneHTCSHCMSHTotal
Total fire number (#)533 (23.7%)589
(26.2%)
374
(16.6%)
753
(33.5%)
2249
Total burned area (ha)6409.6 (25.1%)6131 (23.9%)4732.3 (18.5%)8291.3 (32.4%)25,564.3
Burned area/fire number ratio12.0210.4012.7011.0111.36
Annual fire number (# yr−1)
Mean1718122470
Minimum10002
Maximum547577100287
Annual burned area (ha yr−1)
Mean202.74190.94151.53262.77788.03
Minimum7.690.000.000.0017.58
Maximum586.65616.02745.16957.162427.55
Table 3. Characteristics of the surface fuel models and the standard fuel model adopted (FBFM40 [53]; FBFM13 [54]), used for fire simulations within FlamMap MTT.
Fuel TypeFuel Model CodeLULC ClassesStandard Fuel ModelDead Fuel Load
(t ha−1)
Live Fuel Load
(t ha−1)
Fuel Bed Depth (cm)Fuel Moisture Values
FBFM40FBFM131-h10-h100-hLiveHLiveW1-h10-h100-hLiveHLiveW
Grass
FM3Marshes & Reed bedsGR332.500001057910070
GR3Dry farmingGR332.400003057910070
GR5Scarce & low rangelandGR531000010468100100
GR6Medium density rangelandGR631.2000010568100100
GR9Dense rangelandGR931.60000105688060
Grass-Shrubs
GS3Moderate load grass-shrubs GS310.70.20.10.20.1105798060
GS4High load grass-shrubs GS420.90.30.10.30.1105798060
Shrubs
SH3ShrublandsSH37210.10.91.1405798060
SH4WoodlandSH4721.60.40.70.3205798060
Timber litter
TL4Broadleaved plantation forestTL483.63.60.12.10.920571090100
TL9Dense broadleaved forestTL992.31.20.50.40.6306810100100
Timber understory
TU1Conifer plantation forestTU1104.121.12.71.36057990100
TU2Sparse broadleaved forestTU2102.21.100.1010681070100
TU3Semi-dense broadleaved forestTU3103.52.10.20.40.630681070100
Table 4. Weather data used for wildfire simulations in different bioclimatic zones under extreme fire weather conditions.
Bioclimatic ZoneHTCSHCMSH
Fuel moisture1-h7666
10-h8777
100-h9888
Wind speed (m s−1)66187
Wind directionW (270°)SW (225°)W (270°)W (270°)
Table 5. Simulated values (mean ± standard deviation (STD)) of wildfire hazard metrics for observed (OBS) and random (RND) ignition scenarios under extreme fire weather, across the four bioclimatic zones and the entire study area. Different superscript letters (a, b) within each column indicate statistically significant differences between OBS and RND simulations (p-value < 0.05).
Wildfire
Hazard
Fire
Ignition Scenario
Bioclimatic ZoneTotal
HTCSHCMSH
Burn
Probability (BP)
OBS7.2 × 10−4 ±
2.4 × 10⁻³ a
9.9 × 10⁻⁴ ±
2.2 × 10⁻³ a
3.4 × 10⁻³ ±
6.9 × 10⁻³ a
9.2 × 10⁻⁴ ±
2.4 × 10⁻³ a
1.3 × 10⁻³ ±
3.7 × 10⁻³ a
RND5.0 × 10−4 ±
8.6 × 10⁻⁴ b
1.2 × 10⁻³ ±
9.9 × 10⁻⁴ b
3.1 × 10⁻³ ±
3.6 × 10⁻³ b
8.6 × 10⁻⁴ ±
1.0 × 10⁻³ b
1.2 × 10⁻³ ± 1.9 × 10⁻³ b
Conditional Flame Length (CFL, m)OBS0.25 ± 0.55 a0.56 ± 0.72 a0.93 ± 1.06 a0.53 ± 0.81 a0.54 ± 0.81 a
RND0.42 ± 0.67 b0.93 ± 0.69 b1.19 ± 1.00 b0.72 ± 0.82 b0.78 ± 0.83 b
Fire Size
(FS, ha)
OBS411.18 ± 586.60 a1046.46 ± 565.93 a1632.10 ± 1702.13 a827.89 ± 809.48 a917.28 ± 1017.39 a
RND421.94 ± 586.26 b1067.72 ± 572.74 b1770.61 ± 1836.64 b862.73 ± 840.75 b961.13 ± 1081.29 b
Crown Fire Probability (CFP)OBS0.035 ± 0.174 a0.032 ± 0.165 a0.234 ± 0.340 a0.075 ± 0.232 a0.096 ± 0.254 a
RND0.042 ± 0.179 b0.032 ± 0.161 a0.257 ± 0.347 b0.080 ± 0.224 b0.097 ± 0.250 a
Table 6. Wildland–anthropic interface (WAI) structures threatened by wildfires for OBS (observed) and RND (random) ignition scenarios. Threatened structures were calculated in areas with burn probability (BP) > 0.01. Data are reported for WAI classes and bioclimatic zones.
WAI TypeIgnition ScenarioBioclimatic Zones
HTCSHCMSHTotal
Threatened Structures
(count)(%)(count)(%)(count)(%)(count)(%)(count)(%)
Anthropic
Medium & High Anthr. PresenceOBS50.7471.4641.6190.22250.46
RND50.7481.6652.01100.25280.52
Wildland–Anthropic (WA)
WA InterfaceOBS11.0444.3015.56410.26104.07
RND11.0433.23211.11615.38124.88
WA IntermixOBS42.2750.4141.34160.35290.47
RND42.2760.4951.67170.38320.52
Dispersed Anthropic (DA)
DA in Forest AreasOBS00.0000.0027.4100.0024.26
RND00.0000.00311.11114.2948.51
DA in Rural AreasOBS23.9200.0086.35100.85201.46
RND35.88233.3397.14131.10271.98
DA in Non-Vegetated AreasOBS60.0910.1134.3550.17150.15
RND80.1240.4534.3550.17200.19
Total WAI
Total WAIOBS180.24170.63222.79400.32970.41
RND210.28230.85273.43520.411230.52
Disclaimer/Publisher’s Note: The statements, opinions and data contained in all publications are solely those of the individual author(s) and contributor(s) and not of MDPI and/or the editor(s). MDPI and/or the editor(s) disclaim responsibility for any injury to people or property resulting from any ideas, methods, instructions or products referred to in the content.