


Abstract
National wildfire danger systems compress accumulated fire weather memory, current weather and seasonality into operational indices, but their contributions to occurrence discrimination are rarely tested. We decomposed weather–temporal information into three blocks—the six Fire Weather Index (FWI) components (F), current and derived weather (W) and a cyclic day-of-year time proxy (T)—and evaluated prespecified paired contrasts with a harmonized random forest on station-day data from South Korea, Spain and Canada, using independent test periods. Adding W and T to F increased the test area under the receiver operating characteristic curve (ROC-AUC) by 0.0337–0.0448; in every country, W contributed more (0.0167–0.0227) than T (0.0054–0.0114). The contribution of T depended on how seasonality was already represented; it rose when the FWI’s embedded seasonal coefficients were neutralized (Canada) and was conditional on the Korean index’s fixed seasonal weight. Relative to each national reference, augmented structures increased ROC-AUC by 0.0243 (weather–temporal substructure of the Korean Forest Fire Danger Rating Index), 0.0796 (Spain’s reconstructed station-relative reference) and 0.0371 (Canada’s official FWI components). Common and reference contrasts were robust to clustered inference, matching-distance rules, undersampling and algorithm choice. The results support staged enhancement of weather–temporal information structures through parallel production, forecast-driven validation and recalibration rather than index replacement.
1. Introduction
Wildfire occurrence and spread result from interactions among weather, fuels, ignition sources and topography [1,2,3], and fire weather conditions have lengthened and intensified in many regions in recent decades [4]. Fire danger, however, is not determined by the weather of a single day. Drying accumulated over preceding days to months, seasonal vegetation states and recurrent ignition environments also shape the level of risk. National wildfire danger systems translate this complexity into daily operational indices and, in doing so, compress meteorological information that operates over different time scales into a small number of values [5,6,7]. A danger index can therefore be viewed as an information architecture, determining which current-day weather signals are retained, how drying is carried forward from previous days and how seasonal timing is represented.
These architectures are not fixed. The Algorithm Theoretical Basis Document (ATBD) of the Korean Forest Fire Danger Rating Index (FFDRI) anticipates continued revision of its inputs and methods [8], Spain introduced a new forest fire danger index in 2026 [9], and the Canadian Forest Fire Danger Rating System is being redeveloped [10]. Evidence on which information each component contributes is therefore directly relevant to how such systems are revised.
Our previous study [11] showed, using nationwide South Korean data for 2011–2025, that calendar-based time proxy variables carry predictive information for daily wildfire occurrence and complement the Fire Weather Index (FWI). Three gaps remain. It is unknown whether the conditional contributions of accumulated memory, current weather and seasonal position observed in one country are reproduced under contrasting fire regimes. It is also unknown whether the contribution of a learnable seasonal term depends on the form of seasonal information already present. Finally, it is unclear how retrospective discrimination relates to operational constraints, such as the availability of official information, spatial representativeness and the use of forecast inputs.
The first structural question concerns current weather and accumulated fire weather memory. The FWI System recursively updates fuel-moisture codes with response times from days to months, so that its six components summarize drying histories rather than the conditions of a single day [5,6]. Daily extremes, diurnal variability and atmospheric dryness, however, are only partly represented in its four noon inputs, and index values are sensitive to the meteorological inputs from which they are computed [12,13]. Other operational designs carry memory differently. The weather component of the Korean FFDRI, for example, represents recent conditions through effective humidity and a rainfall effect—a short-lag empirical memory—rather than through a recursive fuel-moisture state [8]. Whether recursive memory absorbs the information in current-day weather, or whether the two are complementary, cannot be determined by comparing final index values. Most machine-learning studies of wildfire occurrence have instead compared predictors and algorithms for the best-performing model [14], which leaves the contribution of each information component untested.
The second structural question concerns seasonality, which national systems encode in at least three ways. A fixed seasonal weight assigns predetermined danger levels to calendar periods; the Korean FFDRI applies such a daily weight by month and 10-day period outside its weather component [8]. An embedded representation places seasonal terms inside the index equations; the Drought Code and Duff Moisture Code of the FWI System contain fixed monthly day-length factors [5]. A learnable representation, such as a cyclic encoding of the day of year, provides only the position within the annual cycle and allows a model to learn its association with occurrence [11,15]. Statistical fire-occurrence prediction systems have long combined fire weather indices with temporal terms [16,17,18], but whether the marginal value of a learnable seasonal term depends on how much seasonal information an operational structure already contains has not been examined. Neither representation is assumed here to be superior; the question is how they interact with the remaining weather information.
National systems also differ in practical constraints that motivate a comparative design. Because the Korean daily weight is fixed by calendar period, it cannot adapt to shifts in the timing of the fire season. In the Canadian data, official FWI information was not produced outside a defined operational season, so it was unavailable on some days on which fires occurred (Section 3.5). Spanish danger information is interpreted relative to station-specific FWI distributions [19,20,21], and archived daily operational products are not readily available for retrospective evaluation.
South Korea, Spain and Canada were therefore selected not as a representative sample but as theoretically contrasting cases that share the FWI as a common fire weather axis. South Korea has an East Asian monsoon climate, a late-winter and spring fire season and an index that combines weather, forest-stand, topographic and fixed seasonal information. Spain has a Mediterranean summer fire regime with station-relative interpretation. Canada is the boreal and cold-temperate setting in which the FWI System was developed, and its official, recalculated and seasonally neutralized components can be distinguished.
To address these gaps across systems whose final indices are not equivalent, we decompose weather–temporal information into three blocks (Section 2.2). F comprises the six components of the FWI System—the Fine Fuel Moisture Code (FFMC), Duff Moisture Code (DMC), Drought Code (DC), Initial Spread Index (ISI), Buildup Index (BUI) and FWI—and represents recursive multi-timescale fire weather memory. W comprises current-day and derived weather variables that retain daily extremes, variability and atmospheric dryness. T is a cyclic time proxy representing position within the annual cycle. FWT is therefore a prespecified structure containing these three dimensions of information, not a combination selected for high performance.
The present study uses the same Korean wildfire and Automated Synoptic Observing System (ASOS) source data as [11] but differs from it in five respects (Table S1). First, in sample processing, the Korean panel is analyzed together with independently constructed Spanish and Canadian station-day panels built under common panel-construction rules. Second, in predictors, the earlier calendar time proxy set is restricted to two cyclic day-of-year coordinates, and current weather is organized as a separate block rather than as a weather-only feature set. Third, in model training, a single random forest specification is fixed in advance and applied without feature-set-specific tuning, instead of comparing algorithms and interpreting feature importance. Fourth, in evaluation design, inference rests on prespecified paired contrasts evaluated on identical station-days in chronologically independent test periods. Fifth, in metrics and inference, incremental ROC-AUC and PR-AUC are reported with clustered bootstrap intervals and multiplicity-adjusted p-values, together with calibration and operational-coverage analyses.
The Korean train, validation and test periods are also identical to those of the earlier study, so the Korean analysis is not an independent temporal test of its findings; the independent evidence comes from contrasts the earlier study did not examine (the conditional contributions of W and T, FWT − FWD and FWT − KD) and from their replication in Spain and Canada. The earlier Korean results are therefore not re-evaluated; the new contributions are the conditional decomposition of weather–temporal information, its replication in two further national contexts and its direct comparison with the weather–temporal substructure of the FFDRI.
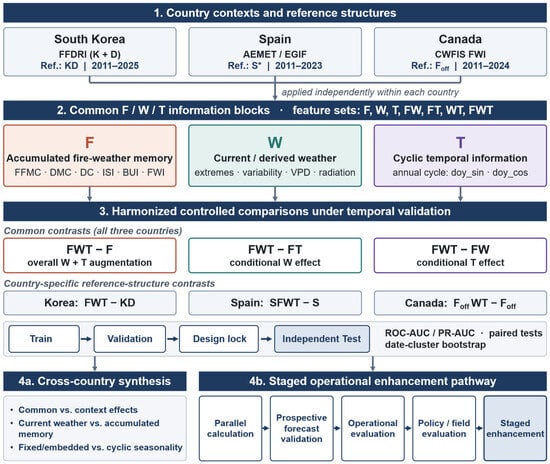
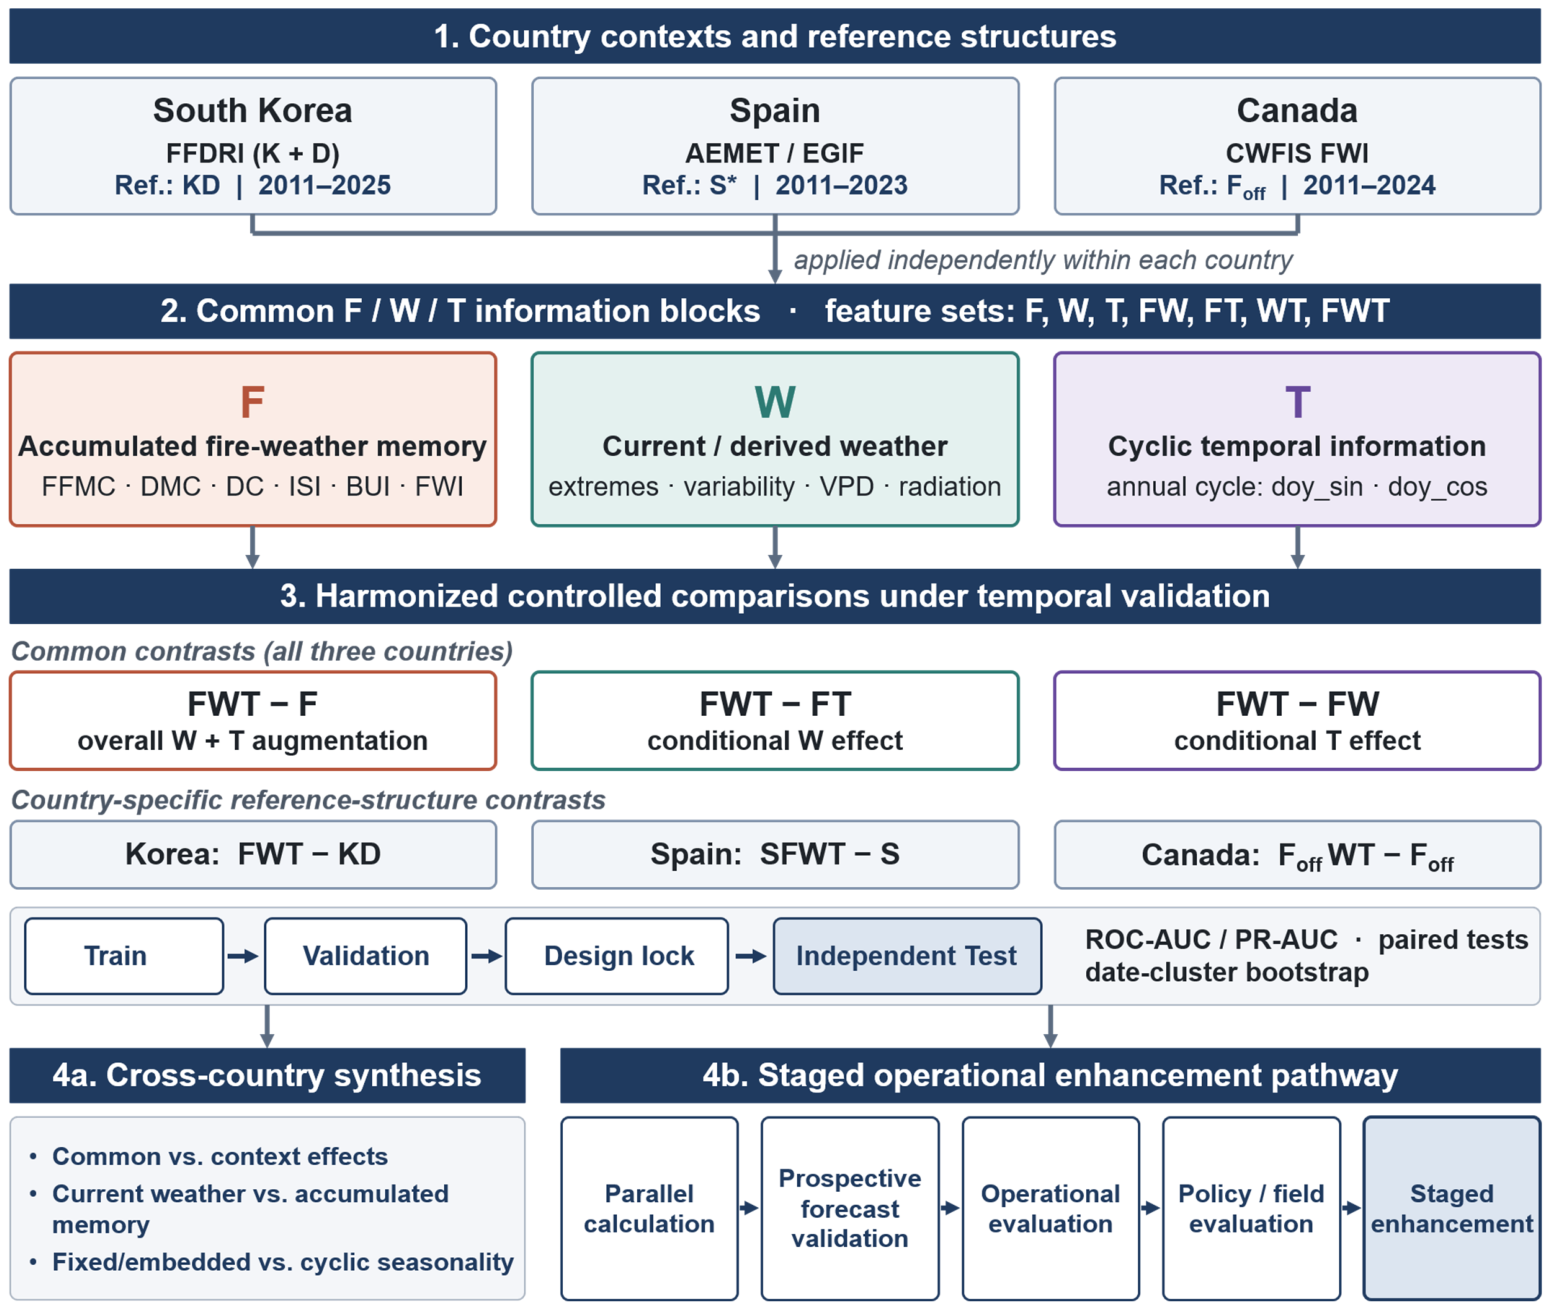
The central question of this study is therefore whether augmenting accumulated fire weather memory with current weather and learnable cyclic seasonal information yields reproducible additional discrimination across contrasting national wildfire danger systems, and what this implies for the staged enhancement of their weather–temporal information structures. It is broken down into three sub-questions, each answered by prespecified contrasts (Figure 1).
Figure 1.
Analytical framework for comparing weather–temporal information structures across three wildfire danger systems. Common F/W/T contrasts were evaluated within each country, and country-specific reference contrasts were assessed separately according to the information structure of each reference system. KD = Korean FFDRI weather–temporal substructure (K + D); S* = reconstructed station-relative reference used for Spain; Foff = official six-component FWI information used in Canada.
Q1 (complementarity): Do current weather and cyclic seasonal position add discrimination to accumulated fire weather memory within each country (FWT − F, FWT − FT and FWT − FW), and is this reproduced across the three systems?
Q2 (seasonal representation): Does the contribution of a learnable seasonal term depend on how seasonality is already represented—as a fixed weight, within the index equations or relative to station climatology (FWT − FWD in South Korea, F0T − F0 in Canada and the role of T alongside S in Spain)?
Q3 (reference structures and operational scope): How much do the augmented structures add relative to each national reference structure—the FFDRI weather–temporal substructure (KD) in South Korea, a reconstructed station-relative reference (S) in Spain and the official FWI components (Foff) in Canada? How do temporal reproducibility, inference choices, probability calibration and the availability of official information constrain operational use? Within Q3, the Korean contrast FWT − KD is the direct policy case, because KD is the weather–temporal substructure of an operational national index.
Q1 is answered in Section 3.1, Q2 in Section 3.2 and Q3 in Section 3.3 and Section 3.5, with the robustness of all three answers examined in Section 3.4. The study neither evaluates nor proposes to replace any complete national danger system; in South Korea the comparison is restricted to the weather–temporal substructure and excludes the Forest Map Index (FMI) and Topographic Map Index (TMI).
2. Materials and Methods
2.1. Data, Labels and Temporal Splits
Station-day panels were constructed independently for each country from public wildfire and meteorological records (Table 1). For weather station s on day t, the binary outcome yst was 1 when at least one wildfire was assigned to s on t and 0 otherwise; multiple fires assigned to the same station-day were consolidated into a single positive station-day. Within each country, all feature sets were evaluated on identical station-day keys and outcomes, so that paired contrasts reflect predictor information rather than differences in the evaluation population. FWI components were computed sequentially by date after a one-year warm-up (2010) that was excluded from modeling.
Table 1.
Data, labels, temporal splits and model specification by country.
In South Korea, 7140 wildfires recorded during 2011–2025 were assigned to the nearest operating ASOS station with valid observations on the occurrence date among the 100 stations of the Korea Meteorological Administration (KMA) [22]; after 497 same-station, same-day fires were merged, the panel contained 517,448 station-days, including 6643 positive station-days. These are the same source data as those used in [11].
In Spain, 133,997 wildfires with valid coordinates in the Estadística General de Incendios Forestales (EGIF) [23] were assigned to the nearest of 364 Agencia Estatal de Meteorología (AEMET) stations that met a 70% annual data-availability criterion [24]; 1083 fires were excluded because of missing or implausible coordinates. No maximum matching distance was imposed in the primary analysis (median 16.41 km; 95th percentile 46.98 km); sensitivity to 30 km and 50 km limits is reported in Section 3.4.
FWI components were recalculated from AEMET daily mean temperature, relative humidity, wind speed and precipitation using the FWI_CMIP6 algorithm [25]. Missing values of these four inputs were imputed by same-day inverse-distance weighting (IDW, power 2) within 100 km using two to 12 neighboring stations, with a 150 km fallback applied only to 26 remaining days at station B954. W variables were not imputed, and solar radiation was obtained from ERA5-Land [26]. Because W was required to be complete, 382 positive validation and 306 positive test station-days were excluded from evaluation. Because FWI values depend on the meteorological inputs used [13], these recalculated values are not reconstructions of AEMET operational products.
In Canada, point records from the Canadian National Fire Database [27] for Alberta, British Columbia, New Brunswick, Newfoundland and Labrador, Nova Scotia and Quebec were assigned to the nearest eligible operating Environment and Climate Change Canada (ECCC) station within 50 km [28]. F was recalculated from ECCC observations [29,30], whereas W combined ERA5-Land temperature, humidity and solar radiation extracted at station locations through Google Earth Engine [26,31] with noon wind speed from the Canadian Wildland Fire Information System (CWFIS) [32]. The primary population A′ comprised station-days on which the official CWFIS components, the recalculated components and W were all available; of the 32,079 positive station-days with official FWI information in the full panel, 32,076 met these conditions.
Data were split chronologically rather than randomly to avoid optimistic estimates from temporally dependent observations [33] (Table 1). Hereafter, train, validation and test denote these fixed chronological periods and their samples. The splits differ among countries because the available study periods differ; they were fixed before any test evaluation and were not aligned retrospectively. Only the train period was used for model fitting, the validation period was used to finalize specifications, and the test period was used once for evaluation; no feature, model or threshold was selected on test data.
Undersampling was applied to the train period only, retaining all positive station-days and sampling negative station-days at a 1:2 ratio—across the whole train period in South Korea and Spain and within each train year in Canada (random seed 42 in all cases). Validation and test samples retained their observed fire occurrence rates. Missing predictor values were handled as prespecified in each country: complete cases in Spain and Canada, and zero-filling in South Korea, which affected 588 of 140,141 test station-days (0.42%). The sensitivity of the results to the undersampling scheme and to the Korean missing-value rule is reported in Section 3.4.
2.2. Information Blocks, Reference Structures and Planned Contrasts
In all countries, F comprised the six FWI System components and T comprised doy_sin and doy_cos, the sine and cosine transforms of the day of year. In each country, W was designed to capture daily extremes, within-day variability and derived measures of atmospheric dryness. The variables and data sources used to construct W differed by country (Table 2). Differences in W composition and in matching rules mean that effect sizes are compared within countries and are not ranked across countries.
In South Korea, the FFDRI combines the Daily Weather Index (DWI), FMI and TMI and multiplies their weighted sum by an official daily weight (D) defined by month and 10-day period [8]:
FFDRI = (7 DWI + 1.5 FMI + 1.5 TMI) × D
The DWI is derived from season-specific occurrence models using daily maximum temperature, mean relative humidity and mean wind speed, with effective humidity added in January–June, and is adjusted by a rainfall effect (RNE) [8]. Following ATBD Version 5.0, the weather block K comprised eff_humidity_v5, rne_v5 and dwi_v5, and KD—K combined with the official D applied without re-estimation—was the Korean reference structure. Because effective humidity and RNE carry information from preceding days, K represents a short-lag empirical weather memory, in contrast to the recursive multi-timescale memory of F. FMI and TMI were outside the comparison.
For Spain, an archive of official daily AEMET danger forecasts covering the study period was not available.
We therefore constructed a station-relative reference S from the recalculated FWI (Figure 2), following the relative FWI framework used for operational interpretation in Spain [20,21]: for each station i, the percentile rank of daily FWI within that station’s train-period (2011–2017) FWI distribution, on a continuous 0–100 scale:
Si,t = PRanki,Train(FWIi,t), 0 ≤ Si,t ≤ 100
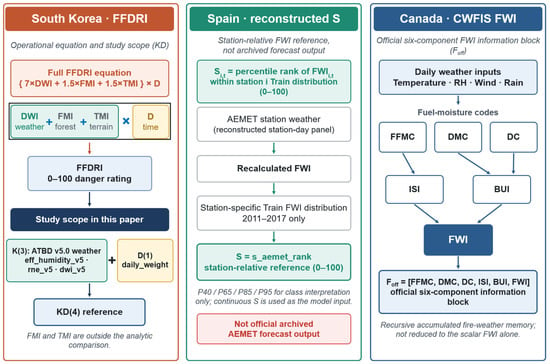
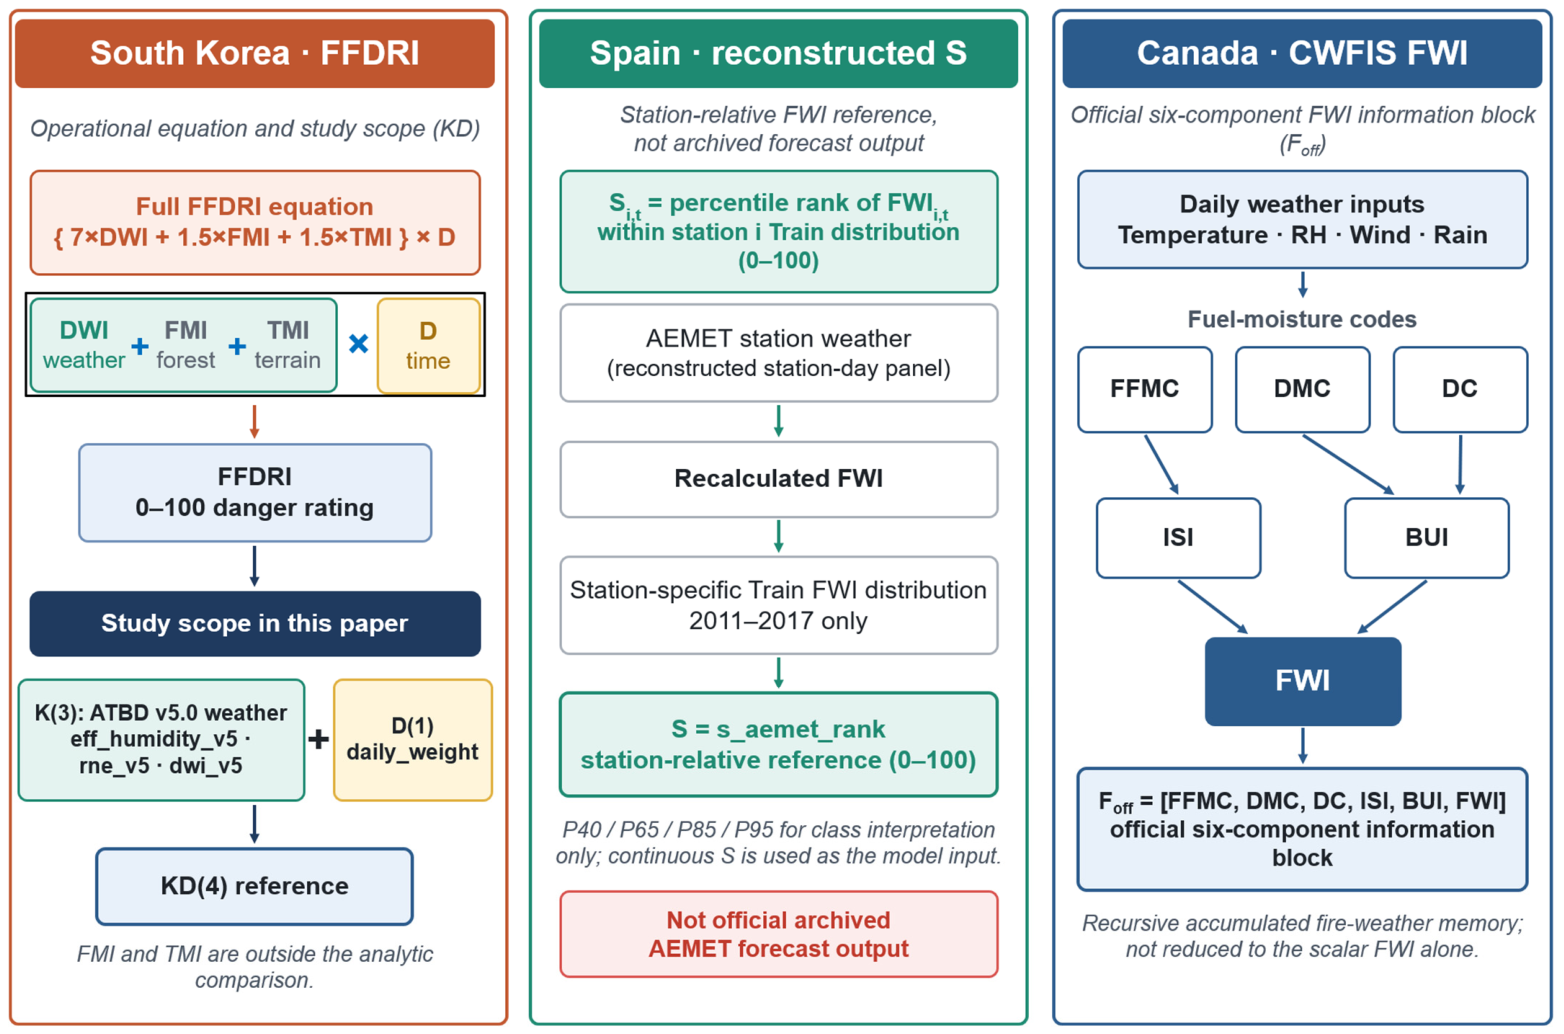
Figure 2.
National reference information structures used in the three-country comparison. The South Korean panel shows the FFDRI structure and the KD weather–temporal substructure analyzed in this study; KD uses daily maximum temperature, mean relative humidity, effective humidity and mean wind speed, with precipitation entering through RNE. The Spanish panel shows the reconstructed station-relative reference S and the Canadian panel shows the official six-component block Foff; both are derived from FWI computed from temperature, relative humidity, wind speed and precipitation. The three structures are not equivalent national danger indices, and each contrast is interpreted within its national information structure.
S is a monotonic transformation of each station’s FWI and is therefore neither independent of F nor a record of official forecasts; contrasts involving S measure added discrimination relative to this research reference only.
For Canada, the reference Foff was the six official CWFIS components [32]:
Foff,t = [FFMCt, DMCt, DCt, ISIt, BUIt, FWIt]
The recalculated block F followed the standard implementation, in which the DMC and DC include fixed monthly day-length factors [5,29,30]. A seasonally neutralized block F0, in which these factors were replaced by the system’s non-seasonal constants (Le = 9.0000, Lf = 1.3900), was prespecified before model fitting as a secondary experiment to isolate embedded seasonal information; it is not an operational product. A prespecified alternative set of constants (Le = 9.7750, Lf = 1.3917; the annual means of the monthly factors) was not run, so the F0 results are conditional on the primary constants.
Feature sets were defined before model fitting to answer the three sub-questions rather than to identify the best-performing combination (Table 2). The common contrasts were FWT − F, FWT − FT and FWT − FW, and the country-specific reference contrasts were FWT − KD, SFWT − S and FoffWT − Foff. Secondary prespecified contrasts were FWT − FWD in South Korea, which replaces the fixed daily weight by T under a constant F + W structure, and F0T − F0 in Canada. A comparison of the positive station-days captured by S, F and SF within a fixed top-10% capacity in Spain was a post hoc exploratory analysis and is reported only in Table S5.
Table 2.
Information blocks, reference structures, feature sets and planned contrasts by country.
2.3. Harmonized Model Specification
A single random forest specification—500 trees, a maximum depth of 10, a minimum of 20 samples per leaf and random seed 42—was applied to every feature set in all three countries, with no feature-set-specific tuning, so that differences between feature sets cannot reflect unequal optimization (Table 1). The specification was selected in South Korea before any test evaluation: eight candidate algorithms were compared on validation data, and random forest was chosen by a prespecified rule (among models whose mean ROC-AUC across the KWT and FWT sets was within 0.002 of the highest, the model with the highest mean PR-AUC). The same specification was then carried forward unchanged to Spain and Canada. Country-specific models that had been prespecified—LightGBM as the primary Spanish model and as a supplementary Canadian model—are reported where relevant, but all cross-country statements are based on the harmonized random forest. Re-fitting the locked Spanish FWT model in a current computing environment reproduced its validation ROC-AUC to within 0.0001 (0.7632 vs. 0.7633), with small differences in individual scores attributable to software versions. All analyses were performed in Google Colaboratory with Python 3.13.15, scikit-learn 1.6.1 and LightGBM 4.6.0.
To examine dependence on the algorithm, LightGBM contrasts were evaluated in all three countries with the same date-cluster bootstrap and Holm adjustment as the random forest (Table S6); in South Korea, LightGBM models were refitted with the locked specification and train sample, reproducing the locked test values of all previously fitted feature sets.
2.4. Statistical Inference, Robustness and Calibration
Discrimination was measured by ROC-AUC, with PR-AUC as a supplementary metric because it depends on the occurrence rate [34,35]. Each contrast A − B compares two feature sets scored on the same station-days. Station-day observations are not independent. Stations share weather on the same date, and each station contributes a long series. Primary inference therefore used a paired bootstrap that resamples calendar dates and retains all stations of each sampled date (5000 replicates) [36,37]; this accommodates arbitrary dependence among stations within a day but assumes approximate independence between dates. In South Korea and Canada, paired DeLong tests [38], which assume independent observations, are also reported for reference. All p-values were adjusted by the Holm procedure [39] within the comparison families prespecified in each country; bootstrap p-values have a resolution of 2/B (0.0004 for B = 5000) and are reported after adjustment (Table A1).
Because date clustering does not address serial dependence within stations, the test contrasts were also recomputed with a bootstrap that resamples stations, retaining all days of each sampled station, and with a two-way pigeonhole bootstrap that resamples dates and stations simultaneously [40,41] (B = 2000 for these additional analyses).
Further sensitivity analyses addressed three choices. (i) For the Spanish matching distance, positive station-days whose nearest matched fire was more than 30 km or 50 km away were removed from evaluation. Separately, the Spanish labels were rebuilt with a 50 km limit and the models were re-fitted; station-days linked only to fires beyond 50 km became negatives, whereas those with at least one fire within 50 km remained positive. This is a redefinition of the outcome rather than a correction of the primary labels. (ii) For the undersampling scheme, the Spanish models were re-fitted with year-stratified 1:2 undersampling, as used in Canada. (iii) For the Korean missing-value rule, station-days with any missing predictor were excluded. These analyses were added during revision; their thresholds and procedures were fixed before their results were examined, and they did not alter the primary analysis.
A contrast, such as FWT − FT, is interpreted as the conditional contribution of W: the additional discrimination obtained when W is added to a model that already contains F and T, under a fixed model specification and evaluation sample. It is a predictive increment, not a causal effect or a unique physical contribution. Because F and W share meteorological inputs and are correlated, the information attributed to a block depends on the blocks already present; the three common contrasts are therefore reported together and are not summed or ranked as independent shares.
Random forest scores trained on undersampled data are not probabilities on the scale of the observed occurrence rate [42,43]. To evaluate probabilistic use, test scores of FWT and of each reference structure were (i) corrected for the known train sampling ratio β of negative station-days as p′ = βp/(βp − p + 1) [42] and (ii) recalibrated by isotonic regression fitted on validation data only [44]. For Canada, where negatives were undersampled within each year, the whole-period ratio was applied, so the correction is approximate; the isotonic recalibration does not depend on β. Calibration was summarized by the Brier score [45], the Brier skill score relative to a constant forecast equal to the validation occurrence rate, and reliability diagrams [46]. These transformations are monotonic and leave ROC-AUC unchanged. No formal cross-country interaction test or meta-analysis was performed; cross-country synthesis concerns the direction and reproducibility of within-country contrasts.
3. Results
3.1. Complementarity of F, W and T (Q1)
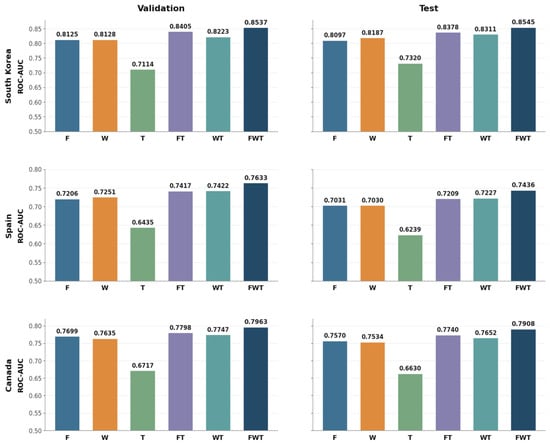
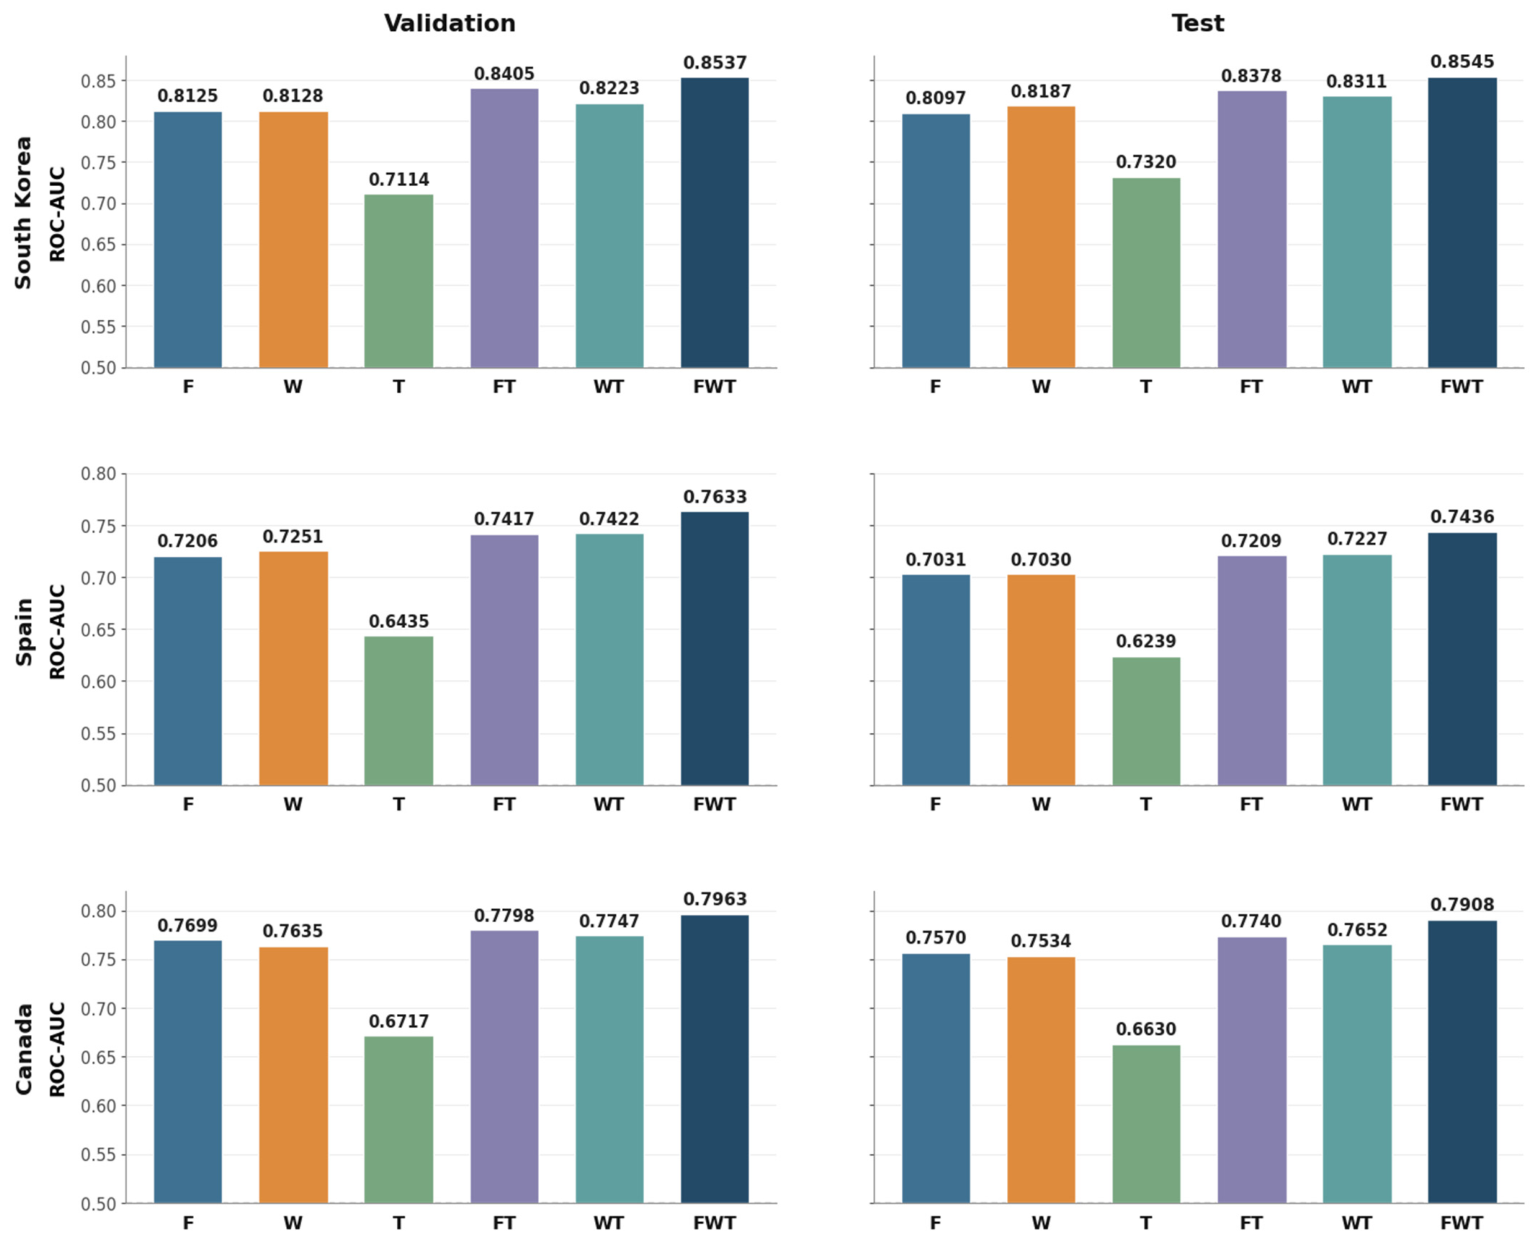
In each country, structures combining F with W and T discriminated better than F alone in both the validation and test periods (Figure 3). Test ROC-AUC increased from 0.8097 for F to 0.8378 for FT and 0.8545 for FWT in South Korea, from 0.7031 to 0.7209 and 0.7436 in Spain, and from 0.7570 to 0.7740 and 0.7908 in Canada (Figure 3, right column). In South Korea, W alone (0.8187) already exceeded F alone. The country-specific LightGBM model reproduced the Spanish pattern (F 0.7028, FT 0.7223, FWT 0.7539), indicating that the ordering of the structures did not depend on the harmonized algorithm.
Figure 3.
Validation and test ROC-AUC of common F/W/T information structures within each country. Bars show ROC-AUC under the harmonized random forest; the value printed above each bar is the ROC-AUC cited in the text. Validation (left) and test (right) are shown side by side for each country. y-axis ranges are scaled by country, start at 0.50 (no discrimination) and are not intended for cross-country ranking.
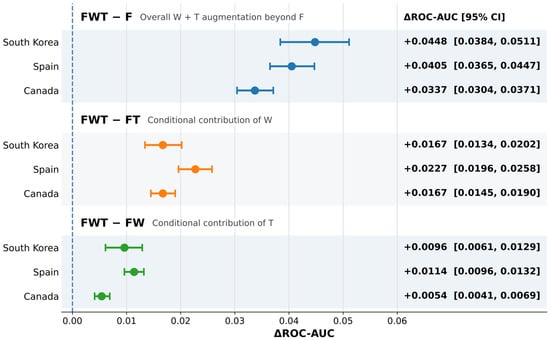
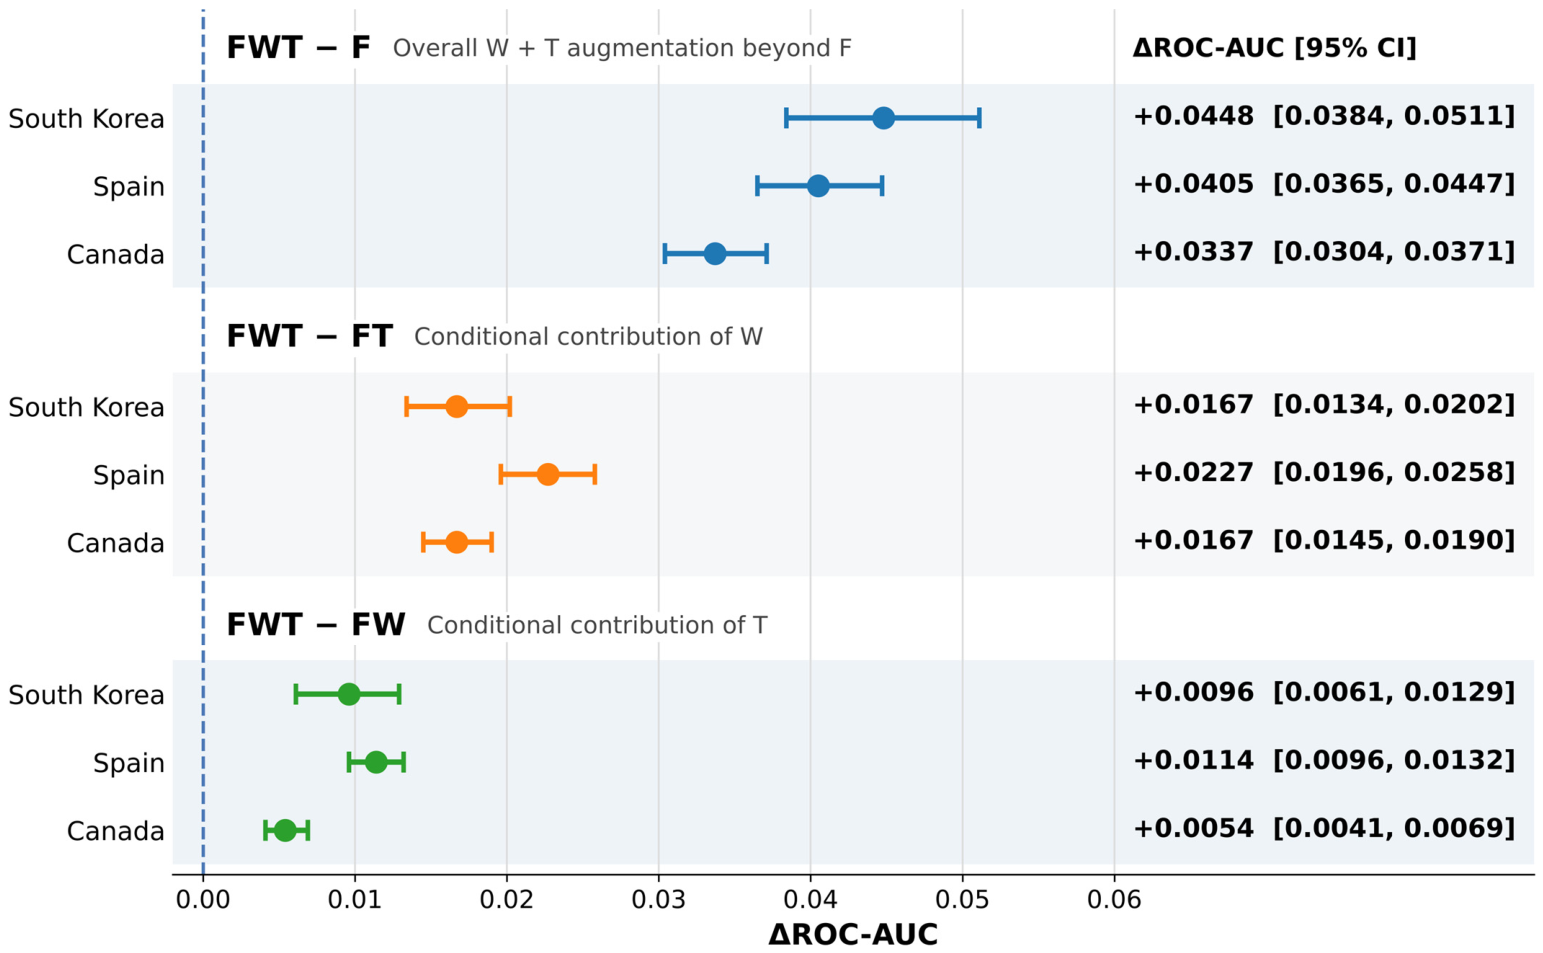
The common test contrasts are shown in Figure 4; confidence intervals, validation values and adjusted p-values are listed in Table A1. FWT − F was +0.0448 in South Korea (95% CI 0.0384–0.0511), +0.0405 in Spain (0.0365–0.0447) and +0.0337 in Canada (0.0304–0.0371). Adding W to F and T (FWT − FT) increased test ROC-AUC by +0.0167 (0.0134–0.0202), +0.0227 (0.0196–0.0258) and +0.0167 (0.0145–0.0190), respectively. Adding T to F and W (FWT − FW) increased test ROC-AUC by +0.0096 (0.0061–0.0129), +0.0114 (0.0096–0.0132) and +0.0054 (0.0041–0.0069). All nine intervals excluded zero, and all adjusted p-values were ≤0.0020 (Table A1). In every country, the conditional increment of T was smaller than that of W. PR-AUC changed in the same direction in South Korea and Spain (Table A1) and in Canada, where it increased from 0.0389 for F to 0.0559 for FWT (Table 3).
Figure 4.
Common test contrasts under the harmonized random forest model. Points show ΔROC-AUC and horizontal bars 95% confidence intervals from 5000 date-cluster paired bootstrap resamples for FWT − F, FWT − FT and FWT − FW within each country; the numerical values are printed on the right and listed with adjusted p-values in Table A1. Intervals are for within-country inference, not for cross-country ranking.
Table 3.
Test performance of reference, common and augmented structures under the harmonized random forest.
Q1 is therefore answered affirmatively in all three countries. The six FWI components did not absorb the information in current weather and seasonal position, and the conditional contribution of W exceeded that of T in each country. These are within-country increments; their magnitudes are not ranked across countries. Whether the answer depends on the evaluation period or on inference and design choices is examined in Section 3.4.
3.2. Seasonal Representation and the Contribution of T (Q2)
The three countries provide the three configurations—a fixed seasonal weight in South Korea, seasonal coefficients embedded in the index equations in Canada and a station-relative reference in Spain.
In Canada, adding T increased test ROC-AUC by 0.0242 (95% CI 0.0208–0.0276) with the monthly factors replaced by constants (F0T − F0) and by 0.0170 (95% CI 0.0144–0.0198) with the standard monthly factors retained (FT − F). With both W and T included, the difference between the two formulations (F0WT − FWT) was +0.0020 in the random forest and +0.0008 in LightGBM, with the LightGBM interval including zero. In LightGBM, F0T − F0 was +0.0248. In South Korea, replacing the fixed daily weight with T while retaining F and W (FWT − FWD) increased test ROC-AUC by 0.0023 (95% CI 0.0007–0.0039). The validation increment was +0.0013 and was not statistically significant. In Spain, when S, F and W were already included, the gain from adding T varied by evaluation period and metric and was not consistently statistically supported.
The answer to Q2 is therefore a qualified yes. The contribution of T was not fixed. It increased when embedded seasonal coefficients were removed and varied with the reference structure with which T was combined. The direct comparison of a fixed weight with T favored T in the Korean test period, but this result depended on the inference procedure and the model (Section 3.4) and is treated as conditional.
3.3. Country-Specific Reference Contrasts (Q3)
Table 3 reports the test performance of each reference structure and of the corresponding augmented structures. In South Korea, FWT exceeded KD by 0.0243 in ROC-AUC (0.8545 vs. 0.8302; 95% CI 0.0192–0.0295) and by 0.0100 in PR-AUC (0.0728 vs. 0.0627; 0.0051–0.0142); the validation difference was +0.0275. In Spain, SFWT exceeded S by 0.0796 in ROC-AUC (0.7734 vs. 0.6938; 0.0745–0.0847; validation +0.0791) and by 0.0598 in PR-AUC (0.1365 vs. 0.0766; 0.0532–0.0669). This increment combines the contributions of F, W and T and is relative to a research reconstruction rather than to archived AEMET forecasts. In Canada, FoffWT exceeded the official components Foff by 0.0371 (0.7863 vs. 0.7492; 0.0331–0.0412; validation +0.0347).
Under the same date-cluster bootstrap, the LightGBM models reproduced the direction and significance of all common and reference contrasts in the three countries (e.g., FWT − F +0.0445, +0.0511 and +0.0400 in South Korea, Spain and Canada; Table S6). In the exploratory fixed top-10% alert-capacity comparison in Spain, S, F and SF captured 3424, 3831 and 5105 positive test station-days, respectively (Table S5).
For the reference part of Q3, the augmented structures added discrimination relative to each national reference structure in both the validation and test periods. Because KD, S and Foff differ in information content and operational meaning, the three increments answer different questions and are not compared with one another.
3.4. Temporal Reproducibility and Robustness of the Answers
This section examines whether the answers to Q1–Q3 depend on the evaluation period or on inference and design choices.
The direction of all common and reference contrasts was reproduced from validation to test in each country (Table A1), and no structure was reselected after the test period was examined. Absolute discrimination nevertheless changed between periods in country-specific ways. In South Korea, FWT changed little (0.8537 to 0.8545), and FWT − KD decreased only modestly (+0.0275 to +0.0243). In Spain, ROC-AUC declined from validation to test by 0.0175 for F, 0.0221 for W, 0.0196 for T, 0.0197 for FWT and 0.0236 for SFWT, while all planned contrasts kept their sign. In Canada, FWT declined by 0.0055 and F by 0.0129, so that FWT − F increased from +0.0264 to +0.0337, whereas FWT − FT was almost unchanged (+0.0165 and +0.0167). The supplementary Canadian W − F difference was significant in validation but not in test (−0.0036; Holm-adjusted p = 0.0655). These differences are reported as evidence of the conditionality and temporal reproducibility of information effects rather than removed.
Table 4 summarizes the robustness analyses. Replacing date clustering with station clustering or with two-way clustering widened the intervals, as expected, but all common and reference contrasts in all three countries remained positive, with intervals excluding zero (Figure S1). In Spain, removing positive station-days matched to fires more than 50 km or 30 km away (3.33% and 14.48% of test positives) changed FWT − F from 0.0405 to 0.0404 and 0.0391, and SFWT − S from 0.0796 to 0.0795 and 0.0768. Rebuilding the labels with a 50 km limit and re-fitting the models, or re-fitting with year-stratified undersampling, changed the common and reference contrasts by at most 0.0009 (Table 4; Table S4). Excluding the 588 Korean test station-days with any missing predictor changed the Korean contrasts by at most 0.0006.
Table 4.
Robustness of the planned test contrasts (ΔROC-AUC [95% CI]) to inference and design choices.
The only inference that depended on the analytical choice was the Korean secondary contrast FWT − FWD: its interval excluded zero under date and station clustering but not under two-way clustering (−0.0002 to 0.0047), and its Holm-adjusted p-value was 0.0320 within its prespecified family but 0.0512 when all 19 Korean contrasts were adjusted jointly (Table A1). The contrast was also not supported under the supplementary LightGBM model (+0.0024; −0.0005 to 0.0053; Table S6).
The answers to Q1 and to the reference part of Q3 therefore did not depend on the evaluation period or on any of the inference and design choices examined. The Korean part of Q2 did, and is reported as conditional evidence.
3.5. Probability Calibration and Operational Coverage (Q3)
Raw scores from models trained on 1:2 undersampled data overestimated occurrence probabilities by an order of magnitude (mean test score 0.2012–0.2991 against occurrence rates of 1.39–4.13%), yielding Brier skill scores between −2.1067 and −7.5015 relative to the validation occurrence rate (Table S2). Correcting for the train sampling ratio reduced the test Brier score of FWT from 0.0866 to 0.0132 in South Korea, from 0.1230 to 0.0387 in Spain and from 0.1208 to 0.0139 in Canada. The resulting skill was small but positive (Brier skill score 0.0220–0.0322) and slightly higher than that of the corresponding reference structures (0.0245 for KD, −0.0008 for S and 0.0126 for Foff). Residual miscalibration followed the change in occurrence rate between train and test: corrected probabilities were too low in South Korea (1.17% vs. 1.39%), too high in Spain (5.95% vs. 4.13%) and close to observed rates in Canada (1.34% vs. 1.44%); isotonic recalibration on validation data reduced this drift in South Korea and Spain (Figure S2).
Operational coverage could be assessed only in Canada (Table S3). Of the 36,003 positive station-days in the full Canadian panel, official CWFIS FWI information was available for 32,079 (89.10%); 3887 (10.80%) fell within planned seasonal non-production, and 37 (0.10%) were missing because of operational gaps. Discrimination on days with official information and availability when information is needed are therefore distinct operational properties.
For the operational part of Q3, the discrimination gains can be used probabilistically only after recalibration to recent occurrence rates, and in Canada about one in nine positive station-days fell outside the period in which official information is issued, a limitation that augmentation of issued information cannot address.
4. Discussion
4.1. Current Weather and Accumulated Fire Weather Memory
The answer to Q1 is the most general finding. Across the three countries, the prespecified contrasts showed the same structure: adding W and T to the FWI components increased discrimination, W added information after F and T were included, and T added less information after F and W were included. Because the national datasets, W variables, matching rules and test periods differed and no country-by-structure interaction test was performed, this is evidence of replication in direction and structure, not of equal effect sizes. The more general implication is that operational danger information is better understood as an architecture that integrates signals over different time scales than as a competition among predictors for the single best feature set. Methodologically, fixing one model specification and testing whether prespecified within-country contrasts are reproduced, rather than ranking country-specific best models, separates the question of which information matters from the question of which algorithm performs best.
The most consistent result is the conditional contribution of current and derived weather: FWT − FT was positive in all three countries and robust to the clustering unit, the matching rule and the undersampling scheme. This is consistent with the design of the FWI System, whose fuel-moisture codes integrate weather over response times from days to months and are driven by a small set of noon observations [5,6]. Sensitivity analyses of the FWI have shown that index values depend strongly on the temperature, humidity and wind inputs used [12,13]. Our results indicate that the daily extremes, diurnal temperature range, vapor pressure deficit and radiation from which those inputs are derived retain occurrence information that the recursive state does not carry. F and W are therefore complementary representations of accumulated fire weather memory and current atmospheric conditions rather than competing predictors. The near-identical Korean and Canadian increments (+0.0167) should not be read as a common physical effect, because W differed in variables and sources, and the Canadian W relied partly on reanalysis [26].
For the Korean system, the relevant distinction is not between current and accumulated weather, because K already carries recent conditions through effective humidity and the rainfall effect. It is between the short-lag empirical memory of K and the recursive multi-timescale memory of F. The FWT − KD result shows that, for nationwide daily occurrence discrimination, a structure combining recursive memory, current weather and cyclic seasonal position contained more discriminative information than the present weather–temporal substructure; it carries no implication for FMI, TMI or the complete FFDRI. The substantive question for system revision is therefore how memory over different time scales should be represented and combined, rather than which single index is superior. In Spain and Canada, by contrast, the reference structures carry the same recursive memory as F: S re-expresses it relative to station climatology, and Foff is its official computation. The reference increments there therefore reflect mainly the addition of current weather and seasonal position and, for S, the absolute levels of the FWI components.
4.2. Fixed, Embedded and Learnable Seasonal Information
The conditional contribution of T was positive but smaller than that of W in all three countries, indicating that cyclic seasonal position is a complementary rather than a core block. The answer to Q2 adds that the value of T depends on which seasonal configuration is already present. The pattern is consistent with T substituting for seasonal information that the index would otherwise carry. Where seasonal terms are embedded in the index equations, a learnable term recovers much of what is removed, so the complete structure changes little. Where seasonality is expressed relative to station climatology, the residual seasonal signal depends on the period and metric. Where it is fixed by calendar period, the difference between fixed and learnable representations is small relative to the contribution of weather information.
This dependence matters beyond the three study countries. The FWI System is applied far outside the conditions for which its seasonal coefficients were derived, including in the European Forest Fire Information System and in global reanalysis-based danger products [7,19]. The Canadian experiment suggests that, where embedded seasonal terms fit the local fire season poorly, part of the seasonal signal can be recovered by a learnable term, while the information in the complete structure changes little. Systems that adopt the FWI as a common fire weather axis could therefore evaluate seasonal representation as a separate design choice rather than inheriting it implicitly from the index equations.
Because the Korean FWT − FWD increment was not supported under two-way clustering, under joint adjustment of all Korean contrasts or under LightGBM, we treat it as conditional evidence that fixed and learnable seasonal representations behave differently under specific conditions, not as a basis for replacing D. A fixed weight is transparent and easy to communicate, whereas a learnable term can follow the empirical seasonal distribution of occurrence but must be re-estimated as that distribution changes. T does not observe a physical mechanism; it encodes position in the annual cycle and may partly proxy seasonal patterns of human ignition and fuel phenology [11,18]. Its value is therefore context-dependent and should be re-established when danger systems, climates or ignition regimes change, and whether the complementarity observed here persists under forecast inputs remains to be tested.
4.3. Pathways for Staged Enhancement of National Danger Systems
The answer to Q3 identifies information that existing national reference structures do not fully exploit, but a gain in retrospective discrimination is not by itself evidence of operational benefit [17]. Three gaps separate the two. First, the retrospective analyses used observation-based and reanalysis inputs. Candidate models must also be evaluated using forecasts available at the time of issue. In operational forecasting, W must be supplied by forecasts whose errors grow with lead time and are often largest for daily extremes, and errors in forecast inputs propagate through the recursive FWI state [47,48]; performance under forecast inputs may therefore be lower than reported here, and the value of W, which depends most on extremes, may change most.
Second, operational use requires alert thresholds. A change in ROC-AUC does not determine the detection rate, false-alarm burden or warning frequency at a particular alert level, which must be evaluated under equal alert capacity together with large-fire and burned-area outcomes. Third, probabilities need maintenance. Our calibration analysis showed that probability scales drift with interannual changes in occurrence rates even when discrimination is stable, so periodic recalibration on recent data is a prerequisite for probabilistic warnings [43,46]. These gaps define the staged pathway in Table 5; its country-specific content is set out below.
Table 5.
Staged pathway for enhancing national weather–temporal danger information.
South Korea is the direct policy case. The analysis addresses an earlier stage of the information chain than previous Korean work on recalibrating danger-class thresholds after the index has been computed [49]. It concerns how the weather–temporal information that enters the index is structured. Three incremental options follow from the results—augmenting the existing K and D with W (KWD), replacing the short-lag memory of K by the recursive memory of F, and the integrated structure FWT. Only FWT − KD was tested inferentially; KWD was fitted, but its increment over KD was not assessed and requires a separate paired evaluation.
A practical sequence would be to compute the current index and the candidate structures in parallel for the same stations and dates, keeping FMI and TMI unchanged; to recompute the candidates with the short-range forecasts available at the time of issue; to compare them under equal alert capacity, including false-alarm burden, regional stability, large-fire and burned-area coverage and recalibration needs; and to evaluate usability with forecasters and field personnel. Only components that remain beneficial through these steps should then be combined with FMI and TMI and evaluated within the full FFDRI framework, with any change documented in a subsequent ATBD revision [8].
In Spain, S expresses daily FWI as a percentile within each station’s train-period distribution, while F retains the values of all six FWI System components. The SFWT − S increment and the larger capture of positives by SF in the exploratory capacity analysis suggest that relative and absolute fire weather information can be used jointly, although the increment cannot be attributed to F alone. Because S is a research reconstruction and the Spanish test period predates the index introduced in 2026 [9], the first step is to compare S with the danger information actually issued, followed by forecast-driven validation of the candidate structures.
In Canada, adding W and T to the official components increased discrimination on days with official information, which supports evaluating W and T as complementary information alongside FWI outputs within the ongoing redevelopment of the national system [10], not as replacements for the FWI System. F0 is an experimental construct and is not proposed as an operational formulation. The coverage audit adds a separate question: most positive station-days without official information fell within planned seasonal non-production, so whether augmented information can be produced reliably around season start and end should be evaluated separately from discrimination on issued days.
Across countries, the operational value of any candidate structure should be judged by the number and severity of additional fires identified under comparable alert capacity, burned-area and large-fire coverage, false-alarm burden, regional stability and implications for resource deployment. The study also shows that three properties often conflated in index evaluation require different evidence: retrospective discrimination with observed weather, the availability of official information when fires occur, and the feasibility of supplying predictors at the time of issue.
5. Conclusions
This study asked whether augmenting accumulated fire weather memory with current weather and learnable cyclic seasonal information yields reproducible additional discrimination of daily wildfire occurrence across contrasting national wildfire danger systems. To answer it, weather–temporal information in South Korea, Spain and Canada was decomposed into the six FWI System components (F), current and derived weather (W) and a cyclic day-of-year time proxy (T), and prespecified paired contrasts were evaluated with a harmonized random forest over independent test periods.
The answer is affirmative: the FWI components carry the core accumulated fire weather signal but do not absorb the information in current weather and seasonal position. Adding W and T to F increased test ROC-AUC by 0.0337–0.0448 in all three countries; W contributed more than T (0.0167–0.0227 vs. 0.0054–0.0114), and both contributions were robust to inference, design and algorithm choices. The contribution of T, however, depended on how seasonality was already encoded. It increased when the seasonal coefficients embedded in the FWI were neutralized in Canada, varied with the station-relative reference in Spain and remained conditional against the fixed daily weight in South Korea. Relative to the national reference structures, the augmented structures added discrimination in each country (ROC-AUC +0.0243 over the weather–temporal substructure of the Korean FFDRI, +0.0796 over the Spanish reconstructed reference and +0.0371 over the official Canadian FWI components), with the direction reproduced from validation to test. Probabilistic use, however, requires periodic recalibration, and in Canada part of the occurrence burden falls outside the period in which official information is issued.
For operational systems, these results support staged enhancement—parallel production, forecast-driven prospective validation, evaluation under equal alert capacity with periodic recalibration, field evaluation with forecasters and operators, and integration with non-meteorological components—rather than replacement of existing indices (Table 5). More generally, for any danger system built on accumulated fire weather indices, the inclusion of current-weather information and the form of seasonal representation are design choices that can be evaluated with the same prespecified contrasts before operational change.
Several limitations bound these conclusions. The analyses used observed rather than forecast weather and do not estimate prospective forecast skill. Models were trained within each country, so the study tests the replication of within-country effects, not transferability. W blocks, data sources and fire–station matching rules differed among countries, so the matched weather represents fire locations with different spatial accuracy. No cross-country interaction test was performed, so effect sizes are not ranked across countries. In Canada, ERA5-Land variables were aggregated over the UTC day, which may not coincide with the local calendar day on which fires were recorded.
The Spanish reference S is a research reconstruction, the Korean comparison excludes FMI and TMI, and the Canadian analysis covers six provinces. Calibrated probabilities depend on recent occurrence rates. The study evaluated occurrence discrimination only; large-fire occurrence, burned area, risks to people and infrastructure and resource costs were not assessed.
Future work should test the candidate structures prospectively with forecast inputs, evaluate warning performance and damage-related outcomes, and examine whether learnable seasonal representations remain stable as fire regimes change.
Supplementary Materials
The following supporting information can be downloaded at: https://www.mdpi.com/article/10.3390/fire9110528/s1, Table S1: Key differences between Choi and Kim (2026) and the present study; Table S2: Calibration of test probabilities; Table S3: Operational coverage of official CWFIS FWI information in Canada; Table S4: Detailed results of the Spanish sensitivity analyses; Table S5: Exploratory top-capacity capture in Spain; Table S6: test contrasts under the harmonized random forest and LightGBM models; Figure S1: Robustness of the planned test contrasts to the bootstrap cluster unit; Figure S2: Reliability of FWT probabilities after prior correction and isotonic recalibration.
Author Contributions
Conceptualization, B.C.; methodology, B.C.; software, B.C.; validation, B.C.; formal analysis, B.C.; investigation, B.C.; data curation, B.C.; writing—original draft preparation, B.C.; writing—review and editing, B.C. and G.-Y.K.; visualization, B.C.; supervision, G.-Y.K. All authors have read and agreed to the published version of the manuscript.
Funding
This work was supported by the Institute of Information and Communications Technology Planning and Evaluation (IITP)-Innovative Human Resource Development for Local Intellectualization Program grant funded by the Korean Government [Ministry of Science and ICT (MSIT)] under Grant IITP-2026-RS-2022-00156360.
Institutional Review Board Statement
Not applicable.
Informed Consent Statement
Not applicable.
Data Availability Statement
The source wildfire and meteorological data used in this study are publicly available from the official data providers cited in Section 2.2. The processed analytical datasets were generated by integrating and transforming these source data as described in the Materials and Methods and are not deposited in a public repository.
Acknowledgments
During the preparation of this manuscript, the authors used ChatGPT (GPT-5.6 Sol Light; OpenAI) and Claude (Claude Opus 4.7 to 5.5; Anthropic) to assist with language editing, restructuring and drafting of text, checking of references and consistency, and review of analysis code. The study design, data processing, analyses, interpretation of results and conclusions are those of the authors, who reviewed and edited all AI-assisted output and take full responsibility for the content of this publication.
Conflicts of Interest
The authors declare no conflicts of interest. The funders had no role in the design of the study; in the collection, analyses, or interpretation of data; in the writing of the manuscript; or in the decision to publish the results.
Abbreviations
| AEMET | Agencia Estatal de Meteorología |
| ASOS | Automated Synoptic Observing System |
| ATBD | Algorithm Theoretical Basis Document |
| BUI | Buildup Index |
| CI | Confidence interval |
| CNFDB | Canadian National Fire Database |
| CWFIS | Canadian Wildland Fire Information System |
| DC | Drought Code |
| DMC | Duff Moisture Code |
| DWI | Daily Weather Index |
| ECCC | Environment and Climate Change Canada |
| EGIF | Estadística General de Incendios Forestales |
| FFDRI | Forest Fire Danger Rating Index |
| FFMC | Fine Fuel Moisture Code |
| FMI | Forest Map Index |
| FWI | Fire Weather Index |
| IDW | Inverse-distance weighting |
| IITP | Institute of Information and Communications Technology Planning and Evaluation |
| ISI | Initial Spread Index |
| KMA | Korea Meteorological Administration |
| LightGBM | Light Gradient Boosting Machine |
| MITECO | Ministerio para la Transición Ecológica y el Reto Demográfico |
| MSIT | Ministry of Science and ICT |
| NRCan | Natural Resources Canada |
| PR-AUC | Area under the precision–recall curve |
| RF | Random forest |
| RNE | Rainfall effect (FFDRI) |
| ROC-AUC | Area under the receiver operating characteristic curve |
| TMI | Topographic Map Index |
| UTC | Coordinated Universal Time |
| VPD | Vapor pressure deficit |
| F | FWI information block comprising FFMC, DMC, DC, ISI, BUI, and FWI |
| W | Current and derived weather information block |
| T | Time proxy consisting of cyclic day-of-year variables |
| K | FFDRI weather-information block |
| D | Official daily weight of the FFDRI |
| KD | FFDRI weather–temporal reference structure combining K and D |
| S | Reconstructed station-relative FWI reference for Spain |
| Foff | Official six-component FWI information block published by CWFIS |
| F0 | Experimental seasonally neutralized FWI information block |
Appendix A
Table A1.
Statistical inference for the planned within-country contrasts (harmonized Random Forest).
References
- Moritz, M.A.; Parisien, M.-A.; Batllori, E.; Krawchuk, M.A.; Van Dorn, J.; Ganz, D.J.; Hayhoe, K. Climate change and disruptions to global fire activity. Ecosphere 2012, 3, 49. [Google Scholar] [CrossRef] [Scilit]
- Plucinski, M.P. A Review of Wildfire Occurrence Research; Bushfire Cooperative Research Centre: Melbourne, Australia, 2012; Available online: https://www.naturalhazards.com.au/crc-collection/downloads/attachment_g_fire_occurrence_literature_review_0.pdf (accessed on 28 September 2026).
- Hayajneh, S.M.; Alzghoul, M.I.; Naser, J. Wind and Slope Effects on Wildland Fire Spread: A Review of Experimental, Empirical, Mathematical, and Physics-Based Models. Fire 2026, 9, 100. [Google Scholar] [CrossRef] [Scilit]
- Jolly, W.M.; Cochrane, M.A.; Freeborn, P.H.; Holden, Z.A.; Brown, T.J.; Williamson, G.J.; Bowman, D.M.J.S. Climate-induced variations in global wildfire danger from 1979 to 2013. Nat. Commun. 2015, 6, 7537. [Google Scholar] [CrossRef] [Scilit] [PubMed]
- Van Wagner, C.E. Development and Structure of the Canadian Forest Fire Weather Index System; Forestry Technical Report 35; Canadian Forestry Service: Ottawa, ON, Canada, 1987.
- Wotton, B.M. Interpreting and using outputs from the Canadian Forest Fire Danger Rating System in research applications. Environ. Ecol. Stat. 2009, 16, 107–131. [Google Scholar] [CrossRef] [Scilit]
- Vitolo, C.; Di Giuseppe, F.; Barnard, C.; Coughlan, R.; San-Miguel-Ayanz, J.; Libertá, G.; Krzeminski, B. ERA5-based global meteorological wildfire danger maps. Sci. Data 2020, 7, 216. [Google Scholar] [CrossRef] [Scilit] [PubMed]
- Noh, M.; Ahn, S.; Heo, S.; Lee, J.; Jung, S.; Won, M. Algorithm Theoretical Basis Document (ATBD) for the Korean Forest Fire Danger Rating System; Research Materials No. 1211; National Institute of Forest Science: Seoul, Republic of Korea, 2026.
- Agencia Estatal de Meteorología (AEMET). AEMET Pone en Marcha un Nuevo índice de Peligro de Incendios Forestales. 28 May 2026. Available online: https://www.aemet.es/es/noticias/2026/05/nuevo_indice_ipif (accessed on 28 September 2026).
- Natural Resources Canada. Canadian Forest Fire Danger Rating System—Next Generation. Available online: https://natural-resources.canada.ca/forests-forestry/wildland-fires/canadian-forest-fire-danger-rating-system-generation (accessed on 28 September 2026).
- Choi, B.; Kim, G.-Y. Nationwide Daily Wildfire Occurrence Prediction Using Time Proxy Variables and the Canadian Fire Weather Index (FWI). Fire 2026, 9, 217. [Google Scholar] [CrossRef] [Scilit]
- Dowdy, A.J.; Mills, G.A.; Finkele, K.; de Groot, W. Index sensitivity analysis applied to the Canadian Forest Fire Weather Index and the McArthur Forest Fire Danger Index. Meteorol. Appl. 2010, 17, 298–312. [Google Scholar] [CrossRef] [Scilit]
- Bedia, J.; Herrera, S.; Gutiérrez, J.M.; Zavala, G.; Urbieta, I.R.; Moreno, J.M. Sensitivity of fire weather index to different reanalysis products in the Iberian Peninsula. Nat. Hazards Earth Syst. Sci. 2012, 12, 699–708. [Google Scholar] [CrossRef] [Scilit]
- Jain, P.; Coogan, S.C.P.; Subramanian, S.G.; Crowley, M.; Taylor, S.; Flannigan, M.D. A review of machine learning applications in wildfire science and management. Environ. Rev. 2020, 28, 478–505. [Google Scholar] [CrossRef] [Scilit]
- Fisher, N.I. Statistical Analysis of Circular Data; Cambridge University Press: Cambridge, UK, 1993. [Google Scholar] [CrossRef] [Scilit]
- Magnussen, S.; Taylor, S.W. Prediction of daily lightning- and human-caused fires in British Columbia. Int. J. Wildland Fire 2012, 21, 342–356. [Google Scholar] [CrossRef] [Scilit]
- Taylor, S.W.; Woolford, D.G.; Dean, C.B.; Martell, D.L. Wildfire prediction to inform fire management: Statistical science challenges. Stat. Sci. 2013, 28, 586–615. [Google Scholar] [CrossRef] [Scilit]
- Nadeem, K.; Taylor, S.W.; Woolford, D.G.; Dean, C.B. Mesoscale spatiotemporal predictive models of daily human- and lightning-caused wildland fire occurrence in British Columbia. Int. J. Wildland Fire 2020, 29, 11–27. [Google Scholar] [CrossRef] [Scilit]
- Copernicus Emergency Management Service. EFFIS—Fire Danger Forecast. Available online: https://forest-fire.emergency.copernicus.eu/about-effis/technical-background/fire-danger-forecast (accessed on 28 September 2026).
- Agencia Estatal de Meteorología (AEMET). Campaña de Incendios 2012. Available online: https://www.aemet.es/en/noticias/2012/07/indice_incendios (accessed on 28 September 2026).
- Romero, R.; Mestre, A.; Botey, R. A new calibration for Fire Weather Index in Spain (AEMET). In Advances in Forest Fire Research; Viegas, D.X., Ed.; Imprensa da Universidade de Coimbra: Coimbra, Portugal, 2014; pp. 1044–1053. [Google Scholar] [CrossRef] [Scilit] [PubMed]
- Korea Meteorological Administration. Open MET Data Portal—Automated Synoptic Observing System (ASOS) Daily Data. Available online: https://data.kma.go.kr/data/grnd/selectAsosList.do?pgmNo=36&tabNo=1 (accessed on 28 September 2026).
- Ministerio para la Transición Ecológica y el Reto Demográfico (MITECO). Estadística de Incendios Forestales—Estadística General de Incendios Forestales (EGIF). Available online: https://www.miteco.gob.es/es/biodiversidad/temas/incendios-forestales/estadisticas-incendios.html (accessed on 28 September 2026).
- Agencia Estatal de Meteorología (AEMET). AEMET OpenData—Centro de Descargas. Available online: https://opendata.aemet.es/centrodedescargas/inicio (accessed on 28 September 2026).
- Quilcaille, Y.; Batibeniz, F.; Ribeiro, A.F.S.; Padrón, R.S.; Seneviratne, S.I. Fire weather index data under historical and shared socioeconomic pathway projections in the 6th phase of the Coupled Model Intercomparison Project from 1850 to 2100. Earth Syst. Sci. Data 2023, 15, 2153–2177. [Google Scholar] [CrossRef] [Scilit]
- Muñoz-Sabater, J.; Dutra, E.; Agustí-Panareda, A.; Albergel, C.; Arduini, G.; Balsamo, G.; Boussetta, S.; Choulga, M.; Harrigan, S.; Hersbach, H.; et al. ERA5-Land: A state-of-the-art global reanalysis dataset for land applications. Earth Syst. Sci. Data 2021, 13, 4349–4383. [Google Scholar] [CrossRef] [Scilit]
- Canadian Forest Service. Canadian National Fire Database—Agency Fire Data; Natural Resources Canada, Canadian Forest Service, Northern Forestry Centre: Edmonton, AB, Canada, 2021. Available online: https://cwfis.cfs.nrcan.gc.ca/ha/nfdb (accessed on 28 September 2026).
- Environment and Climate Change Canada. Historical Climate Data. Available online: https://climate.weather.gc.ca/index_e.html (accessed on 28 September 2026).
- Van Wagner, C.E.; Pickett, T.L. Equations and FORTRAN Program for the Canadian Forest Fire Weather Index System; Forestry Technical Report 33; Canadian Forestry Service: Ottawa, ON, Canada, 1985.
- Wang, X.; Wotton, B.M.; Cantin, A.S.; Parisien, M.-A.; Anderson, K.; Moore, B.; Flannigan, M.D. cffdrs: An R package for the Canadian Forest Fire Danger Rating System. Ecol. Process. 2017, 6, 5. [Google Scholar] [CrossRef] [Scilit]
- Gorelick, N.; Hancher, M.; Dixon, M.; Ilyushchenko, S.; Thau, D.; Moore, R. Google Earth Engine: Planetary-scale geospatial analysis for everyone. Remote Sens. Environ. 2017, 202, 18–27. [Google Scholar] [CrossRef] [Scilit]
- Natural Resources Canada. Canada’s Fire Weather Index System. Available online: https://natural-resources.canada.ca/forests-forestry/wildland-fires/canada-fire-weather-index-system (accessed on 28 September 2026).
- Roberts, D.R.; Bahn, V.; Ciuti, S.; Boyce, M.S.; Elith, J.; Guillera-Arroita, G.; Hauenstein, S.; Lahoz-Monfort, J.J.; Schröder, B.; Thuiller, W.; et al. Cross-validation strategies for data with temporal, spatial, hierarchical, or phylogenetic structure. Ecography 2017, 40, 913–929. [Google Scholar] [CrossRef] [Scilit]
- Davis, J.; Goadrich, M. The relationship between Precision-Recall and ROC curves. In Proceedings of the 23rd International Conference on Machine Learning (ICML 2006), Pittsburgh, PA, USA, 25–29 June 2006; pp. 233–240. [Google Scholar] [CrossRef] [Scilit]
- Saito, T.; Rehmsmeier, M. The Precision-Recall Plot Is More Informative than the ROC Plot When Evaluating Binary Classifiers on Imbalanced Datasets. PLoS ONE 2015, 10, e0118432. [Google Scholar] [CrossRef] [Scilit] [PubMed]
- Efron, B.; Tibshirani, R.J. An Introduction to the Bootstrap; Chapman & Hall: New York, NY, USA, 1993. [Google Scholar]
- Field, C.A.; Welsh, A.H. Bootstrapping clustered data. J. R. Stat. Soc. Ser. B Stat. Methodol. 2007, 69, 369–390. [Google Scholar] [CrossRef] [Scilit]
- DeLong, E.R.; DeLong, D.M.; Clarke-Pearson, D.L. Comparing the areas under two or more correlated receiver operating characteristic curves: A nonparametric approach. Biometrics 1988, 44, 837–845. [Google Scholar] [CrossRef] [Scilit] [PubMed]
- Holm, S. A simple sequentially rejective multiple test procedure. Scand. J. Stat. 1979, 6, 65–70. [Google Scholar]
- Owen, A.B. The pigeonhole bootstrap. Ann. Appl. Stat. 2007, 1, 386–411. [Google Scholar] [CrossRef] [Scilit]
- Cameron, A.C.; Gelbach, J.B.; Miller, D.L. Robust inference with multiway clustering. J. Bus. Econ. Stat. 2011, 29, 238–249. [Google Scholar] [CrossRef] [Scilit]
- Dal Pozzolo, A.; Caelen, O.; Johnson, R.A.; Bontempi, G. Calibrating probability with undersampling for unbalanced classification. In Proceedings of the 2015 IEEE Symposium Series on Computational Intelligence, Cape Town, South Africa, 7–10 December 2015; pp. 159–166. [Google Scholar] [CrossRef] [Scilit]
- Phelps, N.; Woolford, D.G. Comparing calibrated statistical and machine learning methods for wildland fire occurrence prediction: A case study of human-caused fires in Lac La Biche, Alberta, Canada. Int. J. Wildland Fire 2021, 30, 850–870. [Google Scholar] [CrossRef] [Scilit]
- Niculescu-Mizil, A.; Caruana, R. Predicting good probabilities with supervised learning. In Proceedings of the 22nd International Conference on Machine Learning, Bonn, Germany, 7–11 August 2005; pp. 625–632. [Google Scholar] [CrossRef] [Scilit]
- Brier, G.W. Verification of forecasts expressed in terms of probability. Mon. Weather Rev. 1950, 78, 1–3. [Google Scholar] [CrossRef] [Scilit]
- Van Calster, B.; McLernon, D.J.; van Smeden, M.; Wynants, L.; Steyerberg, E.W. Calibration: The Achilles heel of predictive analytics. BMC Med. 2019, 17, 230. [Google Scholar] [CrossRef] [Scilit] [PubMed]
- Di Giuseppe, F.; Pappenberger, F.; Wetterhall, F.; Krzeminski, B.; Camia, A.; Libertà, G.; San Miguel, J. The potential predictability of fire danger provided by numerical weather prediction. J. Appl. Meteorol. Climatol. 2016, 55, 2469–2491. [Google Scholar] [CrossRef] [Scilit]
- Di Giuseppe, F.; Vitolo, C.; Krzeminski, B.; Barnard, C.; Maciel, P.; San-Miguel, J. Fire Weather Index: The skill provided by the European Centre for Medium-Range Weather Forecasts ensemble prediction system. Nat. Hazards Earth Syst. Sci. 2020, 20, 2365–2378. [Google Scholar] [CrossRef] [Scilit]
- Ahn, S.; Han, S.; Kim, H.; Jang, M.; Lee, Y.; Ahn, H.; Heo, S. Improvement of Forest Fire Danger Classification Criteria Using ROC-Curve Analysis. J. Korean Soc. For. Sci. 2025, 114, 504–512. [Google Scholar] [CrossRef]

Disclaimer/Publisher’s Note: The statements, opinions and data contained in all publications are solely those of the individual author(s) and contributor(s) and not of MDPI and/or the editor(s). MDPI and/or the editor(s) disclaim responsibility for any injury to people or property resulting from any ideas, methods, instructions or products referred to in the content. |
© 2026 by the authors. Licensee MDPI, Basel, Switzerland. This article is an open access article distributed under the terms and conditions of the Creative Commons Attribution (CC BY) license.