


Abstract
Aviation kerosene leaked during airport storage, refueling, and ground-support operations can infiltrate soil pores and form oil-contaminated soil systems with combustion behavior different from that of free liquid pool fires. To clarify the regulating effect of soil physical properties on fire hazards, humus soil, lateritic soil, loess, and sandy soil were contaminated with 10, 30, 50, 70, and 90 g of No. 3 aviation kerosene and tested using a cone calorimeter under an external heat flux of 35 kW/m2. For humus soil, lateritic soil, and loess, the time to ignition generally ranged from 3.5 to 7.0 s. In contrast, sandy soil showed a distinctly delayed and nonmonotonic ignition response, with the longest time to ignition reaching approximately 18 s. Heat release increased with fuel loading, but the response varied markedly among soils. At 90 g, the peak HRR values of loess, humus soil, lateritic soil, and sandy soil were 1021, 964, 806, and 461 kW/m2, respectively, and their THR values were 380, 354, 356, and 334 MJ/m2. The mass-loss results further showed that MLR was not directly equivalent to effective heat release: sandy soil had a relatively high peak MLR of approximately 0.40 g/s at 90 g, but its HRR remained the lowest because part of the fuel loss was associated with downward migration or inefficient near-surface flaming. In contrast, loess combined the highest peak MLR, approximately 0.43 g/s, with the highest HRR, indicating efficient conversion of released fuel into flaming heat output. Smoke production was also substrate-dependent, with loess showing the strongest combined smoke hazard and humus soil exhibiting sustained smoke production. Overall, permeability, together with pore structure and fuel retention characteristics, was associated with the distribution of aviation kerosene between the near-surface region and deeper soil layers. These soil-dependent differences were reflected in ignition, heat release, mass loss, and smoke generation. Under the present test conditions, loess showed the highest combined fire hazard, followed by humus soil, lateritic soil, and sandy soil.
1. Introduction
Aviation kerosene leakage on airport aprons, refueling areas, and fuel-storage zones may not remain as a free liquid pool. Once the fuel contacts natural ground, it can spread over the surface, infiltrate soil pores, and form a fuel-contaminated porous layer in which liquid fuel, mineral particles, organic matter, and pore gas coexist. Xiao et al. [1] showed that mineral species and petroleum components significantly affect the thermal desorption behavior of petroleum-contaminated soils, indicating that soil composition can regulate hydrocarbon release under heating. Xue et al. [2] demonstrated that petroleum hydrocarbons in low-permeability contaminated soils respond strongly to thermal treatment, confirming that heat-driven hydrocarbon migration and removal are controlled by soil transport resistance. These recent studies suggest that a fuel-contaminated soil layer should be treated as a coupled heat- and mass-transfer system rather than as a simple free-surface fuel layer.
Recent studies on liquid-fuel combustion in porous media further demonstrate that porous substrates can substantially modify burning behavior. Zhang et al. [3] reported that particle gradation changes the burning characteristics of liquid fuel immersed in porous media beds by altering capillary supply and pore-scale transport. Zhang et al. [4] found that infiltration depth controls both burning behavior and residual fuel distribution in inert porous media beds soaked with combustible liquids. Zhang et al. [5] showed that cross airflow further changes the burning characteristics of liquid-fuel-immersed porous media beds, highlighting the sensitivity of porous-bed fires to external transport conditions. These findings indicate that soil particle structure, pore connectivity, and fuel penetration depth can jointly affect evaporation, flame feedback, and fuel availability near the burning surface.
The behavior of spill fires on porous beds is also closely related to flame spread, heat transfer, and sustained fuel supply. Zhai et al. [6] experimentally investigated continuous spill fires of liquid fuel on porous beds and confirmed that porous-bed properties substantially alter the burning process. Zhai et al. [7] further analyzed the combustion characteristics of continuous oil spill fires on porous beds and showed that the porous substrate affects burning intensity and fuel supply. Zhai et al. [8] examined spill fires on micro-inclined porous media substrates and found that substrate geometry influences heat transfer and propagation speed. Erland et al. [9] reported fast-moving smoldering fronts in thin liquid-fuel films dispersed on inert porous media, demonstrating that fuel retained in porous matrices may support combustion modes different from those of conventional pool fires. Ding et al. [10] studied sub-flash-point fuel spill fires and showed that initial fuel temperature affects spreading and heat-transfer behavior. However, the combined effects of soil type and fuel loading on ignition, heat release, mass loss, and smoke production remain unclear. Previous studies have elucidated key aspects of continuous spill fires, combustion on slightly inclined porous substrates, smoldering in porous materials containing liquid fuel, and spill fires involving fuels below their flash point. However, many of these studies have used idealized porous media, including sand beds, glass beads, and relatively homogeneous granular materials. Natural soils, by contrast, differ substantially in particle size distribution, pore structure, permeability, and fuel retention capacity. In this study, humus soil, lateritic soil, loess, and sandy soil were selected as representative natural soil substrates. The study examines how differences in soil physical properties affect the distribution of aviation kerosene between the near-surface combustion region and deeper soil layers, and how this distribution is reflected in ignition, heat release, mass loss, and smoke generation. Cone calorimeter experiments were conducted using different amounts of aviation kerosene introduced into the soil to compare the fire hazards of fuel-contaminated soil systems. By considering the combined effects of soil type and the amount of aviation kerosene introduced into the soil under realistic conditions, this study extends previous research on combustion in simplified porous beds and provides a basis for assessing aviation kerosene fire hazards on natural ground surfaces.
2. Materials and Methods
2.1. Experimental Apparatus and Test Conditions
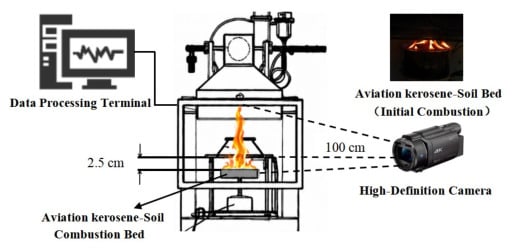
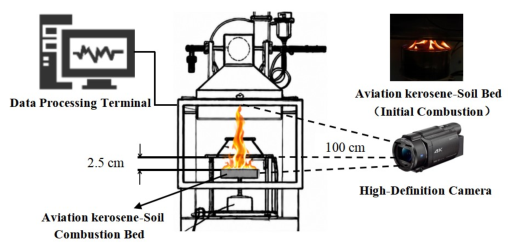
The experiments were conducted using an iCone cone calorimeter manufactured by Fire Testing Technology Ltd., East Grinstead, West Sussex, UK.. The test procedure and parameter settings followed ISO 5660-1 [11]. Considering the particulate characteristics of the soil samples, a customized stainless-steel combustion pan was used as the sample holder. The pan had an inner diameter of 11.7 cm, a height of 5.0 cm, and a wall thickness of 1 mm, which ensured a consistent sample thickness, a uniform heated surface, and comparable boundary conditions among tests (Figure 1).
Figure 1.
Schematic diagram of the experimental system.
Before each test series, the cone calorimeter was calibrated and preheated for 12 h. According to ISO 5660-1, the distance between the sample surface and the cone heater was maintained at 25 ± 1 mm [11]. The ambient temperature was approximately 30 °C, and the relative humidity was approximately 60%. The external heat flux was set to 35 kW/m2, corresponding to a cone-heater temperature of approximately 710 °C. Each condition was repeated at least three times, and the average values were used for analysis.
2.2. Soil Samples and Preparation of Oil-Contaminated Soil
2.2.1. Soil Sample Preparation
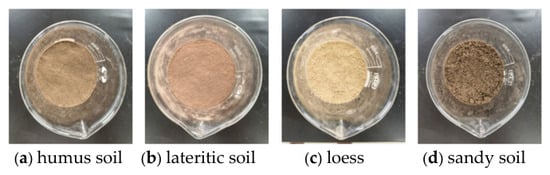
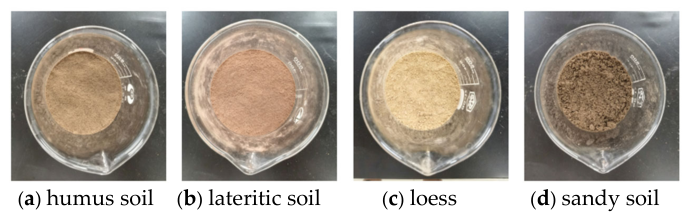
Four soil types, namely humus soil, lateritic soil, loess, and sandy soil, were used in this study. All samples were collected from the 0–30 cm surface layer. Stones and plant residues were removed, and the soils were naturally air-dried, ground, sieved through a 20-mesh sieve, and dried in a vacuum oven at 60 °C for 24 h to minimize the influence of initial moisture content. The four soil types are shown in Figure 2.
Figure 2.
Different soil types used in the tests.
The particle densities of loess, lateritic soil, and sandy soil were all reported as 2.65 g/cm3. Particle density represents the density of the solid mineral fraction and differs from the bulk density of the prepared soil bed. Values close to 2.65 g/cm3 are typical of mineral soils dominated by quartz and other silicate or aluminosilicate constituents [12,13]. The three soils nevertheless differed substantially in porosity, permeability, pore geometry, pore connectivity, and fuel-retention capacity. These bulk structural characteristics are more directly related to aviation-kerosene redistribution and combustion than particle density alone. Soil porosity was measured using a plastic-film sealing buoyancy method based on Archimedes’ principle, in which the apparent volume was determined together with dry mass and particle density [14]. Soil permeability was obtained using a dynamic displacement experiment and calculated using Darcy’s law under steady-flow conditions [15]. The reported value is for the prepared specimen and should not be interpreted as the in situ permeability of undisturbed natural soil. The test specimen was air-dried, ground, sieved, and compacted before measurement. Consequently, the measured value depends on specimen preparation, packing condition, test-fluid properties, and boundary conditions. The values are used only to compare the prepared specimens in the present study. The physical properties of the compacted soils are listed in Table 1.
Table 1.
Physical properties of the compacted soils.
In addition to porosity and permeability, the wetting and redistribution of aviation kerosene within the soil matrix are influenced by interfacial phenomena, including the surface free energy of soil particles, solid–liquid interfacial tension, liquid surface tension, capillary forces, pore geometry, pore connectivity, and particle size distribution. These factors affect fuel retention near the heated surface and transport into deeper soil layers. As these properties were not measured independently, their respective effects could not be quantified in the present study.
To characterize the initial relationship between fuel loading and pore space, the theoretical pore volume of each compacted soil sample was calculated based on the total volume of the soil sample and the measured porosity. The theoretical fuel occupancy was defined as the ratio of the volume of jet fuel to the pore volume of the soil, as shown in Table 2.
Table 2.
Theoretical pore-volume occupation of aviation kerosene at different fuel loadings.
At the highest tested amount of aviation kerosene, 90 g, the corresponding fuel volume was approximately 115.38 cm3. The nominal pore volume occupancy was therefore approximately 32.52% for humus soil, 41.28% for loess, 42.93% for lateritic soil, and 51.11% for sandy soil. The highest loading of 90 g has not yet reached theoretical pore saturation.
2.2.2. Preparation of Oil-Contaminated Soil Samples
No. 3 aviation kerosene was used as the combustible liquid. Its main physical properties are listed in Table 3.
Table 3.
Physical properties of the fuel.
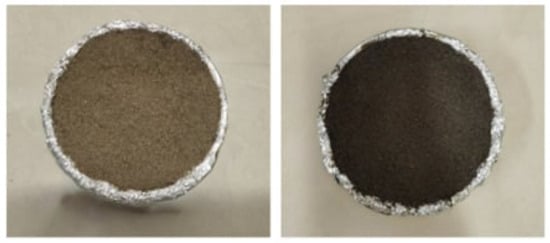
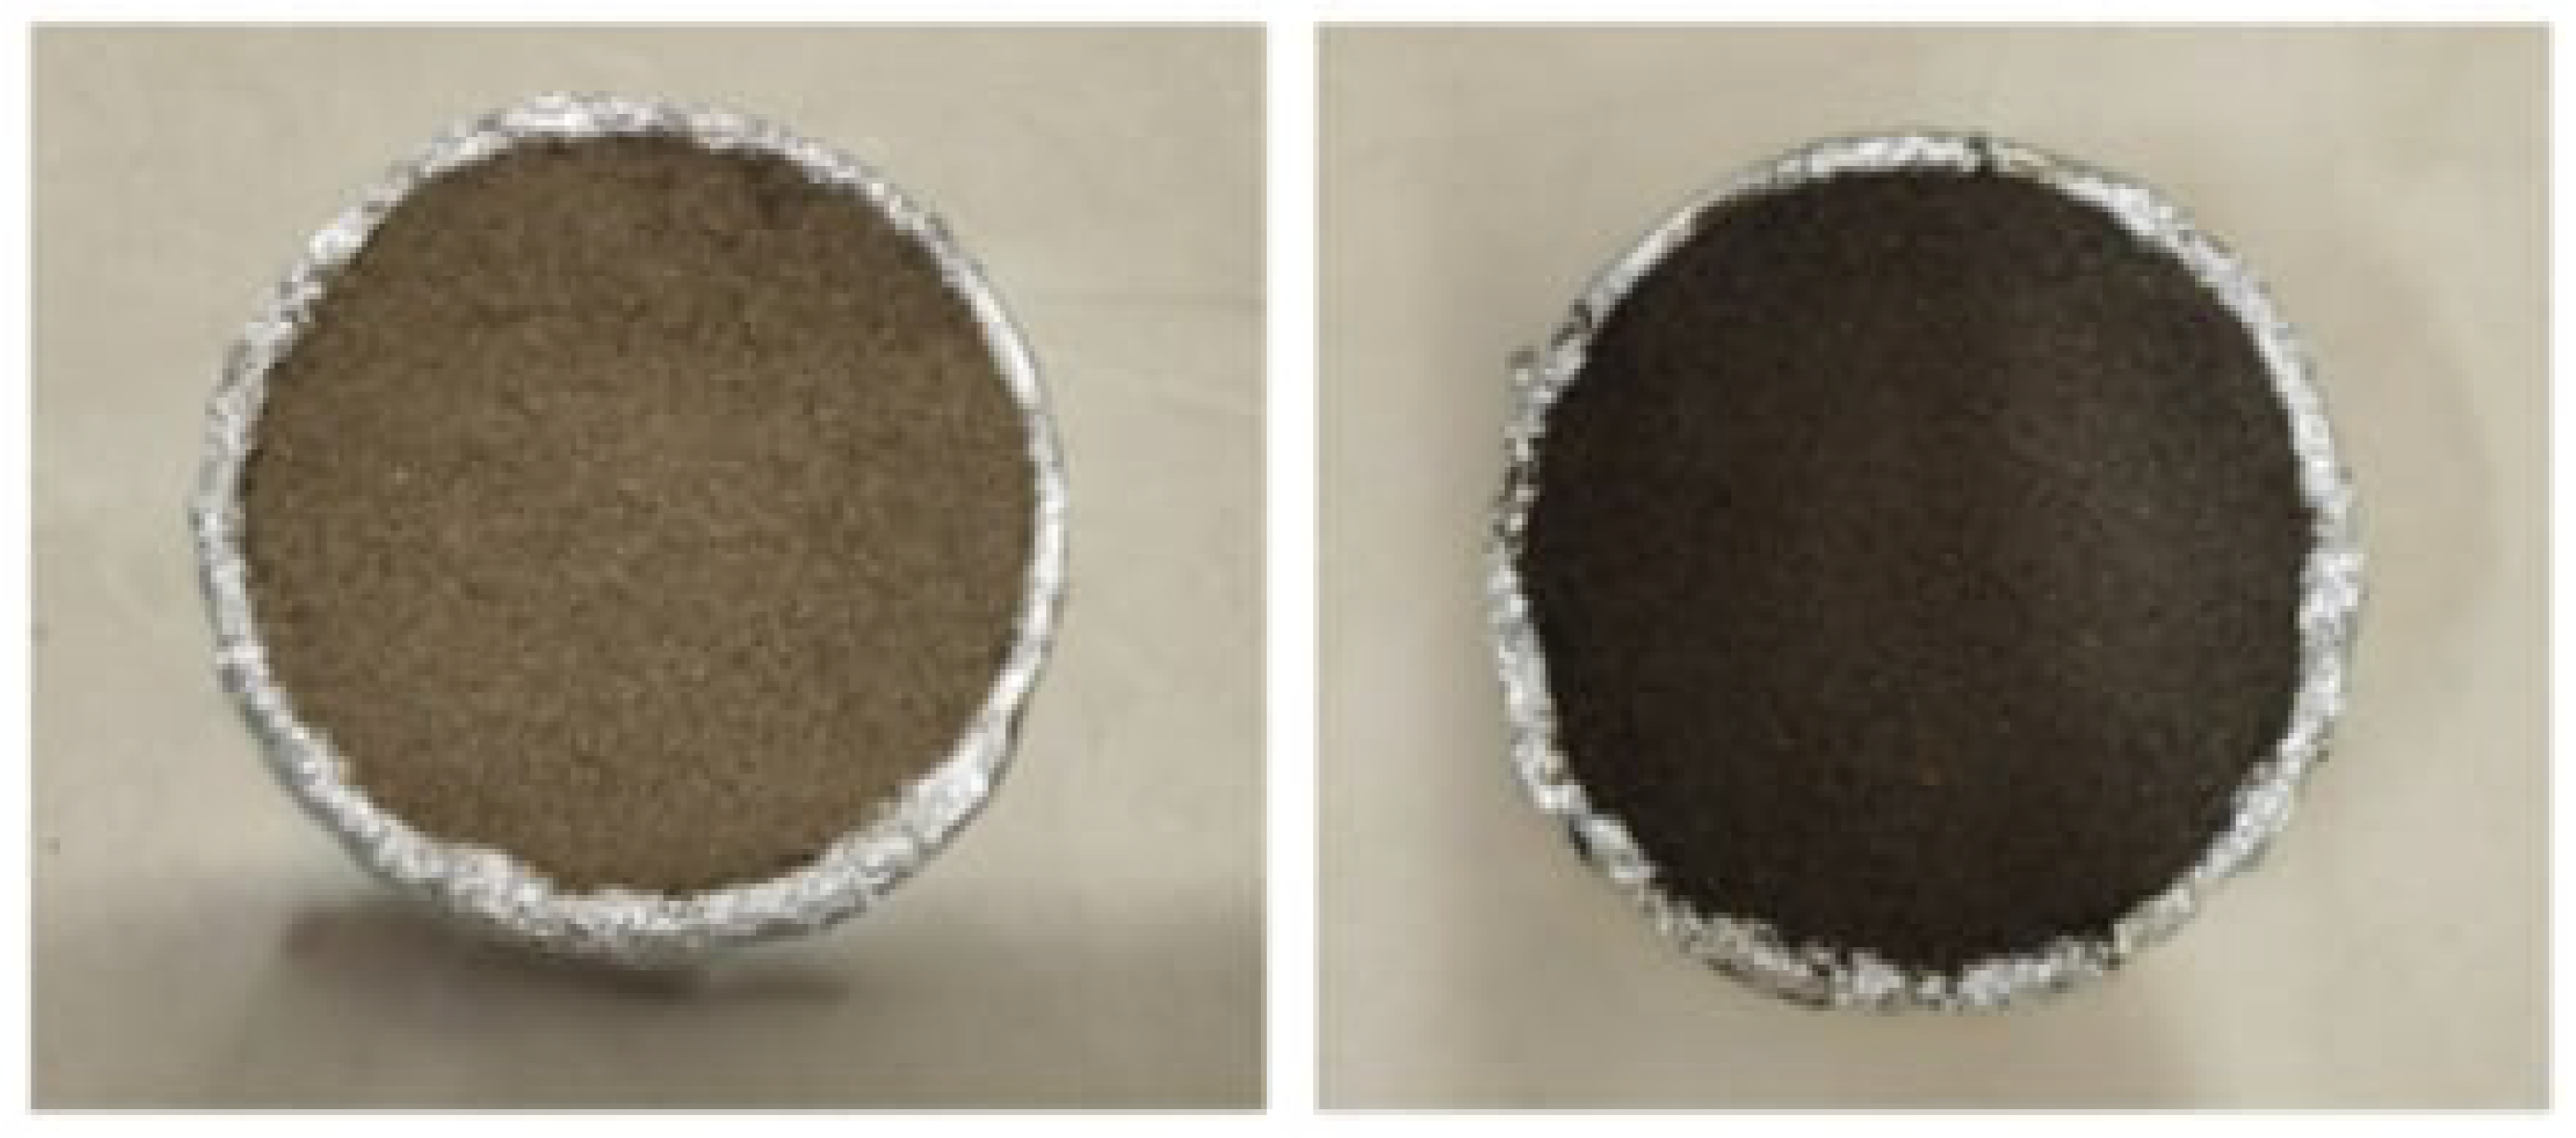
For each test, a specified mass of fuel was uniformly added to the pretreated soil to form an oil-contaminated soil layer. The mixture was placed in the combustion pan, and the surface was leveled to ensure consistent exposure to the external heat flux. After preparation, the samples were conditioned at room temperature for 30 min to allow fuel redistribution within the pore network and to minimize variability in ignition and burning behavior caused by nonuniform initial fuel placement. A sandy soil sample containing 90 g of aviation kerosene is shown in Figure 3.
Figure 3.
Oil-contaminated sandy soil sample with 90 g of aviation kerosene.
2.3. Experimental Condition and Test Parameters
The experimental conditions were designed based on two variables: fuel loading and soil type. The fuel loadings were set to 10, 30, 50, 70, and 90 g, while the packing thickness was maintained at 5 cm for all tests. Each experimental condition was repeated at least three times, and the average values were used for analysis. The detailed experimental conditions are listed in Table 4.
Table 4.
Experimental conditions for soil samples with a packing thickness of 5 cm.
The measured parameters included time to ignition (TTI), heat release rate (HRR), total heat release (THR), mass loss rate (MLR), specific extinction area (SEA), and smoke production rate (SPR). TTI was used to characterize ignition sensitivity; HRR and THR represented instantaneous and cumulative thermal hazards, respectively; MLR described the volatilization and consumption rate of fuel; and SEA and SPR were used to assess smoke-production hazards.
3. Results and Discussion
3.1. Time to Ignition
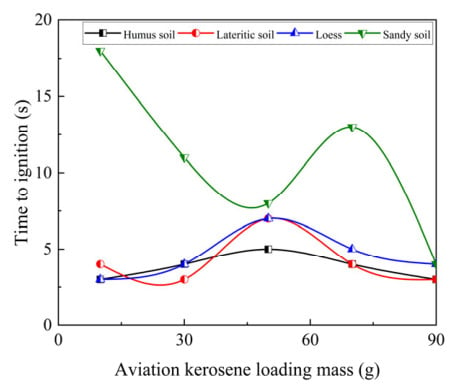
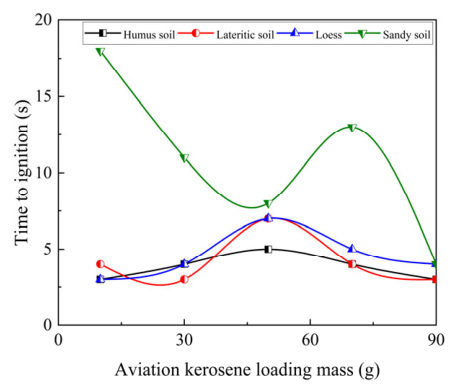
Rantuch [16] reported that time to ignition is closely correlated with external heat flux, supporting the use of TTI to evaluate ignition response under controlled radiant heating. Figure 4 shows the TTI values of oil-contaminated soil samples under different fuel loadings at an external heat flux of 35 kW/m2.
Figure 4.
Ignition time of oil-contaminated soil samples under different fuel loadings.
As shown in Figure 4, humus soil, lateritic soil, and loess generally ignited within 3.5–7.0 s under an external heat flux of 35 kW/m2. In contrast, sandy soil exhibited a substantially longer and nonmonotonic time to ignition, with the maximum value reaching approximately 18 s. Humus soil, lateritic soil, and loess generally exhibited shorter TTI values with relatively limited fluctuations as the fuel loading increased. This indicates that these soils could retain sufficient aviation kerosene within the near-surface region, allowing a flammable vapor layer to form rapidly during external heating. Among them, humus soil showed the shortest average TTI, which can be attributed to its high porosity, abundant organic matter, and aggregate structure. These characteristics favor fuel retention close to the heated surface and promote rapid vapor generation. Loess showed a relatively short ignition response because its silty structure, capillary pores, and overhead pores provided a balance between fuel retention and vapor release. Lateritic soil, with finer particles and cemented components, could restrict rapid downward fuel migration, although its narrow pore throats may also limit vapor diffusion to some extent.
Sandy soil showed a distinctly longer TTI than the other soils and exhibited a nonmonotonic variation with increasing fuel loading, characterized by an initial decrease, followed by an increase and then a further decrease. This behavior is closely related to the low porosity, high permeability, and highly connected pore channels of sandy soil. At low fuel loading, aviation kerosene can rapidly migrate downward through the coarse pore network, reducing the amount of fuel retained in the near-surface heating zone. Consequently, the formation of a sufficiently concentrated flammable vapor layer is delayed, resulting in a longer TTI. When the fuel loading increases from 10 to 30 g, the shortage of near-surface fuel is partly compensated, and the TTI decreases. When the fuel loading further increased to 70 g, more aviation kerosene penetrated into the sandy soil pores and expanded the vertical wetted depth. The combined effects of downward fuel migration and the thermal sink effect of the soil matrix weakened the rapid vapor supply from the near-surface region, resulting in a temporary increase in TTI. When the fuel loading was further increased to 90 g, the amount of aviation kerosene exceeded the rapid dispersion capacity of the sandy pore network, allowing a relatively continuous fuel-rich zone or thin liquid film to be re-established near the surface. This promotes faster vapor accumulation and reduces the TTI again.
Therefore, the longer and nonmonotonic ignition time observed for sandy soil does not indicate lower intrinsic flammability of aviation kerosene. Instead, it is consistent with changes in fuel distribution within a highly permeable soil matrix. Under the present test conditions, ignition appears to be more closely associated with the amount of fuel available near the heated surface and the rate at which combustible vapor is released than with the total amount of aviation kerosene introduced into the soil. Figure 4 suggests that differences in pore structure may influence the balance between fuel retained near the surface and fuel that migrates into deeper soil layers.
3.2. Heat Release Rate and Total Heat Release
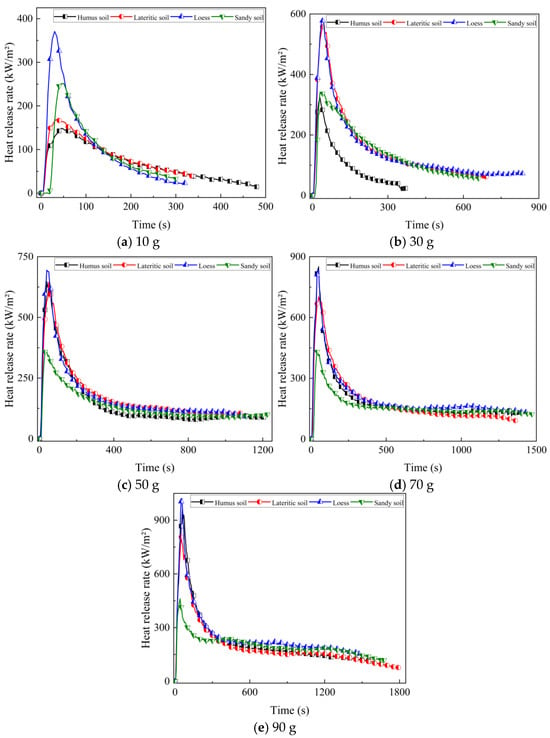
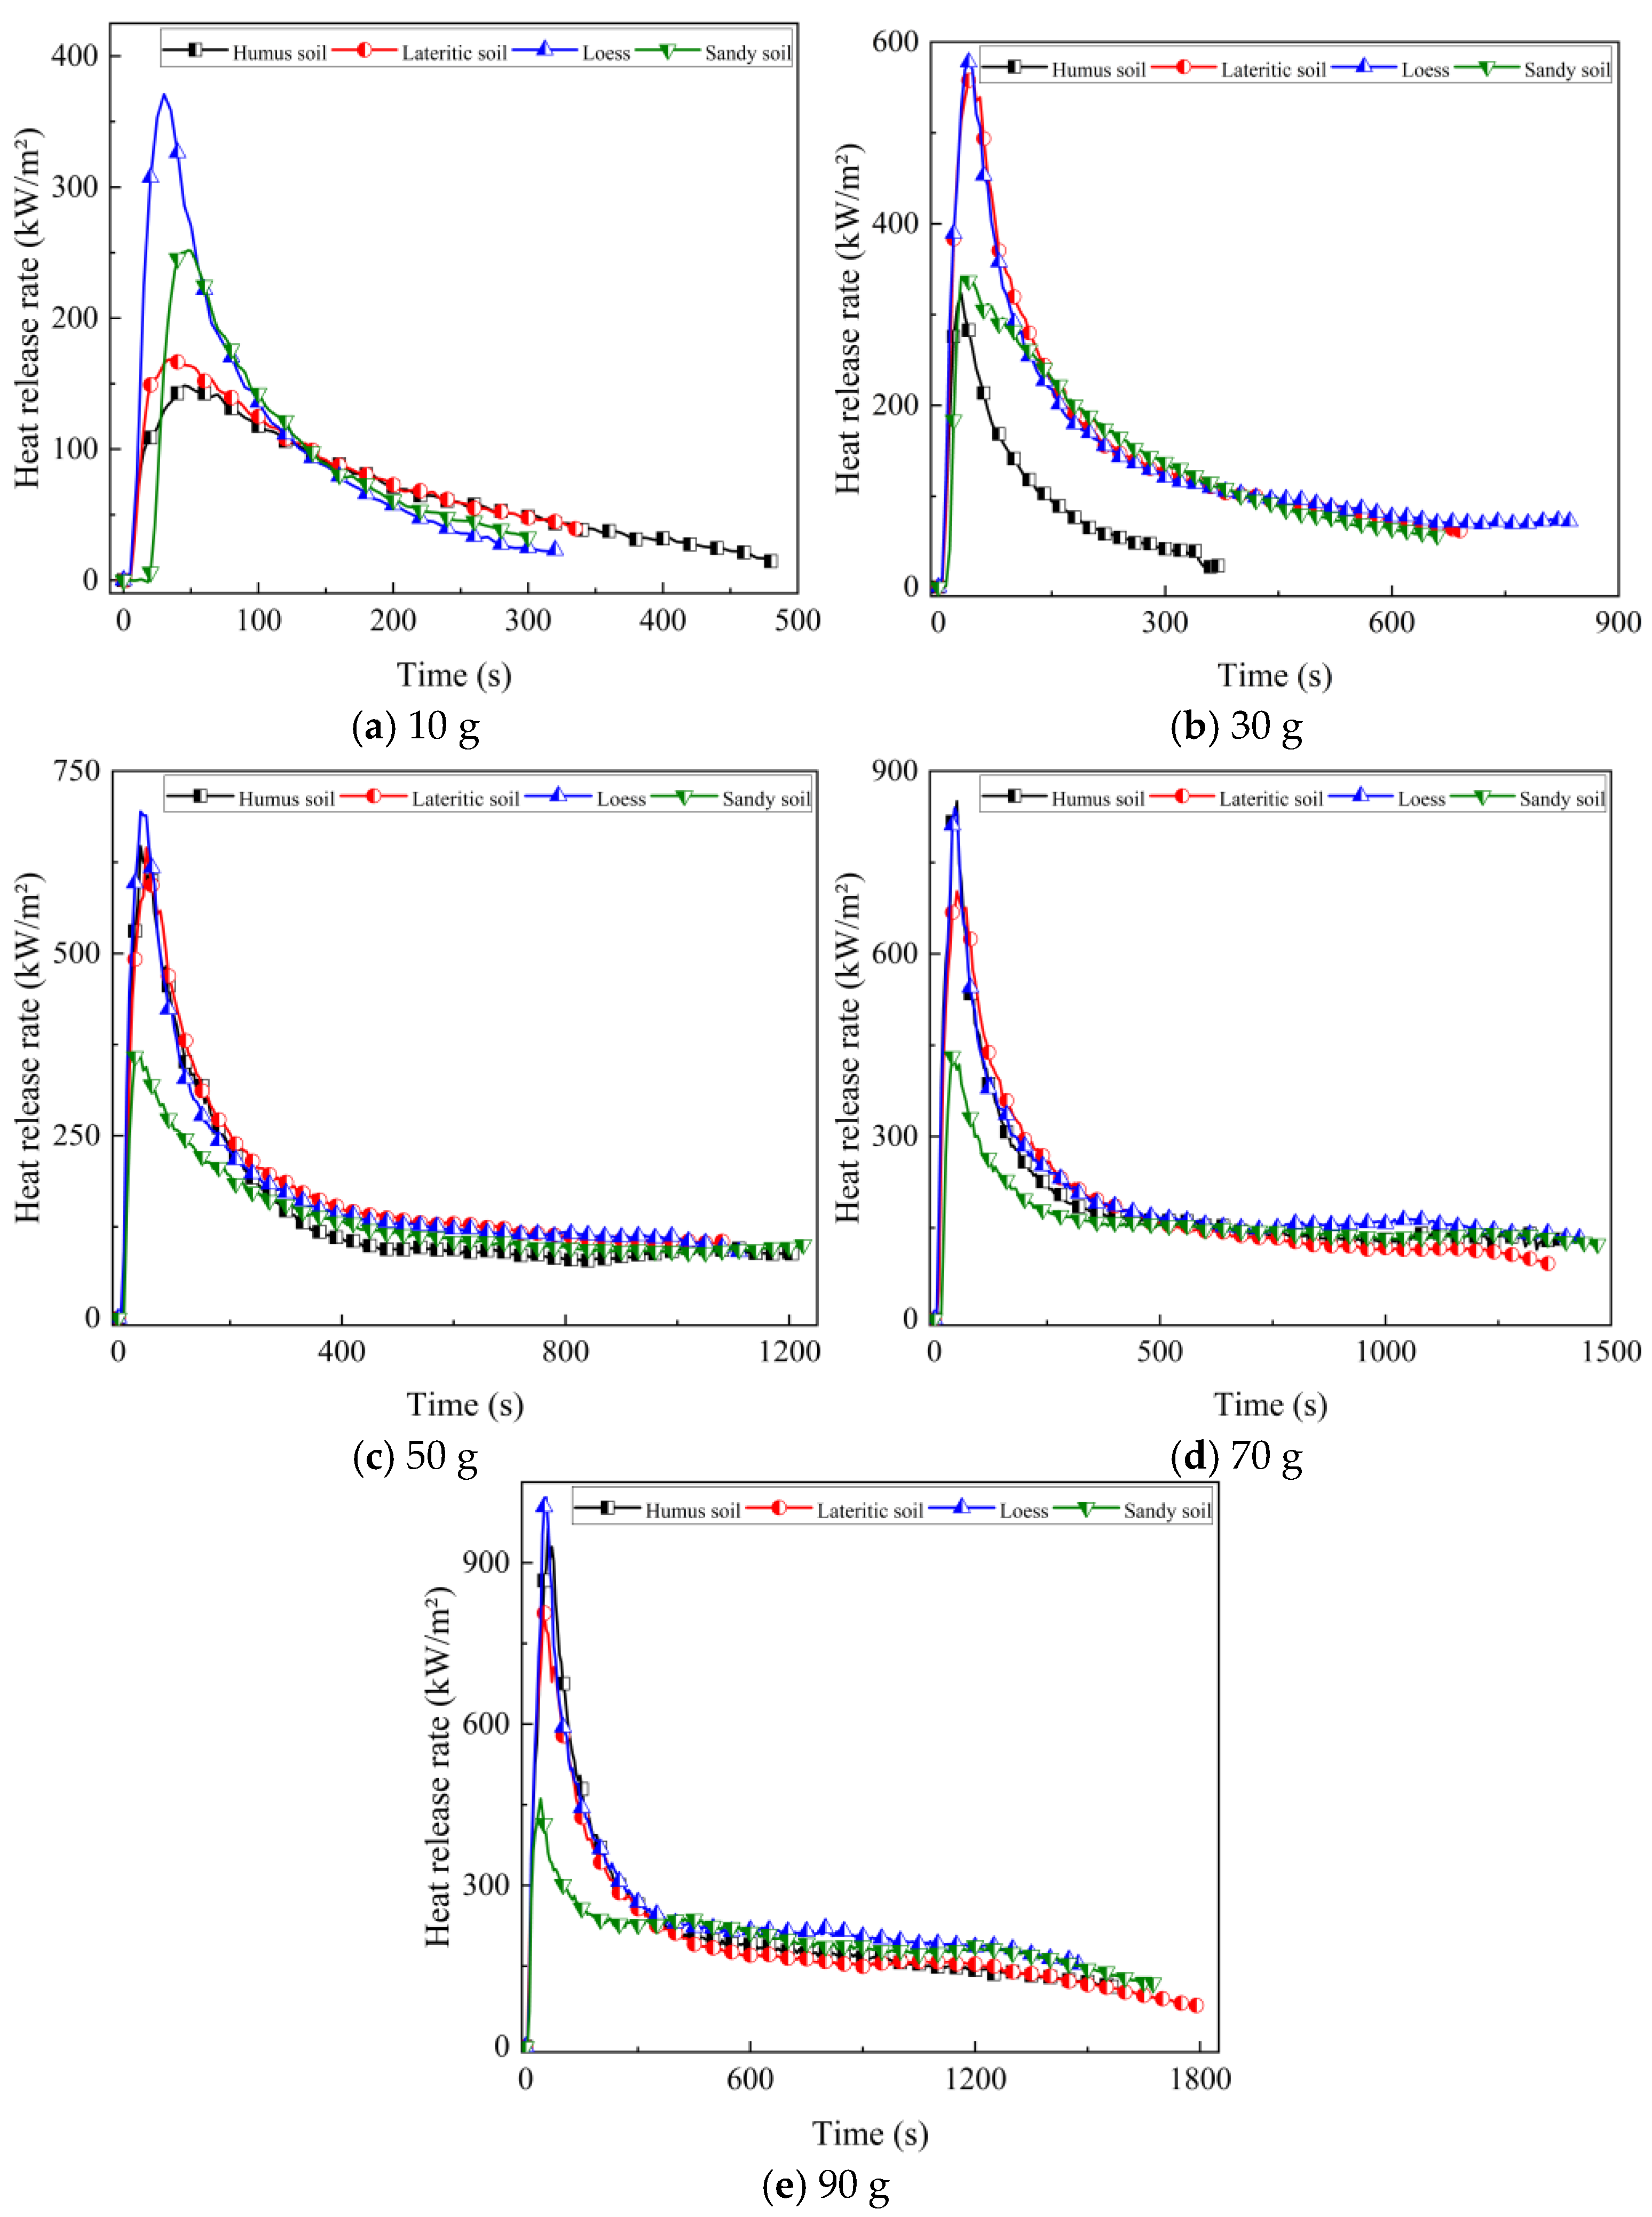
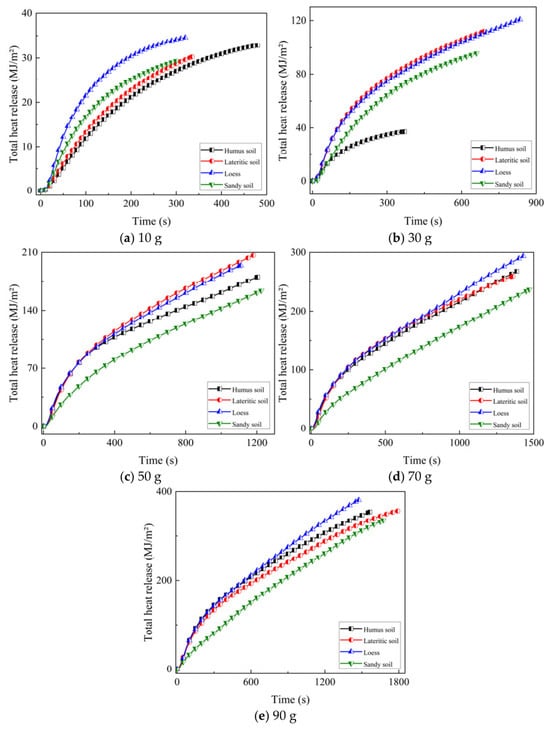
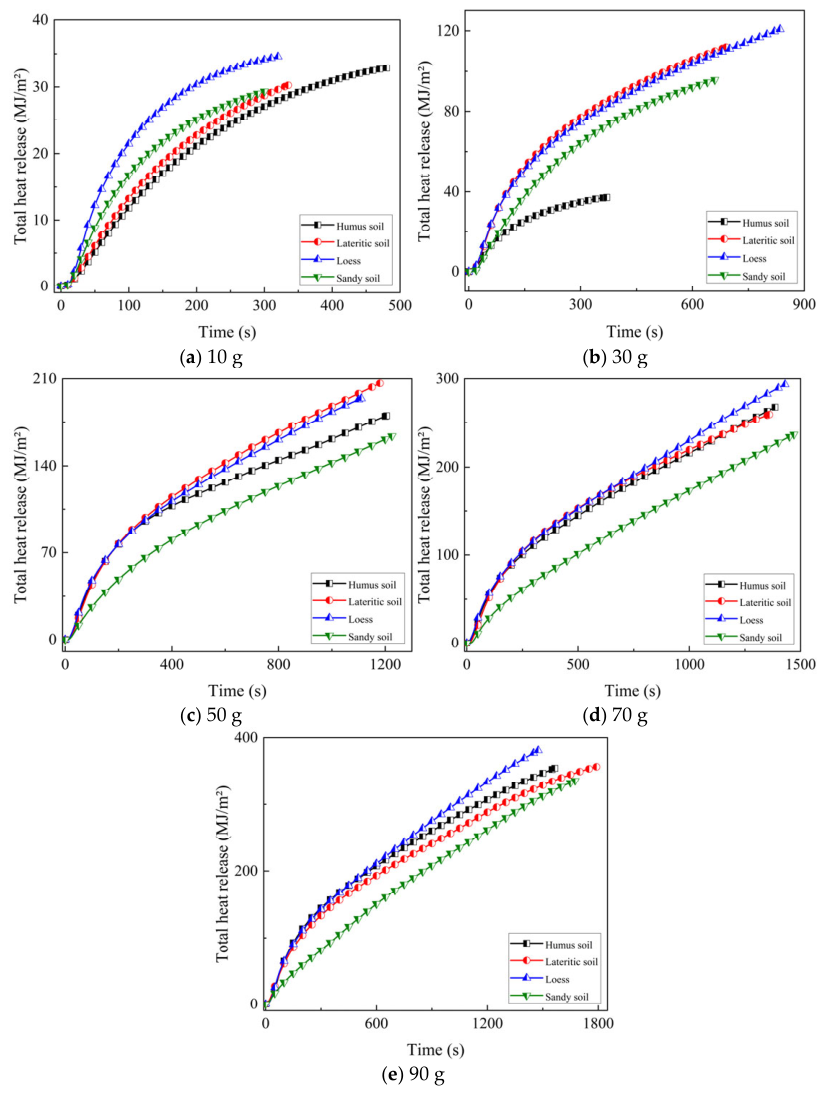
Schartel and Hull [17] further emphasized that HRR and THR should be interpreted as key indicators of instantaneous and cumulative fire hazards. Peak HRR represents the maximum short-term intensity of heat release, whereas THR represents the total heat released during the burning period. Therefore, a lower peak HRR does not necessarily indicate a lower cumulative thermal hazard. Figure 5 and Figure 6 present the HRR and THR histories of the oil-contaminated soil samples at different aviation kerosene fuel loadings.
Figure 5.
Heat release rate of oil-contaminated soil samples at different aviation kerosene fuel loadings.
Figure 6.
Total heat release of oil-contaminated soil samples at different aviation kerosene fuel loadings.
As shown in Figure 5, the HRR curves of all samples increased rapidly after ignition, reached an early peak, and then declined. Most peaks occurred within the first 30–60 s of combustion. This trend suggests that the initial burning intensity was associated with the availability of aviation kerosene near the heated surface and with early heat feedback from the flame. As the amount of aviation kerosene introduced into the soil increased, the HRR increased for all soil types, although the magnitude of this increase differed among the soils. These differences are consistent with variations in pore structure, fuel retention, and the availability of fuel near the surface. For humus soil, the peak HRR increased from 148 kW/m2 at 10 g to 964 kW/m2 at 90 g. For lateritic soil, the corresponding value increased from 168 to 806 kW/m2. Loess showed the highest overall HRR level, increasing from 370 kW/m2 at 10 g to 1021 kW/m2 at 90 g. In contrast, sandy soil showed a much weaker increase, from 251 to 461 kW/m2. These results indicate that the increase in fuel loading did not produce a uniform increase in fire intensity; instead, the heat release response was strongly regulated by the soil pore structure and its effect on near-surface fuel availability.
At low fuel loading, the differences among soils were already evident. Under the 10 g condition, loess produced the highest peak HRR of 370 kW/m2, followed by sandy soil, lateritic soil, and humus soil, with values of 251, 168, and 148 kW/m2, respectively. This suggests that, at limited fuel loading, loess was more effective in retaining fuel within the heated surface layer while still allowing vapor release. Sandy soil also showed a relatively high HRR at 10 g, probably because the small amount of fuel was rapidly released from the coarse near-surface pores. However, this behavior did not persist at higher fuel loadings. From 30 to 90 g, sandy soil consistently exhibited the lowest peak HRR among the four soils, indicating that its high permeability promoted downward fuel migration and reduced the fraction of fuel available for intense surface burning.
The distinction among the four soils became more pronounced at high fuel loading. At 90 g, the peak HRR values of loess, humus soil, lateritic soil, and sandy soil were 1021, 964, 806, and 461 kW/m2, respectively. The peak HRR of loess was 2.216 times that of sandy soil, 26.7% higher than that of lateritic soil, and 5.9% higher than that of humus soil. This result suggests that the pore structure of loess may have provided a favorable balance between retaining fuel near the surface and allowing vapor to reach the flame. Humus soil also showed high peak HRR values at 70 and 90 g, which may be related to its high porosity, organic matter content, and aggregate structure. Lateritic soil showed an intermediate HRR response. Its compact structure and narrow pore throats may have limited both fuel vapor transport and oxygen transport near the surface. Sandy soil showed the lowest peak HRR at medium and high amounts of aviation kerosene. This behavior is consistent with greater downward movement of fuel through its connected coarse pores, which may have reduced the amount of fuel available to support intense burning near the surface.
Figure 6 shows that THR increased with fuel loading for all soil types, confirming that cumulative heat release was closely related to the amount of fuel retained and consumed during combustion. From 10 to 90 g, THR increased from 32 to 354 MJ/m2 for humus soil, from 30 to 356 MJ/m2 for lateritic soil, from 34 to 380 MJ/m2 for loess, and from 28 to 334 MJ/m2 for sandy soil. The overall increase in THR demonstrates that a larger fuel loading not only increased the available combustible inventory but also extended the period over which fuel could participate in combustion. However, the THR curves also show that cumulative thermal hazard was not controlled by fuel loading alone. The soil substrate determined how much of the added fuel remained in an effective burning zone and how long it could continue to supply vapor to the flame.
At 90 g, loess produced the highest THR of 380 MJ/m2, followed by lateritic soil at 356 MJ/m2, humus soil at 354 MJ/m2, and sandy soil at 334 MJ/m2. The THR of loess was 13.8% higher than that of sandy soil, indicating that loess not only generated the strongest peak fire intensity but also released the largest cumulative heat. Lateritic soil had a lower peak HRR than loess and humus soil, but its THR was slightly higher than that of humus soil at 90 g. This suggests that lateritic soil did not favor rapid fuel release, but its restricted pore structure prolonged the burning process and allowed a considerable amount of heat to be released during the decay stage. Sandy soil had the lowest THR at 90 g, but the difference between sandy soil and the other soils was much smaller for THR than for peak HRR. This indicates that although sandy soil suppressed intense surface burning, part of the downward-migrated fuel could still contribute to a longer, lower-intensity burning process.
The comparison of Figure 5 and Figure 6 shows that peak HRR and THR represent different aspects of thermal hazard. At the 90 g fuel loading, loess showed the highest peak HRR and THR, with values of 1021 kW/m2 and 380 MJ/m2, respectively. This result indicates the highest combined peak and cumulative thermal hazard among the four soils. Humus soil showed the second-highest peak HRR, 964 kW/m2, and a THR of 354 MJ/m2, indicating a strong initial burning intensity. Lateritic soil showed a lower peak HRR, 806 kW/m2, but a slightly higher THR, 356 MJ/m2, than humus soil. This pattern is consistent with slower fuel release and a more prolonged period of heat release in lateritic soil. Sandy soil showed the lowest peak HRR, 461 kW/m2, but its THR remained 334 MJ/m2. This result suggests that, although intense burning near the surface was limited, lower-intensity burning continued after the initial peak.
Overall, the HRR and THR results suggest that soil properties influenced both the intensity and duration of combustion. Humus soil was characterized by high peak heat release, lateritic soil by moderate peak intensity but relatively high cumulative heat release, and sandy soil by the lowest peak intensity but appreciable cumulative heat release. These findings show that peak HRR and THR should be considered together when evaluating the fire hazard of aviation kerosene in soil.
3.3. Mass Loss Rate
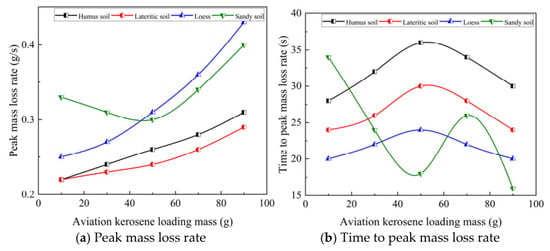
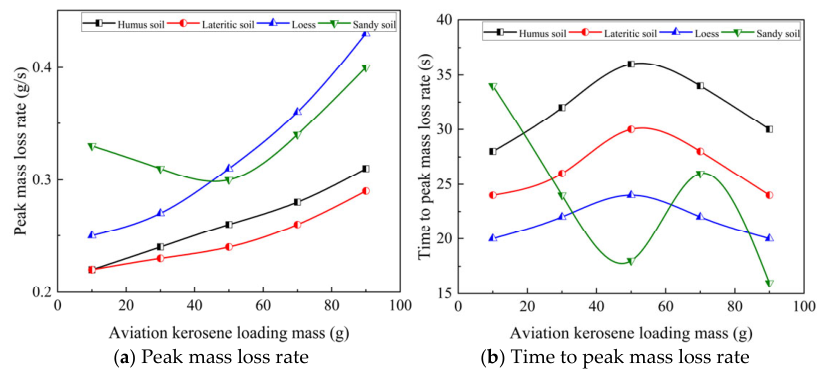
Schartel and Hull [17] also noted that mass-loss behavior helps interpret heat-release processes and combustion efficiency. Figure 7 shows the MLR peaks and corresponding times at different aviation kerosene fuel loadings.
Figure 7.
Peak MLR and corresponding time of oil-contaminated soil samples at different aviation kerosene fuel loadings.
As shown in Figure 7a,b, the mass-loss behavior of the four soil substrates differed not only in peak MLR but also in the time required to reach the peak. These two parameters jointly characterize the effective fuel-supply mode of aviation kerosene within the soil matrix. Loess exhibited a typical efficient fuel-supply behavior. Its peak MLR increased from approximately 0.25 g/s to approximately 0.43 g/s at 90 g, the highest value among the four soils. Meanwhile, its peak time was mainly concentrated within 20–24 s, with the smallest fluctuation among the tested soils. This indicates that loess not only provided a high instantaneous fuel-release intensity, but also established the maximum fuel-supply rate rapidly and stably. Humus soil showed a retention-controlled slow-release behavior. Its peak MLR remained relatively low, increasing only from approximately 0.22 to 0.31 g/s, while its peak time ranged from 28 to 36 s, later than that of loess. This suggests that the mass-loss process in humus soil was dominated by gradual fuel release rather than rapid fuel eruption. Lateritic soil exhibited a low-permeability-limited behavior. Its peak MLR increased from approximately 0.22 to 0.29 g/s, representing the weakest overall release intensity, and its peak time ranged from 24 to 30 s, slightly earlier than that of humus soil but later than that of loess. This indicates that a small amount of near-surface aviation kerosene in lateritic soil could participate in combustion relatively quickly; however, because lateritic soil had the lowest permeability and narrow pore throats, fuel migration, volatilization, and oxygen supply were all restricted, resulting in weak and transport-limited fuel release.
Sandy soil showed the most distinctive response and can be characterized as a high-permeability migration and high-loading burst-release substrate. Its behavior can be divided into three stages. In the first stage, from 10 to 50 g, downward migration dominated. Aviation kerosene rapidly migrated into deeper layers through highly permeable pore channels, reducing the amount of effective near-surface fuel and causing the peak MLR to decrease. However, the fuel remaining in shallow coarse pores had low release resistance, so the peak time became shorter. In the second stage, from 50 to 70 g, vertical dispersion and thermal lag became more important. More aviation kerosene entered deeper pores and expanded the vertical wetted depth, increasing the thermal sink effect of the soil matrix. As a result, the establishment of the maximum fuel-supply rate was delayed, and the peak time increased. In the third stage, from 70 to 90 g, near-surface enrichment became dominant. The supplied fuel exceeded the rapid dispersion capacity of the sandy pore network, allowing a fuel-rich region or thin liquid film to reform near the surface. Consequently, the peak MLR increased and the peak time decreased again. Therefore, the MLR evolution of sandy soil reflects the competition between downward fuel migration and near-surface fuel enrichment in a highly permeable porous medium. From 10 to 50 g, downward migration dominated and suppressed the peak MLR. From 50 to 70 g, the increased wetted depth and thermal sink effect delayed the peak. From 70 to 90 g, near-surface fuel enrichment became dominant again, leading to enhanced mass loss and earlier peak occurrence. This behavior indicates that, at low to intermediate fuel loadings, sandy soil tends to promote fuel migration into deeper layers and reduce near-surface fuel availability. At high fuel loading, however, it can rapidly shift to near-surface fuel accumulation and short-duration intense mass loss, implying a potential risk of early fire-growth acceleration.
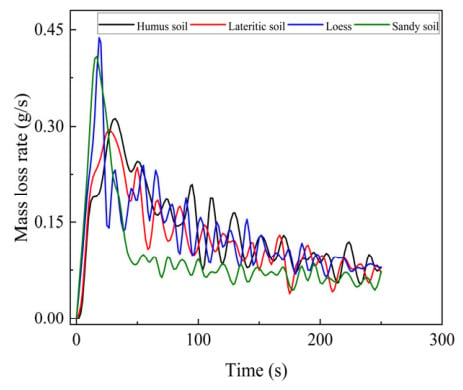
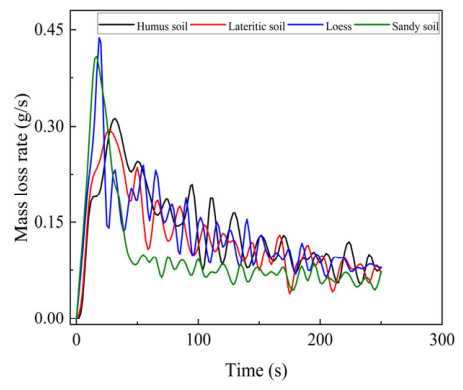
To compare the fuel-consumption behavior under high fuel loading, Figure 8 presents the MLR curves of the 90 g samples during the first 250 s, which captures the ignition, rapid burning, peak MLR, and main decay stages that dominate the mass-loss process.
Figure 8.
Mass loss rate curves of the 90 g oil-contaminated soil samples during the first 250 s of combustion.
Combined analysis of Figure 5, Figure 7 and Figure 8 shows that the peak MLR and peak HRR were not strictly proportional under the 90 g aviation kerosene loading. As shown in Figure 7 and Figure 8, the peak MLR values of loess, sandy soil, humus soil, and lateritic soil were approximately 0.43, 0.40, 0.31, and 0.29 g/s, respectively. In contrast, Figure 5 shows that the corresponding peak HRR values followed a different order, with loess, humus soil, lateritic soil, and sandy soil reaching 1021, 964, 806, and 461 kW/m2, respectively. Although the peak MLR of sandy soil was only about 7.0% lower than that of loess, its peak HRR was approximately 54.9% lower. Conversely, the peak MLR of humus soil was about 22.5% lower than that of sandy soil, but its peak HRR was approximately 2.09 times that of sandy soil. This result suggests that part of the measured mass loss may have been associated with fuel movement or vapor release that did not contribute proportionally to intense flaming near the surface.
To compare the correspondence between mass loss and heat release, the ratio of peak HRR to peak MLR was estimated for the 90 g samples as an apparent comparative indicator. It is used only to compare the relative association between instantaneous mass loss and flame heat release among different soil substrates under the same test geometry. The apparent pHRR/pMLR values were approximately 2376 kW·m−2/(g·s−1) for loess, 3111 kW·m−2/(g·s−1) for humus soil, 2780 kW·m−2/(g·s−1) for lateritic soil, and 1153 kW·m−2/(g·s−1) for sandy soil. The lower value for sandy soil suggests that a substantial fraction of its measured mass loss may not have contributed proportionally to high-intensity near-surface flaming.
The discrepancy was most pronounced for sandy soil. Its connected coarse-pore structure was associated with a relatively high peak MLR but the lowest peak HRR. Under the 90 g condition, a transient fuel-rich region may have formed near the surface, producing a high rate of mass loss. At the same time, fuel movement and vapor transport through the connected pores may have reduced the continuity of vapor supply to the principal flame region. These processes could explain why the measured mass loss did not contribute proportionally to high-intensity surface heat release.
Loess showed the opposite behavior. It had the highest peak MLR, approximately 0.43 g/s, and also the highest peak HRR, 1021 kW/m2. This indicates that mass loss in loess was more efficiently converted into heat release. Loess had a porosity of 52.0% and a permeability of 4.661 D, and its silty structure contained both capillary pores and overhead pores. This pore configuration allowed aviation kerosene to remain within the near-surface heated region while still providing effective vapor-release pathways. The MLR curve in Figure 8 also shows that loess maintained a high peak with a relatively stable release process, suggesting that a near-surface fuel-supply pathway was rapidly established and maintained. Therefore, the mass loss in loess mainly corresponded to effective evaporation and combustion of near-surface fuel, which is consistent with the high HRR observed in Figure 5.
Humus soil and lateritic soil exhibited another type of MLR-HRR relationship. For humus soil, the peak MLR under the 90 g condition was approximately 0.31 g/s, lower than those of loess and sandy soil, but the peak HRR reached 964 kW/m2, only about 5.6% lower than that of loess. This suggests that humus soil did not produce the highest instantaneous mass-loss intensity, but its near-surface fuel retention and vapor supply were relatively stable, resulting in a high heat release per unit mass loss. Lateritic soil had the lowest peak MLR, approximately 0.29 g/s, but its peak HRR still reached 806 kW/m2, clearly higher than that of sandy soil. This indicates that although its low permeability and narrow pore throats restricted the fuel-release rate, the limited amount of released fuel was more concentrated in the effective near-surface burning zone and could participate more fully in flaming combustion. With the lowest permeability of 3.648 D, lateritic soil suppressed rapid downward fuel migration, so its MLR was low, but the coupling between mass loss and heat release was stronger than that in sandy soil.
Overall, the 90 g tests revealed four distinct coupling patterns between mass loss and heat release among the soil substrates. Loess showed strong coupling, as its high MLR was accompanied by the highest HRR, indicating efficient conversion of released fuel into flaming heat output. Humus soil exhibited efficient heat release despite a moderate MLR, suggesting stable near-surface vapor supply and effective combustion of the released fuel. Lateritic soil showed a constrained but still effective response, with a low MLR but a moderately high HRR, reflecting restricted fuel release and relatively efficient combustion of the available vapor. Sandy soil showed the weakest coupling, as its relatively high MLR corresponded to the lowest HRR, indicating that a considerable fraction of mass loss was related to inefficient fuel consumption.
3.4. Specific Extinction Area and Smoke Production Rate
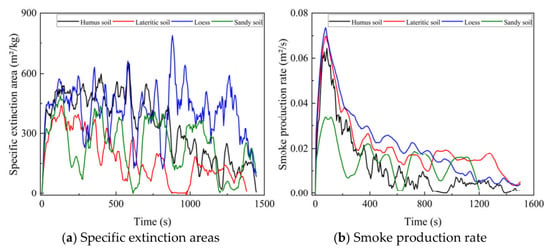
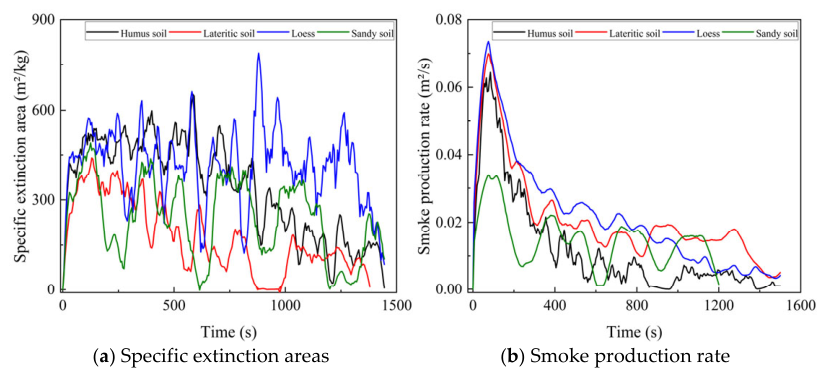
For aviation kerosene-contaminated soils, smoke production depends not only on the fuel itself but also on soil composition, pore structure, and fuel distribution in the porous medium [17]. Figure 9 presents the specific extinction area (SEA) and smoke production rate (SPR) curves for the soil samples at a fuel loading of 90 g. This condition provided a sufficiently long burning duration and a complete record of smoke generation. It was therefore selected to compare the smoke production characteristics of the different soil samples. The following analysis is limited to the 90 g fuel loading condition.
Figure 9.
The SEA and SPR curves of the four soil samples containing 90 g of aviation kerosene.
As shown in Figure 9a, the SEA curves fluctuated markedly, indicating that soot formation during oil-contaminated soil combustion was staged and unstable. This behavior was related to the nonuniform fuel distribution, fluctuating local vapor supply, and incomplete combustion in the soil pores. Loess showed the highest SEA level for most of the burning duration and reached a peak close to 800 m2/kg at approximately 850 s, indicating the strongest smoke-generation capability per unit mass loss. Humus soil also showed a relatively high smoke tendency, generally maintaining values of 300–600 m2/kg. Lateritic and sandy soils exhibited lower SEA levels, and sandy soil had the weakest overall smoke-generation capability despite local fluctuations.
As shown in Figure 9b, the SPR curves increased rapidly during the initial burning stage, reached peaks within approximately 50–150 s, and then gradually decreased. The peak SPR was highest for loess, approximately 0.073 m2/s, followed by lateritic soil at approximately 0.070 m2/s, humus soil at approximately 0.060 m2/s, and sandy soil at approximately 0.034 m2/s. These results indicate that loess and lateritic soil generated smoke more rapidly during the early stage, which may accelerate smoke accumulation in the fire environment.
Considering SEA and SPR together, loess showed the highest smoke hazard under the 90 g condition. Humus soil showed sustained smoke production, lateritic soil showed relatively rapid smoke release during the early stage, and sandy soil showed the lowest overall smoke production.
To facilitate a comprehensive comparison of these four soil types, the main thermal, mass loss, and smoke characteristics at the 90 g fuel loading are summarized in Table 5.
Table 5.
Summary of combustion characteristics at the 90 g fuel loading.
As shown in Table 5, loess showed the highest HRR, THR, SEA, and SPR. Humus soil showed high peak heat release and sustained smoke production. Lateritic soil showed moderate peak heat release, relatively high THR, and a pronounced early-stage smoke response. Sandy soil showed the lowest peak HRR and peak SPR, although its peak MLR remained relatively high.
4. Conclusions
This study investigated the combustion behavior of aviation-kerosene-contaminated humus soil, lateritic soil, loess, and sandy soil under a 35 kW/m2 external heat flux using a cone calorimeter. The main conclusions are as follows:
- (1)
- The ignition response varied markedly among the soil types. Under an external heat flux of 35 kW/m2, the time to ignition of humus soil, lateritic soil, and loess generally ranged from 3.5 to 7.0 s. Sandy soil showed a longer and nonmonotonic ignition response, with the longest ignition time reaching approximately 18 s. This pattern is consistent with the ability of the connected coarse pores in sandy soil to redistribute part of the fuel away from the heated surface. At higher amounts of aviation kerosene, the ignition delay of sandy soil decreased, which may indicate renewed fuel accumulation near the surface.
- (2)
- Heat release depended on both the amount of aviation kerosene introduced into the soil and the physical characteristics of the soil. At 90 g, the peak HRR values were 1021 kW/m2 for loess, 964 kW/m2 for humus soil, 806 kW/m2 for lateritic soil, and 461 kW/m2 for sandy soil. The corresponding THR values were 380, 354, 356, and 334 MJ/m2, respectively. Loess showed the highest peak and cumulative heat release under the present conditions. This result is consistent with a pore structure that retained fuel near the heated surface while allowing vapor to reach the flame. Sandy soil showed the lowest peak HRR, which may be associated with greater downward redistribution of fuel through its connected coarse pores. The comparison between lateritic soil and humus soil also shows that a lower peak HRR does not necessarily correspond to a lower cumulative thermal hazard. Although lateritic soil had a lower peak HRR than humus soil, its THR was slightly higher at 90 g, suggesting a slower and more prolonged heat-release process.
- (3)
- MLR analysis showed that mass loss and heat release were coupled differently among soils. At 90 g, the peak MLR values of loess, sandy soil, humus soil, and lateritic soil were approximately 0.43, 0.40, 0.31, and 0.29 g/s, respectively. However, the corresponding peak HRR values were 1021, 461, 964, and 806 kW/m2. Loess showed the strongest mass-loss-to-heat-release coupling, whereas sandy soil showed the weakest coupling.
- (4)
- Smoke generation at the 90 g condition also varied among the soil types. Loess showed the highest combined smoke response, with a peak SPR of approximately 0.073 m2/s and SEA values reaching nearly 800 m2/kg. Humus soil showed sustained smoke production, with SEA values generally between 300 and 600 m2/kg. Lateritic soil showed a relatively high early-stage peak SPR of approximately 0.070 m2/s, whereas sandy soil showed the lowest peak SPR, approximately 0.034 m2/s. These differences were associated with the observed differences in heat release, mass loss, and fuel retention behavior. The relatively high early-stage smoke release from lateritic soil may be related to restricted transport within its narrow pore structure, while the low smoke level of sandy soil may be associated with fuel redistribution into deeper layers.
- (5)
- Under the present test conditions, loess showed the highest combined fire hazard because it had the highest peak HRR, the highest THR, the highest peak MLR, and the strongest smoke response at 90 g. Humus soil and lateritic soil also presented substantial hazards. Humus soil showed high peak heat release and sustained smoke production, whereas lateritic soil showed a moderate peak HRR but relatively high THR and an evident early-stage smoke response. Sandy soil showed the lowest peak heat release and smoke production, but its high permeability and connected coarse pores were associated with greater potential for downward fuel migration. At high amounts of aviation kerosene, this behavior may also lead to short-duration increases in near-surface mass loss.
Author Contributions
Conceptualization, X.J. and H.C.; methodology, X.J. and K.L.; investigation, K.L., T.T., S.Z. and R.L.; data curation, K.L., T.T. and R.L.; writing—original draft preparation, X.J. and H.C.; writing—review and editing, X.J., H.C. and K.L.; supervision, X.J. All authors have read and agreed to the published version of the manuscript.
Funding
This research was funded by the Chongqing Postgraduate Research and Innovation Project, grant number CYS25913.
Data Availability Statement
The data presented in this study are available from the corresponding author upon reasonable request.
Conflicts of Interest
The authors declare no conflicts of interest.
References
- Xiao, Z.; Guo, S.; Cheng, F.; Wang, S. Effects of mineral species and petroleum components on thermal desorption behavior of petroleum-contaminated soil. Chemosphere 2022, 307, 135548. [Google Scholar] [CrossRef] [Scilit]
- Xue, Y.; Chen, L.; Xiang, L.; Zhou, Y.; Wang, T. Experimental investigation on electromagnetic induction thermal desorption for remediation of petroleum hydrocarbons contaminated soil. J. Environ. Manag. 2023, 328, 117200. [Google Scholar] [CrossRef] [Scilit]
- Zhang, Y.; Chen, C.; Jiao, W.; Lu, T. Experimental study on burning characteristic of liquid fuel immersed in porous media bed: Effect of particle gradation. Fuel 2023, 344, 128103. [Google Scholar] [CrossRef] [Scilit]
- Zhang, Y.; Chen, C.; Lei, P.; Zhao, D. Experimental study on effect of infiltration depth on burning characteristic and fuel residual feature of inert porous media bed soaked by combustible liquid. Fire Technol. 2024, 60, 1163–1184. [Google Scholar] [CrossRef] [Scilit]
- Zhang, Y.; Zhang, D.; Mao, S.; Wang, X.; Lu, K.; Li, B. Experimental study on burning characteristic of liquid fuel-immersed porous media bed in cross airflow. Int. J. Therm. Sci. 2025, 210, 109677. [Google Scholar] [CrossRef] [Scilit]
- Zhai, X.; Chen, P.; Li, L.; Sun, R.; Liu, Y. Experimental study on continuous spill fire of liquid fuel on porous bed. Energy Sources Part A Recovery Util. Environ. Eff. 2023, 45, 1937–1951. [Google Scholar] [CrossRef] [Scilit]
- Zhai, X.; Chen, P.; Li, L.; Sun, S.; Liu, Y.; Sun, R. Experimental study on combustion characteristics of continuous oil spill fire on porous bed. J. Therm. Anal. Calorim. 2023, 148, 10375–10387. [Google Scholar] [CrossRef] [Scilit]
- Zhai, X.; Chen, P.; Sun, S.; Liu, Y.; Li, L. Experimental study on heat transfer and propagation speed of spill fire on porous media substrate with micro-inclination. Int. Commun. Heat Mass Transf. 2023, 145, 106860. [Google Scholar] [CrossRef] [Scilit]
- Erland, S.; Meyer, R.; Hagen, B.C. Fast moving smoldering fronts in thin liquid fuel films dispersed on inert porous media. Fire Saf. J. 2022, 133, 103645. [Google Scholar] [CrossRef] [Scilit]
- Ding, C.; Ma, S.; Yan, Z.; He, L.; Li, Y.; Fang, T.; Jiao, Y. Experimental study on the effect of sub-flash point fuel temperature on the spread characteristics of spill fire. Fire 2023, 6, 284. [Google Scholar] [CrossRef] [Scilit]
- ISO 5660-1; Reaction-to-Fire Tests—Heat Release, Smoke Production and Mass Loss Rate—Part 1: Heat Release Rate (ConeCalorimeter Method) and Smoke Production Rate (Dynamic Measurement). International Organization for Standardization: Geneva, Switzerland, 2015.
- ASTM D854-23; Standard Test Methods for Specific Gravity of Soil Solids by the Water Displacement Method. ASTMInternational: West Conshohocken, PA, USA, 2023.
- Mitchell, J.K.; Soga, K. Fundamentals of Soil Behavior, 3rd ed.; John Wiley & Sons: Hoboken, NJ, USA, 2005. [Google Scholar]
- ASTM D7263-21; Standard Test Methods for Laboratory Determination of Density (Unit Weight) of Soil Specimens. ASTM International: West Conshohocken, PA, USA, 2021.
- Bear, J. Dynamics of Fluids in Porous Media; Dover Publications: New York, NY, USA, 1988. [Google Scholar]
- Rantuch, P. The correlation between external heat flux and time to ignition. In Ignition of Polymers; Springer Series on Polymer and Composite Materials; Springer: Cham, Switzerland, 2022; pp. 45–68. [Google Scholar]
- Schartel, B.; Hull, T.R. Development of fire-retarded materials—Interpretation of cone calorimeter data. Fire Mater. 2007, 31, 327–354. [Google Scholar] [CrossRef] [Scilit]

Disclaimer/Publisher’s Note: The statements, opinions and data contained in all publications are solely those of the individual author(s) and contributor(s) and not of MDPI and/or the editor(s). MDPI and/or the editor(s) disclaim responsibility for any injury to people or property resulting from any ideas, methods, instructions or products referred to in the content. |
© 2026 by the authors. Licensee MDPI, Basel, Switzerland. This article is an open access article distributed under the terms and conditions of the Creative Commons Attribution (CC BY) license.