


Abstract
This study comparatively analyzed the experimental methods used in previous studies to generate primary and secondary arc beads, with particular emphasis on the conductor temperature conditions. On this basis, the suitability of these methods was critically examined, and the conventional method for generating primary arc beads was considered inconsistent with the definition of a primary arc bead, which should be associated with a short circuit that initiates a fire. To verify this hypothesis, two experiments were conducted. In the first experiment, specimens were generated by short circuiting conductors at room temperature using the same method as in previous studies, and the ability of the resulting arc to ignite adjacent combustible materials was evaluated. In the second experiment, which was designed to produce ignition at the time of the short circuit, a poor electrical connection was first introduced at a receptacle to thermally degrade the combustible material and raise the conductor temperature; a short circuit was then intentionally induced to generate the specimens. The specimens produced in both experiments were prepared and their cross-sectional microstructures were analyzed by scanning electron microscopy–electron backscatter diffraction (SEM-EBSD). Misorientation was quantitatively measured and compared. In the first experiment, cotton was the only combustible material ignited by the arc, whereas in the second experiment, the receptacle insulation ignited when the short circuit occurred. In the comparison of low-angle misorientation in the arc beads generated by the two experiments, the mean values for all specimens from the second experiment were higher than those from the first experiment, and the overall difference between the experiments averaged 32.15%. The t-test results showed a statistically significant difference between the two groups. Furthermore, the standardized mean difference between the two groups was substantial, indicating a clear distinction beyond statistical significance. These results raise questions regarding the representativeness of primary arc bead specimens generated using conventional methods and indicate that the experimental method for generating primary arc beads should be re-established to enable reliable arc bead discrimination.
1. Introduction
Research on the differentiation of arc beads was initiated to improve the accuracy of fire investigations. In particular, studies have attempted to distinguish between primary arc beads, which are formed when an electrical arc initiates a fire, and secondary arc beads, which are formed during a fire, based on the assumption that fundamental differences exist between the two types of arc beads [1,2,3,4].
Although numerous studies have investigated the differentiation of primary and secondary arc beads over several decades, no method has yet been implemented in routine practice [5]. Based on previous studies and the relevant theoretical background, this study hypothesized that the principal limitation lies not in the analytical methods used to characterize arc beads, but in the experimental procedures used to produce the specimens. This hypothesis was based on the following observation. In most previous studies, primary arc beads were generated by short circuiting conductors at room temperature, whereas secondary arc beads were generated by exposing conductors to a flame before inducing a short circuit. However, when the definition of a primary arc bead as a bead associated with fire initiation is considered, a momentary arc produced by a simple short circuit may be insufficient to ignite nearby combustibles, conductor insulation, or insulating components connected to the conductor and to sustain combustion through a chain reaction. Although the magnitude of the thermal energy is important for ignition, the duration of heat exposure and thermally induced changes in material properties are also critical [6,7].
To verify this hypothesis, two experiments were conducted. In the first experiment, arc beads were generated using the same room-temperature short circuit method adopted in previous studies, while an ignition test was simultaneously performed to determine whether the short circuit arc could ignite combustible materials. In the second experiment, specimens were produced using a newly proposed method in which a short circuit was induced after the conductor temperature had increased because of a poor electrical connection. The specimens produced in both experiments were sectioned and examined using SEM–EBSD, and their misorientation distributions were quantitatively compared.
2. Research Trends in Arc Bead Differentiation
Melted marks generally refer to various traces formed when conductors found at fire scenes melt and subsequently resolidify. They may be broadly classified into arc beads formed by electrical arcing and fire-melted globules formed by exposure to the high temperatures of a fire. Arc beads are further classified as primary arc beads, which are associated with fire initiation, and secondary arc beads, which are formed after fire onset under the influence of flames or radiant heat [8,9,10,11].
Previous studies generally produced specimens through controlled experiments designed to generate different types of arc beads and then attempted to distinguish them by comparing their characteristics. Various approaches have been investigated, including external morphology, surface luster, cross-sectional microstructure, void size and number, and oxygen concentration. However, no method has yet been established for the unambiguous differentiation of primary and secondary arc beads in practical fire investigation. Nevertheless, in several countries, including the United States, Japan, and Korea, melted marks collected from fire scenes are sectioned and their cross-sectional microstructures are examined using metallurgical microscopy to distinguish arc beads from fire-melted globules. A 2012 research report by Roby published by the U.S. Department of Justice concluded that cross-sectional microstructural examination using a metallurgical microscope was the most effective method for distinguishing arc beads from fire-melted globules [6].
In Korea, studies have employed not only metallurgical microscopy but also scanning electron microscopy-based electron backscatter diffraction (SEM–EBSD) for cross-sectional microstructural analysis [12]. EBSD is a powerful analytical technique that has long been used in materials science to quantitatively characterize microstructural features [13]. The Electrical Safety Research Institute of the Korea Electrical Safety Corporation has introduced EBSD to support the differentiation of arc beads and fire-melted globules.
A review of previous studies shows that the experimental methods used by different researchers to generate primary and secondary arc beads were generally similar.
Gray generated primary arc beads by applying overcurrent to PVC-insulated conductors until a short circuit occurred, whereas secondary arc beads were generated by exposing energized conductors carrying normal current to a flame. The magnitude of the overcurrent and the relevant temperature conditions were not reported [14]. Erlandsson generated primary arc beads by short circuiting conductors at room temperature and produced secondary arc beads by inducing a short circuit while the conductors were exposed to a flame in a furnace controlled at approximately 1000 °C [15]. Mitsuhashi generated primary arc beads by inducing a short circuit at room temperature under current-limited conditions and produced secondary arc beads by first heating the conductors to 1000 °C in an oven and subsequently short circuiting the heated conductors [16]. Satoh generated primary arc beads by short circuiting conductors at room temperature and then conducted an additional flame exposure test. Secondary arc beads were generated by exposing conductors to a flame and inducing a short circuit [17]. Lee produced primary arc beads by carbonizing the insulating material between conductors and inducing a short circuit through the resulting carbonized conductive path, whereas secondary arc beads were generated by flame exposure [18]. K. M. Park produced primary arc beads by crossing stripped conductors at right angles and short circuiting them at room temperature (25 °C). Secondary arc beads were produced by inducing a short circuit in insulated conductors in a furnace controlled at approximately 600 °C, corresponding to the temperature of flashover conditions [12]. J. Y. Park generated primary arc beads by positioning the ends of stripped conductors opposite each other and inducing a short circuit at room temperature (25 °C). Secondary arc beads were produced using the same arrangement while exposing the conductors to flames at 600 and 900 °C [19].
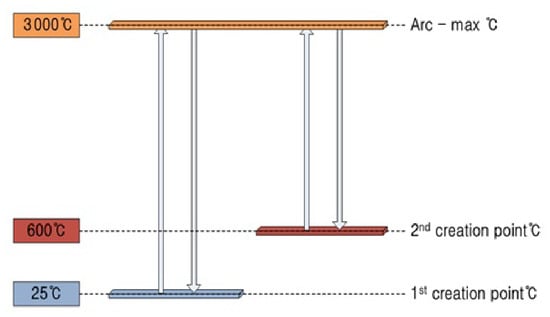
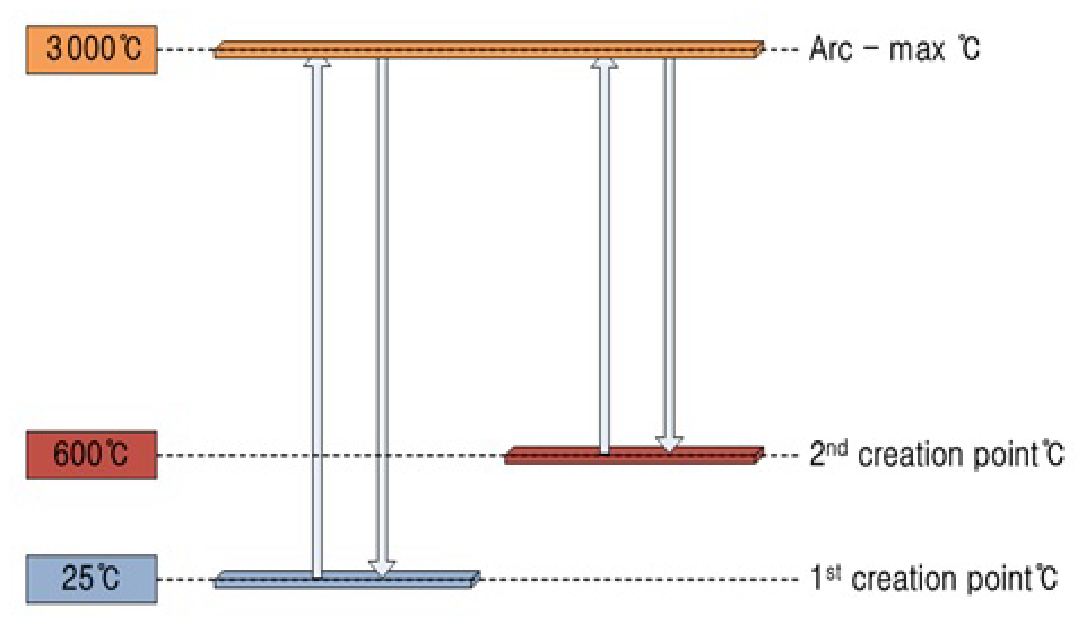
In most of these studies, primary arc beads were generated by short circuiting conductors at room temperature, whereas secondary arc beads were generated by short circuiting conductors exposed to a flame. Consequently, the ambient temperature surrounding the conductor before short circuiting differed by approximately 600–1000 °C between the two specimen groups. The principal factor governing the microstructural differences between primary and secondary arc beads can therefore be considered the cooling condition resulting from the temperature difference between the surrounding environment and the arc-heated conductor, whose local temperature may reach approximately 3000 °C [19,20]. Here, the cooling condition refers primarily to the cooling rate, which affects the number of nucleation sites and the distribution of misorientation angles. Researchers have attempted to distinguish the two types of arc beads using cross-sectional microstructural analysis by optical or metallurgical microscopy and electron microscopy, elemental concentration profiling by Auger electron spectroscopy (AES) or secondary ion mass spectrometry (SIMS), and carbon structure analysis by Raman spectroscopy [14,15,17,18]. The most widely used approach has been microscopic examination of the cross-sectional microstructure. K. M. Park used EBSD to measure misorientation angles and attempted a quantitative comparison [12]. J. Y. Park also used EBSD to quantitatively evaluate misorientation, grain area ratio, and grain aspect ratio and proposed these parameters as classification factors [19]. Table 1 summarizes the research trends in arc bead differentiation, and Figure 1 schematically illustrates the cooling conditions associated with the experimental temperature conditions.
Table 1.
Temperature-based arc bead generation methods by different researchers.
Figure 1.
Short circuit conductor temperature and cooling conditions.
3. Concept of Super Cooling and Misorientation
Electrical conductors are generally made of copper, commonly 99.95% electrolytic tough pitch (ETP) copper. Copper has a melting point of approximately 1083 °C and consists of polycrystalline grains with a face-centered cubic (FCC) structure, frequently including annealing twins [21].
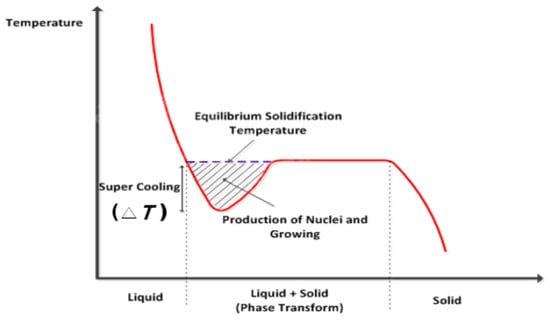
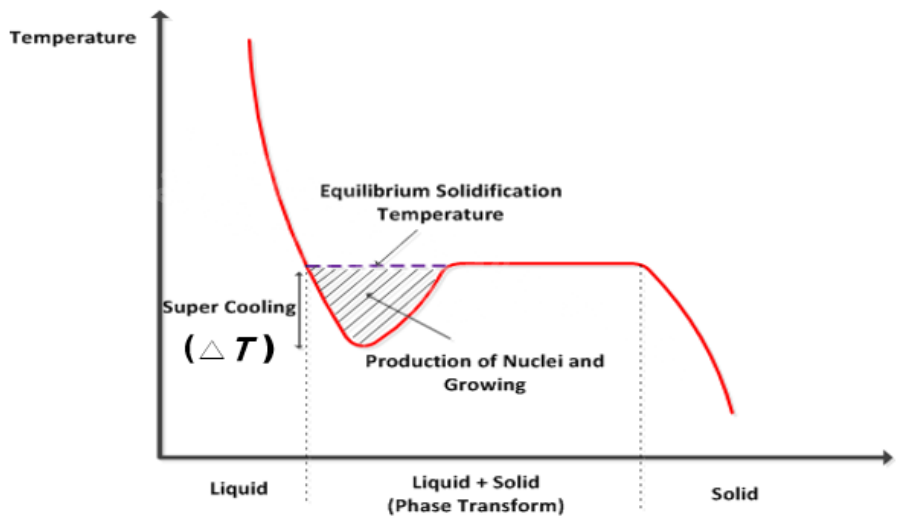
During a short circuit, super cooling occurs as the conductor locally melts and resolidifies. Super cooling affects nucleation and crystal growth. In particular, as the degree of super cooling (ΔT) increases during solidification, the nucleation barrier decreases, facilitating the formation of new nuclei. Figure 2 illustrates the concept of super cooling. Differences in the degree of super cooling during solidification affect nucleation and grain growth behavior. Consequently, grain size per unit area and crystallographic orientation distributions may vary. These microstructural differences may appear as differences in the misorientation distribution measured by EBSD [22].
Figure 2.
Concept of super cooling.
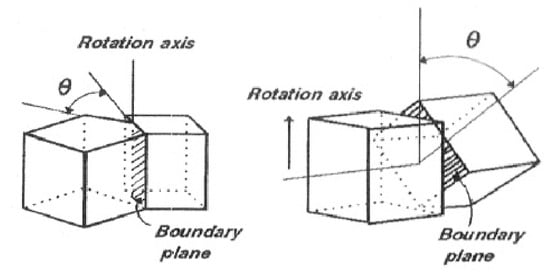
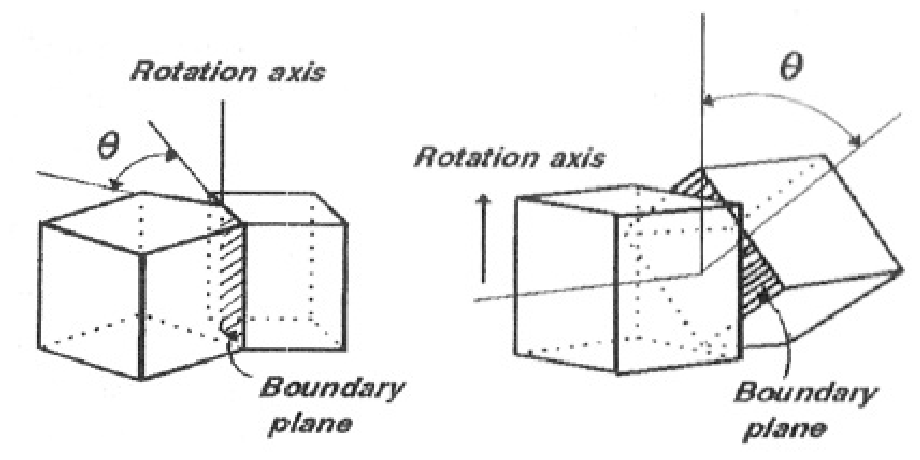
In a single-phase polycrystalline specimen, grains generally have different crystallographic orientations, resulting in various types of grain boundaries. The properties of a given grain boundary depend on the crystallographic misorientation between adjacent grains and on the orientation of the boundary plane. The crystal lattices of two neighboring grains can be brought into coincidence by rotating one grain through an appropriate angle about a single axis. In general, however, the rotation axis does not necessarily correspond to a simple direction relative to either the grains or the boundary plane. As illustrated in Figure 3, grain boundaries may be described in terms of pure tilt and pure twist components. A tilt boundary is formed when the rotation axis is parallel to the grain boundary plane, whereas a twist boundary is formed when the rotation axis is perpendicular to the boundary plane [22].
Figure 3.
Concept of misorientation angle [22].
When the misorientation between two grains is small, the grain boundary can be regarded as an array of dislocations. In general, grain boundaries have mixed tilt-and-twist character and contain different combinations of edge and screw dislocations. The energy of a low-angle boundary corresponds to the total dislocation energy per unit boundary area and depends on the spacing between dislocations. For a simple dislocation arrangement, it can be expressed as follows [22].
D = b/sinθ
τ ∝ θ
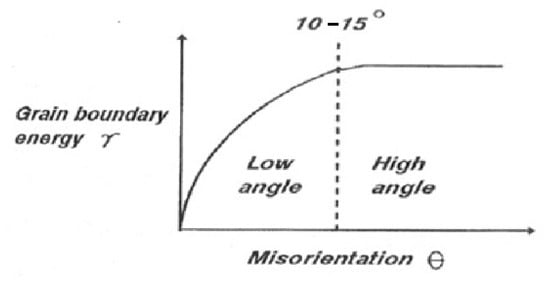
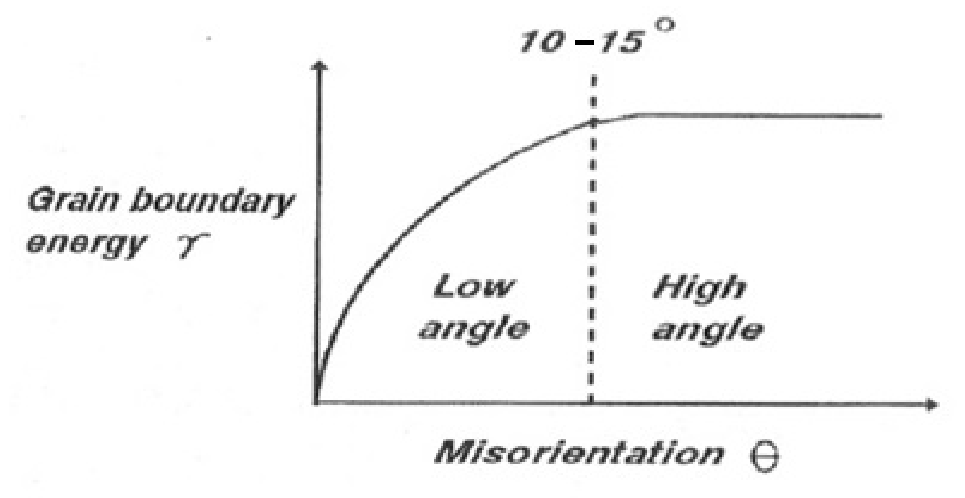
In this equation, b is the Burgers vector of the dislocation and θ is the misorientation angle between the two crystals. When θ is very small, the spacing between dislocations is large, and the grain boundary energy (γ) is approximately proportional to the dislocation density, 1/D, within the boundary. As θ increases, the strain fields surrounding individual dislocations increasingly overlap, and the rate of increase in γ gradually decreases, as shown in Figure 4. When θ generally exceeds approximately 10–15°, the dislocation spacing becomes so small that the dislocation cores overlap, making it physically impossible to distinguish individual dislocations. At this stage, the grain boundary energy becomes nearly independent of the misorientation angle. Grain boundaries with θ greater than approximately 10–15° are referred to as high-angle grain boundaries [22].
Figure 4.
Misorientation low & high angle [22].
4. Review of Experimental Methods for Generating Arc Bead
A primary arc bead is an arc bead associated with fire initiation and is therefore understood to form while ignition of a material occurs because of an electrical arc. This definition also implies that the flame does not self-extinguish after ignition but develops into a sustained fire. Even when a short circuit arc momentarily ignites a combustible material, combustion will cease unless a self-sustaining chain reaction occurs, leaving only a carbonized mark on the material. Fire development requires the generation of a flame through the three fundamental elements of combustion—an ignition source, fuel, and oxygen—and conditions that allow the combustible material to sustain a chain reaction [23].
Most previous studies generated primary arc beads by simply short circuiting conductors at room temperature. This method implicitly assumed that a combustible material would ignite either directly from the arc or from molten conductor particles ejected by the arc and that the ignition would subsequently develop into a fire. However, if the combustible material is not ignited by the arc or ejected particles, or if sustained fire development is unlikely after ignition, the method used to generate primary arc beads should be reconsidered.
Ignition and subsequent fire development are more likely when a short circuit arc occurs after continuous heating and changes in material properties have already been caused by phenomena such as poor electrical connections, electrical tracking, or sustained series arcing due to poor contact. Under such conditions, the conductor temperature at the time of the short circuit would be elevated rather than remaining at room temperature.
Gray and Lee conducted experiments that considered changes in material properties. Gray induced a short circuit by applying overcurrent until the conductor insulation melted. Under these conditions, the conductor temperature would have been higher than its normal operating temperature. However, when an appropriate overcurrent protective device, such as a circuit breaker, is installed in the circuit, the power supply may be interrupted before significant degradation of the insulation occurs, thereby preventing fire development [14]. In contrast, Lee carbonized the insulation and induced a short circuit through the resulting carbonized conductive path [18]. Although the carbonization method was not described in detail, UL 1699, the standard for arc fault circuit interrupters used in residential installations, includes a parallel arcing test involving a carbonized conductive path [24].
Except for the studies by Gray and Lee, most arc bead specimens were generated under conditions that inevitably produced substantial differences between primary and secondary arc beads because of the large differences in the conductor temperature and cooling rate at the time of arcing. Consequently, the related studies did not achieve sufficient reliability for practical acceptance [3]. In Lee’s study, the difference in conductor temperature at the time of short circuiting was likely reduced; however, carbon structure analysis using Raman spectroscopy, rather than cross-sectional microstructural analysis, was applied for differentiation [18]. Overall, most previous studies appear to have used specimen generation methods that were inconsistent with the definition of a primary arc bead. Conversely, when a more appropriate specimen generation method was used, the resulting specimens were not evaluated using cross-sectional microstructural analysis focused on differences in the cooling rate.
In the present study, the first experiment reproduced the room-temperature short circuit method used in most previous studies to generate primary arc beads, while simultaneously evaluating whether the resulting arc could ignite nearby combustible materials. The second experiment employed a newly proposed method in which a short circuit was induced after the conductor temperature had increased because of a poor electrical connection. The specimens produced in the two experiments were sectioned, their cross-sectional microstructures were analyzed by SEM–EBSD, and their misorientation distributions were quantitatively compared. By comparing the misorientation distributions of arc beads generated using the two methods, this study aimed to demonstrate the limitations in the representativeness of conventional primary arc bead specimens.
5. Combustible Materials Ignition Test
5.1. Experimental Method
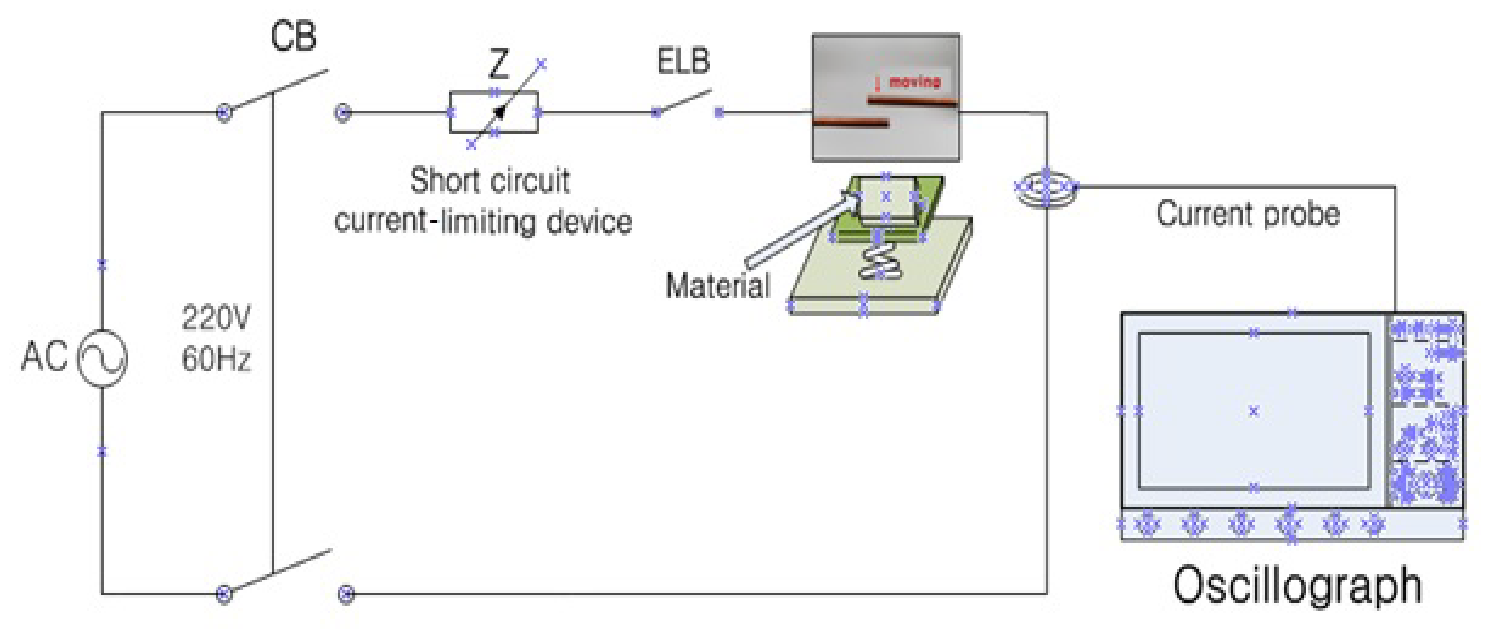
A short circuit was produced between bare conductors at room temperature on the load side of a circuit breaker connected to the commercial power supply. Combustible materials were placed below the short circuit point, and whether they were ignited by the resulting arc was observed. The short circuit current was limited to 1 kA using a short circuit current-limiting device. J. Y. Park previously conducted experiments in which the short circuit current was limited to 500 A in accordance with UL 1699 to preserve the arc bead morphology [24]. Because the present experiment focused on whether combustible materials could be ignited by the short circuit arc while maintaining the arc bead morphology, a short circuit current of 1 kA, twice the value used in that study, was selected.
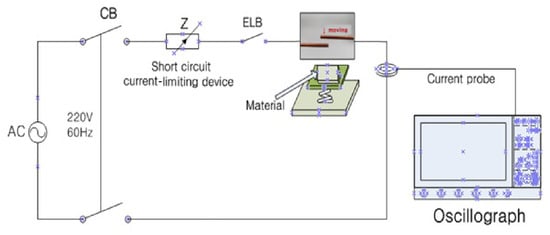
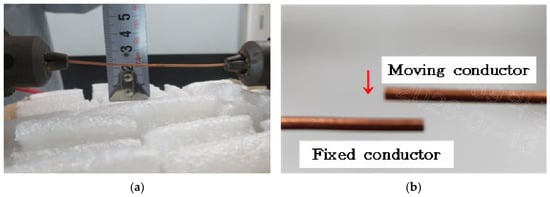
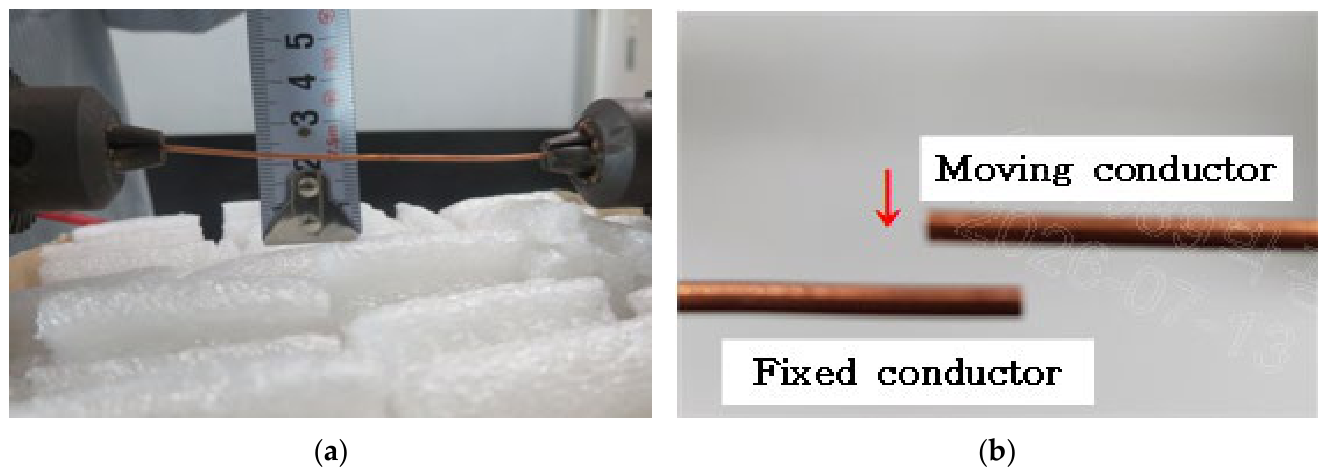
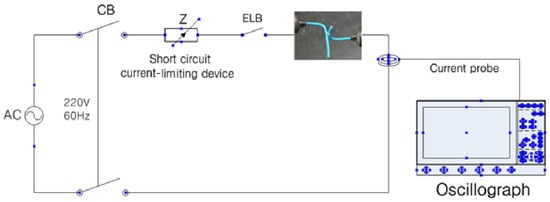
Figure 5 shows a schematic of the short circuit test setup, and Figure 6 shows the conductor contact condition during short circuiting and the distance between the short circuit point and the combustible material. The supply voltage was 220 V, the conductor cross-sectional area was 2.5 mm2, the ambient temperature was 27 °C, and the distance between the short circuit point and the combustible material was approximately 2 cm. Figure 6a shows the distance between the short circuit point and the combustible material. Figure 6b shows the short circuiting method and contact condition. The conductors were connected to an energized test apparatus; one conductor was fixed, while the other was moved using a knob on the apparatus. The magnitude of the short circuit current was measured using an oscilloscope. The combustible materials tested comprised five types: a tablecloth composed primarily of wool, expanded polystyrene foam, polyethylene air cushion packaging film, a cellulose-based industrial paper wiper, and cotton fiber. Five tests were performed for each material.
Figure 5.
(Conductor temperature—RT) Schematic of short circuit and ignition test 1.
Figure 6.
Short circuit and ignition test: (a) distance between the short circuit point and the combustible material; (b) wire movement & short circuit point.
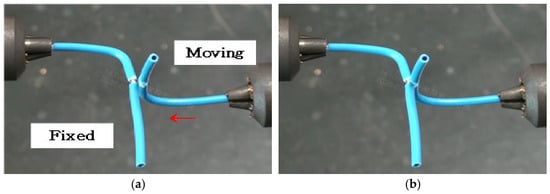
The conductor insulation was also evaluated as an additional combustible material. Figure 7 shows a schematic of the short circuit test setup. Unlike the preceding tests, this experiment examined whether insulation attached to the conductor could be ignited by the high temperature of a momentary arc. The conductor insulation was made of PVC, which begins to undergo thermal decomposition at approximately 200–300 °C and may ignite near 300 °C [25]. As shown in Figure 8, a small portion of the insulation was removed; one conductor was fixed, and the other was moved toward it to produce the short circuit.
Figure 7.
(Conductor temperature—RT) Schematic of short circuit and ignition test 2.
Figure 8.
Short circuit and ignition test: (a) wire movement; (b) before short circuit.
5.2. Experimental Results
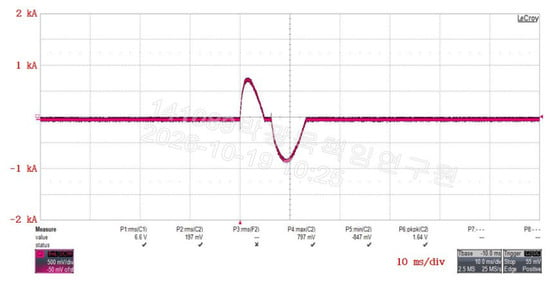
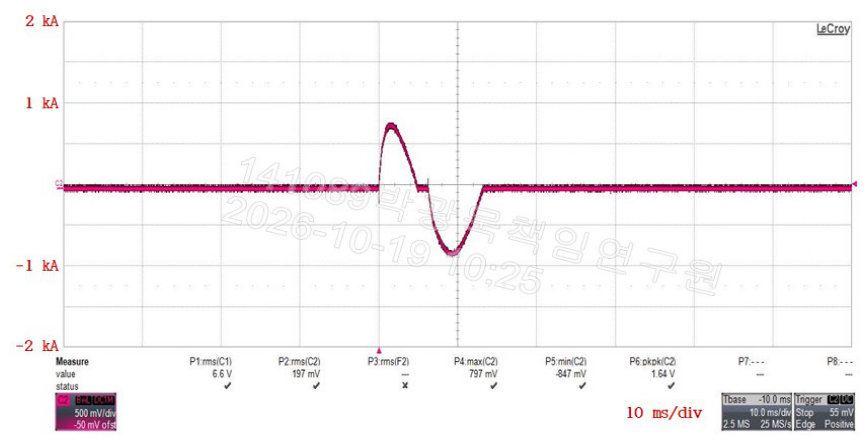
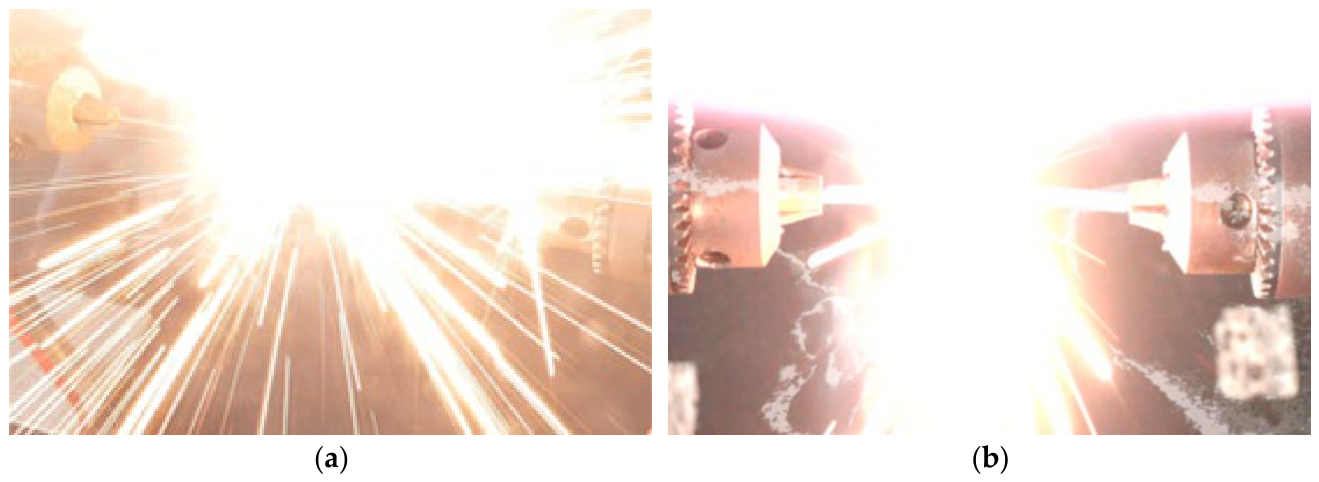
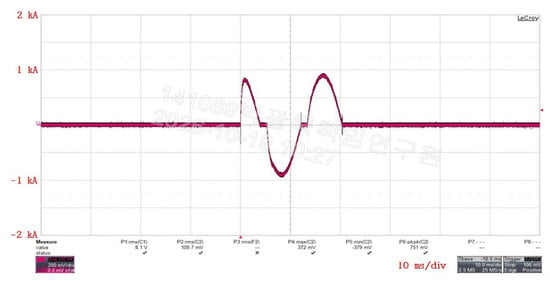
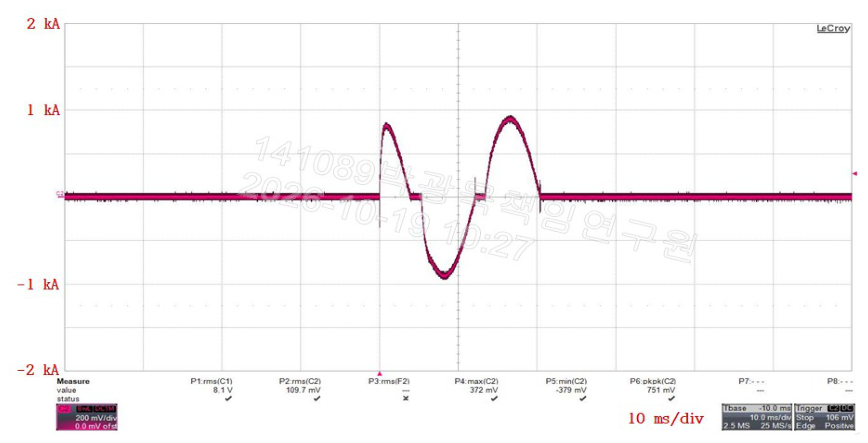
Figure 9 shows the short circuit current waveform. Figure 10 shows the arc generated during the short circuit and its effect on the combustible material located below the short circuit point. The maximum short circuit current was approximately 1 kA, and the mean duration was 13.23 ms.
Figure 9.
Maximum short circuit current.
Figure 10.
Arc generation: (a) top view; (b) side view.
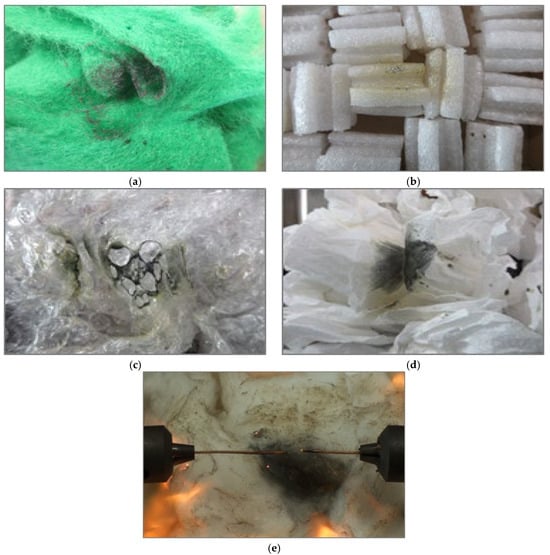
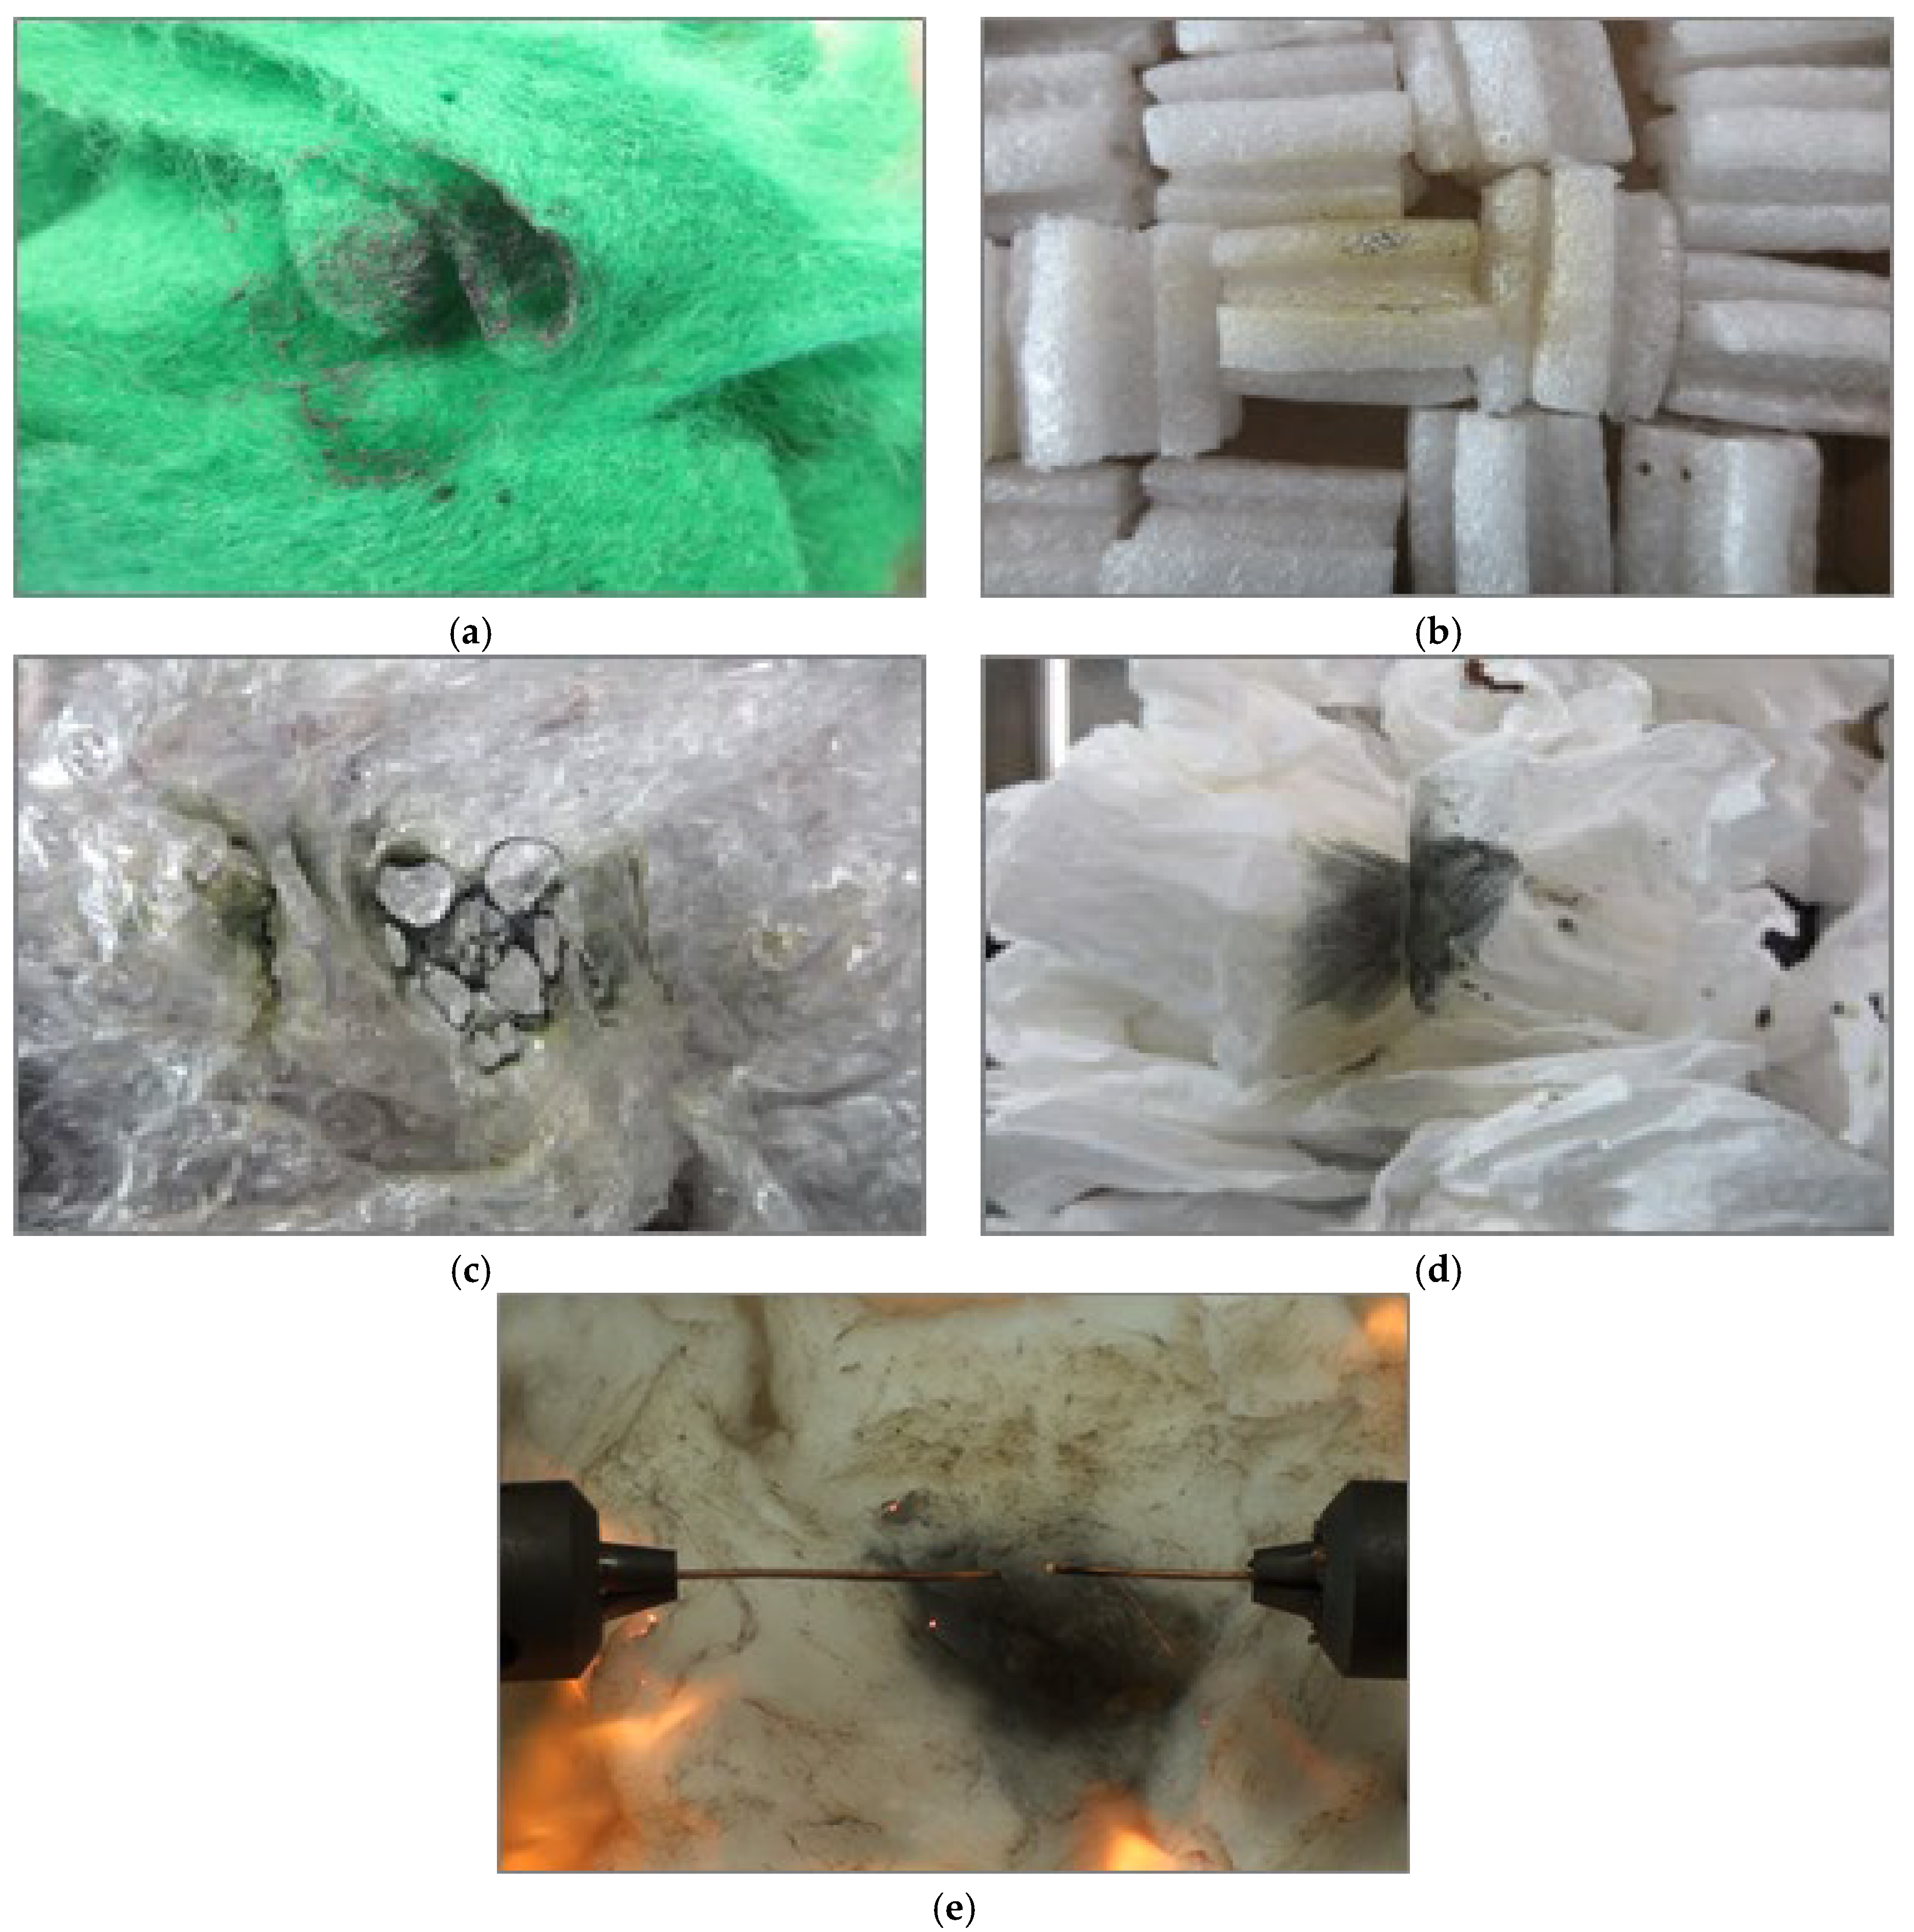
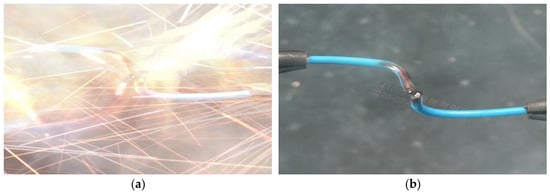
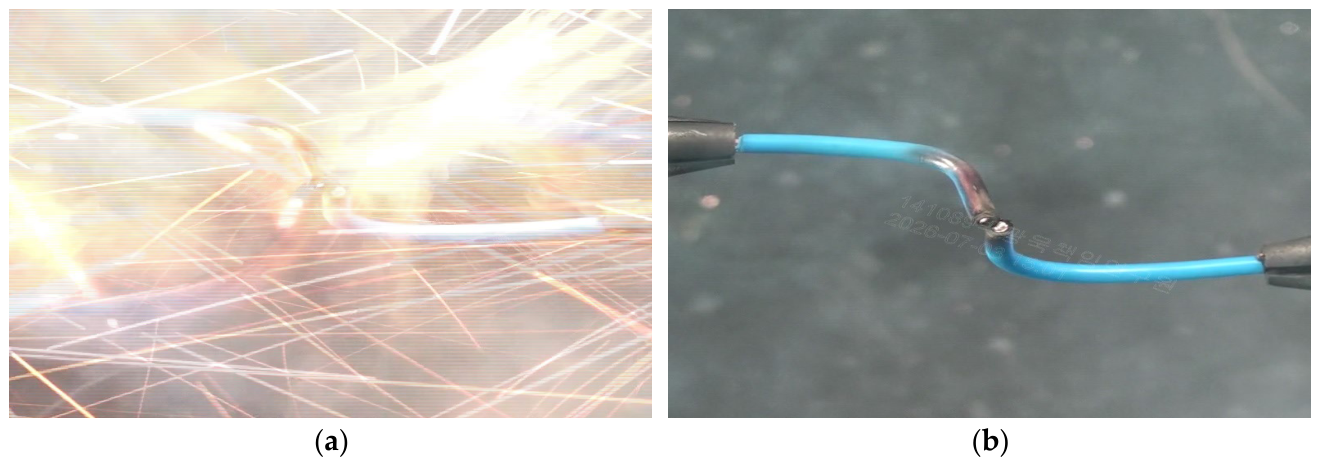
Among the five combustible materials, only cotton was ignited by the arc. Cotton is readily ignitable because of factors such as its low minimum ignition energy and large specific surface area, which facilitate heat accumulation. The tablecloth, expanded polystyrene foam, air cushion packaging film, and industrial paper wipes exhibited partial carbonization, and melting was observed on the air cushion packaging film. Figure 11 shows the post-test condition of the combustible materials. In the conductor insulation ignition test, the insulation was not ignited; only surface carbonization occurred. The conductors were severed by the short circuit. Figure 12 shows the arc generated during the short circuit and the carbonized surface of the conductor insulation.
Figure 11.
(Combustible materials) Experimental results: (a) tablecloth; (b) expanded polystyrene foam; (c) air cushion packaging film; (d) industrial paper wipes; (e) cotton.
Figure 12.
(Conductor insulation) Ignition experimental results: (a) arc generation; (b) conductor insulation condition.
6. Generation of Arc Beads Accompanied by Ignition
6.1. Experimental Method
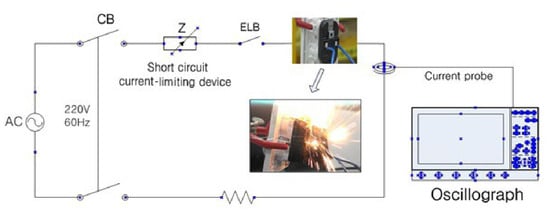
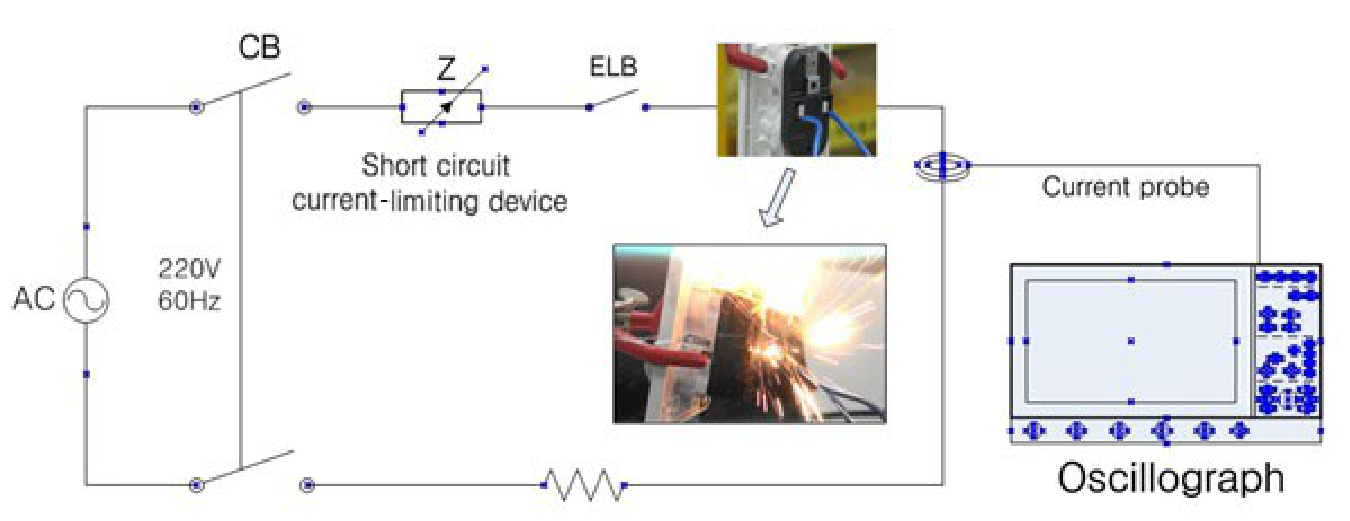
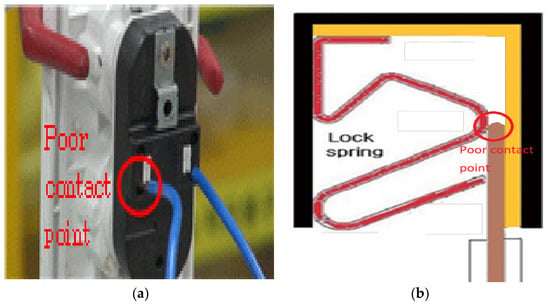
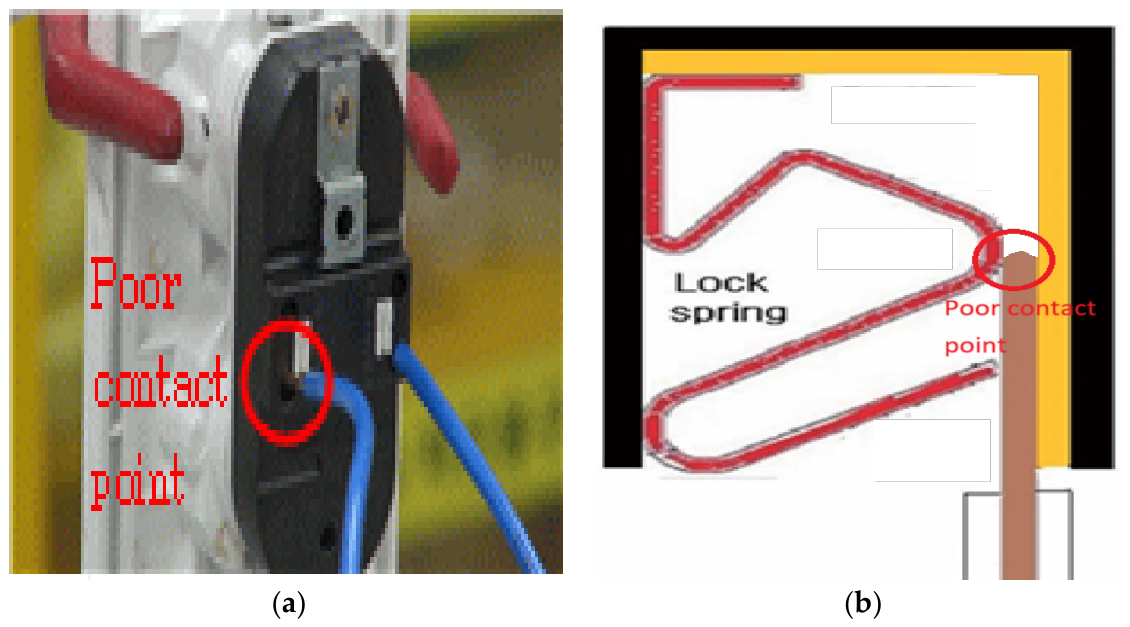
In the second experiment, the same basic conditions as those of the first experiment were used: a 220 V supply, 2.5 mm2 conductors, an ambient temperature of 27 °C, and a short circuit current limited to 1 kA. A load current of 15 A was maintained before the short circuit. A poor connection was then introduced at one conductor connected to a wall-mounted receptacle to increase the conductor temperature. After the insulation had deformed and reached a condition favorable for ignition, the heated conductor was intentionally short circuited with a conductor of the opposite polarity. The temperature at the connection point was measured using an infrared thermal imaging camera. Five tests were performed, each using a different conductor temperature at the time of short circuiting. Figure 13 shows a schematic of the short circuit test setup, and Figure 14 shows the conductor connection and poor contact condition at the wall receptacle.
Figure 13.
(Conductor temperature—high) Schematic of short circuit.
Figure 14.
Poor contact test: (a) exterior of wall receptacle; (b) internal of the wall receptacle.
6.2. Experimental Results
Figure 15 shows the short circuit current waveform. The maximum short circuit current was approximately 1 kA, and the mean duration was 18.28 ms. The arc duration was only 5.05 ms longer than that in the first experiment. Owing to a high short circuit current, the conductors were severed in both experiments, which may have resulted in a relatively short arc duration.
Figure 15.
Maximum short circuit current.
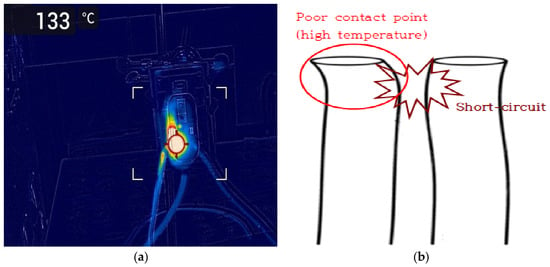
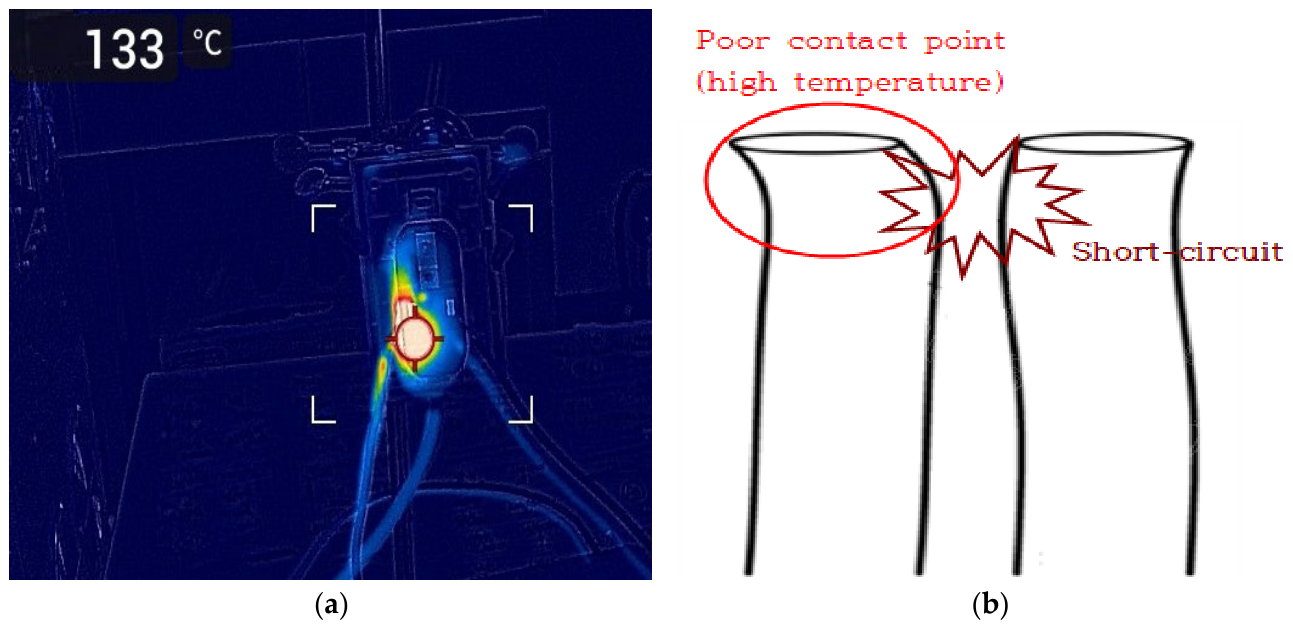
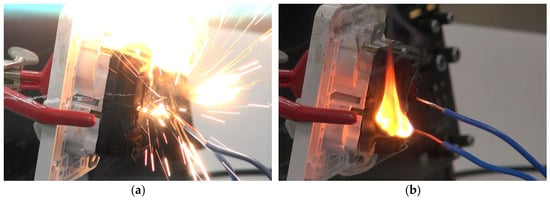
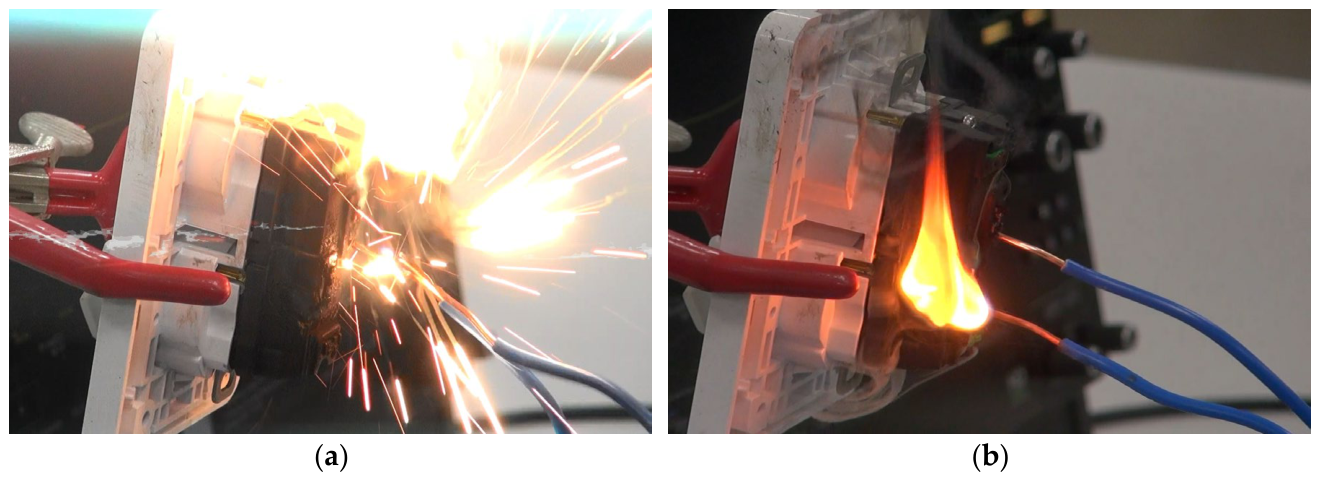
Figure 16a shows the elevated conductor temperatures before the short circuit caused by the poor electrical connection, and Figure 16b shows the short circuit situation. Figure 17 shows the arc generated during the short circuit and ignition of the insulating material by the arc. The conductor temperatures before short circuiting in the five tests were 133, 165, 294, 360, and 520 °C. Once the conductor temperature exceeded approximately 100 °C, rapid temperature escalation was observed, which was likely accompanied by increased contact resistance and heating associated with cuprous oxide growth.
Figure 16.
Conductor temperatures and short circuit situation: (a) conductor temperatures before short circuit; (b) short circuit between the heated conductor and opposite conductor.
Figure 17.
Arc generation by short circuit & ignition of the insulating material: (a) arc generation; (b) ignition.
7. Comparison of Misorientation and Statistical Analysis
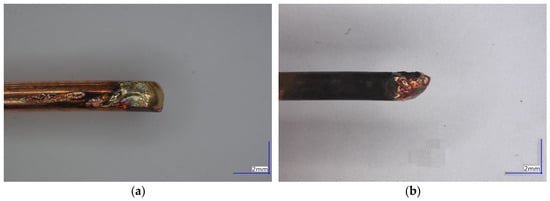
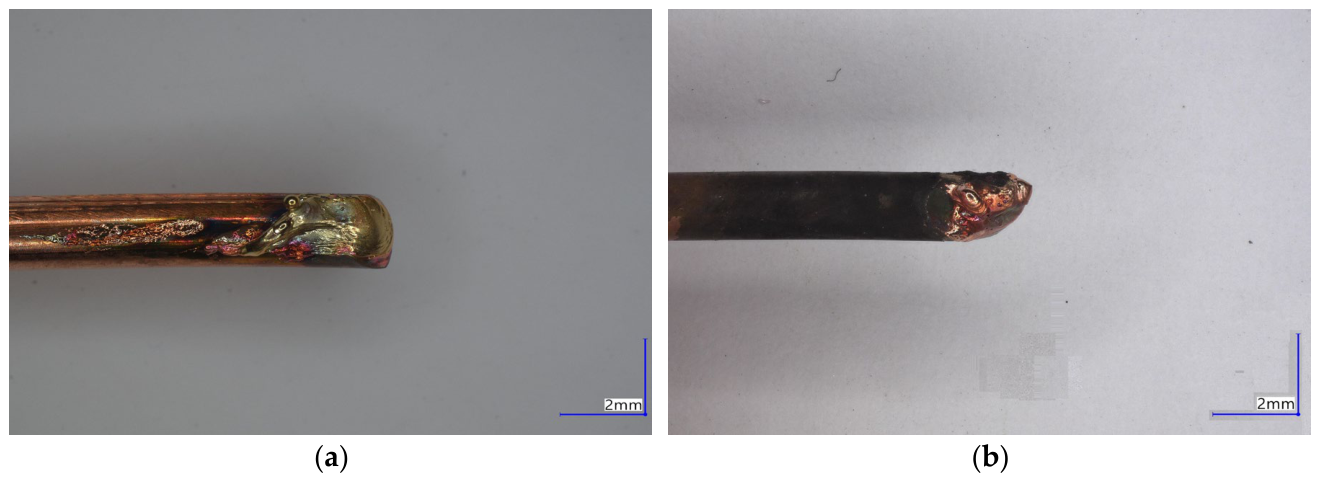
Figure 18 presents photographs of the arc beads generated in the first and second experiments. Although the size and morphology of the melted regions varied among specimens in both experiments, the surfaces of the arc beads generated in the first experiment were generally smoother. In addition, the surfaces of the arc beads generated in the second experiment exhibited more pronounced carbonization than those produced in the first experiment. The arc beads generated in the second experiment more closely resembled those commonly identified at actual fire scenes.
Figure 18.
Appearance of arc beads: (a) arc beads of the first experiment; (b) arc beads of the second experiment.
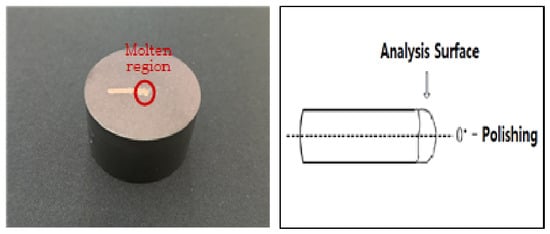
Five arc beads generated by room-temperature short circuits in the first experiment and five arc beads generated by short circuiting heated conductors in the second experiment were sectioned and mounted, after which their surfaces were prepared by mechanical polishing. During mounting, the molten region was positioned as close as possible to the center of each specimen. To prevent charging by the nonconductive mounting resin during EBSD measurements after preparation, the specimens were hot-mounted using ConduFast, a conductive acrylic hot-mounting resin containing iron powder (Struers). Mechanical polishing was performed using Tegramin-25 (Struers, Ballerup, Denmark) automatic polisher, polishing cloths, and abrasives according to the copper polishing procedure provided by Struers, with a controlled specimen load, rotational speed, rotational direction, and polishing time. The detailed mechanical polishing conditions are presented in Table 2. Figure 19 shows the specimens after completion of the preparation process.
Table 2.
Procedure of mechanical polishing.
Figure 19.
Bead mounting & polishing method.
EBSD analysis was performed after specimen preparation. GEMINI 460 (ZEISS, Oberkochen, Germany) FE-SEM and VELOCITY SUPER (EDAX, Pleasanton, CA, USA) EBSD were used. The FE-SEM accelerating voltage was set to 15 kV, the EBSD scan mode used a hexagonal grid, and the step size was 4 μm. The indexing rate of the EBSD data was 40–50%, and no separate cleanup procedure was applied during data processing. Grain reconstruction was performed using OIM Analysis software (EDAX, USA); the grain tolerance angle was set to 5, and the minimum grain size was set to 2. Accordingly, adjacent measurement points were classified as different grains when the crystallographic misorientation exceeded the specified criterion. Twin boundaries were not separately excluded or treated, but were processed using the same misorientation-based grain grouping conditions.
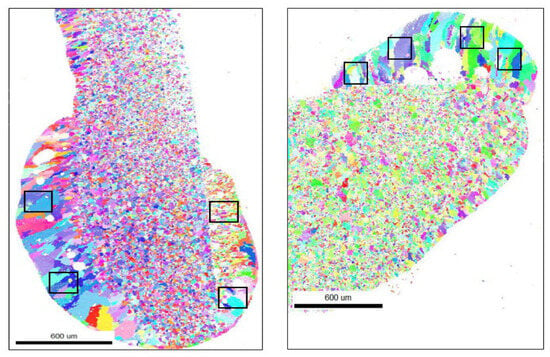
To ensure consistency among specimens, misorientation was measured in four rectangular cropped regions of equal area for each specimen, yielding a total of 20 datasets per experiment. Figure 20 shows the overall cross-sectional microstructure observed by EBSD and the locations of the rectangular regions in which misorientation was measured. The locations and size of the measured rectangular regions (150 μm × 150 μm) were selected to exclude void regions as much as possible.
Figure 20.
EBSD analysis region (black rectangular regions).
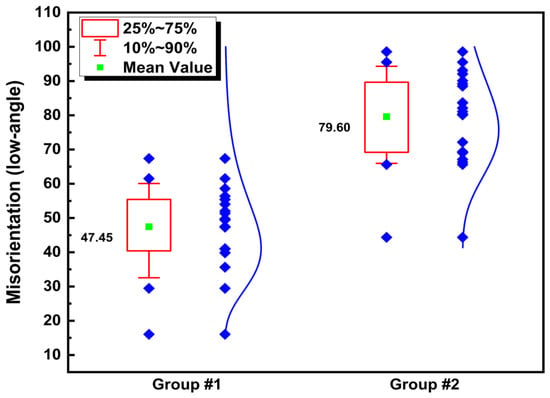
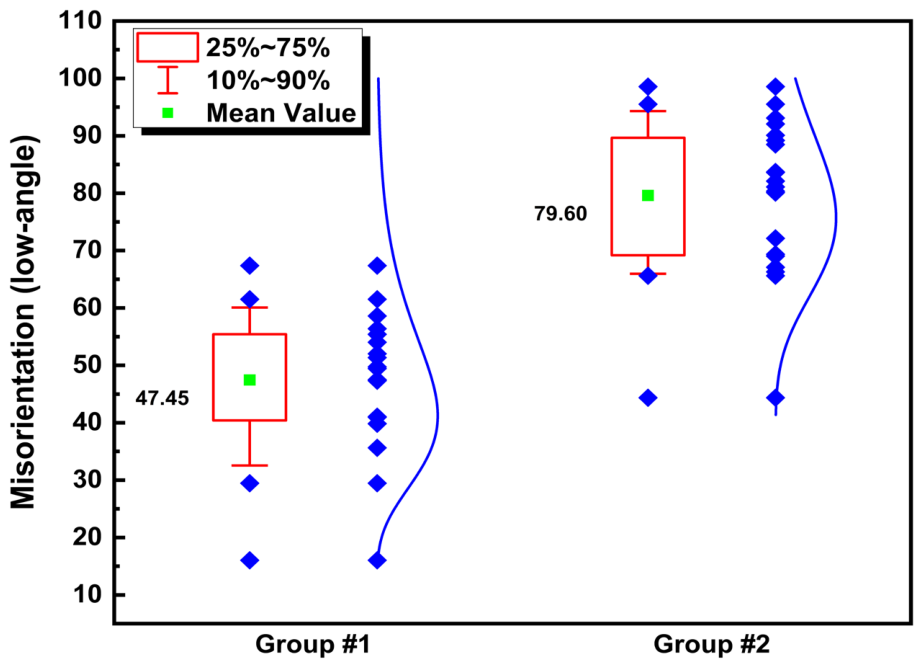
Table 3 and Table 4 present the misorientation data. The mean low-angle fractions for the individual specimens in Experiment 1 were 43.81%, 40.54%, 44.72%, 49.99%, and 58.20%, with an overall mean of 47.45%. The corresponding values for Experiment 2 were 65.61%, 75.70%, 83.76%, 80.65%, and 92.48%, with an overall mean of 79.60%. Although the distributions of the two groups partially overlapped, the mean value for every specimen in the second experiment was higher than that of the specimens in the first experiment, and the overall difference between the experiments averaged 32.15 percentage points. Figure 21 graphically compares the misorientation fractions.
Table 3.
Experiment 1 (RT short circuit), misorientation (low-angle) data.
Table 4.
Experiment 2 (HT short circuit), misorientation (low-angle) data.
Figure 21.
Misorientation comparison.
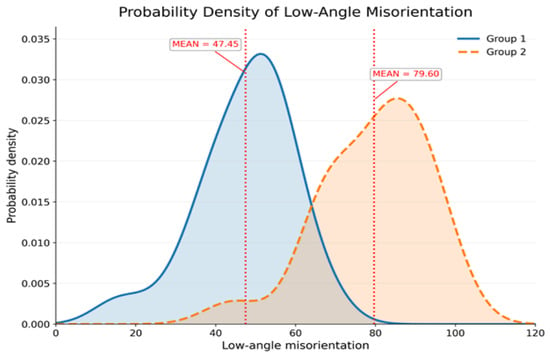
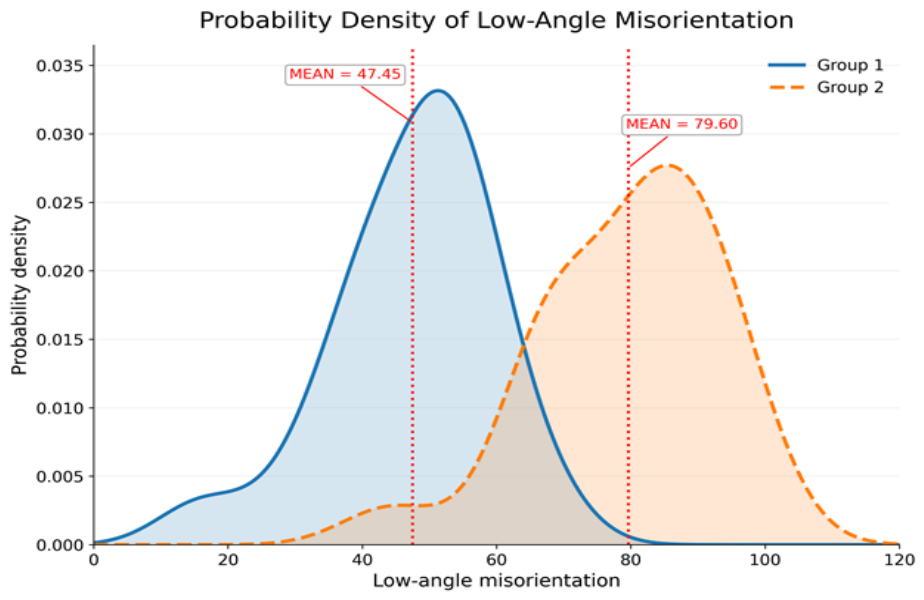
Figure 22 provides an intuitive comparison of the misorientation distributions of the two groups. Although some overlap was present, the centers and major density regions of the two distributions were clearly different. A t-test showed that the difference between the two groups was statistically significant (t(37.55) = 8.104, p < 0.001), with a standardized mean difference of 2.51. Table 5 presents the statistical analysis of misorientation.
Figure 22.
Probability density of misorientation.
Table 5.
Statistical analysis of misorientation.
8. Conclusions
This study reviewed trends in previous research on melted mark discrimination and critically examined the experimental methods used to generate primary arc bead specimens. In previous studies to date, researchers have generally regarded arc beads generated by simple short circuits at room temperature as primary arc beads. However, by definition, a primary arc bead should be associated with a short circuit that initiates a fire. From the perspective of this definition, the short circuit should lead from ignition to a self-sustaining chain reaction and ultimately to fire development; at a minimum, ignition of a combustible material should accompany the short circuit.
The first combustible material ignition experiment was conducted using five materials—a tablecloth, expanded polystyrene foam, air cushion packaging film, an industrial paper wiper, and cotton—and an additional test was performed using conductor insulation. Among these materials, only cotton, which requires relatively little energy for ignition, was ignited by the arc. This result indicates that a momentary arc produced by a simple short circuit is generally insufficient to ignite combustible materials and develop into a sustained fire. The second experiment was designed to demonstrate a condition in which ignition accompanies a short circuit. A poor electrical connection was introduced so that thermal deformation of a combustible insulating material occurred first, thereby weakening the material through heating and making ignition by the subsequent short circuit arc more likely. Excluding materials such as cotton or cosmetic tissue that can ignite with very little energy when struck by ejected molten particles, the materials most likely to be ignited by a short circuit arc and contribute to fire development are conductor insulation and the insulating components of circuit breakers and receptacles. These materials are generally polyethylene or similar polymers and may have ignition temperatures around 300 °C, but they are difficult to ignite through momentary thermal exposure alone. These two experiments were intended to test the validity of the room-temperature short circuit method used in previous studies from the standpoint of the definition of a primary arc bead. The results raise questions as to whether specimens generated by simple short circuits at room temperature in previous studies can be considered representative of primary arc beads.
The cross-sectional microstructures of the arc beads generated in the two experiments were analyzed by EBSD, and misorientation was measured. The purpose was to determine whether differences attributable to undercooling could be identified by comparing the misorientation of arc beads generated by short circuiting conductors at room temperature, as in previous studies, with those generated after the conductor temperature had increased because of a poor electrical connection. Although the distributions of the two groups partially overlapped, the mean value for every specimen in the second experiment was higher than that of the specimens in the first experiment, and the overall difference between the experiments averaged 32.15 percentage points. A t-test showed that the difference between the two groups was statistically significant (t(37.55) = 8.104, p < 0.001), with a standardized mean difference of 2.
For reliable discrimination between primary and secondary arc beads, quantitative analysis and the development of data-driven discrimination models are important. However, the representativeness and validity of the specimens used for analysis must first be ensured. Therefore, the experimental method used to generate primary arc beads needs to be re-established. Future work will review standardized methods and develop experimental equipment for generating representative primary arc beads based on test standards such as IEC 62606 and UL 1699. Specimens and EBSD data will then be obtained using the developed experimental equipment, their reliability will be evaluated, and an arc bead discrimination model will be developed.
Author Contributions
Conceptualization, K.P. and J.J.; methodology, K.P.; validation, K.P.; investigation, K.P., J.-H.K., C.C. and D.B.; data curation, K.P. and D.B.; writing—original draft preparation, K.P.; writing—review and editing, K.P.; supervision, J.J.; project administration, K.P.; funding acquisition, K.P. and J.J. All authors have read and agreed to the published version of the manuscript.
Funding
This research was funded by the National Fire Agency of the Republic of Korea (grant number RS-2025-03372990).
Data Availability Statement
This data related to this work can be obtained from the corresponding author upon reasonable request.
Conflicts of Interest
The authors declare no conflict of interest.
References
- Liu, K.-H.; Shih, Y.-H.; Chen, G.-J.; Chou, J.-M. Microstructural study on molten marks of fire-causing copper wires. Materials 2015, 8, 3776–3790. [Google Scholar] [CrossRef] [Scilit]
- Wright, S.A.; Loud, J.D.; Blanchard, R.A. Globules and beads: What do they indicate about small-diameter copper conductors that have been through a fire? Fire Technol. 2015, 51, 1051–1070. [Google Scholar] [CrossRef] [Scilit]
- Babrauskas, V. Arc beads from fires: Can “cause” beads be distinguished from “victim” beads by physical or chemical testing? J. Fire Prot. Eng. 2004, 14, 125–147. [Google Scholar] [CrossRef] [Scilit]
- Takaki, A. On the effect of thermal histories upon the metallographic structure of electric wires. Rep. Natl. Res. Inst. Police Sci. 1971, 24, 48–56. [Google Scholar]
- Park, J.-Y.; Kang, J.-H.; Lee, E.-P.; Ko, Y.-H.; Bang, S.-B. New approach to distinguish copper molten marks based on quantitative microstructure analysis using electron backscatter diffraction. Fire Technol. 2021, 57, 1667–1682. [Google Scholar] [CrossRef] [Scilit]
- Roby, R.J.; McAllister, J. Forensic Investigation Techniques for Inspecting Electrical Conductors Involved in Fire; National Institute of Justice, U.S. Department of Justice: Washington, DC, USA, 2012. [Google Scholar]
- Lee, E.-P.; Ohtani, H.; Matsubara, Y.; Seki, T.; Hasegawa, H.; Imada, S. Study on primary and secondary molten marks. In Proceedings of the 1st Conference of the Association of Korean-Japanese Safety Engineering Society; Korean Institute for Industrial Safety: Goyang, Republic of Korea, 1999; pp. 209–212. [Google Scholar]
- Kim, T.-H.; Kim, E.-B.; Hwang, E. Swin transformer-based molten mark classification scheme for accurate electrical fire cause identification. Fire Sci. Eng. 2026, 40, 59–66. [Google Scholar] [CrossRef] [Scilit]
- Tokyo Fire Department, Investigation Section. Research on first and second fused mark discrimination of electric wires. J. Jpn. Assoc. Fire Sci. Eng. 1992, 42, 15–20. [Google Scholar]
- National Fire Agency; Korea Central Firefighting Academy. Fire Investigation Practice; Korea Central Firefighting Academy: Gongju, Republic of Korea, 2023. [Google Scholar]
- National Fire Protection Association. NFPA 921: Guide for Fire and Explosion Investigations, 2024th ed.; National Fire Protection Association: Quincy, MA, USA, 2024. [Google Scholar]
- Park, K.-M.; Bang, S.-B.; Yang, S.-C. The orientation comparison of the primary and secondary beads grain by EBSD. J. Korean Inst. Electr. Electron. Mater. Eng. 2017, 30, 728–733. [Google Scholar] [CrossRef] [Scilit]
- Humphreys, F.J. Review grain and subgrain characterisation by electron backscatter diffraction. J. Mater. Sci. 2001, 36, 3833–3854. [Google Scholar] [CrossRef] [Scilit]
- Gray, D.A.; Drysdale, D.D.; Lewis, F.A.S. Identification of electrical sources of ignition in fires. Fire Saf. J. 1983, 6, 147–150. [Google Scholar] [CrossRef] [Scilit]
- Erlandsson, R.; Strand, G. An investigation of physical characteristics indicating primary or secondary electrical damage. Fire Saf. J. 1985, 8, 97–103. [Google Scholar] [CrossRef] [Scilit]
- Mitsuhashi, N. Discrimination between primary and secondary arc marks on electric wires by microvoid distribution. Rep. Natl. Res. Inst. Police Sci. 1995, 48, 20–26. [Google Scholar]
- Satoh, K.; Sugisaki, M.; Kakizaki, S.; Itoh, C.; Saitoh, K.; Iwaki, M. Secondary ion mass spectroscopy (SIMS) and auger electron spectroscopy (AES) applied to the fire investigation for short circuit. In Proceedings of the 1996 Annual Meeting of the Japan Association for Fire Science and Engineering, Yokohama, Japan, 22–23 May 1996; pp. 282–285. [Google Scholar]
- Lee, E.-P.; Ohtani, H.; Seki, T.; Hasegawa, H.; Imada, S.; Yashiro, I. Discrimination between primary and secondary molten marks on electric wires by DAS. J. Appl. Fire Sci. 2000, 9, 361–379. [Google Scholar] [CrossRef] [Scilit]
- Park, J.; Kang, J.-H.; Jang, H.-S.; Ko, Y.-H.; Bang, S.-B. Potential method to distinguish copper molten marks using boundary and grain characteristics. Materials 2022, 15, 4534. [Google Scholar] [CrossRef] [Scilit]
- Hong, S.; Bang, S.-B.; Bang, J.-H.; Park, J.; Min, K.-D.; Lee, J.-S. Analysis of visual characteristics of short circuited arc sites. Fire Technol. 2023, 59, 559–580. [Google Scholar] [CrossRef] [Scilit]
- Su, Z.; Zhu, Z.; Zhang, Y.; Zhang, H.; Xiao, Q. Recrystallization behavior of a pure Cu connection interface with ultrasonic welding. Metals 2021, 11, 61. [Google Scholar] [CrossRef] [Scilit]
- Porter, D.A.; Easterling, K.E.; Sherif, M.Y. Phase Transformations in Metals and Alloys, 4th ed.; CRC Press: Boca Raton, FL, USA, 2021. [Google Scholar]
- Lazar, S.T.; Kolibaba, T.J.; Grunlan, J.C. Flame-retardant surface treatments. Nat. Rev. Mater. 2020, 5, 259–275. [Google Scholar] [CrossRef] [Scilit]
- Underwriters Laboratories Inc. UL 1699: Standard for Arc-Fault Circuit-Interrupters, 4th ed.; Underwriters Laboratories Inc.: Northbrook, IL, USA, 2025. [Google Scholar]
- Yang, S.; Wang, Y.; Man, P. Kinetic analysis of thermal decomposition of polyvinyl chloride at various oxygen concentrations. Fire 2023, 6, 404. [Google Scholar] [CrossRef] [Scilit]

Disclaimer/Publisher’s Note: The statements, opinions and data contained in all publications are solely those of the individual author(s) and contributor(s) and not of MDPI and/or the editor(s). MDPI and/or the editor(s) disclaim responsibility for any injury to people or property resulting from any ideas, methods, instructions or products referred to in the content. |
© 2026 by the authors. Licensee MDPI, Basel, Switzerland. This article is an open access article distributed under the terms and conditions of the Creative Commons Attribution (CC BY) license.