


Abstract
In this paper, we study electron to ion root confinement transitions triggered by Electron Cyclotron Resonant Heating switch-off when the line-averaged electron density is sufficiently high and while Neutral Beam Injection heating is on. We use a Heavy Ion Beam Probe system to document the transition in considerable detail. The transition occurs in two phases. An initial, fast phase is characterized by a rapid, global decay of the plasma potential and the concomitant establishment of an edge radial electric field shear layer. This phase is induced by the pump-out effect, as documented using simultaneous measurements of the evolution of the plasma potential at different radial locations. This initial, fast phase is followed by a slow phase during which the profiles adjust to the new edge and heating conditions via transport.
1. Introduction
The electron to ion (e-i) root transition is an important phenomenon in stellarators. It is a transition to improved confinement that involves the establishment of a transport barrier, and therefore it is in the same category of transitions as the L–H (low to high confinement) transition and Internal Transport Barriers (ITBs) [1]. A related transition is also observed in the core region, called the Core Electron Root Confinement (CERC) phenomenon, observed in various stellarators [2].
In the TJ-II stellarator, the electron to ion root transition to enhanced confinement, reported initially in [3], has been studied extensively [4]. Recall that the distinction between electron and ion root depends on the sign of the radial electric field, (positive and negative, respectively) [1]. This transition is characterized by several phenomena in TJ-II. It usually occurs when the rising line-averaged electron density crosses the critical value of m−3 [5]. At the transition, turbulence amplitudes and the turbulence correlation time increase, whereas above the transition point, they decrease [6]. Moreover, long-range correlations between toroidally separated Langmuir probes increase at and above the transition point [7]. In addition, above the transition, the radial electric field, , becomes negative at the plasma edge, a significant shearing rate in the poloidal velocity is established [8], and the edge density gradient increases [9]. The enhanced particle confinement is reflected in a sudden increase of , the growth rate of the line-averaged electron density.
Previous work at TJ-II has clarified that the e-i root transition can be achieved through various means, once the plasma is in an appropriate state. One possibility is by simply raising the line-averaged electron density above the critical value using gas puff [3]. This transition can be forced also by applying a (negative) biasing voltage in the plasma edge [5,10,11]. The transition also occurs frequently at the end of the Electron Cyclotron Resonance Heating (ECRH) phase, when the density is sufficiently high: then the transition may occur after switching off or reducing microwave heating [12,13]. A common aspect of these external actions is that they tend to modify the plasma potential (making it more negative). Thus, the plasma potential profile is a key player in this transition.
The evolution of the potential profile at TJ-II as a function of has been documented in some detail using a Heavy Ion Beam Probe (HIBP) [14]. The potential profile decreases gradually as the electron density increases, and near the critical density it changes sign. Thus, the edge radial electric field also tends to change sign when crosses the critical value. However, one should remember that the transition is more complex than a mere sign change of at the edge, namely, a ‘corrugation’ or shear of in the edge region is important, as shear may produce a transport barrier, changing the confinement quality.
In addition, there is a second parameter that modifies the global plasma potential, namely, the Electron Cyclotron Resonance Heating (ECRH) power. Namely, the plasma potential increases with ECRH power at constant [15]. Consequently, as ECRH power is switched off, the overall plasma potential becomes more negative. When is sufficiently high (i.e., near but still below ), the plasma potential is positive and small, and the additional drop in potential induced by switching off ECRH may then push the plasma into the ion root state. This effect is regularly observed in TJ-II discharges [12]. This paper focuses on the transition caused by ECRH switch-off.
In view of the above, documenting the evolution of the plasma potential at the transition seems essential to reach a full understanding of this phenomenon. The Heavy Ion Beam Probe is a very relevant diagnostic for this purpose, as shown in other devices, e.g., the LHD stellarator [16] and the CHS stellarator [17]. TJ-II possesses a dual HIBP system [14] that allows tracking the time evolution of the plasma potential simultaneously at two radial locations, which can be placed upon demand at almost any radial location, as well as Langmuir probe systems in the plasma edge. To obtain insight into the potential evolution across the plasma volume, in the present study we will analyze similar e-i root transition events in a large set of experiments, with measurements made at different locations.
2. Methods
The experiments reported here are performed at the TJ-II stellarator [18], with toroidal magnetic field T, major radius m and minor radius m.
2.1. Experiments
The magnetic configuration in vacuum that was used is the one labeled 100_44_64, often referred to as the ‘standard configuration’, which has a rotational transform of at the Last Closed Flux Surface (LCFS). Typically, plasma currents are small in TJ-II.
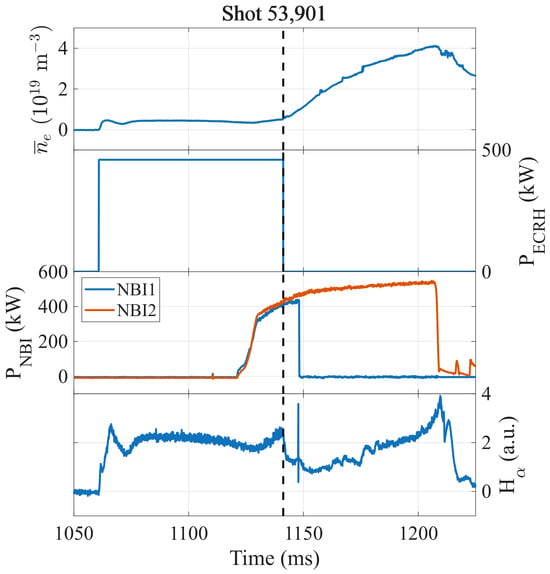
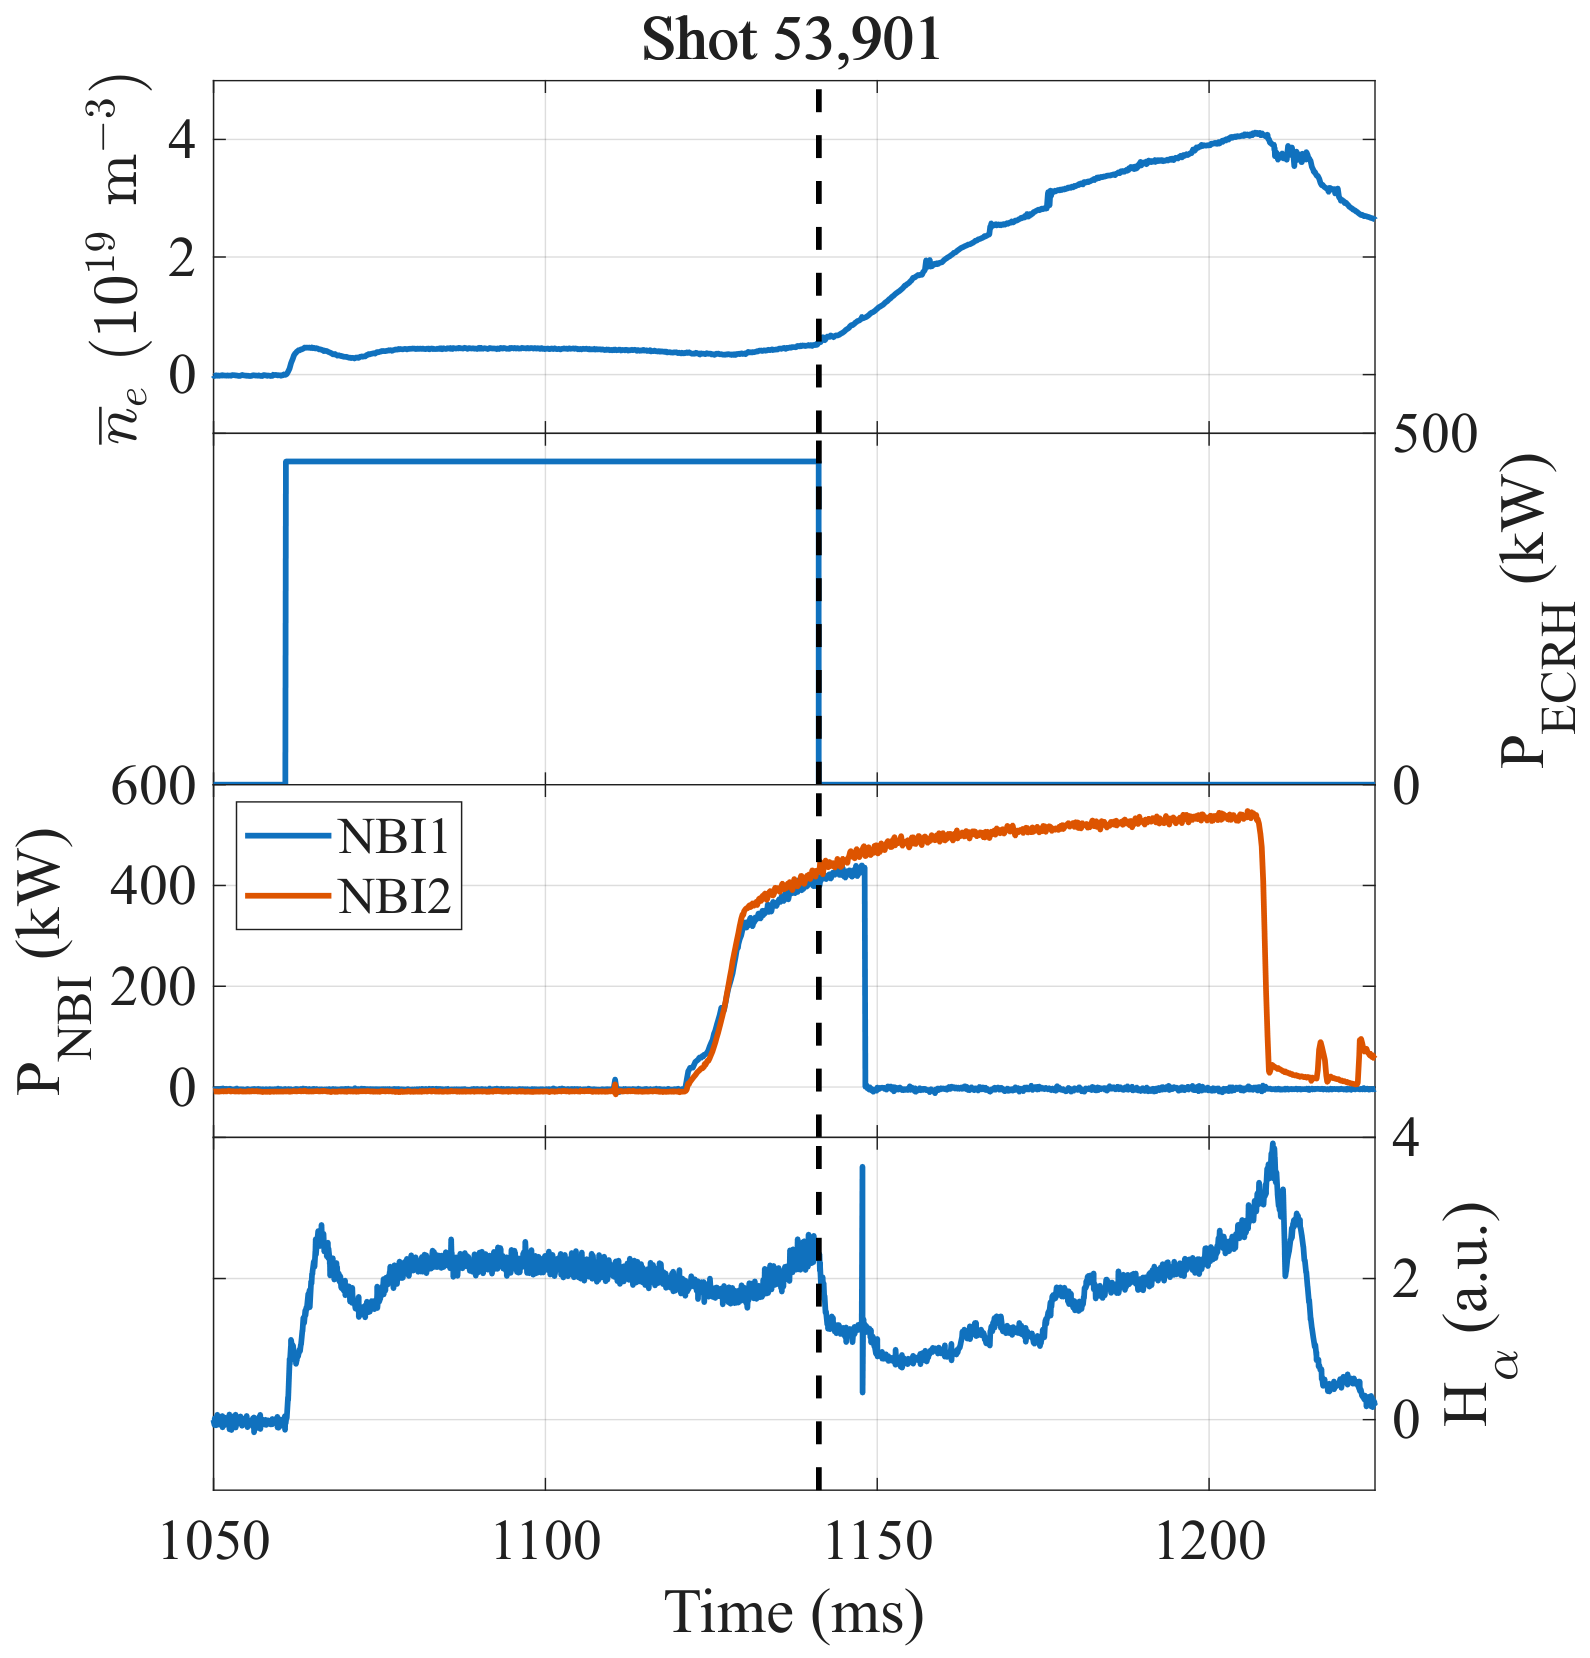
Plasmas are initiated using two Electron Cyclotron Resonance Heating (ECRH) beam lines, operating at 53.2 GHz, delivering up to about 300 kW of power each. One or two tangential Neutral Beam Injection (NBI) systems, operating in a co/counter configuration, then inject up to ∼1 MW of through-put power at ≤32 keV into the TJ-II vessel for ≤120 ms. NBI heating is started before ECR heating ends. A typical heating scenario is shown in Figure 1. ECRH is used to start the plasma and maintain it for about 80 ms, after which it is switched off. NBI heating starts about 20 ms prior to ECRH switch-off. When NBI is started, the line-averaged electron density from the interferometer, , starts to rise slightly due to the fueling implied by NBI. However, when ECRH is switched off, the rate of change increases sharply, while the edge signal drops, reflecting reduced edge outward particle transport. Together, this indicates improved particle confinement in spite of a reduction of heating power.
Figure 1.
Typical heating scenario in TJ-II. Top to bottom: evolution of the line-averaged electron density, ; nominal ECRH power; nominal power of the two NBI systems; and emission from the Scrape-Off Layer. The time of ECRH switch-off is indicated by a vertical dashed line.
This paper will focus on the time period around the switching off of ECRH. When the line-averaged electron density, , is sufficiently high but still below the critical density , this action often produces an immediate transition from the electron to the ion root. This fact can be verified using the characteristic indicators mentioned in Section 1.
2.2. Diagnostics
In this work, we will make extensive use of the dual Heavy Ion Beam Probe (HIBP) system of TJ-II [14]. The HIBP operates by injecting a narrow, collimated beam of fast Cs+ ions into the plasma. The ions may be ionized once more, yielding Cs++ ions that exit the plasma and are collected in an energy analyzer, providing information on the plasma potential and electron density. The intersection of the orbits of the incoming Cs+ ions and the collected Cs++ ions defines an interaction or ‘sampling’ volume. The sampling volume is either fixed or can be scanned through the plasma using beam deflection plates. The sampling volume has a resolution better than 1 cm, and the sampling rate is typically 1 MHz. Scans require between 5 to 20 ms to sweep all or part of the plasma diameter. The position of the sampling volume is expressed in terms of the normalized plasma radius , such that on the High Field Side (HFS), and on the Low Field Side (LFS), by definition.
TJ-II also disposes of a dual set of reciprocating Langmuir probes [19]. Among other things, these probes allow for the measurement of the floating potential, , and the ion saturation current, , in the plasma edge region, with high spatial and temporal resolution. The typical sampling rate is 1 MHz.
Another diagnostic of interest is the 12-channel Electron Cyclotron Emission (ECE) system that allows for the measurement of the local electron temperature at up to 12 different radial positions along the midplane, with a radial resolution of about 1 cm [20]. The measurements are cross-calibrated with profiles obtained by the Thomson Scattering diagnostic [21].
3. Experimental Results
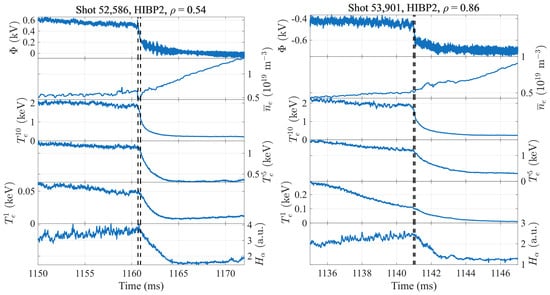
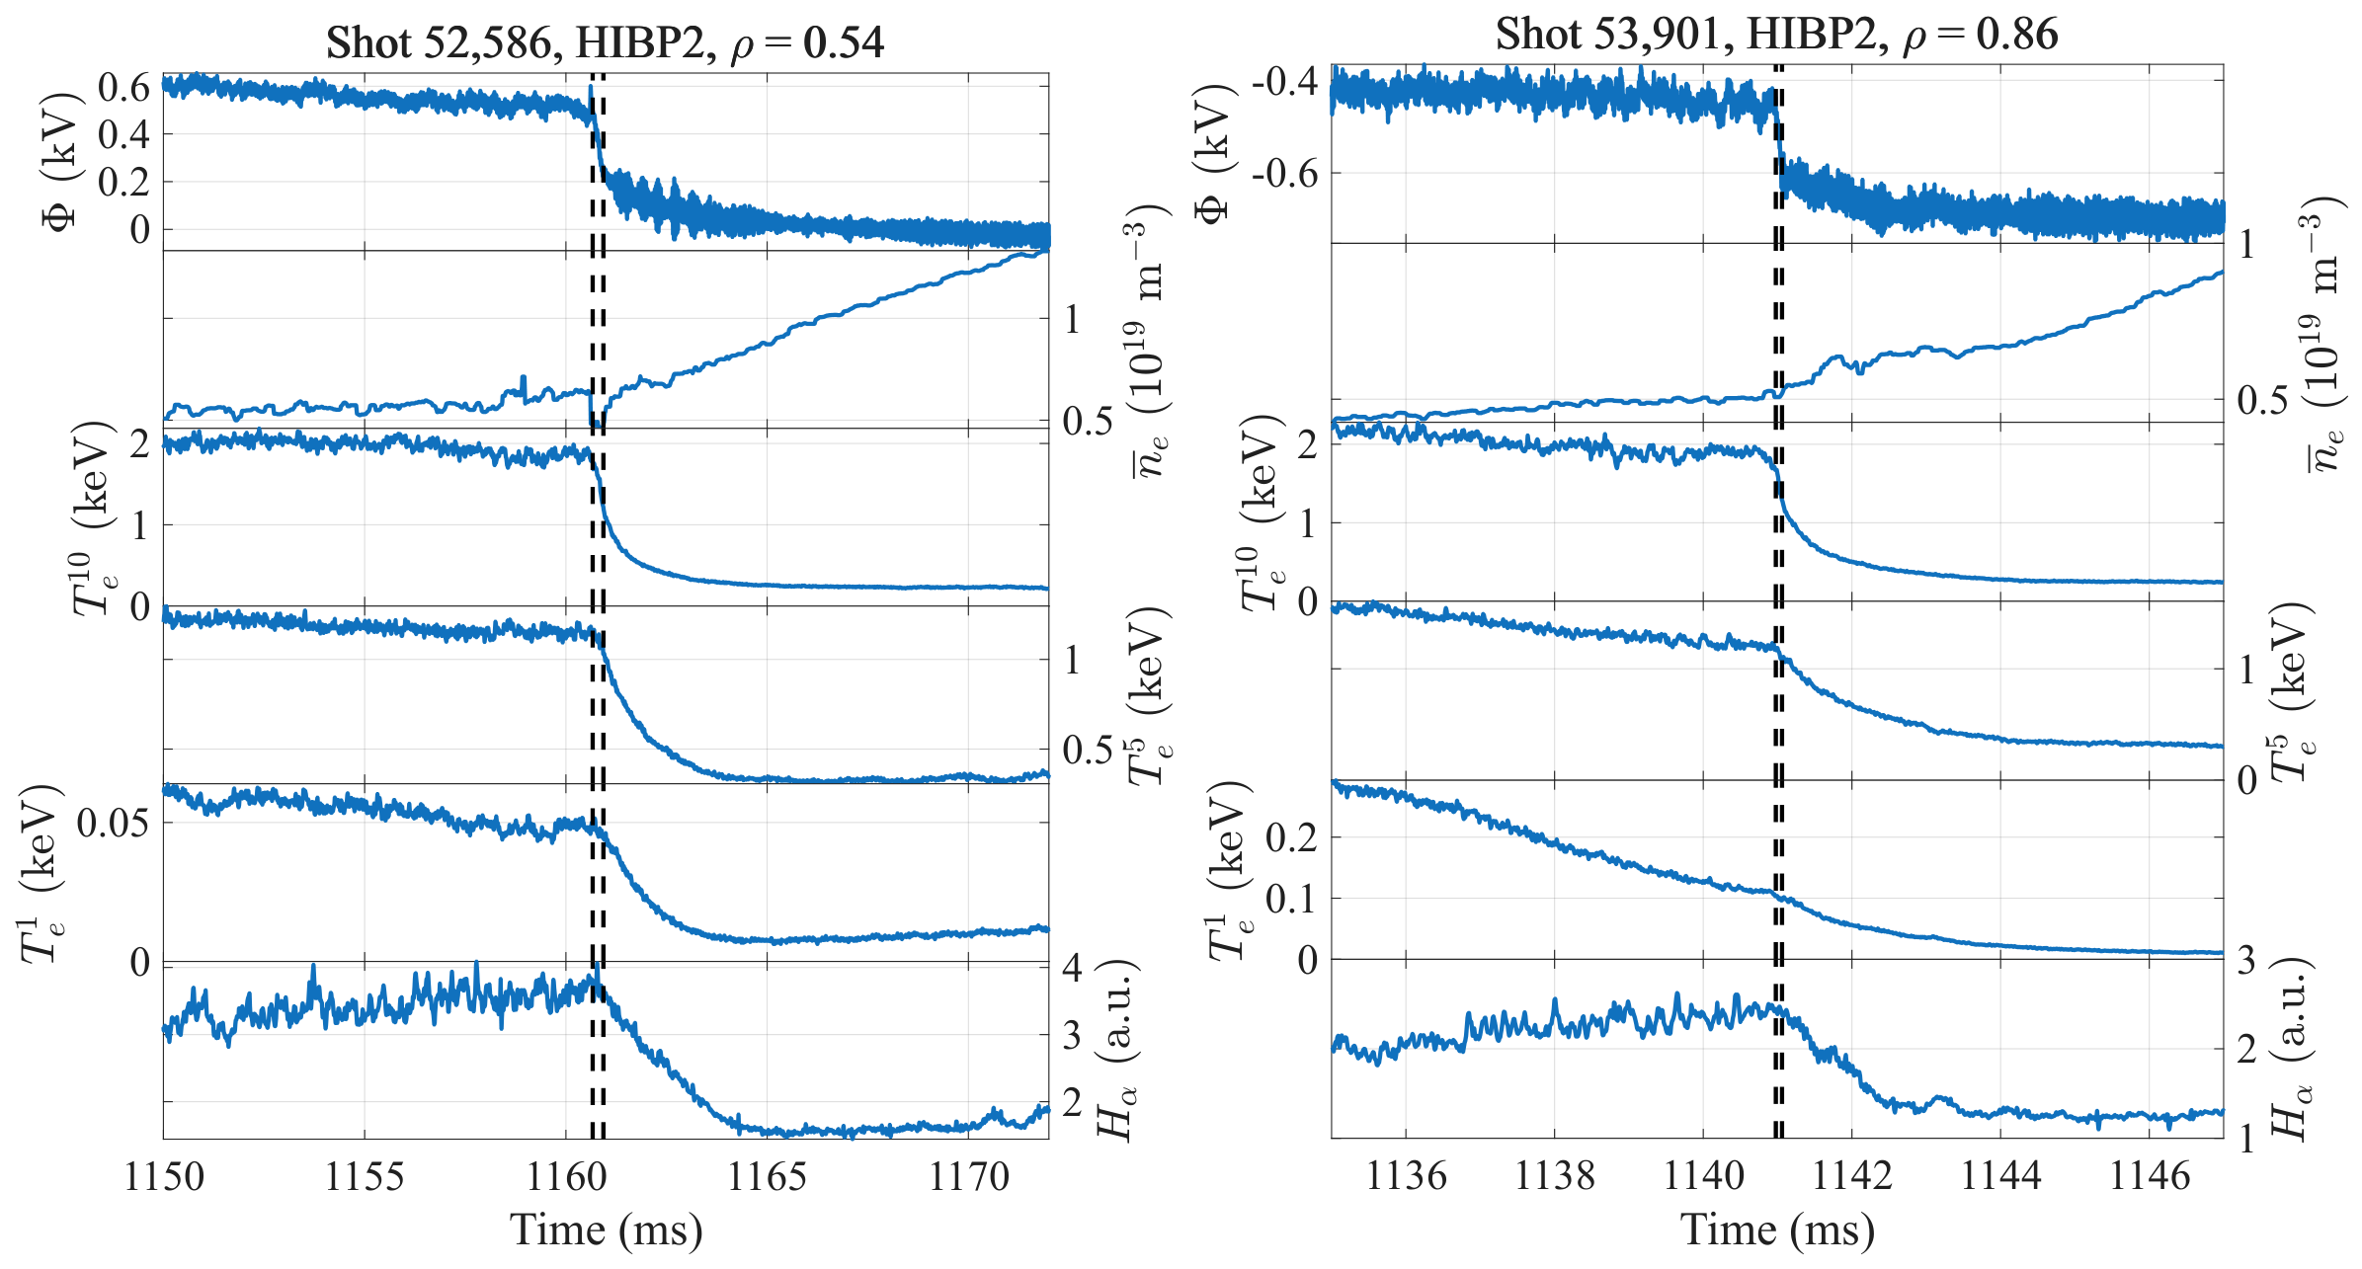
Figure 2 shows some e-i transitions at the time of ECRH switch-off (marked by a vertical dashed line). The root transition is marked by the rapid drop of potential, , and the subsequent increase in the growth rate of the line-averaged electron density, . emissions from the Scrape-Off Layer (SOL) drop after the transition, reflecting a reduction of edge outward particle transport. The figure also shows the exponential drop of the electron temperature following ECRH switch-off, with a decay time of 1–2 ms. The initial change of slope occurs simultaneously for all ECE channels, and concurs with the initial drop of the potential . However, the subsequent exponential relaxation is longer for ECE channels located at larger normalized radius, .
Figure 2.
Root transition examples. Top to bottom: plasma potential, , at the radial location indicated in the header; line-averaged electron density, ; electron temperature, for various channels (, , ), and edge emission signal. In each panel, the left vertical dashed line indicates the time of ECRH switch-off (); the right one corresponds to the end of the fast potential drop phase (, see text).
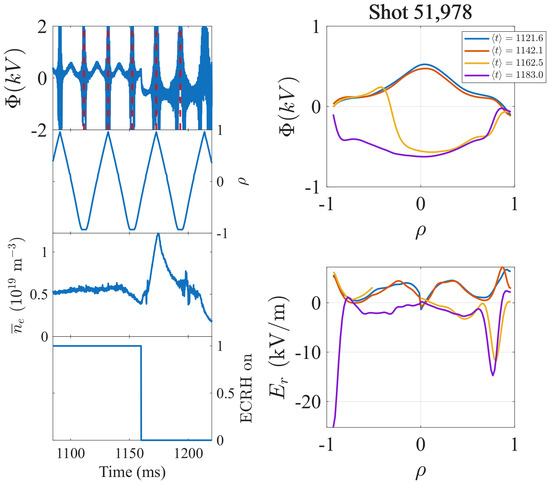
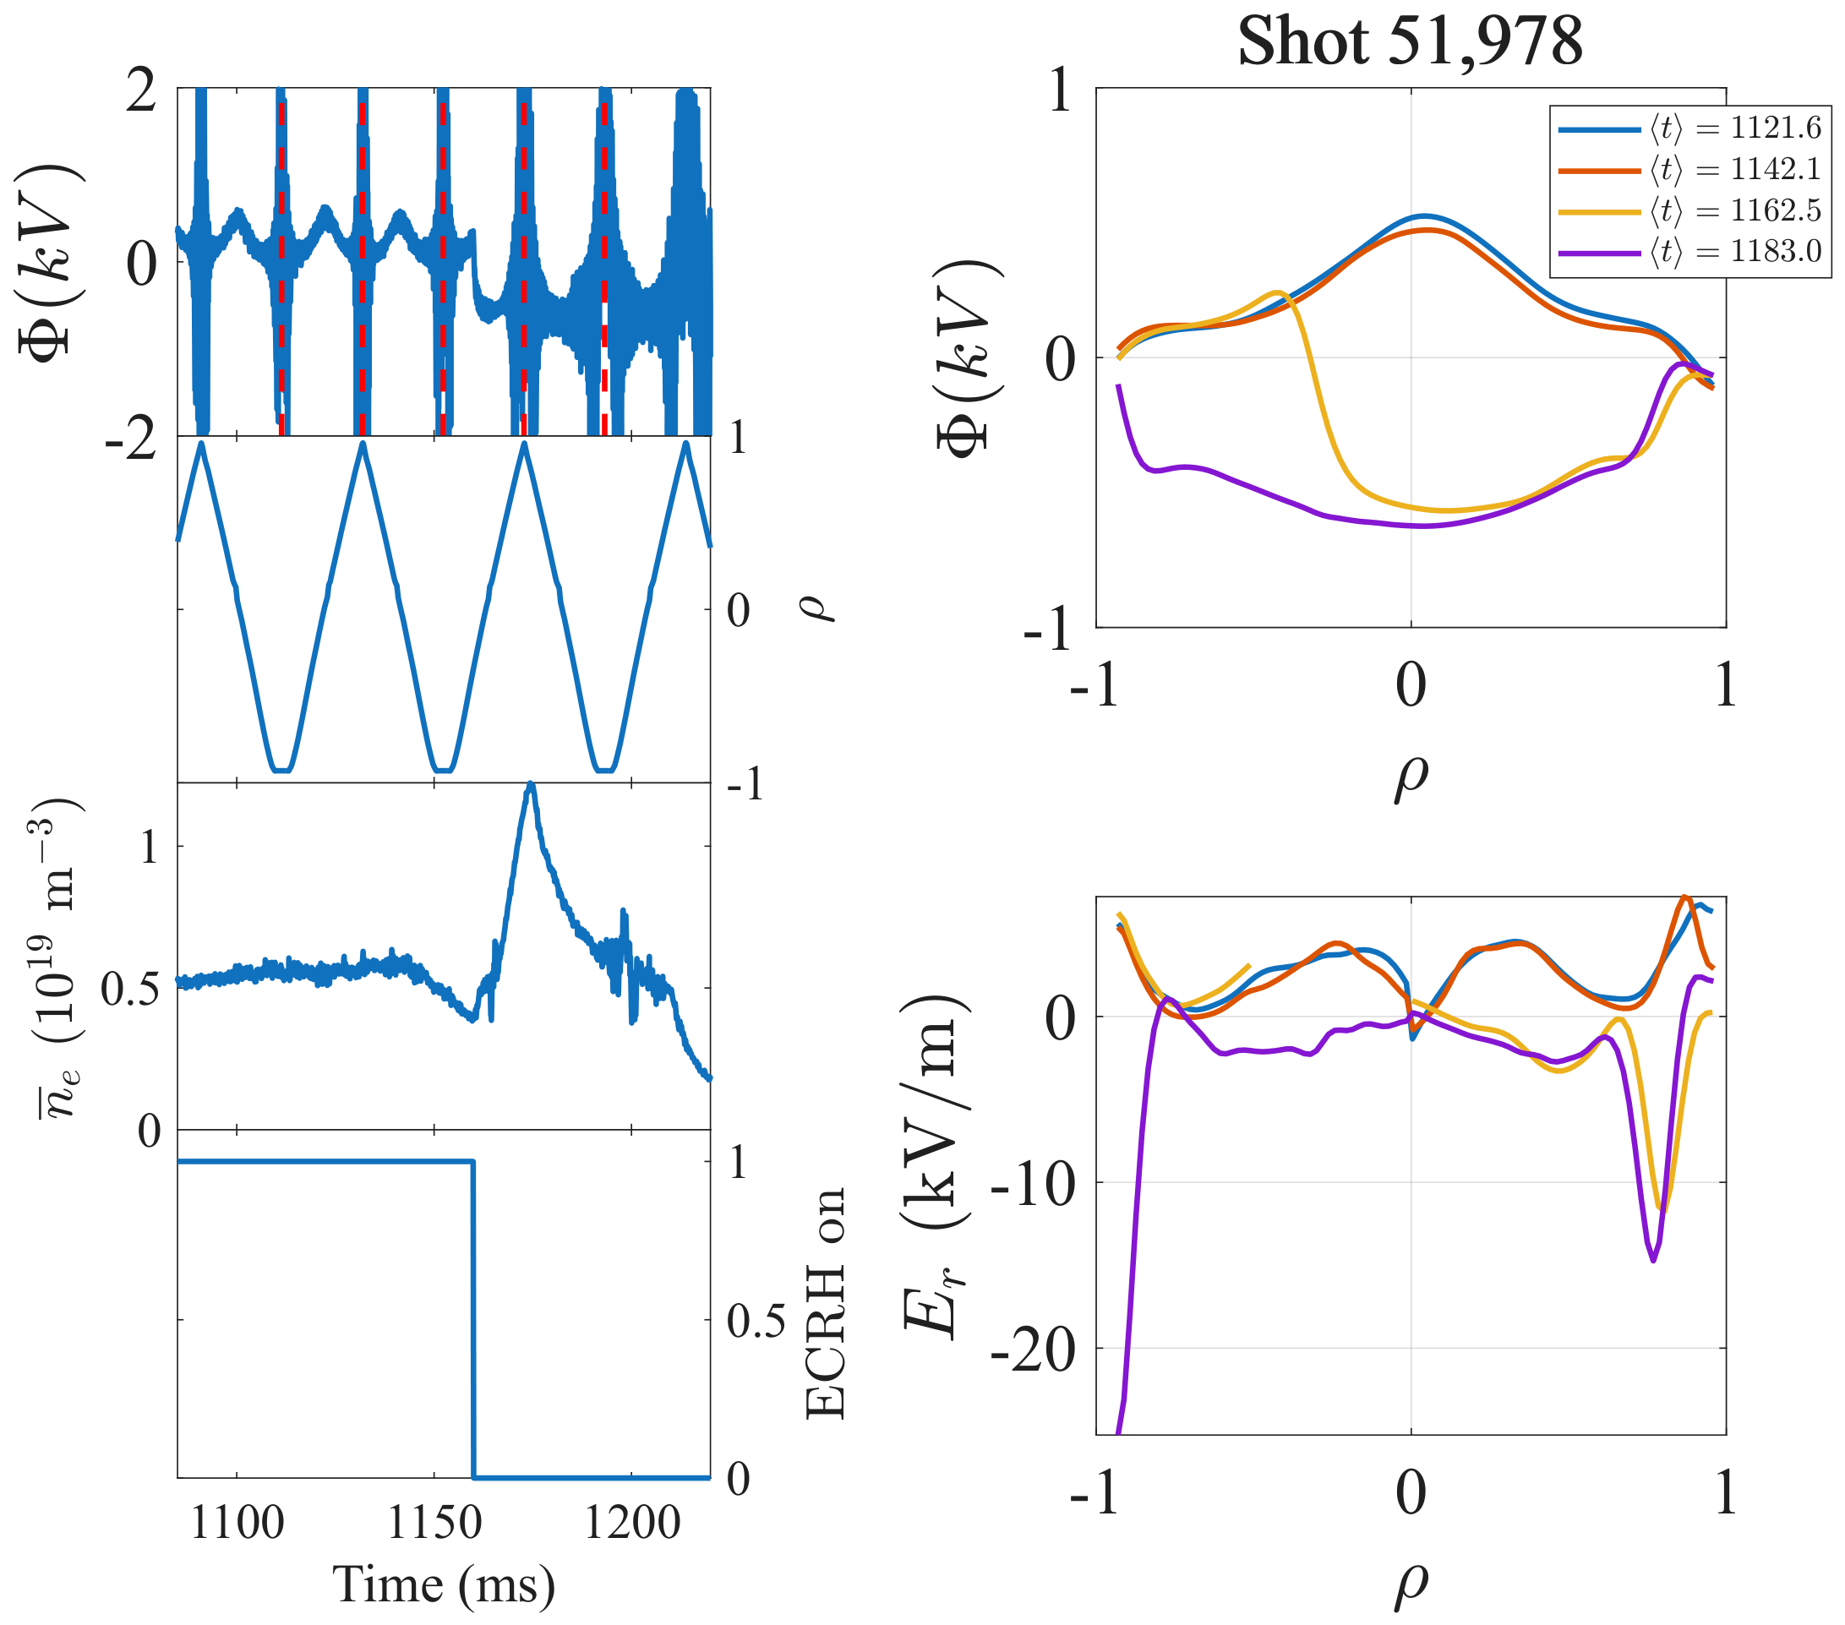
Figure 3 shows an example of an observation of the e-i root transition using the HIBP diagnostic while in scanning mode. The transition occurs at ms and is seen as a sharp drop in the potential. Potential profiles are peaked in the center of the plasma in the ECR heating phase. As noted in Section 1, the transition occurs when ECRH is switched off. After the transition, profiles are globally negative. The increased electron density due to NBI heating results in a reduced secondary HIBP beam current due to beam attenuation and hence an increased noise level in the signal. Nevertheless, the smoothed signal still provides useful information. The figure also shows an estimate of the radial electric field, calculated as , where a is the minor plasma radius. This approximation, based on the scanning motion of the sampling volume, is only valid for quasi-static profiles, hence is not valid at the transition where is changing rapidly in time. The formation of a strong shear layer at the plasma edge (near ), after the transition, is clearly visible in the form of a narrow dip in . Such a shear layer implies a zonal flow shear (due to the drift velocity ) that may lead to turbulence suppression and the formation of an edge transport barrier.
Figure 3.
Left, top to bottom: measured potential (red dashed lines indicate the limites between radial scans); calculated normalized radius of the sampling volume, , which results from the scanning motion of the Cs+ ion beam; line-averaged density; and ECRH on/off. Individual scans are delimited by vertical red dashed lines in the top left plot. Top right: smoothed profiles; the legend indicates the mean time of each radial scan. Bottom right: calculated radial electric field, .
3.1. Transition Phases
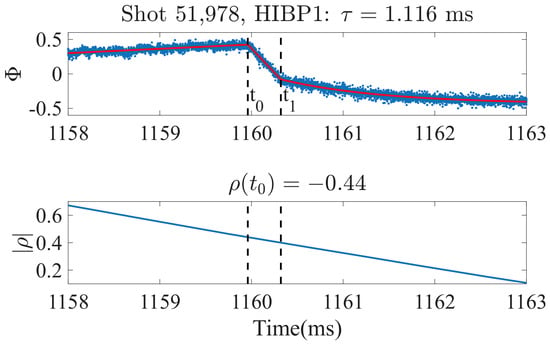
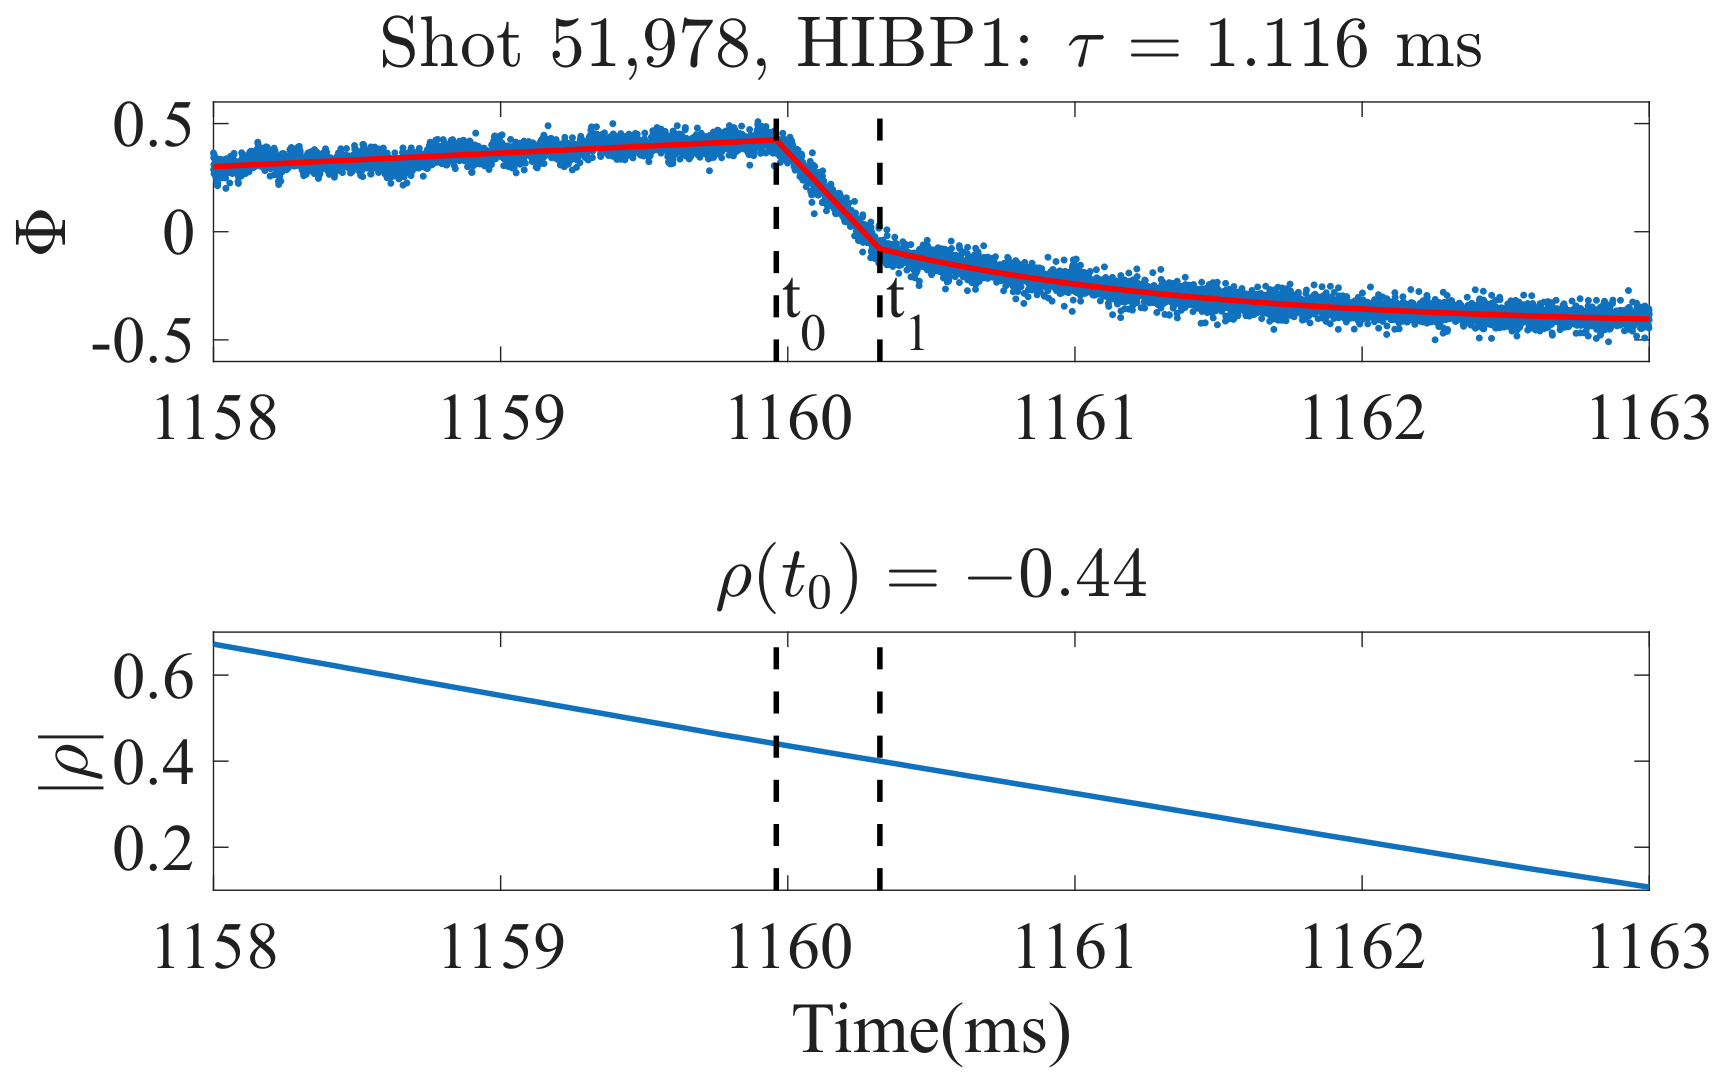
Figure 4 shows an example of a measurement (abbreviated ) in a short time window around the time of the e- to i-root transition. The measurement location is varying in time due to the scanning motion of the Cs+ beam. The curve can be subdivided into three sections: an initial, roughly linear variation associated with the scanning movement of the sampling volume and reflecting the nearly unchanging potential profile . Next, one observes a fast drop, on a sub-ms time scale. And finally, an exponential relaxation phase is observed, characterized by a longer time scale (of several ms).
Figure 4.
(Top): time trace for and fit. (Bottom): radial location of the sampling volume. Dashed vertical lineas correspond to the times and (see text).
To quantify this behavior, we fit the following heuristic function to the trace data:
where . An example fit is shown in Figure 4. The fit is performed over a 4–5 ms long time window, roughly centered on the transition, as shown in the figure. From this fit one obtains: the transition time interval (vertical dashed lines), the potential at the start of the transition , the potential at the end of the transition , the duration of the transition , the asymptotic potential for , , and the exponential decay rate .
3.2. Dependence on
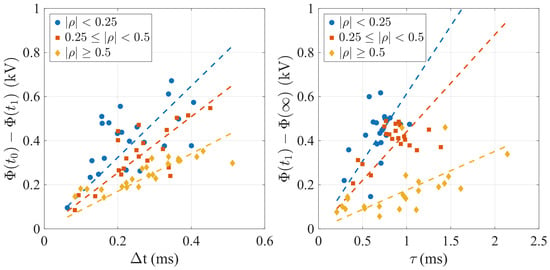
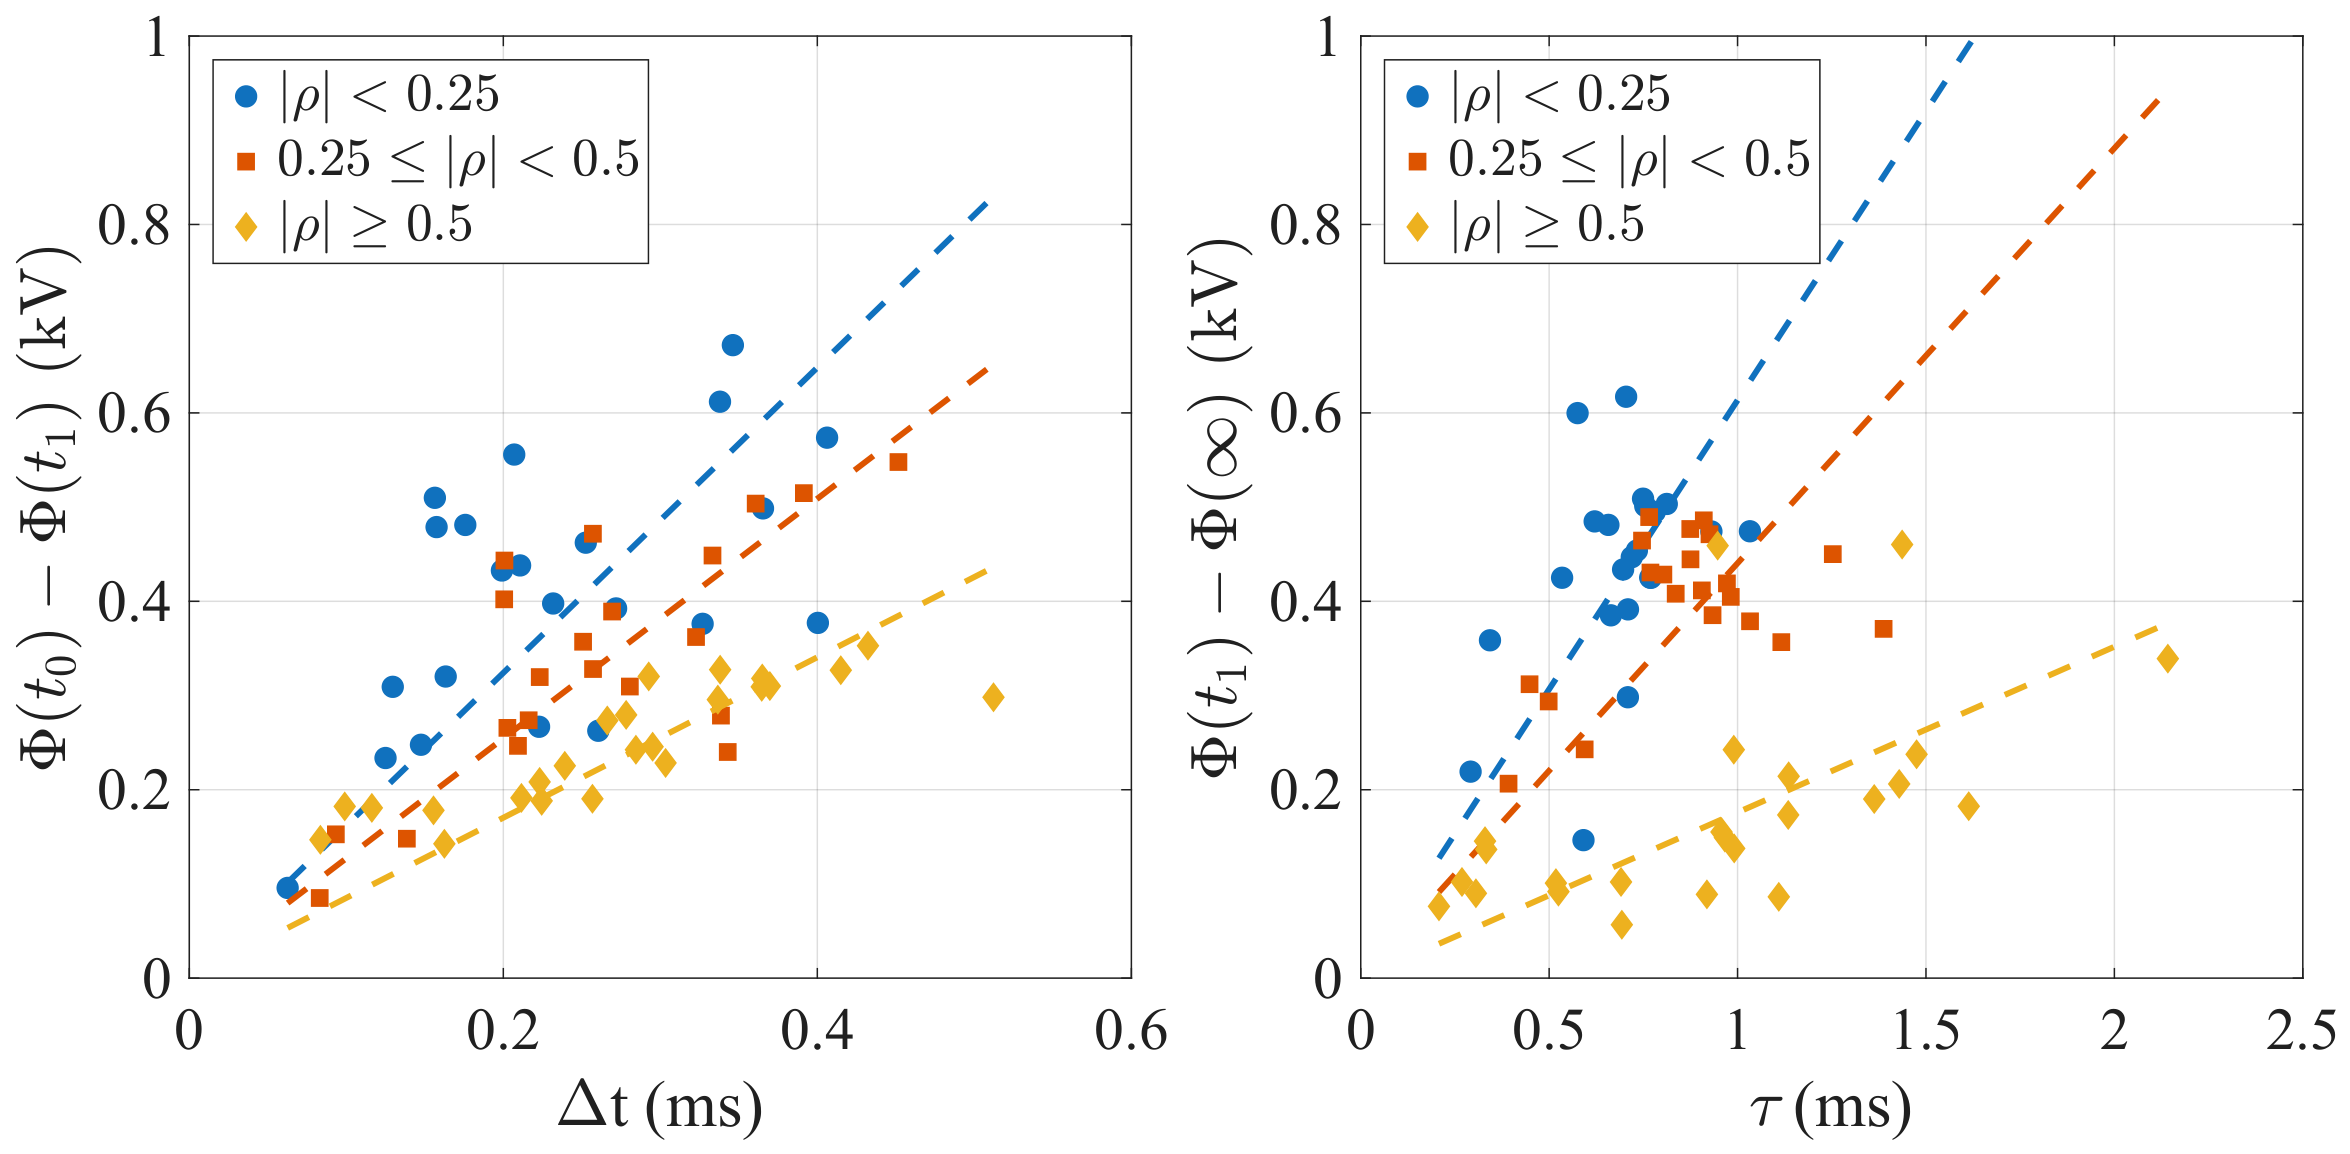
We have performed the fit described in Section 3.1 on time traces corresponding to a database of 94 discharges. The line-averaged electron density at time is m−3. We find that the drop in potential during the fast phase is correlated with the duration of this phase, see Figure 5 (left). While the duration of the fast phase does not vary across the plasma in any single shot (as will be shown in Section 3.3 below), the graph shows that the potential drop is larger in the core than at the edge. This occurs because the size of the potential drop is proportional to the ECRH power deposition profile (see Section 3.3 and Section 4). Something similar occurs with the drop in potential during the second phase and the relaxation time, see Figure 5 (right); in this case, however, the difference between the core () and the edge () is much more marked, as radial transport also plays a role in the relaxation of profiles.
Figure 5.
(Left): potential drop versus drop duration for the first, fast phase. (Right): potential drop versus relaxation time for the second phase. Dashed lines are linear fits to the corresponding points.
3.3. Fast Transition Simultaneity
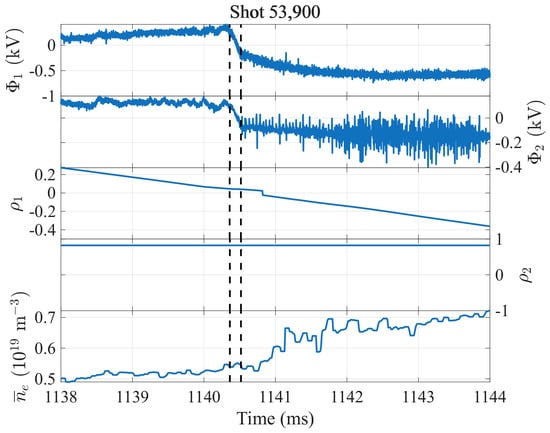
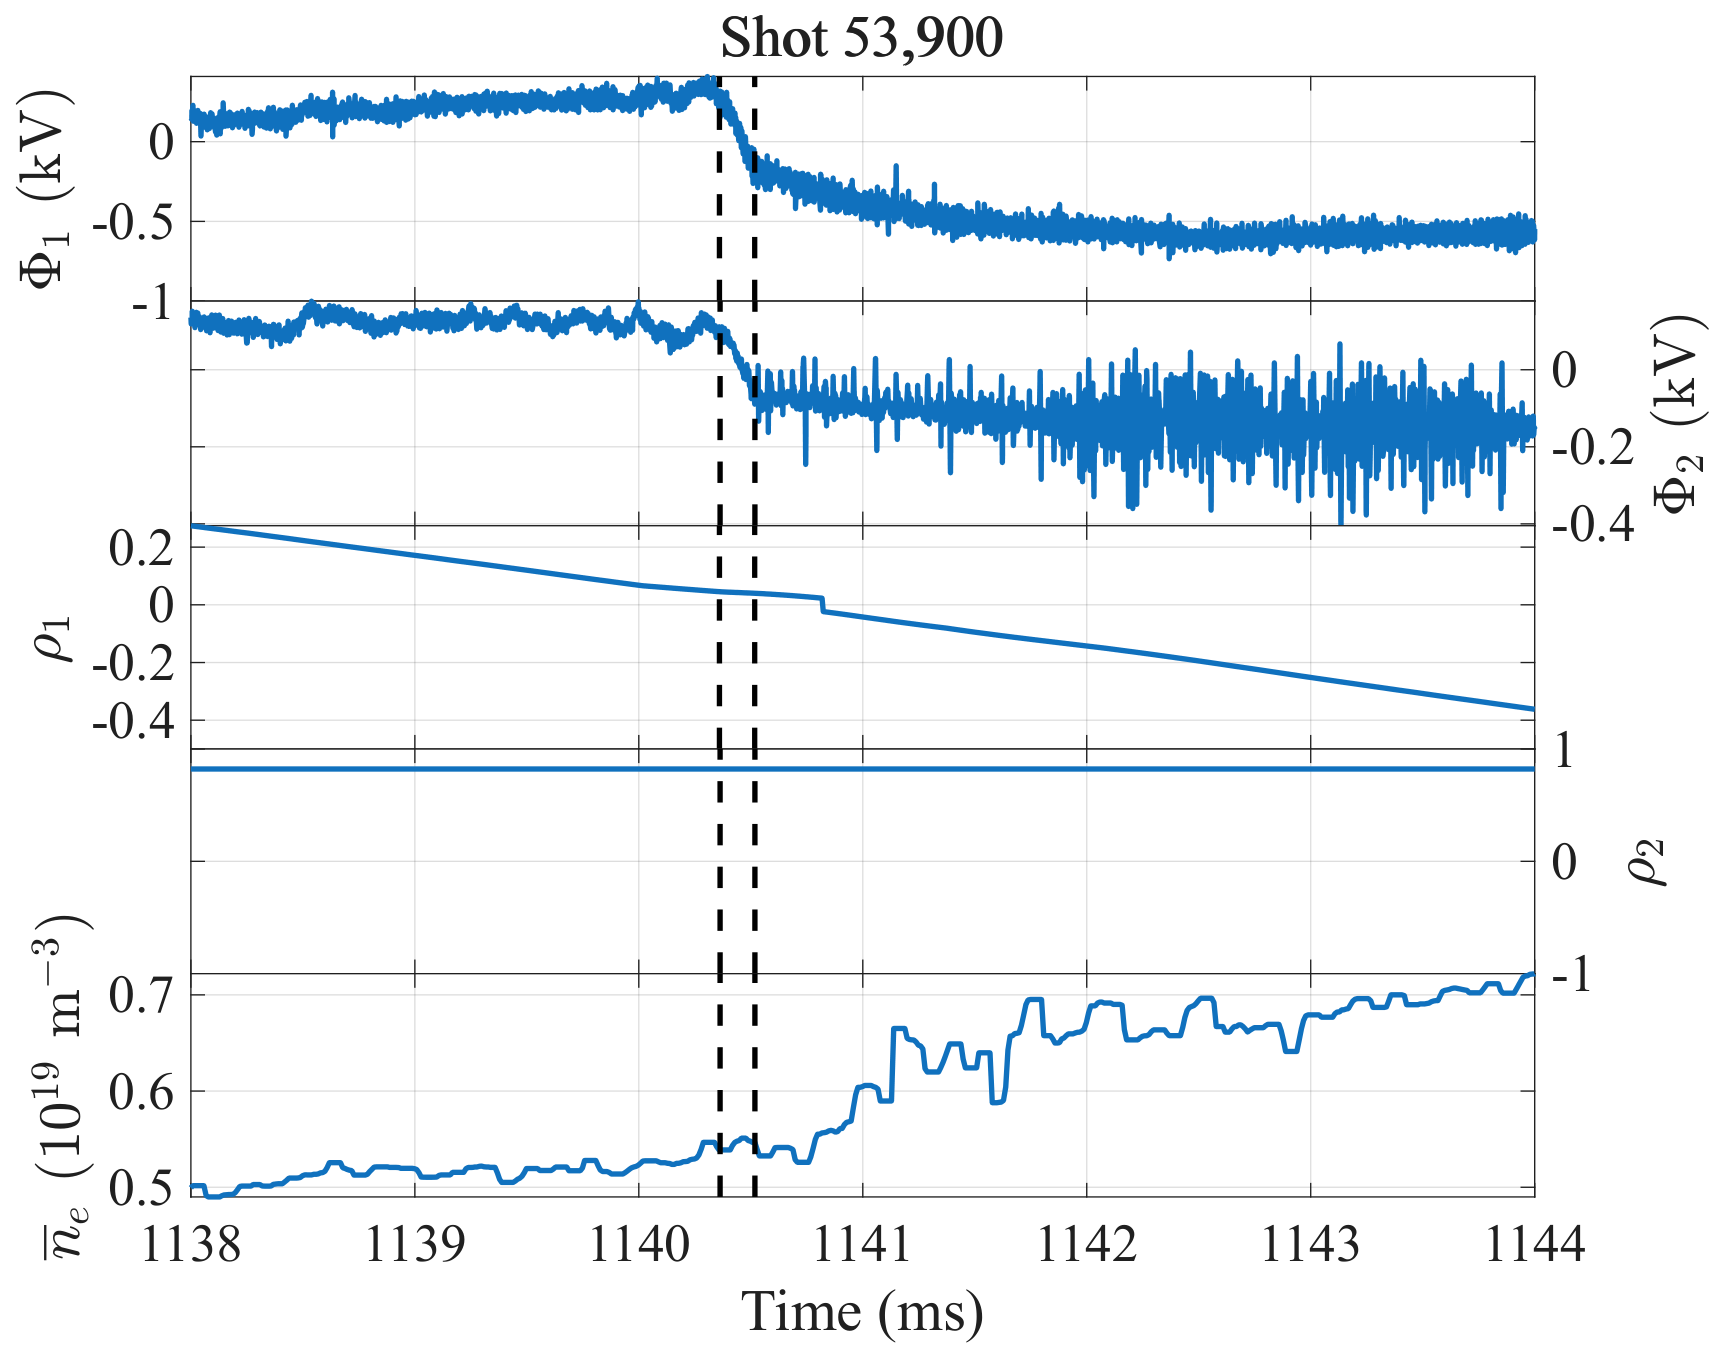
Figure 6 shows potential measurements from the two HIBP systems. System 1 is scanning, and the e-i transition occurs when the sampling volume is in the deep plasma core. System 2 is not scanning and measures at the edge, at . The fast potential drop associated with the e-i transition occurs simultaneously in the core and the edge. In order to determine the existence of a possible time delay, we have computed the cross correlation between and in a time interval of 3 ms around the time of the transition. From this analysis, the peak of the cross correlation was found to occur at μs. The fast drop in the core (∼0.5 kV) is bigger than the drop at the edge (∼0.2 kV).
Figure 6.
Comparison of potential measured by the 2 HIBP systems, discharge 53,900. Top to bottom: from HIBP 1; from HIBP 2; for HIBP 1 (scanning); for HIBP 2 (fixed at ); and line-averaged electron density. The times and are indicated with vertical dashed lines. A similar case is discharge 53,901.
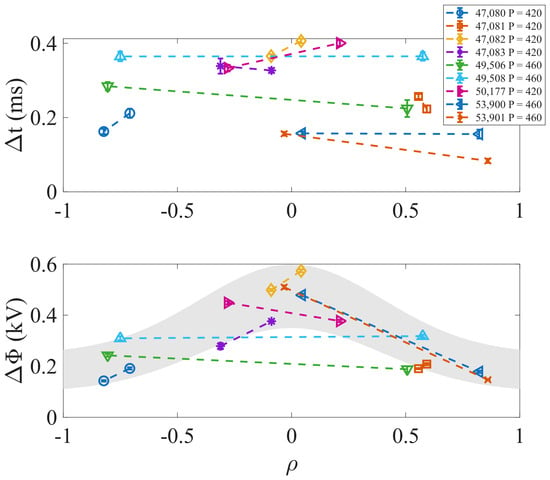
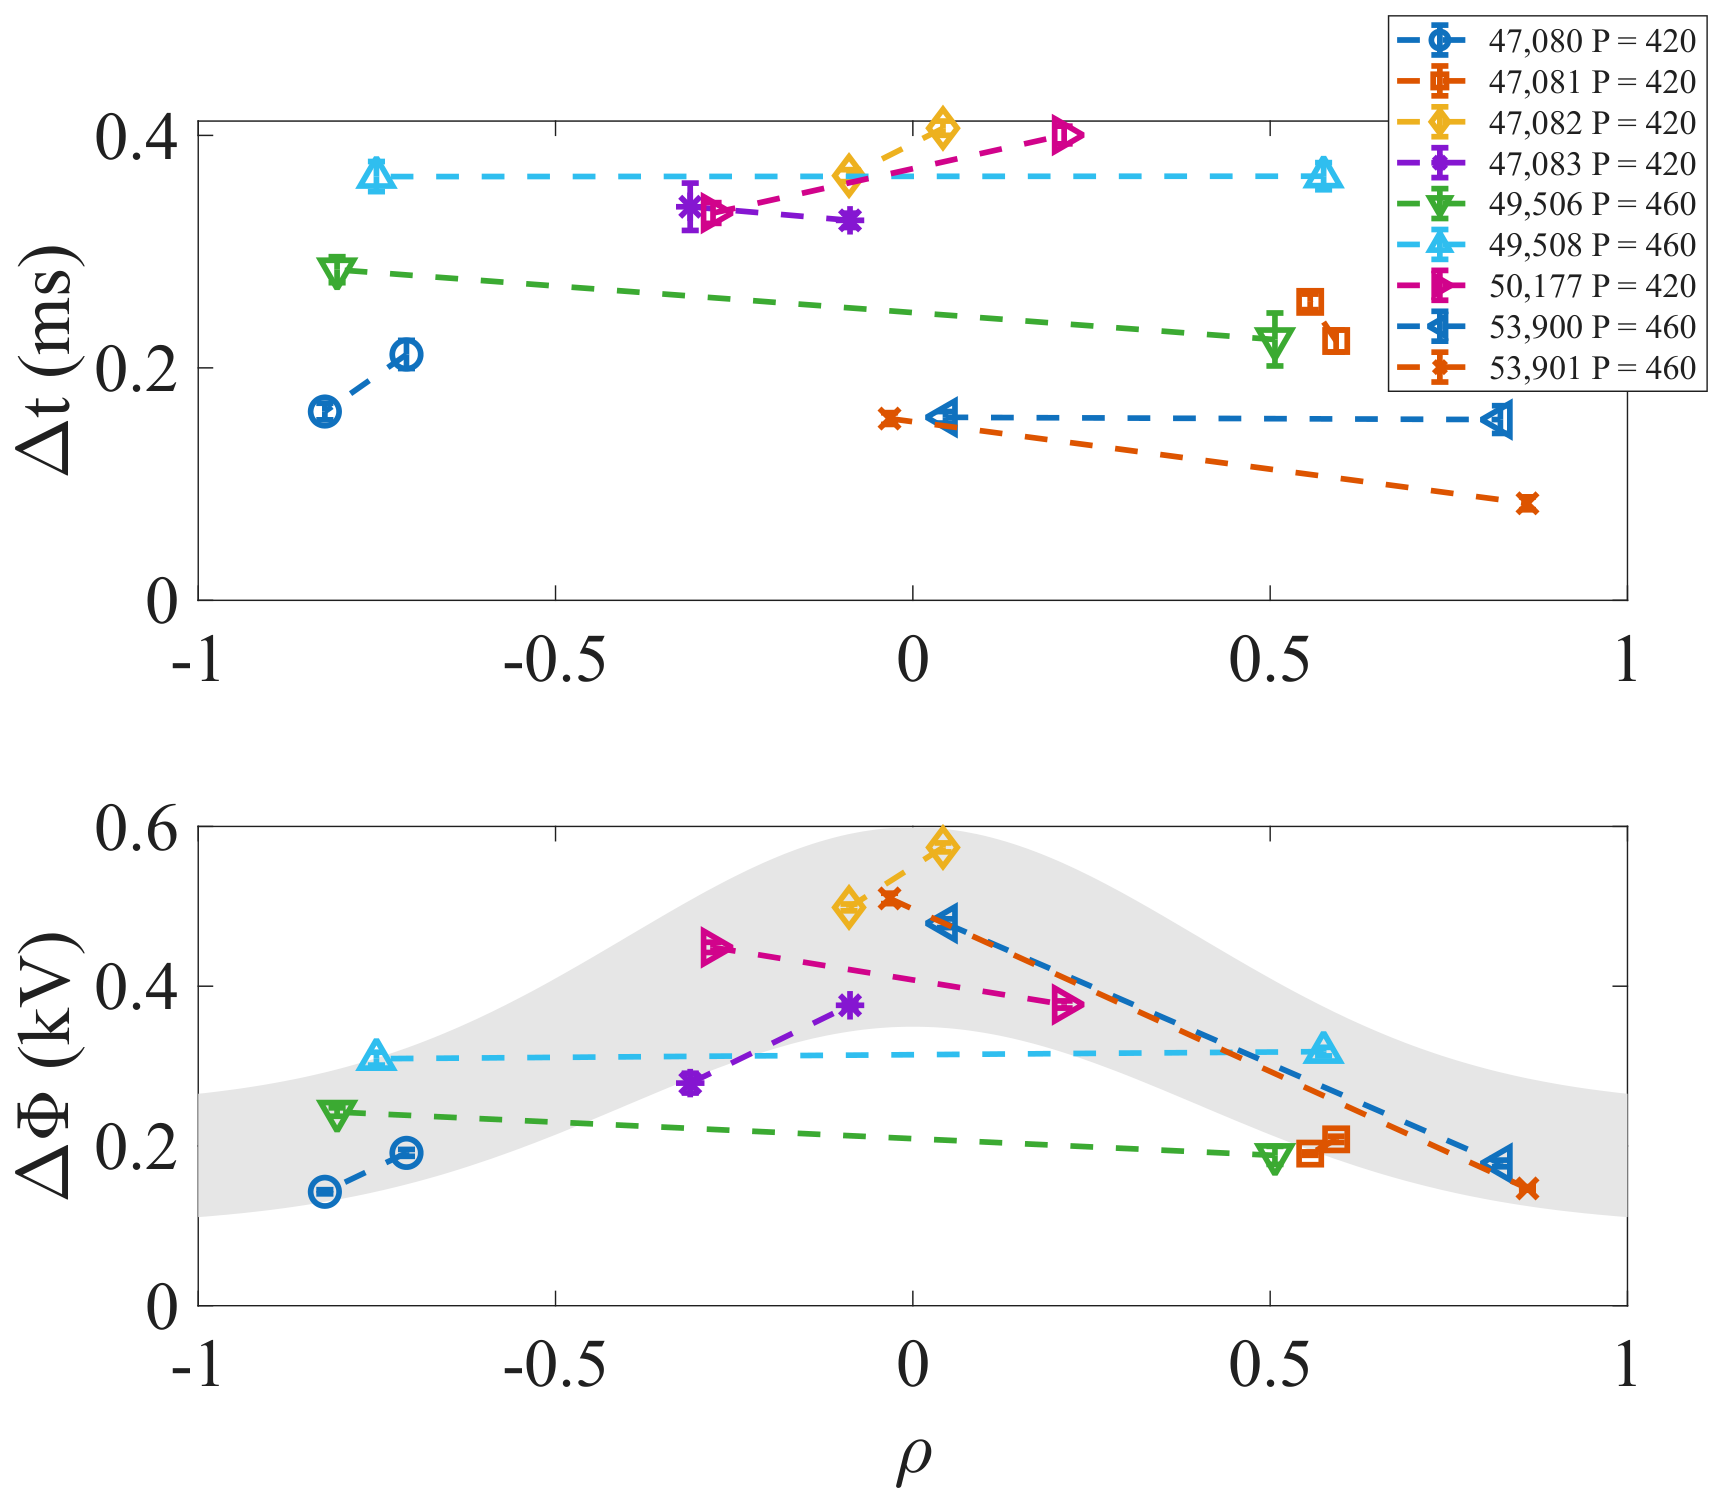
To evaluate how systematic these results are, results from the analysis of a set of nine discharges with e-i transitions following ECRH switch-off, for which measurements from both HIBP systems, are considered. The results are shown in Figure 7. The duration of the fast phase, , as determined using the fit procedure described above, is similar for both HIBP systems (within about 0.05 ms), even when they are measuring at very different radial locations. However, the potential drop in the fast phase, , is clearly peaked in the core. This difference in potential drop according to radius is perhaps clearest for discharges 53,900 and 53,901, which have simultaneous measurements at the edge and in the core. The overall radial shape of the potential drop (indicated by a grey area) roughly matches the ECRH power deposition profile, (see [22] and Section 4).
Figure 7.
Duration of the fast phase, , and potential drops , detected by the dual HIBP system measuring simultaneously at different radial locations; the two simultaneous measurements are connected by dashed lines. Error bars returned by the fit procedure are shown. The nominal heating power, (kW), is indicated in the legend. The grey area is explained in the text.
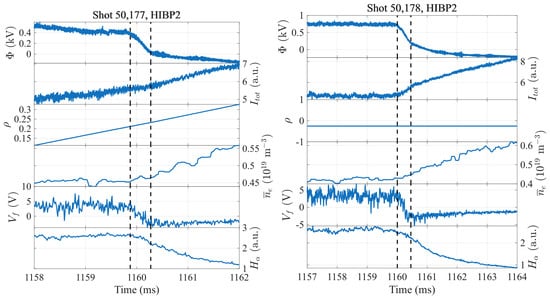
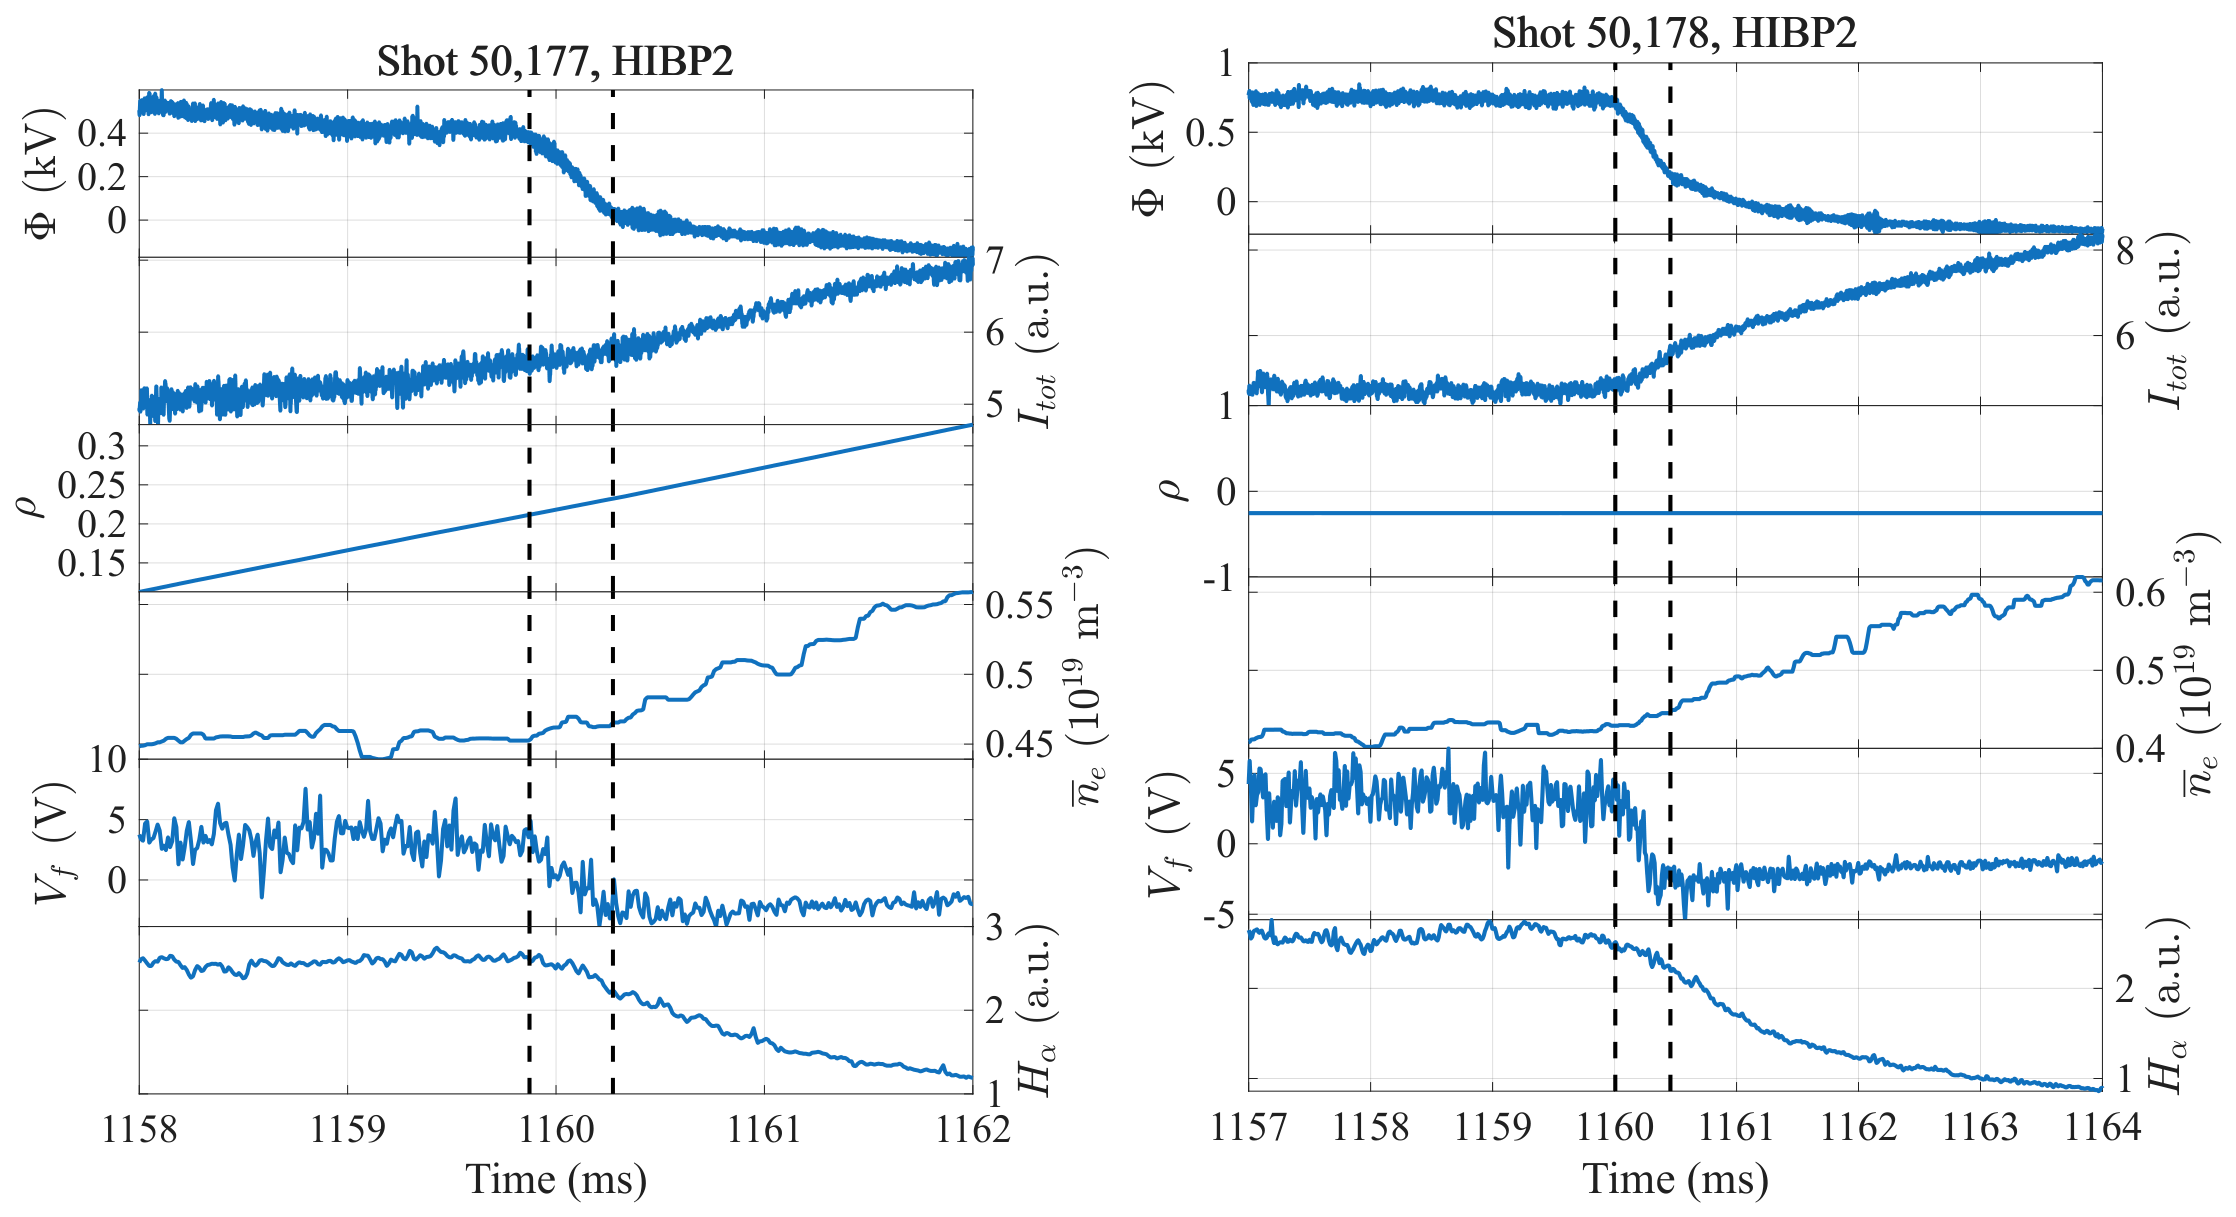
Figure 8 shows examples of transitions in which we have measurements from both HIBP and Langmuir probes. The floating potential change at the edge during the transition is fully synchronized with the fast plasma potential change in the core: so again, the initial fast transition occurs simultaneously in the core and at the edge. Again, the change in slope clearly illustrates the particle confinement enhancement occurring at the transition, as does the change in slope of the HIBP beam current, (recall that is proportional to the local electron density). These observations extend the preceding results to radial positions very close to the Last Closed Flux Surface, namely, .
Figure 8.
Top to bottom: plasma potential, , in the core; HIBP secondary beam current ; normalized radius of the sampling volume, , line-averaged electron density ; floating potential from the Langmuir probe, , at the edge; and emission from the Scrape-Off Layer. The position of the Langmuir probe is . Left: discharge 50,177, HIBP scanning; right: discharge 50,178, HIBP not scanning (). Vertical dashed lines indicate the times and .
In all cases, the perfect synchronization of the transition is confirmed (to 1 μs accuracy). One can therefore conclude that the fast potential drop occurs simultaneously across the plasma.
3.4. Density Response
An important issue is how the local electron density (rather than the line-averaged density) responds to the transition. This quantity should reflect the change in particle confinement. The HIBP does not measure the density directly, but the secondary (Cs2+) beam current, , is proportional to the local electron density at the sampling volume, as well as a non-local beam attenuation factor that is expected to vary only slowly [23].
Figure 8 shows the response of to the transition in an experiment with a fixed position of the sampling volume, for discharge 50,178. Prior to the transition, both and are constant. During the fast phase, the drops at a nearly constant rate, while increases. This is due to the local inverse proportionality of and and is not a transport effect. Immediately after the fast phase, increases at a (different) constant rate. This is a transport effect, indicating enhanced confinement. There is no discernible delay between the end of the fast phase and the start of the density rise.
4. Discussion
In this work, we study the electron to ion root transition triggered by the switching off of ECRH heating in some detail at TJ-II. We find that the transition occurs in two phases.
4.1. Fast Transition Phase
This phase is short, occurring on a sub-ms time scale ( ms). In this time, one observes a sharp drop in the potential, , of the order of 0.3–0.4 kV. The rate of change is kV/ms, but it varies with radius (cf. Figure 5).
Comparing simultaneous measurements made at different radial positions, we find that the time lag between the observed fast drop at different locations is ≲1 μs, i.e., simultaneous within measurement precision, implying that the occurrence of this drop is essentially global. The size of this drop is peaked in the core and does not decrease to zero for , such that it is roughly proportional to the ECRH power deposition profile [22].
In a previous related study at the LHD stellarator, a similar result for the temporal evolution was obtained in an ECRH switch-on experiment, combined with HIBP measurements of the potential, see Figure 7 of [24]. The cited work interprets the initial, fast phase in terms of direct electron losses or ‘pump-out’ due to electron energy gain from the microwave radiation. In our case, the fast phase we observe is similarly understood to be due to ‘pump-out’, or rather the sudden disappearance of ‘pump-out’ due to the switching off of ECRH, leading to a positive variation of electron density and a negative variation of plasma potential [5,25]. This effect is seen clearly in Figure 8. The ‘pump-out’ hypothesis explains both the short time scale and the fact that it occurs globally (simultaneously over the whole ECRH power deposition region, and in proportion to the power deposition profile). The authors are not aware of any other mechanism to explain both the observed global simultaneity of the potential drop, and the approximate proportionality of the size of the drop to the ECRH power deposition profile.
The potential profile at the end of the fast transition phase, , only exists fleetingly and therefore is difficult to measure directly, in the absence of multiple simultaneous local measurements. A crucial question to understand the mechanism of the formation of the edge transport barrier is whether it is already established at the end of the fast phase. It should be noted that the local electron density response, shown in Figure 8 (especially discharge 50,178), indicates that the rate of increase of , , increases immediately after the end of the fast phase. The immediate decay of the edge emissions following the transition (cf. Figure 2) signals a rapid reduction of outward particle transport in the plasma edge. Thus, it seems likely that a ‘seed’ for a transport barrier is established during the fast phase, which is then reinforced during the second, slower and transport-dominated phase. An actual transport barrier can of course only be established over times of the order of the transport time scales.
4.2. Slow Relaxation Phase
This initial rapid drop is followed by a slow exponential relaxation phase, with a typical time scale of ms (i.e., the transport time scale). Figure 6 shows that the drop in is larger in the core ( kV) than at the edge ( kV). As the plasma is no longer heated in the core by ECRH, the temperature profile flattens, so that the initially peaked electron temperature profile drops more in the core than at the edge. This also means that the potential must drop more in the core than the edge, which is in accordance with observations.
4.3. Interpretation in Terms of the Pump-Out Effect
ECR heating causes an increase of the perpendicular velocity of electrons through microwave absorption. This may cause some electrons to enter the so-called ‘loss cone’ in momentum space, after which they escape the plasma on a very short timescale [25]. In order to model the evolution of the electron density in an ECR heated plasma, including the pump-out effect, consider the continuity equation for electrons:
where is the radial electron flux, while and are the ionization source and recombination loss, respectively. Ionization is important mostly in the plasma edge region, due to its proportionality to the neutral density, . Likewise, recombination also occurs predominantly in the edge region, where the electron temperature, , is relatively low. Of main interest here is the pump-out term, , associated with the radial flux of ripple-trapped suprathermal electrons [26], which can be written as
where is the pumping rate, which is assumed to depend only on (more power implying smaller ). This equation expresses that the number of electrons lost is proportional to the number of bulk electrons present.
On a fast timescale (less than the confinement time), a change in , implying a change in , will induce a corresponding change in , and this change would be proportional to the local power deposition . This idea is consistent with the reported observations. On a longer timescale, the profiles will evolve to a new equilibrium state, as a change in will change the (diffusive) transport properties [24]; this longer timescale should therefore be of the order of the transport timescale or the (particle) confinement time, again consistent with the observations.
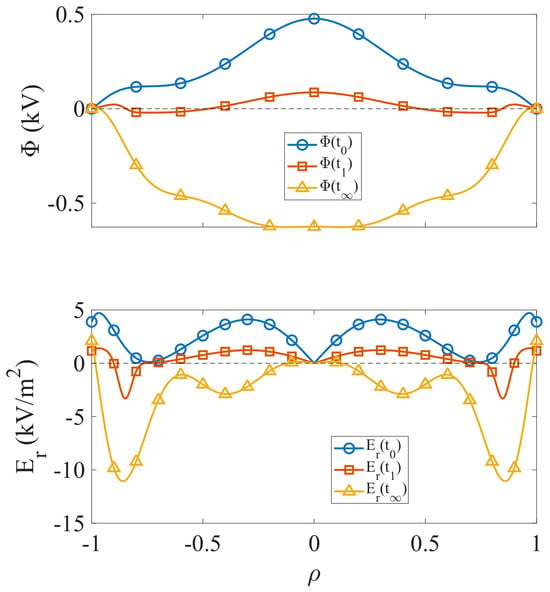
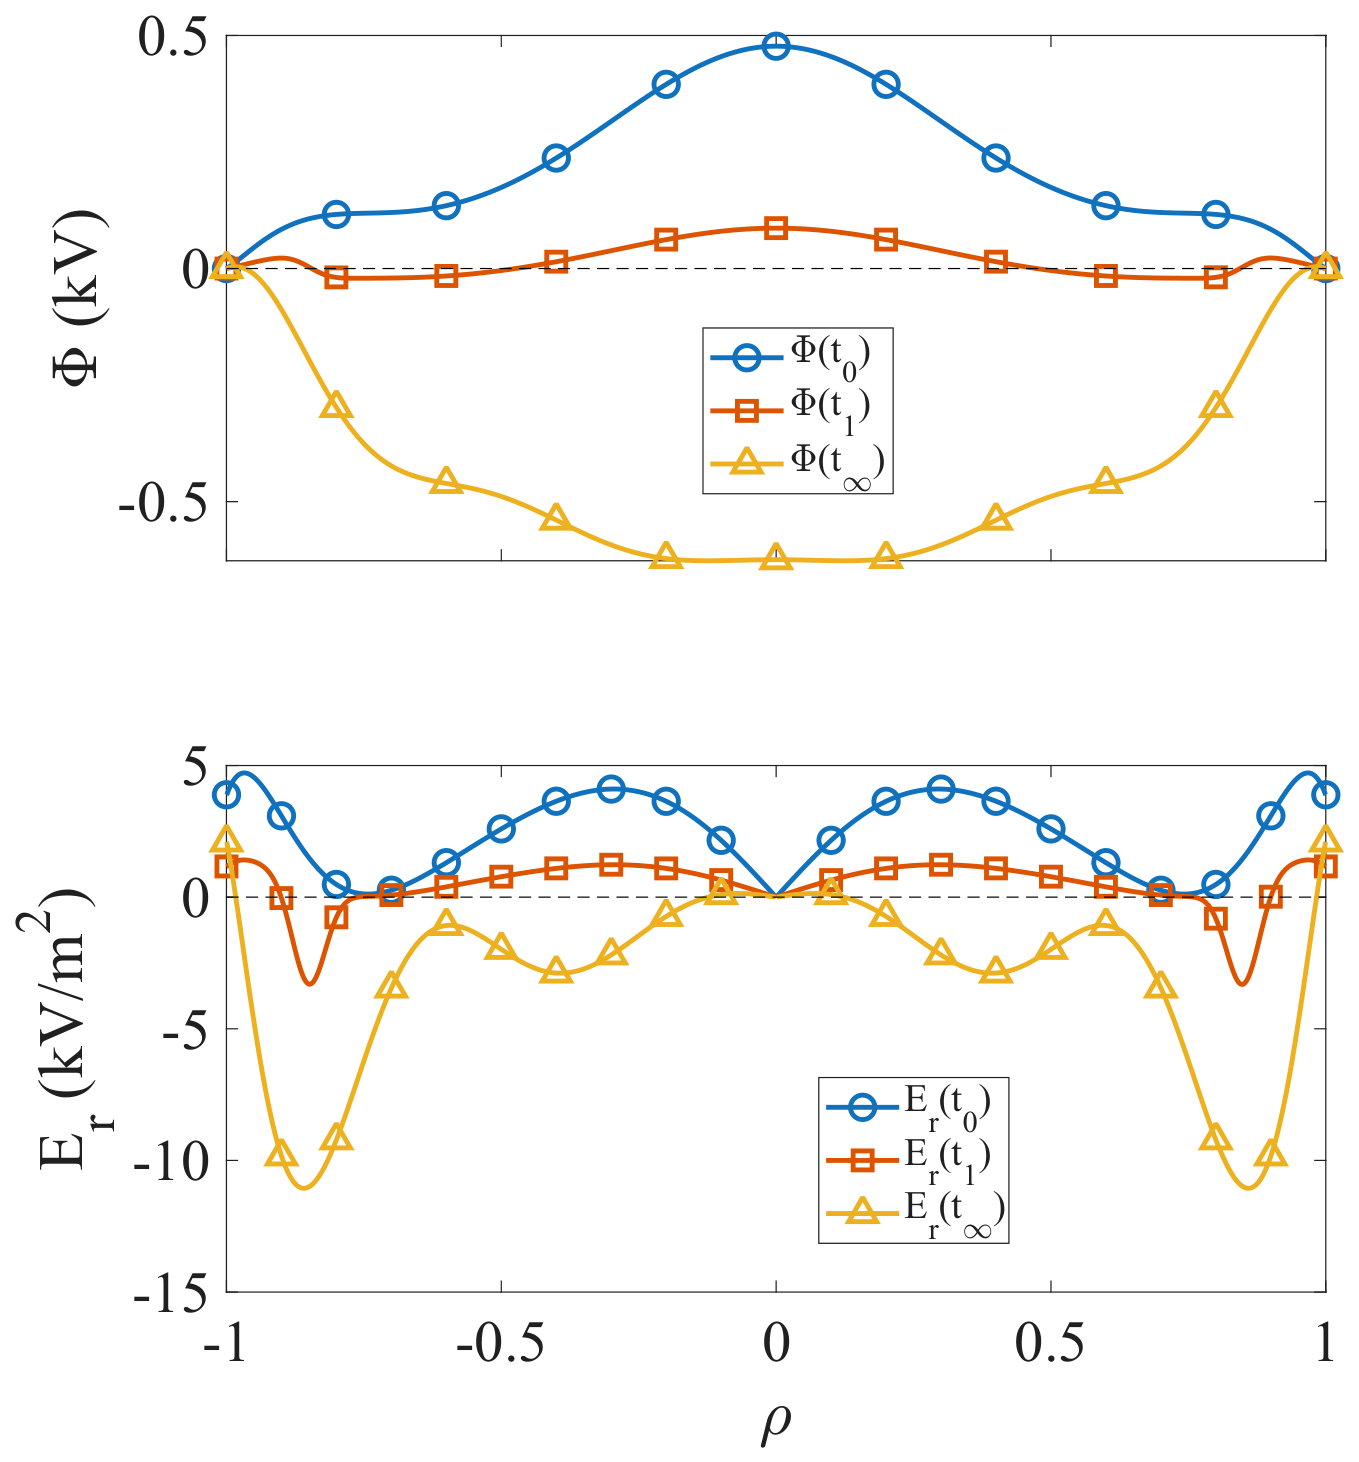
The described evolution of the potential profile is sketched in Figure 9. The pre-transition -profile (at ) is peaked, related to the peaked profile associated with core ECR heating, and the plasma is in the electron root state. The -profile after the fast phase (at ) is reduced in proportion to the ECRH power deposition profile, as suggested above, except near the very edge, where the boundary condition is imposed. Due to this, the profile has a ‘wiggle’ in the edge region, which constitutes the seed of a negative edge radial electric field layer. The final -profile is negative over most of the plasma radius, so that the plasma is in the ion root state, and a strong negative radial electric field layer exists at the plasma edge.
Figure 9.
Hypothetical evolution of the plasma potential profile. The profiles at and are closely similar to those of Figure 3. The profile at is hypothetical.
5. Conclusions
The experimental results clearly show that the e-i transition triggered by ECRH switch-off occurs in two phases. The initial phase is short ( ms) and occurs simultaneously across the whole plasma volume, with any delays being less than the detection threshold of 1 μs. This study documents this simultaneity for the first time using multiple diagnostic systems measuring the local plasma potential. During this phase, the plasma potential drops roughly in proportion to the ECRH power deposition profile. The most likely explanation for these observations is a sharp reduction of ‘pump-out’ due to ECRH switch-off.
This sharp, fast drop of potential may create a seed edge radial electric field shear layer or transport barrier in the plasma edge region, which may explain why the rate of change of the local and line-averaged densities increases immediately after the fast phase. The remainder of the second phase is a relaxation, on a time scale of 1 ms, toward a new confinement state in which a fully formed edge transport barrier is present. This relaxation involves the modification of profiles due to transport effects.
Consequently, it appears that the formation of the edge radial electric field shear layer induced by the pump-out mechanism following ECRH switch-off initiates the e-i transition in this scenario. This would conveniently explain why the e-i transition often occurs immediately following ECRH switch-off in TJ-II.
Author Contributions
Conceptualization, B.P.v.M. and I.G.-C.; methodology, B.P.v.M.; software, B.P.v.M., O.S.K. and O.O.C.; validation, O.S.K., O.O.C. and Á.C.; investigation, B.P.v.M., I.G.-C. and K.J.M.; writing—original draft preparation, B.P.v.M.; writing—review and editing, B.P.v.M., I.G.-C. and K.J.M.; visualization, B.P.v.M.; project administration, B.P.v.M., J.L.d.P., I.G.-C. and K.J.M.; funding acquisition, B.P.v.M., J.L.d.P., I.G.-C. and K.J.M.; operational support, TJ-II Team. All authors have read and agreed to the published version of the manuscript.
Funding
Research sponsored in part by the Ministerio de Ciencia e Innovación of Spain under project Nos. PID2021-124883NB-I00 and PID2023-148697OB-I00 funded by MCIN/AEI/10.13039/501100011033 and by ERDF ‘A way of making Europe’. This work has been carried out within the framework of the EUROfusion Consortium, funded by the European Union via the Euratom Research and Training Programme (Grant Agreement No 101052200–EUROfusion). Views and opinions expressed are, however, those of the author(s) only and do not necessarily reflect those of the European Union or the European Commission. Neither the European Union nor the European Commission can be held responsible for them.
Data Availability Statement
The raw data supporting the conclusions of this article will be made available by the authors on request.
Acknowledgments
The authors would like to recognize the contributions of A. Melnikov to the HIBP diagnostic.
Conflicts of Interest
The authors declare no conflict of interest.
References
- Ida, K. Bifurcation phenomena in magnetically confined toroidal plasmas. Adv. Phys. X 2020, 5, 1801354. [Google Scholar] [CrossRef] [Scilit]
- Yokoyama, M.; Maassberg, H.; Beidler, C.D.; Tribaldos, V.; Ida, K.; Castejón, F.; Estrada, T.; Fujisawa, A.; Minami, T.; Shimozuma, T.; et al. Common Features of Core Electron-Root Confinement in Helical Devices. Fusion Sci. Technol. 2006, 50, 327–342. [Google Scholar] [CrossRef] [Scilit][Green Version]
- García-Cortés, I.; López-Bruna, D.; Tabarés, F.L.; Estrada, T.; Medina, F.; the TJ-II Team. Spontaneous improvement of TJ-II plasmas confinement. Plasma Phys. Control. Fusion 2002, 44, 1639. [Google Scholar] [CrossRef] [Scilit]
- Hidalgo, C.; Pedrosa, M.; Sánchez, E.; Gonçalves, B.; Alonso, J.; Calderón, E.; Chmyga, A.; Dreval, N.; Eliseev, L.; Estrada, T.; et al. Physics of sheared flow development in the boundary of fusion plasmas. Plasma Phys. Control. Fusion 2006, 48, S169. [Google Scholar] [CrossRef] [Scilit]
- Pedrosa, M.; Hidalgo, C.; Calderón, E.; Estrada, T.; Fernández, A.; Herranz, J.; Pastor, I.; the TJ-II Team. Threshold for sheared flow and turbulence development in the TJ-II stellarator. Plasma Phys. Control. Fusion 2005, 47, 777. [Google Scholar] [CrossRef] [Scilit]
- Pedrosa, M.; Carreras, B.; Hidalgo, C.; Silva, C.; Hron, M.; García, L.; Alonso, J.; Calvo, I.; de Pablos, J.; Stöckel, J. Sheared flows and turbulence in fusion plasmas. Plasma Phys. Control. Fusion 2007, 49, B303. [Google Scholar] [CrossRef] [Scilit]
- Pedrosa, M.; Silva, C.; Hidalgo, C.; Carreras, B.; Orozco, R.; Carralero, D.; the TJ-II Team. Evidence of Long-Distance Correlation of Fluctuations during Edge Transitions to Improved-Confinement Regimes in the TJ-II Stellarator. Phys. Rev. Lett. 2008, 100, 215003. [Google Scholar] [CrossRef] [Scilit] [PubMed]
- Estrada, T.; Happel, T.; Eliseev, L.; López-Bruna, D.; Ascasíbar, E.; Blanco, E.; Cupido, L.; Fontdecaba, J.; Hidalgo, C.; Jiménez-Gómez, R.; et al. Sheared flows and transition to improved confinement regime in the TJ-II stellarator. Plasma Phys. Control. Fusion 2009, 51, 124015. [Google Scholar] [CrossRef] [Scilit]
- Hidalgo, C.; Pedrosa, M.; García, L.; Ware, A. Experimental evidence of coupling between sheared-flow development and an increase in the level of turbulence in the TJ-II stellarator. Phys. Rev. E 2004, 70, 067402. [Google Scholar] [CrossRef] [Scilit] [PubMed]
- Silva, C.; Goncalves, B.; Pedrosa, M.A.; Hidalgo, C.; McCarthy, K.; Calderon, E.; Herranz, J.; Pastor, I.; Orozco, O. Transport and fluctuations during electrode biasing on TJ-II. Czech. J. Phys. 2005, 55, 1589. [Google Scholar] [CrossRef] [Scilit]
- van Milligen, B.; Pedrosa, M.; Hidalgo, C.; Carreras, B.; Estrada, T.; Alonso, J.; de Pablos, J.; Melnikov, A.; Krupnik, L.; Eliseev, L.; et al. The dynamics of the formation of the edge particle transport barrier at TJ-II. Nucl. Fusion 2011, 51, 113002. [Google Scholar] [CrossRef] [Scilit]
- Sánchez, J.; Acedo, M.; Alonso, A.; Alonso, J.; Alvarez, P.; de Aragón, F.; Ascasíbar, E.; Baciero, A.; Balbín, R.; Barrera, L.; et al. Overview of TJ-II experiments. Nucl. Fusion 2007, 47, S677. [Google Scholar] [CrossRef] [Scilit]
- Alvarez, A.A.; van Milligen, B.P.; Voldiner, I.; Caldas, I.L.; Guimarães-Filho, Z.O.; Kozachok, O.S.; Chmyga, O.O.; the TJ-II Team. Edge Turbulence Dynamics Across Electron–Ion Root Transitions During ECRH Modulation Experiments in the TJ-II Stellarator. Plasma Phys. Control. Fusion 2026, 68, 065019. [Google Scholar] [CrossRef] [Scilit]
- Melnikov, A.; Krupnik, L.; Eliseev, L.; Barcala, J.; Bravo, A.; Chmyga, A.; Deshko, G.; Drabinskij, M.; Hidalgo, C.; Khabanov, P.; et al. Heavy ion beam probing—Diagnostics to study potential and turbulence in toroidal plasmas. Nucl. Fusion 2017, 57, 072004. [Google Scholar] [CrossRef] [Scilit]
- Melnikov, A.V.; Krupnik, L.I.; Ascasibar, E.; Cappa, A.; Chmyga, A.A.; Deshko, G.N.; Drabinskij, M.A.; Eliseev, L.G.; Hidalgo, C.; Khabanov, P.O.; et al. ECRH effect on the electric potential and turbulence in the TJ-II stellarator and T-10 tokamak plasmas. Plasma Phys. Control. Fusion 2018, 60, 084008. [Google Scholar] [CrossRef] [Scilit]
- Shimizu, A.; Ido, T.; Nishiura, M.; Makino, R.; Yokoyama, M.; Takahashi, H.; Igami, H.; Yoshimura, Y.; Kubo, S.; Shimozuma, T.; et al. Bifurcation-Like Behavior of Electrostatic Potential in LHD. Plasma Fusion Res. 2013, 8, 2402122. [Google Scholar] [CrossRef] [Scilit][Green Version]
- Fujisawa, A.; Iguchi, H.; Sanuki, H.; Itoh, K.; Lee, S.; Hamada, Y.; Kubo, S.; Idei, H.; Crowley, T.P.; Akiyama, R.; et al. Dynamic Behavior of Potential in the Plasma Core of the CHS Heliotron/Torsatron. Phys. Rev. Lett. 1997, 79, 1054–1057. [Google Scholar] [CrossRef] [Scilit]
- Harris, J.; Cantrell, J.; Hender, T.; Carreras, B.; Morris, R. A flexible heliac configuration. Nucl. Fusion 1985, 25, 623. [Google Scholar] [CrossRef] [Scilit]
- Pedrosa, M.; López-Sánchez, A.; Hidalgo, C.; Montoro, A.; Gabriel, A.; Encabo, J.; de la Gama, J.; Martínez, L.; Sánchez, E.; Pérez, R.; et al. Fast movable remotely controlled Langmuir probe system. Rev. Sci. Instrum. 1999, 70, 415. [Google Scholar] [CrossRef] [Scilit]
- de la Luna, E.; Sánchez, J.; Tribaldos, V.; Estrada, T. Multichannel electron cyclotron emission radiometry in TJ-II stellarator. Rev. Sci. Instrum. 2001, 72, 379. [Google Scholar] [CrossRef] [Scilit]
- Barth, C.; Pijper, F.; van der Meiden, H.; Herranz, J.; Pastor, I. High-resolution multiposition Thomson scattering for the TJ-II stellarator. Rev. Sci. Instrum. 1999, 70, 763. [Google Scholar] [CrossRef] [Scilit]
- Martínez-Fernández, J.; Cappa, Á.; Tereshchenko, M.; Tolkachev, A.; Ros, A.; Catalán, G. High power characterisation of the ECRH transmission lines and power deposition calculations in the TJ-II stellarator. Fusion Eng. Des. 2020, 161, 112065. [Google Scholar] [CrossRef] [Scilit]
- Khabanov, P.; Eliseev, L.; Melnikov, A.; Drabinskiy, M.; Hidalgo, C.; Kharchev, N.; Chmyga, A.; Kozachek, A.; Pastor, I.; de Pablos, J.; et al. Density profile reconstruction using HIBP in ECRH plasmas in the TJ-II stellarator. J. Instrum. 2019, 14, C09033. [Google Scholar] [CrossRef] [Scilit]
- Makino, R.; Kubo, S.; Ido, T.; Tanaka, K.; Shimozuma, T.; Yoshimura, Y.; Nishiura, M.; Igami, H.; Takahashi, H.; Shimizu, A.; et al. Local and Fast Density Pump-out by ECRH in the LHD. Plasma Fusion Res. 2013, 8, 2402115. [Google Scholar] [CrossRef] [Scilit][Green Version]
- Castejón, F.; Eguilior, S.; Calvo, I.; López-Bruna, D.; García-Regaña, J.M. Estimation of pump-out and positive radial electric field created by electron cyclotron resonance heating in magnetic confinement devices. Phys. Plasmas 2008, 15, 012504. [Google Scholar] [CrossRef] [Scilit]
- Maaßberg, H.; Beidler, C.D.; Gasparino, U.; Romé, M.; Team, W.A.; Dyabilin, K.S.; Marushchenko, N.B.; Murakami, S. The neoclassical “Electron Root” feature in the Wendelstein-7-AS stellarator. Phys. Plasmas 2000, 7, 295–311. [Google Scholar] [CrossRef] [Scilit]
Disclaimer/Publisher’s Note: The statements, opinions and data contained in all publications are solely those of the individual author(s) and contributor(s) and not of MDPI and/or the editor(s). MDPI and/or the editor(s) disclaim responsibility for any injury to people or property resulting from any ideas, methods, instructions or products referred to in the content. |
© 2026 by the authors. Licensee MDPI, Basel, Switzerland. This article is an open access article distributed under the terms and conditions of the Creative Commons Attribution (CC BY) license.