


Optical Properties of Five Esthetic Ceramic Materials Used for Monolithic Restorations: A Comparative In Vitro Study


Abstract
1. Introduction
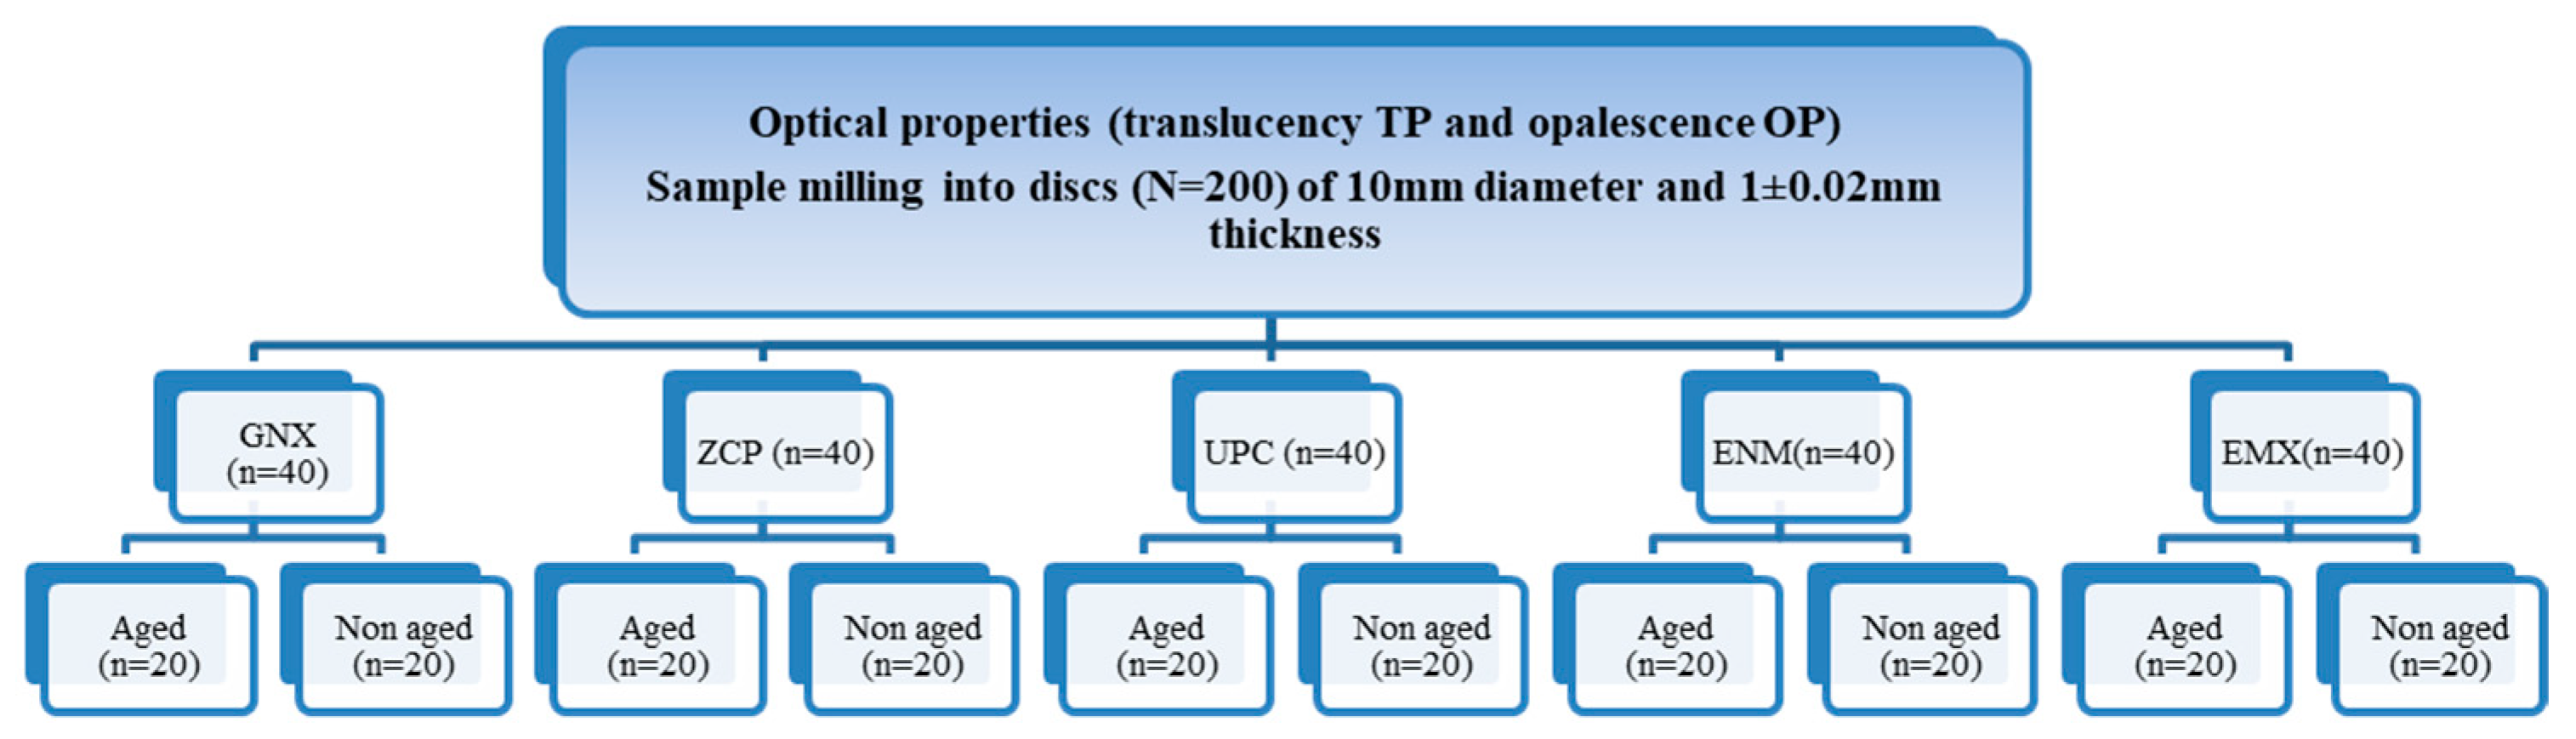
2. Materials and Methods
2.1. Aging Procedure
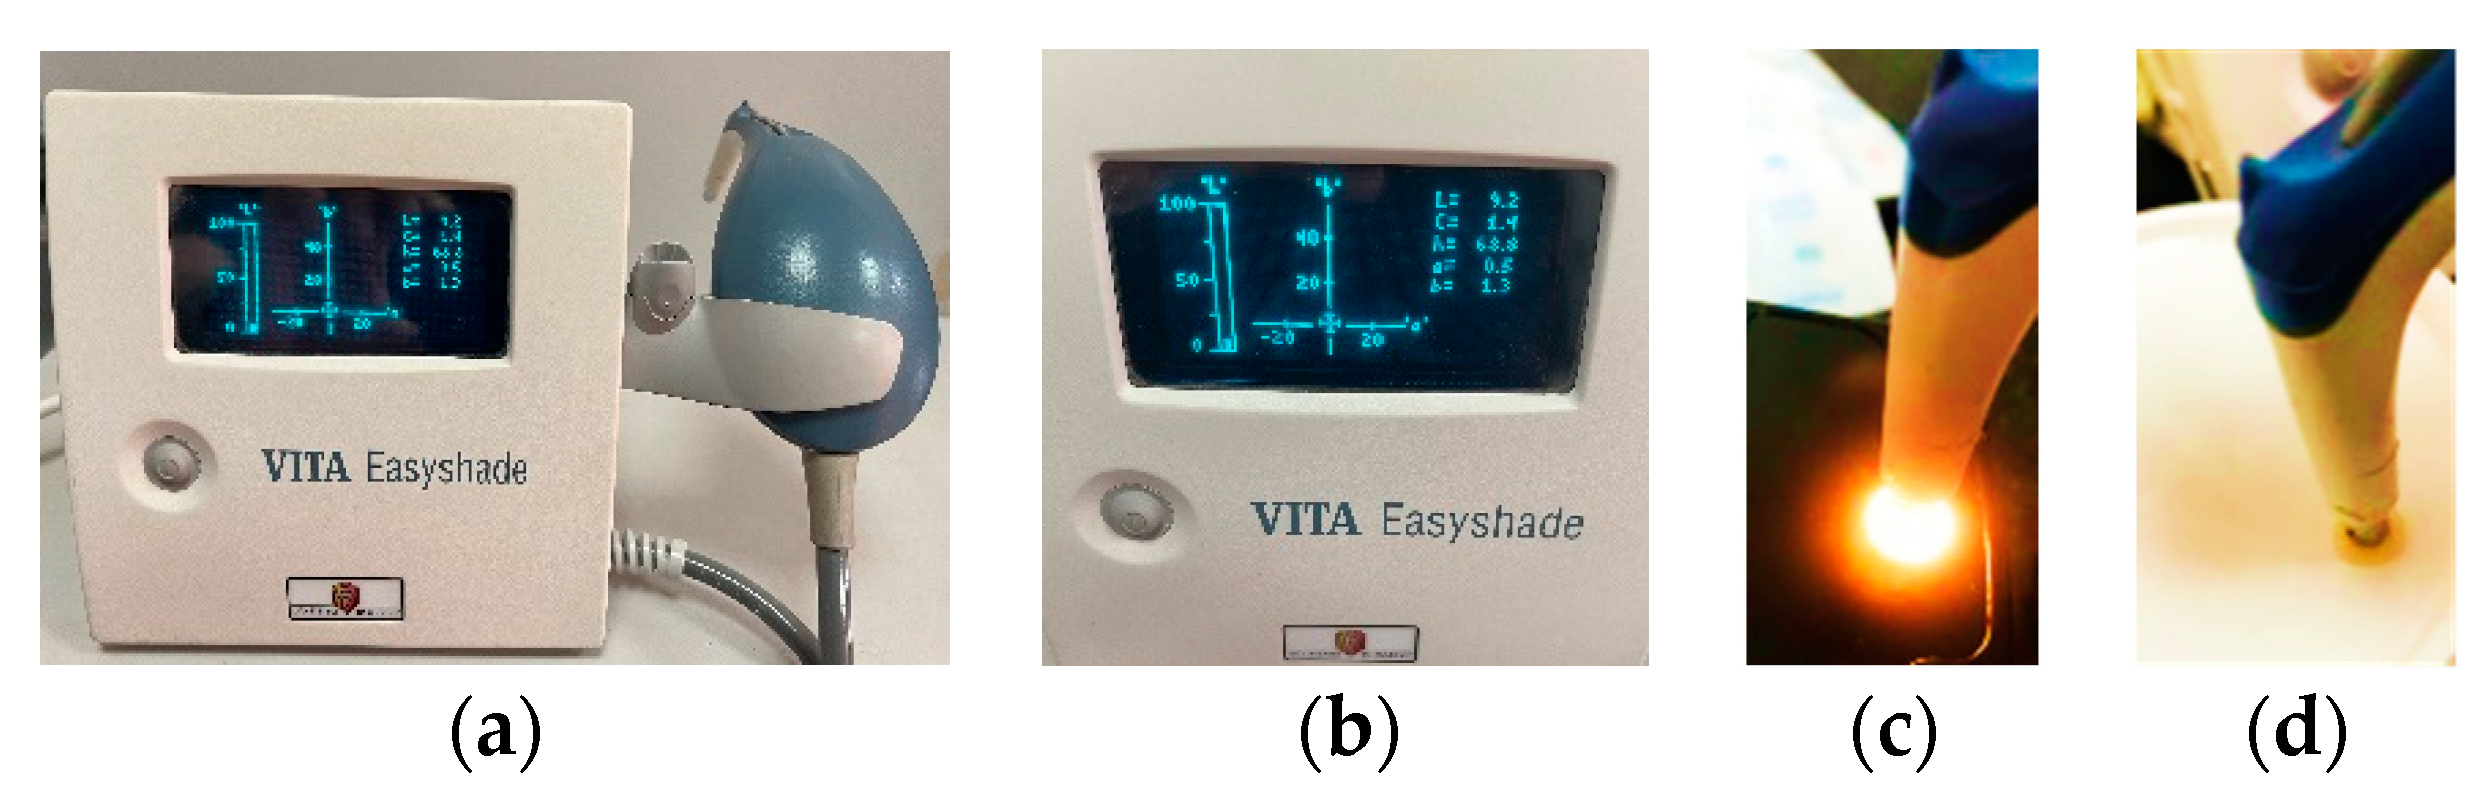
2.2. Translucency Parameter Measurement
2.3. Opalescence Parameter Measurement
2.4. Shade Evaluation
3. Results
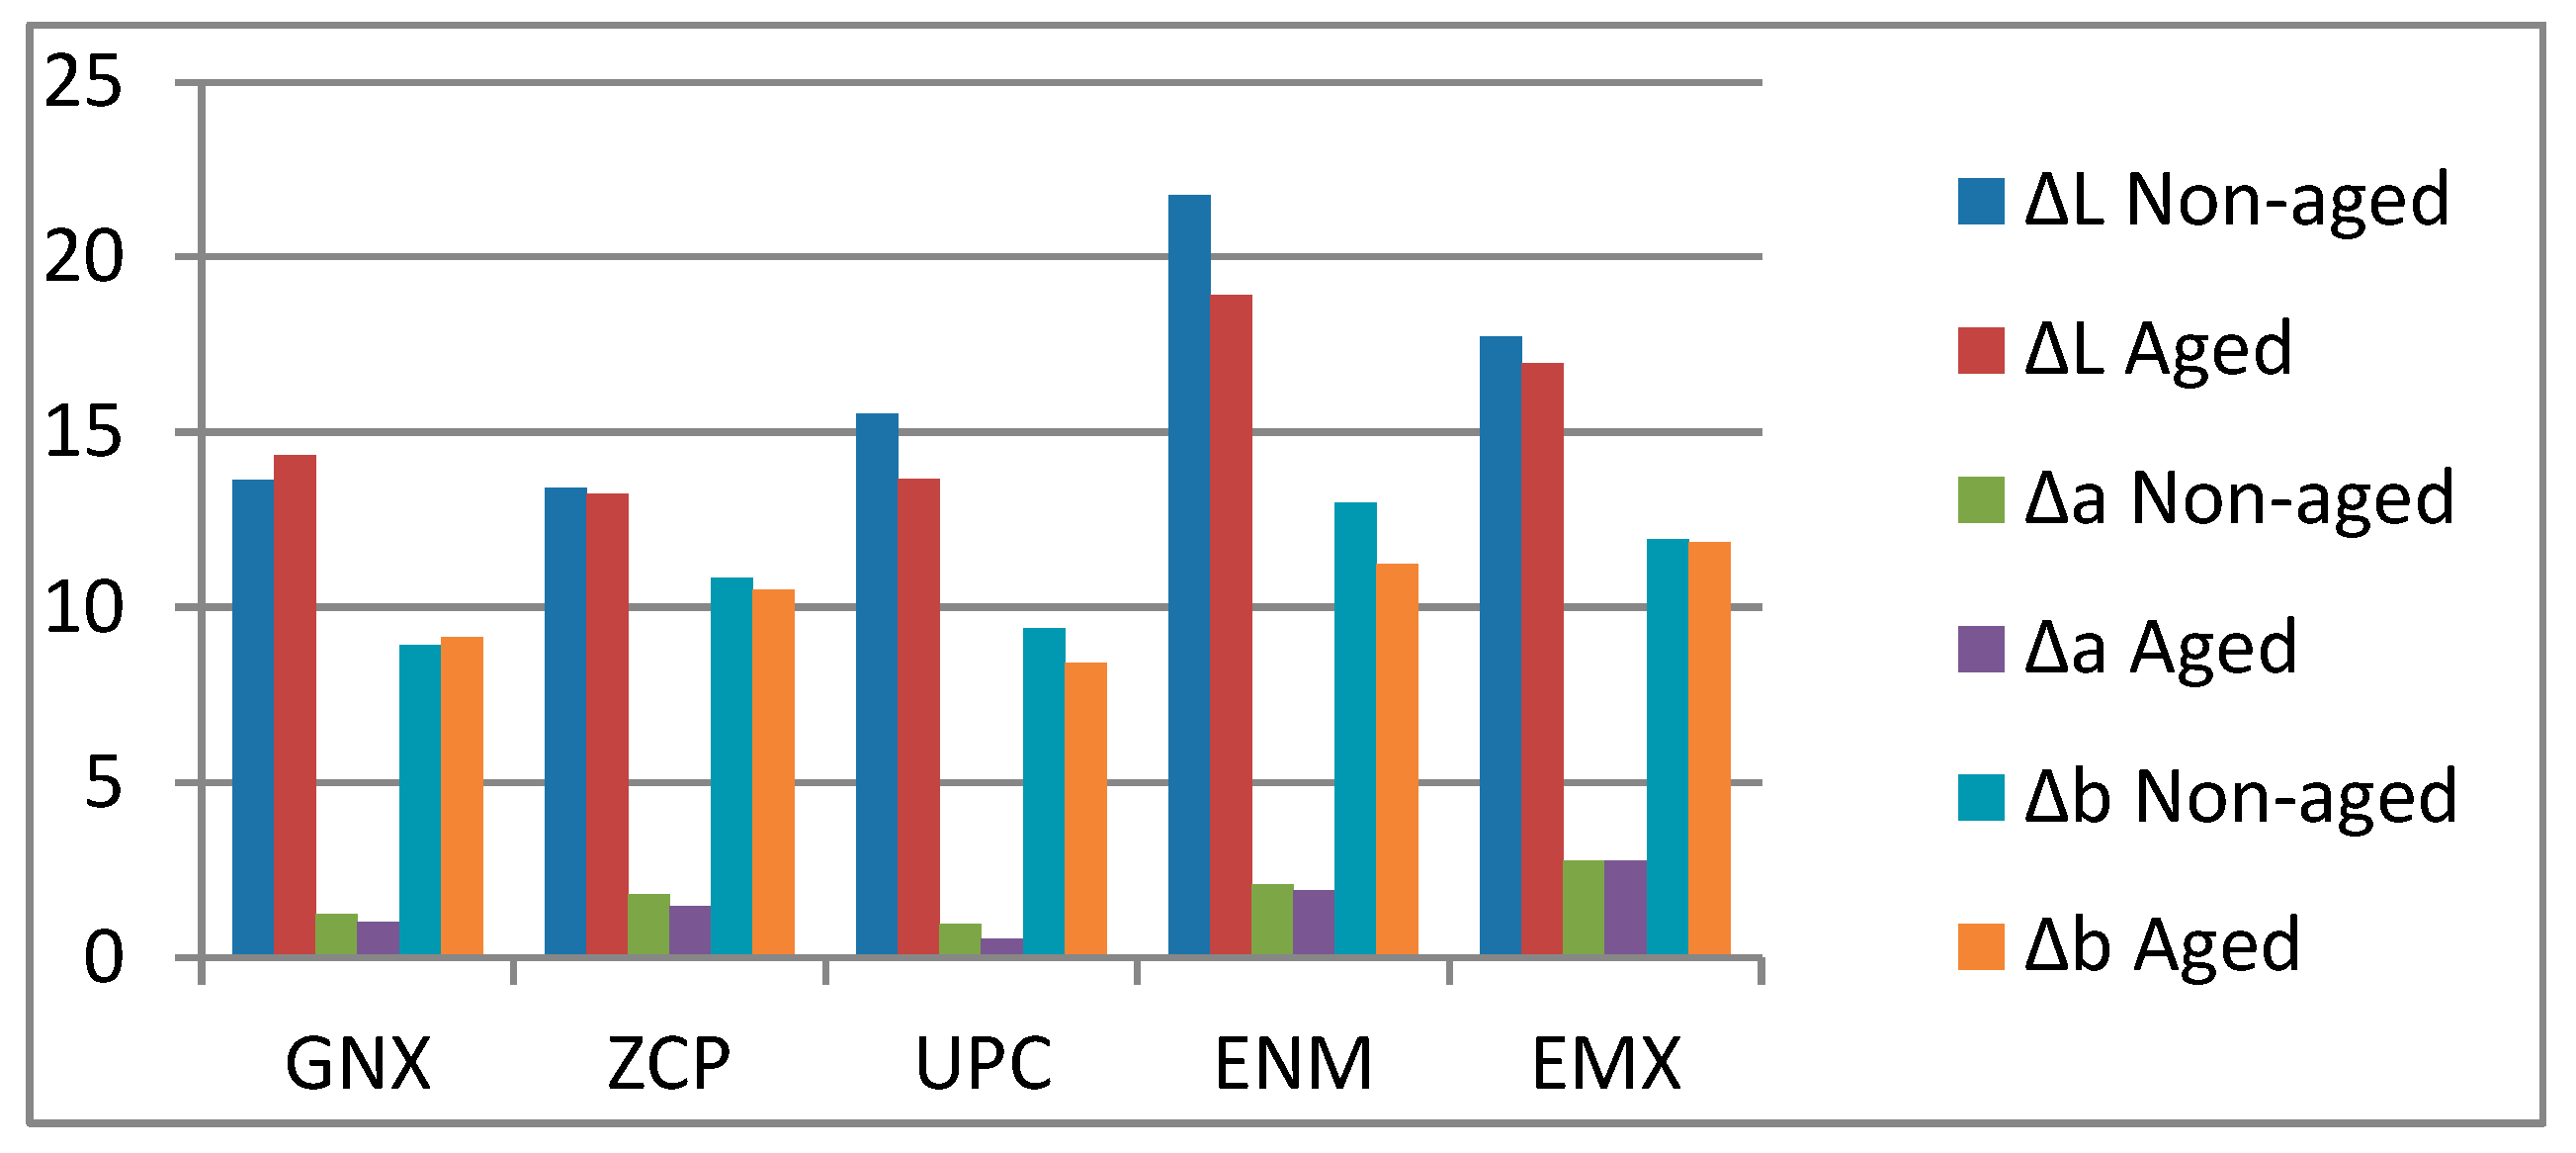
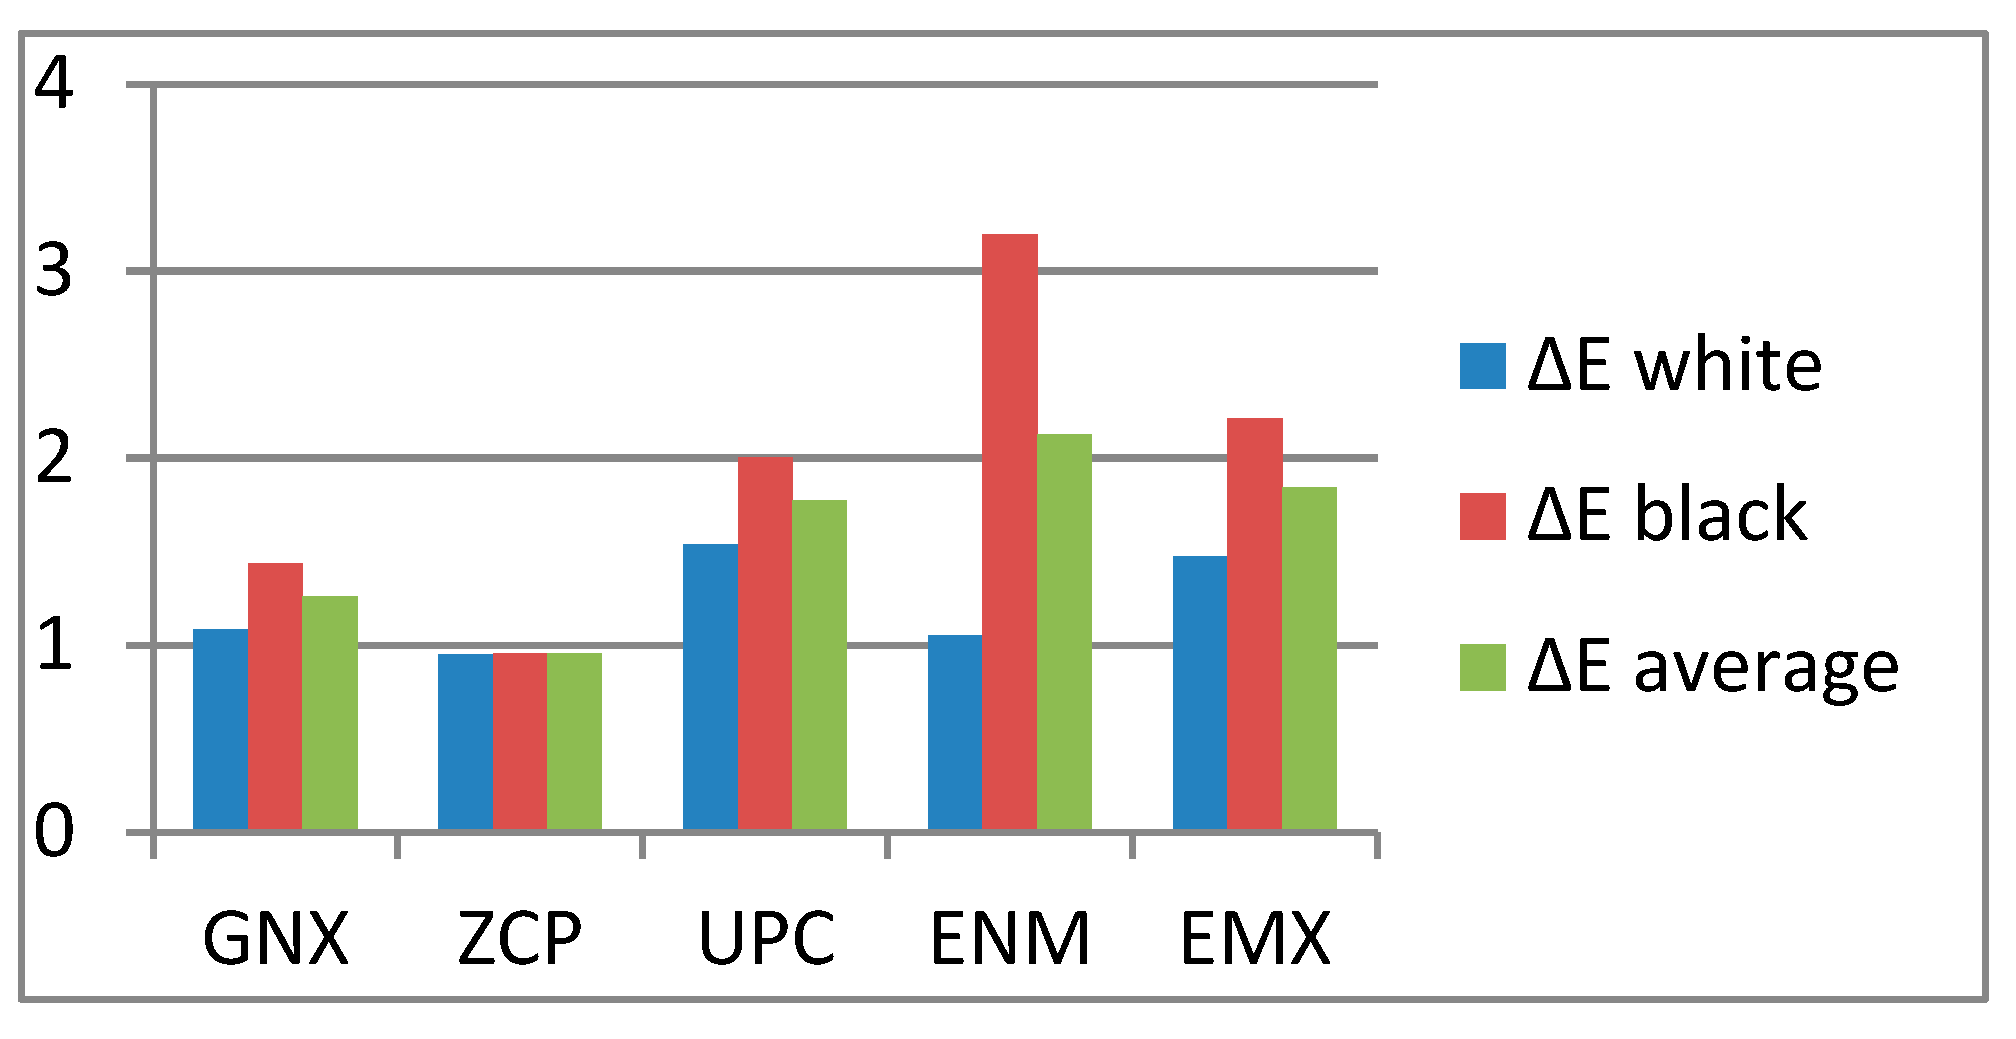
3.1. Shade Stability
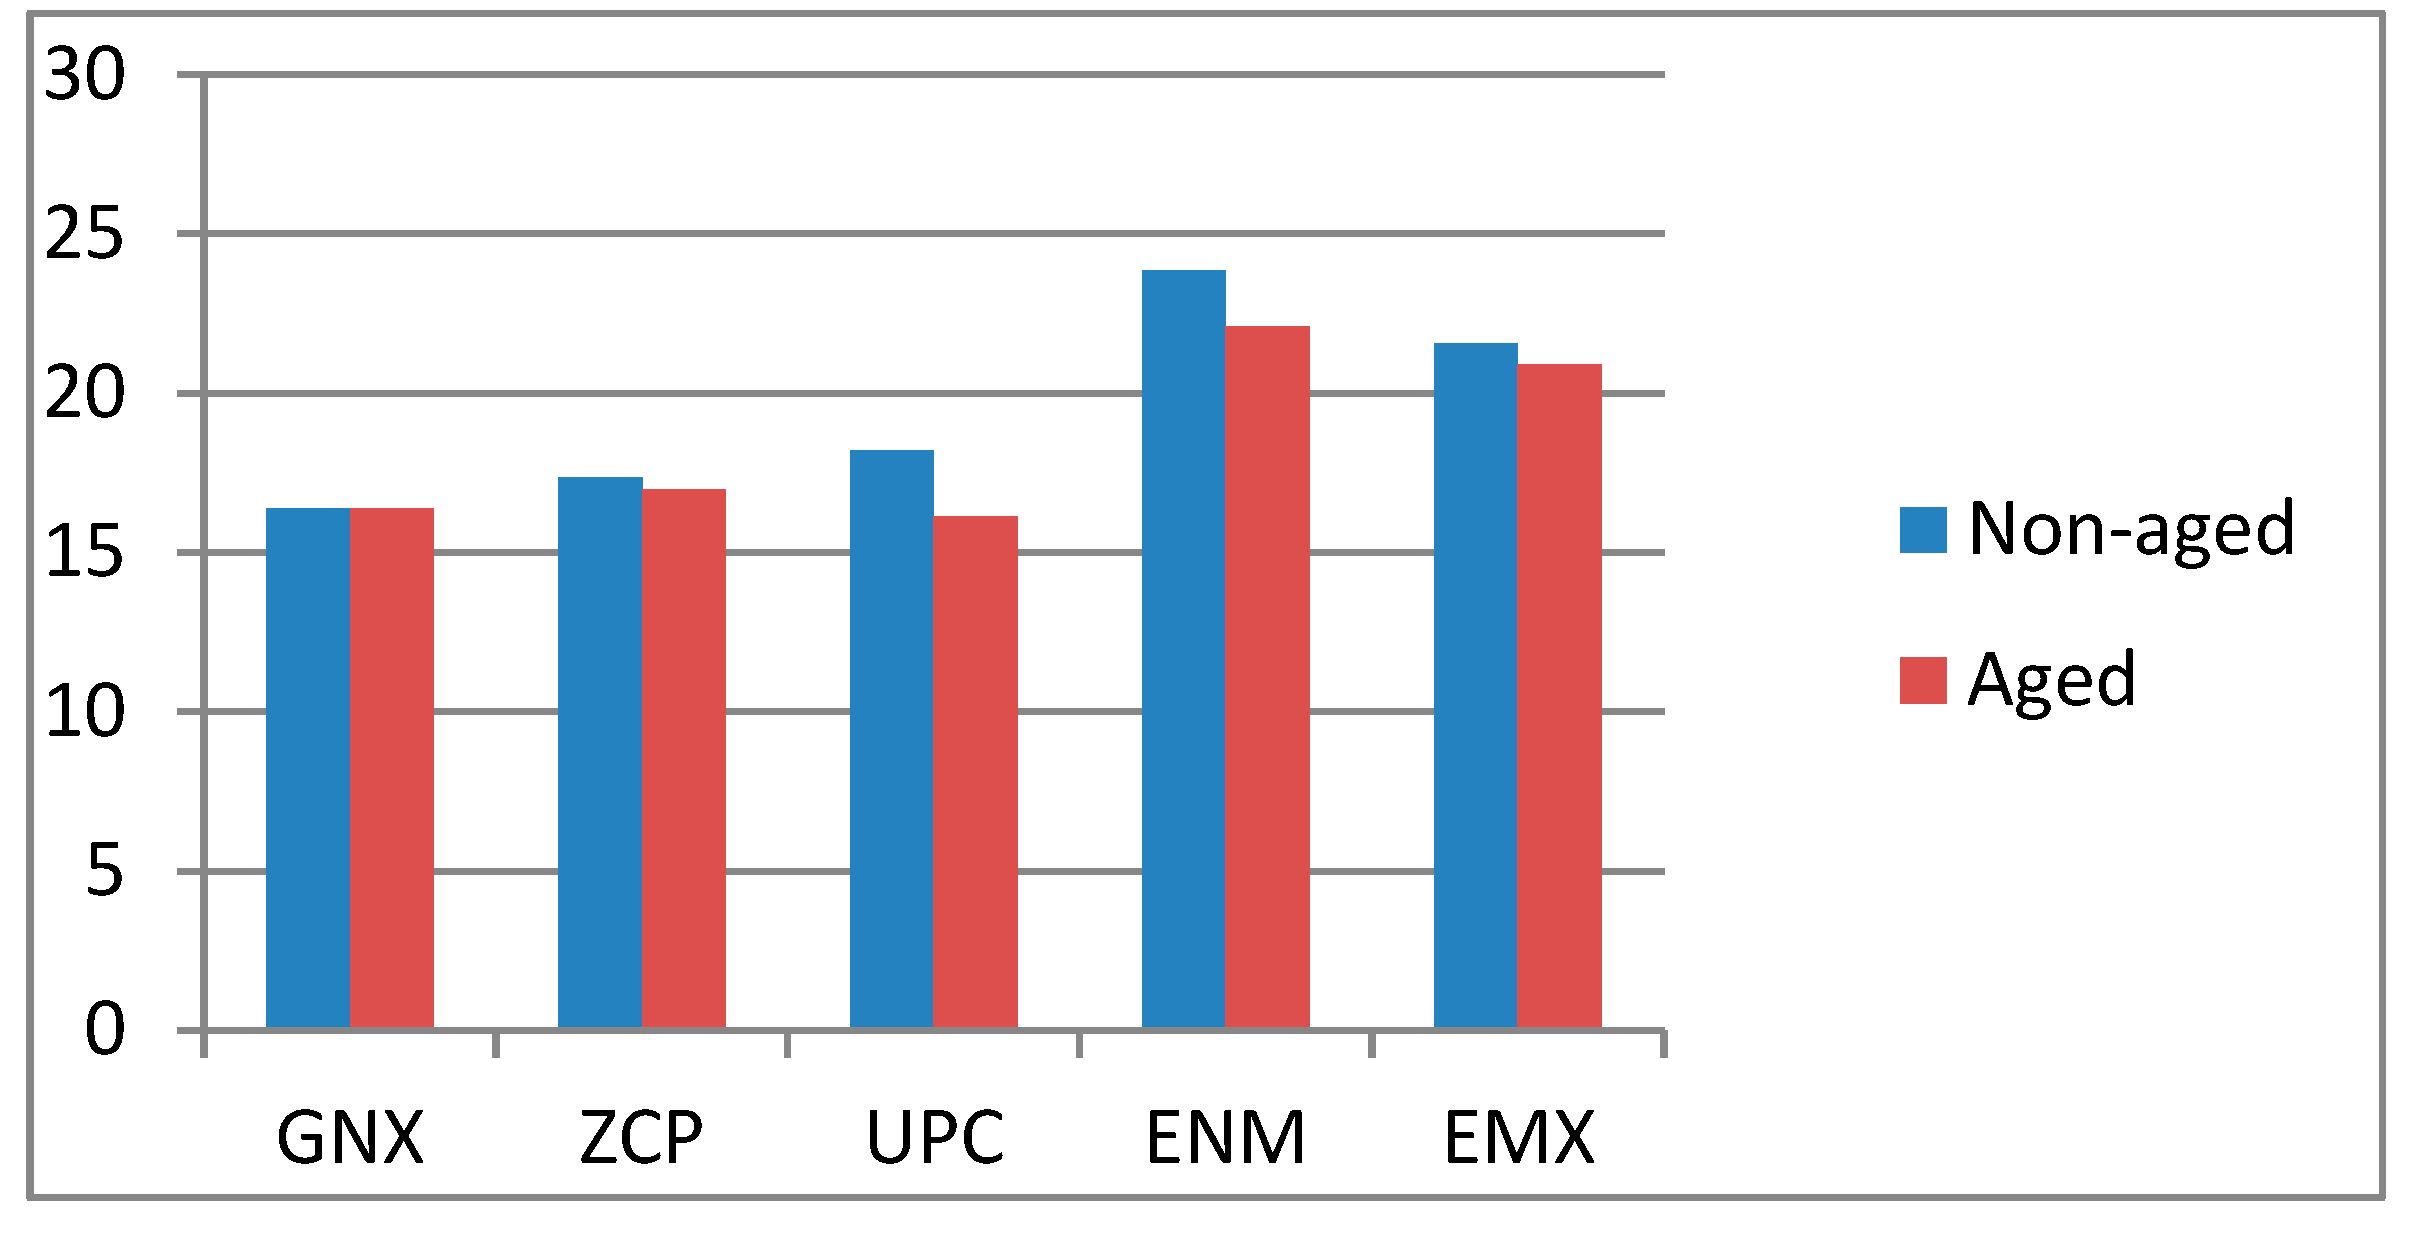
3.2. TP Evaluation
- TP for the non-aged groups:
- TP for the aged groups:
- -
- Comparison of TP values within same material group; non-aged and aged
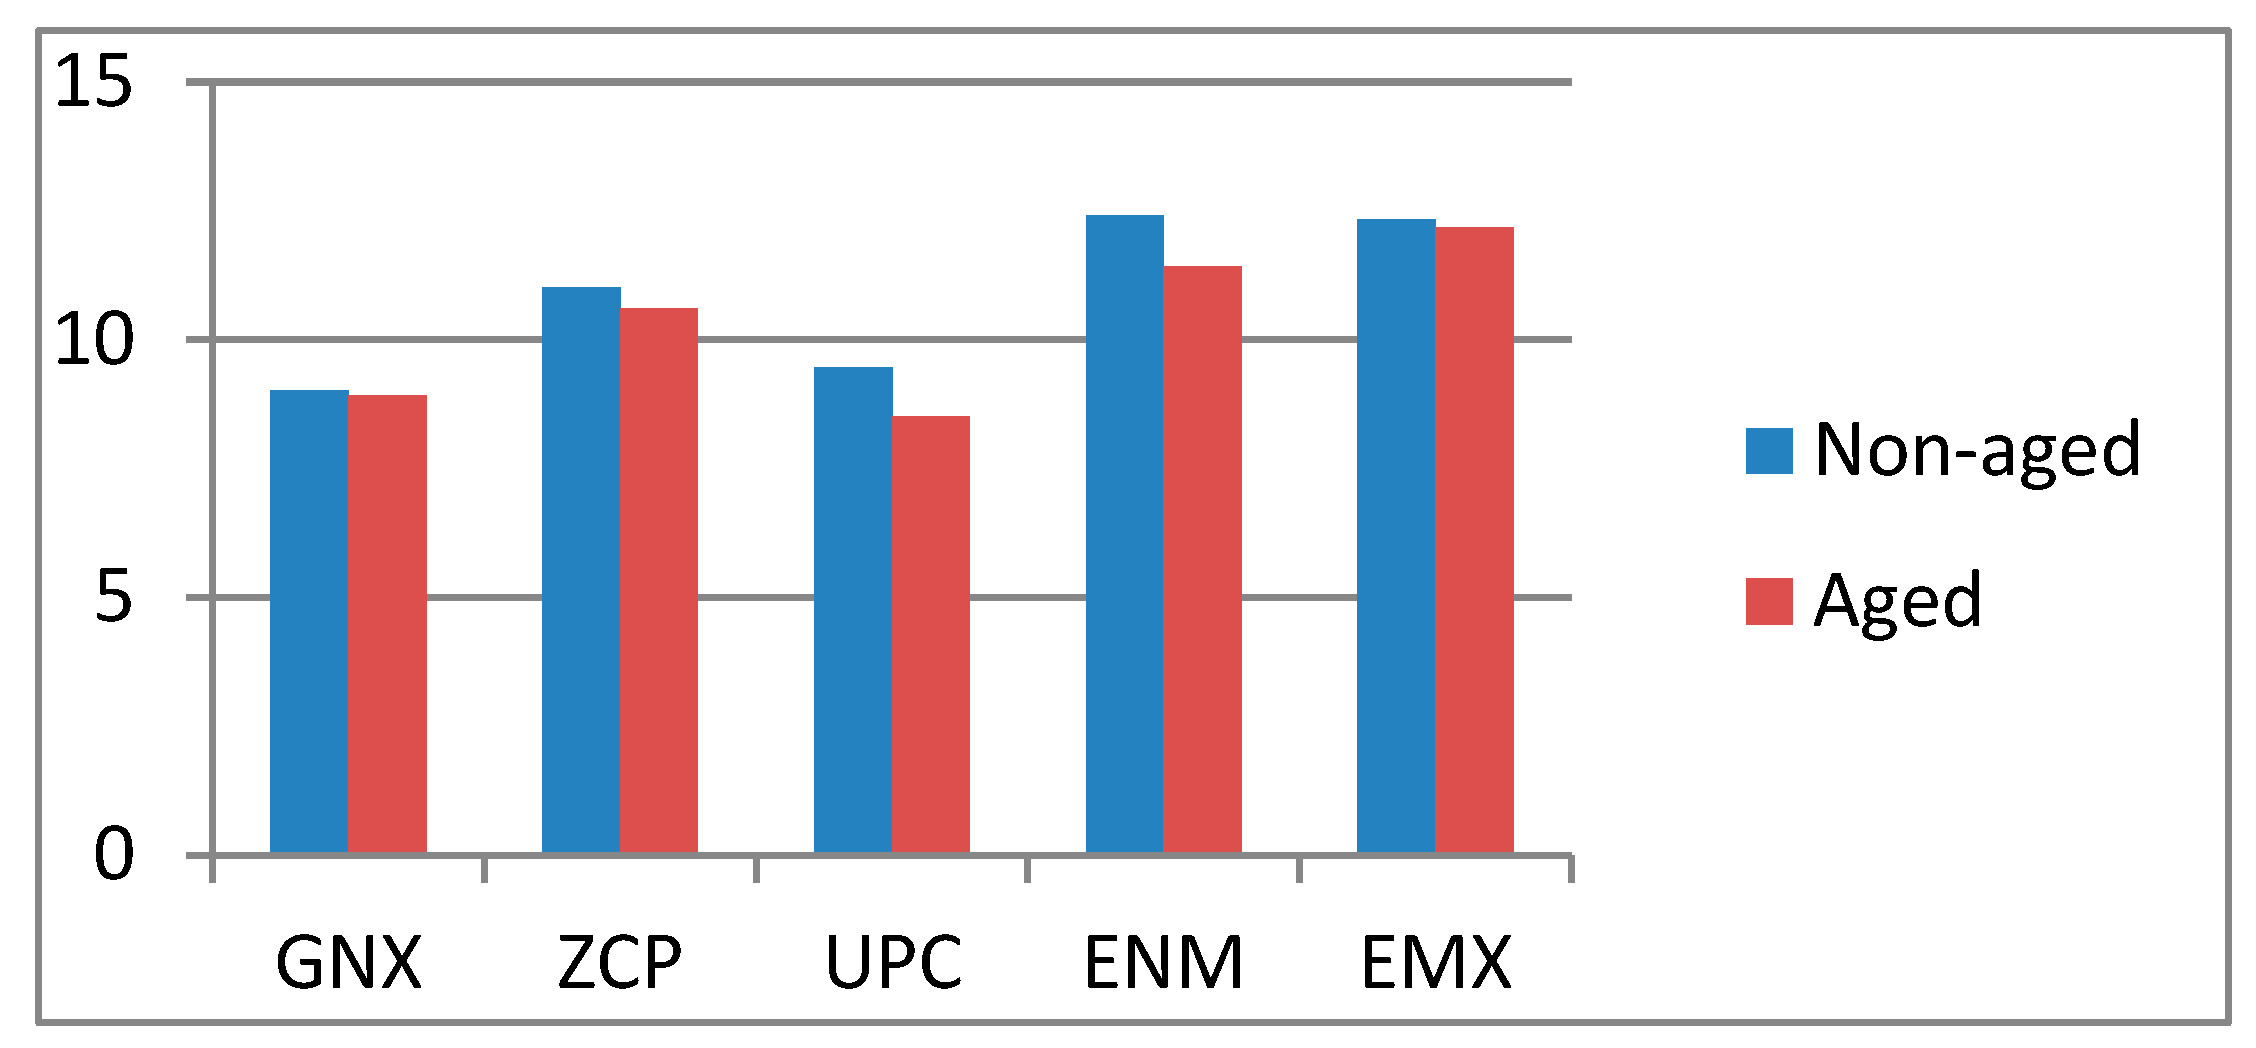
3.3. OP Evaluation
- OP for the non-aged groups:
- OP for the aged groups:
- -
- Comparison of OP values within same material group; non-aged and aged
4. Discussion
4.1. Shade Stability
4.2. Translucency Parameter (TP)
4.3. Opalescence Parameter (OP)
4.4. Limitations
5. Conclusions
- At baselines, the lithium disilicate ceramic (EMX) showed higher optical properties (translucency and opalescence) than the monolithic zirconia groups (GNX, ZCP, and UPC), while the hybrid ceramic (ENM) showed the highest optical properties among all groups.
- All groups showed to some extent a change in the optical properties (translucency and opalescence) after aging, but that was within the clinical acceptability range.
Author Contributions
Funding
Institutional Review Board Statement
Informed Consent Statement
Data Availability Statement
Conflicts of Interest
References
- Beuer, F.; Schweiger, J.; Eichberger, M.; Kappert, H.F.; Gernet, W.; Edelhoff, D. High-Strength CAD/CAM-Fabricated Veneering Material Sintered to Zirconia Copings—A New Fabrication Mode for All-Ceramic Restorations. Dent. Mater. 2009, 25, 121–128. [Google Scholar] [CrossRef]
- Drummond, J.; King, T.; Bapna, M.; Koperski, R. Mechanical Property Evaluation of Pressable Restorative Ceramics. Dent. Mater. 2000, 16, 226–233. [Google Scholar] [CrossRef]
- Yip, K.H.-K.; Smales, R.J.; Kaidonis, J.A. Differential Wear of Teeth and Restorative Materials: Clinical Implications. Int. J. Prosthodont. 2004, 17, 350–356. [Google Scholar]
- Rosentritt, M.; Sikora, M.; Behr, M.; Handel, G. In Vitro Fracture Resistance and Marginal Adaptation of Metallic and Tooth-Coloured Post Systems. J. Oral Rehabil. 2004, 31, 675–681. [Google Scholar] [CrossRef]
- Kisi, E.H.; Howard, C. Crystal Structures of Zirconia Phases and Their Inter-Relation. In Key Engineering Materials; Trans Tech Publications Ltd.: Bäch, Switzerland, 1998; Volume 153, pp. 1–36. [Google Scholar]
- Denry, I.; Kelly, J.R. State of The Art of Zirconia for Dental Applications. Dent. Mater. 2008, 24, 299–307. [Google Scholar] [CrossRef] [PubMed]
- Ruff, O. Ceramics of Highly Refractory Materials: I. Z. Anorg. Allg. Chem. 1929, 180, 19–41. [Google Scholar] [CrossRef]
- Zhang, Y. Making Yttria-Stabilized Tetragonal Zirconia Translucent. Dent. Mater. 2014, 30, 1195–1203. [Google Scholar] [CrossRef]
- Lambert, H.; Durand, J.-C.; Jacquot, B.; Fages, M. Dental Biomaterials for Chairside CAD/CAM: State of The Art. J. Adv. Prosthodont. 2017, 9, 486–495. [Google Scholar] [CrossRef] [PubMed]
- Mainjot, A.; Dupont, N.; Oudkerk, J.; Dewael, T.; Sadoun, M. From Artisanal to CAD-CAM Blocks: State of The Art of Indirect Composites. J. Dent. Res. 2016, 95, 487–495. [Google Scholar] [CrossRef] [PubMed]
- Wiegand, A.; Stucki, L.; Hoffmann, R.; Attin, T.; Stawarczyk, B. Repairability of CAD/CAM High-Density PMMA and Composite-Based Polymers. Clin. Oral Investig. 2015, 19, 2007–2013. [Google Scholar] [CrossRef] [PubMed]
- Ruse, N.; Sadoun, M. Resin-Composite Blocks for Dental CAD/CAM Applications. J. Dent. Res. 2014, 93, 1232–1234. [Google Scholar] [CrossRef] [PubMed]
- Sato, T.; Ohtaki, S.; Endo, T.; Shimada, M. Transformation of Yttria-Doped Tetragonal ZrO2 Polycrystals by Annealing under Controlled Humidity Conditions. J. Am. Ceram. Soc. 1985, 68, 320–322. [Google Scholar] [CrossRef]
- Lawson, S. Environmental Degradation of Zirconia Ceramics. J. Eur. Ceram. Soc. 1995, 15, 485–502. [Google Scholar] [CrossRef]
- Cattani-Lorente, M.; Scherrer, S.S.; Ammann, P.; Jobin, M.; Wiskott, H.A. Low Temperature Degradation of a Y-TZP Dental Ceramic. Acta Biomater. 2011, 7, 858–865. [Google Scholar] [CrossRef]
- Amat, N.F.; Muchtar, A.; Amril, M.S.; Ghazali, M.J.; Yahaya, N. Effect of Sintering Temperature on the Aging Resistance and Mechanical Properties of Monolithic Zirconia. J. Mater. Res. Technol. 2019, 8, 1092–1101. [Google Scholar] [CrossRef]
- Watanabe, W.; Iiu, S.; Fukuura, I. Aging Behavior of Y-TZP. In Science and Technology of Zirconia II; American Ceramic Society, Inc.: Columbus, OH, USA, 1983; Volume 4, pp. 391–398. [Google Scholar]
- Kelly, J.R.; Nishimura, I.; Campbell, S.D. Ceramics in Dentistry: Historical Roots and Current Perspectives. J. Prosthet. Dent. 1996, 75, 18–32. [Google Scholar] [CrossRef]
- Brodbelt, R.; O’brien, W.; Fan, P. Translucency of Dental Porcelains. J. Dent. Res. 1980, 59, 70–75. [Google Scholar] [CrossRef]
- Chaiyabutr, Y.; Kois, J.C.; LeBeau, D.; Nunokawa, G. Effect of Abutment Tooth Color, Cement Color, and Ceramic Thickness on the Resulting Optical Color of a CAD/CAM Glass-Ceramic Lithium Disilicate-Reinforced Crown. J. Prosthet. Dent. 2011, 105, 83–90. [Google Scholar] [CrossRef]
- Wang, F.; Takahashi, H.; Iwasaki, N. Translucency of Dental Ceramics with Different Thicknesses. J. Prosthet. Dent. 2013, 110, 14–20. [Google Scholar] [CrossRef]
- Ilie, N.; Hickel, R. Correlation between Ceramics Translucency and Polymerization Efficiency Through Ceramics. Dent. Mater. 2008, 24, 908–914. [Google Scholar] [CrossRef]
- Heffernan, M.J.; Aquilino, S.A.; Diaz-Arnold, A.M.; Haselton, D.R.; Stanford, C.M.; Vargas, M.A. Relative Translucency of Six All-Ceramic Systems. Part I: Core Materials. J. Prosthet. Dent. 2002, 88, 4–9. [Google Scholar] [CrossRef] [PubMed]
- Yu, B.; Ahn, J.-S.; Lee, Y.-K. Measurement of Translucency of Tooth Enamel and Dentin. Acta Odontol. Scand. 2009, 67, 57–64. [Google Scholar] [CrossRef] [PubMed]
- Ozturk, O.; Uludag, B.; Usumez, A.; Sahin, V.; Celik, G. The Effect of Ceramic Thickness and Number of Firings on The Color of Two All-Ceramic Systems. J. Prosthet. Dent. 2008, 100, 99–106. [Google Scholar] [CrossRef]
- Chu, F.C.; Chow, T.W.; Chai, J. Contrast Ratios and Masking Ability of Three Types of Ceramic Veneers. J. Prosthet. Dent. 2007, 98, 359–364. [Google Scholar] [CrossRef]
- Primus, C.M.; Chu, C.C.; Shelby, J.E.; Buldrini, E.; Heckle, C.E. Opalescence of Dental Porcelain Enamels. Quintessence Int. 2002, 33, 439–449. [Google Scholar]
- Fondriest, J. Shade Matching in Restorative Dentistry: The Science and Strategies. Int. J. Periodontics Restor. Dent. 2003, 23, 467–480. [Google Scholar] [CrossRef]
- Lee, Y.-K.; Lu, H.; Powers, J.M. Measurement of Opalescence of Resin Composites. Dent. Mater. 2005, 21, 1068–1074. [Google Scholar] [CrossRef]
- Cho, M.-S.; Yu, B.; Lee, Y.-K. Opalescence of All-Ceramic Core and Veneer Materials. Dent. Mater. 2009, 25, 695–702. [Google Scholar] [CrossRef]
- Vanini, L. Light and Color in Anterior Composite Restorations. Pract. Periodontics Aesthetic Dent. 1996, 8, 673–682. [Google Scholar]
- Monteiro, P.; Brito, P.; Pereira, J.; Alves, R. The Importance of the Optical Properties in Dental Silica-Based Ceramics. J. Calif. Dent. Assoc. 2012, 40, 476–481. [Google Scholar]
- Ward, M.; Tate, W.; Powers, J. Surface Roughness of Opalescent Porcelains after Polishing. Oper. Dent. 1995, 20, 106–110. [Google Scholar] [PubMed]
- Lee, Y.-K. Opalescence of Human Teeth and Dental Esthetic Restorative Materials. Dent. Mater. J. 2016, 35, 845–854. [Google Scholar] [CrossRef] [PubMed]
- Delta E, Delta H, Delta T: What Does It Mean? Available online: https://help.efi.com/fieryxf/KnowledgeBase/color/Delta%20E_H_T.pdf (accessed on 23 September 2022).
- Alshali, S.A.; Kazim, S.A.; Nageeb, R.; Almarshoud, H.S. Comparative Evaluation of the Translucency of Monolithic Zirconia. J. Contemp. Dent. Pract. 2020, 21, 51–55. [Google Scholar] [CrossRef] [PubMed]
- Kim, J.-H.; Oh, S.; Uhm, S.-H. Effect of The Crystallization Process on the Marginal and Internal Gaps of Lithium Disilicate CAD/CAM Crowns. BioMed Res. Int. 2016, 2016, 8635483. [Google Scholar] [CrossRef] [PubMed]
- Ziyad, T.A.; Abu-Naba’a, L.A.; Almohammed, S.N. Optical Properties of CAD-CAM Monolithic Systems Compared: Three Multi-Layered Zirconia and One Lithium Disilicate System. Heliyon 2021, 7, e08151. [Google Scholar] [CrossRef]
- Chevalier, J.; Gremillard, L.; Deville, S. Low-Temperature Degradation of Zirconia and Implications for Biomedical Implants. Annu. Rev. Mater. Res. 2007, 37, 1–32. [Google Scholar] [CrossRef]
- Zhang, F.; Inokoshi, M.; Batuk, M.; Hadermann, J.; Naert, I.; Van Meerbeek, B.; Vleugels, J. Strength, Toughness and Aging Stability of Highly-Translucent Y-TZP Ceramics for Dental Restorations. Dent. Mater. 2016, 32, 327–337. [Google Scholar] [CrossRef]
- Della Bona, A.; Nogueira, A.D.; Pecho, O.E. Optical Properties of CAD–CAM Ceramic Systems. J. Dent. 2014, 42, 1202–1209. [Google Scholar] [CrossRef]
- Yoshinari, M.; Dérand, T. Fracture Strength of All-Ceramic Crowns. Int. J. Prosthodont. 1994, 7, 329–338. [Google Scholar]
- Dapieve, K.S.; Silvestri, T.; Rippe, M.P.; Pereira, G.K.R.; Valandro, L.F. Mechanical Performance of Y-TZP Monolithic Ceramic after Grinding and Aging: Survival Estimates and Fatigue Strength. J. Mech. Behav. Biomed. Mater. 2018, 87, 288–295. [Google Scholar] [CrossRef]
- Pereira, G.; Muller, C.; Wandscher, V.; Rippe, M.; Kleverlaan, C.; Valandro, L. Comparison of Different Low-Temperature Aging Protocols: Its Effects on The Mechanical Behavior of Y-TZP Ceramics. J. Mech. Behav. Biomed. Mater. 2016, 100, 324–330. [Google Scholar] [CrossRef] [PubMed]
- Pereira, G.; Silvestri, T.; Amaral, M.; Rippe, M.; Kleverlaan, C.; Valandro, L. Fatigue Limit of Polycrystalline Zirconium Oxide Ceramics: Effect of Grinding and Low-Temperature Aging. J. Mech. Behav. Biomed. Mater. 2016, 100, 45–54. [Google Scholar] [CrossRef] [PubMed]
- Thompson, D. How to Use Color Spaces to Talk about Color. First Source Worldwide, LLC. 2017. Available online: http://www.fsw.cc/color-spaces/ (accessed on 15 February 2020).
- Judeh, A.; Al-Wahadni, A. A Comparison between Conventional Visual and Spectrophotometric Methods for Shade Selection. Quintessence Int. 2009, 40, 69–79. [Google Scholar]
- Schmitter, M.; Mueller, D.; Rues, S. In Vitro Chipping Behaviour of All-Ceramic Crowns with a Zirconia Framework and Feldspathic Veneering: Comparison of CAD/CAM-Produced Veneer with Manually Layered Veneer. J. Oral Rehabil. 2013, 40, 519–525. [Google Scholar] [CrossRef] [PubMed]
- Chevalier, J.; Cales, B.; Drouin, J.M. Low-Temperature Aging of Y-TZP Ceramics. J. Am. Ceram. Soc. 1999, 82, 2150–2154. [Google Scholar] [CrossRef]
- Bagis, B.; Turgut, S. Optical Properties of Current Ceramics Systems for Laminate Veneers. J. Dent. 2013, 41, 24–30. [Google Scholar] [CrossRef]
- Hamza, T.A.; Al-Baili, M.A.; Abdel-Aziz, M.H. Effect of Artificially Accelerated Aging on Margin Fit and Color Stability of Laminate Veneers. Stomatol. Dis. Sci. 2018, 2, 1. [Google Scholar] [CrossRef]
- Paravina, R.D.; Ontiveros, J.C.; Powers, J.M. Accelerated Aging Effects on Color and Translucency of Bleaching-Shade Composites. J. Esthet. Restor. Dent. 2004, 16, 117–126. [Google Scholar] [CrossRef]
- Johnston, W.; Kao, E. Assessment of Appearance Match by Visual Observatin and Clinical Colorimetry. J. Dent. Res. 1989, 68, 819–822. [Google Scholar] [CrossRef]
- Papageorgiou-Kyrana, A.; Kokoti, M.; Kontonasaki, E.; Koidis, P. Evaluation of Color Stability of Preshaded and Liquid-Shaded Monolithic Zirconia. J. Prosthet. Dent. 2018, 119, 467–472. [Google Scholar] [CrossRef]
- Johnston, W.M.; Ma, T.; Kienle, B.H. Translucency Parameter of Colorants for Maxillofacial Prostheses. Int. J. Prosthodont. 1995, 8, 79–86. [Google Scholar] [PubMed]
- Vichi, A.; Carrabba, M.; Paravina, R.; Ferrari, M. Translucency of Ceramic Materials for CEREC CAD/CAM System. J. Esthet. Restor. Dent. 2014, 26, 224–231. [Google Scholar] [CrossRef] [PubMed]
- Lee, Y.-K. Translucency of Human Teeth and Dental Restorative Materials and Its Clinical Relevance. J. Biomed. Opt. 2015, 20, 45002. [Google Scholar] [CrossRef]
- Lee, Y.-K. Influence of Scattering/Absorption Characteristics on the Color of Resin Composites. Dent. Mater. 2007, 23, 124–131. [Google Scholar] [CrossRef] [PubMed]
- Awad, D.; Stawarczyk, B.; Liebermann, A.; Ilie, N. Translucency of Esthetic Dental Restorative CAD/CAM Materials and Composite Resins with Respect to Thickness and Surface Roughness. J. Prosthet. Dent. 2015, 113, 534–540. [Google Scholar] [CrossRef] [PubMed]
- Sen, N.; Us, Y.O. Mechanical and Optical Properties of Monolithic CAD-CAM Restorative Materials. J. Prosthet. Dent. 2018, 119, 593–599. [Google Scholar] [CrossRef]
- Carrabba, M.; Keeling, A.J.; Aziz, A.; Vichi, A.; Fonzar, R.F.; Wood, D.; Ferrari, M. Translucent Zirconia in The Ceramic Scenario for Monolithic Restorations: A Flexural Strength and Translucency Comparison Test. J. Dent. 2017, 60, 70–76. [Google Scholar] [CrossRef]
- Barizon, K.T.L. Relative Translucency of Ceramic Systems for Porcelain Veneers. J. Dent. 2011, 39, 165–175. [Google Scholar]
- Niu, E.; Agustin, M.; Douglas, R.D. Color Match of Machinable Lithium Disilicate Ceramics: Effects of Cement Color and Thickness. J. Prosthet. Dent. 2014, 111, 42–50. [Google Scholar] [CrossRef] [PubMed]
- Alfouzan, A.F.; Al-Otaibi, H.; Labban, N.; Al Taweel, S.M.; Al-Tuwaijri, S.; Al-Maha, S. Effects of Thickness and Background Color on The Translucency of CAD/CAM Ceramic Materials. Ceram.–Silikáty 2020, 64, 418–422. [Google Scholar] [CrossRef]
- Shirani, M.; Savabi, O.; Mosharraf, R.; Akhavankhaleghi, M.; Hebibkhodaei, M.; Isler, S. Comparison of Translucency and Opalescence among Different Dental Monolithic Ceramics. J. Prosthet. Dent. 2021, 126, 446.e1–446.e6. [Google Scholar] [CrossRef]
- Kim, H.-K.; Kim, S.-H. Effect of Hydrothermal Aging on the Optical Properties of Precolored Dental Monolithic Zirconia Ceramics. J. Prosthet. Dent. 2019, 121, 676–682. [Google Scholar] [CrossRef]
- Hamza, T.A.; Alameldin, A.A.; Elkouedi, A.Y.; Wee, A.G. Effect of Artificial Accelerated Aging on Surface Roughness and Color Stability of Different Ceramic Restorations. Stomatol. Dis. Sci. 2017, 1, 8–13. [Google Scholar] [CrossRef][Green Version]
- Haralur, S.B.; Alqahtani, R.S.; Alhassan Mujayri, F. Effect of Hydrothermal Aging and Beverages on Color Stability of Lithium Disilicate and Zirconia Based Ceramics. Medicina 2019, 55, 749. [Google Scholar] [CrossRef] [PubMed]
- Morsi, T.S.; Wahba, M.M. Effect of Hydrothermal Aging on Translucency of Different Types of Zirconia and Lithium Disilicate at Variable Thicknesses. Future Dent. J. 2021, 7, 69–74. [Google Scholar] [CrossRef]
- Fathy, S.M.; El-Fallal, A.A.; El-Negoly, S.A.; El Bedawy, A.B. Translucency of Monolithic and Core Zirconia after Hydrothermal Aging. Acta Biomater. Odontol. Scand. 2015, 1, 86–92. [Google Scholar] [CrossRef] [PubMed]
- Alghazzawi, T.F. The Effect of Extended Aging on The Optical Properties of Different Zirconia Materials. J. Prosthodont. Res. 2017, 61, 305–314. [Google Scholar] [CrossRef] [PubMed]
- Kurt, M.; Bal, B.T. Effects of Accelerated Artificial Aging on The Translucency and Color Stability of Monolithic Ceramics with Different Surface Treatments. J. Prosthet. Dent. 2019, 121, 712.e1–712.e8. [Google Scholar] [CrossRef] [PubMed]
- Abdelbary, O.; Wahsh, M.; Sherif, A.; Salah, T. Effect of Accelerated Aging on Translucency of Monolithic Zirconia. Future Dent. J. 2016, 2, 65–69. [Google Scholar] [CrossRef]
- Barizon, K.T.; Bergeron, C.; Vargas, M.A.; Qian, F.; Cobb, D.S.; Gratton, D.G.; Geraldeli, S. Ceramic Materials for Porcelain Veneers: Part II. Effect of Material, Shade, and Thickness on Translucency. J. Prosthet. Dent. 2014, 112, 864–870. [Google Scholar] [CrossRef]
- Dikicier, S.; Ayyildiz, S.; Ozen, J.; Sipahi, C. Effect of Varying Core Thicknesses and Artificial Aging on the Color Difference of Different All-Ceramic Materials. Acta Odontol. Scand. 2014, 72, 623–629. [Google Scholar] [CrossRef] [PubMed]
- Inokoshi, M.; Zhang, F.; De Munck, J.; Minakuchi, S.; Naert, I.; Vleugels, J.; Van Meerbeek, B.; Vanmeensel, K. Influence of Sintering Conditions on Low-Temperature Degradation of Dental Zirconia. Dent. Mater. 2014, 30, 669–678. [Google Scholar] [CrossRef] [PubMed]
- Jiang, L.; Liao, Y.; Wan, Q.; Li, W. Effects of Sintering Temperature and Particle Size on the Translucency of Zirconium Dioxide Dental Ceramic. J. Mater. Sci. Mater. Med. 2011, 22, 2429–2435. [Google Scholar] [CrossRef]
- Kim, H.-K.; Kim, S.-H. Effect of The Number of Coloring Liquid Applications on the Optical Properties of Monolithic Zirconia. Dent. Mater. 2014, 30, e229–e237. [Google Scholar] [CrossRef] [PubMed]
- Juntavee, N.; Attashu, S. Effect of Sintering Process on Color Parameters of Nano-Sized Yttria Partially Stabilized Tetragonal Monolithic Zirconia. J. Clin. Exp. Dent. 2018, 10, 794–804. [Google Scholar] [CrossRef]
- Lee, Y.-K.; Yu, B. Measurement of Opalescence of Tooth Enamel. J. Dent. 2007, 35, 690–694. [Google Scholar] [CrossRef] [PubMed]
- Shiraishi, T.; Wood, D.J.; Shinozaki, N.; van Noort, R. Optical Properties of Base Dentin Ceramics for All-Ceramic Restorations. Dent. Mater. 2011, 27, 165–172. [Google Scholar] [CrossRef]
- Abbasimoghaddam, S.; Hakimaneh, S.M.R.; Hooshmand, T.; Shayegh, S.S. Effects of Aging on Mechanical and Optical Properties of Translucent and Opaque Zirconia. J. Iran. Dent. Assoc. 2021, 33, 22–32. [Google Scholar]
- Yamashita, I.; Tsukuma, K. Light Scattering by Residual Pores in Transparent Zirconia Ceramics. J. Ceram. Soc. Jpn. 2011, 119, 133–135. [Google Scholar] [CrossRef]
- Ilie, N.; Stawarczyk, B. Quantification of The Amount of Blue Light Passing Through Monolithic Zirconia with Respect to Thickness and Polymerization Conditions. J. Prosthet. Dent. 2015, 113, 114–121. [Google Scholar] [CrossRef]
- Koseoglu, M.; Albayrak, B.; Gül, P.; Bayindir, F. Effect of Thermocycle Aging on Color Stability of Monolithic Zirconia. Open J. Stomatol. 2019, 9, 75–85. [Google Scholar] [CrossRef]


| Material as Described by the Company | Trade Name and Company Details | Abbreviation | Basic Chemical Composition (wt%) |
|---|---|---|---|
| Multilayer highly translucent monolithic zirconia | Ceramill Zolid Gen-X, Amann Girrbach AG, Germany | GNX | 4Y-TZP: ZrO2 + HfO2 + Y2O3 ≥ 99.0% Y2O3 6–7% HfO2 ≤ 5% Al2O3 ≤ 0. 5% Other oxides ≤ 1% |
| Natural esthetics and high-strength zirconia ‘One-Disc Solution’ | IPS e.max ZirCAD Prime, Ivoclar Vivadent, Schaan, Liechtenstein | ZCP | 3Y-TZP and 5Y-TZP: ZrO2 88–95.5% Y2O3 4.5–7% HfO2 < 5% Al2O3 < 1% Other oxides < 1.5% |
| Monolithic multilayer ‘All Cases’ zirconia | Upcera Esthetic Explore, Upcera, China | UPC | 4Y-TZP and 5Y-TZP: ZrO2 + HfO2 86.3–94.2 % Fe2O3 < 0.5 % Y2O3 5.8–9.7% Er2O3 < 2% Al2O3 < 0.5% Other oxides < 0.5% |
| Polymer-infiltrated hybrid ceramic | Enamic, VITA-Zahnfabrik H. Rauter-GmbH-Germany | ENM | 86 % by weight (75% by volume) ceramic network and 14% by weight (25% by volume) polymerized methacrylate polymer network; UDMA and TEGDMA [SiO2 (58–63%), Al2O3 (20–23%), Na2O (9–11%), K2O (4–6%), B2O3 (0.5–2%), CaO (<1%) and TiO2 (<1%)]. |
| Highly esthetic lithium disilicate glass-ceramic | IPS e.max CAD, Ivoclar Vivadent, Schaan, Liechtenstein | EMX | SiO2 57–80 % Li2O 11–19% K2O 0–13% P2O5 0–11% ZrO2 0–8% ZnO 0–8% Al2O3 0–5% MgO 0–5% Coloring oxides 0–8% |
| Group | Heating Rate and Eventual Heating Steps | Final Temperature (°C) | Holding Time (min) | Cooling Rate Up | Furnace Brand |
|---|---|---|---|---|---|
| GNX | 8 °C/min | 1450 °C | 120 | 20 °C/min | Ceramill Therm, Amann Girrbach |
| UPC | 10 °C/min until 300 °C, 17.5 °C/min until 1000 °C, 4 °C/min until 1530 °C | 1530 °C | 120 | 12.2 °C/min | Ceramill Therm, Amann Girrbach |
| ZCP | 10 °C/min until 900 °C is attained, after holding for 30 min, heating rate of 3.3 °C/min until 1500 °C | 1500 °C | 120 | 10 °C/min from 1500 °C until 900 °C, then 8 °C/min from 900 °C to 300 °C | Ceramill Therm, Amann Girrbach |
| ENM * | |||||
| EMX | 60 °C/min until 770 °C is attained, holding for 5 min. Then, 30 °C/min until 850 °C | 850 °C | 10 | 20 °C/min | Programat EP5010 (Ivoclar-Vivadent) |
| Material | Factor | Aging | N | Mean | Std. Deviation | Sig. |
|---|---|---|---|---|---|---|
| GNX | ΔL | non-aged | 20 | 13.6300 | (0.83231) | 0.202 |
| ΔL | aged | 20 | 14.3300 | (2.26555) | 0.207 | |
| Δa | non-aged | 20 | 1.2400 | (0.19841) | 0.017 | |
| Δa | aged | 20 | 1.0100 | (0.35968) | 0.018 | |
| Δb | non-aged | 20 | 8.9200 | (0.99821) | 0.595 | |
| Δb | aged | 20 | 9.1450 | (1.58827) | 0.595 | |
| ZCP | ΔL | non-aged | 20 | 13.4050 | (0.85068) | 0.508 |
| ΔL | aged | 20 | 13.2400 | (0.70591) | 0.509 | |
| Δa | non-aged | 20 | 1.8000 | (0.24921) | 0.000 | |
| Δa | aged | 20 | 1.4700 | (0.24516) | 0.000 | |
| Δb | non-aged | 20 | 10.8550 | (0.84322) | 0.163 | |
| Δb | aged | 20 | 10.5050 | (0.70597) | 0.163 | |
| UPC | ΔL | non-aged | 20 | 15.5150 | (1.20494) | 0.000 |
| ΔL | aged | 20 | 13.6650 | (0.59230) | 0.000 | |
| Δa | non-aged | 20 | 0.9650 | (0.38970) | 0.123 | |
| Δa | aged | 20 | 0.5350 | (1.15498) | 0.128 | |
| Δb | non-aged | 20 | 9.4000 | (1.51588) | 0.016 | |
| Δb | aged | 20 | 8.4200 | (0.86730) | 0.018 | |
| ENM | ΔL | non-aged | 20 | 21.7500 | (4.55106) | 0.009 |
| ΔL | aged | 20 | 18.9200 | (0.79114) | 0.013 | |
| Δa | non-aged | 20 | 2.0950 | (0.40843) | 0.079 | |
| Δa | aged | 20 | 1.9150 | (0.17852) | 0.083 | |
| Δb | non-aged | 20 | 12.9950 | (2.40186) | 0.002 | |
| Δb | aged | 20 | 11.2450 | (0.25644) | 0.004 | |
| EMX | ΔL | non-aged | 20 | 17.7300 | (1.35999) | 0.074 |
| ΔL | aged | 20 | 16.9650 | (1.26752) | 0.074 | |
| Δa | non-aged | 20 | 2.7550 | (0.18489) | 0.689 | |
| Δa | aged | 20 | 2.7800 | (0.20673) | 0.689 | |
| Δb | non-aged | 20 | 11.9450 | (0.48826) | 0.505 | |
| Δb | aged | 20 | 11.8500 | (0.40066) | 0.505 |
| Material | Mean of ΔE at White Background | Mean of ΔE at Black Background | Mean of ΔE at White and Black Background |
|---|---|---|---|
| GNX | 1.084208 | 1.438327 | 1.261268 |
| ZCP | 0.952307 | 0.953905 | 0.953106 |
| UPC | 1.538089 | 2.004471 | 1.77128 |
| ENM | 1.052949 | 3.197876 | 2.125412 |
| EMX | 1.471839 | 2.211663 | 1.841751 |
| Material | N | Mean | Std. Deviation |
|---|---|---|---|
| GNX | 20 | 16.3669 | (0.82461) |
| ZCP | 20 | 17.3539 | (1.04154) |
| UPC | 20 | 18.2139 | (1.43829) |
| ENM | 18 * | 23.8405 | (1.47981) |
| EMX | 20 | 21.5661 | (1.27472) |
| Total | 98 | 19.3791 | (3.02144) |
| Group | Other Groups | Sig. |
|---|---|---|
| GNX | ZCP | 0.092 |
| UPC | 0.000 | |
| ENM | 0.000 | |
| EMX | 0.000 | |
| ZCP | UPC | 0.185 |
| ENM | 0.000 | |
| EMX | 0.000 | |
| UPC | ENM | 0.000 |
| EMX | 0.000 | |
| ENM | EMX | 0.000 |
| Material | N | Mean | Std. Deviation |
|---|---|---|---|
| GNX | 18 * | 16.3750 | (0.74454) |
| ZCP | 20 | 16.9788 | (0.75222) |
| UPC | 20 | 16.1179 | (0.68423) |
| ENM | 20 | 22.0976 | (0.69962) |
| EMX | 20 | 20.8905 | (1.15557) |
| Total | 98 | 18.5352 | (2.64346) |
| Group | Other Groups | Sig. |
|---|---|---|
| GNX | ZCP | 0.117 |
| UPC | 0.803 | |
| ENM | 0.000 | |
| EMX | 0.000 | |
| ZCP | UPC | 0.005 |
| ENM | 0.000 | |
| EMX | 0.000 | |
| UPC | ENM | 0.000 |
| EMX | 0.000 | |
| ENM | EMX | 0.003 |
| Material | Aging | N | Mean | Std. Deviation | Sig. (2-Tailed) |
|---|---|---|---|---|---|
| GNX | non-aged | 20 | 16.3669 | (0.82461) | 0.975 |
| aged | 18 * | 16.3750 | (0.74454) | 0.975 | |
| ZCP | non-aged | 20 | 17.3539 | (1.04154) | 0.200 |
| aged | 20 | 16.9788 | (0.75222) | 0.200 | |
| UPC | non-aged | 20 | 18.2139 | (1.43829) | 0.000 |
| aged | 20 | 16.1179 | (0.68423) | 0.000 | |
| ENM | non-aged | 18 * | 23.8405 | (1.47981) | 0.000 |
| aged | 20 | 22.0976 | (0.69962) | 0.000 | |
| EMX | non-aged | 20 | 21.5661 | (1.27472) | 0.087 |
| aged | 20 | 20.8905 | (1.15557) | 0.087 |
| Material | N | Mean | Std. Deviation |
|---|---|---|---|
| GNX | 20 | 9.0072 | (1.00427) |
| ZCP | 20 | 11.0044 | (0.86360) |
| UPC | 20 | 9.4533 | (1.54029) |
| ENM | 18 * | 12.3994 | (0.58992) |
| EMX | 19 * | 12.3362 | (0.34766) |
| Total | 97 | 10.7925 | (1.70406) |
| Group | Other Groups | Sig. |
|---|---|---|
| GNX | ZCP | 0.000 |
| UPC | 0.813 | |
| ENM | 0.000 | |
| EMX | 0.000 | |
| ZCP | UPC | 0.004 |
| ENM | 0.000 | |
| EMX | 0.000 | |
| UPC | ENM | 0.000 |
| EMX | 0.000 | |
| ENM | EMX | 0.995 |
| Material | N | Mean | Std. Deviation |
|---|---|---|---|
| GNX | 19 * | 8.9048 | (0.93894) |
| ZCP | 20 | 10.6088 | (0.72565) |
| UPC | 20 | 8.5016 | (0.96641) |
| ENM | 20 | 11.4080 | (0.26852) |
| EMX | 20 | 12.1734 | (0.40094) |
| Total | 99 | 10.3336 | (1.58517) |
| Group | Other Groups | Sig. |
|---|---|---|
| GNX | ZCP | 0.000 |
| UPC | 0.680 | |
| ENM | 0.000 | |
| EMX | 0.000 | |
| ZCP | UPC | 0.000 |
| ENM | 0.001 | |
| EMX | 0.000 | |
| UPC | ENM | 0.000 |
| EMX | 0.000 | |
| ENM | EMX | 0.000 |
| Material | Aging | N | Mean | Std. Deviation | Sig. (2-Tailed) |
|---|---|---|---|---|---|
| GNX | non-aged | 20 | 9.0072 | (1.00427) | 0.744 |
| aged | 19 * | 8.9048 | (0.93894) | 0.744 | |
| ZCP | non-aged | 20 | 11.0044 | (0.86360) | 0.125 |
| aged | 20 | 10.6088 | (0.72565) | 0.125 | |
| UPC | non-aged | 20 | 9.4533 | (1.54029) | 0.025 |
| aged | 20 | 8.5016 | (0.96641) | 0.025 | |
| ENM | non-aged | 18 * | 12.3994 | (0.58992) | 0.000 |
| aged | 20 | 11.4080 | (0.26852) | 0.000 | |
| EMX | non-aged | 19 * | 12.3362 | (0.34766) | 0.185 |
| aged | 20 | 12.1734 | (0.40094) | 0.185 |
Publisher’s Note: MDPI stays neutral with regard to jurisdictional claims in published maps and institutional affiliations. |
© 2022 by the authors. Licensee MDPI, Basel, Switzerland. This article is an open access article distributed under the terms and conditions of the Creative Commons Attribution (CC BY) license (https://creativecommons.org/licenses/by/4.0/).
Share and Cite
Almohammed, S.N.; Alshorman, B.; Abu-Naba’a, L.A. Optical Properties of Five Esthetic Ceramic Materials Used for Monolithic Restorations: A Comparative In Vitro Study. Ceramics 2022, 5, 961-980. https://doi.org/10.3390/ceramics5040069
Almohammed SN, Alshorman B, Abu-Naba’a LA. Optical Properties of Five Esthetic Ceramic Materials Used for Monolithic Restorations: A Comparative In Vitro Study. Ceramics. 2022; 5(4):961-980. https://doi.org/10.3390/ceramics5040069
Chicago/Turabian StyleAlmohammed, Saleh N., Belal Alshorman, and Layla A. Abu-Naba’a. 2022. "Optical Properties of Five Esthetic Ceramic Materials Used for Monolithic Restorations: A Comparative In Vitro Study" Ceramics 5, no. 4: 961-980. https://doi.org/10.3390/ceramics5040069
APA StyleAlmohammed, S. N., Alshorman, B., & Abu-Naba’a, L. A. (2022). Optical Properties of Five Esthetic Ceramic Materials Used for Monolithic Restorations: A Comparative In Vitro Study. Ceramics, 5(4), 961-980. https://doi.org/10.3390/ceramics5040069