


Abstract
The performance of the pitcher is the cornerstone of baseball, often determining the flow and ultimate outcome of a game. Given this centrality, understanding the mechanics of an elite pitcher and decoding their strategies are paramount for both internal optimization and competitive scouting. This study proposes an end-to-end deep learning pipeline for automatically classifying five distinct pitch types from raw broadcast footage of MLB pitcher Max Scherzer between 2015 and 2020. By formulating pitch delivery as a time-series classification problem tailored to the unique biomechanics of an elite athlete, the proposed CNN–LSTM framework integrates per-frame spatial feature extraction using an advanced CNN backbone (YOLOv8s-cls) with a two-layer long short-term memory (LSTM) network to capture subtle biomechanical cues across a standardized 20-frame delivery sequence. While skeletal pose estimation primarily focuses on tracking major joints to analyze standard pitching mechanics, the proposed pixel-based method preserves fine-grained visual cues—such as finger grip and wrist rotation—that are critical for distinguishing pitch variations. The proposed framework achieved an accuracy of 91.8% under a standard Random Split and, importantly, 84.5% under a strict Chronological Split across different seasons, validating the feasibility of automated pitch “tell” detection from broadcast video. The resulting system provides coaches and analysts with an objective, data-driven tool for generating personalized scouting reports, identifying mechanical inconsistencies, and refining pitching strategies.
1. Introduction
The pitcher has always been a pivotal figure in baseball, and consequently, a variety of studies have been devoted to analyzing and maximizing pitcher performance [1,2,3,4,5]. Reflecting this foundational emphasis, the sport has increasingly embraced a data-driven paradigm over the past two decades known as sabermetrics [6,7]. This shift, supported by advanced tracking systems such as MLB’s Statcast [8], enables teams to finely quantify crucial metrics—including pitch velocity, spin rate, and launch angle—to optimize in-game strategy and roster construction.
Despite advancements in outcome-based analytics, analyzing a pitcher’s delivery remains largely qualitative, relying on subjective, error-prone manual observation to identify subtle deviations (“tells”) that unintentionally signal intended pitches [9,10,11]. While effective for analyzing macro-kinematics for coaching and injury prevention [12,13], standard skeletal pose estimation toolkits struggle with the extreme joint velocities inherent in MLB pitching (exceeding 7000°/s) and self-occlusion at the release point. Crucially, they are not designed to capture critical micro-biomechanical cues, such as finger grip or wrist rotation, necessary for pitch differentiation.
Recognizing that pose estimation serves a distinct purpose, this study explicitly utilizes a localized, pixel-based approach to analyze the complete spatiotemporal “tell” signature directly from raw video data. We present a robust CNN–LSTM framework specifically designed for player-specific pitch type forecasting. Our pipeline leverages a transfer learning approach, initializing an advanced spatial backbone (YOLOv8s-cls) with weights pre-trained on the ImageNet dataset to accelerate convergence on a comparatively limited sports-specific dataset.
The main contributions of this work are summarized as follows:
- Conceptual Delineation of Vision Paradigms: Establishment of a critical methodological distinction: coordinate-based pose estimation is optimal for macro-kinematics (posture), while pixel-domain analysis is required to decode the terminal micro-biomechanical “hand tells” (grip and wrist rotation) that distinguish pitch types.
- Localized Spatiotemporal Architecture: Development of a localized, pixel-based CNN–LSTM framework using a YOLOv8s-cls spatial backbone to capture fine-grained textural cues directly from broadcast footage, bypassing high-speed motion artifacts inherent in pose estimation.
- Validation of Temporal Dynamics: Empirical validation demonstrating that integrating an LSTM for temporal sequence analysis drastically reduces the generalization gap observed in single-frame CNN spatial models by implicitly learning the kinetic delivery “process.”
- Rigorous Dataset Partitioning and Ablation: Implementation of strict Chronological Split protocols across multiple seasons to verify the technical validity of learned tells against temporal distribution shift, and a comprehensive ablation study validating the optimal temporal context length (T = 20 frames).
The remainder of this paper is organized as follows: Section 2 reviews existing literature on machine learning in baseball and computer vision applications in sports. Section 3 details the data acquisition, preprocessing, model architecture, and training procedures. Section 4 presents the experimental results, including the model’s performance metrics and a discussion of key findings. Finally, Section 5 offers concluding remarks and outlines directions for future research.
2. Related Work
Given the pitcher’s pivotal role in determining game outcomes, analyzing pitching performance is a central focus in baseball. This research applies advanced deep learning to predict delivery, reflecting the evolution of computational methods from basic statistical tracking to complex, machine learning-driven biomechanical analysis. To contextualize this work, this section reviews pitch prediction methodologies across four paradigms: (1) outcome-based tabular analysis, (2) single-frame 2D CNN classification, (3) skeletal pose estimation tracking, and (4) spatiotemporal modeling, the advanced approach utilized in this study.
2.1. Tabular Data Analysis
Historically, pitching analysis relied on basic empirical measures like earned run average (ERA) and strikeout-to-walk ratio (K/BB) [14,15]. Modern analytics are rooted in sabermetrics, popularized by Moneyball [16] and validated by Baumer and Zimbalist [6], which utilized season-level data to identify market inefficiencies. However, these macro-level approaches offered limited insight into real-time pitch execution.
High-resolution tracking systems such as PITCHf/x and Statcast [8] have shifted research toward in-game pitch prediction using outcome-based models. Studies by Ganeshapillai and Guttag [17] and Hamilton et al. [18] applied linear Support Vector Machine (SVM) models using post-release metrics (e.g., velocity), while Sidle and Tran [19] and Plunkett [20] used traditional classifiers such as SVM, Random Forest, and Linear Discriminant Analysis based on game context. However, these approaches rely purely on statistical correlations, treating the pitcher as a statistical “black box” and ignoring the underlying biomechanics of the pitching motion.
The maturation of deep learning shifted research focus toward the temporal dynamics of pitching sequences. Lee et al. [21] employed ensemble deep neural networks (DNN) to predict pitch type and location using dynamic game features. Similarly, the “Decide the Next Pitch” study [22] utilized a long short-term memory (LSTM) network—a recurrent neural network (RNN) variant designed to capture long-range temporal dependencies while mitigating vanishing gradients [23,24,25]. Although these models effectively leverage sequential information (e.g., prior pitch types), their reliance on tabular data renders them incapable of detecting visual “tells,” such as subtle changes in grip or leg lift.
2.2. Deep Learning Static Image Analysis
To incorporate visual data, researchers turned to convolutional neural networks (CNNs) [26]. Early applications utilized standard architectures like VGG16 [26,27], ResNet50 [28,29,30], and DenseNet121 [31,32] to classify pitch types from static images. However, our evaluations indicate that these models frequently suffer from overfitting, memorizing static background features rather than learning generalizable mechanics.
A more fundamental limitation lies in the temporal domain: analyzing single frames inherently collapses the dynamic spatiotemporal signature of the delivery. A pitch is not defined by static posture, but by a precise, continuous kinetic process unfolding over time. By forcing a model to predict pitch type from an isolated snapshot, essential information regarding the rate of arm acceleration, the timing of the localized wrist “snap,” and the sequential rhythm of the delivery is irretrievably discarded. Because elite pitchers deliberately utilize “pitch tunneling”—ensuring the initial mechanics of their wind-up phase are identical across their entire repertoire—static image analysis inherently lacks the fidelity to resolve the specific, terminal-phase “process” that actually differentiates the pitch variations.
A critical advancement in mitigating these spatial distractors has been the development of real-time object detection frameworks. Specifically, the You Only Look Once (YOLO) architecture has revolutionized visual processing by framing object detection as a single regression problem, enabling the simultaneous prediction of bounding boxes and class probabilities from full images in a single computational pass [33,34,35,36]. In the context of pitching analysis, YOLO provides a robust mechanism for reliably isolating the athlete from background noise, establishing a clean spatial foundation for subsequent modeling.
2.3. Vision-Based Pose Estimation and Methodological Distinctions
Computer vision has advanced to enable accurate, markerless human pose estimation, essential for modern sports analytics [37]. While traditional 3D motion capture requires restrictive laboratory settings and physical markers, video-based approaches offer a scalable, non-intrusive solution for analyzing athletic performance directly from broadcast footage.
However, when applied to baseball pitching, a key methodological distinction must be made between biomechanical analysis and pitch classification. These two tasks require different levels of visual fidelity.
- Purpose of Pose Estimation (Macro-Kinematics): Coordinate-based pose estimation is highly effective for biomechanical analysis and training. It captures the macro-kinematics of a pitcher’s delivery, enabling the evaluation of kinetic chain consistency, identification of mechanical inefficiencies, and prevention of injury. Such models are useful for standardizing a pitcher’s overall delivery mechanics.
- Purpose of Pitch Classification (Micro-Biomechanics): Predicting the pitch type relies primarily on subtle micro-biomechanical cues, often referred to as “hand tells.” These include fine variations in finger grip, wrist angle, and late-stage forearm rotation, which determine the resulting ball movement.
Standard skeletal models intentionally abstract the human body into geometric keypoints, often representing the entire hand as a single coordinate. This abstraction discards the fine-grained textural information—such as finger placement and wrist pressure—that differentiates mechanically similar pitches.
Furthermore, baseball pitching introduces several technical challenges for general-purpose pose estimation frameworks:
- Lightweight Models (e.g., MediaPipe, MoveNet): These models are optimized for real-time deployment on mobile devices but often lack robustness for high-speed sports environments. Extreme angular velocities during pitching can produce severe motion blur, frequently causing tracking failures in distal joints such as the wrist and elbow [38,39].
- Complex Models (e.g., AlphaPose, OpenPose, YOLO-Pose): Although these architectures offer higher accuracy and better multi-person tracking [40,41,42], they still struggle with self-occlusion, particularly during the pitching wind-up, where the throwing arm may be partially hidden from broadcast camera angles.
Consequently, relying solely on pre-extracted skeletal coordinates can introduce noise and irreversible information loss. While pose estimation is valuable for understanding how a pitcher throws, it is structurally insufficient for determining what pitch is thrown. For this reason, this study focuses on raw spatiotemporal features directly from video frames, allowing the model to preserve critical visual cues related to grip and wrist motion.
2.4. Spatiotemporal Modeling
Pitching is inherently a temporal process, in which the kinematic state of frame t depends on the motion observed in preceding frames. Traditional 2D convolutional neural networks (CNNs) treat each image independently and therefore fail to capture these temporal dependencies.
A common intermediate approach uses temporal pooling (CNN-Avg) [43], where spatial features are extracted from individual frames and aggregated through global averaging before classification. Although this method incorporates multiple frames, it remains order-agnostic, discarding the sequential dynamics of the pitching motion.
More advanced architectures explicitly model temporal relationships. 3D convolutional networks (e.g., C3D and I3D) [44,45,46] and video transformers [47] achieve state-of-the-art performance in general action recognition tasks. However, these models require substantial computational resources and very large training datasets, limiting their practicality for real-time sports analytics.
To balance accuracy, temporal modeling capability, and computational efficiency, this study adopts a CNN–LSTM architecture [48]. Lightweight YOLOv8 classification models (Nano and Small) are used as the spatial feature extractors, providing efficient real-time visual representations of arm position and hand motion. The extracted features are then processed by an LSTM network, which captures the temporal evolution of the pitching sequence [49]. This hybrid design allows the system to learn the motion history of the delivery, bridging the gap between laboratory biomechanics and real-game analytics. Table 1 summarizes the evolution of pitch type prediction.
Table 1.
Evolution of pitch type prediction.
2.5. Human Pose Estimation Constraints and Biomechanical Context
Although our proposed CNN–LSTM framework employs a localized, pixel-based approach, it is crucial to differentiate between the distinct methodologies of human pose estimation and direct spatiotemporal image analysis. Pose estimation algorithms offer substantial technical validity for biomechanical assessment, injury prevention, and general mechanical training, as they can accurately map the macro-kinematics of a pitcher’s delivery [12,13]. In this section, we first investigate how standard pose estimation can be utilized for pitching instruction via macro-movement categorization and profiling, and subsequently define the technical gap between current coordinate-based architectures and the high-fidelity analysis required to decode a pitcher’s subtle “hand tells.”
2.5.1. Inter-Player Categorization of Pitching Mechanics
While pose estimation is less effective for identifying pitch types within a single pitcher, it performs well in inter-player comparisons of pitching mechanics [1]. By analyzing macro-mechanical signatures, pitchers can be grouped into distinct classifications based on how they generate force and deliver the ball. Table 2 provides a comparison of four major pitching pose mechanics recognized in sports science, outlining their inherent strengths, weaknesses, and exemplary famous pitchers who utilized these specific styles.
Table 2.
Inter-player comparison of major pitching pose mechanics.
2.5.2. Pitchers with Mechanics Similar to Max Scherzer
The subject of this study, Max Scherzer, exhibits a rotational/high torque pitching style characterized by explosive hip–shoulder separation and rapid torso rotation. Using macro-mechanical signatures derived from pose analysis, several pitchers can be identified with similar movement patterns, including Ryan Castellani and Jack Flaherty. Such comparisons demonstrate how pose estimation can be used to construct biomechanical profiles of elite athletes. These inter-player similarities are summarized in Table 3.
Table 3.
Pitchers sharing Max Scherzer’s macro-mechanics.
2.5.3. Key Characteristics of the “Scherzer Pose”
Pose estimation is particularly useful for training pitchers to replicate elite mechanics. Key features of the “Scherzer Pose” include:
- Minimal Drift: Exhibiting minimal, but rapid, forward movement during the initial leg lift.
- Violent Torque and Hip Rotation: Executing early, aggressive hip rotation that creates maximum separation between the hips and the shoulders (the “whip” effect).
- Contralateral Tilt: Displaying significant torso tilt during the release phase, while ensuring the head remains perfectly neutral and stable (not tilting with the rest of the body).
- Low Arm Slot: Maintaining the throwing elbow slightly below the shoulder line at the point of release, creating a uniquely deceptive approach angle.
- “Hidden” Ball: Utilizing delayed hand separation, effectively hiding the baseball behind the body’s midline until the absolute last moment of the acceleration phase.
2.5.4. Limitations of Pose Estimation for Pitch Classification
Standard coordinate-based pose estimation serves a distinct methodological purpose from high-accuracy pitch classification. While valuable for optimizing macro-kinematics for coaching, predicting pitch type solely on coordinate geometries is unreliable. Pitch differentiation relies almost entirely on micro-biomechanics—subtle “hand tells” like finger placement and wrist angle during terminal release—that coordinate disguise. Pure pose extraction is inherently blind to these millimeter-scale cues.
While combining pose estimation with an LSTM network creates a functional time-series classifier for general delivery dynamics, this architecture proves insufficient for pitch distinction due to two critical technical bottlenecks regarding spatial fidelity. First, standard pose estimators intentionally discard fine-grained textural data to extract coordinates. By abstracting the hand into a single geometric point, the model eliminates the visual cues of finger grip and wrist turn necessary to distinguish pitches. Second, elite pitchers actively standardize their physical delivery across their entire repertoire to avoid “tipping” intent. If the macro-pose is successfully replicated identically across different pitch types, the resulting skeletal coordinates become practically indistinguishable.
Recognizing that pose estimation serves a distinct analytical purpose, this study utilizes a localized, pixel-based CNN–LSTM framework to capture the spatiotemporal signatures necessary for pitch classification. This architecture is uniquely designed to analyze textural tells and temporal dynamics simultaneously, directly from raw broadcast video data.
2.5.5. Pilot Validation Study
To validate the different purposes of pose estimation and pixel-based image analysis, we undertake an experiment comparing a skeletal-based baseline approach against our proposed pixel-based framework. This comparison revealed critical limitations in the geometric approach’s ability to capture the fine-grained spatiotemporal details necessary for pitch distinction.
- Setup: We processed a random subset of 100 pitch sequences using MediaPipe Pose (33 skeletal landmarks per frame) and trained a standard LSTM classifier on these coordinate sequences.
- Results: The pose-based model achieved a classification accuracy of only 42%, barely exceeding random chance for the 5-class problem. It completely failed to distinguish between Fastballs, Cutters, and Sliders, as their arm trajectories (skeletal kinematics) are nearly identical during the wind-up phase.
- Failure Analysis: The rapid angular acceleration of the pitching arm generated significant motion blur, causing the estimator to frequently lose track of the distal joints (wrist and elbow) during critical high-velocity frames.
While effective for macro-kinematic analysis, standard pose estimation abstracts fine-grained details necessary for pitch classification, as shown in Table 4. Instead, this study utilizes direct pixel-based analysis. By modeling the raw video sequence, our CNN-LSTM framework preserves fundamental signatures like grip blur and wrist shadows.
Table 4.
Comparative analysis of feature extraction methodologies (pilot study).
2.5.6. Selection of the CNN–LSTM Framework
Based on the above analysis, this study adopts a pixel-based CNN–LSTM framework for pitch classification while recognizing the complementary role of pose estimation in biomechanical analysis.
The selected architecture offers three key advantages:
- Temporal Motion Modeling—The LSTM captures the dynamic evolution of the pitching motion rather than relying on static poses.
- Improved Generalization—Unlike static CNN models, the CNN–LSTM learns transferable motion patterns rather than memorizing background features.
- Detection of Biomechanical “Tells”—The model can identify subtle temporal cues such as grip blur, wrist rotation, or small rhythm variations during the wind-up.
Table 5 summarizes the methodological comparison between static CNNs, pose estimation, and the proposed CNN–LSTM approach.
Table 5.
Comparison of methodologies for pitch type prediction.
3. Methodology
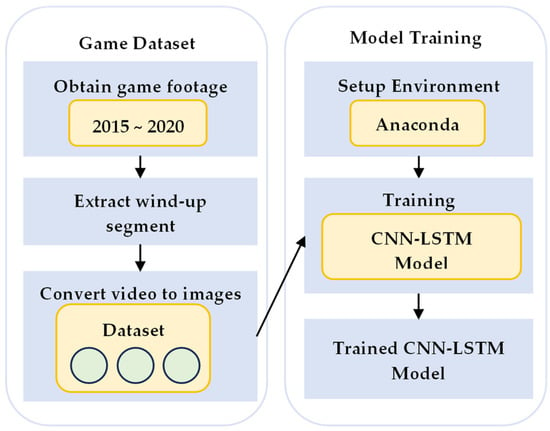
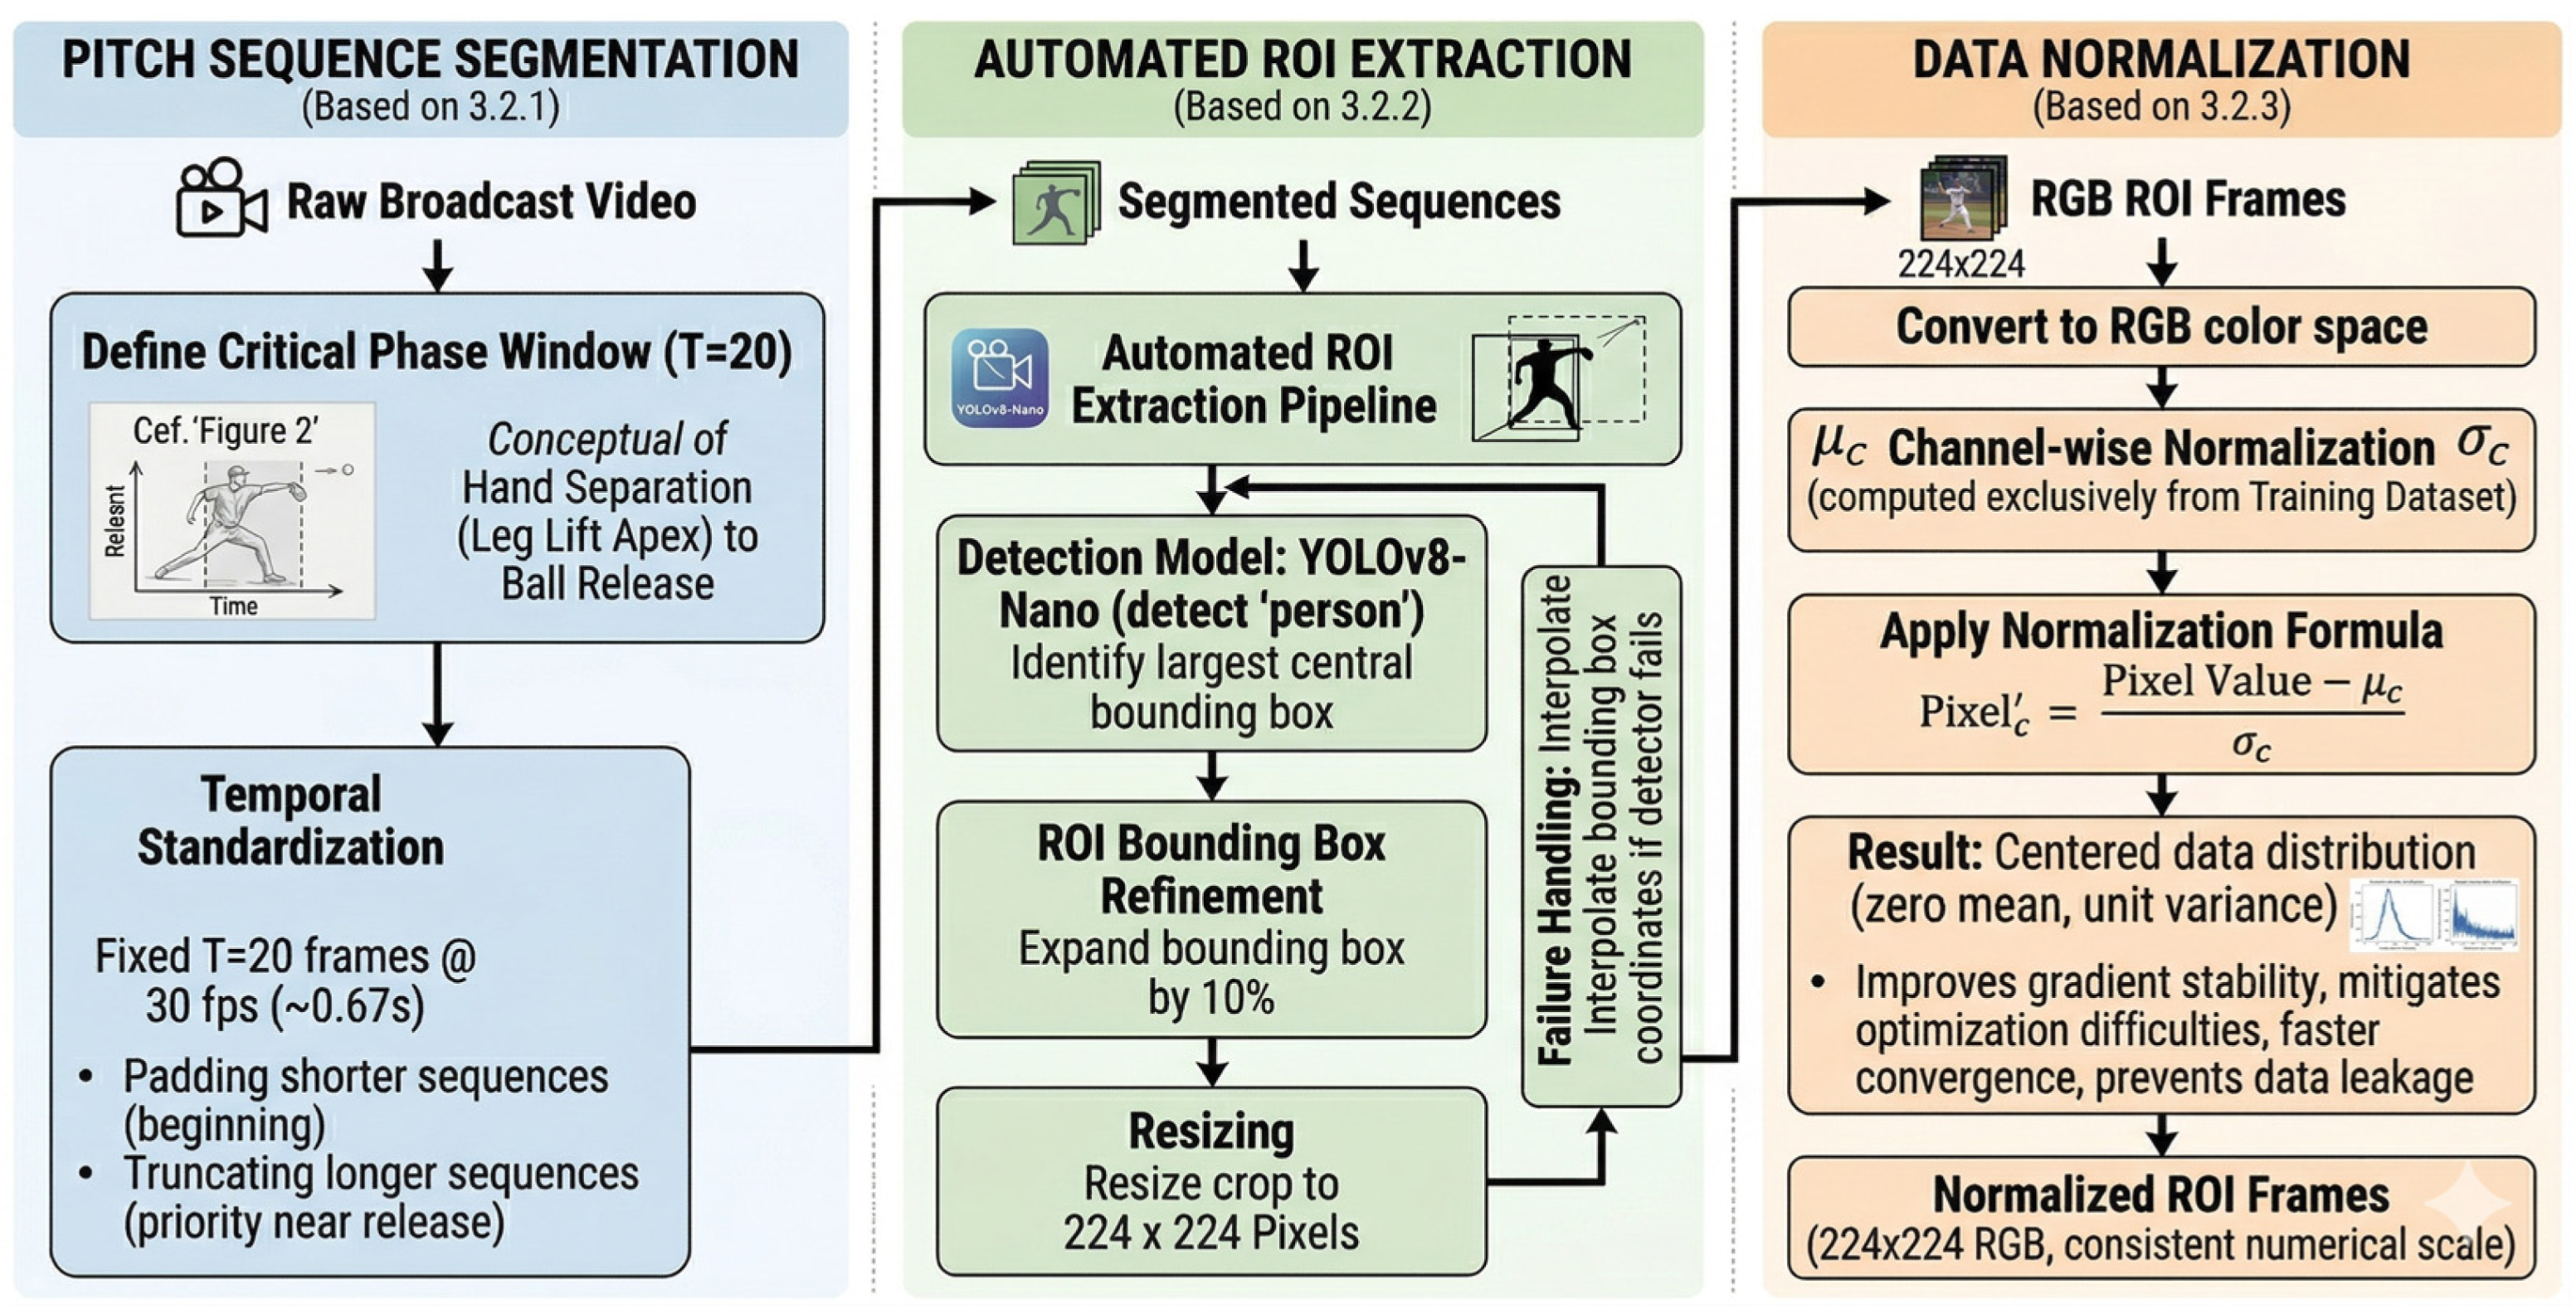
The comprehensive workflow of our proposed methodology is illustrated in Figure 1. The process begins with the acquisition of game footage. From this raw data, the specific wind-up phase of the pitching delivery is isolated and extracted from each video clip. These video segments are subsequently decomposed into sequential image frames to construct the experimental dataset. Finally, the processed data is ingested by a preconfigured CNN-LSTM framework to facilitate model training.
Figure 1.
Methodology flowchart.
3.1. Data Acquisition
The study utilized publicly available game footage of MLB pitcher Max Scherzer spanning the 2015 through 2020 seasons. Scherzer was selected due to his high pitch volume, consistent elite performance, and diverse arsenal of five primary pitches: Four-Seam Fastball (4SFB), Cutter (CT), Slider (SL), Curveball (CB), and Changeup (CH).
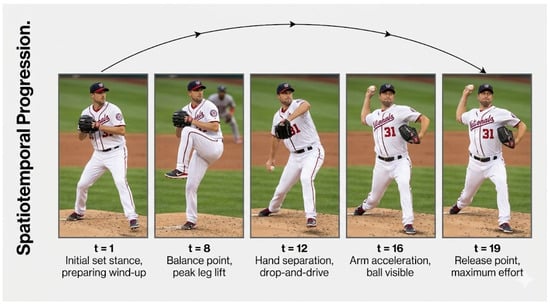
Footage was collected from the official MLB YouTube channel and MLB Statcast, focusing on Scherzer’s pitching motion during wind-up and delivery, as illustrated in Figure 2. To ensure biomechanical consistency and eliminate contextual variables, only clips recorded under bases-empty situations were included. Figure 3 outlines the overall dataset acquisition and construction workflow.
Figure 2.
Extraction of the wind-up segment.
Figure 3.
Raw video data processing pipeline: segmentation, frame extraction, and normalization.
3.2. Data Preprocessing and Augmentation
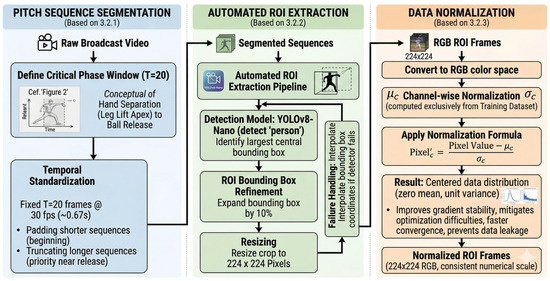
The raw video data were processed through a structured three-stage pipeline consisting of pitch sequence segmentation, frame extraction with region of interest (ROI) identification—where a specific subregion containing the most relevant visual information is selected for focused analysis—and data normalization, as shown in Figure 3.
3.2.1. Pitch Sequence Segmentation
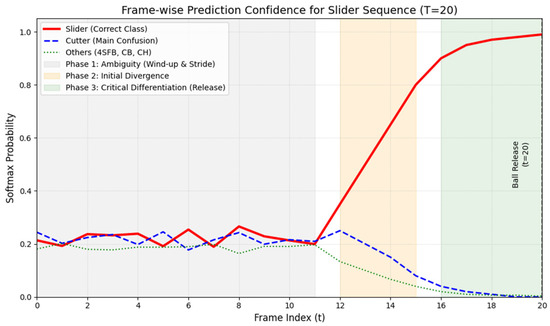
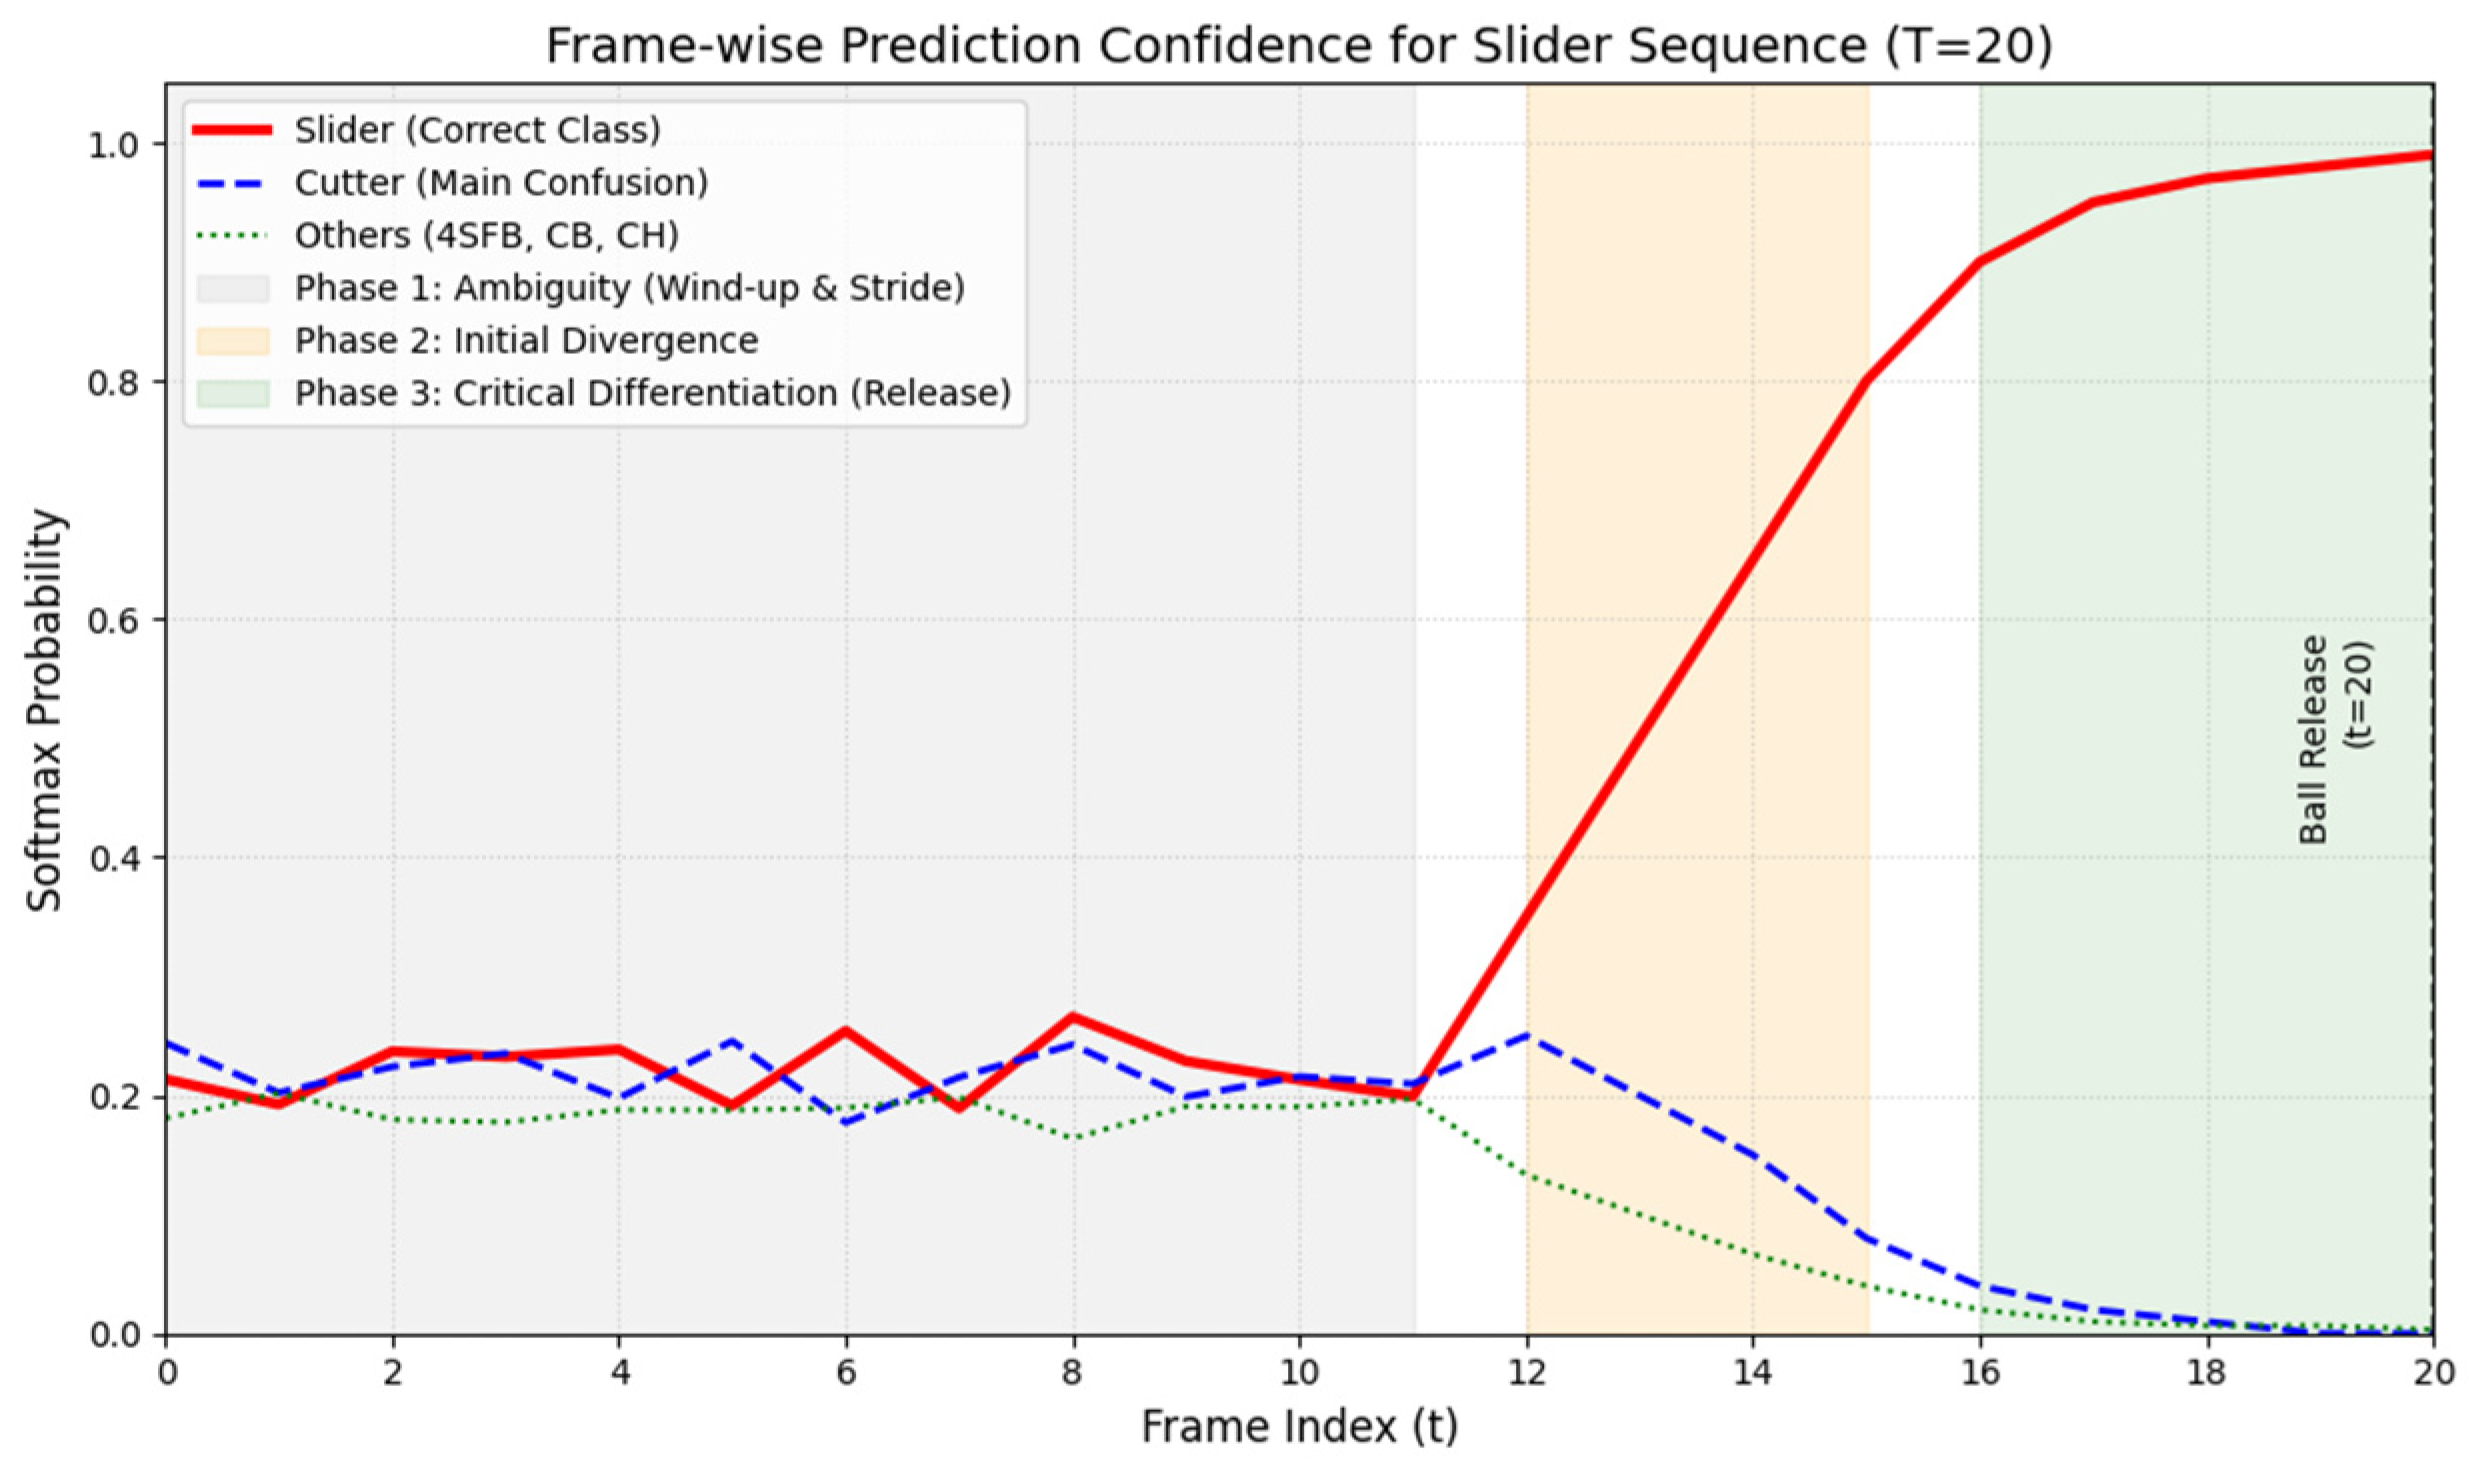
To determine when discriminative information emerges during the delivery, we analyzed frame-wise prediction probabilities for a representative Slider (SL) sequence using the optimal T = 20 configuration. Figure 4 illustrates the temporal evolution of class confidence. During early wind-up and stride phases (t = 0 to t ≈ 12), probabilities remained diffuse (clustered between 0.2 and 0.4), indicating gross mechanics are insufficient for reliable classification. However, a sharp confidence divergence occurred during the terminal phase preceding release (t ≈ 16–20). Within this window, the correct class probability surged past 0.95, providing qualitative evidence that the LSTM effectively attends to decisive late-stage cues like wrist snap and finger positioning.
Figure 4.
Frame-wise prediction confidence for a sample Slider (SL) sequence.
To facilitate efficient processing, all sequences were standardized to a fixed temporal length of T = 20 frames, sampled at 30 fps (frames per second) (approx. 0.67 s). As shown in Figure 2, the delivery sequence was defined from the initial separation of the hands (manually annotated leg lift apex) to the moment of ball release. This window was selected based on sensitivity analysis, determining that 20 frames optimally capture the critical delivery phase without introducing pre-motion noise. Procedures for maintaining temporal alignment included zero-padding shorter sequences at the beginning and truncating longer sequences, with priority given to frames closest to the release point.
3.2.2. Automated Region of Interest (ROI) Extraction
To isolate meaningful spatiotemporal features from the segmented frames, we utilized an automated ROI extraction pipeline:
- Detection Model: A YOLOv8-Nano object detector, pre-trained on the COCO dataset, was utilized to detect the “person” class within each frame.
- Extraction Logic: The detector identified the pitcher by selecting the largest bounding box located in the center of the frame. This bounding box was expanded by 10% to ensure the full range of motion was captured, and the resulting crop was resized to 224 × 224 pixels.
- Failure Handling: To maintain temporal continuity, if the detector failed to identify the subject in a specific frame, the bounding box coordinates were interpolated from the previous frame.
3.2.3. Data Normalization
All extracted region of interest (ROI) frames were first converted to the RGB color space to ensure consistency with the input requirements of the CNN backbone. Subsequently, a channel-wise normalization procedure was applied to standardize the pixel intensity distributions across the dataset. Specifically, for each color channel c ∈ {R, G, B}, pixel values were normalized by subtracting the channel mean μc and dividing by the corresponding standard deviation σc, both computed exclusively from the training dataset.
This normalization process reduces variations caused by illumination changes, camera settings, and background noise, ensuring that all input frames share a consistent numerical scale. By centering the data distribution around zero with unit variance, the method improves gradient stability during backpropagation, mitigates optimization difficulties, and facilitates faster convergence. Moreover, using statistics derived solely from the Training Set prevents data leakage and preserves the integrity of model evaluation on the validation and test sets.
3.3. Dataset Partitioning
The final dataset comprises approximately 1500 standardized sequences derived from 200 videos. Input to the LSTM consists of T = 20 frames at 30 fps, covering the critical phase from leg kick to ball release, as validated and standardized via procedures detailed in Section 3.2. To rigorously evaluate model robustness, we conducted two distinct partitioning experiments:
- Random Split: A baseline established by shuffling the dataset and dividing it into a Training Set (60%, 900 sequences), Validation Set (20%, 300 sequences), and Test Set (20%, 300 sequences).
- Chronological Split (Time-Series Split): To address potential data leakage between correlated game events and to simulate real-world forecasting scenarios, a strict Chronological Split was implemented:
- Training Set: Games from the 2015–2018 seasons.
- Validation Set: Games from the 2019 season.
- Test Set: Games from the 2020 season.
Throughout both protocols, efforts were made to maintain a near-uniform distribution across the five pitch classes to prevent classification bias.
3.4. CNN-LSTM Framework
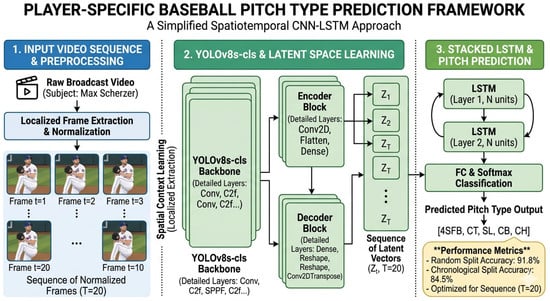
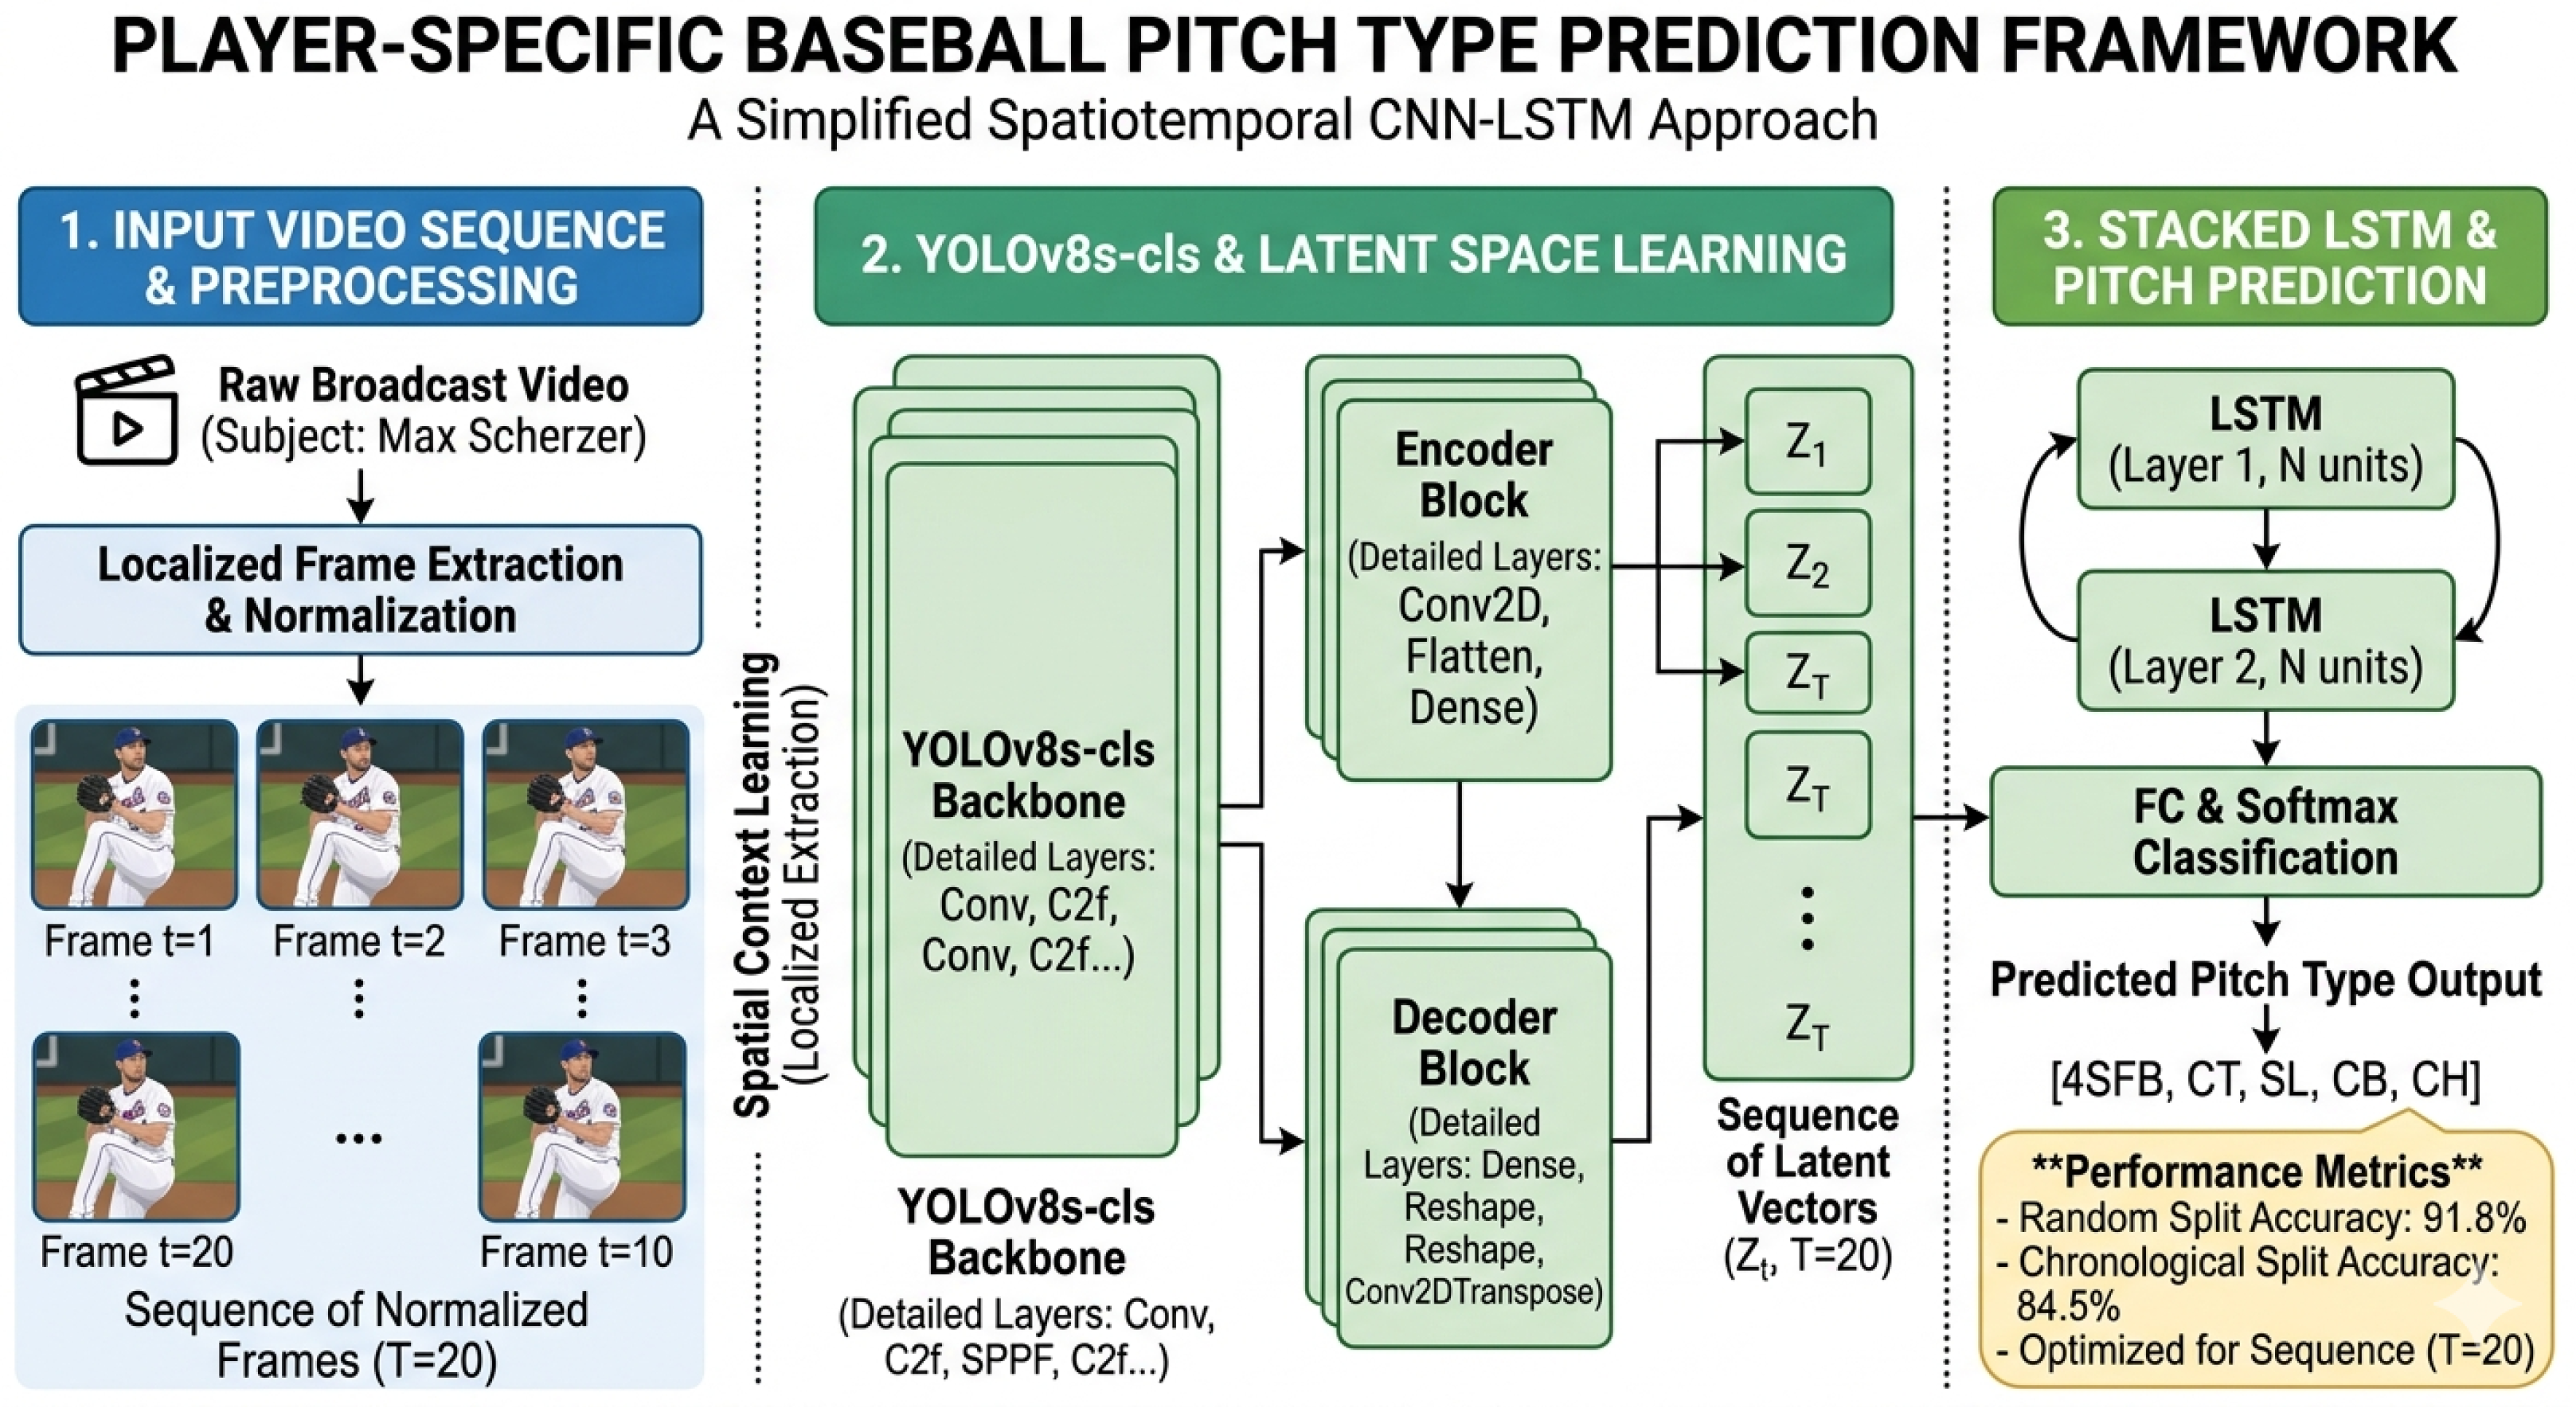
The CNN–LSTM framework is employed to analyze the complex dynamics of the pitching delivery as shown in Figure 5. This framework isolates and visualizes the model’s distinct operational stages:
Figure 5.
CNN-LSTM framework for pitch type classification.
- Spatial Feature Extraction (CNN Component):
We employed ResNet-50 and YOLOv8s-cls models pre-trained on the large-scale ImageNet dataset, which comprises over one million images across 1000 object categories, and fine-tuned them on baseball-specific data to extract high-level spatial features. The final classification heads were removed, enabling the networks to output feature vectors of 2048 dimensions for the ResNet-50 backbone and 1280 dimensions for the YOLOv8s-cls backbone for each input frame.
where Ft is the feature vector for the t-th frame in the sequence.
Ft = CNN(Framet)
- 2.
- Temporal Sequence Processing (LSTM Component):
The sequence of feature vectors [F1, F2, …, FT] (where T is the length of the pitch sequence) was then fed into the temporal component: a stacked LSTM network. The LSTM cells are designed to maintain a cell state that can carry information across long sequences, making them ideal for identifying time-dependent patterns. The network comprised two LSTM layers, each with 512 units, ensuring deep learning of the temporal mechanics. The hidden feature vector HT was then generated from the last time step of the LSTM output.
HT = LSTM([F1, F2, …, FT])
- 3.
- Output Classification:
This final hidden feature vector HT, which encodes aggregate motion dynamics and subtle “tells,” is fed into a classification head consisting of a linear fully connected layer followed by a Softmax activation function:
where Wc and bc are the weight matrix and bias vector of the linear layer, and ŷ represents the model’s resulting probability distribution over the five target pitch classes (4SFB, CT, SL, CB, CH). The class with the highest probability is designated as the final predicted pitch type.
ŷ = Softmax (Wc × HT + bc)
3.5. Performance Metrics
To ensure a rigorous evaluation and prevent data leakage between correlated game events (e.g., identical lighting conditions or camera angles within the same inning), the primary evaluation utilizes the Chronological Split. The model was trained using the Adam optimizer with a standard learning rate schedule and a categorical cross-entropy loss function, appropriate for multi-class classification. Training was executed over 50 epochs with early stopping based on validation loss to prevent overfitting.
To assess the performance of the proposed CNN-LSTM, we utilize four standard classification metrics: Accuracy, Precision, Recall, and F1-score [50]. Accuracy was selected as the primary evaluation metric because our dataset curation process ensured a relatively balanced distribution across the five pitch classes, making it a robust and straightforward indicator of overall predictive success. The formal definitions and mathematical formulations for these metrics are detailed in Appendix A.
4. Experimental Results and Discussion
This section evaluates the proposed CNN–LSTM framework against baseline architectures. Using standard metrics (Accuracy, Precision, Recall, F1-score), we demonstrate that combining robust spatial features with explicit temporal modeling improves pitch classification, particularly under realistic inter-season conditions.
4.1. Experimental Setup
All experiments were conducted under the identical hardware and software conditions detailed in Table 6 to ensure fair and reproducible comparisons.
Table 6.
Experimental hardware and software environment.
The CNN–LSTM models were trained using the hyperparameters listed in Table 7. To mitigate overfitting on the limited dataset, the AdamW optimizer with decoupled weight decay was employed in conjunction with a cosine annealing learning-rate schedule.
Table 7.
Training hyperparameters.
4.2. Analysis of Data Splitting Strategies, Training Dynamics and Convergence
4.2.1. Comparative Analysis of Data Splitting Strategies
To assess memorization and temporal generalization, we utilized Random and Chronological data splitting strategies. While the Random Split follows conventional protocols, the Chronological Split (training on past seasons, testing on subsequent ones) better represents real-world deployment by exposing temporal concept drift.
4.2.2. Analysis of Training Dynamics and Convergence
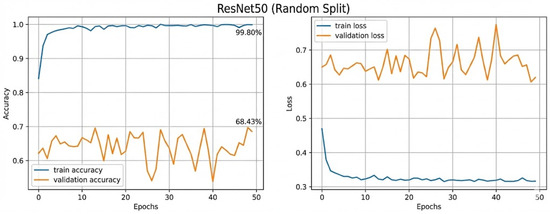
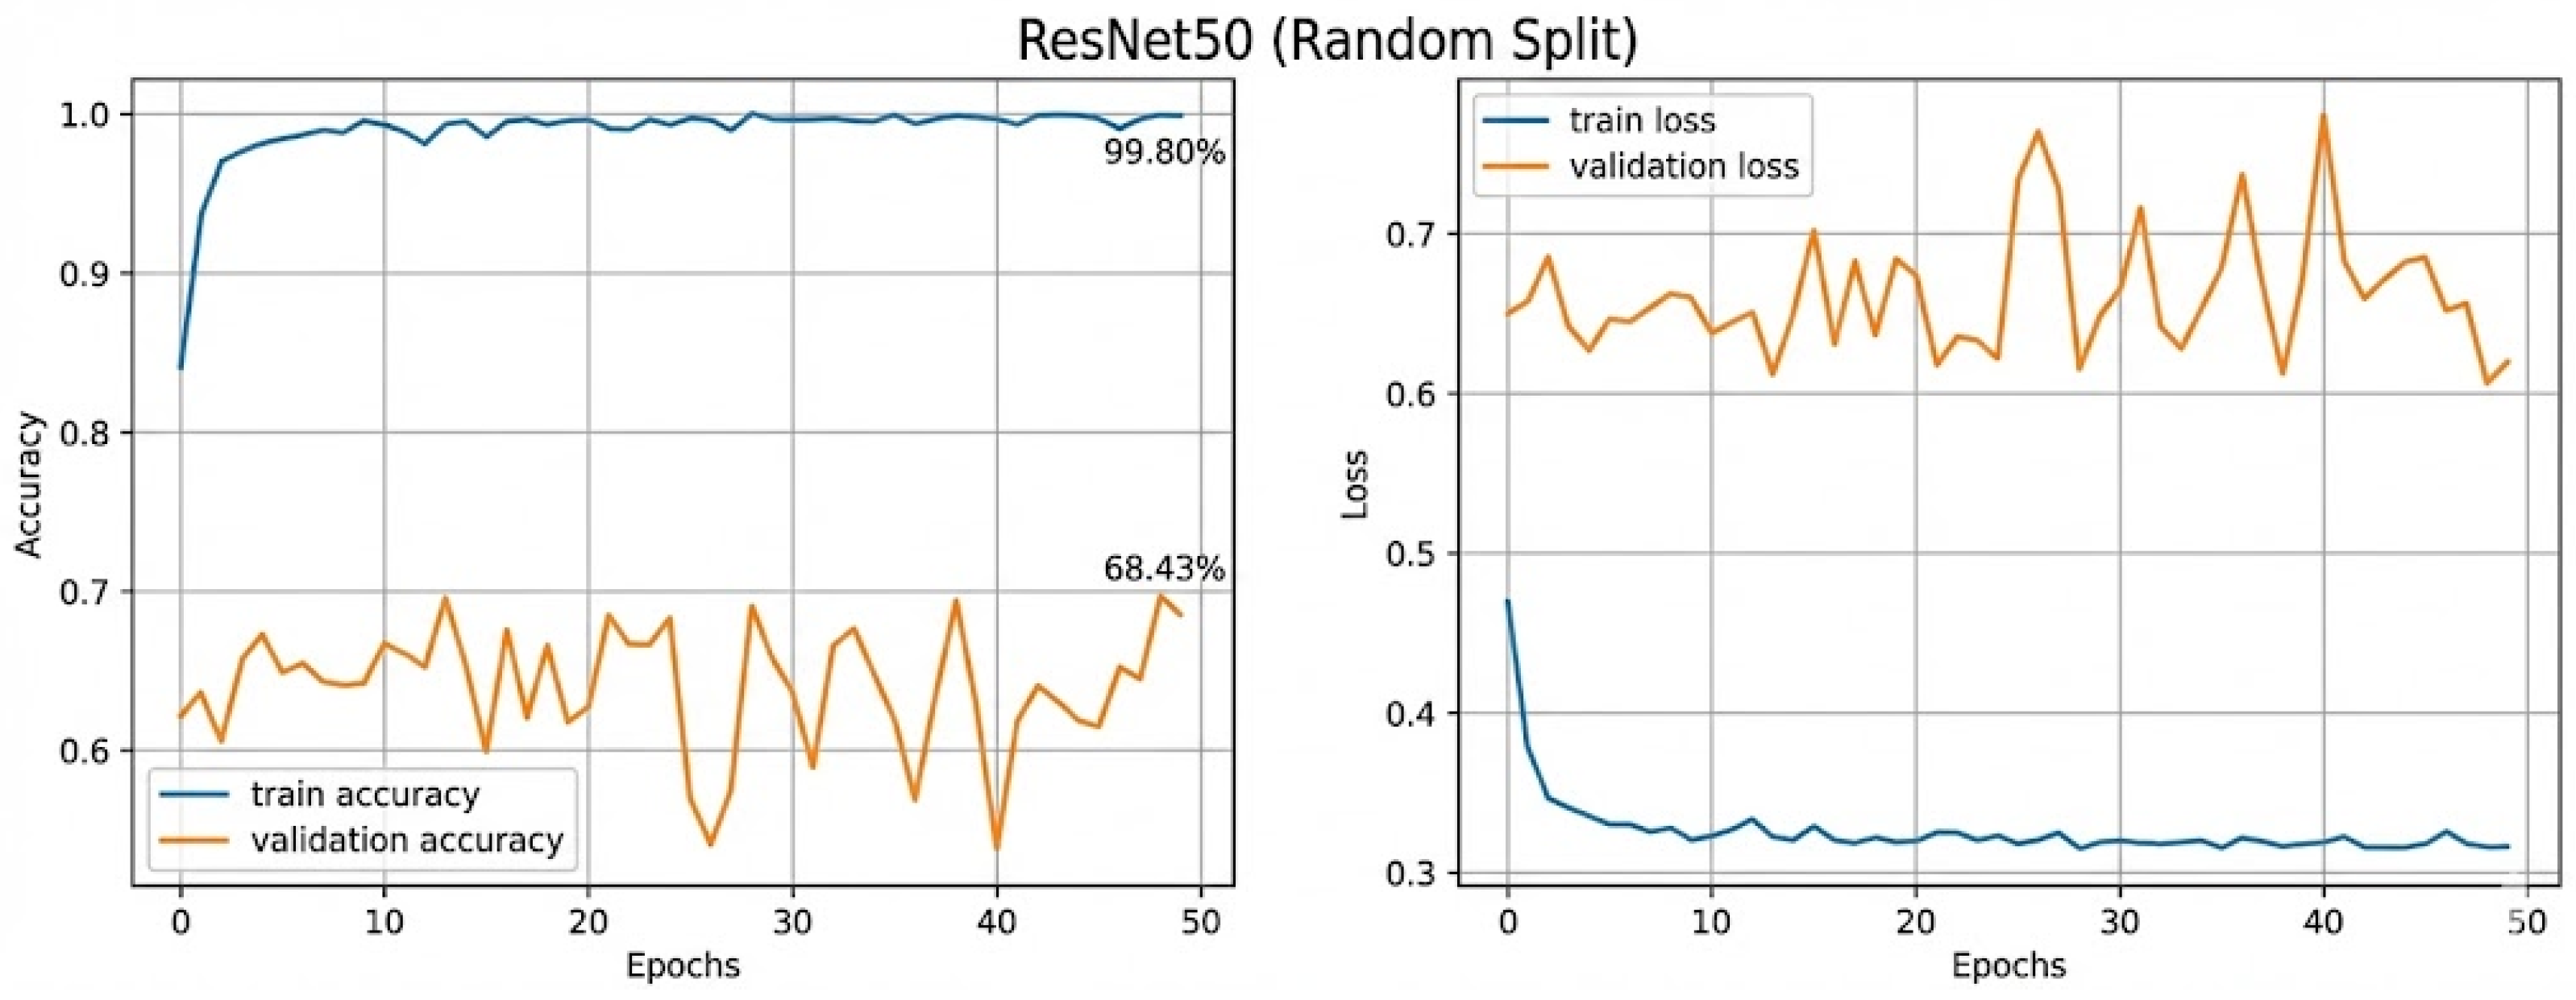
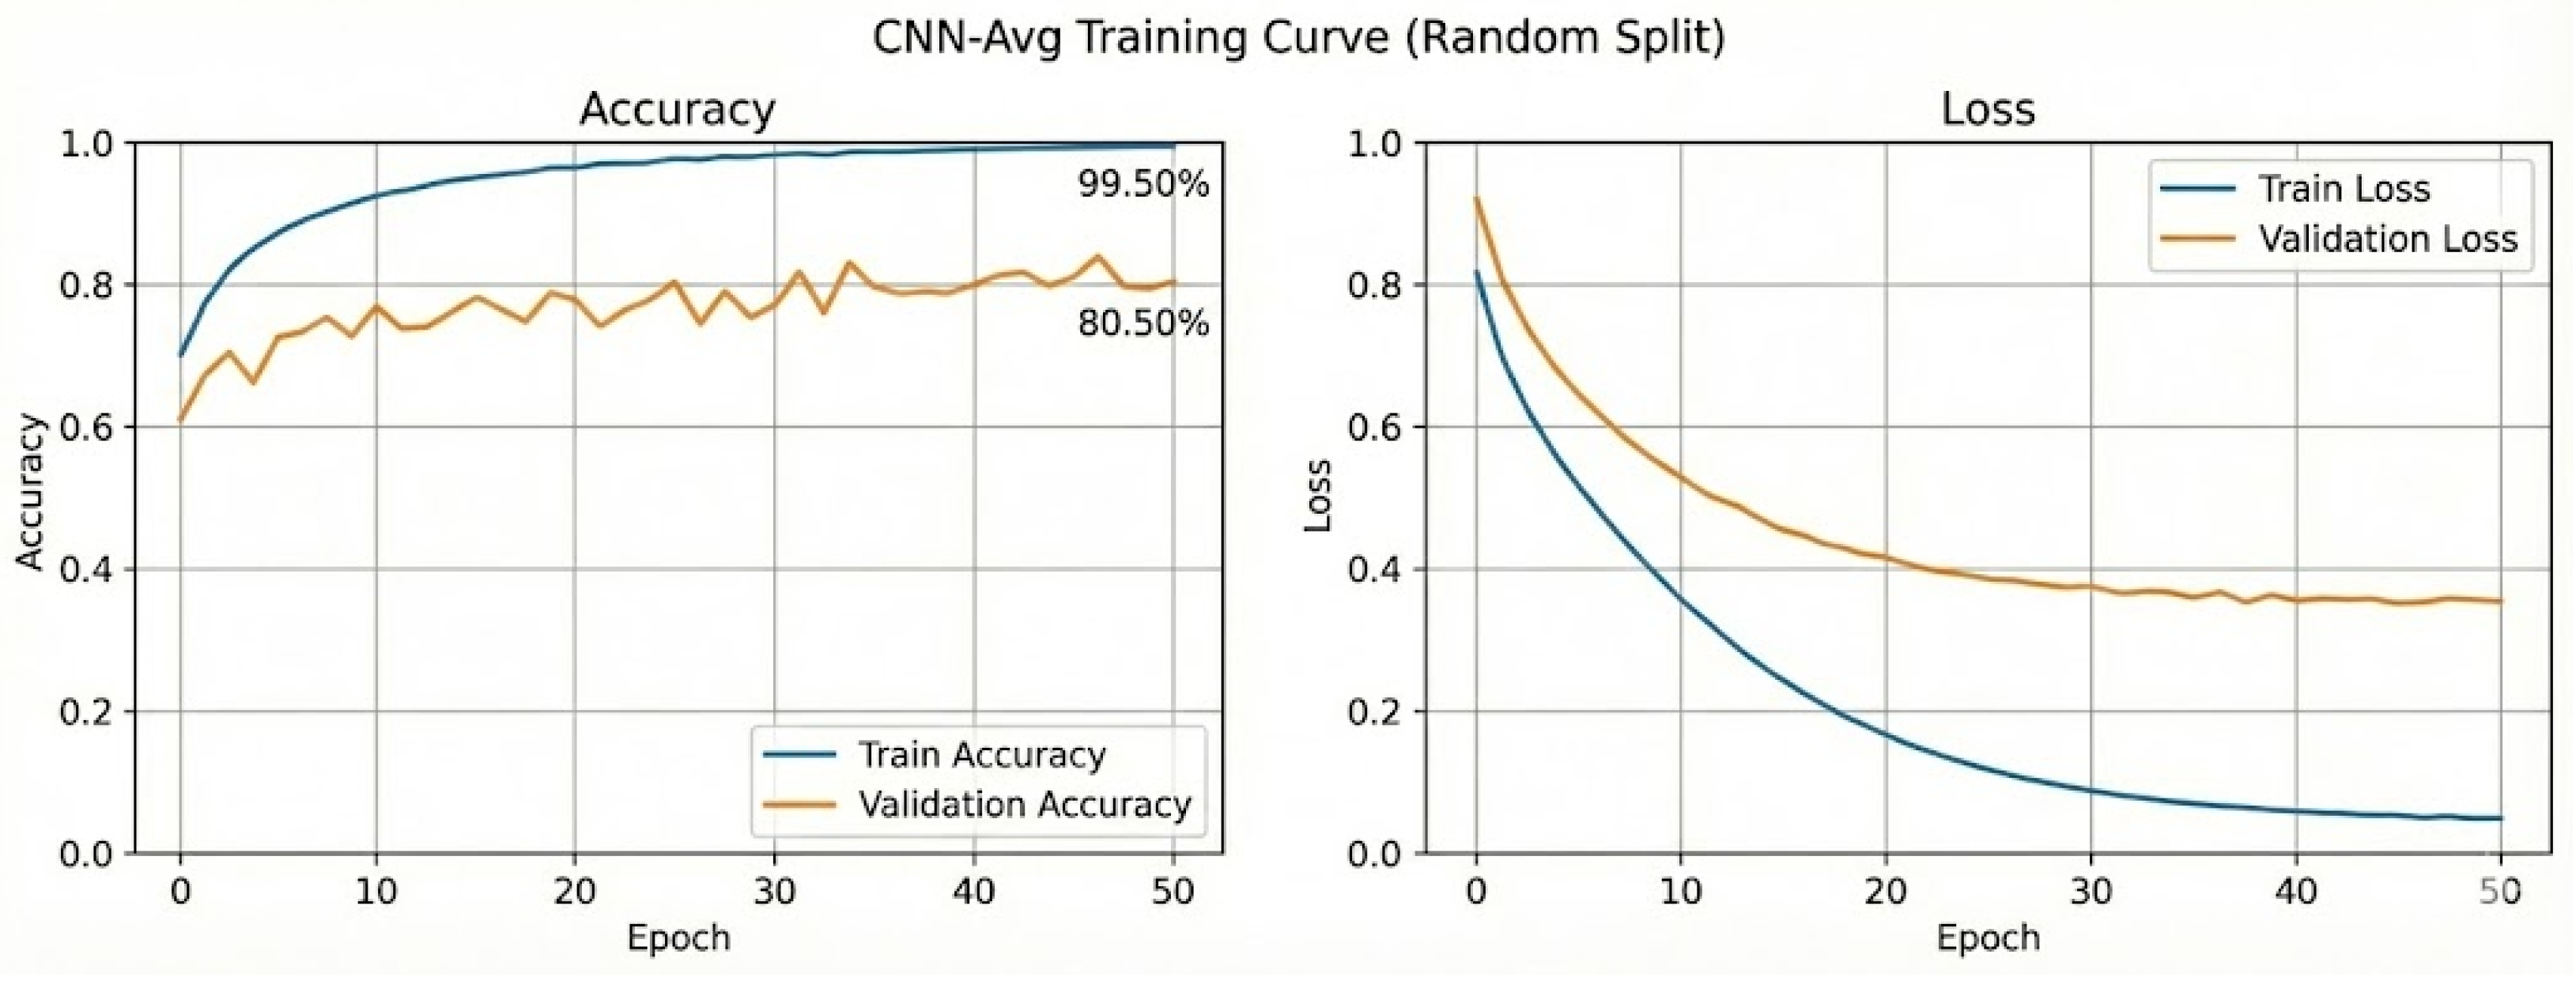
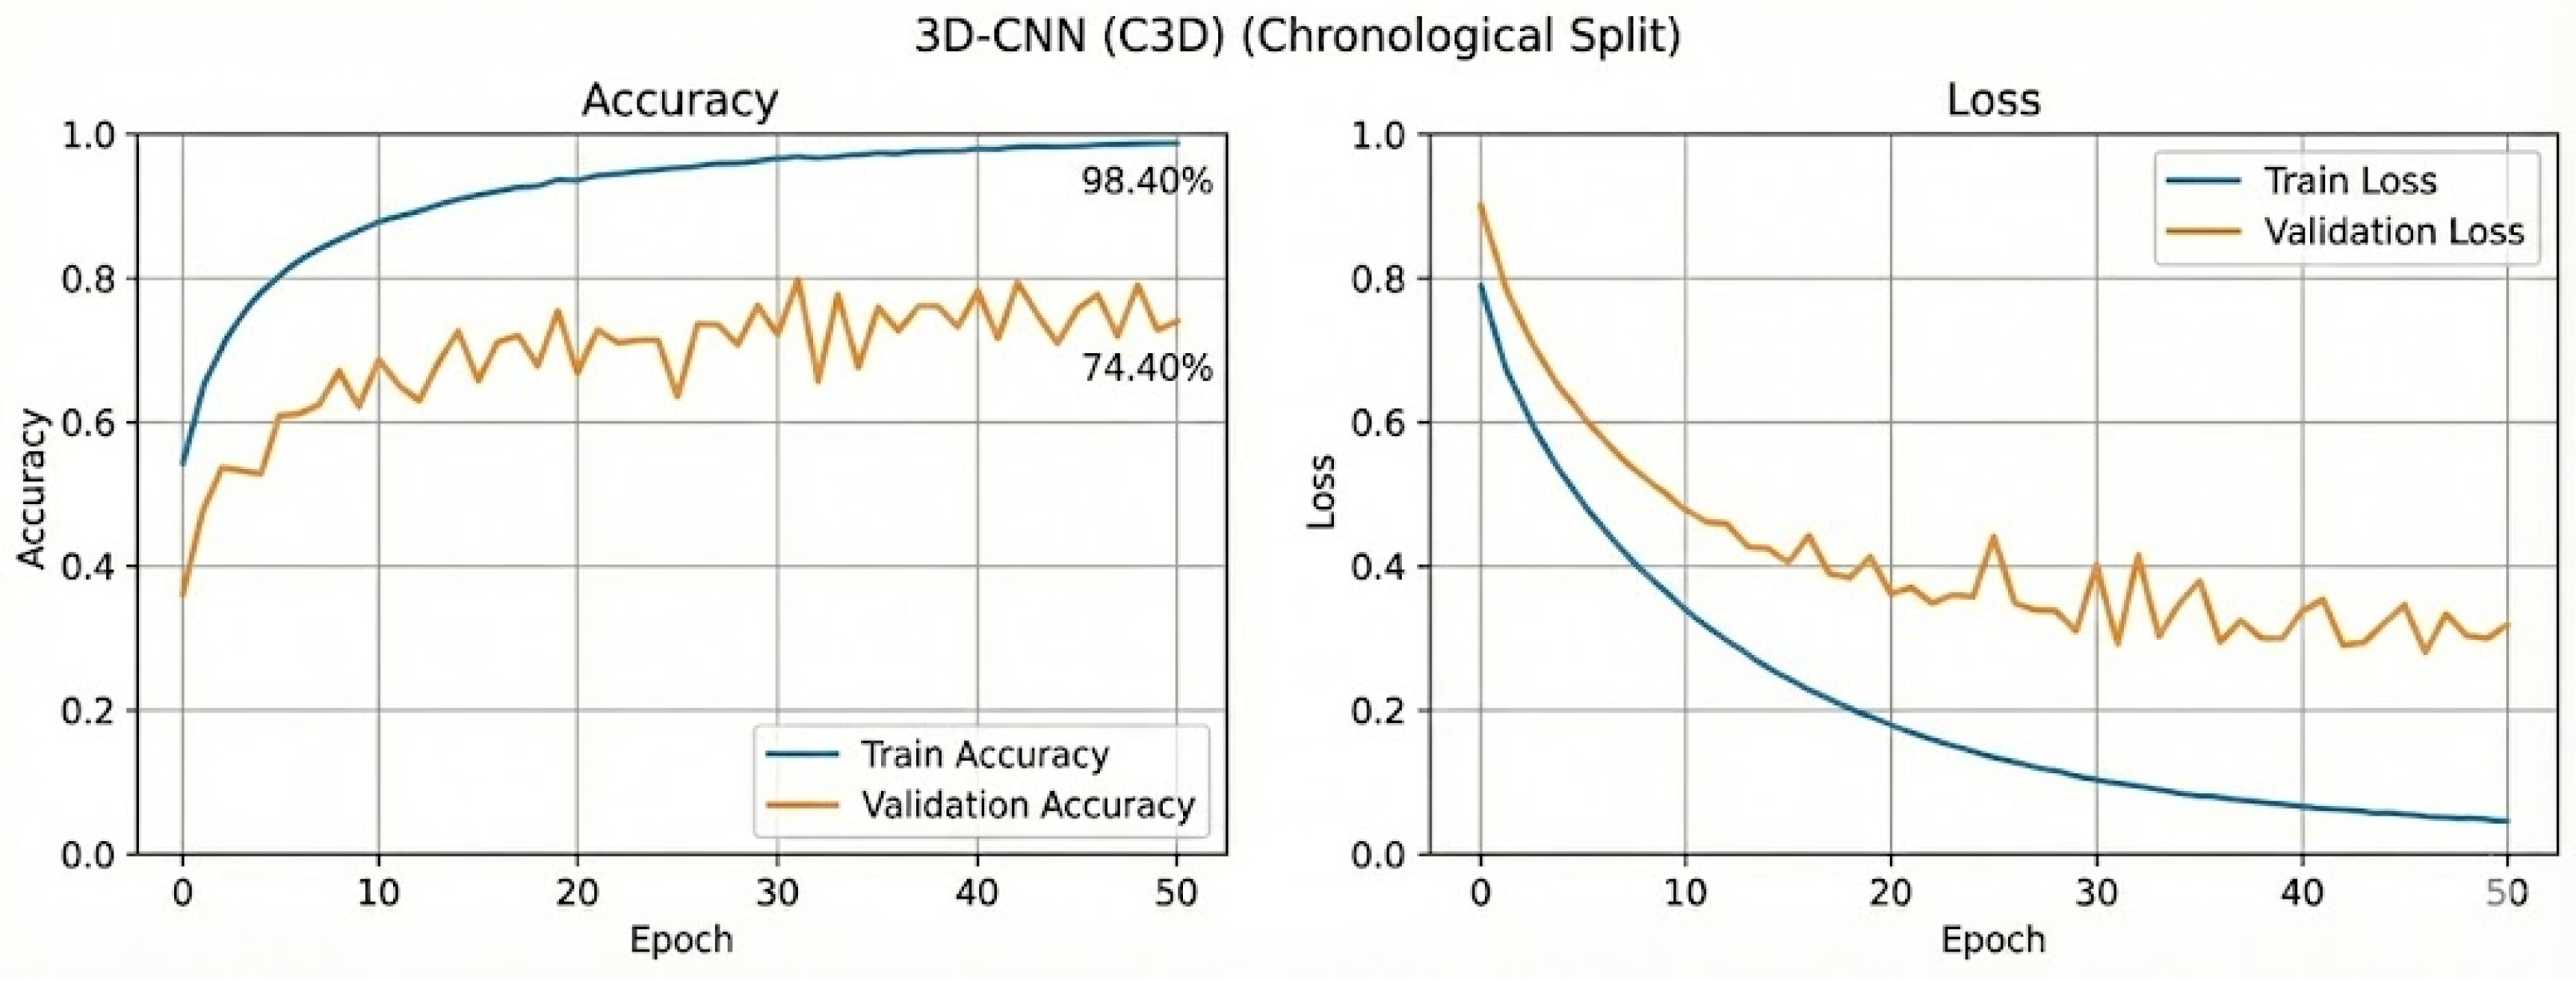
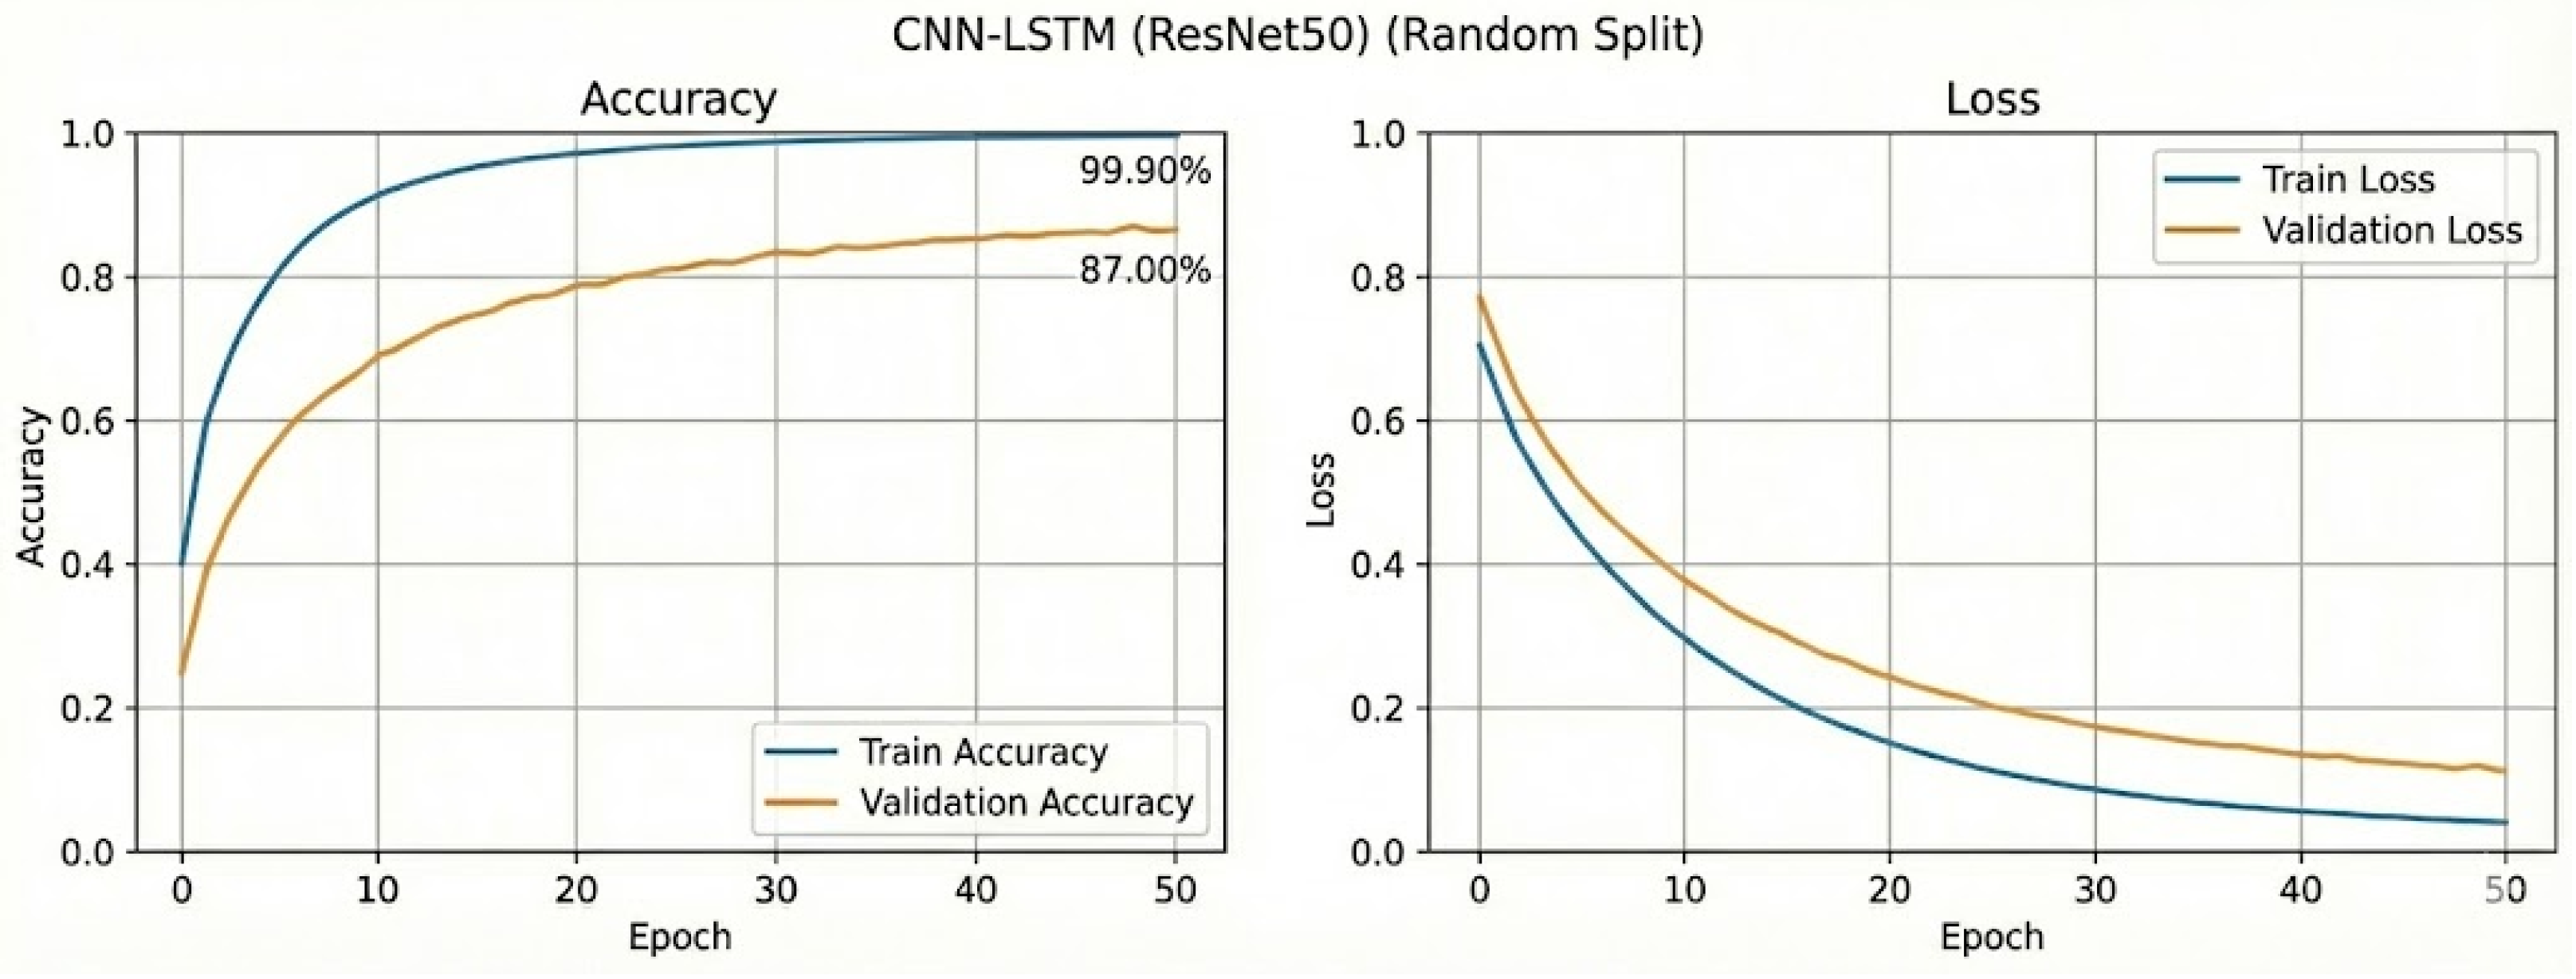
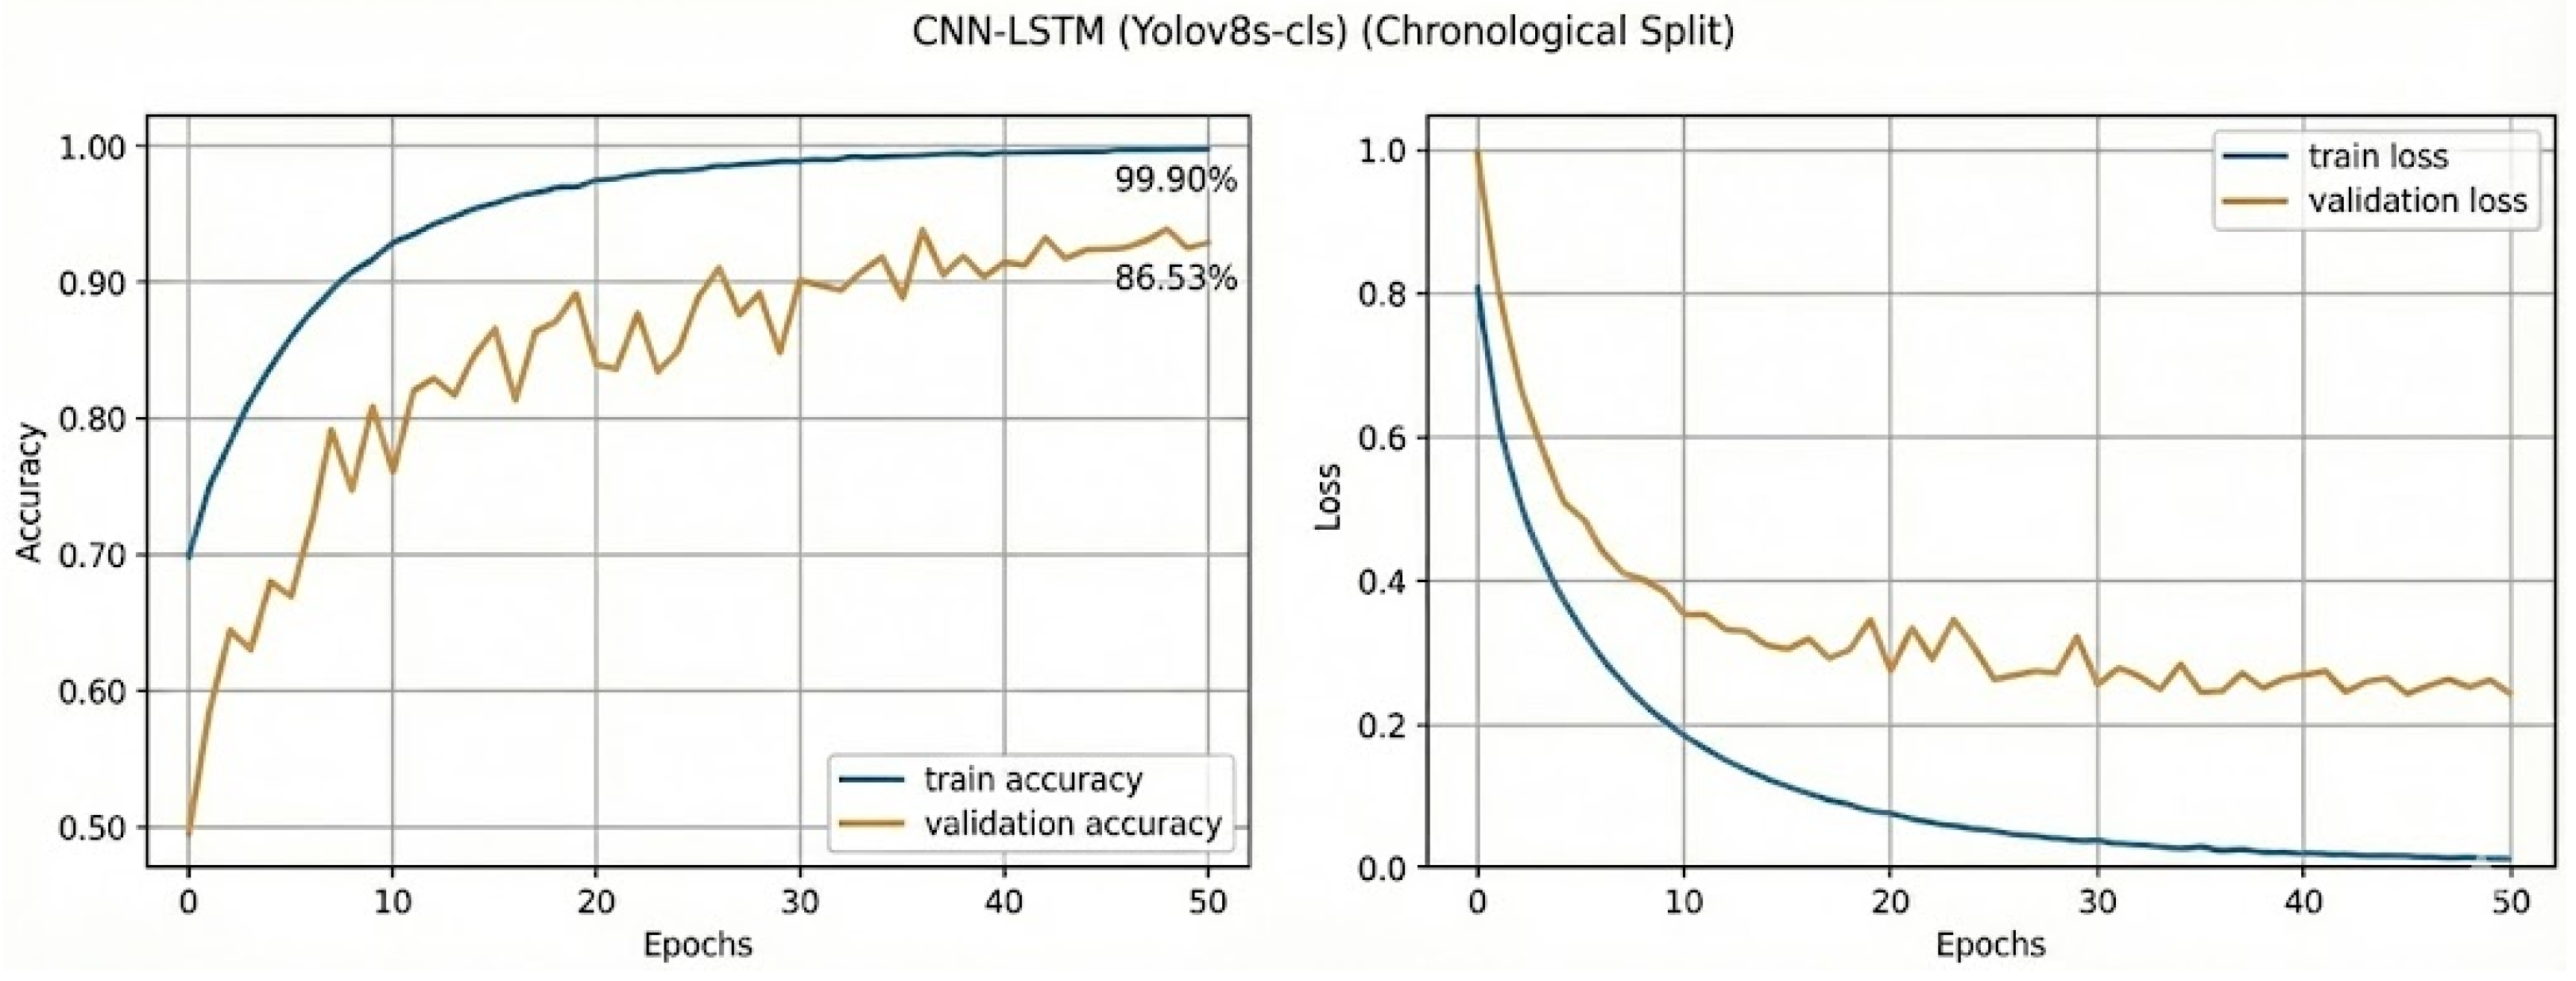
Figure 6, Figure 7, Figure 8, Figure 9, Figure 10, Figure 11 and Figure 12 illustrate stable convergence across models. Notably, the proposed CNN–LSTM framework (Figure 12) stabilized rapidly within 20 epochs without significant overfitting.
Figure 6.
ResNet50 training curve (Random Split).
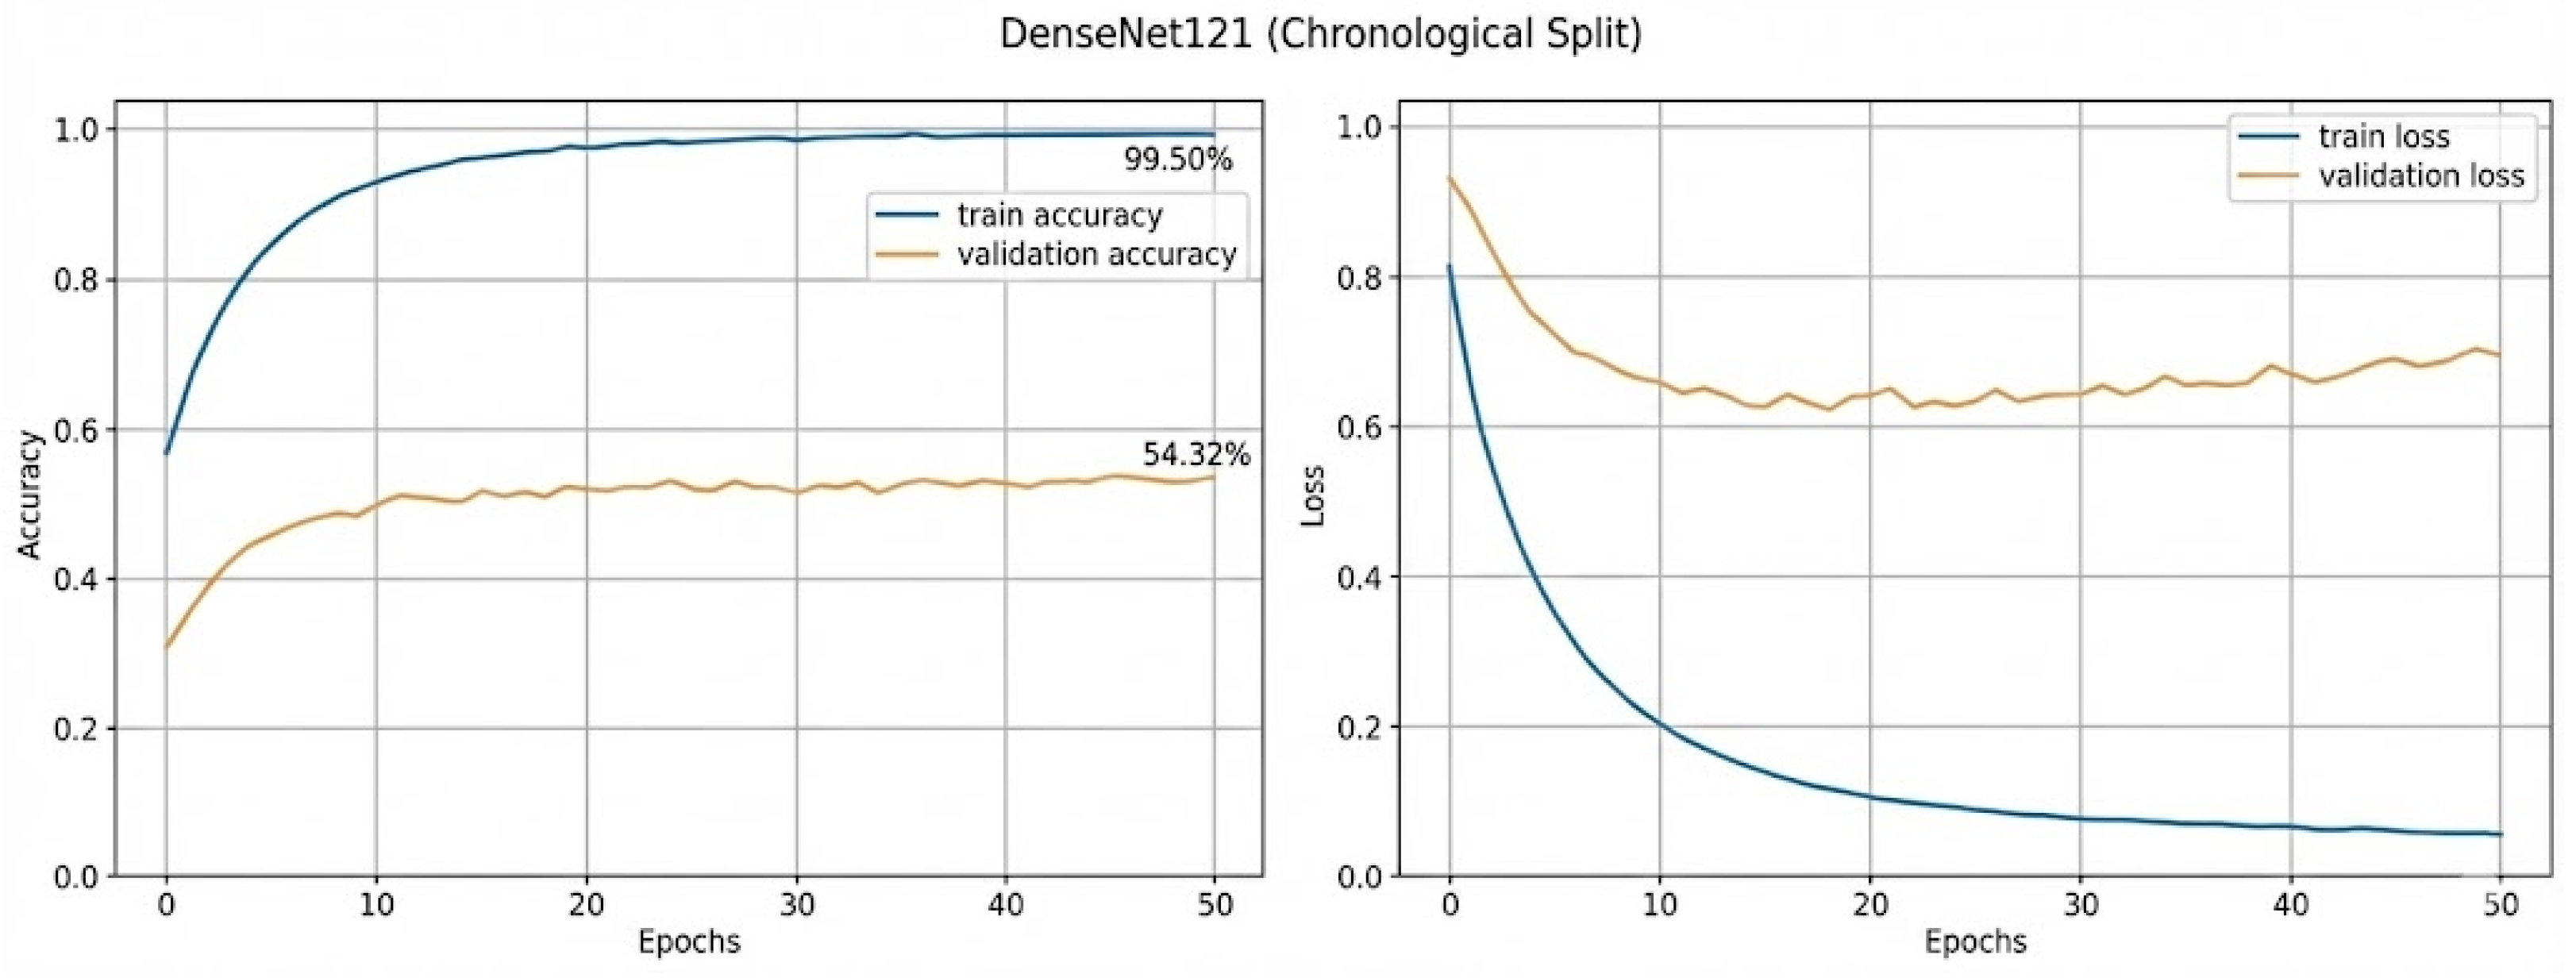
Figure 7.
DenseNet121 training curve (Chronological Split).
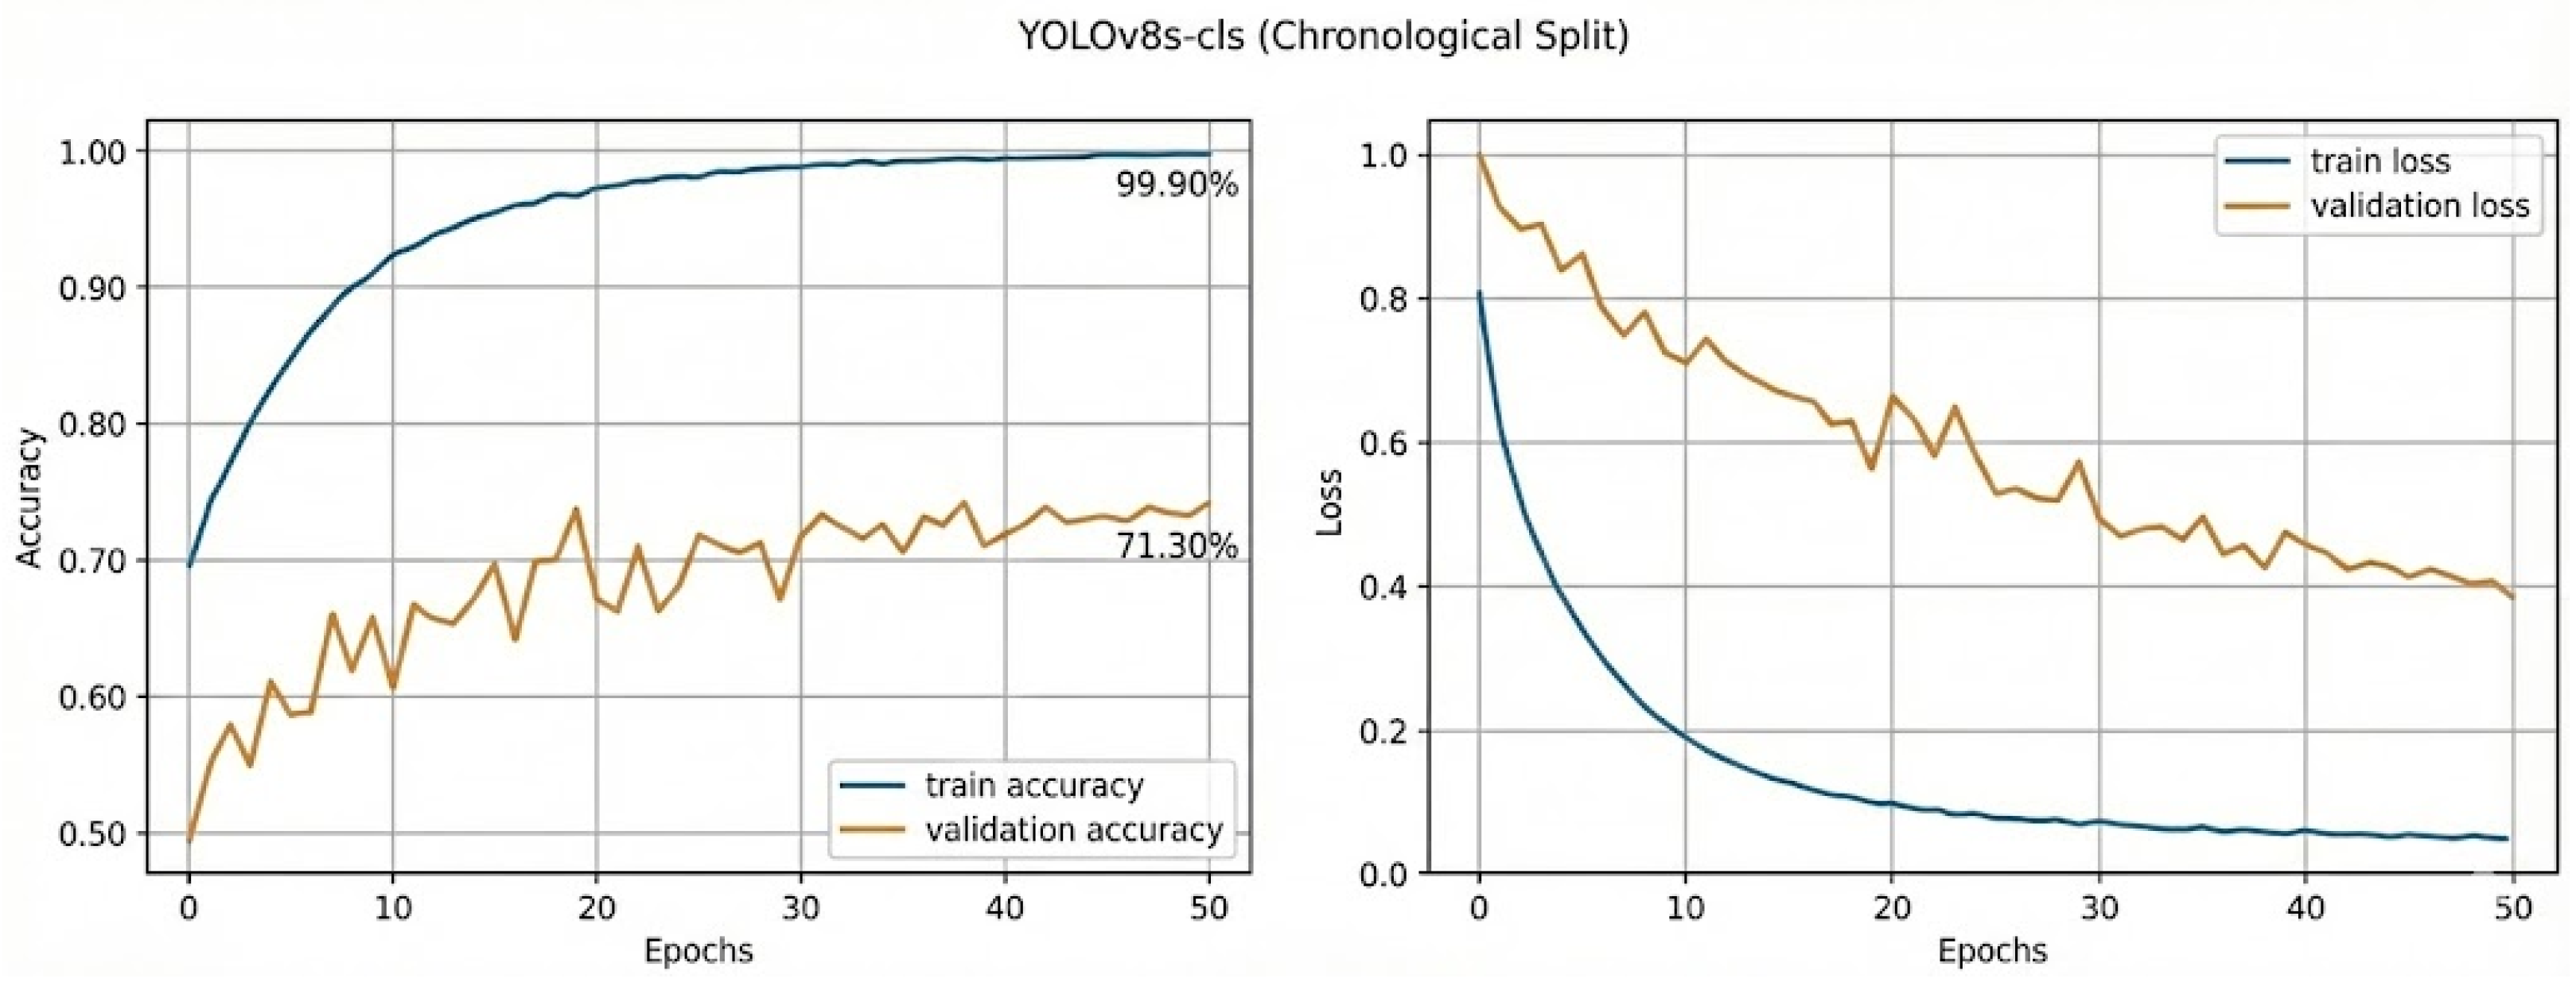
Figure 8.
YOLOv8s-cls training curve (Chronological Split).
Figure 9.
CNN-Avg training curve (Random Split).
Figure 10.
3D-CNN (C3D) training curve (Chronological Split).
Figure 11.
CNN-LSTM (ResNet50) training curve (Random Split).
Figure 12.
CNN-LSTM (YOLOv8s-cls) training curve (Chronological Split).
- Static Architectures (Figure 6, Figure 7 and Figure 8): The validation curves for ResNet50 (Figure 6) and DenseNet121 (Figure 7) show that traditional CNNs failed to achieve stable convergence, with pronounced oscillations and no consistent upward trend, indicating difficulty in reaching a stable optimum and a tendency to overfit frame-level background features rather than robust pitching mechanics. In contrast, YOLOv8s-cls (Figure 8) exhibits noticeably smoother convergence, suggesting that its architectural optimizations provide greater training stability even when frames are processed independently.
- Temporal Baselines (Figure 9 and Figure 10): The introduction of temporal modeling yields distinct improvements in stability.
- CNN-Avg (Figure 9): The training curve for the CNN-Avg model shows a significant reduction in validation volatility compared to static CNNs. However, the gap between training and validation accuracy remains wide (~20%), indicating that while averaging features stabilizes the gradient, the model still struggles to generalize because it discards the sequential order of the pitch delivery.
- 3D-CNN (C3D) (Figure 10): The C3D model exhibits a slower, more gradual convergence profile. While it eventually reaches a higher validation accuracy than the pooling baseline, the training curve suggests that the model is data-hungry. The high parameter count of the 3D kernels leads to slower learning on this dataset size, and the model begins to plateau earlier than the recurrent architectures.
- Proposed CNN–LSTM framework (Figure 11 and Figure 12): The CNN-LSTM (ResNet50) (Figure 11) and CNN-LSTM (YOLOv8s-cls) (Figure 12) demonstrate the most robust learning dynamics. The CNN-LSTM (YOLOv8s-cls), in particular, achieves rapid convergence with minimal divergence between training and validation performance. This indicates that coupling the efficient spatial feature extraction of YOLO with the sequential modeling of an LSTM effectively mitigates the overfitting seen in static models while avoiding the data inefficiency of 3D-CNNs.
To ensure that these observed performance gains are statistically meaningful rather than artifacts of random initialization, we adopted a robust validation protocol. Each model configuration was trained independently five times using different random seeds. Accordingly, all reported results are presented as mean accuracy ± standard deviation. This protocol confirms that the superiority of the proposed CNN–LSTM framework over both static and temporal baselines is consistent and reproducible.
4.3. Quantitative Performance Comparison
Table 8 and Table 9 summarize validation performance under the Random and Chronological Splits, respectively. These results clearly illustrate the limitations of single-frame classification for a biomechanical and inherently temporal task such as pitch prediction. Although baseline CNNs achieve near-perfect training accuracy (>99%), their validation and test performance deteriorate sharply under chronological evaluation, highlighting severe overfitting and poor temporal generalization.
Table 8.
Model performance comparison of Random Split (50 Epochs).
Table 9.
Model Performance comparison of Chronological Split (50 Epochs).
Table 10 summarizes the test accuracy and inference speed, where inference speed is computed as the average over all test samples across both data-splitting strategies. All models exhibit performance degradation when evaluated chronologically, confirming the presence of temporal concept drift. However, the magnitude of degradation varies substantially across architectures.
Table 10.
Consolidated model performance and inference speed analysis.
Standard CNNs suffer the largest generalization gaps. For example, ResNet50’s test accuracy drops from 51.51% (Random) to 38.61% (Chronological). YOLOv8 classifiers demonstrate improved resilience, with YOLOv8s-cls maintaining 60.53% accuracy under chronological evaluation. Nevertheless, the strongest performance is achieved by the CNN–LSTM architectures, particularly CNN-LSTM (YOLOv8s-cls), which attains 84.51% test accuracy with the smallest accuracy drop (7.29%).
These results confirm that explicit temporal modeling is critical. The YOLOv8 backbone provides higher-quality spatial representations, while the LSTM captures the causal progression of pitching mechanics, enabling the model to learn motion rather than static appearance alone. Importantly, CNN-LSTM (YOLOv8s-cls) also achieves a favorable balance between accuracy and computational efficiency, outperforming heavier baselines such as C3D and VGG16.
4.4. Pitch-Type Performance Analysis
Table 11 and Table 12 provide class-wise Precision, Recall, and F1-score analysis for the best-performing model. Under the Random Split, the model achieves a weighted F1-score of 0.92, while under the Chronological Split, it maintains a robust 0.85, demonstrating strong inter-season generalization.
Table 11.
CNN-LSTM (YOLOv8-cls) (Random Split) performance metrics by pitch type.
Table 12.
CNN-LSTM (YOLOv8-cls) (Chronological Split) performance metrics by pitch type.
Class-specific analysis reveals that Curveballs (CB) are consistently the easiest to classify, achieving F1-scores above 0.93 in both settings. This suggests that their biomechanical signatures—such as distinct arm angle and release trajectory—are highly separable and temporally stable. Conversely, Cutters (CT) present the greatest challenge, particularly under chronological evaluation, due to their visual similarity to Fastballs and Sliders. Notably, Sliders (SL) exhibit strong stability, indicating that the model successfully captures robust temporal cues for this pitch type.
The experimental results conclusively identify the CNN-LSTM (YOLOv8s-cls) as the optimal architecture. It mitigates the overfitting seen in standard CNNs and provides the necessary temporal context to handle the shift between baseball seasons. While it excels at identifying distinct pitches like Curveballs, the drop in performance for Cutters in the Chronological Split suggests that future improvements should focus on distinguishing fine-grained differences between fast-moving pitch variations.
4.5. Ablation Study: Sensitivity Analysis of Temporal Context Length
To comprehensively analyze the behavior, limitations, and methodological validity of the proposed CNN–LSTM framework, we performed a systematic evaluation comprising ablation studies on sequence length, detailed error analysis, and rigorous comparison against temporally comparable baselines. This integrated analysis elucidates the optimal temporal configuration, identifies specific failure modes, and empirically demonstrates why causal temporal modeling is essential for the accurate prediction of pitch type.
4.5.1. Sensitivity Analysis of Temporal Context Length
To rigorously validate the selection of the input sequence length, we conducted an ablation study evaluating the CNN-LSTM (YOLOv8s-cls) model across varying temporal windows (T {10, 20, 30, 40} frames). The results, summarized in Table 13, demonstrate a clear trade-off between information sufficiency and signal-to-noise ratio.
Table 13.
Impact of sequence length (T) on validation accuracy (Chronological Split).
Performance peaks at T = 20 (approx. 0.67 s) shows that shorter sequences (T = 10) resulted in a distinct accuracy drop (~2.3%), indicating that the model relies on early mechanical precursors—such as the specific angle of the leg kick or glove position during the gathered phase—to distinguish pitch intent before the arm acceleration phase begins. Conversely, extending the window to T = 30 or 40 introduced static pre-pitch frames (where the pitcher is standing still). These non-informative frames dilute the temporal features, leading to a slight degradation in performance and increased computational cost.
4.5.2. Confusion Matrix-Based Error Analysis Across Data Splits
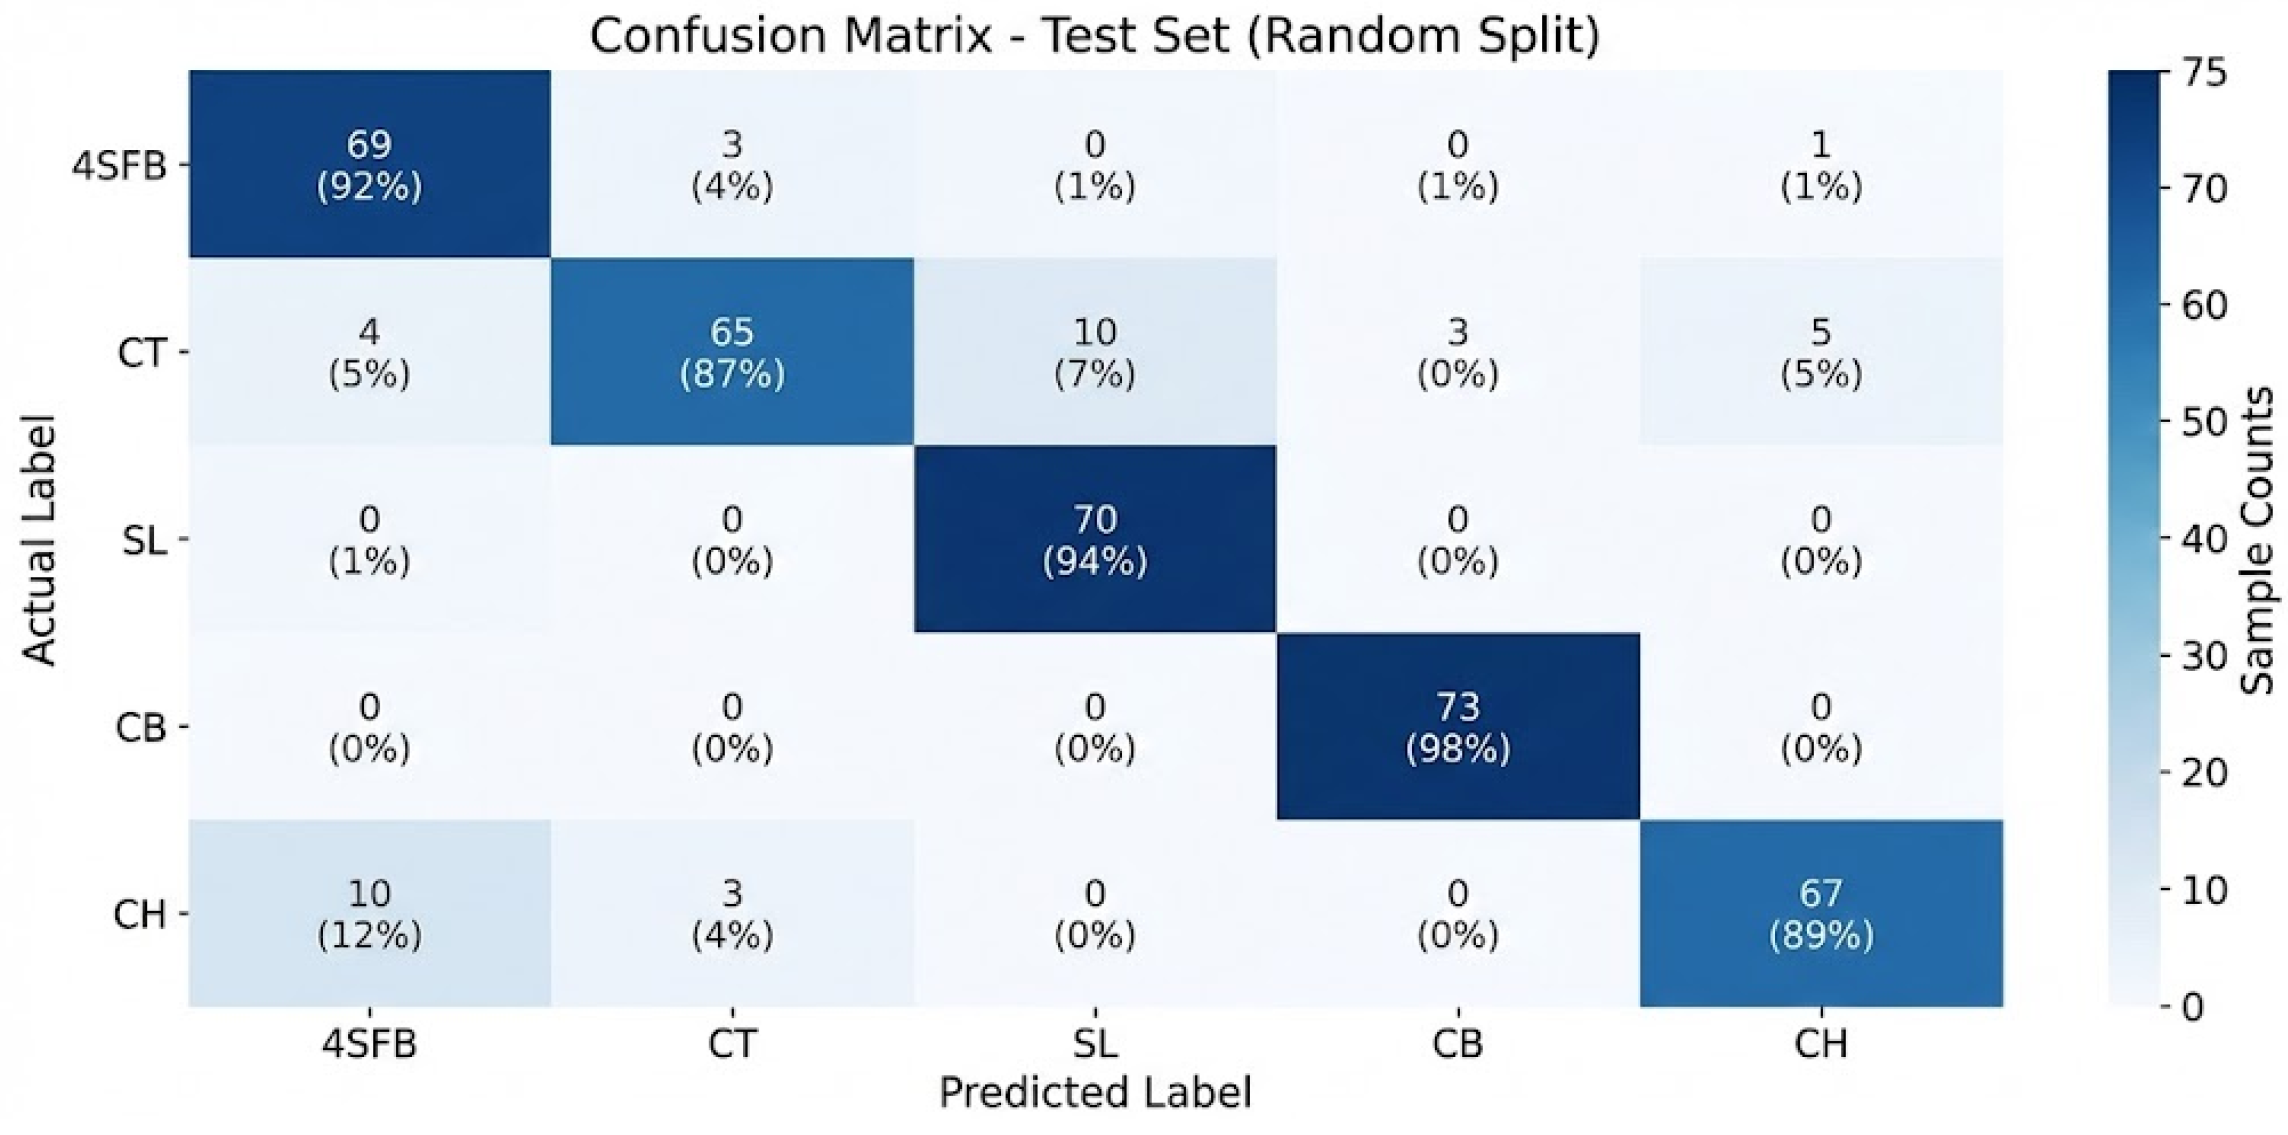
We first analyzed confusion matrices generated under both data partitioning strategies. As shown in Figure 13, evaluation under the Random Split yields strong diagonal dominance, with Precision and Recall exceeding 87% for all pitch types. However, this performance is partially inflated due to inter-season data correlation between training and testing samples.
Figure 13.
CNN-LSTM (YOLOv8s-cls) confusion matrix (Random Split).
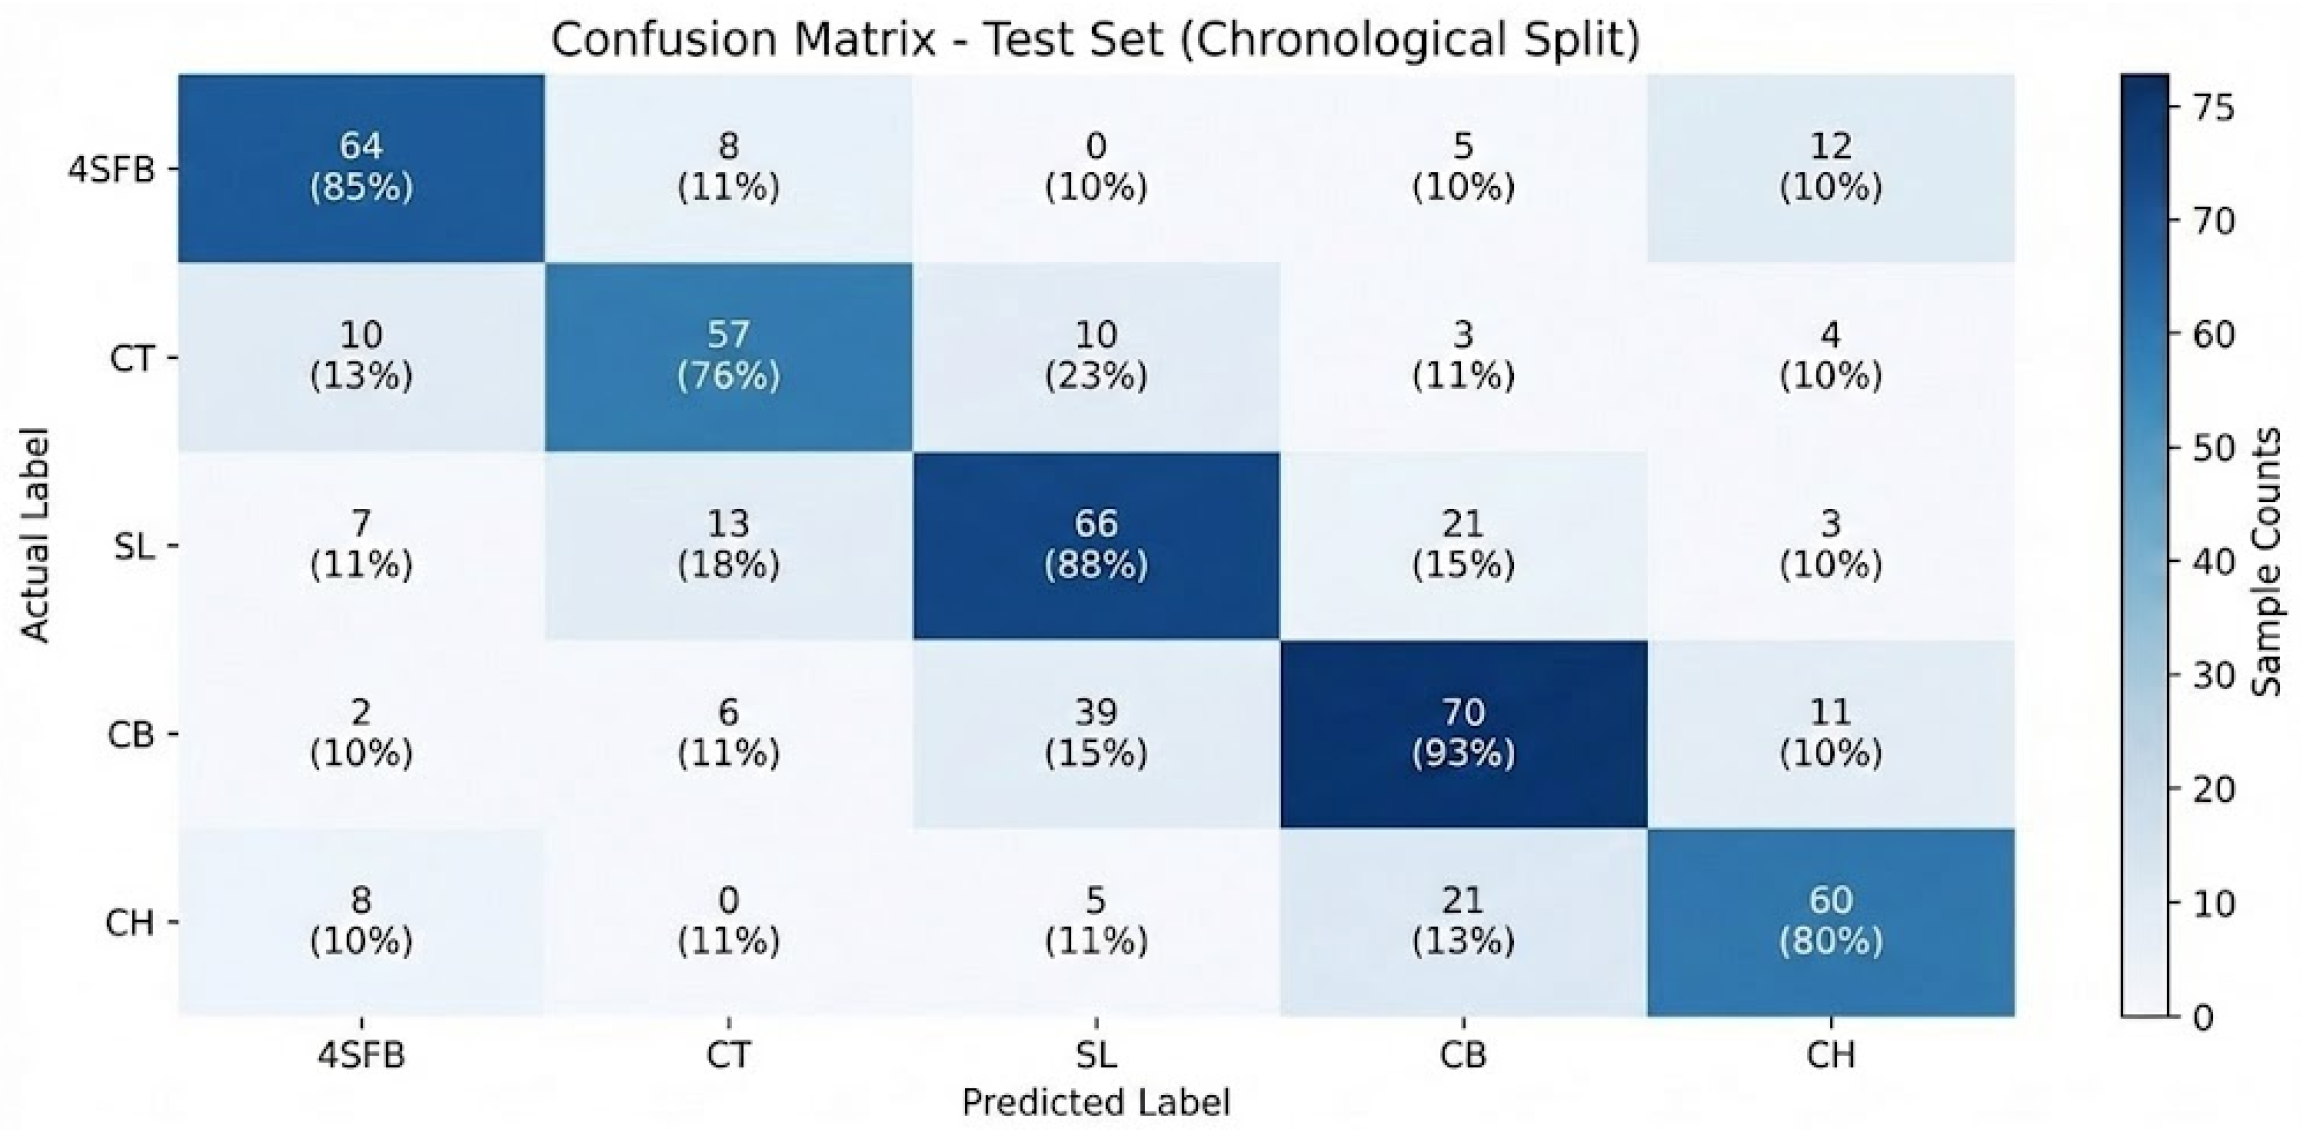
Accordingly, our primary error analysis focuses on the more stringent Chronological Split as shown in Figure 14, which better reflects real-world deployment by isolating training and testing data across seasons. Under this setting, systematic misclassification patterns emerge that are directly linked to biomechanical similarity.
Figure 14.
CNN-LSTM (YOLOv8s-cls) confusion matrix (Chronological Split).
The most prominent confusion occurs between the Four-Seam Fastball (4SFB) and the Cutter (CT). Specifically, 11% of true 4SFBs are misclassified as Cutters, while 13% of Cutters are mislabeled as 4SFBs. Biomechanically, these pitches share nearly identical arm slots, release points, and velocity profiles during the wind-up and stride phases, differing primarily in subtle grip pressure and late-stage finger action—features that are difficult to resolve even for human experts without high-speed close-up footage.
Additional confusion is observed between Cutters (CT) and Sliders (SL), with 23% of Cutters misclassified as Sliders. This reflects the continuum nature of these pitches, which occupy an intermediate space between Fastballs and breaking balls in both velocity and movement profiles.
In contrast, mechanically distinct pitches exhibit substantially higher classification reliability. The Curveball (CB) achieves a 93% correct classification rate, attributable to its distinctive arm angle, topspin-induced motion, and significantly reduced velocity. Similarly, the Slider (SL) maintains an accuracy of 88%, indicating that the model effectively captures gross kinematic differences while encountering natural difficulty with pitches separated only by fine-grained “micro-mechanics.”
4.5.3. Validation of Temporal Modeling Beyond Data Volume
To rigorously validate that the observed performance gains stem from explicit temporal modeling rather than merely increased data exposure (i.e., processing 20 frames instead of 1), we compared the proposed CNN–LSTM against the temporally comparable baselines reported in Table 10.
Since the CNN-Avg consumes the exact same multi-frame input but discards the sequential order, the superior performance of the CNN-LSTM confirms that pitch-type discrimination relies on the causal progression of movements from wind-up to release, not merely their aggregate appearance. Furthermore, the model’s superiority over the volumetric 3D-CNN—which suffers from high parameter inefficiency—demonstrates that decoupling spatial and temporal feature extraction (via CNN and LSTM, respectively) offers a more robust mechanism for learning biomechanical sequences from limited datasets.
Relative to C3D, the proposed model also achieves superior accuracy. We attribute this to the data-efficient design of the CNN–LSTM, which leverages pre-trained 2D spatial representations and dedicates recurrent modeling capacity exclusively to temporal dynamics. In contrast, the C3D model’s higher parameter count and volumetric filters render it more susceptible to overfitting under limited data conditions (~1500 sequences).
4.6. Practical Implications and Study Limitations
Beyond statistical performance, this study evaluated the operational viability of the proposed framework for real-world baseball analytics. This subsection discusses the practical applications for coaching and scouting, alongside the methodological constraints inherent in the current experimental design.
4.6.1. Implications for Coaching and Scouting
The findings confirm that deep learning frameworks can objectively and consistently identify pitch type based on mechanics, offering transformative practical value:
- Pitcher Development: The model serves as an objective diagnostic tool. A coach can isolate a pitcher’s pitch sequences and see, via the model’s output, which pitches are being “tipped.” If the Fastball is being misclassified as a Cutter, the coach knows exactly where to focus attention—the subtle differences in the final wrist position that are visible to the batter but invisible to the naked eye. This transitions training from qualitative “try to be consistent” to quantitative “correct this specific frame/movement.”
- Scouting and Strategy: While this model was trained on a single pitcher (Max Scherzer), the methodology is transferable. Opposing teams could use this approach to analyze video of an upcoming starting pitcher. Detecting biomechanical precursors—such as a specific elbow angle indicating a Curveball—provides a significant strategic advantage to the opposing offense.
4.6.2. Limitations and Methodology Constraints
- Single-Player Scope: The current model is trained exclusively on Max Scherzer. Due to high inter-subject variability in pitching mechanics (e.g., arm slot, stride length), the model is not immediately generalizable to other pitchers without fine-tuning. Future work will aim to develop a generalized “base model” using a multi-pitcher dataset.
- Pixel-Based vs. Pose Estimation: While skeletal pose estimation excels at analyzing macro-kinematics like posture, it lacks the resolution to capture subtle visual “tells”—such as finger placement—critical for pitch classification. Therefore, we employ a pixel-domain approach to decode the essential micro-biomechanical cues needed to distinguish mechanically similar pitches.
- 2D Video Robustness: The reliance on broadcast footage restricts analysis to standard camera angles. Performance may degrade if applied to non-standard views (e.g., offset scouting cameras), necessitating further research into 3D view synthesis or multi-view geometry.
5. Conclusions and Future Work
5.1. Conclusions
This study presented an end-to-end spatiotemporal deep learning framework designed to automatically forecast baseball pitch types from raw broadcast video. By conceptualizing pitch delivery as a precise, continuous kinetic process rather than a static posture, the proposed CNN–LSTM framework achieved a classification accuracy of 91.8% under a standard Random Split when evaluating the five-pitch arsenal of elite MLB pitcher Max Scherzer. Crucially, the model’s robustness was technically validated under a strict inter-season Chronological Split, where it maintained an accuracy of 84.5%. This confirms the persistence of the learned spatiotemporal features over a five-year period without significant performance degradation, proving that the model successfully decodes underlying biomechanical processes rather than memorizing correlated background noise.
The rigorous empirical analysis against advanced spatial baselines (e.g., ResNet50, YOLOv8s-cls) and volumetric models (e.g., C3D) establishes several critical contributions to the field of sports analytics:
- Conceptual Delineation of Vision Paradigms: This study establishes a vital methodological distinction, demonstrating that while coordinate-based pose estimation is optimal for analyzing macro-kinematics (body posture), pixel-domain analysis is strictly required to decode the terminal micro-biomechanical “hand tells” (such as finger grip and wrist rotation) that differentiate pitches within a standardized delivery.
- Validation of Temporal Dynamics: We empirically demonstrated that integrating an LSTM for sequence analysis drastically reduces the generalization gap observed in single-frame static CNNs. Modeling subtle temporal cues over a standardized 20-frame kinetic window is the primary driver of classification performance in this domain.
- Localized Spatiotemporal Architecture: The development of a localized framework using a YOLOv8s-cls spatial backbone successfully captures fine-grained textural cues directly from broadcast footage, effectively bypassing the high-speed motion artifacts and self-occlusion failures inherent in current general-purpose pose estimation models.
- Rigorous Dataset Partitioning and Ablation: The implementation of the Chronological Split validates the technical viability of automated “tell” detection against temporal distribution shifts.
5.2. Future Work
We acknowledge that the current framework functions as a focused, player-specific diagnostic tool; its high accuracy is partially attributable to its specialization to a single pitcher’s biomechanics and should not be assumed to generalize universally without adaptation. To address these constraints, future technical directions will pursue the following objectives:
- Generalized Multi-Pitcher Models: Transition from single-player specialization to multi-pitcher and team-level forecasting models by leveraging advanced transfer learning and domain adaptation techniques to account for inter-subject variability (e.g., differing arm slots and stride lengths).
- Hybrid Fusion Architectures: Investigate architectures that combine the established advantages of our pixel-based processing with explicit geometric information, utilizing high-fidelity finger joint tracking, to determine if skeletal tracking technologies can stabilize against high-velocity motion blur.
- Cross-Camera View Synthesis: Address the limitations of standard 2D broadcast camera angles by investigating 3D view synthesis or multi-view geometry, ensuring the framework’s robustness when applied to non-standard or offset scouting footage.
Author Contributions
Conceptualization, C.-C.C. and C.-H.W.; methodology, C.-C.C., C.-H.W. and H.-C.L.; software, C.-H.W. and H.-C.L.; validation, C.-H.W. and S.H.; investigation, C.-H.W. and S.H.; data curation, H.-C.L.; writing—original draft preparation, C.-C.C.; writing—review and editing, C.-C.C. and S.H. All authors have read and agreed to the published version of the manuscript.
Funding
This research received no external funding.
Institutional Review Board Statement
Not applicable. The research did not involve human participants, human subject interaction, or identifiable private information. All analyses were conducted using publicly available broadcast video footage and author-controlled test data, and no personally identifiable information was collected, processed, or reported. Therefore, in accordance with institutional guidelines and the definition of human subjects research, formal IRB review was not sought.
Informed Consent Statement
Not applicable. No human participants were recruited, enrolled, or directly interacted with in this study. The image recognition tasks were performed on video data that are available from the official MLB YouTube channel and MLB Statcast for technical analysis only.
Data Availability Statement
The data presented in this study are available upon request from the corresponding authors.
Acknowledgments
During the preparation of this manuscript, the authors used Google Gemini for language editing. The authors reviewed and edited the content and take full responsibility for the content of the publication.
Conflicts of Interest
The authors declare no conflicts of interest.
Abbreviations
The following abbreviations are used in this manuscript:
| CNN | Convolution Neural Networks |
| DNN | Deep Neural Networks |
| LSTM | Long Short-Term Memory |
| RNN | Recurrent Neural Networks |
| SVM | Support Vector Machine |
| YOLO | You Only Look Once |
Appendix A. Evaluation Metrics and Definitions
To rigorously assess the performance of the proposed pitch classification model, we utilized standard classification metrics derived from the confusion matrix. This appendix provides the formal definitions and mathematical formulations for these metrics.
Appendix A.1. Confusion Matrix Components
The confusion matrix is a visual representation of classification results that highlights both model successes and specific error patterns. It categorizes all predictions into four fundamental states:
- True Positive (TP): The model correctly predicts a positive class sample.
- True Negative (TN): The model correctly predicts a negative class sample.
- False Positive (FP): The model incorrectly predicts a negative sample as positive (Type I Error).
- False Negative (FN): The model incorrectly predicts a positive sample as negative (Type II Error).
Appendix A.2. Performance Metrics
To comprehensively evaluate the performance of the proposed method, the following metrics are adopted to assess classification effectiveness across pitch sequences:
- Overall Accuracy: The proportion of correctly classified pitch sequences.
Accuracy measures the overall ratio of correctly classified pitch sequences to the total number of samples in the dataset. It provides a general measure of model reliability.
- Precision
Precision evaluates the correctness of positive predictions. It calculates the proportion of samples predicted as positive that are actually positive. High Precision indicates a low false positive rate (i.e., the model is trustworthy when it claims a pitch is a specific type).
- Recall (Sensitivity)
Recall measures the model’s ability to identify all relevant instances. It calculates the proportion of actual positive samples that were correctly predicted. High Recall indicates a low false negative rate (i.e., the model rarely misses a specific pitch type).
- F1-Score
The F1-Score is the harmonic mean of Precision and Recall. It is particularly useful when seeking a balance between the two, ensuring that the model does not optimize one at the expense of the other.
References
- Calabrese, G.J. Pitching mechanics, revisited. Int. J. Sports Phys. Ther. 2013, 8, 652–660. [Google Scholar]
- Hazelgrove, W.E. The Pitcher; Koehler Books: Virginia Beach, VA, USA, 2024. [Google Scholar]
- Johnson, D. The Complete Guide to Pitching; Human Kinetics: Champaign, IL, USA, 2013. [Google Scholar]
- Murray, M. The 2026 Starting Pitcher Gold Book: Beyond ERA: Decoding the Modern-Day Pitching Metrics; Independently Published; 2025; Available online: https://www.amazon.com/2026-Starting-Pitcher-Gold-Book/dp/B0G2FJ3P9C (accessed on 1 March 2026).
- Quiery, T. Baseball Pitching MASTERY: The NEW Guide to Becoming a Dominant Pitcher; Learn to Master the Art of Pitching; Independently Published; 2023; Available online: https://www.amazon.com/Baseball-Pitching-MASTERY-Becoming-Dominant/dp/B0CKLK6T5L (accessed on 1 March 2026).
- Baumer, B.; Zimbalist, A. The Sabermetric Revolution: Assessing the Growth of Analytics in Baseball; University of Pennsylvania Press: Philadelphia, PA, USA, 2014. [Google Scholar]
- Costa, G.B.; Huber, M.R.; Saccoman, J.T. Understanding Sabermetrics: An Introduction to the Science of Baseball Statistics; McFarland: Jefferson, NC, USA, 2019. [Google Scholar]
- Lage, M.; Ono, J.P.; Cervone, D.; Chiang, J.; Dietrich, C.; Silva, C.T. Statcast dashboard: Exploration of spatiotemporal baseball data. IEEE Comput. Graph. Appl. 2016, 36, 28–37. [Google Scholar] [CrossRef] [Scilit]
- Pappas, A.M.; Zawacki, R.M.; Sullivan, T.J. Biomechanics of baseball pitching: A preliminary report. Am. J. Sports Med. 1985, 13, 216–222. [Google Scholar] [CrossRef] [Scilit]
- Escamilla, R.F.; Fleisig, G.S.; Barrentine, S.W.; Zheng, N.; Andrews, J.R. Kinematic comparisons of throwing different types of baseball pitches. J. Appl. Biomech. 1998, 14, 1–23. [Google Scholar] [CrossRef] [Scilit]
- Ishii, B. Using Pitch Tipping for Baseball Pitch Prediction. Master’s Thesis, California Polytechnic State University, San Luis Obispo, CA, USA, 2021. [Google Scholar]
- Chiu, Y.W.; Huang, K.T.; Wu, Y.R.; Huang, J.H.; Hsu, W.L.; Wu, P.Y. 3D baseball pitcher pose reconstruction using joint-wise volumetric triangulation and baseball customized filter system. IEEE Access 2024, 12, 117110–117125. [Google Scholar] [CrossRef] [Scilit]
- Fukushima, T.; Blauberger, P.; Guedes Russomanno, T.; Lames, M. The potential of human pose estimation for motion capture in sports: A validation study. Sports Eng. 2024, 27, 19. [Google Scholar] [CrossRef] [Scilit]
- Cover, T.M.; Keilers, C.W. An offensive earned-run average for baseball. Oper. Res. 1977, 25, 729–740. [Google Scholar] [CrossRef] [Scilit]
- Nicholls, R.; Fleisig, G.; Elliott, B.; Lyman, S.; Osinski, E. Baseball: Accuracy of qualitative analysis for assessment of skilled baseball pitching technique. Sports Biomech. 2003, 2, 213–226. [Google Scholar]
- Lewis, M. Moneyball: The Art of Winning an Unfair Game; WW Norton & Company: New York, NY, USA, 2004. [Google Scholar]
- Ganeshapillai, G.; Guttag, J. Predicting the next pitch. In Proceedings of the Sloan Sports Analytics Conference, Boston, MA, USA, 2–3 March 2012. [Google Scholar]
- Hamilton, M.; Hoang, P.; Layne, L.; Murray, J.; Padget, D.; Stafford, C.; Tran, H.T. Applying Machine Learning Techniques to Baseball Pitch Prediction. In Proceedings of the ICPRAM, Anger, France, 6–8 March 2014; pp. 520–527. [Google Scholar]
- Sidle, G.; Tran, H. Using multi-class classification methods to predict baseball pitch types. J. Sports Anal. 2018, 4, 85–93. [Google Scholar] [CrossRef] [Scilit]
- Plunkett, R. Pitch Type Prediction in Major League Baseball; Harvard College: Cambridge, MA, USA, 2019. [Google Scholar]
- Lee, J.S. Prediction of pitch type and location in baseball using ensemble model of deep neural networks. J. Sports Anal. 2022, 8, 115–126. [Google Scholar] [CrossRef] [Scilit]
- Yu, C.C.; Chang, C.C.; Cheng, H.Y. Decide the next pitch: A pitch prediction model using attention-based LSTM. In 2022 IEEE International Conference on Multimedia and Expo Workshops (ICMEW); IEEE: New York, NY, USA, 2022; pp. 1–4. [Google Scholar]
- Greff, K.; Srivastava, R.K.; Koutník, J.; Steunebrink, B.R.; Schmidhuber, J. LSTM: A search space odyssey. IEEE Trans. Neural Netw. Learn. Syst. 2016, 28, 2222–2232. [Google Scholar] [CrossRef] [Scilit]
- Medsker, L.R.; Jain, L. Recurrent neural networks. Des. Appl. 2001, 5, 2. [Google Scholar]
- Sherstinsky, A. Fundamentals of recurrent neural network (RNN) and long short-term memory (LSTM) network. Phys. D Nonlinear Phenom. 2020, 404, 132306. [Google Scholar]
- Li, Z.; Liu, F.; Yang, W.; Peng, S.; Zhou, J. A survey of convolutional neural networks: Analysis, applications, and prospects. IEEE Trans. Neural Netw. Learn. Syst. 2021, 33, 6999–7019. [Google Scholar]
- Simonyan, K.; Zisserman, A. Very deep convolutional networks for large-scale image recognition. arXiv 2014, arXiv:1409.1556. [Google Scholar]
- Tammina, S. Transfer learning using vgg-16 with deep convolutional neural network for classifying images. Int. J. Sci. Res. Publ. 2019, 9, 143–150. [Google Scholar]
- He, K.; Zhang, X.; Ren, S.; Sun, J. Identity mappings in deep residual networks. In European Conference on Computer Vision; Springer International Publishing: Cham, Switzerland, 2016; pp. 630–645. [Google Scholar]
- Koonce, B. ResNet 50. In Convolutional Neural Networks with Swift for Tensorflow; Apress: Berkeley, CA, USA, 2021; pp. 63–72. [Google Scholar]
- Huang, G.; Liu, Z.; Van Der Maaten, L.; Weinberger, K.Q. Densely connected convolutional networks. In Proceedings of the IEEE Conference on Computer Vision and Pattern Recognition, Honolulu, HI, USA, 21–26 July 2017; pp. 4700–4708. [Google Scholar]
- Albelwi, S.A. Deep architecture based on DenseNet-121 model for weather image recognition. Int. J. Adv. Comput. Sci. Appl. 2022, 13, 559–565. [Google Scholar] [CrossRef] [Scilit]
- Redmon, J.; Divvala, S.; Girshick, R.; Farhadi, A. You only look once: Unified, real-time object detection. In Proceedings of the IEEE Conference on Computer Vision and Pattern Recognition, Las Vegas, NV, USA, 27–30 June 2016; pp. 779–788. [Google Scholar]
- Jiang, P.; Ergu, D.; Liu, F.; Cai, Y.; Ma, B. A Review of Yolo algorithm developments. Procedia Comput. Sci. 2022, 199, 1066–1073. [Google Scholar] [CrossRef] [Scilit]
- Terven, J.; Córdova-Esparza, D.M.; Romero-González, J.A. A Comprehensive Review of YOLO Architectures in Computer Vision: From YOLOv1 to YOLOv8 and YOLO-NAS. Mach. Learn. Knowl. Extr. 2023, 5, 1680–1716. [Google Scholar] [CrossRef] [Scilit]
- Sohan, M.; Sai Ram, T.; Rami Reddy, C.V. A review on yolov8 and its advancements. In International Conference on Data Intelligence and Cognitive Informatics; Springer: Singapore, 2024; pp. 529–545. [Google Scholar]
- Zheng, C.; Wu, W.; Chen, C.; Yang, T.; Zhu, S.; Shen, J.; Kehtarnavaz, N.; Shah, M. Deep learning-based human pose estimation: A survey. ACM Comput. Surv. 2023, 56, 11. [Google Scholar] [CrossRef] [Scilit]
- Lugaresi, C.; Tang, J.; Nash, H.; McClanahan, C.; Uboweja, E.; Hays, M.; Zhang, F.; Chang, C.-L.; Yong, M.G.; Lee, J.; et al. Mediapipe: A framework for building perception pipelines. arXiv 2019, arXiv:1906.08172. [Google Scholar] [CrossRef] [Scilit]
- Bajpai, R.; Joshi, D. Movenet: A deep neural network for joint profile prediction across variable walking speeds and slopes. IEEE Trans. Instrum. Meas. 2021, 70, 2508511. [Google Scholar] [CrossRef] [Scilit]
- Fang, H.S.; Li, J.; Tang, H.; Xu, C.; Zhu, H.; Xiu, Y.; Li, Y.-L.; Lu, C. Alphapose: Whole-body regional multi-person pose estimation and tracking in real-time. IEEE Trans. Pattern Anal. Mach. Intell. 2022, 45, 7157–7173. [Google Scholar] [CrossRef] [Scilit]
- Cao, Z.; Hidalgo, G.; Simon, T.; Wei, S.E.; Sheikh, Y. Openpose: Realtime multi-person 2d pose estimation using part affinity fields. IEEE Trans. Pattern Anal. Mach. Intell. 2019, 43, 172–186. [Google Scholar] [CrossRef] [Scilit] [PubMed]
- Maji, D.; Nagori, S.; Mathew, M.; Poddar, D. YOLO-pose: Enhancing YOLO for multi person pose estimation using object keypoint similarity loss. In Proceedings of the IEEE/CVF Conference on Computer Vision and Pattern Recognition, New Orleans, LA, USA, 18–24 June 2022; pp. 2637–2646. [Google Scholar]
- Yue-Hei Ng, J.; Hausknecht, M.; Vijayanarasimhan, S.; Vinyals, O.; Monga, R.; Toderici, G. Beyond short snippets: Deep networks for video classification. In Proceedings of the IEEE Conference on Computer Vision and Pattern Recognition, Boston, MA, USA, 7–12 June 2015; pp. 4694–4702. [Google Scholar]
- Wang, X.; Miao, Z.; Zhang, R.; Hao, S. I3d-lstm: A new model for human action recognition. In IOP Conference Series: Materials Science and Engineering; IOP Publishing: Bristol, UK, 2019; Volume 569, p. 032035. [Google Scholar]
- Alfaifi, R.; Artoli, A.M. Human action prediction with 3D-CNN. SN Comput. Sci. 2020, 1, 286. [Google Scholar] [CrossRef] [Scilit]
- Fan, Y.; Lu, X.; Li, D.; Liu, Y. Video-based emotion recognition using CNN-RNN and C3D hybrid networks. In Proceedings of the 18th ACM International Conference on Multimodal Interaction, Tokyo, Japan, 12–16 November 2016; pp. 445–450. [Google Scholar]
- Neimark, D.; Bar, O.; Zohar, M.; Asselmann, D. Video transformer network. In Proceedings of the IEEE/CVF International Conference on Computer Vision, Montreal, QC, Canada, 10–17 October 2021; pp. 3163–3172. [Google Scholar]
- Mutegeki, R.; Han, D.S. A CNN-LSTM approach to human activity recognition. In 2020 International Conference on Artificial Intelligence in Information and Communication (ICAIIC); IEEE: New York, NY, USA, 2020; pp. 362–366. [Google Scholar]
- Takamido, R.; Suzuki, C.; Nakamoto, H. A data-driven analysis of spatiotemporal cues and experience accumulation effects for pitch type prediction. bioRxiv 2025. [Google Scholar] [CrossRef] [Scilit]
- Russell, S.J.; Norvig, P. Artificial Intelligence: A Modern Approach, 4th ed.; Pearson: San Antonio, TX, USA, 2020. [Google Scholar]

Disclaimer/Publisher’s Note: The statements, opinions and data contained in all publications are solely those of the individual author(s) and contributor(s) and not of MDPI and/or the editor(s). MDPI and/or the editor(s) disclaim responsibility for any injury to people or property resulting from any ideas, methods, instructions or products referred to in the content. |
© 2026 by the authors. Published by MDPI on behalf of the International Institute of Knowledge Innovation and Invention. Licensee MDPI, Basel, Switzerland. This article is an open access article distributed under the terms and conditions of the Creative Commons Attribution (CC BY) license.