Article

Glacier-Fed Deltas and New Age Constraints for Glacial Lake Grand Gorge in the Northern Catskill Mountains of New York State, USA


by
Andrew L. Kozlowski
1,*,
Richard A. Frieman
1,
Karl J. Backhaus
1,
Hailey M. Forgeng
1,
Robert S. Feranec
2 and
Shannon A. Mahan
3
1
Geological Survey, New York State Museum, Albany, NY 12230, USA
2
Research and Collections, New York State Museum, Albany, NY 12230, USA
3
Luminescence Geochronology Laboratory, United States Geological Survey, Denver, CO 80225, USA
*
Author to whom correspondence should be addressed.
Quaternary 2026, 9(3), 46; https://doi.org/10.3390/quat9030046
Submission received: 30 December 2025 / Revised: 1 June 2026 / Accepted: 8 June 2026 / Published: 17 June 2026

Abstract

Ice-dammed lakes were common along the southern margin of the Laurentide Ice Sheet during deglaciation. In the Schoharie Valley of the northern Catskill Mountains, New York, a 171 km2 lake known as glacial Lake Grand Gorge formed in an interlobate area. Previous researchers suggested that deltas developed into this glacial lake from meltwater supplied by the adjacent Hudson Lobe during deglaciation. This study investigates stratigraphy and sedimentology of Pleistocene deltas and lake deposits to determine the source of meltwater and sediment. Detailed examination of stratigraphy from quarries, stream exposures, and new exploration borings was combined with radiocarbon and OSL geochronology to establish event stratigraphy. Sedimentologic and geomorphic data from deltas in the Manor Kill and Platter Kill Valleys demonstrates that braided outwash was supplied directly from the Westerlo Sublobe that crossed the northeastern escarpment of the Catskill Mountains. New geochronologic data indicates that the lake was established by 28 ka and likely persisted to at least 22 ka. Insects and twigs recovered from lake sediments complement the OSL data and indicate: (1) that the lake was present significantly earlier than previous deglacial models predict, and (2) that it existed in an ice-free area of the northern Catskill Mountains during the last glacial maximum of the MIS 2 glaciation.

1. Introduction

An understanding of the past configuration of continental ice sheets is critical for construction of paleoclimate models [1,2,3]. The expertise of field scientists working at local and regional scales is crucial to improve the resolution of these models [4], particularly to define the last glacial maximum of North American ice sheets in the Great Lakes region [5,6,7,8]. Geological mapping by state and federal geological surveys participating in the Great Lakes Geological Mapping Coalition [9] over the last two decades continually benefits local communities while simultaneously improving the spatial resolution and scientific understanding of the Pleistocene geologic record.
The distribution of Pleistocene glaciers and continental ice sheets has considerable implications for past meltwater routing and present drainage patterns, which in turn impact modern society in broad and varied ways. Pleistocene deposits of sorted sand and gravel serve as a crucial source of high-quality aggregate needed to repair aging infrastructure. When exposed at the surface they enhance recharge function of unconsolidated aquifers, and when below the water table and/or buried by younger aquitards they host aquifers themselves. Ice-dammed lakes, formed when ice margins impeded drainage, provided a low-energy setting for the deposition of fine-grained lake sediments. Thick deposits of these glaciolacustrine sediments have proven to be a serious geological hazard; steep slopes of lake clays and silts are prone to fail, and landslides are a risk to roads, homes, railroads, and other infrastructure [10,11,12,13]. Further, the locations of many former Pleistocene ice-dammed lakes are currently dammed by humans to serve as reservoirs to supply crucial water resources. Detailed geologic maps are critical to plan and engineer future water reservoirs, predict and mitigate landslides, and understand precisely where aggregate resources may be located in a cost-effective manner [14]. Knowledge of the spatial and temporal trends of Pleistocene glaciers and an understanding of the geologic conditions, geographic extent, and event stratigraphy produced by former ice-dammed lakes complements and enriches geologic mapping to better serve society.
Ice-dammed lakes develop where glaciers block regional or local drainage [15,16]. This scenario was common during the late Pleistocene as lobes from expanding continental ice sheets spread into upland topography and into stream valleys that drained in the opposite direction to advancing ice flow, thereby impounding bodies of water. Depth of ice-dammed lakes is a function of the occupied basin topography, whereas the lake surface elevation and volume are controlled by the location of a drainage outlet. Outlets of former late-Pleistocene ice-dammed lakes commonly appear on the landscape as well-developed large channels or spillways carved by escaping meltwater [17,18,19,20]. Stabilization of ice-dammed lake level may result when an outlet develops on a resilient threshold such as bedrock, and/or when the occupying glacier(s) approaches an equilibrium or steady-state condition [21].
Deltas deposited along the shores of late-Pleistocene ice-dammed lakes are commonly preserved on the present-day landscape. The surface elevation of these constructional landforms records the approximate lake level (datum) of former ice-dammed lakes and indicates a period of stabilized lake level, potentially brief, during the glacial climate condition [22,23,24,25]. The sediment–landform assemblage represented by preserved Pleistocene deltas provides an opportunity to contextualize the relationship between glaciers and associated ice-dammed lakes. Simultaneously, deposits of sand and resultant deltaic stratigraphy allow better understanding of event timing with use of optical stimulated luminescence (OSL) dating on clastic sediments [26,27,28,29,30,31,32,33,34].
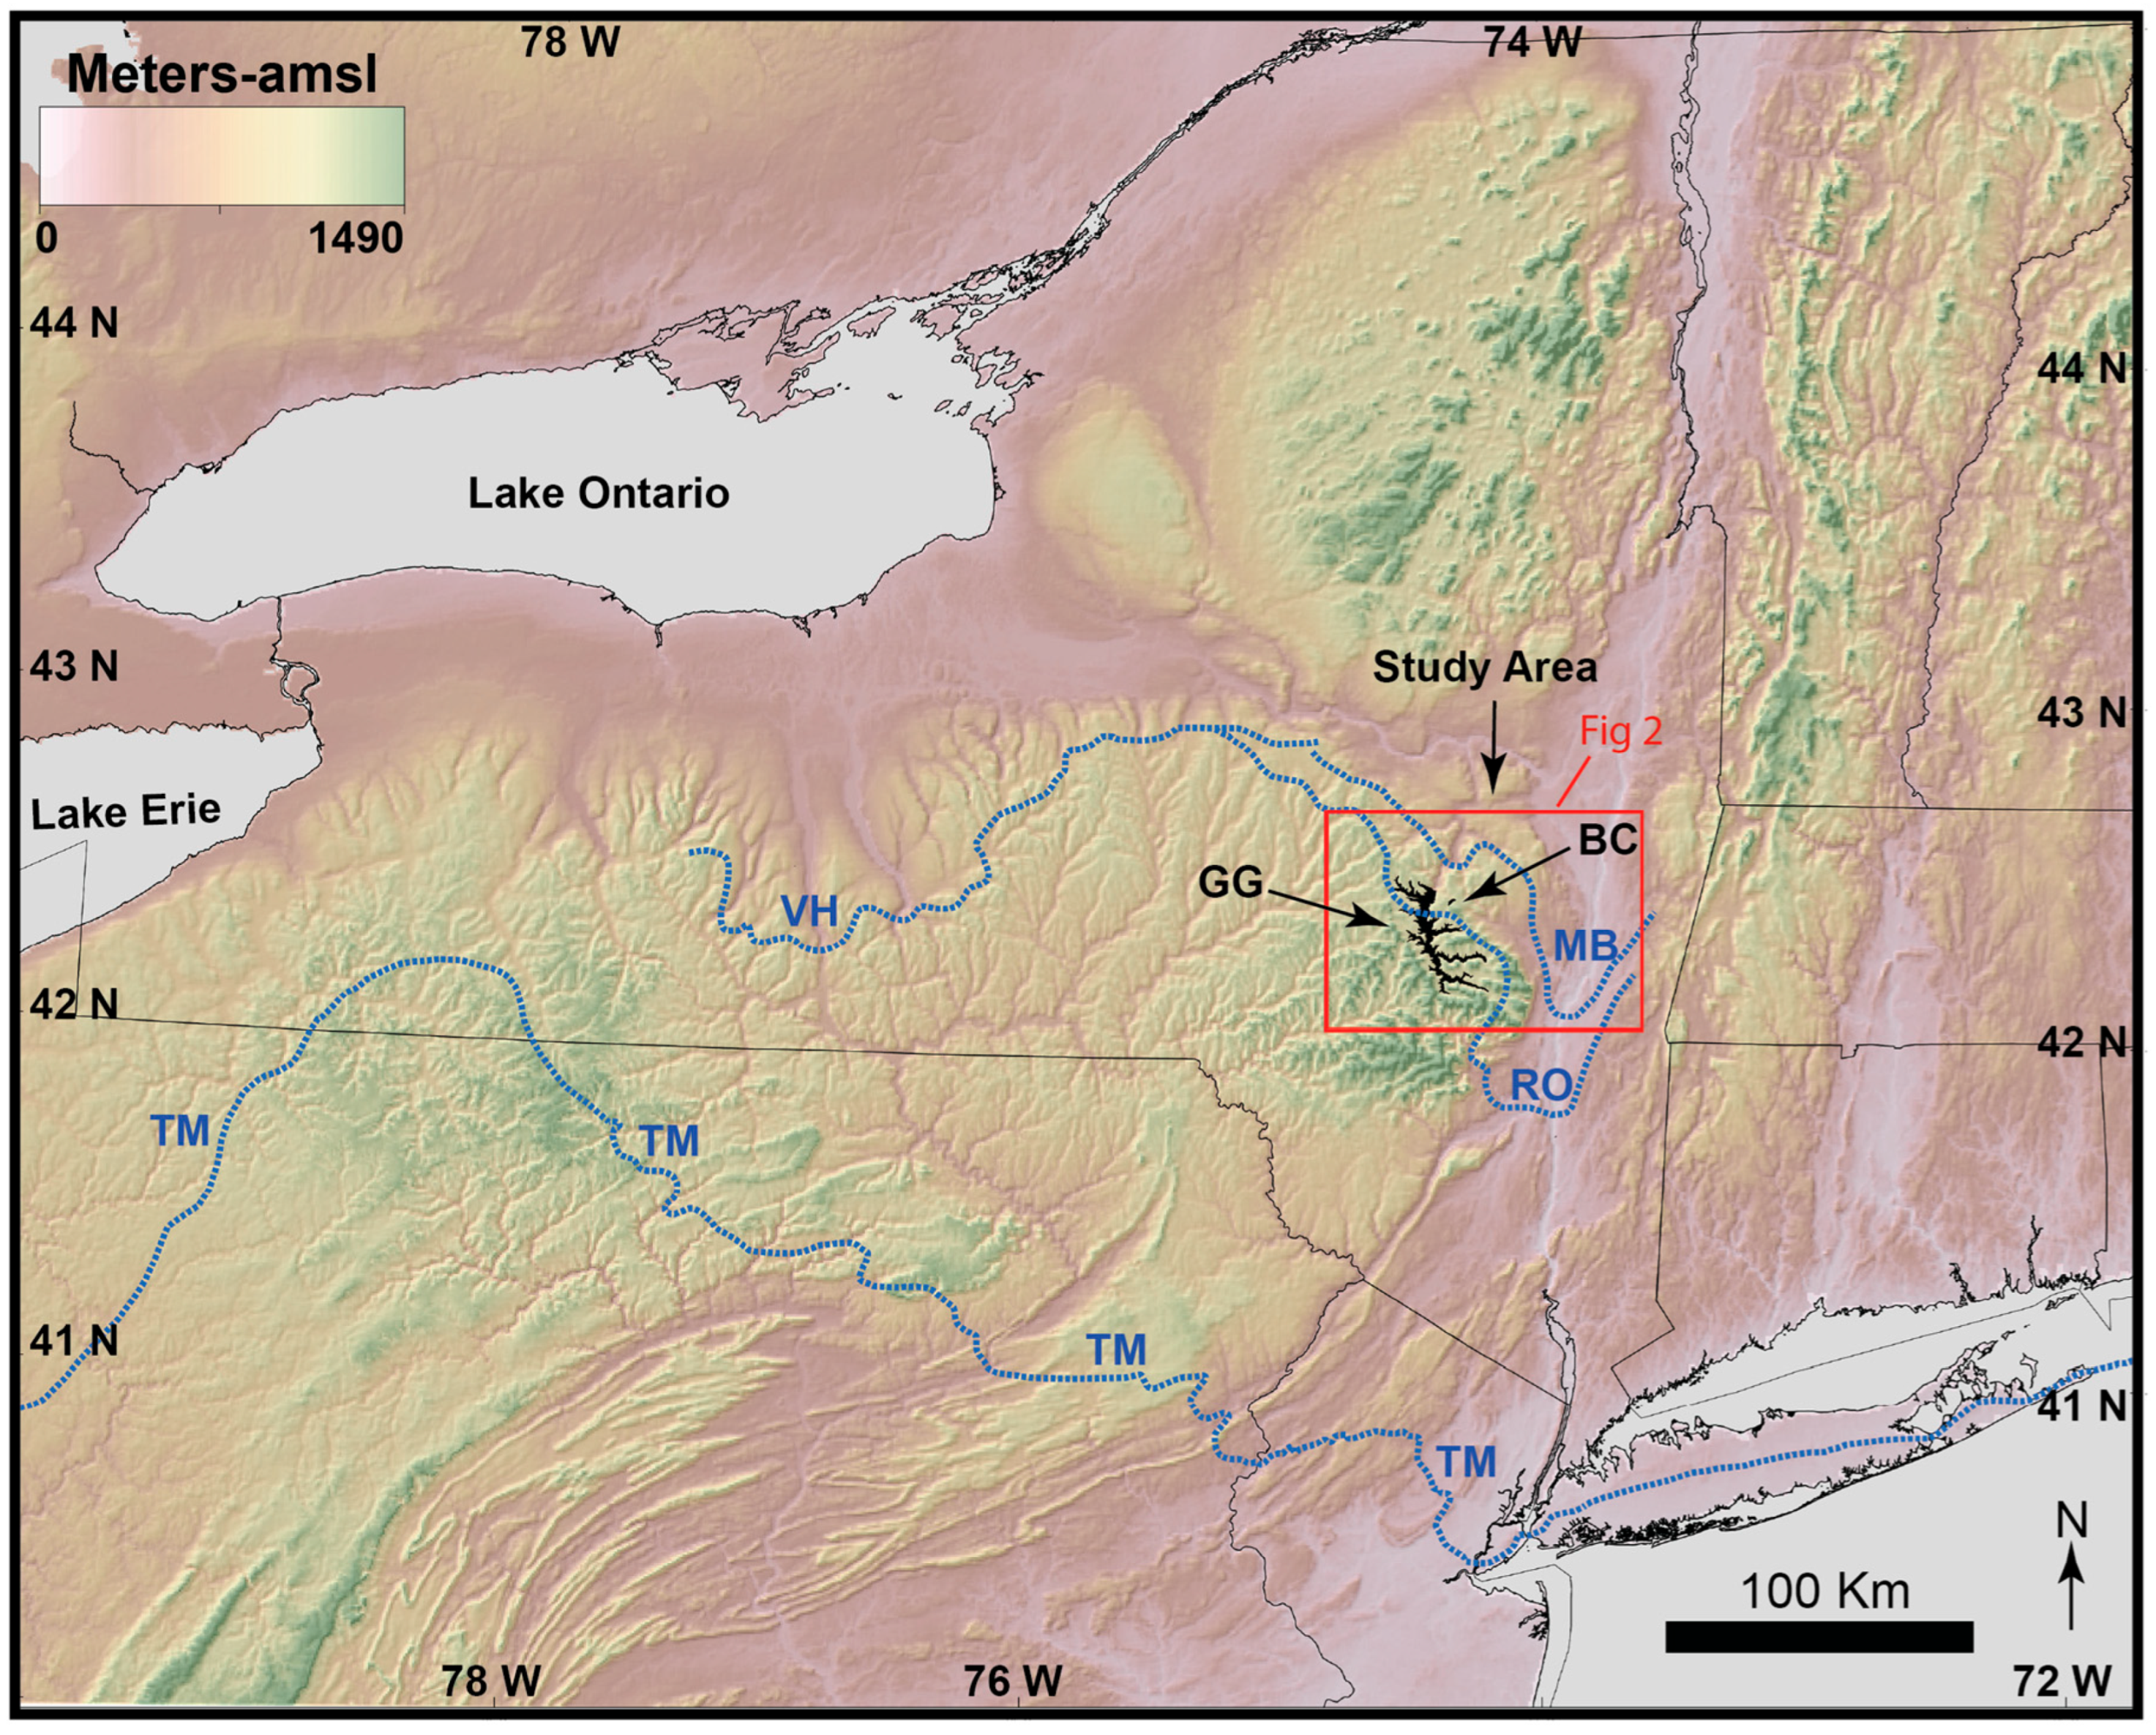
In this paper we evaluate the stratigraphic framework of landforms and sediments deposited into glacial Lake Grand Gorge, a 171 km2 ice-dammed lake that once occupied the Schoharie Valley of eastern New York State (Figure 1), to address two fundamental questions: (1) Is there geomorphic and sedimentologic evidence to support previous suggestions [35,36,37] that an ice sheet from the Hudson Valley supplied sediment and meltwater to construct deltas on the eastern edge of glacial Lake Grand Gorge? and (2) When did glacial Lake Grand Gorge exist?
We present new data on basin stratigraphy and deltaic deposits as well as new geochronology to evaluate the timing of this ice-dammed lake and its outlet. The data presented herein provide the opportunity to test previous models of deglaciation for the southeastern sector of the Laurentide Ice Sheet (LIS) along the northern Catskill Mountains. These data suggest that an ice-free inlier and corridor for meltwater to escape may have existed at or near the time of the last glacial maximum (LGM) some 140+ km north of the currently mapped terminal moraine (Figure 1).

Study Location, Setting, and Previous Work

The study area is located in the Schoharie Valley in the northern Catskill Mountains in eastern New York State (Figure 1). At a broad regional level, the generalized configuration of glacial lobes of the LIS in New York State (Ontario Lobe, Mohawk Lobe, and Hudson Lobe; Figure S1) has been recognized for more than a century [39,40,41,42,43,44,45]. Early researchers astutely hypothesized that glaciers occupied lower elevation topography such as the Hudson Valley, Mohawk Valley, and portions of the Ontario Basin during deglaciation. However, little is known about the glacial advance history in New York State during the Marine Isotope Stage (MIS) 2–3 transition. In southeastern New York, on western Long Island, the maximum limiting age of the MIS 2 southerly advance of the Hudson Lobe is constrained by MIS 3-age (30–54 ka) buried remains of wood and peat, preserved in sediment underlying MIS 2 deposits associated with the LGM [46,47]. The age of the terminal moraine in western Long Island and northern New Jersey produced by the Hudson Lobe has been debated [48]. However, a growing body of literature suggests the southeastern edge Hudson Lobe reached its southernmost extent between 21 and 27 ka [7,46,49,50,51,52].
By comparison, substantially less is known regarding the southwesterly expansion of the Hudson Lobe in New York State. The contemporary belief has been that the Hudson-Champlain Lobe (Figure S1) extended southwesterly into northeast Pennsylvania to the terminal moraine, covering the Catskill Mountains and depositing the Olean Drift [53,54,55,56]. Kirkland [57] and later Ozsvath [58] evaluated boring logs from water well records and landforms in the western Catskill Mountains along the West Branch and the East Branch of the Delaware River and assigned a Late Wisconsin (MIS 2) age to landforms and deposits in the region. They acknowledged, however, that this assignment was speculative in the absence of radiocarbon data. Crowl and Sevon [55] reported several bog-bottom ages of ~18 ka from the mapped (MIS 2) terminal moraine in northern Pennsylvania; Muller and Calkin [47], however, suggested these ages were likely too young in comparison to ages reported in northern New Jersey and western Long Island. Near Chenango Forks, NY (Figure 1), north of the mapped MIS 2 terminal moraine in northern Pennsylvania and 115 km west of our study area, Cadwell [59] reported the oldest known radiocarbon age west of the Catskill Mountains and southeast of the Finger Lakes (16,650 ± 1880 14C) on basal organic debris from a core collected in a kettle. This single, bulk age has a 2σ range of 15–25 ka and a median age of 20 ka using intCal20 [60]. No older (>30 ka) organic-bearing sites between the area southeast of the Finger Lakes and west of the Catskill Mountains have been reported.
Pleistocene deposits from the Ontario Lobe in the eastern Finger Lakes Region spanning MIS 2, MIS 3, and MIS 6 cycles have been reported [61,62,63]. Although advances have been made by mapping the 2D stratigraphic framework of late-Pleistocene deposits in the Finger Lakes to better understand temporal events [64,65,66], correlation of Ontario Lobe deposits with Hudson Lobe event stratigraphy has not yet been achieved.
At a smaller-scale geographic level, this study focuses on the northern Catskill Mountains where the intersection of topography and geology continues to influence a variety of land use specialists including farmers, hydrologists, engineers, ecologists, and quarry owners who operate around the drainage within the Schoharie Valley. Stream piracy and the development of stream drainage patterns in the Catskill Mountains caught the attention of pioneering geologists in New York State [67,68,69,70,71]. This early research scrutinized the erosional patterns and their interplay with the geologic structure of gently south- and west-dipping Devonian clastic sedimentary rocks that have been dissected into several escarpments to produce the rugged terrain of the Catskill Mountains.
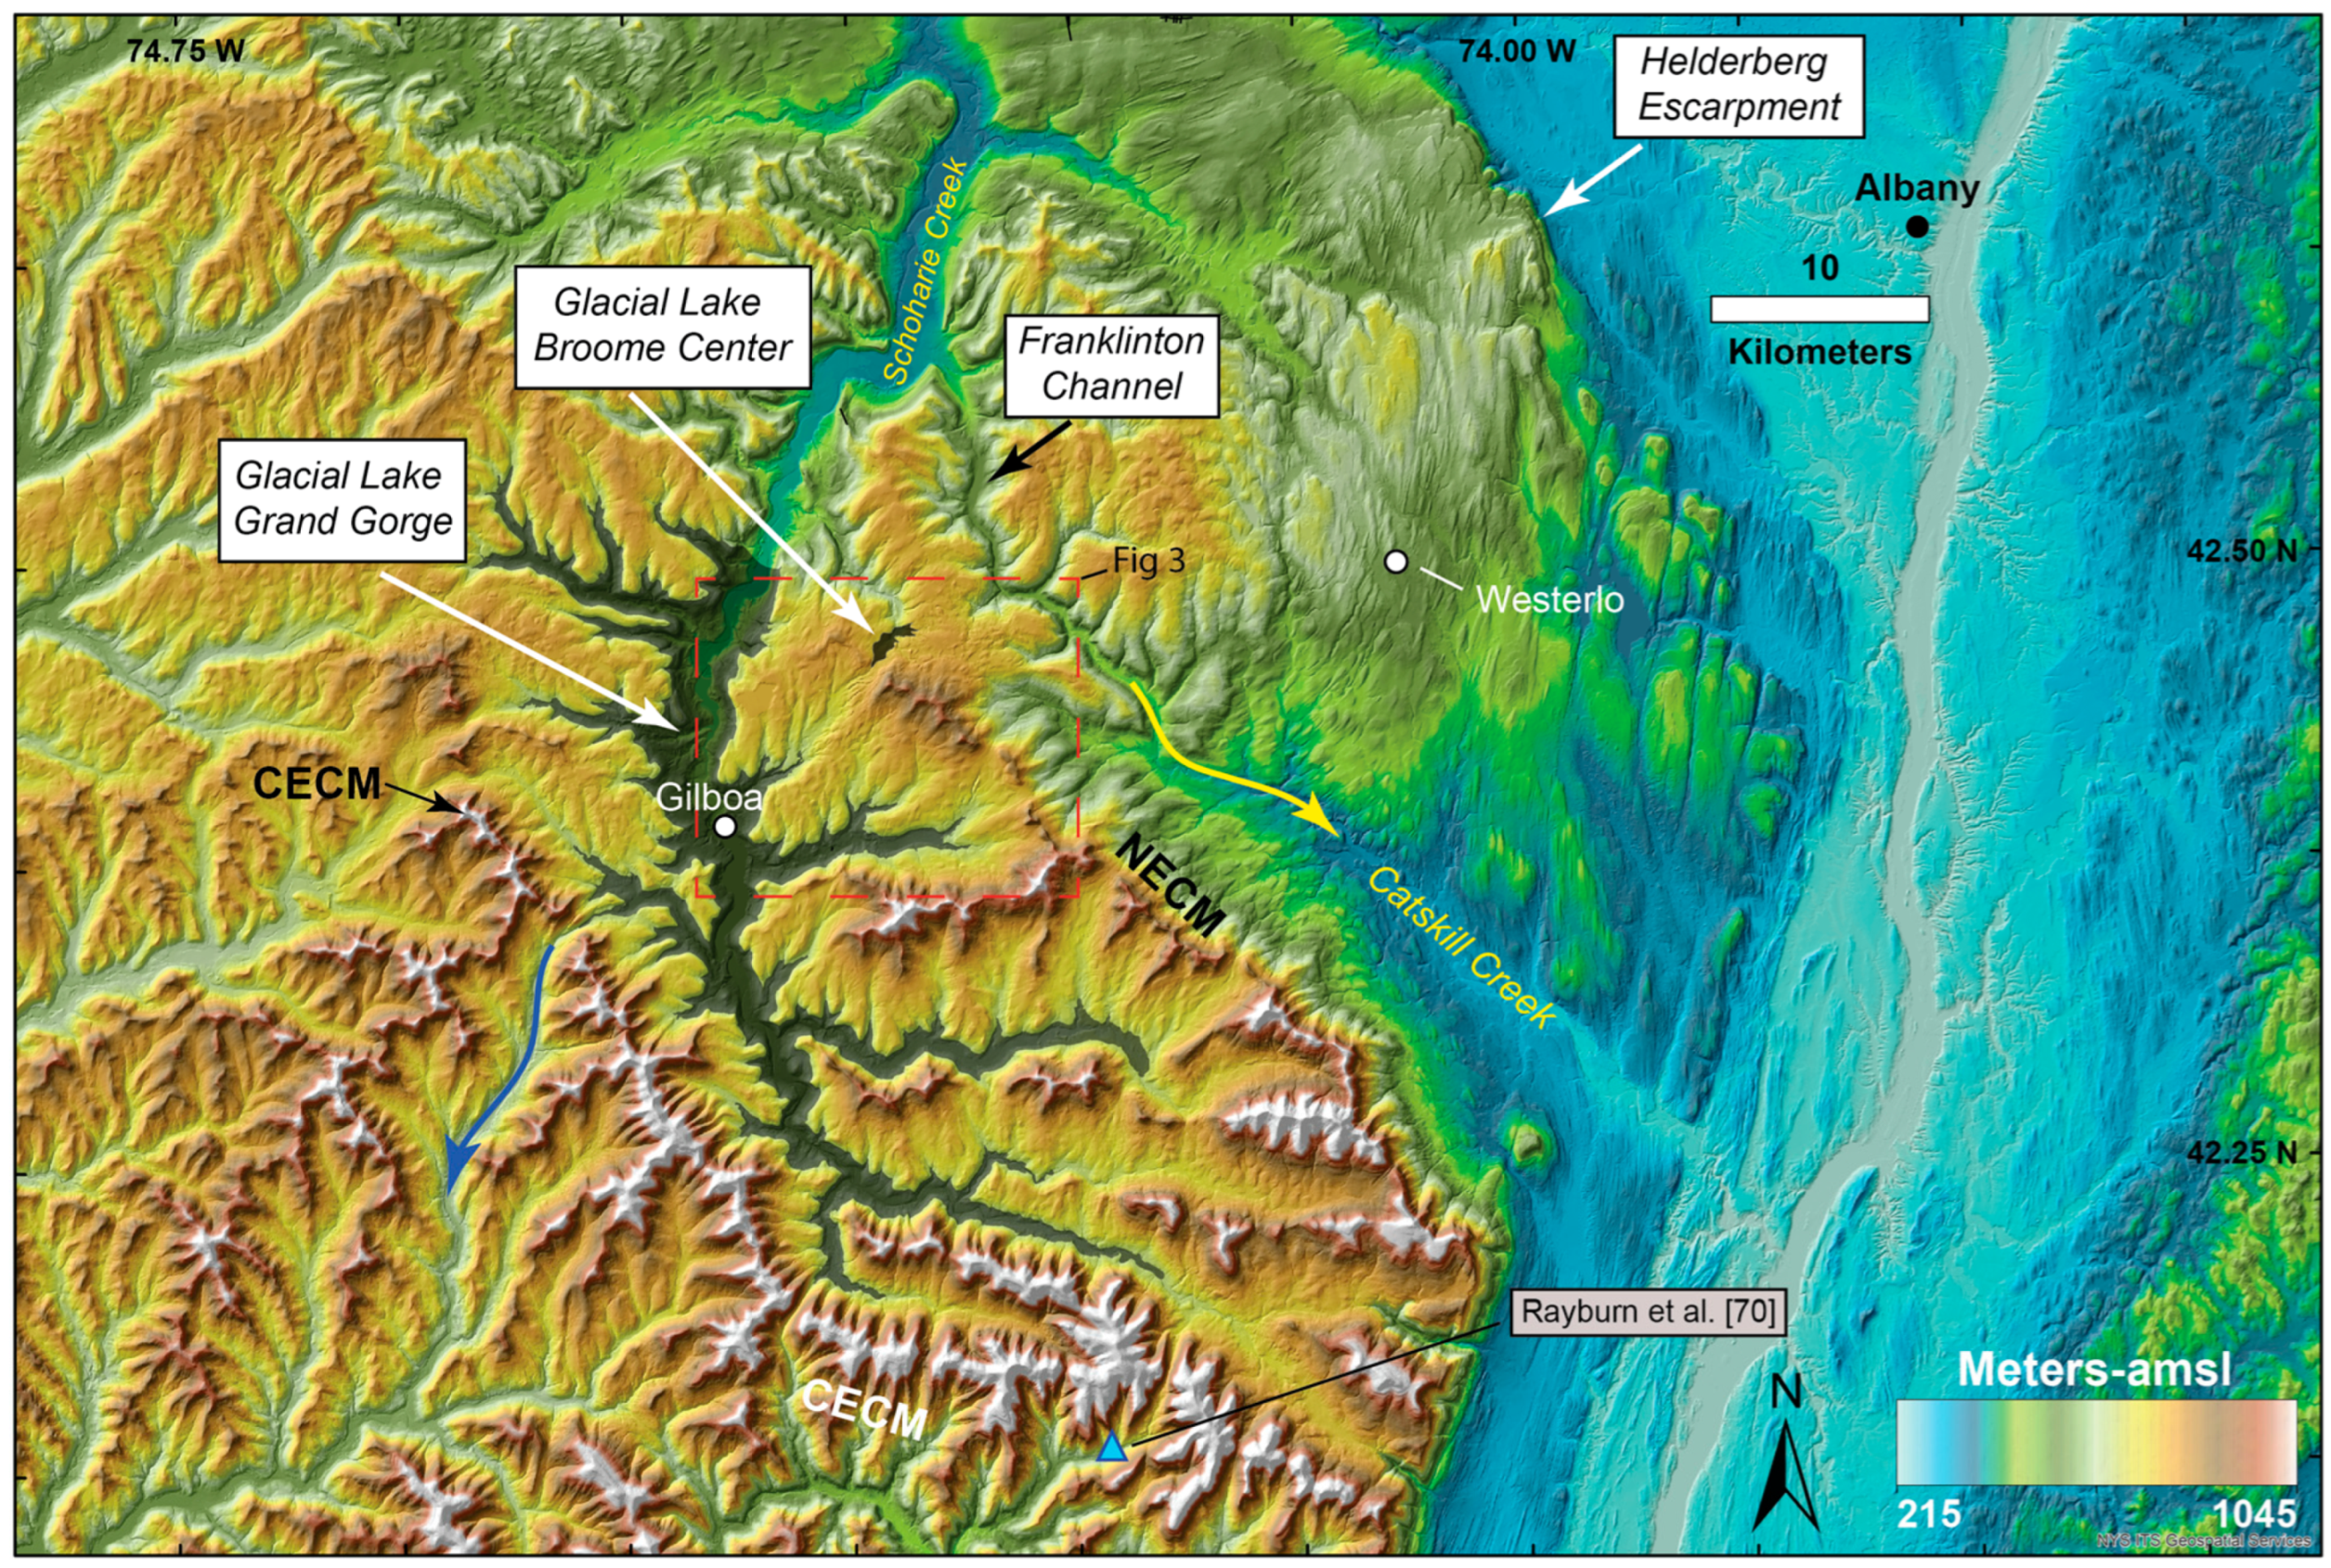
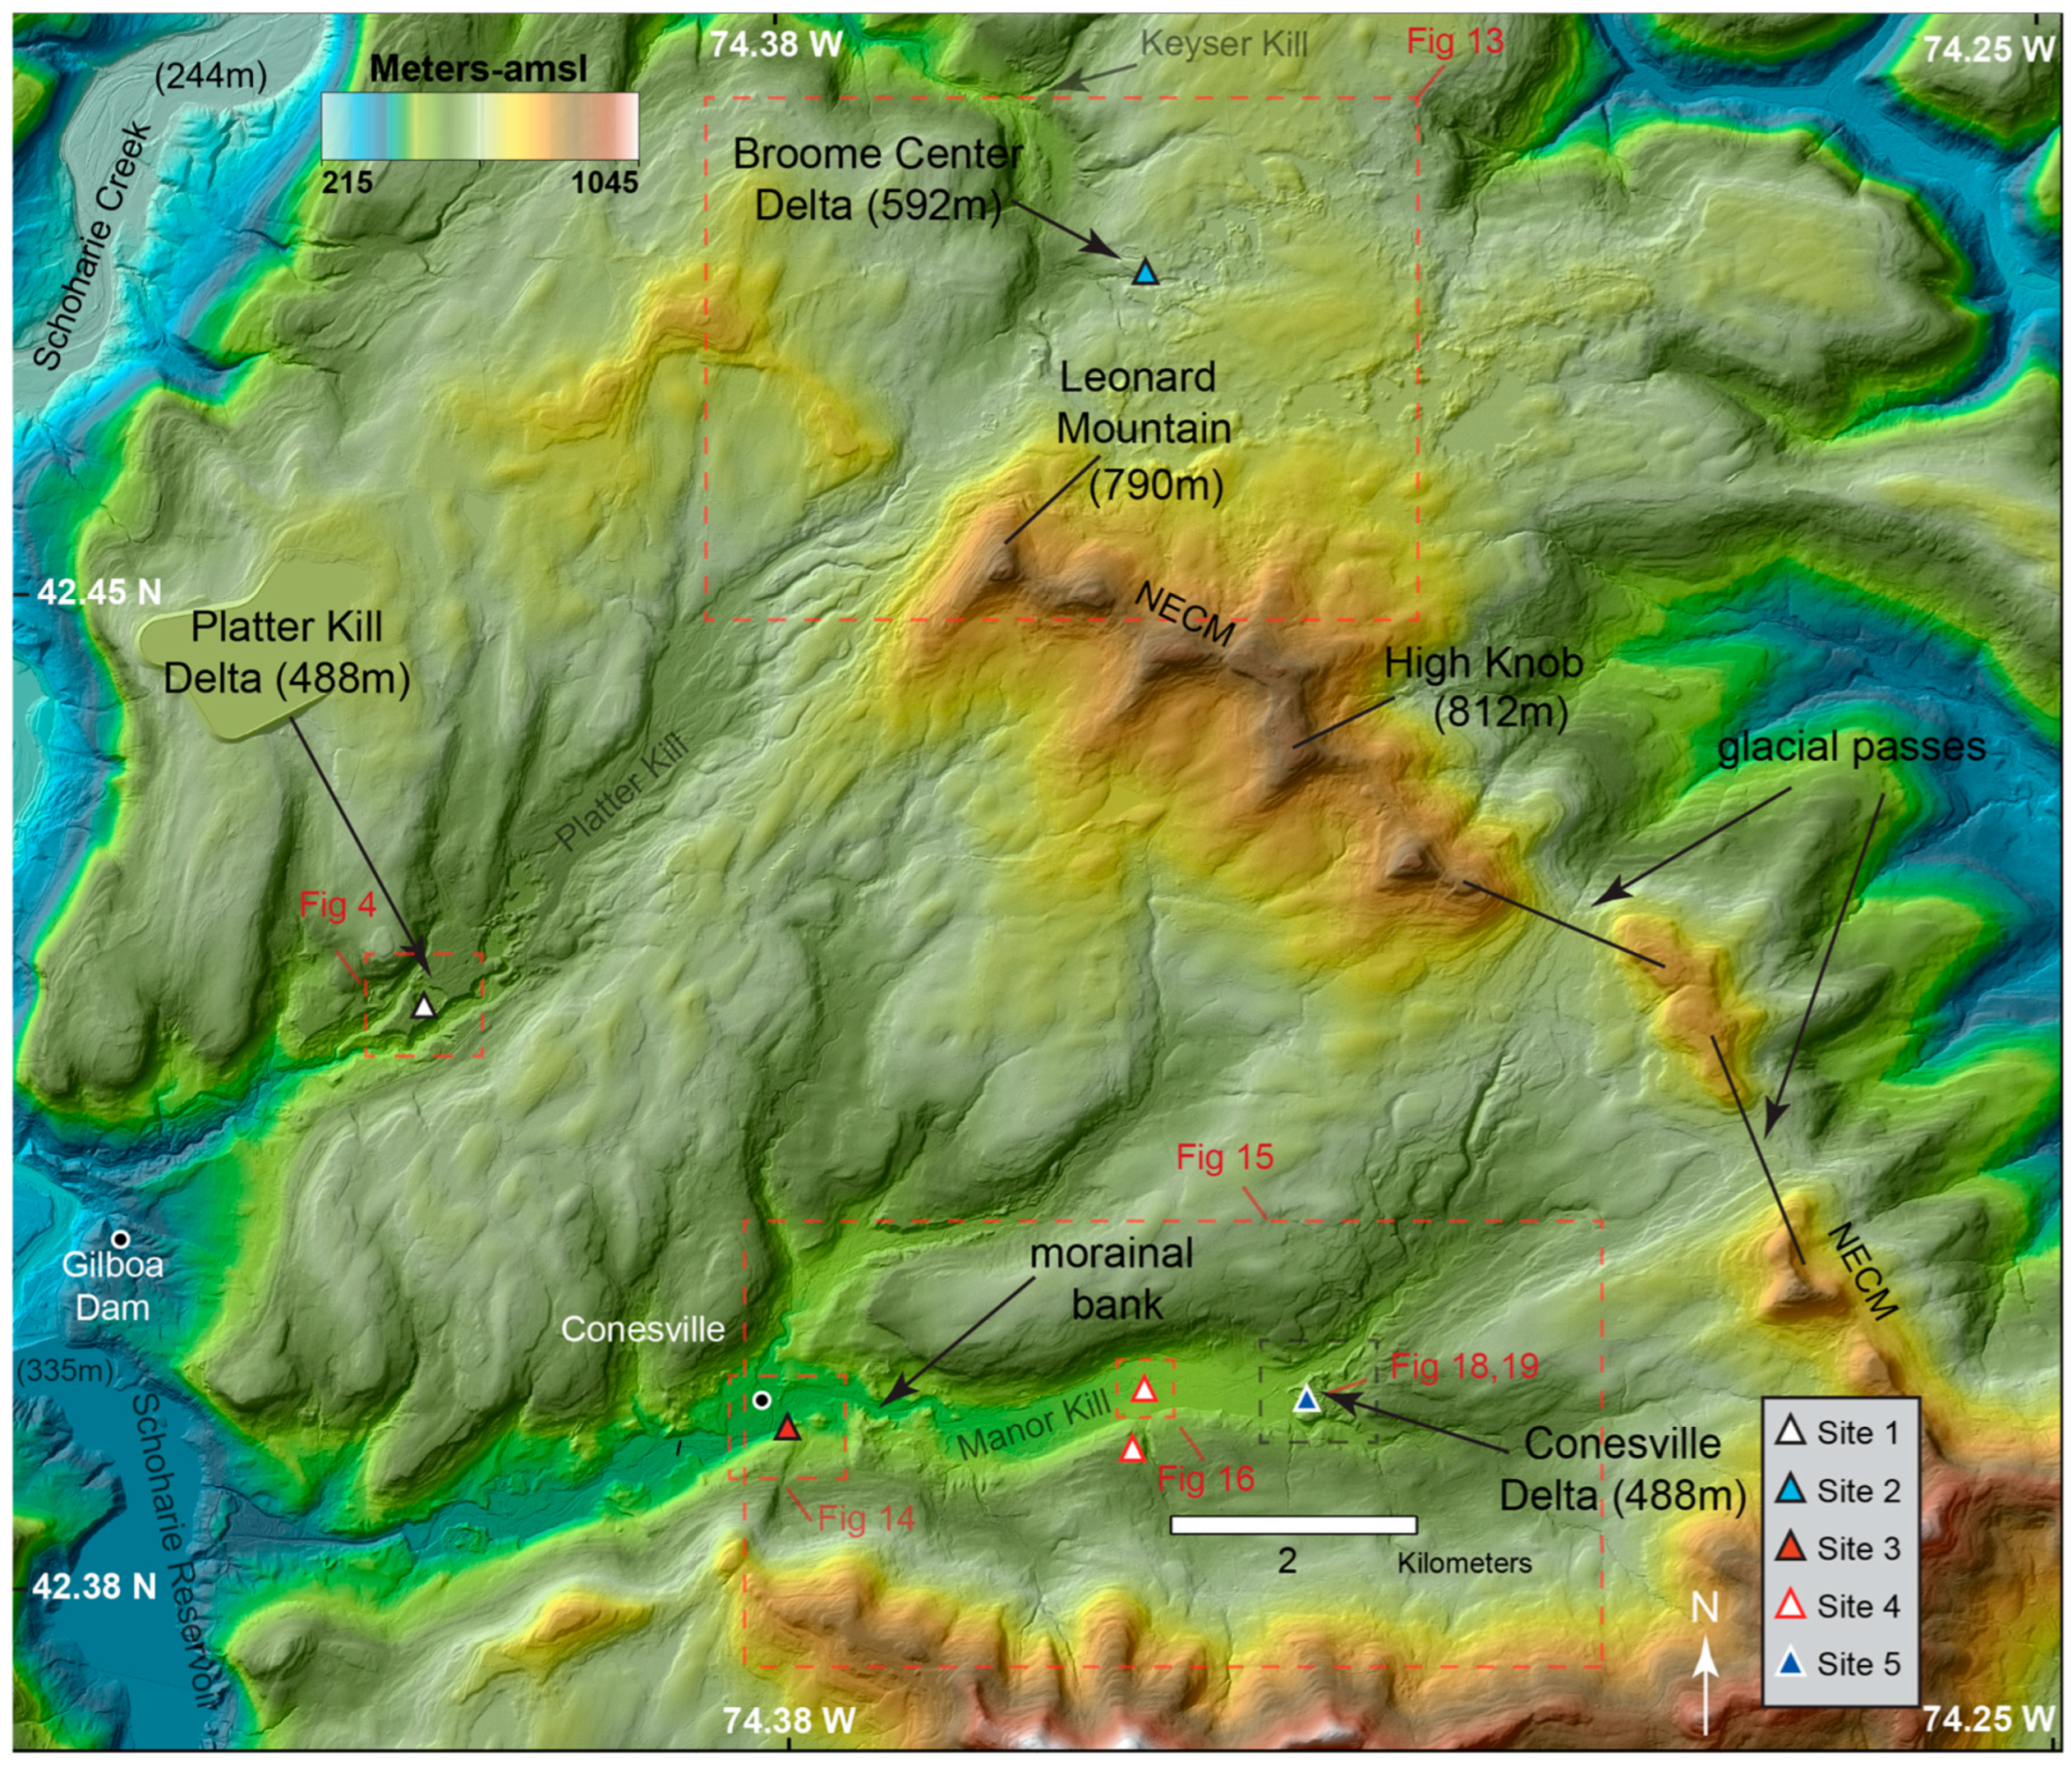
In east-central New York State, the Schoharie Valley of the northern Catskill Mountains guides the modern Schoharie Creek, a north-draining tributary to the Mohawk River (Figure 2). Although Schoharie Creek is fed by numerous tributaries, here we focus on the west-draining tributary valleys of the Platter Kill and the Manor Kill in the central Schoharie Valley near Gilboa, NY (Figure 3). The valley walls of both tributaries are draped by a suite of glacial landforms and the valley floors are dominated by thick (>30 m) and smooth accumulations of lacustrine sediments that were deposited in a proglacial lacustrine setting and often have a veneer of postglacial alluvium at the surface. Ice-contact landforms are also observed and range from subglacial landforms, such as drumlins and eskers, to ice-marginal moraines and kames [35,36,37]. Rich [35] identified deltas at an elevation of 488 m (above mean sea level, AMSL; all elevations reported AMSL) at the eastern ends of the Manor Kill and Platter Kill Valleys and interpreted these relict deltaic landforms to have been constructed in embayments along the eastern shore of a former ice-dammed lake controlled by an outlet at Grand Gorge [35,69]. Rich [35] also identified deltas higher on the landscape at an elevation of 592 m, controlled by an outlet at Broome Center, NY, near Leonard Mountain (Figure 3).
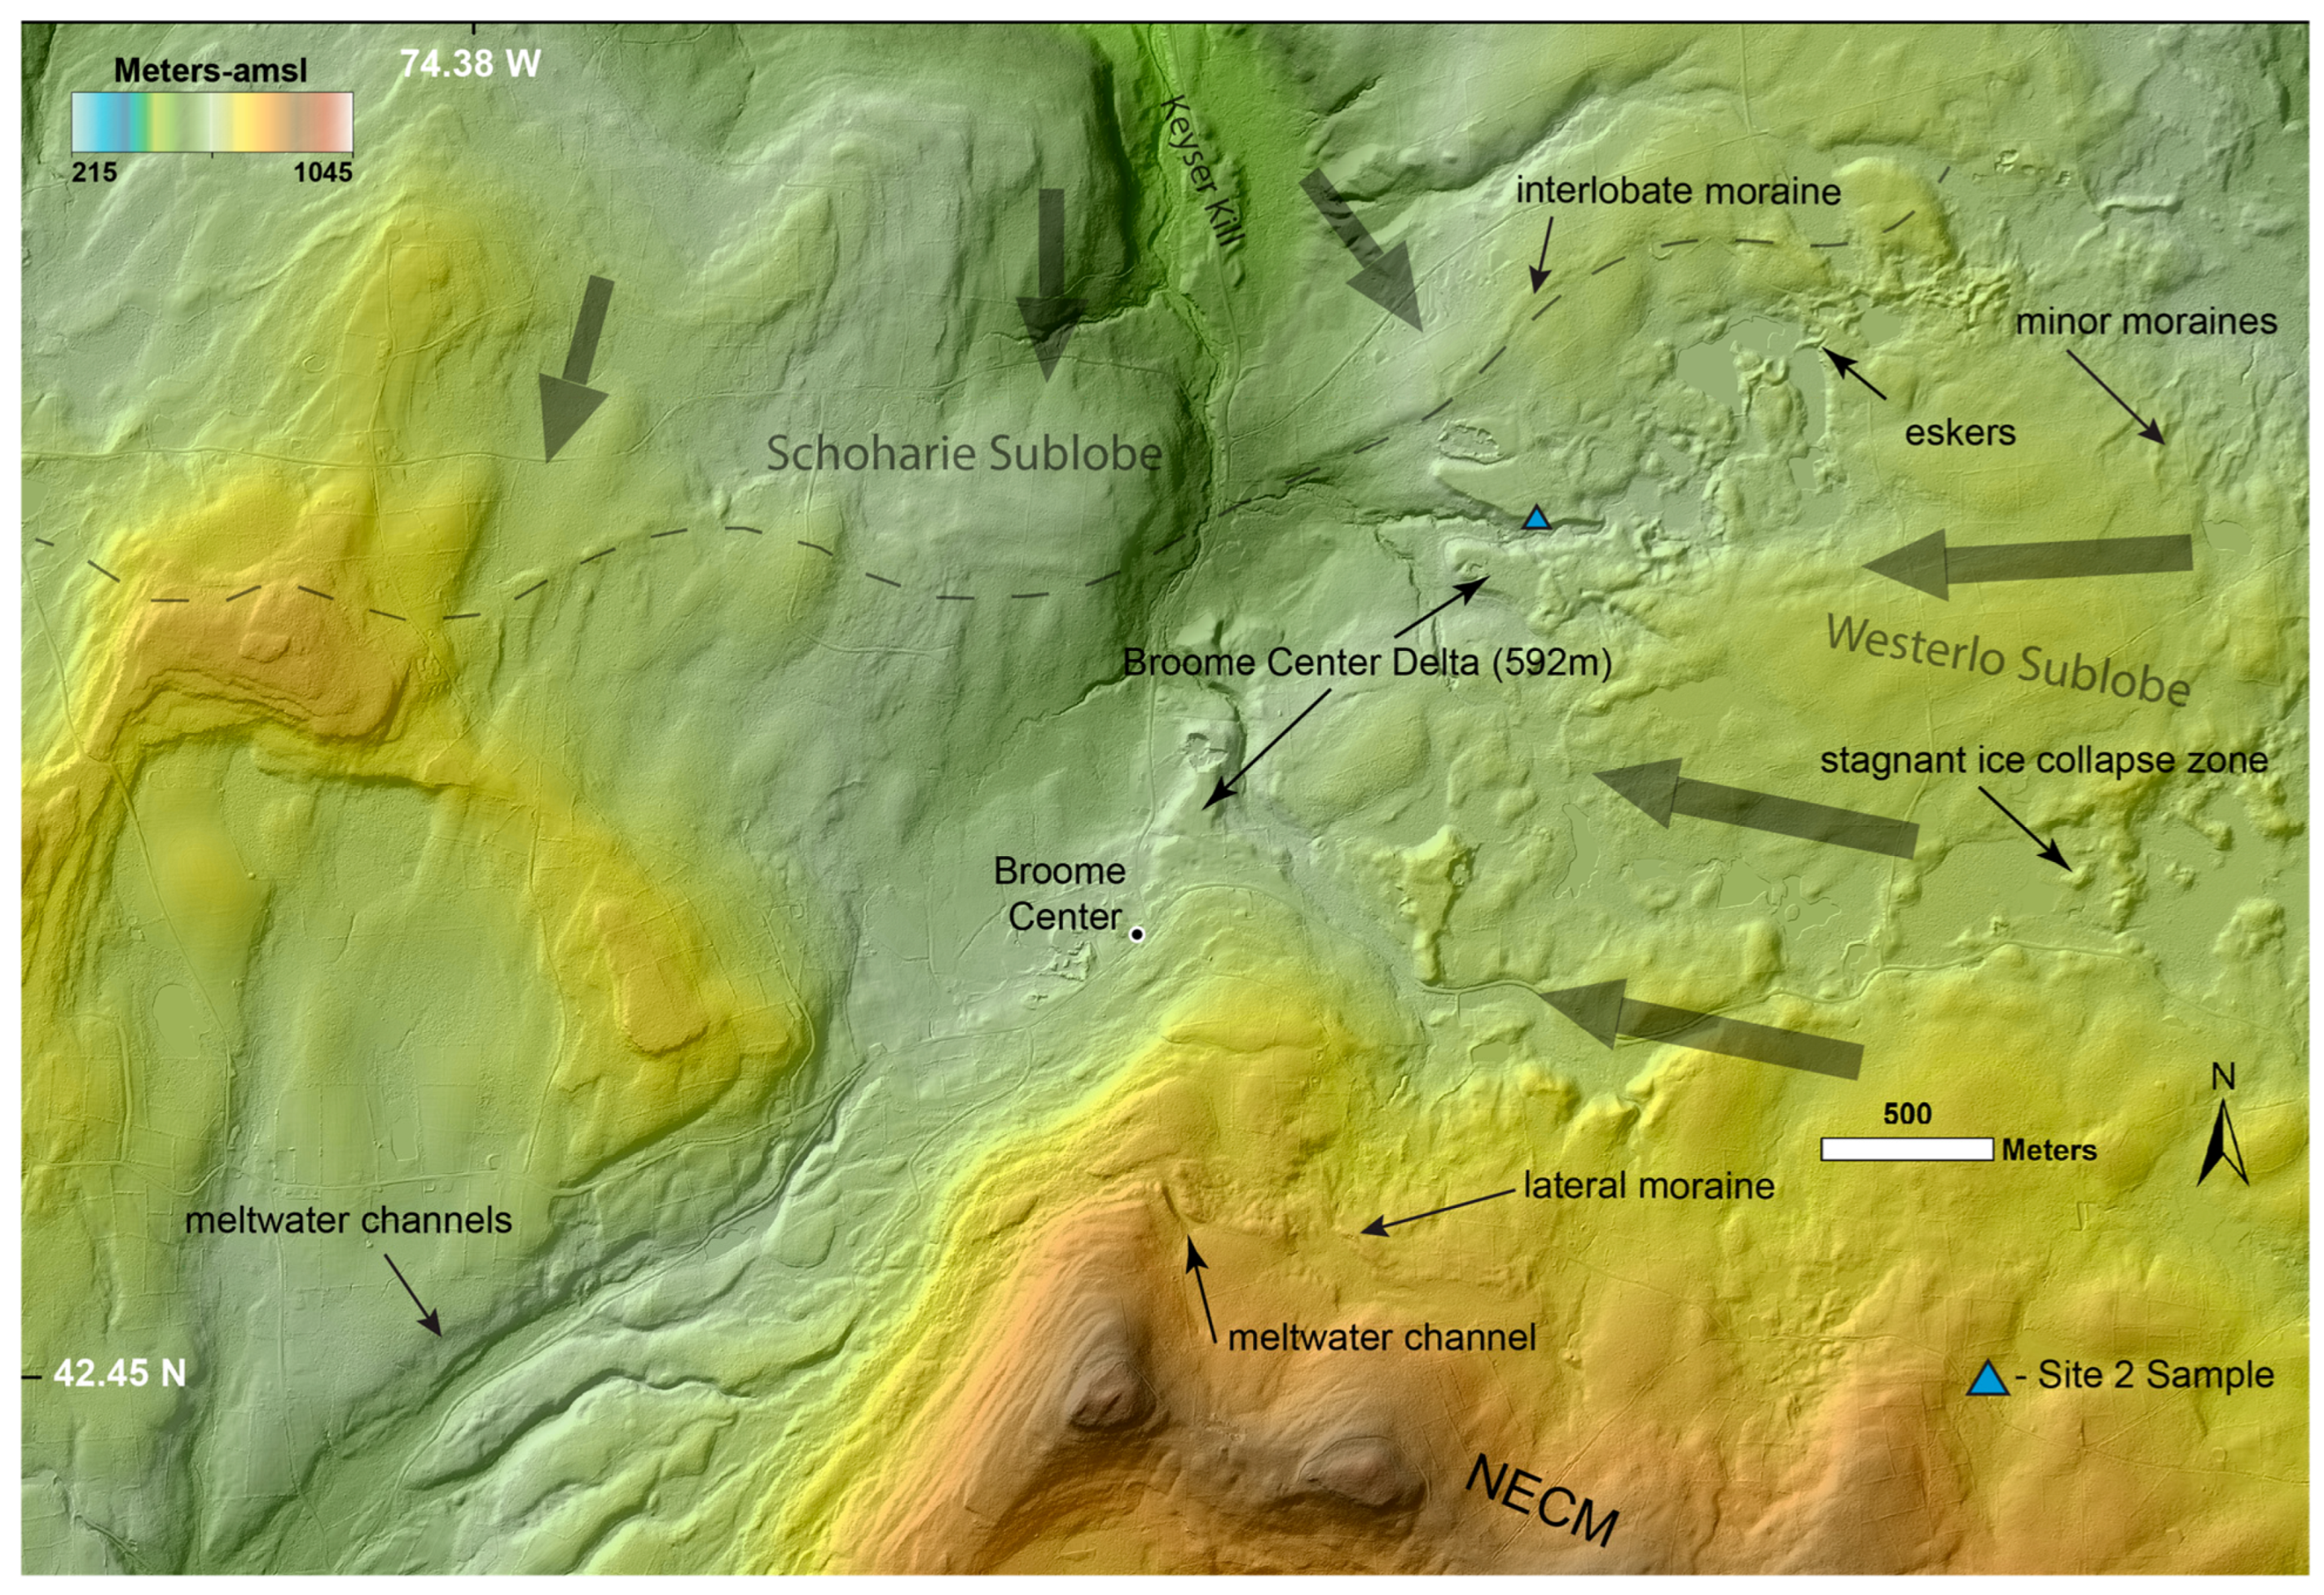
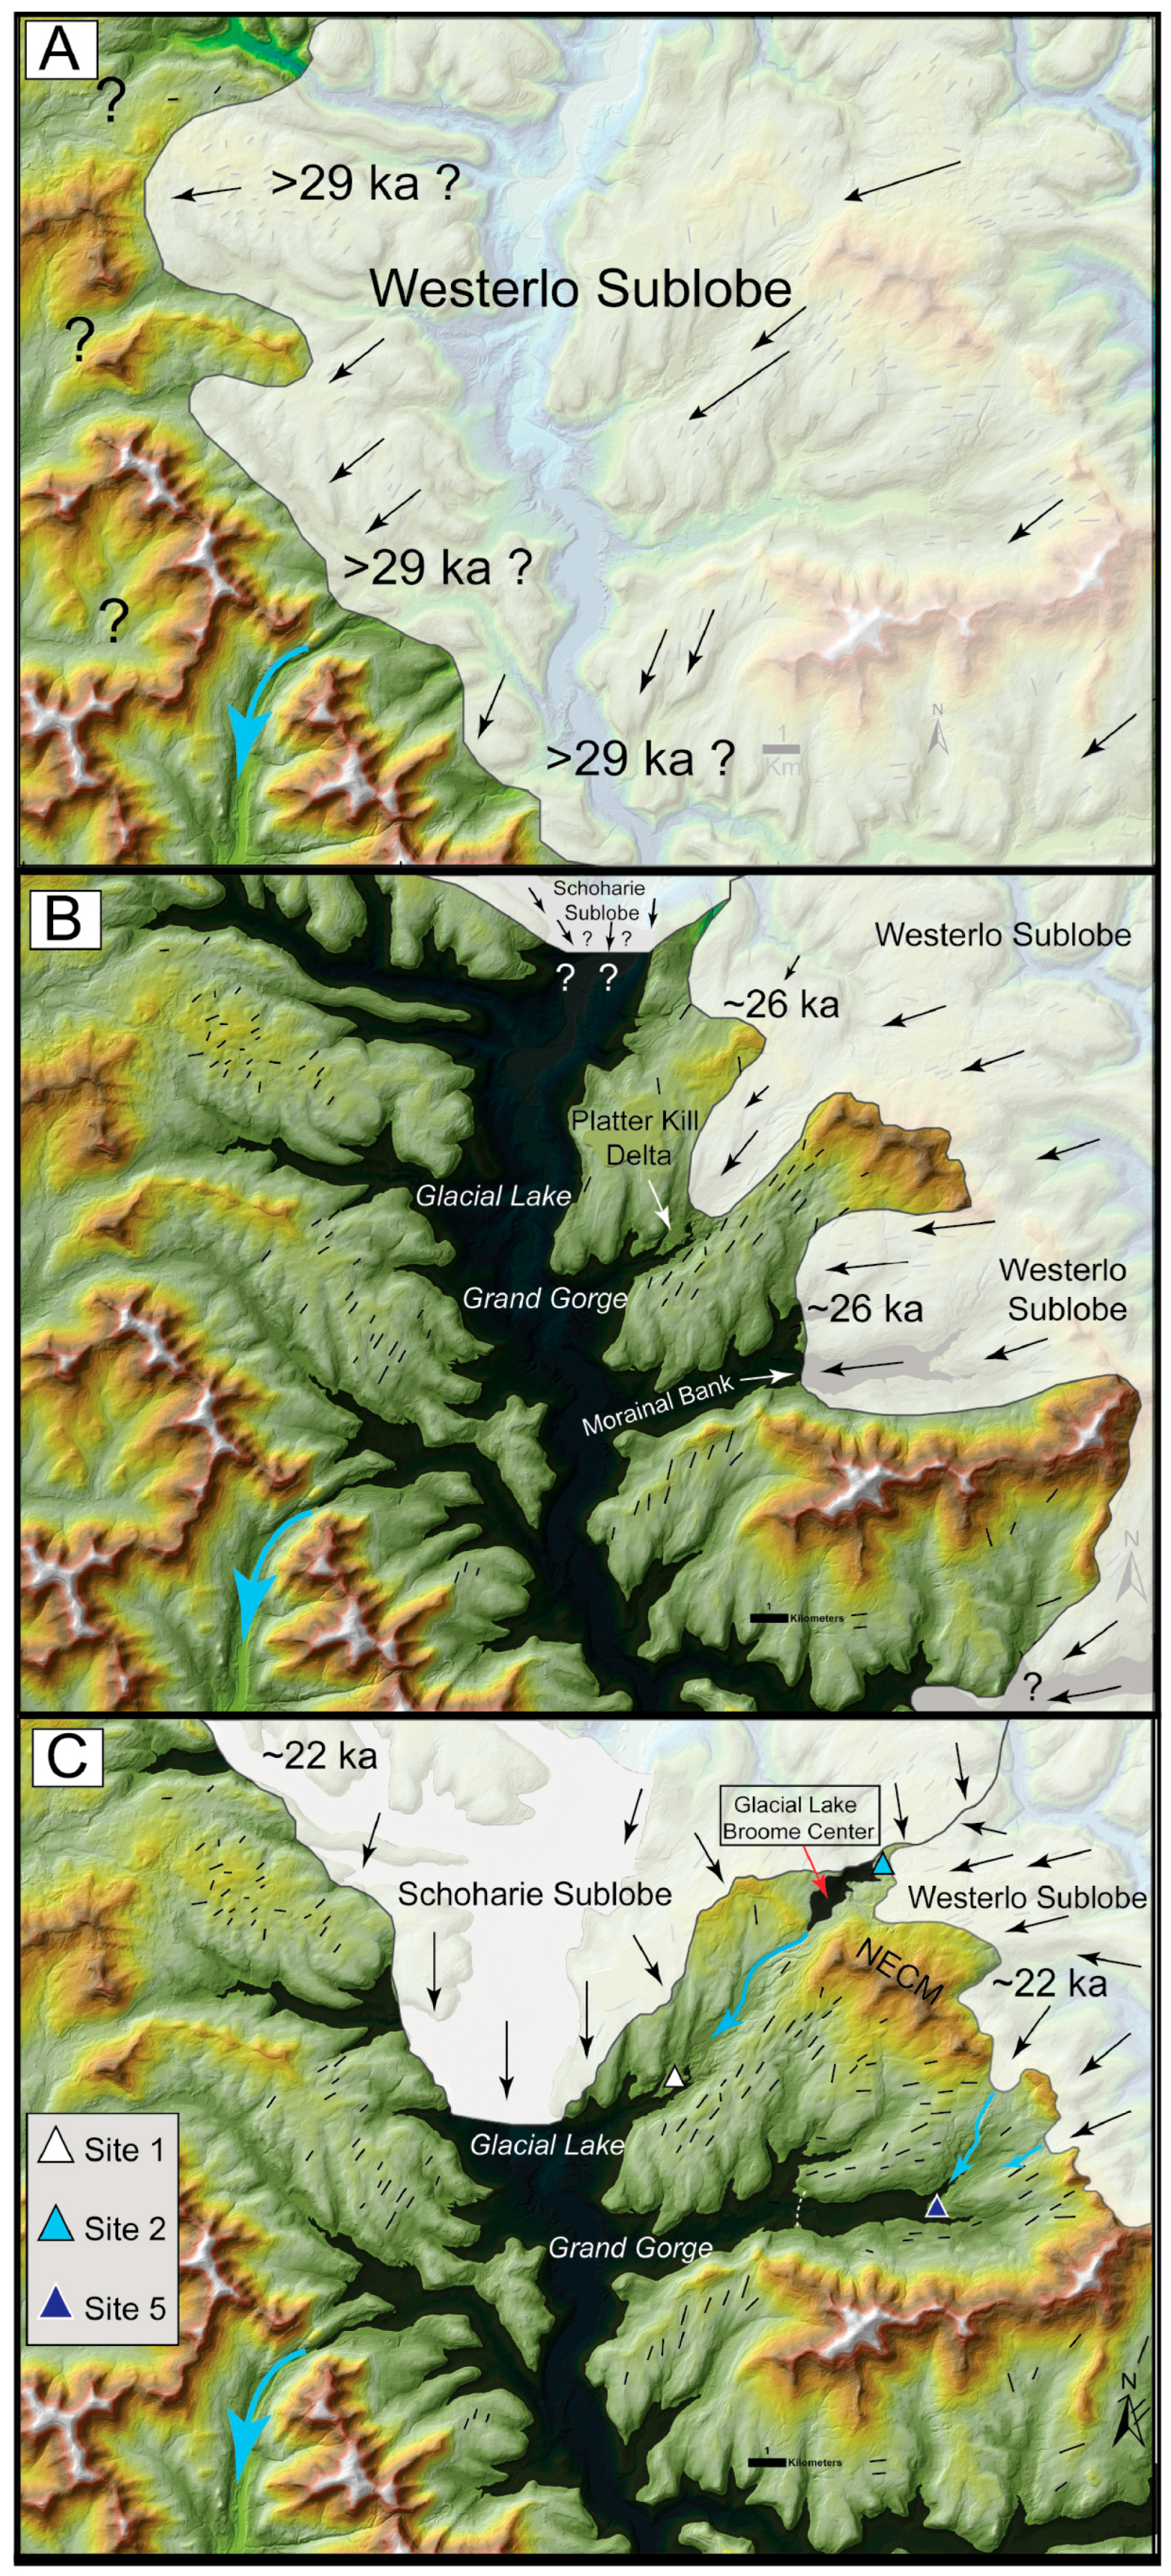
The landforms present in the study area developed where two sublobes of ice converged in an interlobate area centered around the northeastern escarpment of the northern Catskill Mountains, a prominent feature hereafter referred to as the NECM in this text (see Figure 2 and Figure S1). Rich [35], LaFleur [36], and Cadwell [37] proposed that as the Hudson Lobe advanced southward into the Hudson Valley prior to the LGM, its western edge expanded with increasing ice volume over the Helderberg Escarpment (Figure 2) and the NECM. Both Brigham [72] and Rich [73] recognized conflicting azimuths on the long axes of streamlined landforms in the lower Mohawk Valley and the Helderberg Plateau (HP) as evidence of divergent ice flow to the south and west near the confluence of the Hudson and Mohawk Valleys. Dineen [74] recognized drumlins on the HP having a southwest azimuth and introduced the term Helderberg Sublobe to reflect southwesterly ice flow as a contribution from the Hudson Lobe. However, the introduction of 1 m LiDAR digital elevation models combined with new geological and landform mapping [75,76] has improved topographic resolution. The term “Helderberg” is a subregional term, predominantly associated with a plateau (HP) and the Helderberg Escarpment. The new landform mapping (see Supplementary Materials) on a 1 m LiDAR basemap [75,76] clearly depicts a well-defined zone of streamlined landforms centered along the hamlet of Westerlo, NY (Figure 2), and extending southwesterly toward the NECM. With the precision of modern 1 m LiDAR terrain models, we find that the name “Helderberg Sublobe” of Dineen [74] introduces confusion and replace the terminology with the Westerlo Sublobe to better specify a southwesterly flowline originating and diverging from the western edge of the Hudson Lobe (Figure S1). With this clarification, it is the Westerlo Sublobe that is referred to as Hudson Lobe ice by Rich [35], LaFleur [36], and Cadwell [37].
Any southwestward advance of the Westerlo Sublobe south of Catskill Creek (Figure 2) toward the NECM would block southeastward drainage that may have originated from the Schoharie Valley via the Franklinton Channel and Catskill Creek (Figure 2). Similarly, the Schoharie Sublobe, a small sublobe derived from the westward-expanding Mohawk Lobe, flowed south into the Schoharie Valley (Figures S1 and S2) and served as the primary ice dam that resulted in a series of proglacial lakes [35,36,37] through the Schoharie Valley and its tributaries in the northern Catskill Mountains. The northern portion of the NECM appears to demarcate the area where the Westerlo Sublobe converged with the Schoharie Sublobe just north of Leonard Mountain (Figure 2 and Figure 3). The synchroneity and spatial relationship between the Schoharie Sublobe and Westerlo Sublobe have not previously been explored.
Regional deglaciation is believed to have begun sometime between 24 and 20 ka [52,77], after the MIS 2 advance of the Hudson Lobe to the LGM in northern New Jersey and western Long Island. Ice margins and glacial material compositions in southeastern New York and the Hudson Valley are mapped [78,79] and regional correlations and chronologies have been proposed [80,81]. While many of the mapped ice marginal positions are interpreted to be recessional positions, the Rosendale [82], Delmar [74], and Middleburgh [36] ice margins have been proposed as readvance positions. Rich [35], Lafleur [36], and Cadwell [37] all mapped various ice-front positions within and around the Schoharie Valley. The closest mapped margins to this specific study are the Grand Gorge margin [37,78] that has been correlated to the Rosendale margin in the Hudson Valley [37,38,80]. Dineen [74] correlated the Delmar ice margin to the Middleburgh ice margin of Lafleur [36].

2. Methods

The new information we present is the work of recent surficial geological mapping [76] which analyzed sediments and stratigraphy exposed in sand and gravel quarries and along roads and streams. Sediment samples were gathered when permissible and stratigraphy photographed and documented as part of the mapping process. In addition, subsurface data in the Manor Kill and Platter Kill Valleys was collected utilizing direct push, sonic, and PQ wireline continuous soil-coring methods. The resulting sediment cores were described and photographed in the field and brought to the New York State Museum for further laboratory analysis and final archival into the Quaternary Landscape Materials (QLM) collection.
Sediment samples from cores and outcrops were closely scrutinized for plant and/or insect macrofossils preserved within buried stratigraphic horizons. Macrofossils recovered were carefully rinsed with water to remove sediment residue and then placed into an oven to dry at 42 °C. Organic materials were examined and photographed, after which those suitable for radiocarbon dating by accelerator mass spectrometry (AMS) were sent to the W. M. Keck Carbon Cycle Accelerator Facility at the University of California, Irvine. Resulting radiocarbon ages were calibrated using Calib 8.2 with intCal20 [60]. In this paper we report the median calibrated radiocarbon age rounded to the nearest decade.
Stratigraphic units of bedded sand in both surface exposures and subsurface cores were sampled for OSL dating when opportune. Surface exposures consisting of sand and coarse silt were carefully excavated to a minimum of 25 cm into the exposure for sampling. Once excavated, a steel conduit tube 5 cm in diameter was driven 25 cm into the exposure with a rubber mallet to encapsulate the sediment and prevent exposure to the sun. The tube ends were immediately capped and taped to prevent exposure to sunlight. A 50 mL vial of sediment adjacent to the OSL sample was collected at the same time to measure moisture content. Intervals of drill core sampled for OSL age analysis were collected by driving a 25 cm steel conduit tube into the end of the retrieved core barrel prior to core extrusion. Tube ends were immediately capped and taped to prevent exposure to sunlight and a 50 mL vial of sediment adjacent to the OSL sample was collected to measure moisture content.
At the Illinois State Geological Survey Luminescence Laboratory, subsamples for equivalent dose (DE) measurements (i.e., natural luminescence accumulations) were obtained from the center of the core tubes. Sediment from the external portions was used to measure the in situ water content, as a redundancy to the 50 mL vials, and its radioactive element content (uranium, thorium, and potassium), both for dose rate calculation. Quartz mineral grains for OSL dating were extracted from the remainder (inner portion) of each tube.
These grains were wet-sieved to retrieve the 150 to 250 μm grain size. A 10% hydrochloric acid rinse was applied to dissolve any carbonate minerals that might be present. Using a heavy liquid solution (2.58 g/mL) of lithium heteropolytungstate (LST), we separated K-feldspar from quartz. For quartz, further purification was done with a hydrofluoric acid (HF) attack (40% for 1 h) to dissolve any remaining impurities. A second HCl rinse was performed to dissolve calcium fluoride minerals, a potential by-product of HF dissolution of calcium-rich silicates. Finally, the purified quartz extracts were again sieved at 150 microns to remove partially dissolved impurities. A purity check on the quartz was performed by an infrared over blue OSL stimulation on a luminescence reader. These quartz samples showed no significant contamination from feldspar.
To obtain the dose rate, sediments from the external portion of each sampling tube were dried, and a representative portion was encapsulated in thin disk-shaped containers (~20 g) and sealed with two layers of epoxy gel. A minimum waiting time of 21 days after sealing is recommended to restore the radioactive equilibrium of radon-222 daughter products [83]. The specific activities (Bq/kg) were measured with a broad-energy high-purity germanium detector (BEGe), in a planar configuration, shielded by 15 cm of lead. Efficiency calibration of the detector was obtained with a set of six certified standards (IAEA-RGU-1, IAEA-RGTh-1, IAEA-RGK-1, IAEA-385, NIST 4350b, and NIST 4355). All luminescence ages are presented in thousands of years, ka (0 year of collection and measurement = 2020 A.D.) following a calendar year, and uncertainties are given at the 68% (1σ) confidence level. The uncertainties combine random and systematic errors, added in quadrature. Further details can be found in the Supplementary Materials, and bin files for all OSL data are available on Zenodo: https://doi.org/10.5281/zenodo.20496122 (accessed on 1 June 2026).

3. Results

3.1. Site 1: Platter Kill Sand and Gravel Quarry

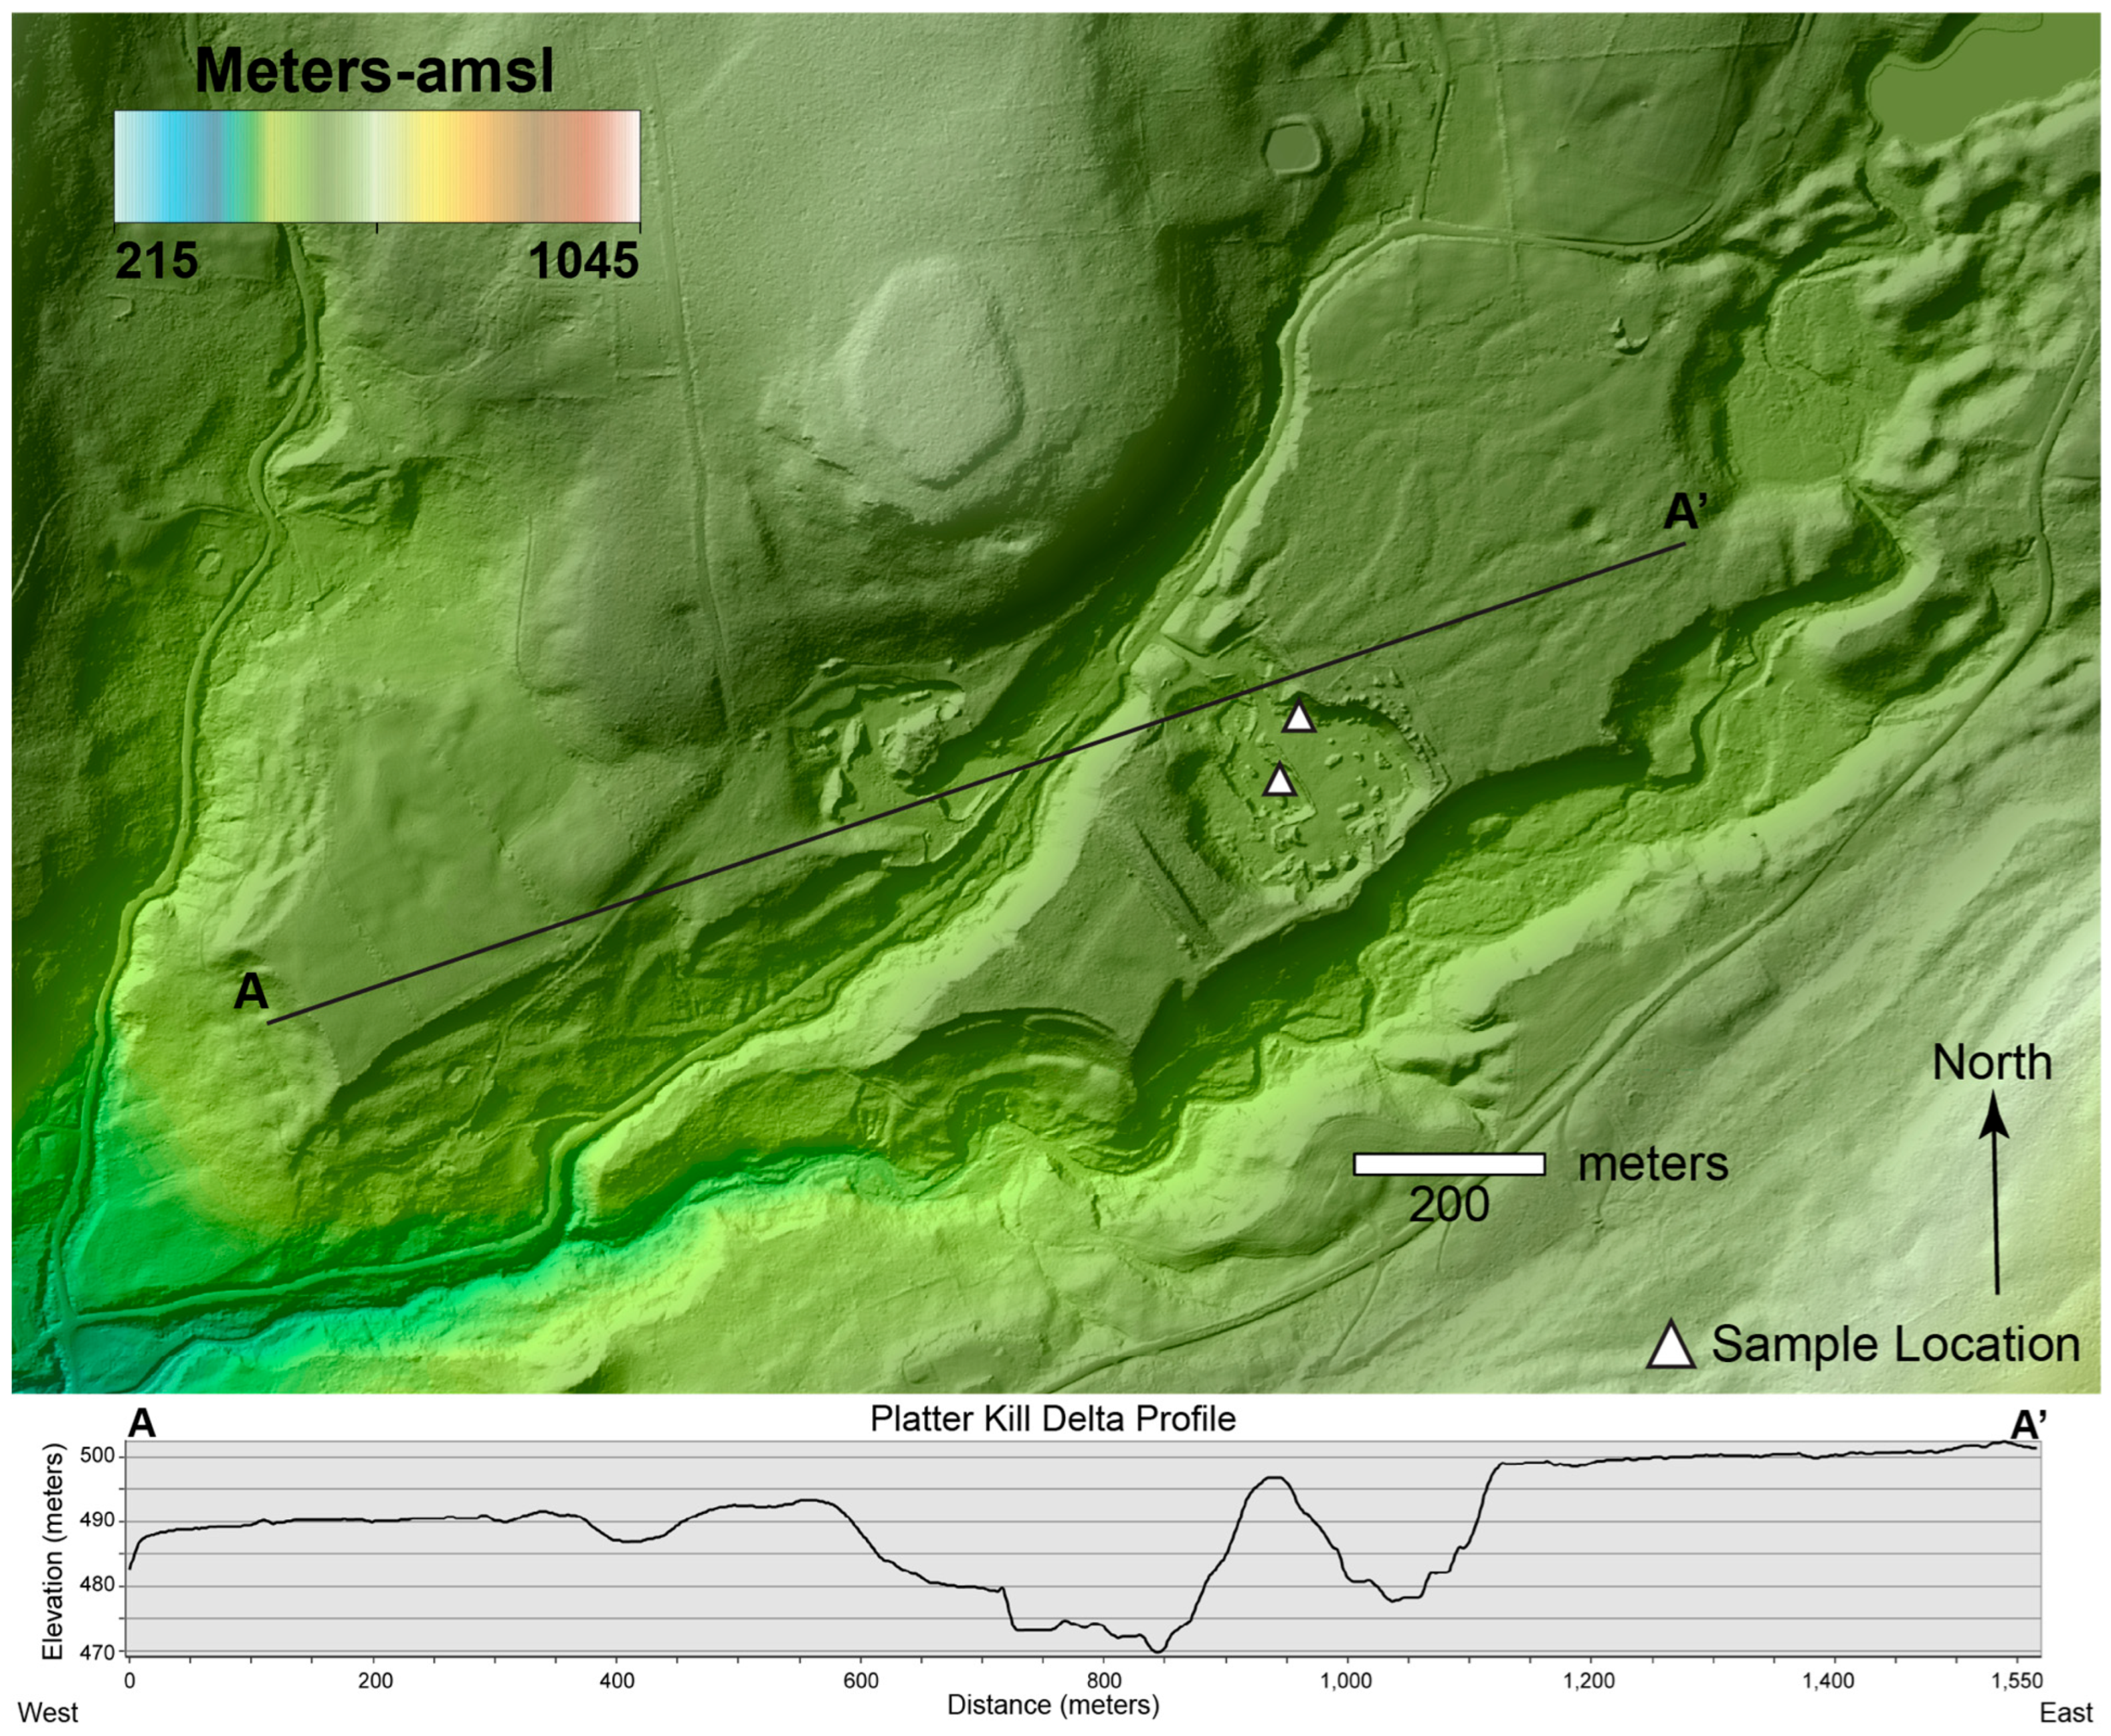
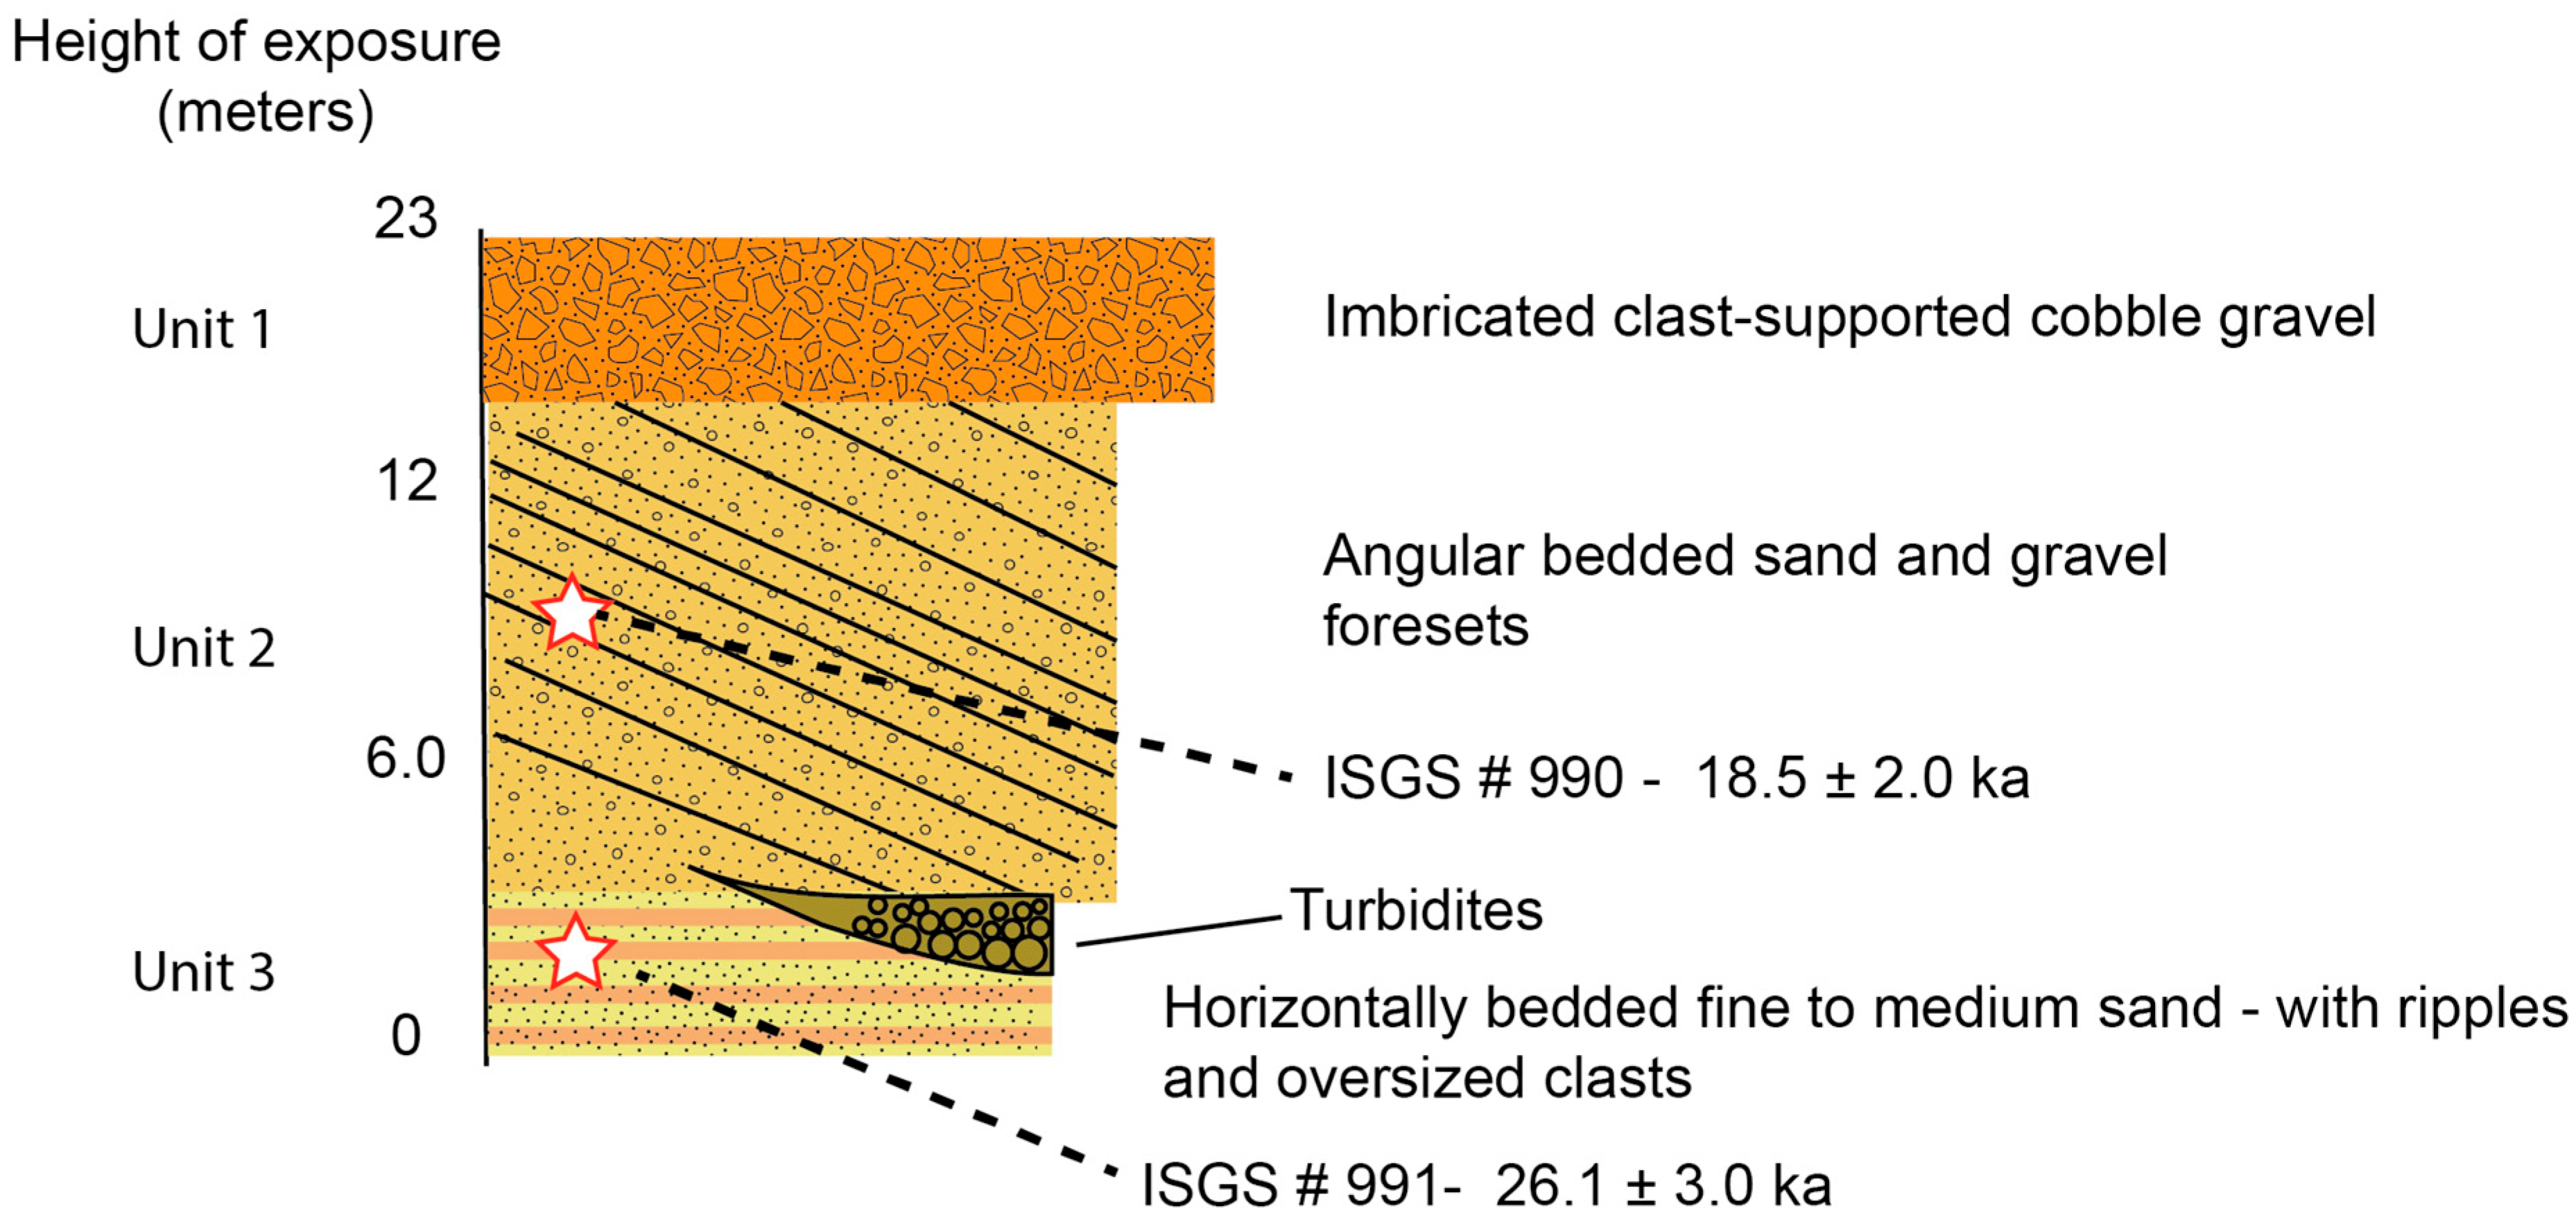
There are multiple sand and gravel quarries along the Platter Kill approximately 4 km northeast of the Gilboa Dam (Figure 3): an older abandoned quarry and a larger active quarry to the northwest of and adjacent to the creek (Figure 4). The active Platter Kill Sand and Gravel quarry (PK) exposes 23 m of stratigraphy and provided access to fresh exposures to evaluate. Exposures were divided into three units consisting of horizontally bedded cobble gravel (PK-Unit 1), angular-bedded sands (PK-Unit 2), and horizontally bedded rippled sand and silt (PK-Unit 3) (Figure 5) and are described from the base of the section upward.
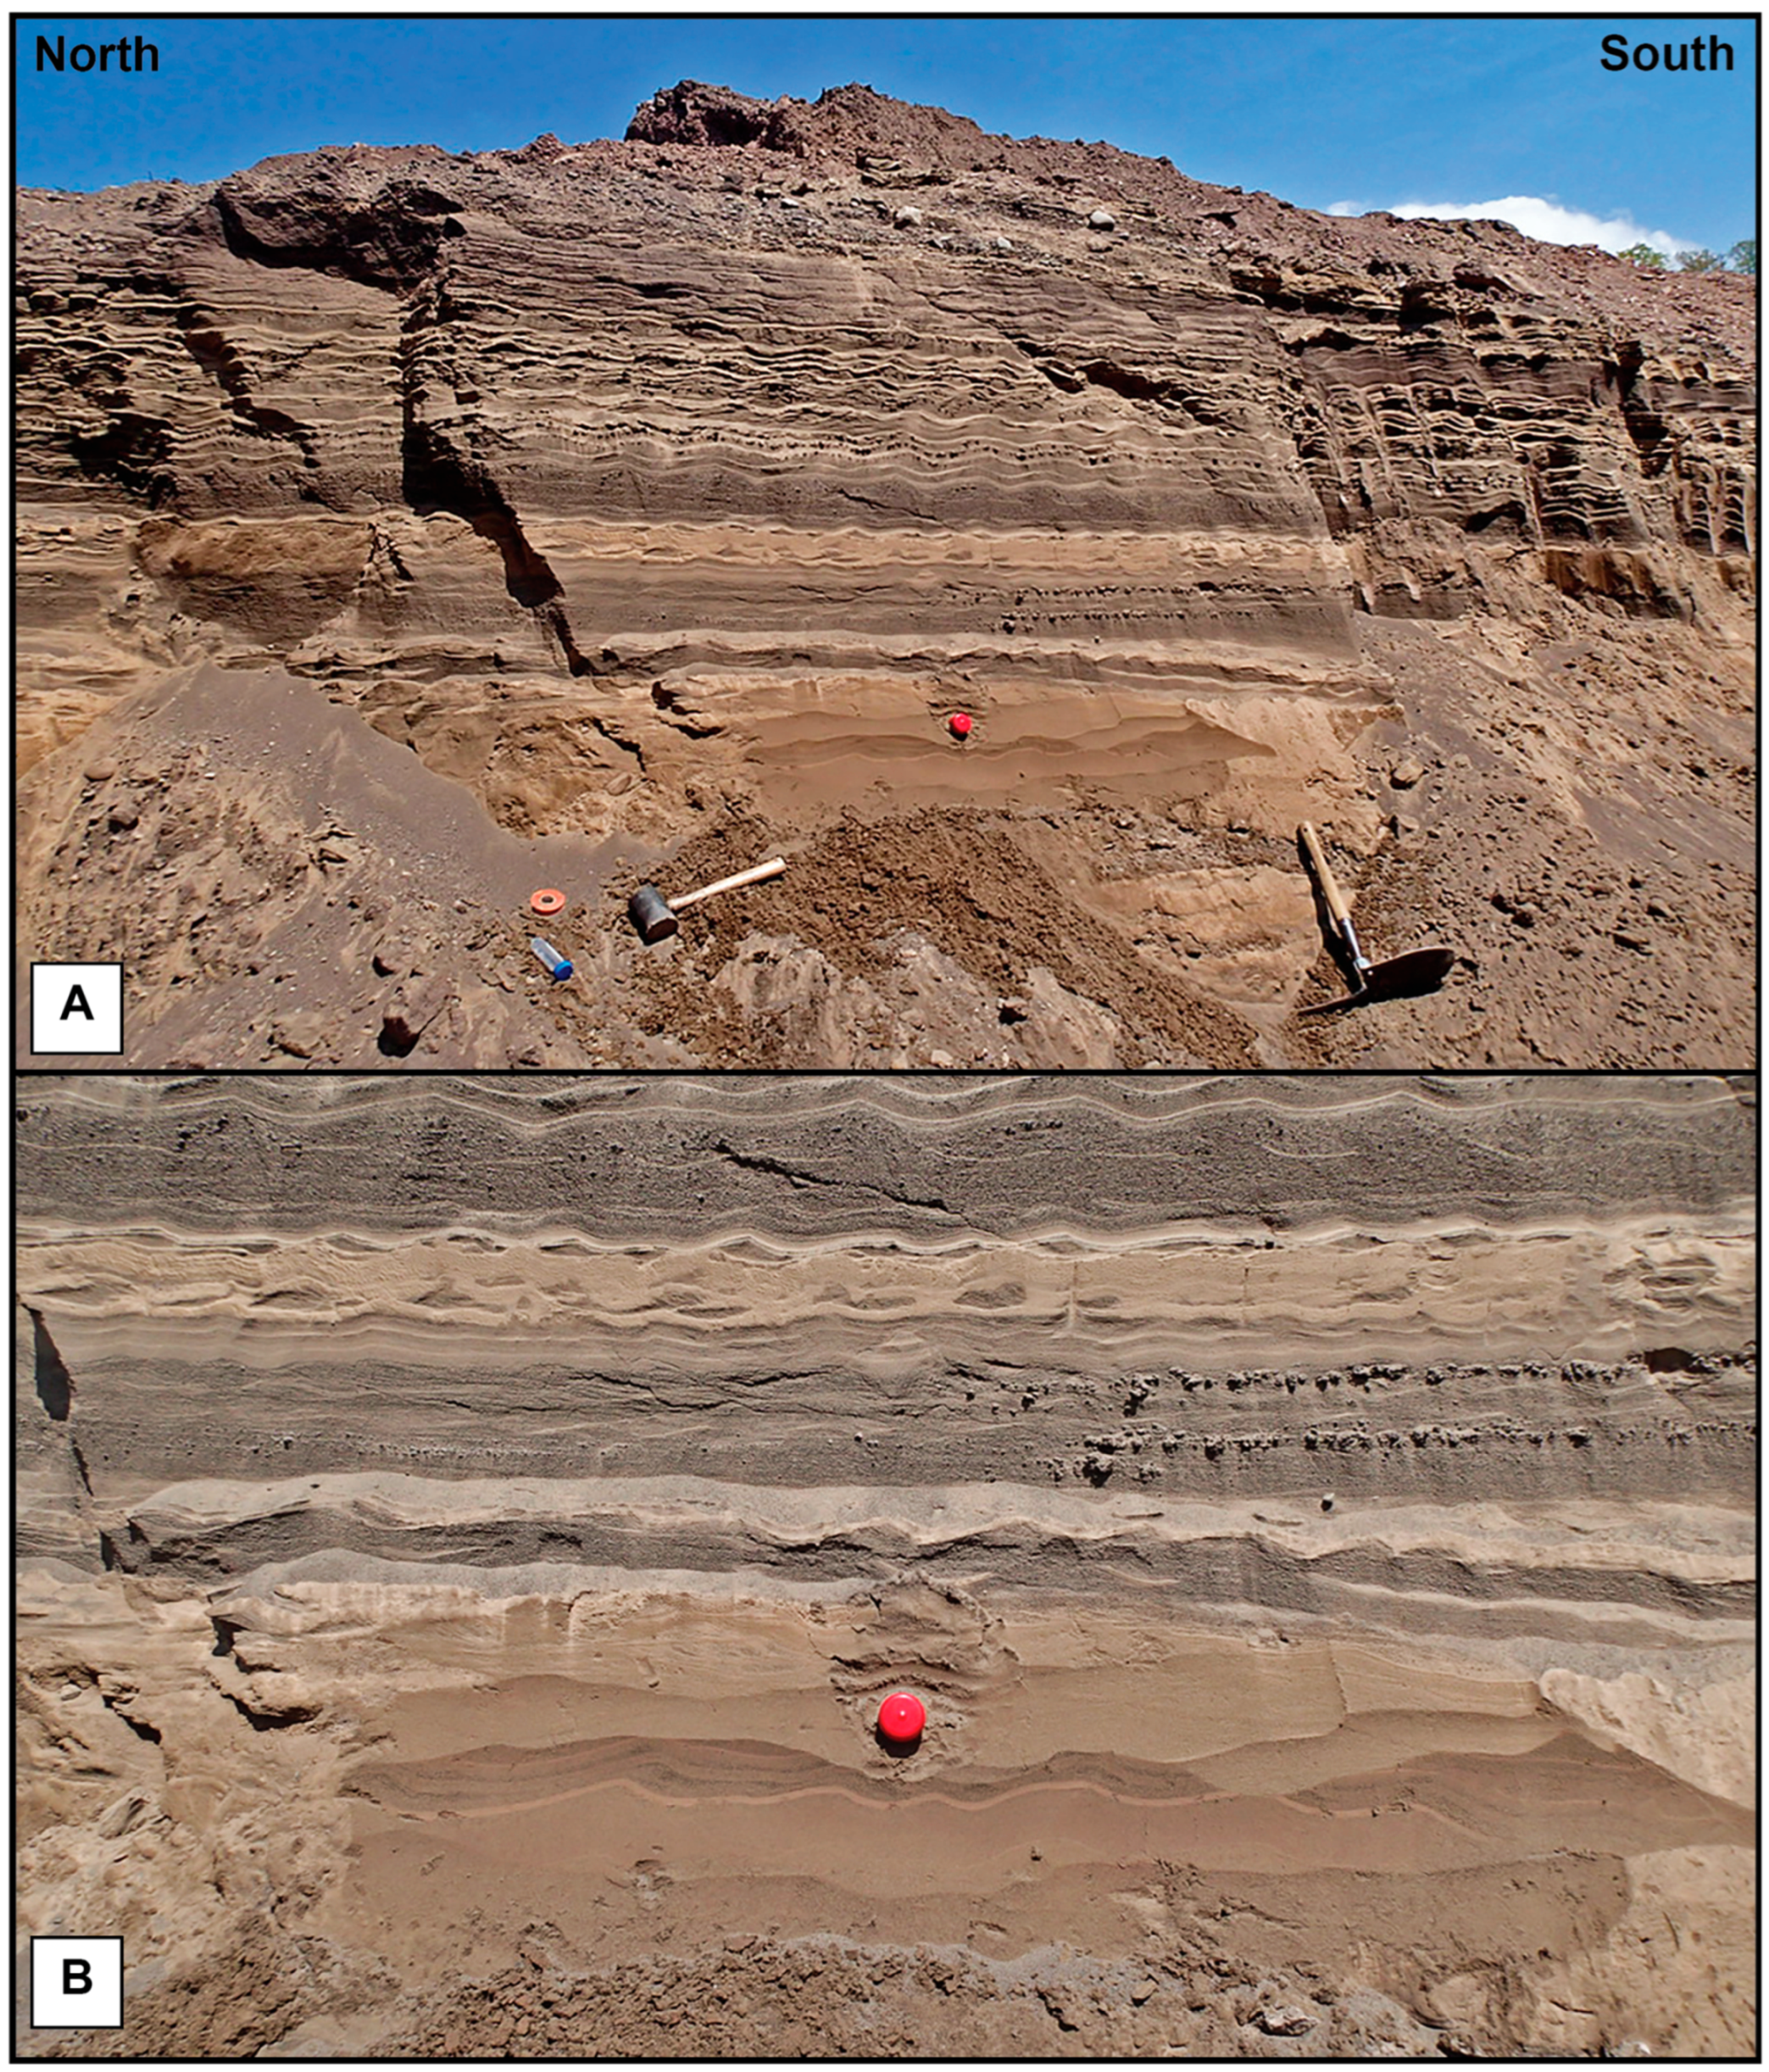
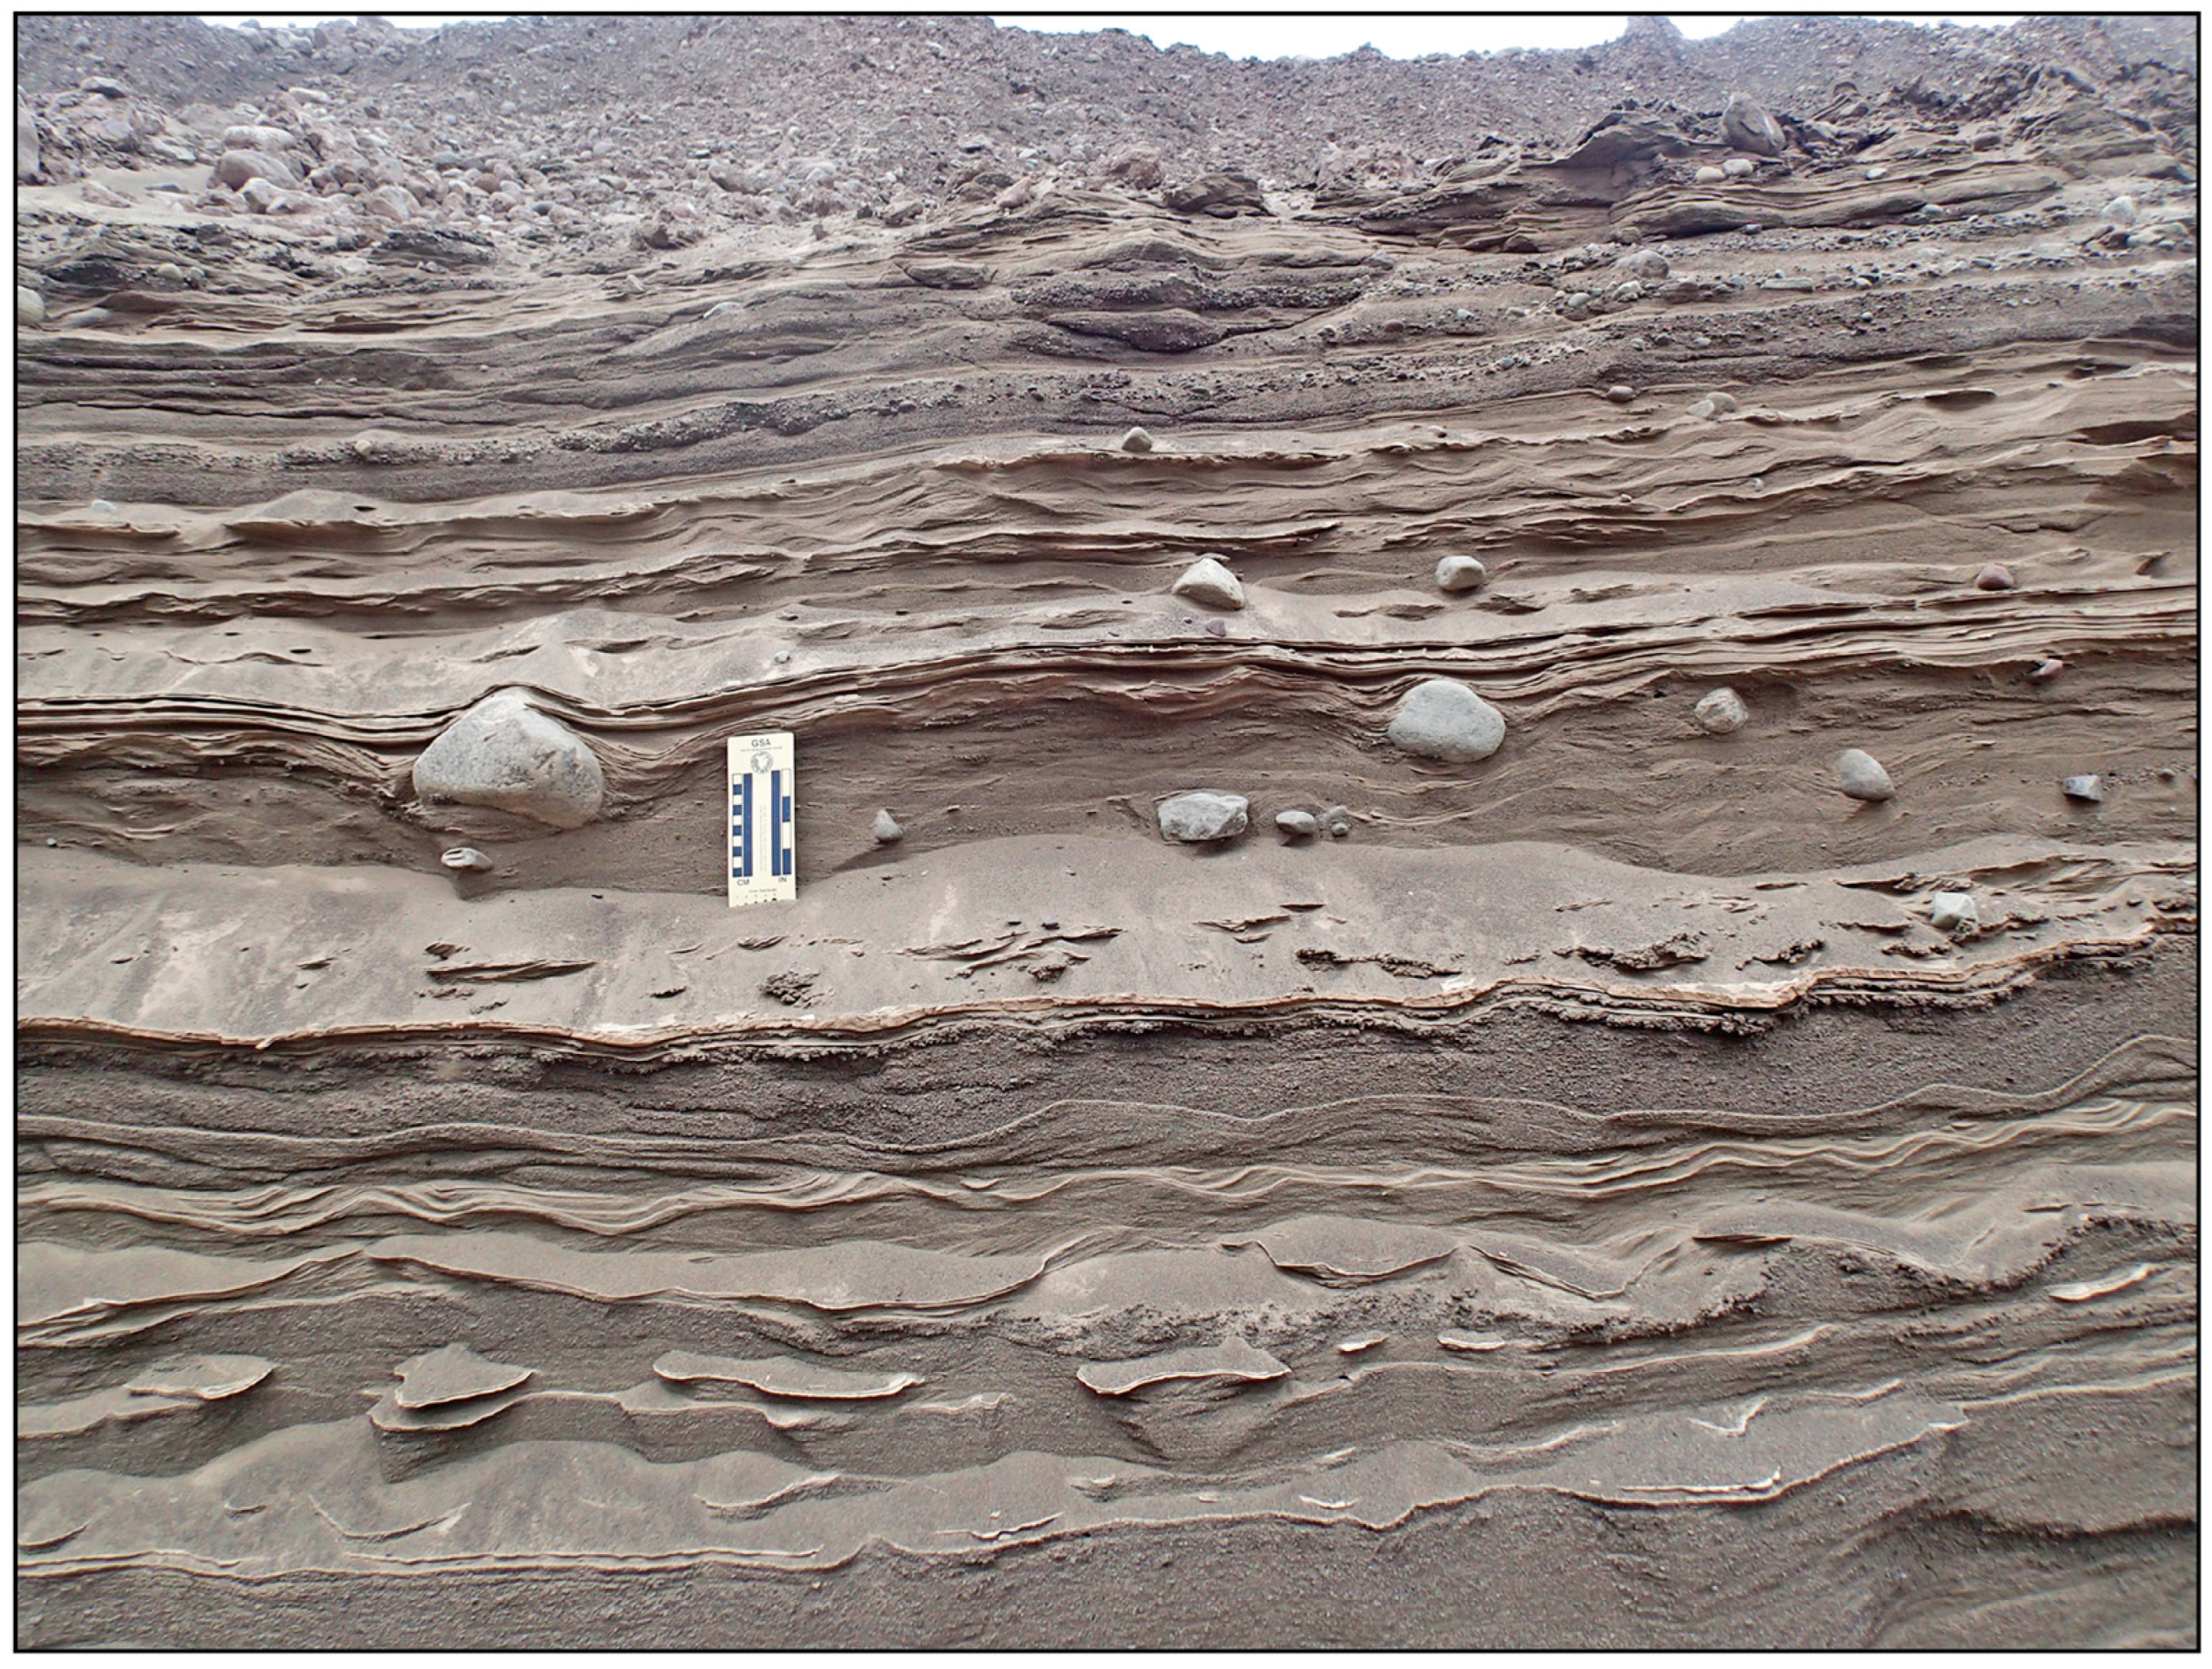
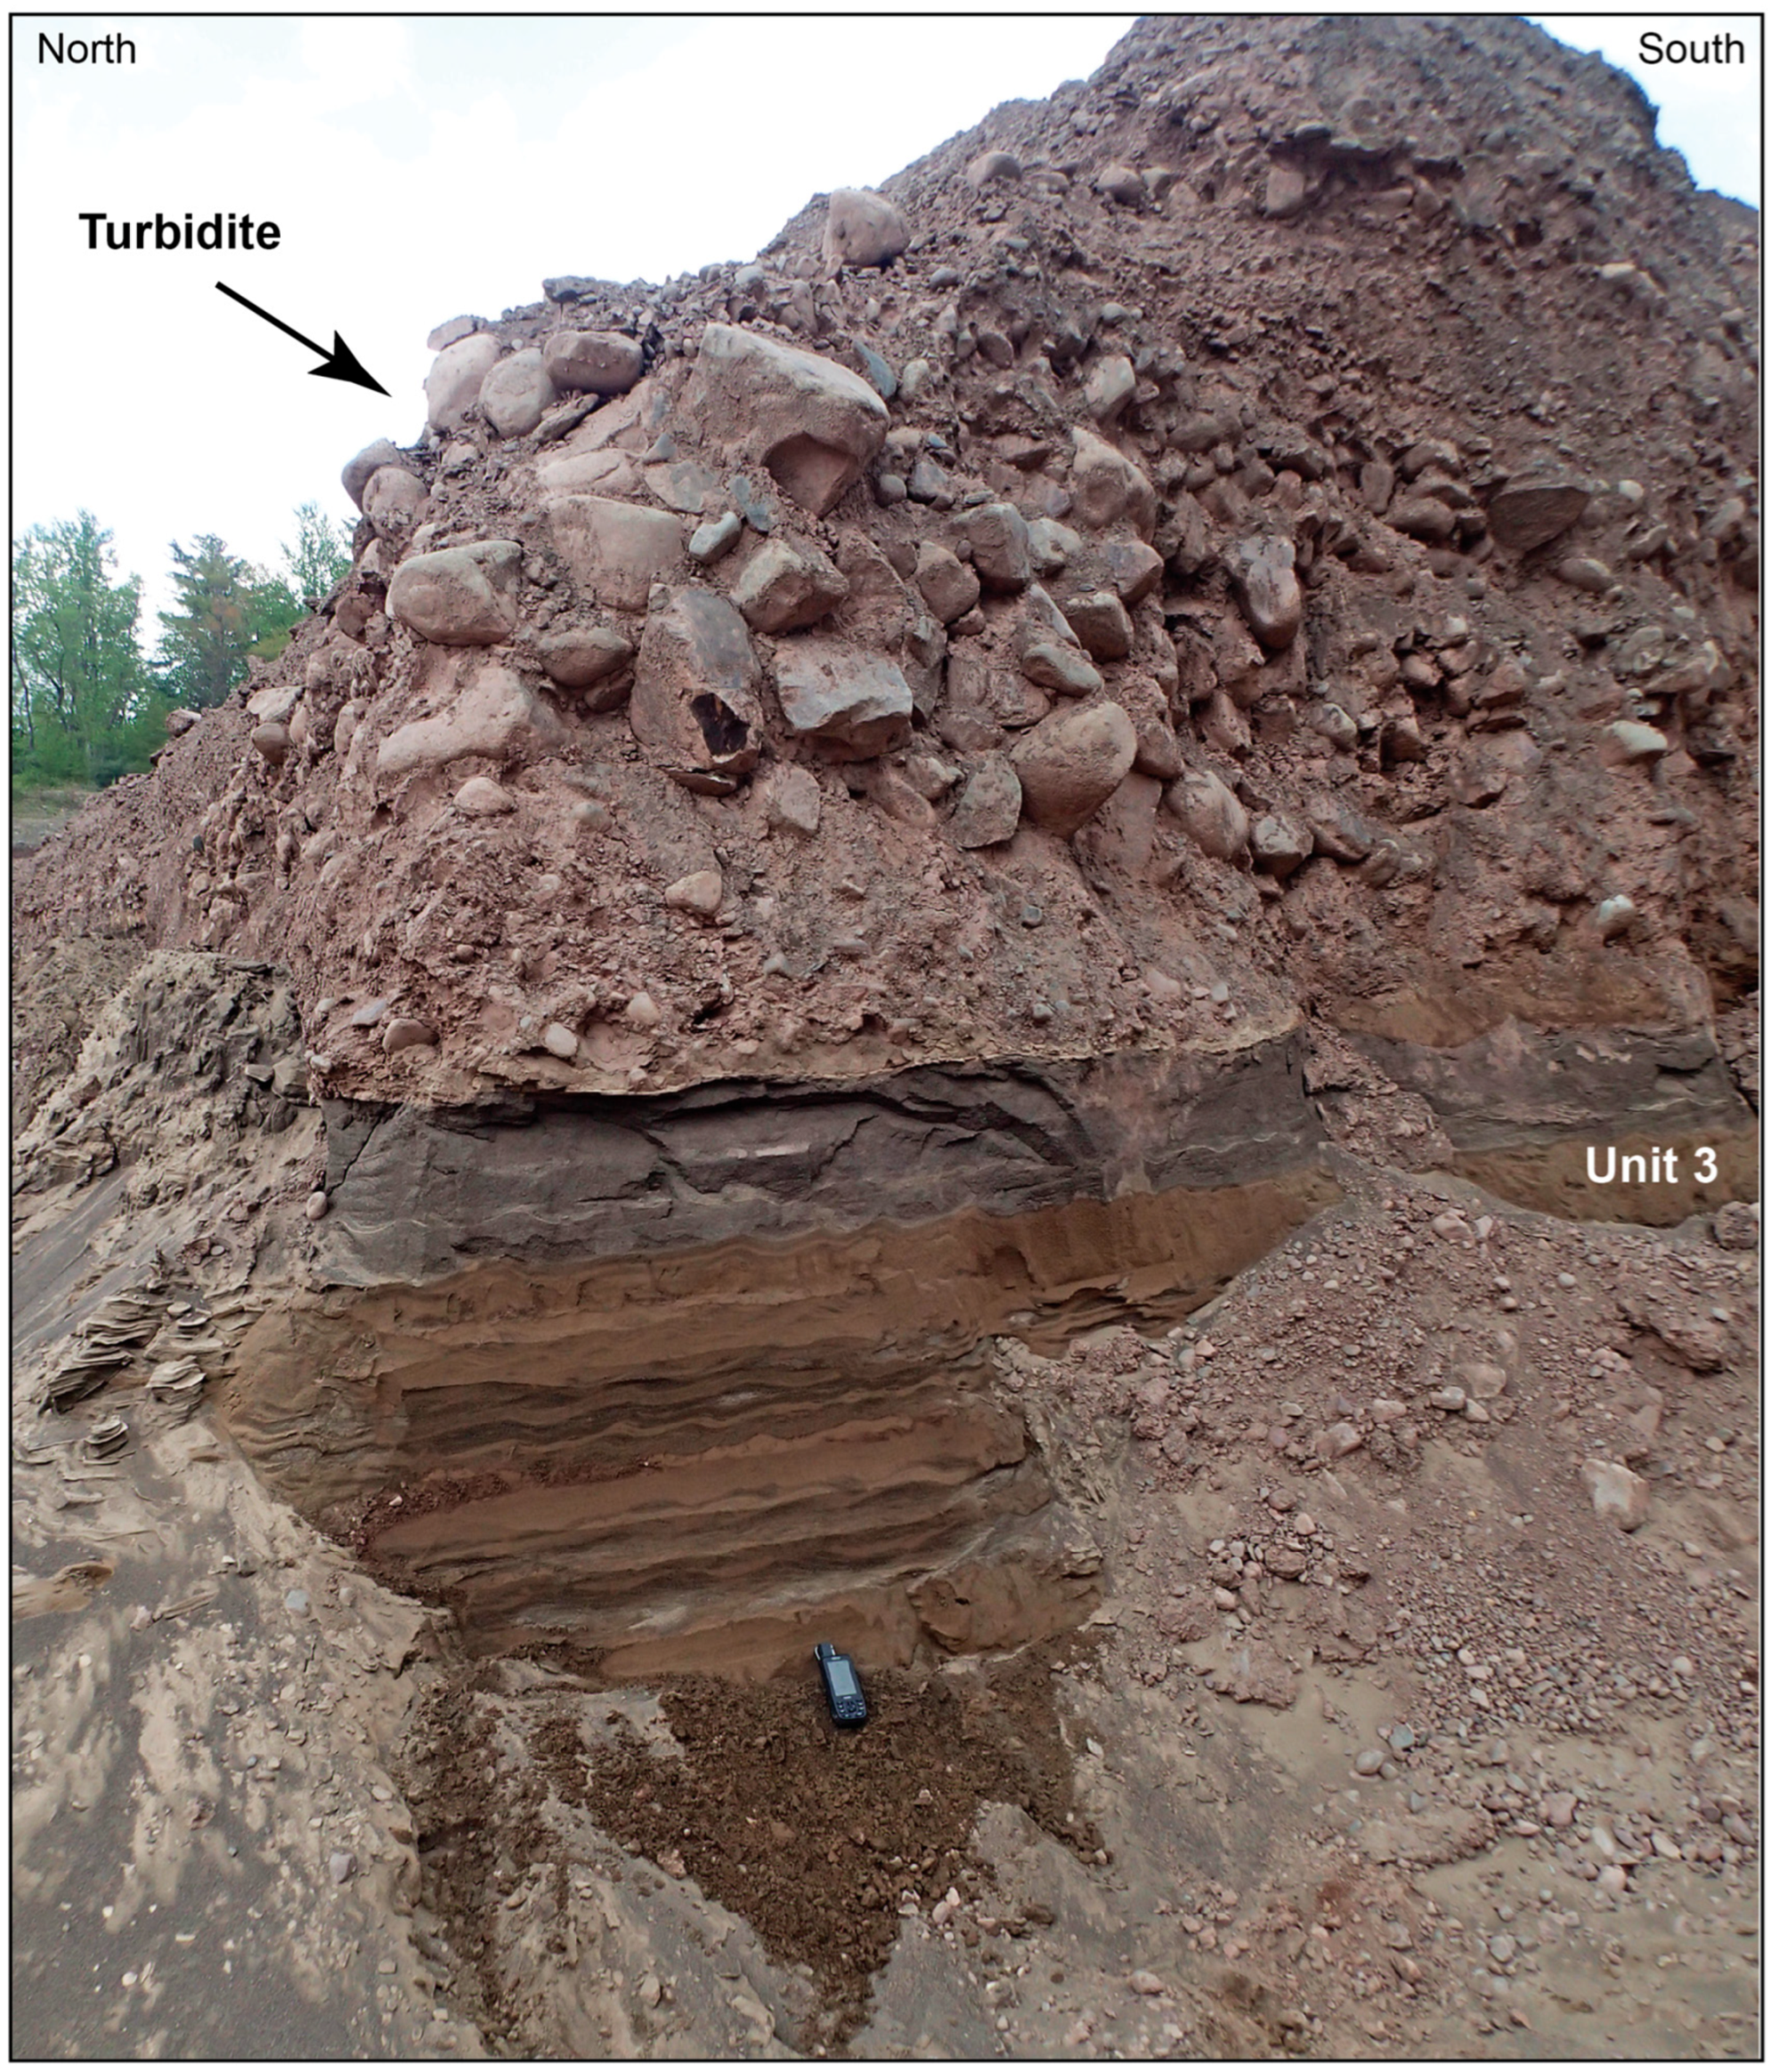
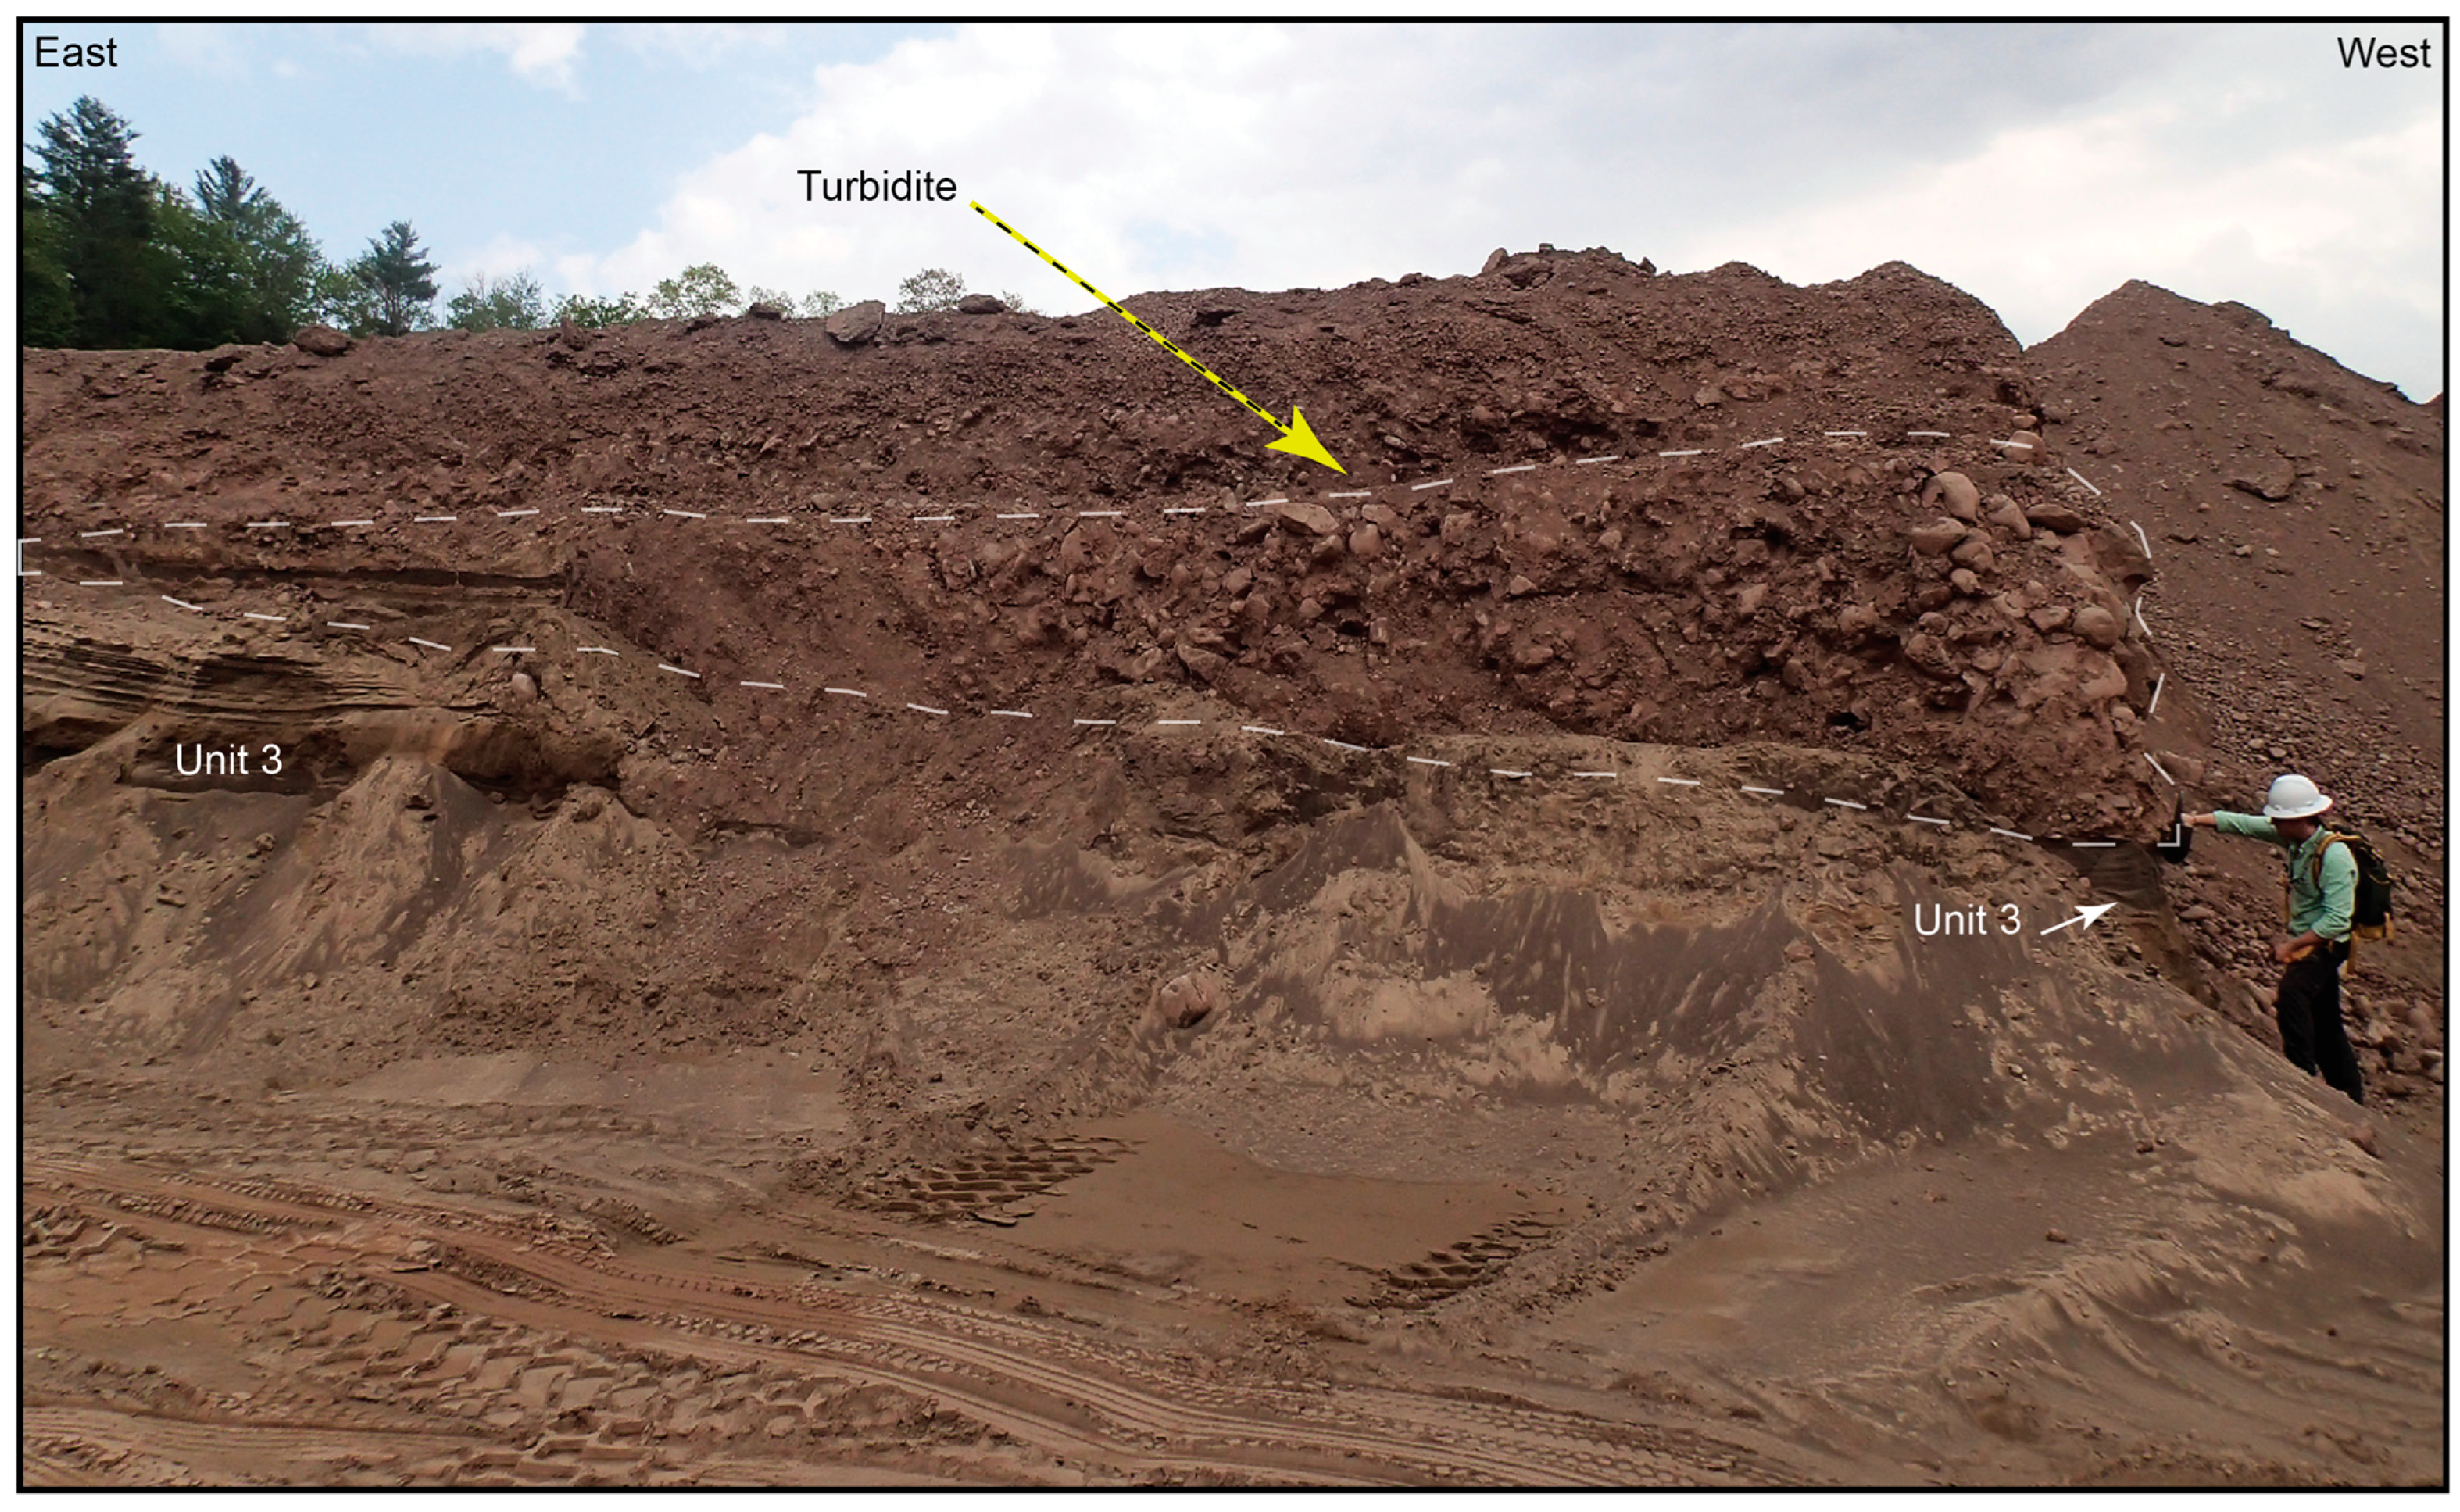
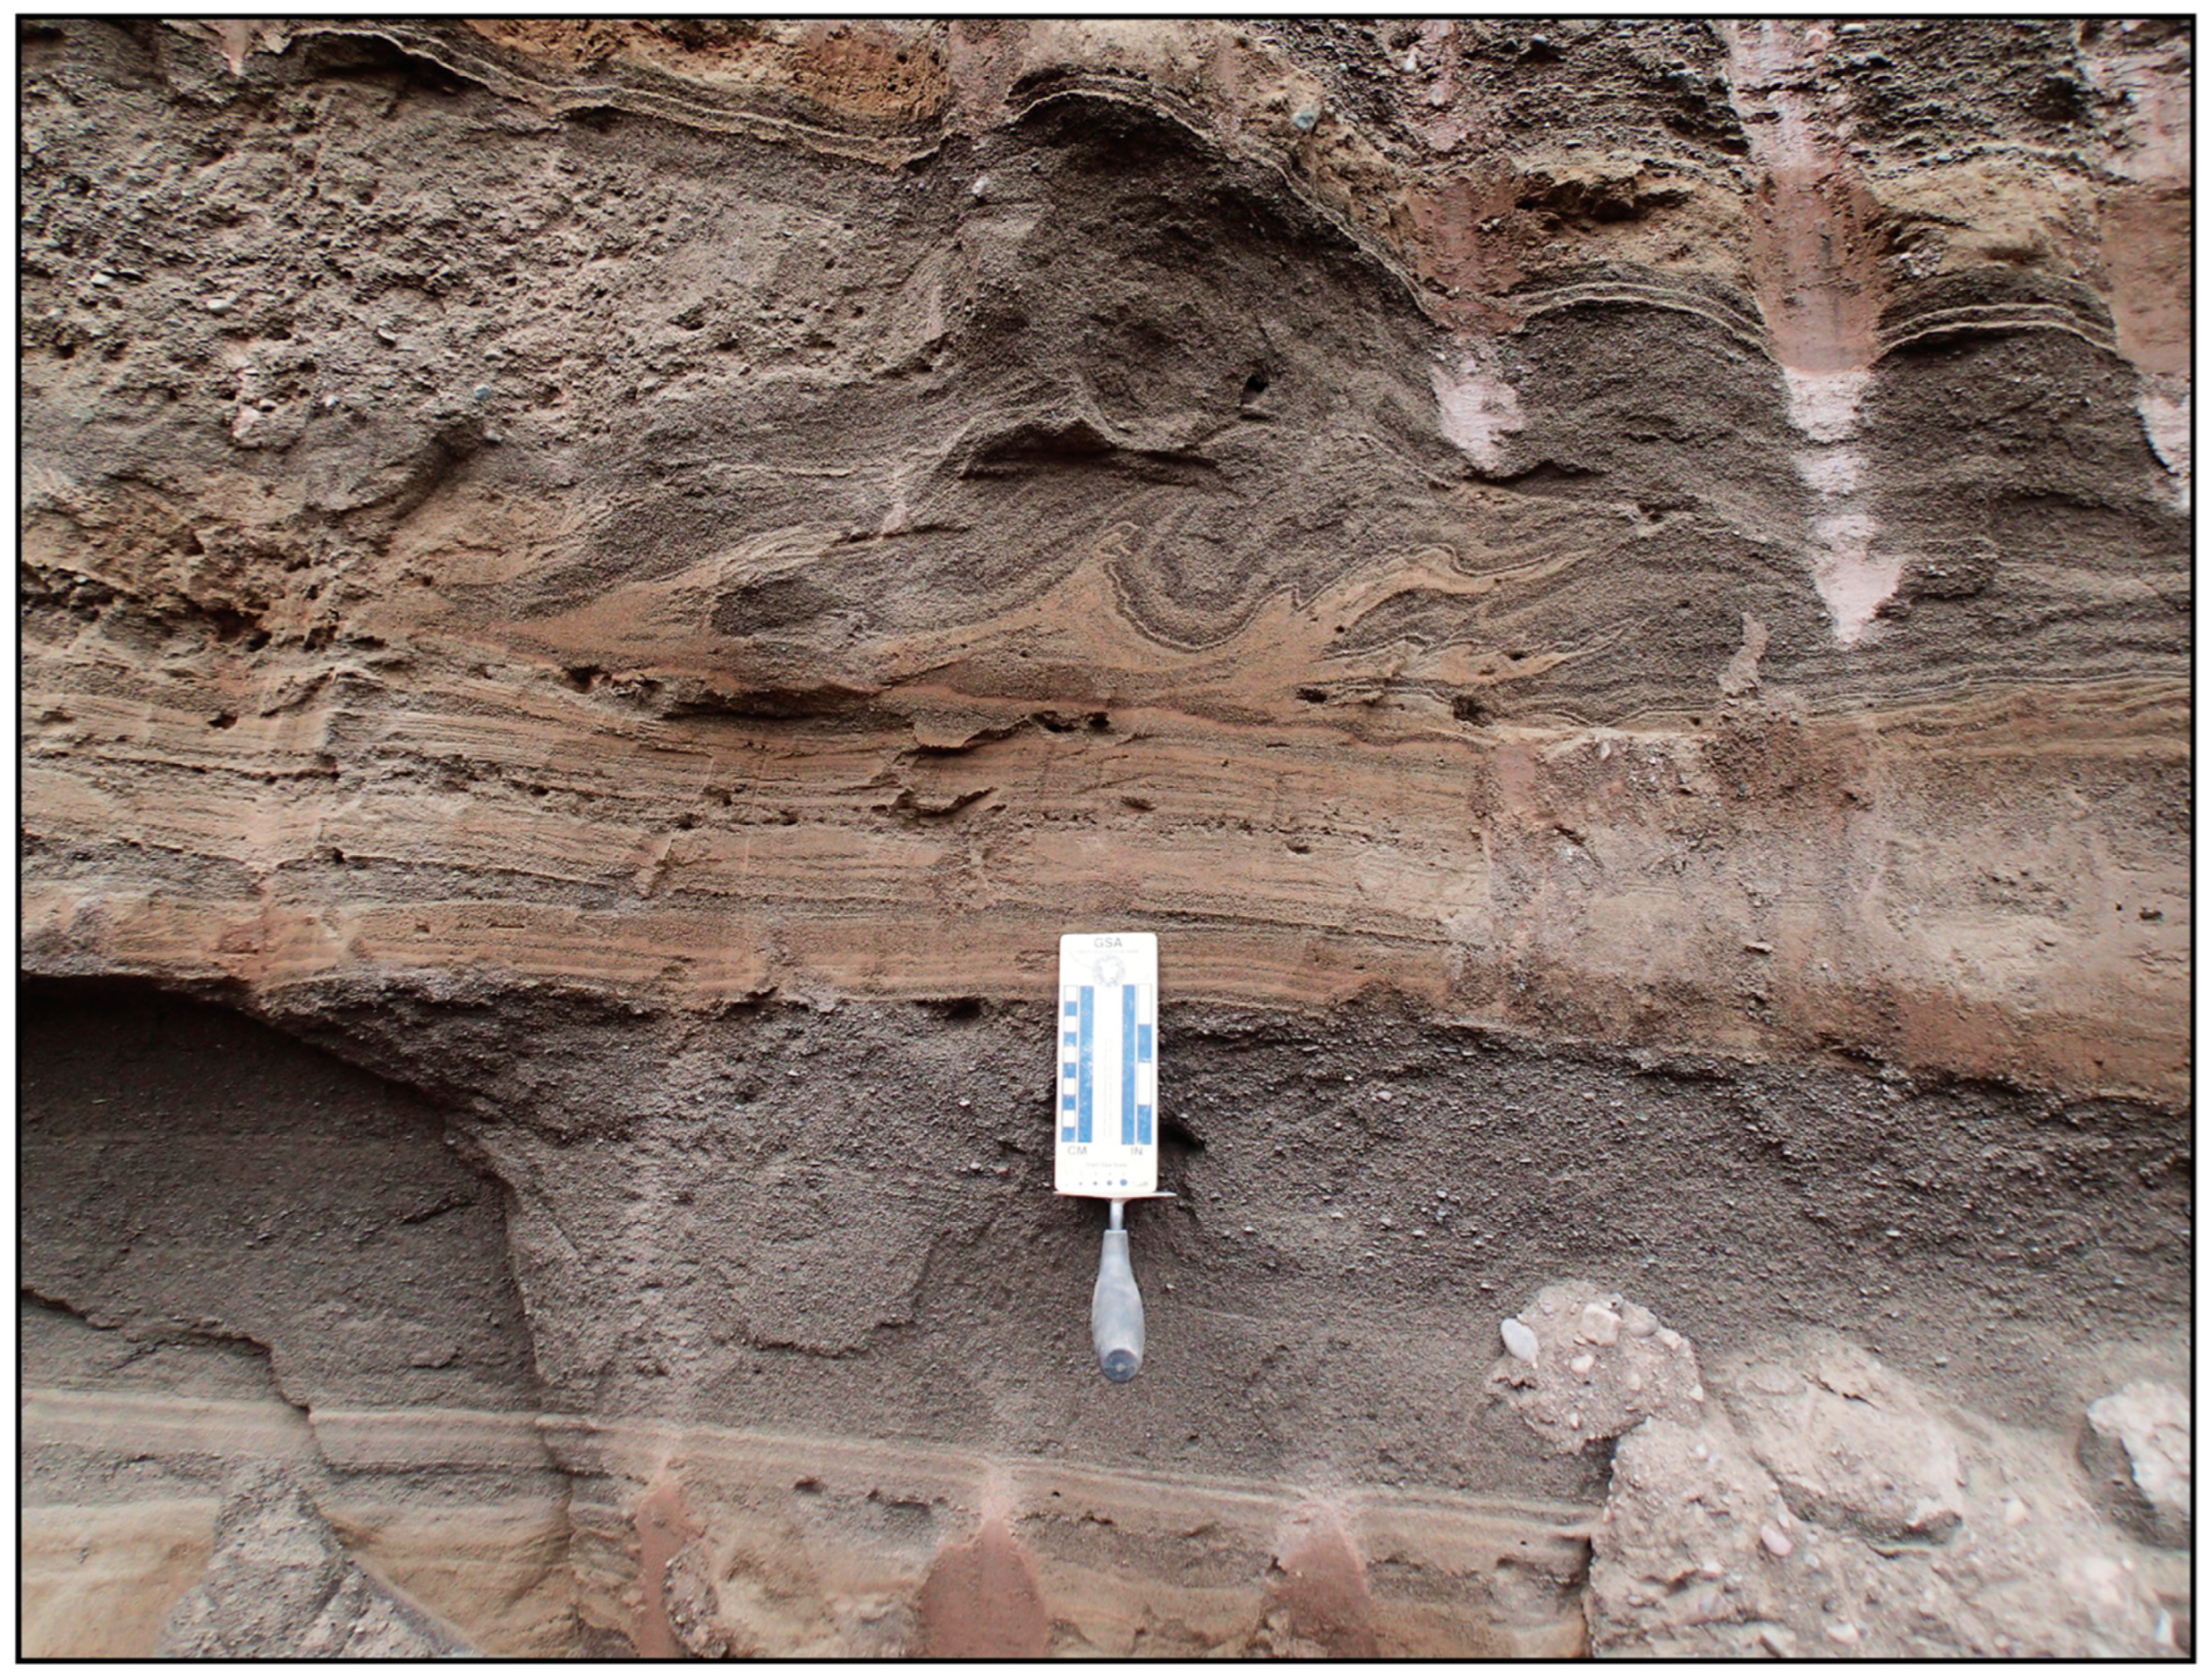
The lowermost exposed sediments (PK-Unit 3) are horizontally bedded, well-sorted rippled sand (Figure 6). Paleoflow measurements of selected well-developed ripples indicate currents that deposited sand moved from the northeast to southwest (see Supplementary Materials). Some sand units contain oversized gravel and cobble clasts that appear sporadically throughout Unit 3 and deform bedding (Figure 7). In other locations the horizonal bedding is eroded by channels 1 to 4 m wide that are infilled with normally graded cobbles, gravel, coarser sand, and silty matrix-supported diamicton. Exposures in the quarry allow observation of the longitudinal cross-section (parallel to flow) of channel fills that eroded into Unit 3. The channel-filling sediments taper in the up-flow direction and retain a plume-like geometry in several locations (Figure 8 and Figure 9). Horizontal bedding adjacent to scour and fill displays well-preserved soft sediment deformation structures such as flame structures (Figure 10). The geometry, grain size, and erosional context of the coarser channel fills cut into the lower sands are consistent with turbidity currents or underflows [84,85,86] and the soft sediment deformation is consistent with loading and shear associated with turbidite deposition [87].
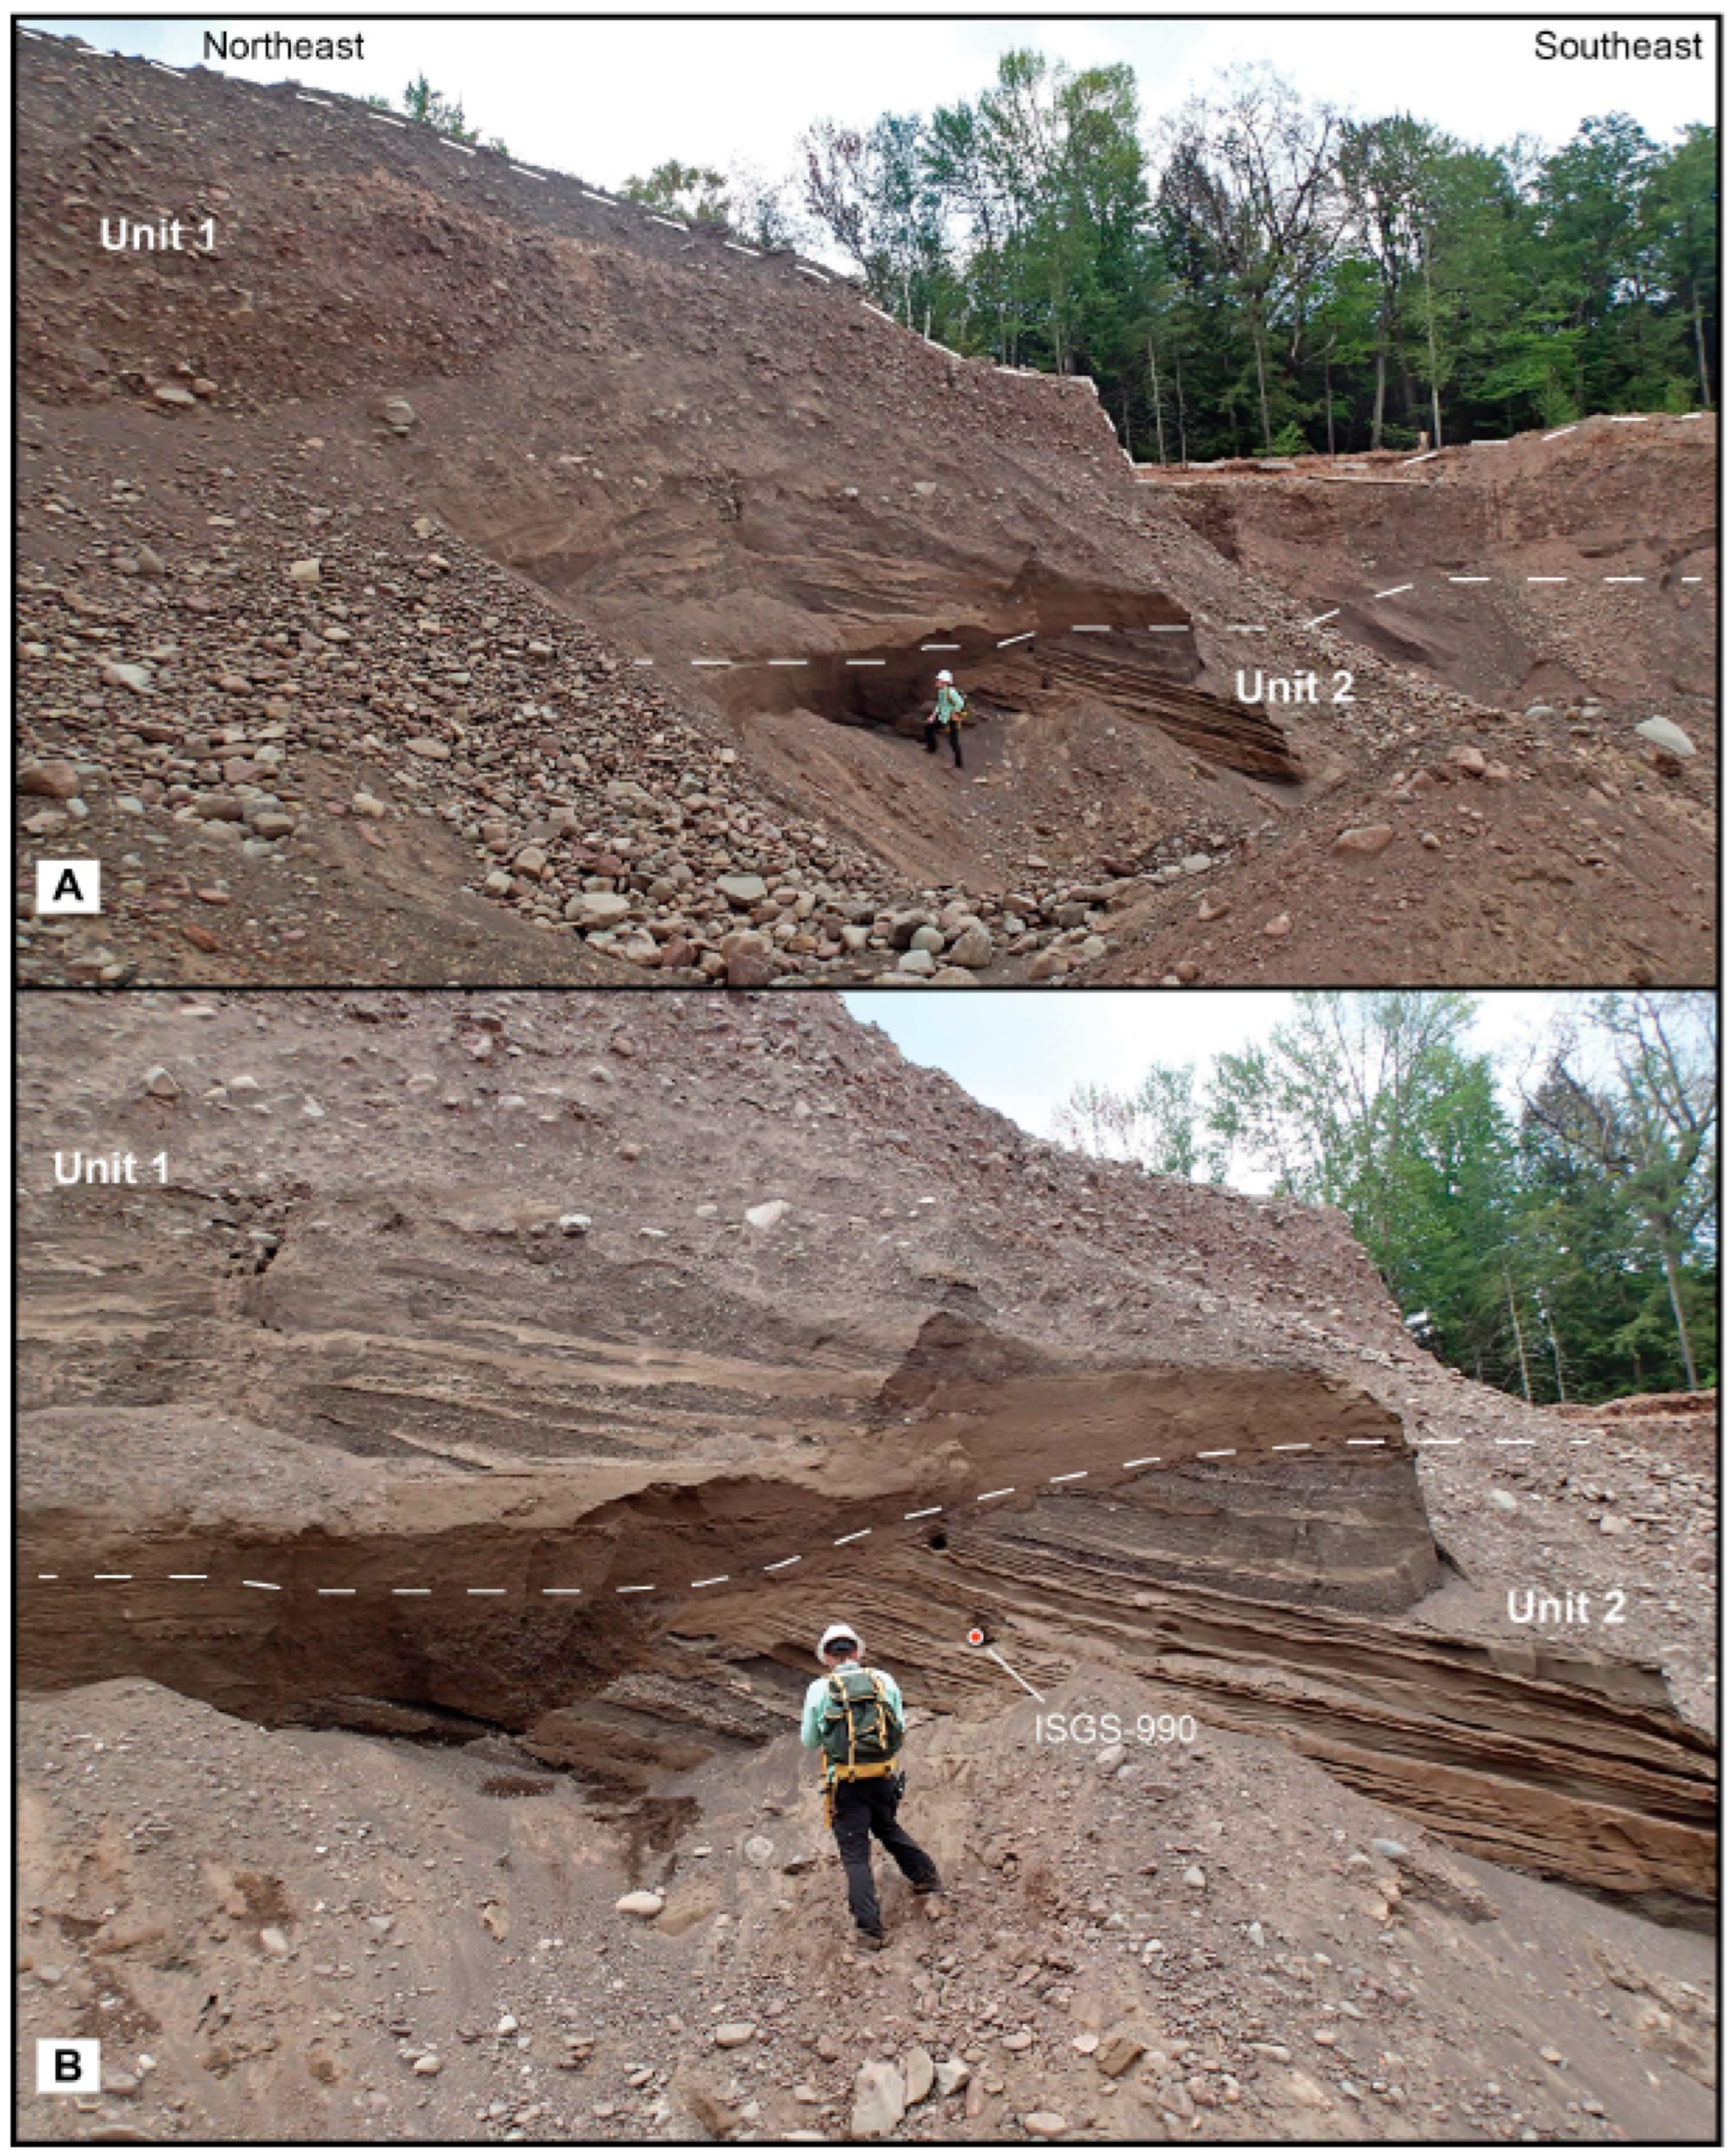
Above PK-Unit 3 is a well-developed stratigraphic interval of steeply dipping sand and gravel beds we designate as PK-Unit 2. Orientation of the dipping bed geometry varies, but generally beds dip south to southwest consistent with flow directions observed in ripples within Unit 3. Exposed beds in PK-Unit 2 range in thickness from 4 cm to more than 2 m. They tend to be sand-dominant and preserve sedimentary structures like tabular cross-bedding and ripples. Some individual beds display cross-laminated sets that seldom exceed 2–3 cm in thickness. Dip orientation of individual beds is consistent with the larger bed geometry and dip direction in PK-Unit 2. Sand units are typically well sorted. Individual beds tend to be continuous and lack disruptions such as faults. Some beds within PK-Unit 2 consist of clast-supported gravel–pebble wedges on the order of 1–2 m thick with individual, internal beds 10 cm in thickness (Figure 11, see Supplementary Materials). The top of Unit 2 occurs as a sharp erosional angular unconformity (contact) with the above Unit 1 (Figure 11). Additional photos of the PK-Unit 2 beds and related stratigraphy can be found in the Supplementary Materials.
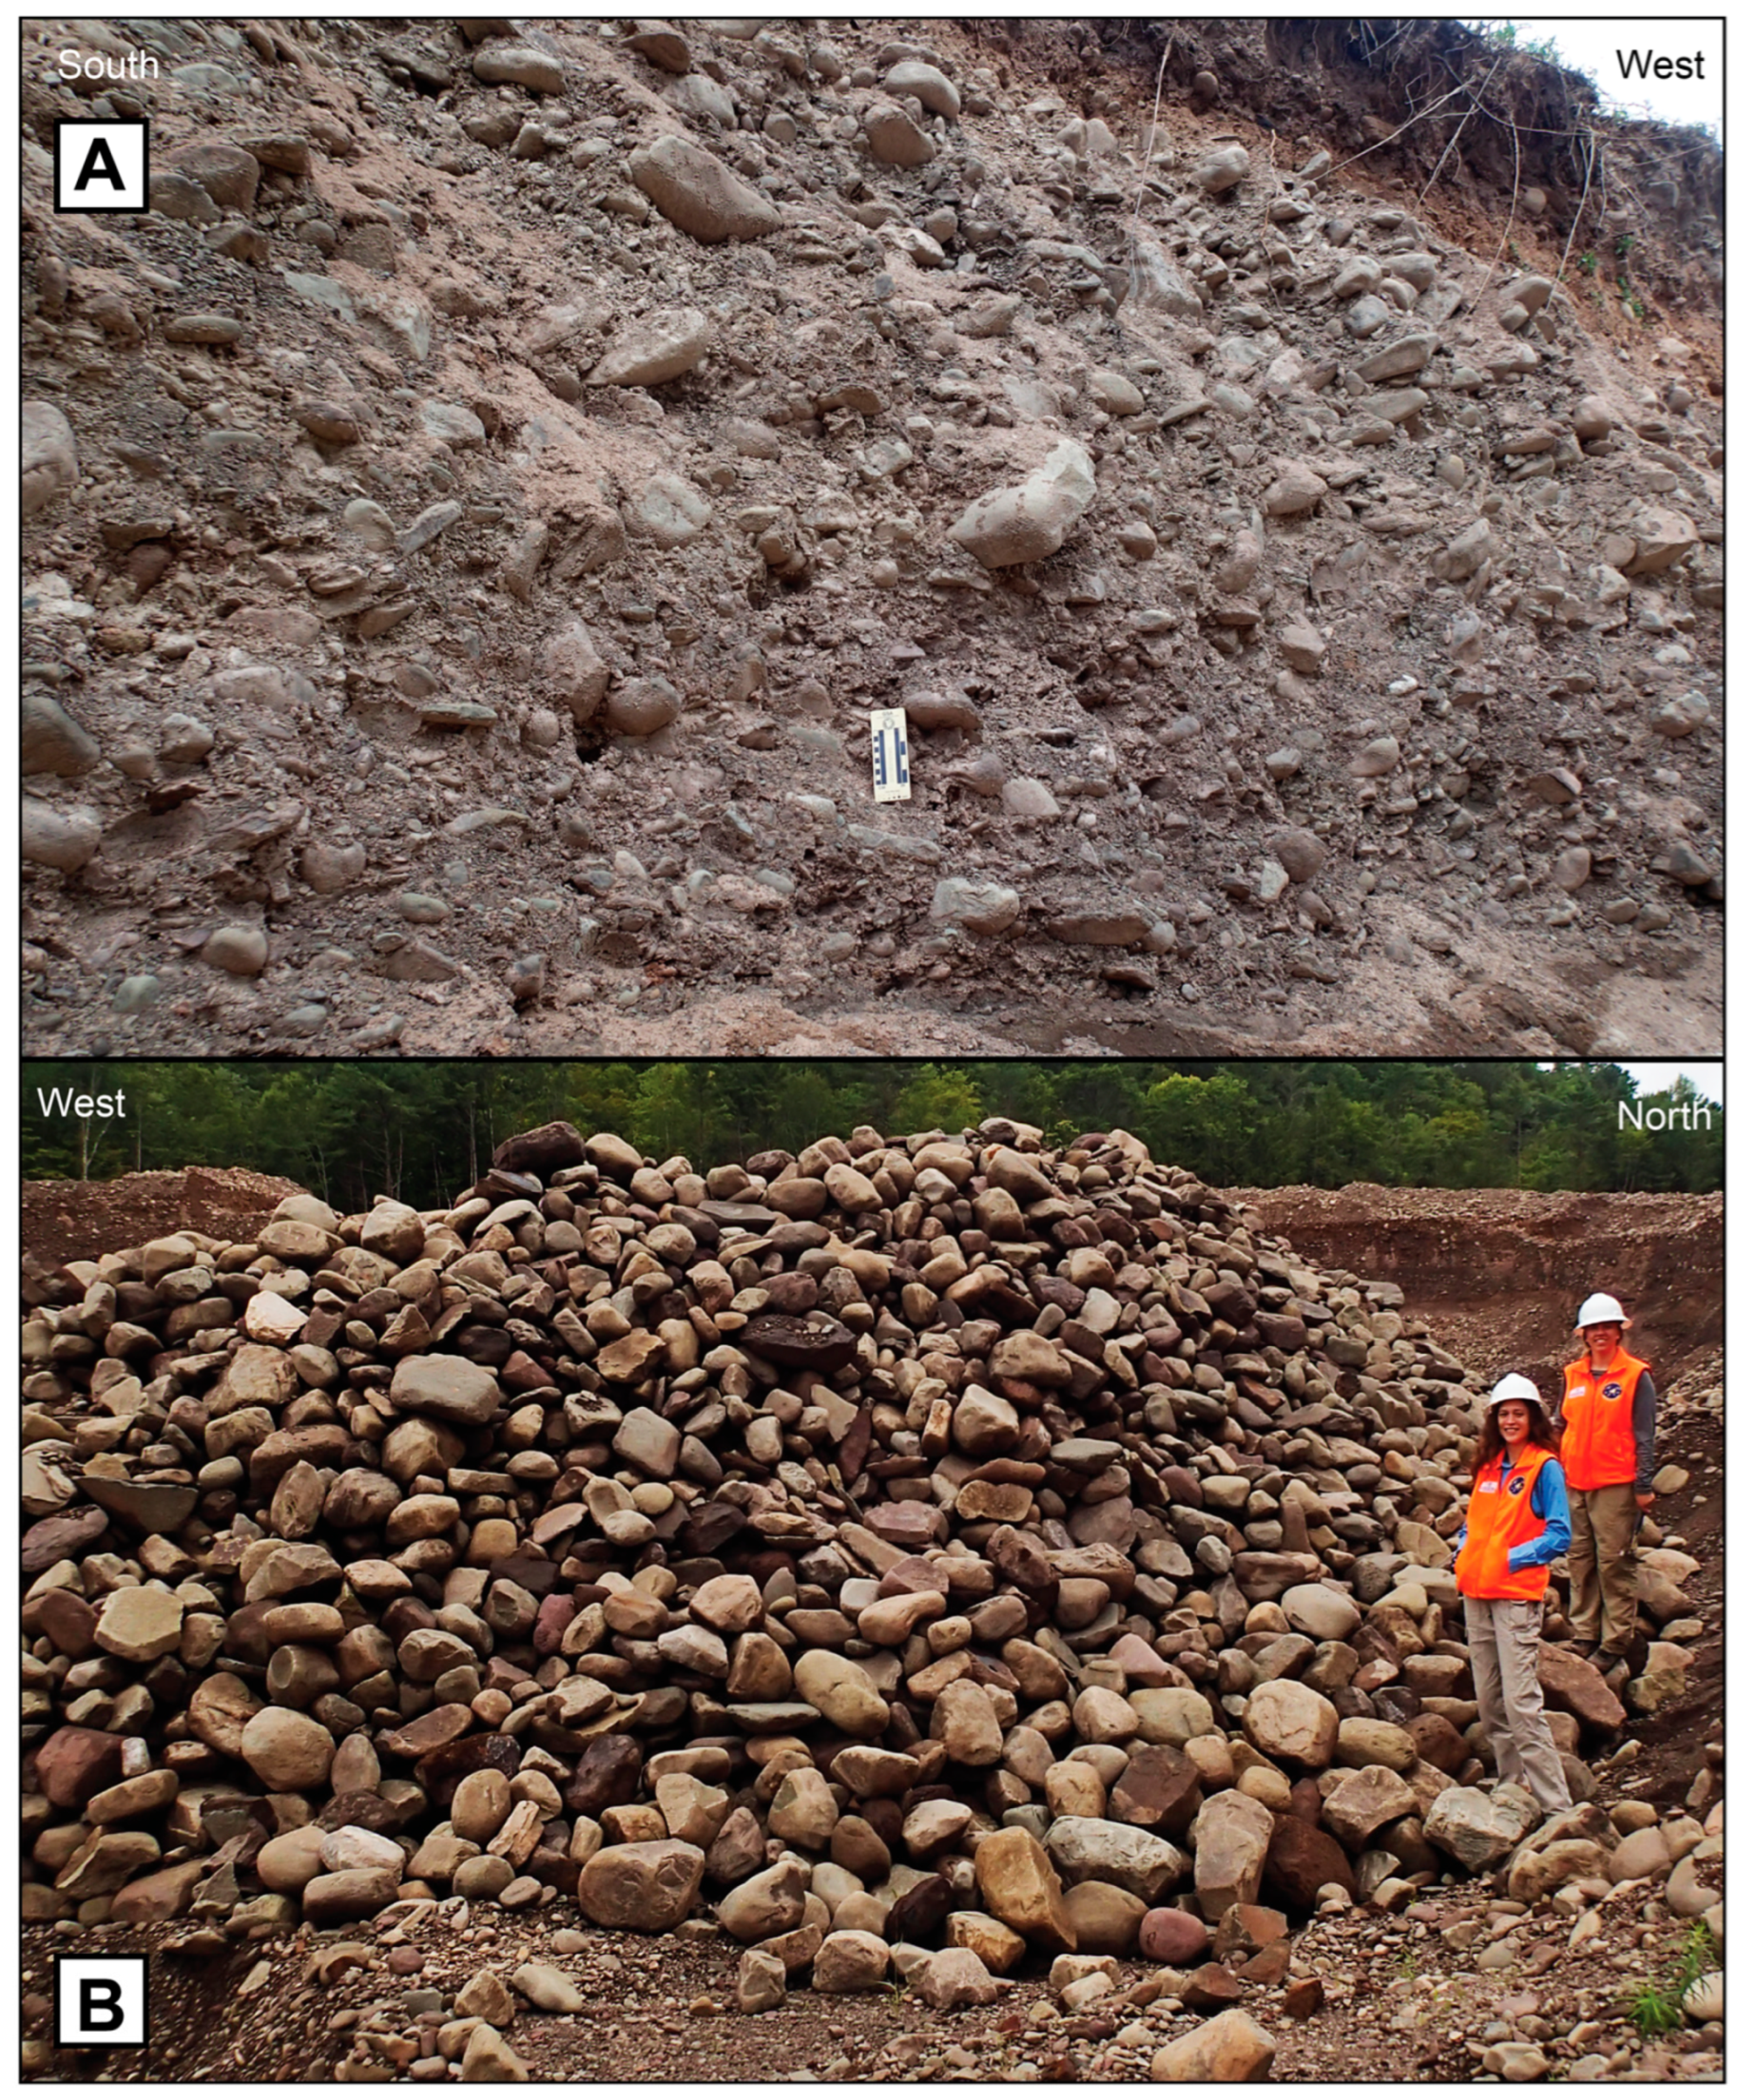
The uppermost stratigraphic unit (PK-Unit 1) exposed at the Platter Kill Sand and Gravel quarry consists of a poorly sorted, clast-supported cobble–boulder gravel facies. Examination of 150 cobbles and small boulders from Unit 1 yields that 91% of this deposit is local clastic sedimentary rock, primarily Devonian sandstone of the Oneonta Formation, while approximately 6% is carbonate rock and about 3% is exotic metamorphic and igneous lithologies (see Supplementary Materials). Clast shapes are subrounded to tabular and they display a well-developed imbrication indicating transport by meltwater flowing to the southwest (Figure 12). LiDAR terrain images (Figure 4) clearly display braided channels on top of the delta surface that forms Unit 1. The braided outwash surface comprising Unit 1 atop the Platter Kill Sand and Gravel quarry extends more than 800 m in width in some locations of the Platter Kill Valley and 600 m north of the quarry (Site 1). The observation of hummocky terrain and several large kettles suggests the glacier ice was sufficiently close to bury blocks of ice with Unit 1 deposits. The coarse gravel unit was deposited along a gradient of 12.5 m per km with an equivalent slope of 1.25%, which is considered a gentle slope for a braided river system [88].
The relationship between sediment supply and water flow influences channel morphology [89], and braided streams are common downstream of glaciers, particularly in mountainous terrain [90]. In glacier-fed meltwater streams, the abundance of coarse sediment armors channel bottoms and prevents channels from deepening and increasing flow efficiency and competence [91]. Hence channels migrate laterally, abandoning previous channels and initiating new ones, and creating bars and chutes for moving water and sediment. Maizels [92] documented increased aggradation and braided channel development in a valley train associated with glacial advance where the highest rates of aggradation occurred in the proximal zone to the glacier, and more recently, Kavan et al. [93] also recognized rapid delta growth related to glacier advance. The abundance of coarse gravel, cobbles, and small boulders (Figure 12) provides evidence for ample sediment and meltwater input indicating that the PK-Unit 1 deposits observed at the surface are braided outwash which grades into the delta at an elevation of 488 m, the stable lake level of glacial Lake Grand Gorge (see Figure 4). In summary, the stratigraphic succession of flat-lying sand and silt overlain by large-scale dipping sand and gravel beds and capped by imbricated gravels exposed in the Platter Kill Sand and Gravel quarry is consistent with a Gilbert-type delta with well-developed bottomsets (Unit 3), foresets (Unit 2), and topsets (Unit 1) [94,95,96,97,98].

Geochronology Results of Site 1—Platter Kill Sand and Gravel Quarry

Two samples were collected for OSL dating from the Platter Kill Sand and Gravel quarry and submitted to the Luminescence Geochronology Laboratory of the Illinois State Geological Survey for analysis. The first sample was collected in well-sorted and horizontally bedded rippled sands that comprise the bottomsets of PK-Unit 3 at a depth of 22 m below the top of the quarry surface (delta top) (Figure 6). This sample (ISGS-991) yielded an age of 26 ± 3 ka. The second sample (ISGS-990) was collected within well-sorted sand layers in the foreset beds of PK-Unit 2 (Figure 12), 12 m below the delta top. This sample yielded an age of 19 ± 2 ka. For additional information on OSL samples see Table 1 and Table 2.

3.2. Site 2—Broome Center Delta

Approximately 8.5 km northeast of Site 1, to the north of Leonard Mountain, a series of constructional glacial landforms can be observed (Figure 3). While much of the terrain in this area is hummocky and is typified by eskers, moraines, and knob and kettle topography [76], a portion of the landscape near Black Brook is distinctive as a flat-topped landform with a surface elevation of 592 m (Figure 13). This landform was identified by Rich [35] and interpreted as a high-elevation delta once deposited into an ice-dammed body of water that he designated glacial Lake Broome Center. Postglacial erosion by Black Brook incised through a central section of the northern delta surface and exposed beds of well-sorted sand, dipping 20 degrees to the west, interpreted to be foresets deposited into this glacial lake. Although a separate basin (a different lake) than the much larger glacial Lake Grand Gorge, this delta represents a stabilized phase of the Schoharie Sublobe ice margin during which glacial ice blocked drainage in the Keyser Kill (Figure 2 and Figure 3). LiDAR terrain models display several channels that served as spillways for meltwater that exited from glacial Lake Broome Center and drained southwestward into the Platter Kill.

Geochronology Results of Site 2—Broome Center Delta

Field mapping along Black Brook revealed an exposed stream cut 3 m high and approximately 2 m wide. The outcrop is 6.1 m below the surface of the delta and exposes well-sorted medium sand. Angled bedding observed in outcrop is consistent with foreset beds deposited when sands prograded into the glacial Lake Broome Center basin. An OSL sample (ISGS-887) was collected from the sands and yielded an age of 21 ± 2 ka. For additional information on this OSL sample see Table 1.

3.3. Site 3: Champlin Road Exposure—Manor Kill

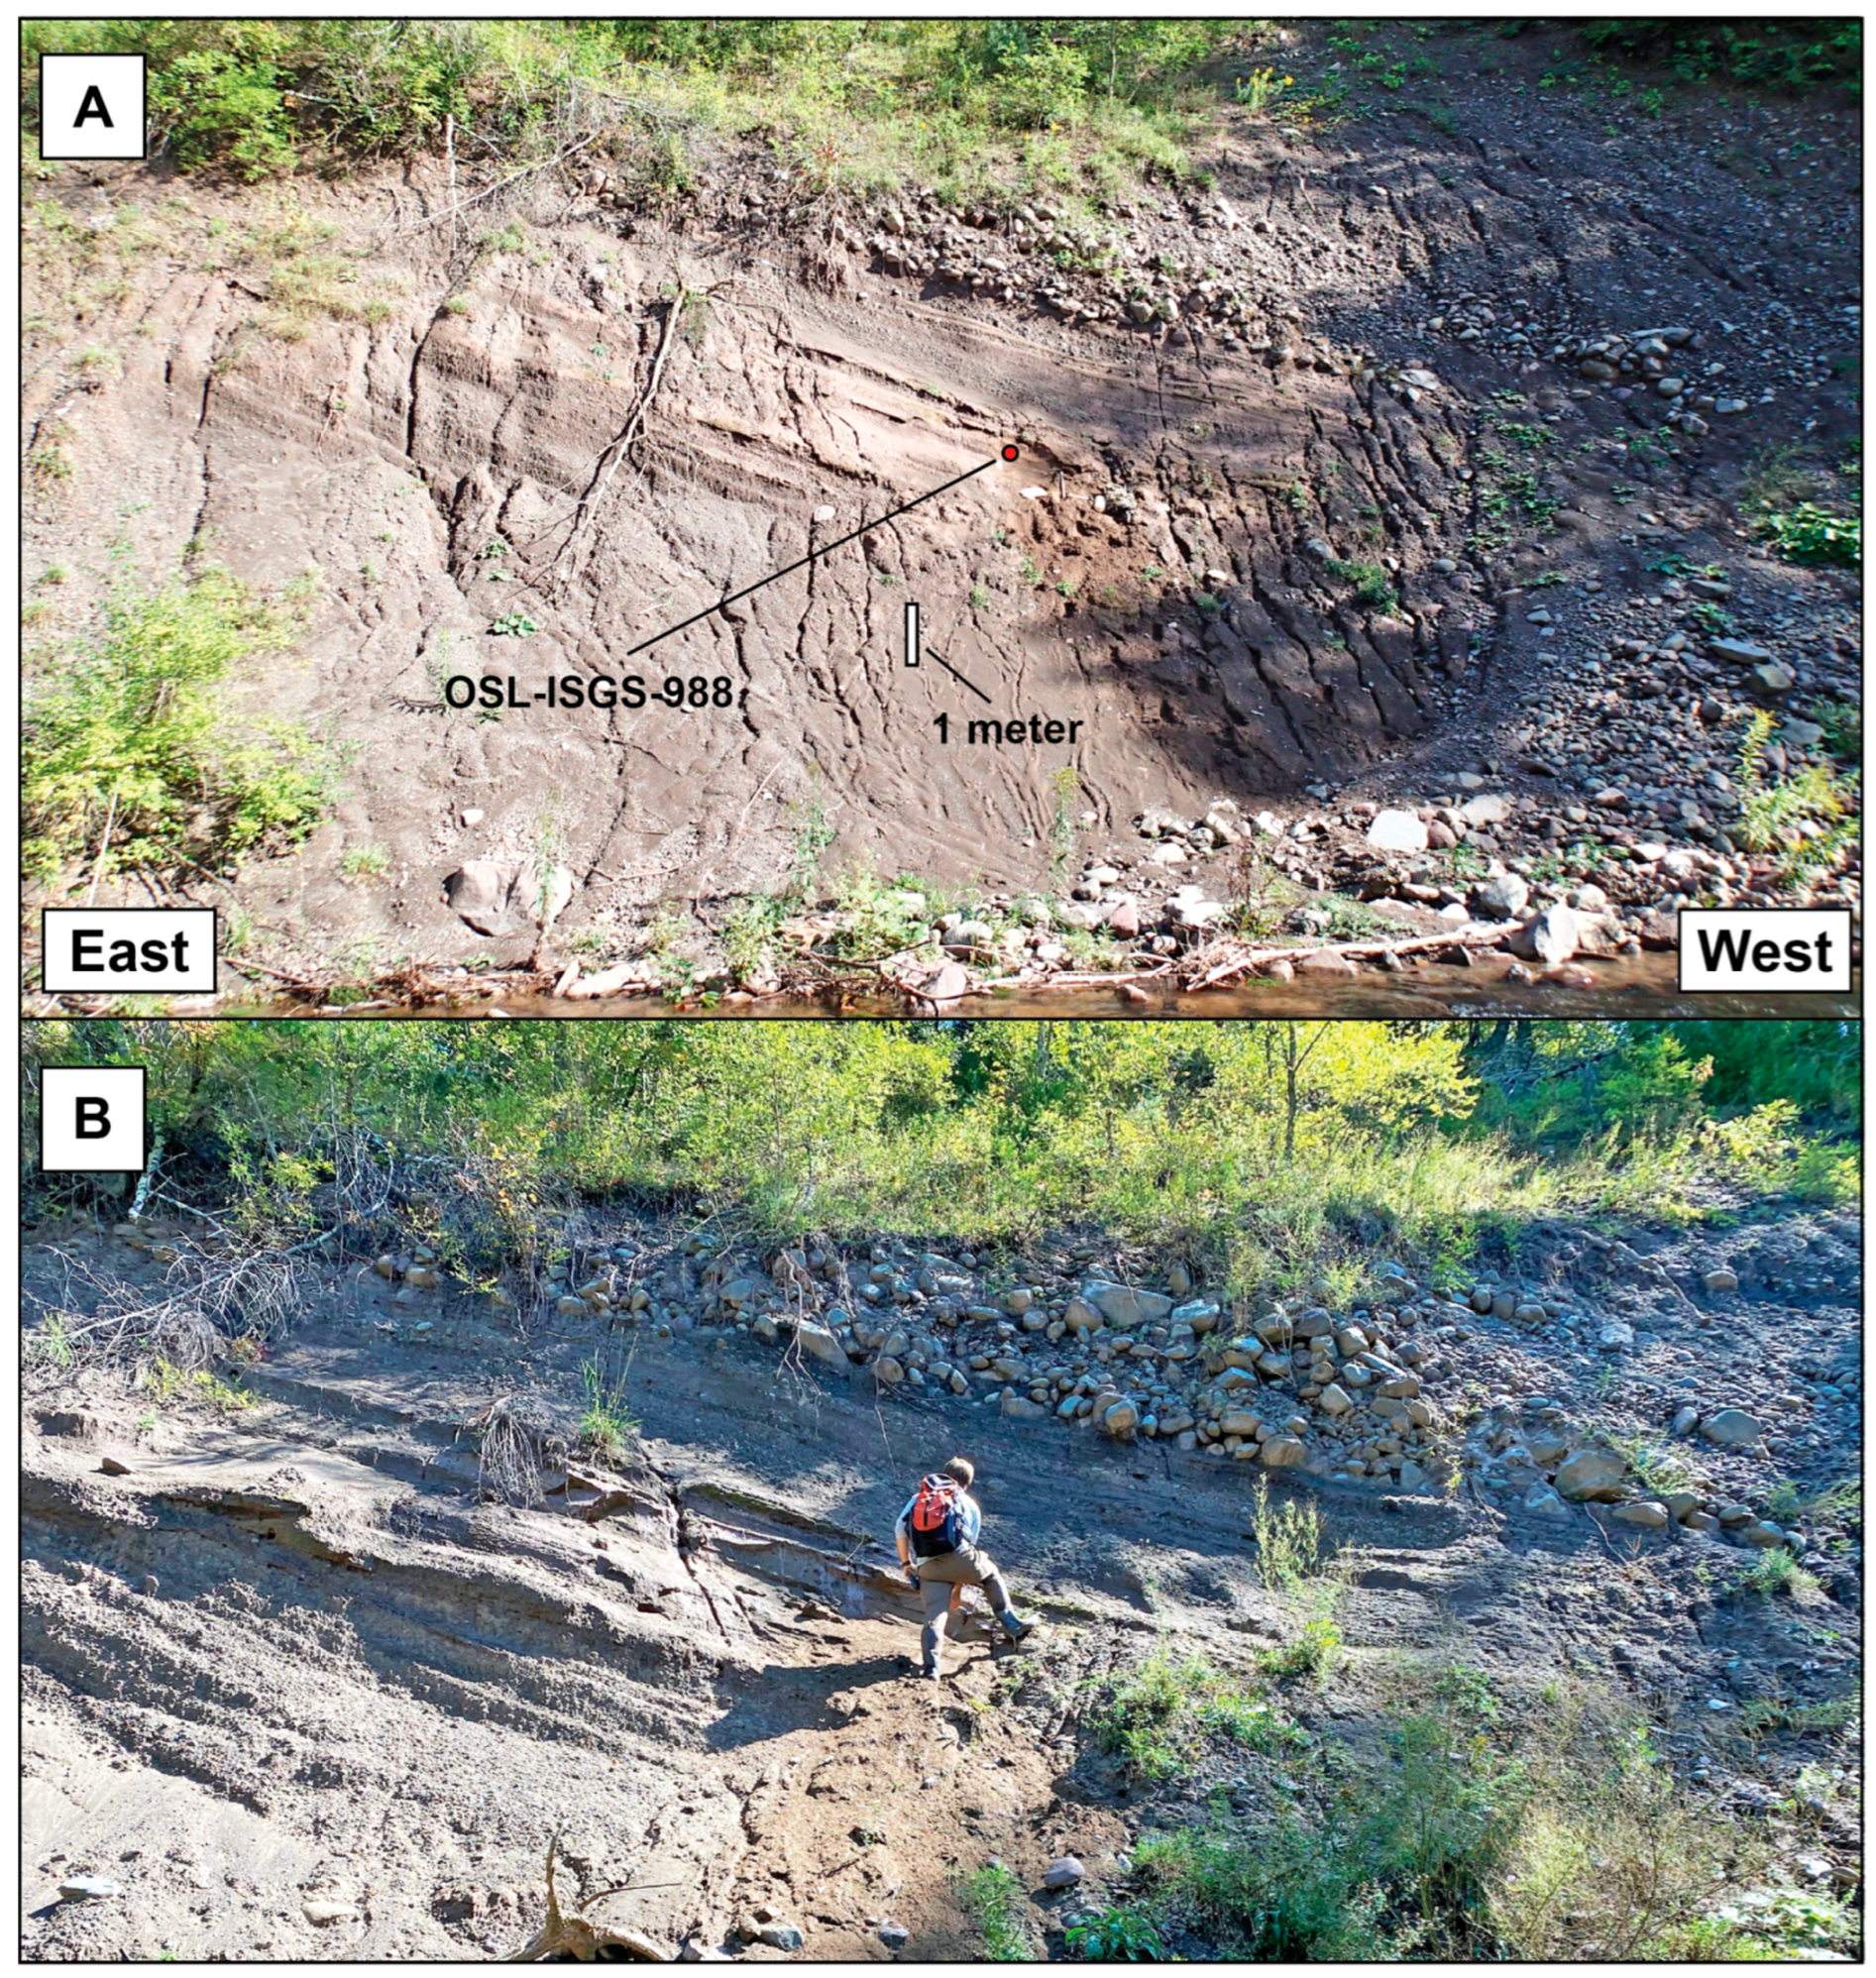
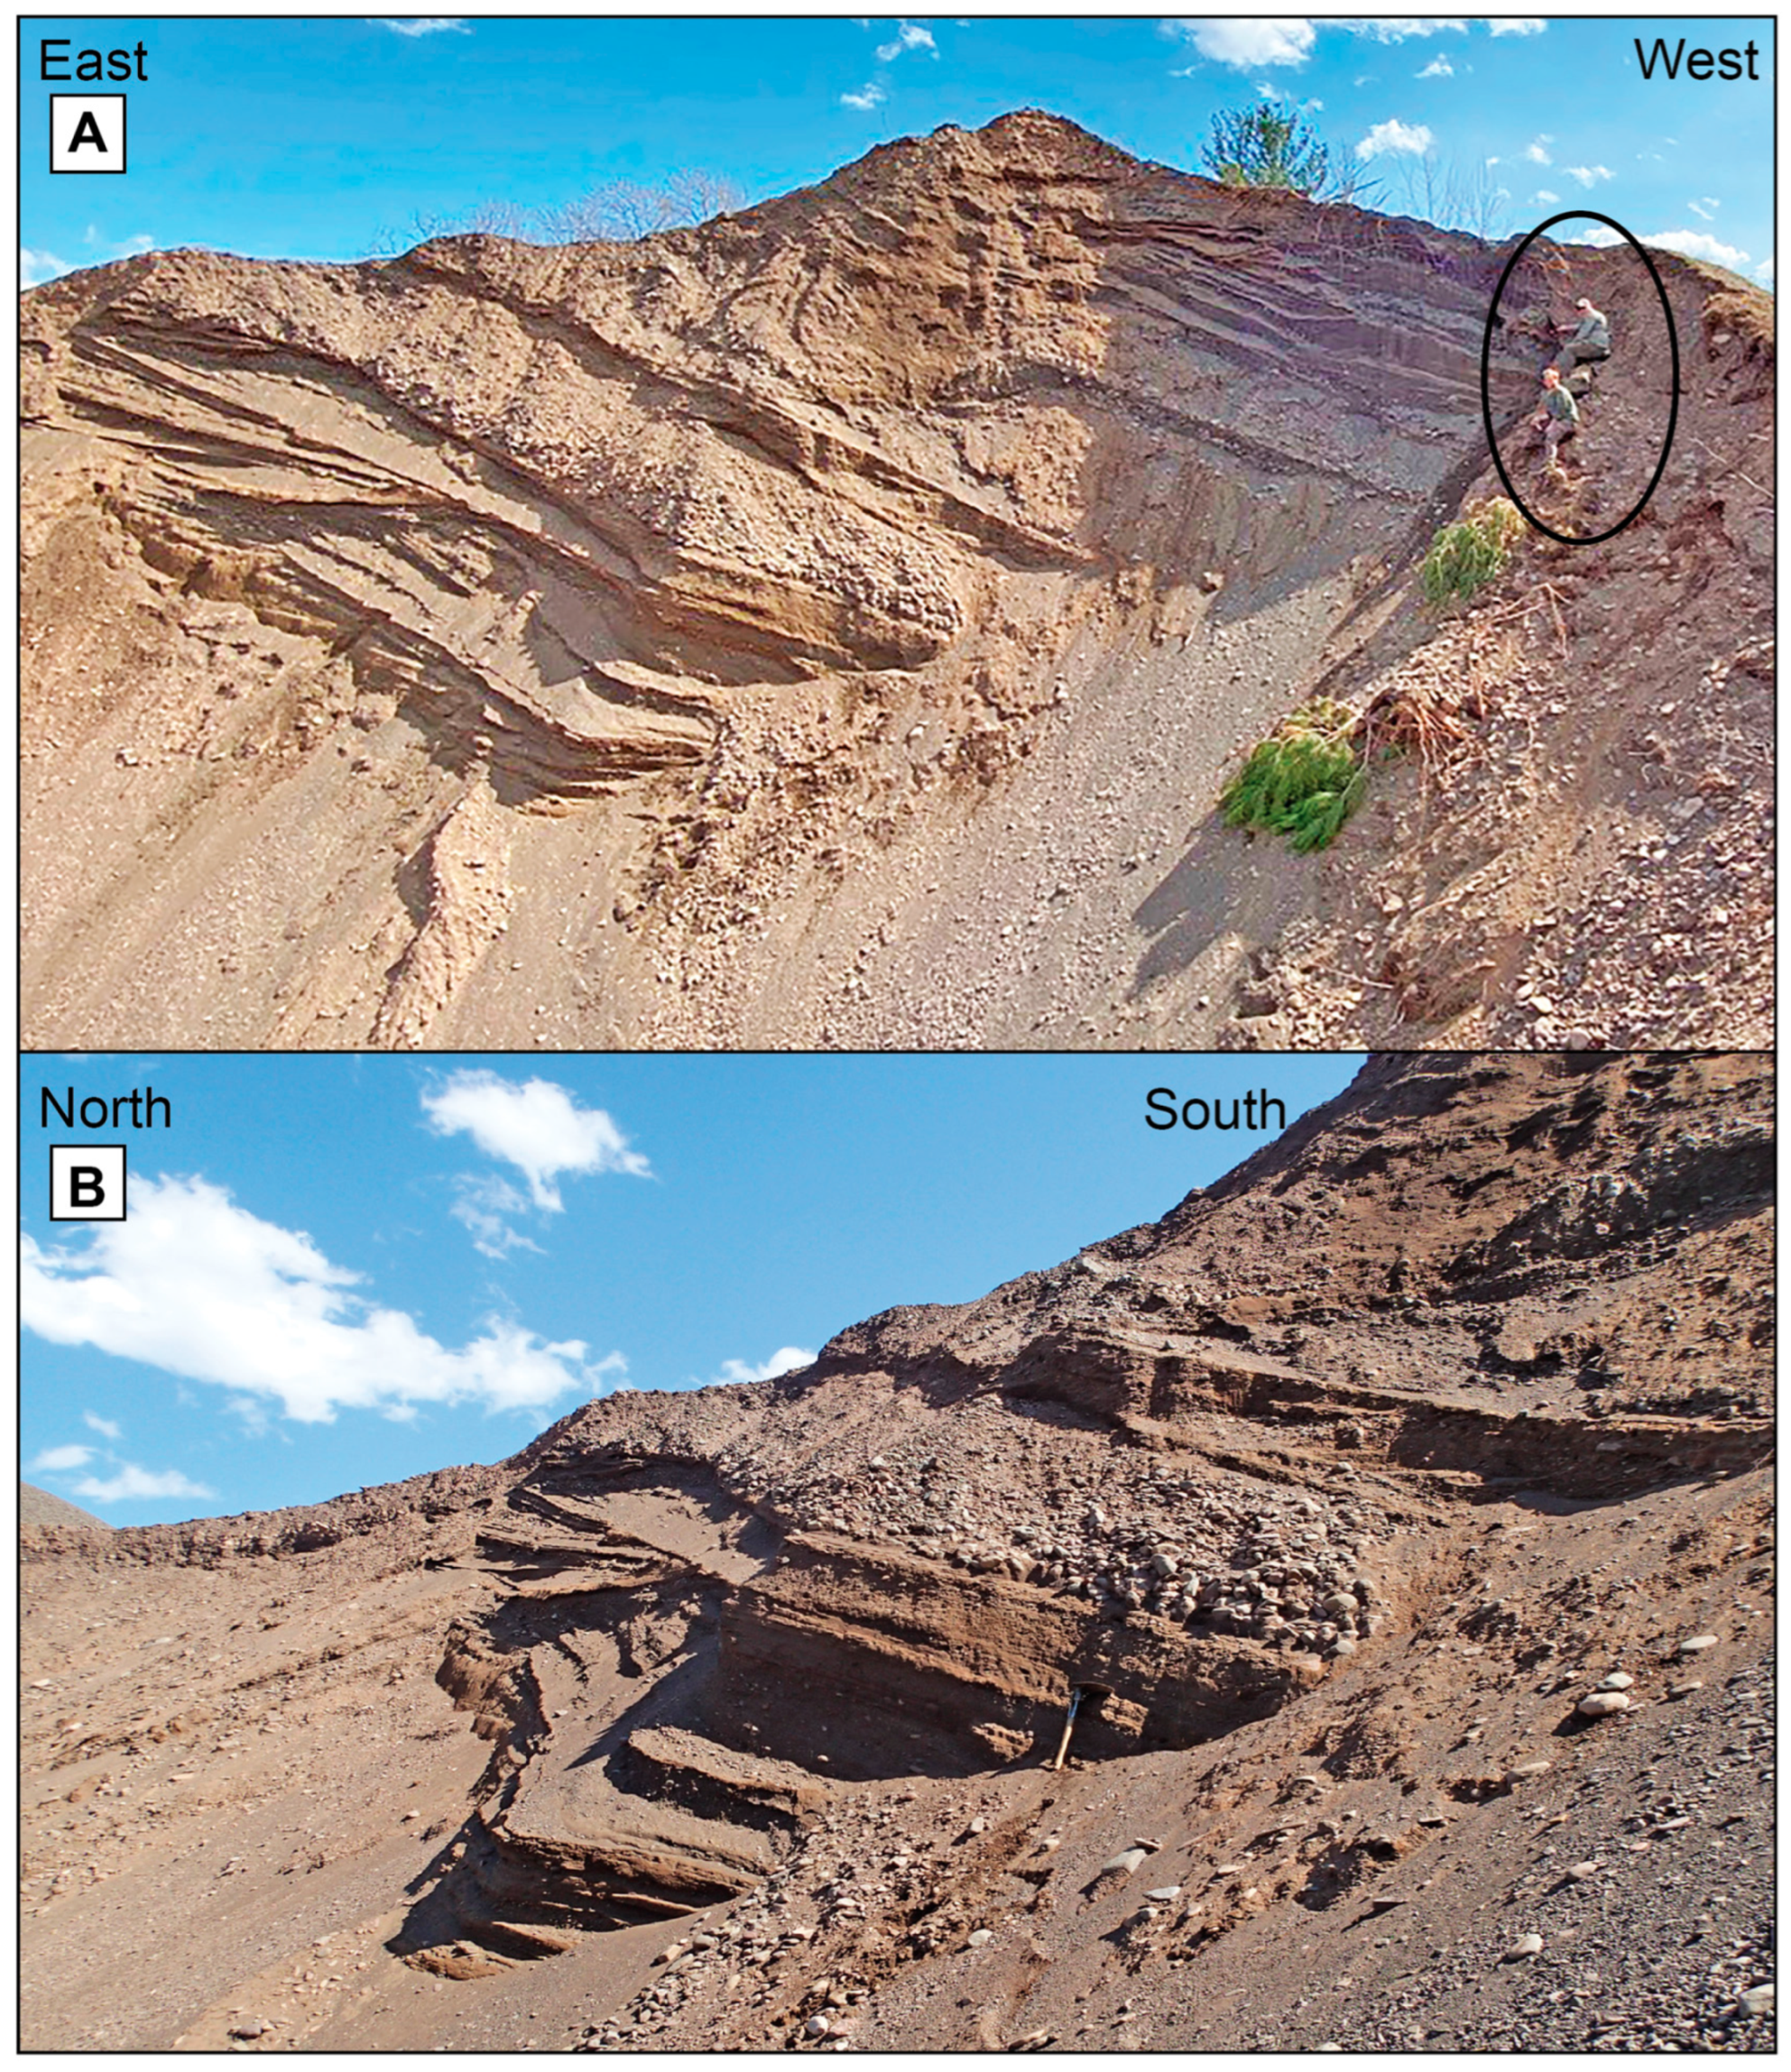
Approximately 5 km south of Site 1, near Conesville, NY, another large stream-cut exposure along the Manor Kill was discovered while mapping glacial deposits near Champlin Road (CR). The exposure is approximately 18 m in height and exhibits well-stratified layers of sediment in two distinct units. The lower half of the outcrop is composed of westward-dipping bedded sand (CR-Unit 2). The top of Unit 2 terminates at a sharp contact to a west-dipping cobble–boulder gravel unit (CR-Unit 1) approximately 10 m above stream level (Figure 14). The younger cobble–boulder unit appears to be more than 3 m in thickness and consists of rounded to sub-angular clasts ranging from 20 cm to more than 1 m in diameter. There is internal stratification and normal grading within beds and across the entire Unit 1. The interstices between clasts are devoid of fine-grained sediments and zones appear as clast-supported open-framework pebbles, cobbles, and boulders. The uppermost units exposed at Site 3 were too steep to investigate safely and were also highly vegetated. The exposure occurs at a meander in the Manor Kill on the south side of the stream, which has eroded a remnant ridge extending north toward the center of the valley with a different appearance from the deltas previously described. Half a kilometer to the east of this exposure is another, larger constructional landform that fully blocks the valley (Figure 15) which was described by Rich [35] as a subaqueous moraine. In addition, the inclined bedding observed at Site 3, characterized by bedded sand units and an abrupt contact with coarser open-framework gravel, is consistent with descriptions of grounding line fans [99,100,101].

Geochronology Results of Site 3—Champlin Road Exposure—Manor Kill

An OSL sample (ISGS-988) of well-sorted fine–medium sand (CR-Unit 2) was collected 2.5 m below the Unit 1 boulder–gravel contact at Site 3 (Figure 14), approximately 12 m below the top of the exposure and upper land surface. The results of the OSL analysis yielded an age of 29 ± 2 ka.

3.4. Site 4: Manor Kill Basin

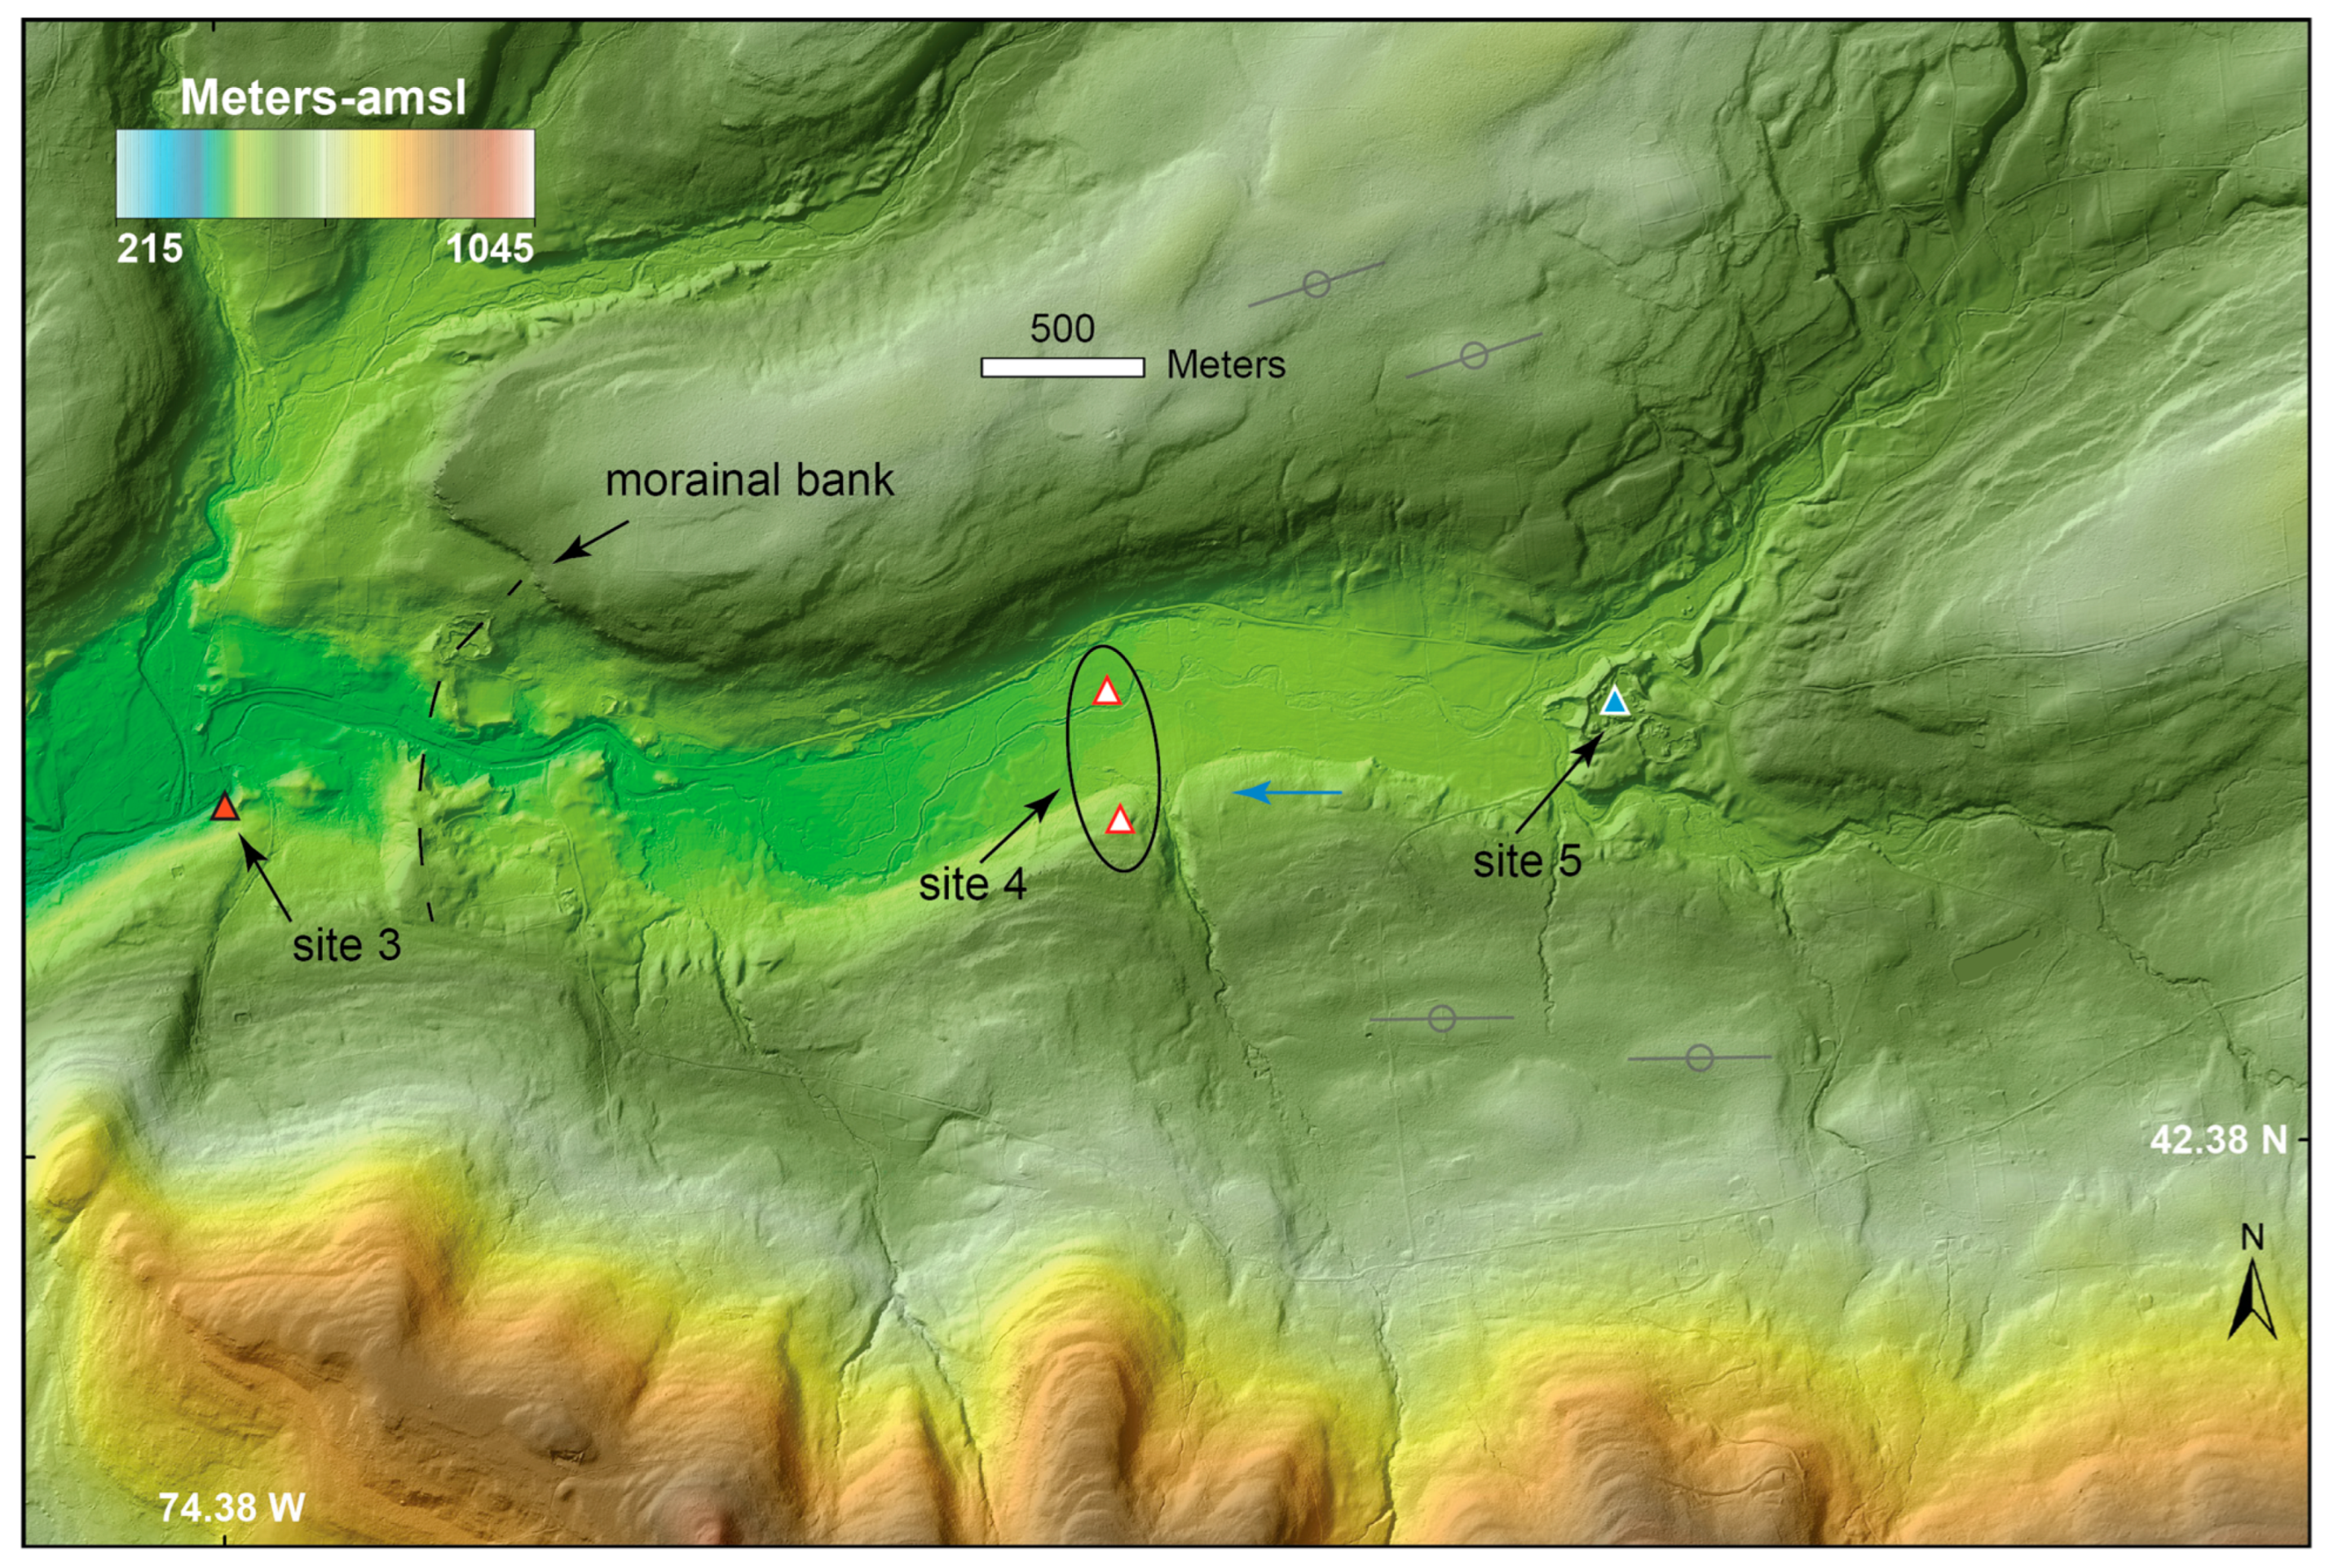
The fourth site investigated as part of this study is located approximately 2.7 km to the east of Site 3 and consists of two sample locations within the Manor Kill Valley. The first sample location is along the flat valley bottom that was occupied by a tongue of glacial ice [35,36,37] and that later became an embayment of glacial Lake Grand Gorge. This site will hereafter be called the “Manor Kill Basin” (MB). The second sampling location is a nearby exposure within an inactive gravel pit on the south valley wall, about 35 m higher in elevation than the valley bottom.
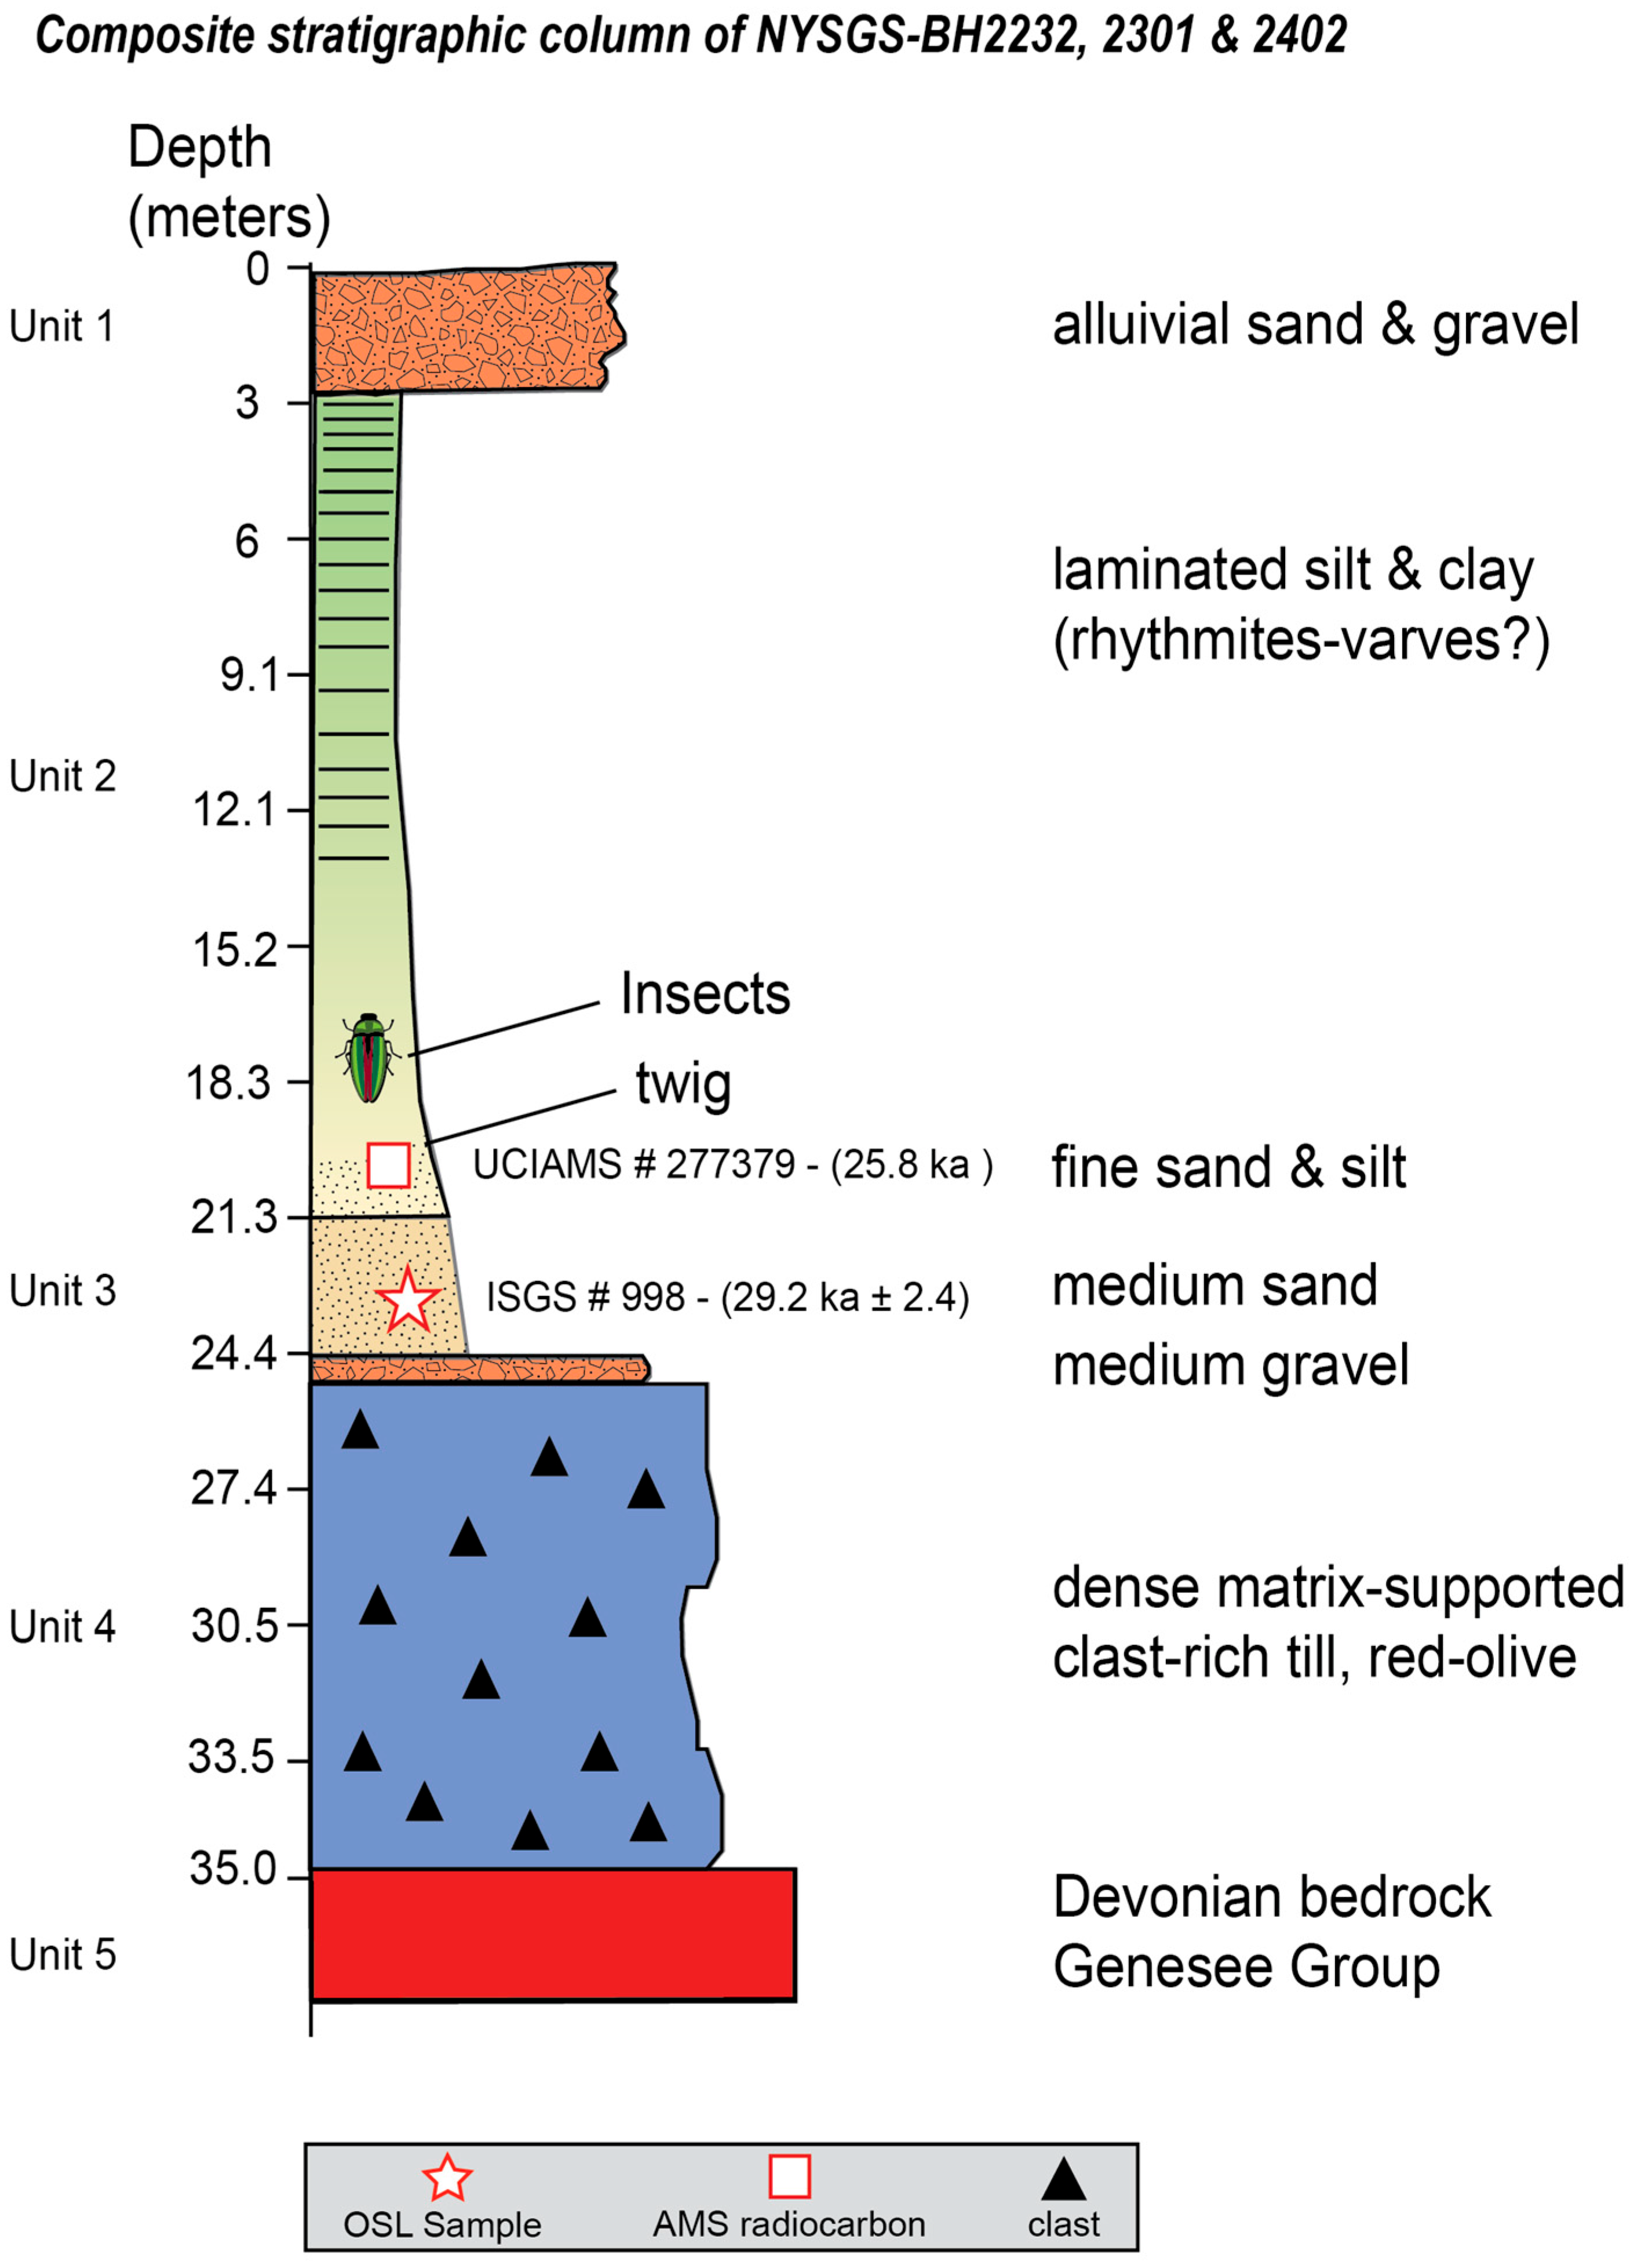
As part of a geological mapping investigation, a series of exploration cores were collected in the mid-center of the Manor Kill Basin to investigate the thickness and composition of valley fill sediments. Multiple continuous subsurface cores were collected utilizing direct push methods, sonic drilling, and wireline soil coring. Coring with sonic and wireline techniques extended from the surface until reaching the bedrock at a depth of 35 m, while direct push methods were employed until refusal. The stratigraphic sequence of the valley fill deposits generalized from the three boreholes is presented in Figure 16 and consists of five stratigraphic intervals. The bedrock interval (MB-Unit 5) at the base of the sequence consists of a green-gray Devonian sandstone of the Genesee Group. It is important to note, however, that red sandstones also occur in the Genesse Group and have been observed 3 km to the east of Site 4. Directly overlying the bedrock is 7.6 m of dense, indurated, red-to-olive-colored matrix-supported sandy diamicton (MB-Unit 4; Figure 16 and Figure S10).
Unit 4 contains faceted and striated clasts and thin, elongated rock fragments of Devonian plant fossils that may be related to the fossil-bearing bedrock strata of the Gilboa Fossil Forest [102,103]. Clasts within the diamicton unit are equal in volume to the matrix. Three separate samples of the diamicton collected in rotosonic drill core from intervals between 23.9 and 25.9 m were analyzed for clast lithology with a total count of 300 clasts greater than 2 mm in diameter. The clasts within this diamicton unit are exclusively red sandstone derived locally from the Genesee Group. This diamicton is consistent with observations of glacial till elsewhere in the Catskill Mountains and probably represents lodgement till deposited by the ice that constructed moraines and grounding line landforms to the west [35]. The composition of the till (Figure S10) has similarities to the Olean Till described by Moss and Ritter [54]. However, numerous interpretations and conflicting drift terminology prohibit any such correlation (see Supplementary Materials for an expanded discussion).
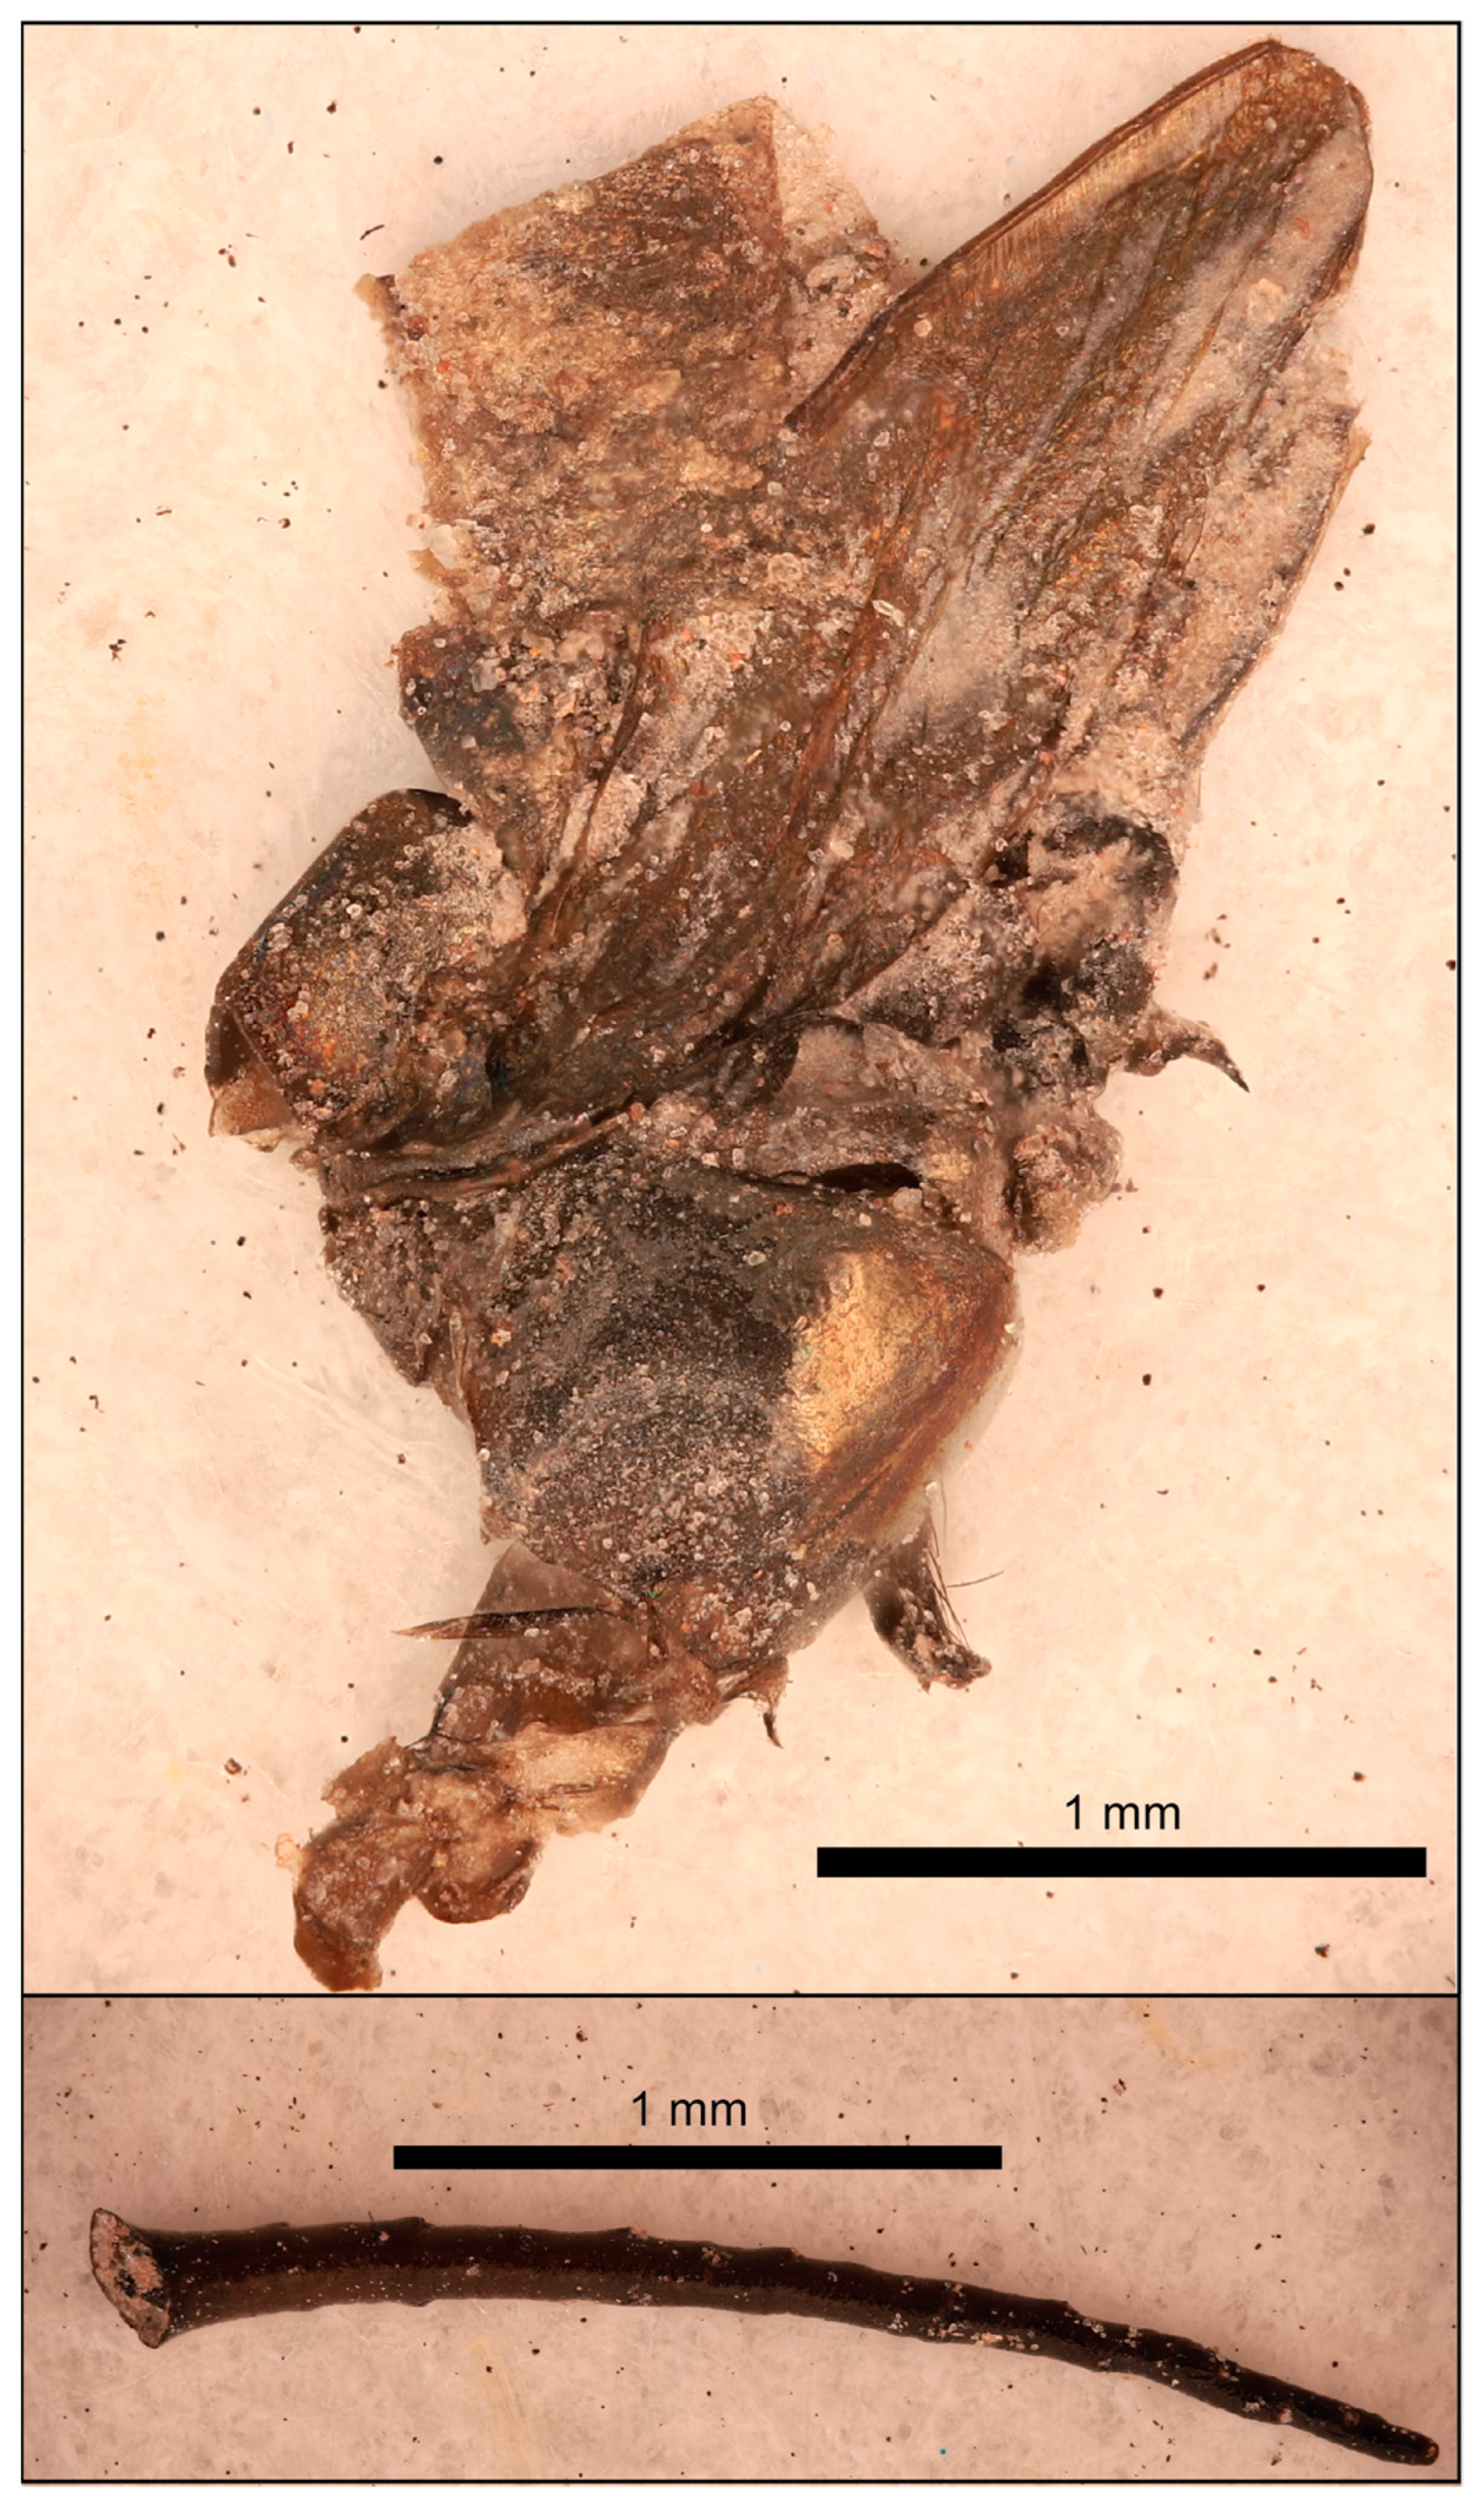
Atop the diamicton of MB-Unit 4, MB-Unit 3 is a 3 m thick unit of bedded, normally graded sand and rounded gravel (Figure 16). Gravel at the base ranges in size from granules to cobbles, and the unit grades upwards into a well-sorted medium sand that was sampled for OSL analysis. MB-Unit 2 was deposited above the uppermost sands of Unit 3, forming a package that is more than 18 m in thickness and grades from fine sand and silt at the base into a thick section of laminated silt and clay rhythmites. The contact between MB-Unit 2 and MB-Unit 3 is gradational. The rhythmites in MB-Unit 2 may, in fact, be annual/seasonal deposition cycles (varves), but proving the precise mechanism of deposition of these rhythmites was beyond the scope of this project. A small twig and insects were recovered from the fine sand and silt between 17 and 20 m depth at the base of Unit 2 (Figure 17). The uppermost stratigraphic unit observed in the Manor Kill Basin (MB-Unit 1) consists of 3 m of bedded and poorly sorted sand, silt, and rounded gravel and is identical to present-day alluvial sediments observed in the Manor Kill.
Approximately 475 m south of the drill sites in the valley center, and 35 m above the valley floor, is a small inactive gravel pit excavated into hummocky deposits along the southern valley wall (Figure 15). The pit is relatively small in size and consists of a single arcuate highwall that is 15 m tall. Along the northern edge of a quarry wall adjacent to a ravine, slumped sediments were cleared to reveal the internal stratigraphy. Although the sediments are stratified, the beds are undulating and not as well sorted as other exposures visited in the field area. Some layers contain well-sorted sand but other layers are clast-supported gravel with a loose silty matrix. Clast sizes range from granules to pebbles with sporadic large cobble in some of the bedded layers. Clasts are mostly sub-angular to rounded in shape and consist almost entirely of red sandstones which are inferred to represent the local bedrock of the Devonian Genessee Group.

Geochronology Results of Site 4—Manor Kill Basin

An OSL sample (ISGS-998) of fine–medium well-sorted sand from a depth of 23.7 m was collected immediately after the drill core was retrieved at Site 4 in the Manor Kill Basin (Figure 15). The sample yielded an age of 29 ± 2 ka. Additional geochronologic data were obtained from an interval between 17.6 and 20.7 m depth within a fine sand unit that yielded organic materials including insects and sparse plant macrofossils. A 3 mm long twig recovered from a depth of 20.1 m was submitted to the W. M. Keck Carbon Cycle Accelerator Facility at the University of California, Irvine, for AMS radiocarbon analysis (UCIAMS- 277379) and produced a calibrated median age of 25.8 ka. Two small, winged insects were recovered from depths of 17.6 m and 18.8 m along the length of the drill core. The insects appear to be of the same species but have not been identified and no destructive testing has been performed on them; they remain in the QLM collection at the New York State Museum. The OSL analysis of the sand sample (ISGS-992) collected in the inactive gravel pit yielded an age of 18 ± 2 ka. Age results and supporting data are reported in Table 1 and Table 2.

3.5. Site 5: Conesville Delta

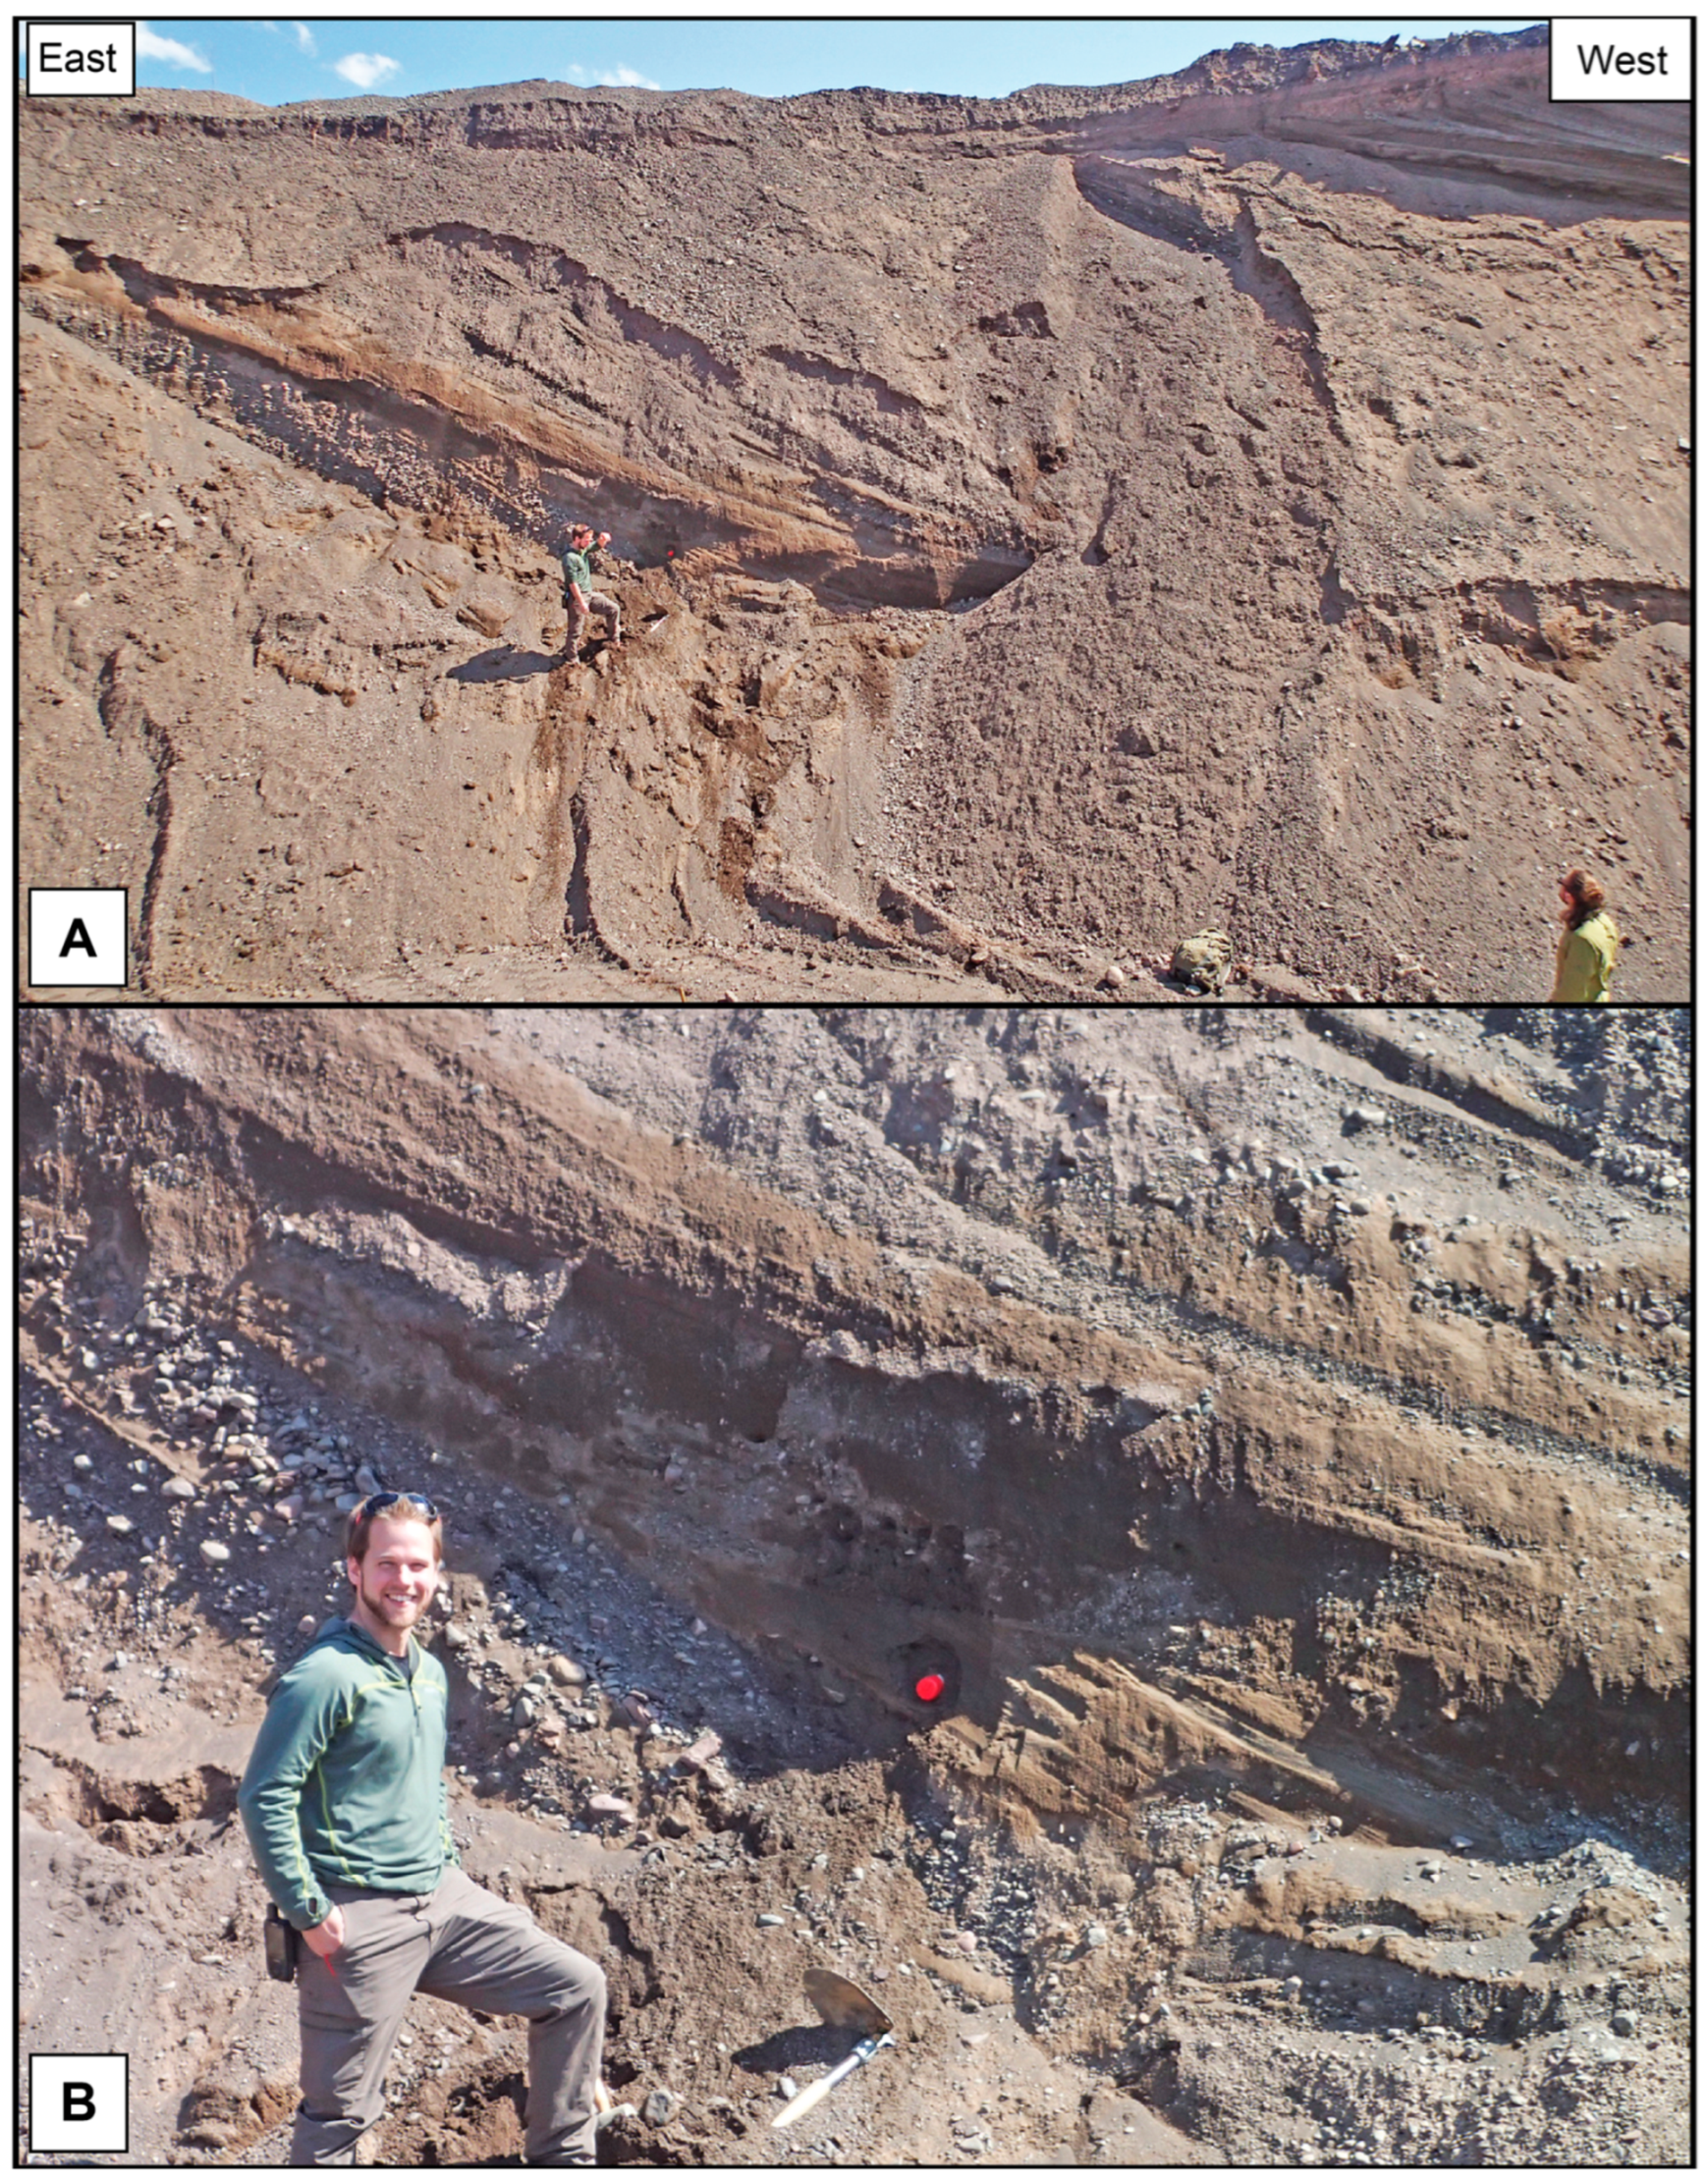
The fifth site examined during field mapping was an active gravel quarry on the Conesville Delta (CV) [35,36,37], located 1.5 km east of the drill core sites (Site 4; MB) and at the head of the Manor Kill Valley (Figure 15). The delta is located at the confluence of two tributaries and has surface elevations ranging from 488 m to 475 m, but has been actively mined for more than a century. The northernmost tributary is the headwaters for the Manor Kill and originates from the slopes immediately below two glacial passes along the NECM with elevations along the divide of approximately 603 m (Figure 3). Several sizeable meltwater channels are incised along the northern tributary above the delta (Figure 3 and Figure 15) similar to those observed in the Platter Kill below glacial Lake Broome Center. At the time of inspection in April 2022, only two distinct stratigraphic units were visible. The upper unit, CV-Unit 1, is a poorly sorted gravel–cobble facies with a matrix of coarse sand. Cobbles in this upper unit appear to have imbrication which indicates transport from east to west. Unit 1 was only visible along the highwall and access was restricted, which prohibited closer inspection. The appearance of the upper unit at the Conesville Delta is very similar to that of the upper unit at the Platter Kill Sand and Gravel quarry (PK-Unit 1).
Active excavations in the central, lower portion of the quarry at Site 5 exposed a 10 m tall outcrop of bedded sands and gravels consistent with foreset beds (CV-Unit 2) dipping westward (Figure 18). The foreset beds are dominated by well-sorted layers of sand, although also observed are consistent beds of normally graded, clast-supported, medium to coarse gravels. Gravel in this landform is often well rounded and, in some instances, appears as open-framework beds (Figure 19). By September of 2025 the foreset units (Unit 2) at Site 5 had largely been excavated and a lower stratigraphic interval (CV-Unit 3) was exposed 8 m deeper in the section below Unit 2. The lowermost unit comprises horizontally bedded rippled sand and silt layers consistent with a bottomset unit. Clast counts made of 100 cobbles removed from the uppermost layer at the site, Unit 1, indicate that the vast majority (72%) of cobbles consist of sandstones (clastic) followed by exotic clasts (21%), which are primarily metamorphic rocks. Only a small fraction (6%) of cobbles are carbonate lithologies.

Geochronologic Results from Site 5—Conesville Delta

The bedded sand units in the Conesville Delta were sampled for OSL geochronologic analysis. The first sample (ISGS-888) was collected from a well-sorted medium sand 9.4 m below the delta top within the foreset beds (CV-Unit 2) and yielded an age of 30 ± 3 ka. A second sample (ISGS-895) was collected 50 m to the west of the first sample from a higher stratigraphic level within the foresets of Unit 2, 2.4 m below horizontally bedded sand and gravels inferred to be the topset–foreset contact surface along the western edge of the delta. This second sample provided an OSL age of 23 ± 1.5 ka.

3.6. Results Summary

The stratigraphy and sedimentology observed at Site 1 and Site 5 in the Platter Kill and Manor Kill Valleys are consistent with previous interpretations [35,36,37] that these landforms are deltas deposited into an ice-dammed lake with a stable outlet at 488 m elevation. A third landform (Site 2) inspected along Black Brook, a tributary to the Keyser Kill, at an elevation of 592 m is also consistent with previous interpretations [35,37] as being a delta associated with a separate, isolated, ice-dammed lake near Broome Center. Glacial Lake Broome Center was likely co-eval with glacial Lake Grand Gorge and probably fed meltwater to the delta at the Platter Kill (Site 1).
The surficial deposits comprising the uppermost stratigraphy in the deltas at Site 1 and Site 5 consist of poorly sorted, imbricated, coarse-grained cobble–boulder gravel. High-resolution topography data from LiDAR encompassing the delta of Site 1 displays a pattern of braided channels upon the landform surface. Both the geomorphology and sedimentology of this unit are consistent with glacial outwash (sandur) deposits that have prograded onto a delta plain.
Subsurface stratigraphy in the Manor Kill Basin (Site 4) obtained from multiple continuously sampled drill cores illustrates the framework of late-Pleistocene glacial events. A dense diamicton unit at the base of the valley fill documents the westward advance of the Westerlo Sublobe across the NECM and deposition of glacial till. Clasts within the till unit consist entirely of red sandstone, identical to the observed bedrock exposed at the surface in a quarry 3 km to the east of Site 4 aligned with the glacial pass. This interpretation is also supported by drumlins (Figure 15) and bedrock striations oriented east to west along the valley wall south of the Manor Kill Basin, as well as morainal landforms at an average elevation of 466 m and grounding line deposits at an elevation of 440 m (Site 3; west of the coring locations). Above the till unit, the valley-filling sediments generally fine upward from sand to silt and clay and document sedimentation into a lake basin following retreat of ice that deposited the till. Macrofossils and insects were found in the fine sands below the transition into silt–clay rhythmites. It is important to note the fragile nature of these macrofossils. They would likely not survive interaction with the sliding bed of a glacier. There is also a lack of overcompacted sediments like those observed in central New York [64,65]. The uppermost sediments (<3 m depth) recovered from the drill core are lithologically indistinguishable from modern alluvium in the Manor Kill. These sediments likely represent Holocene alluvium reworked and deposited as base level dropped when glaciers receded from the region.
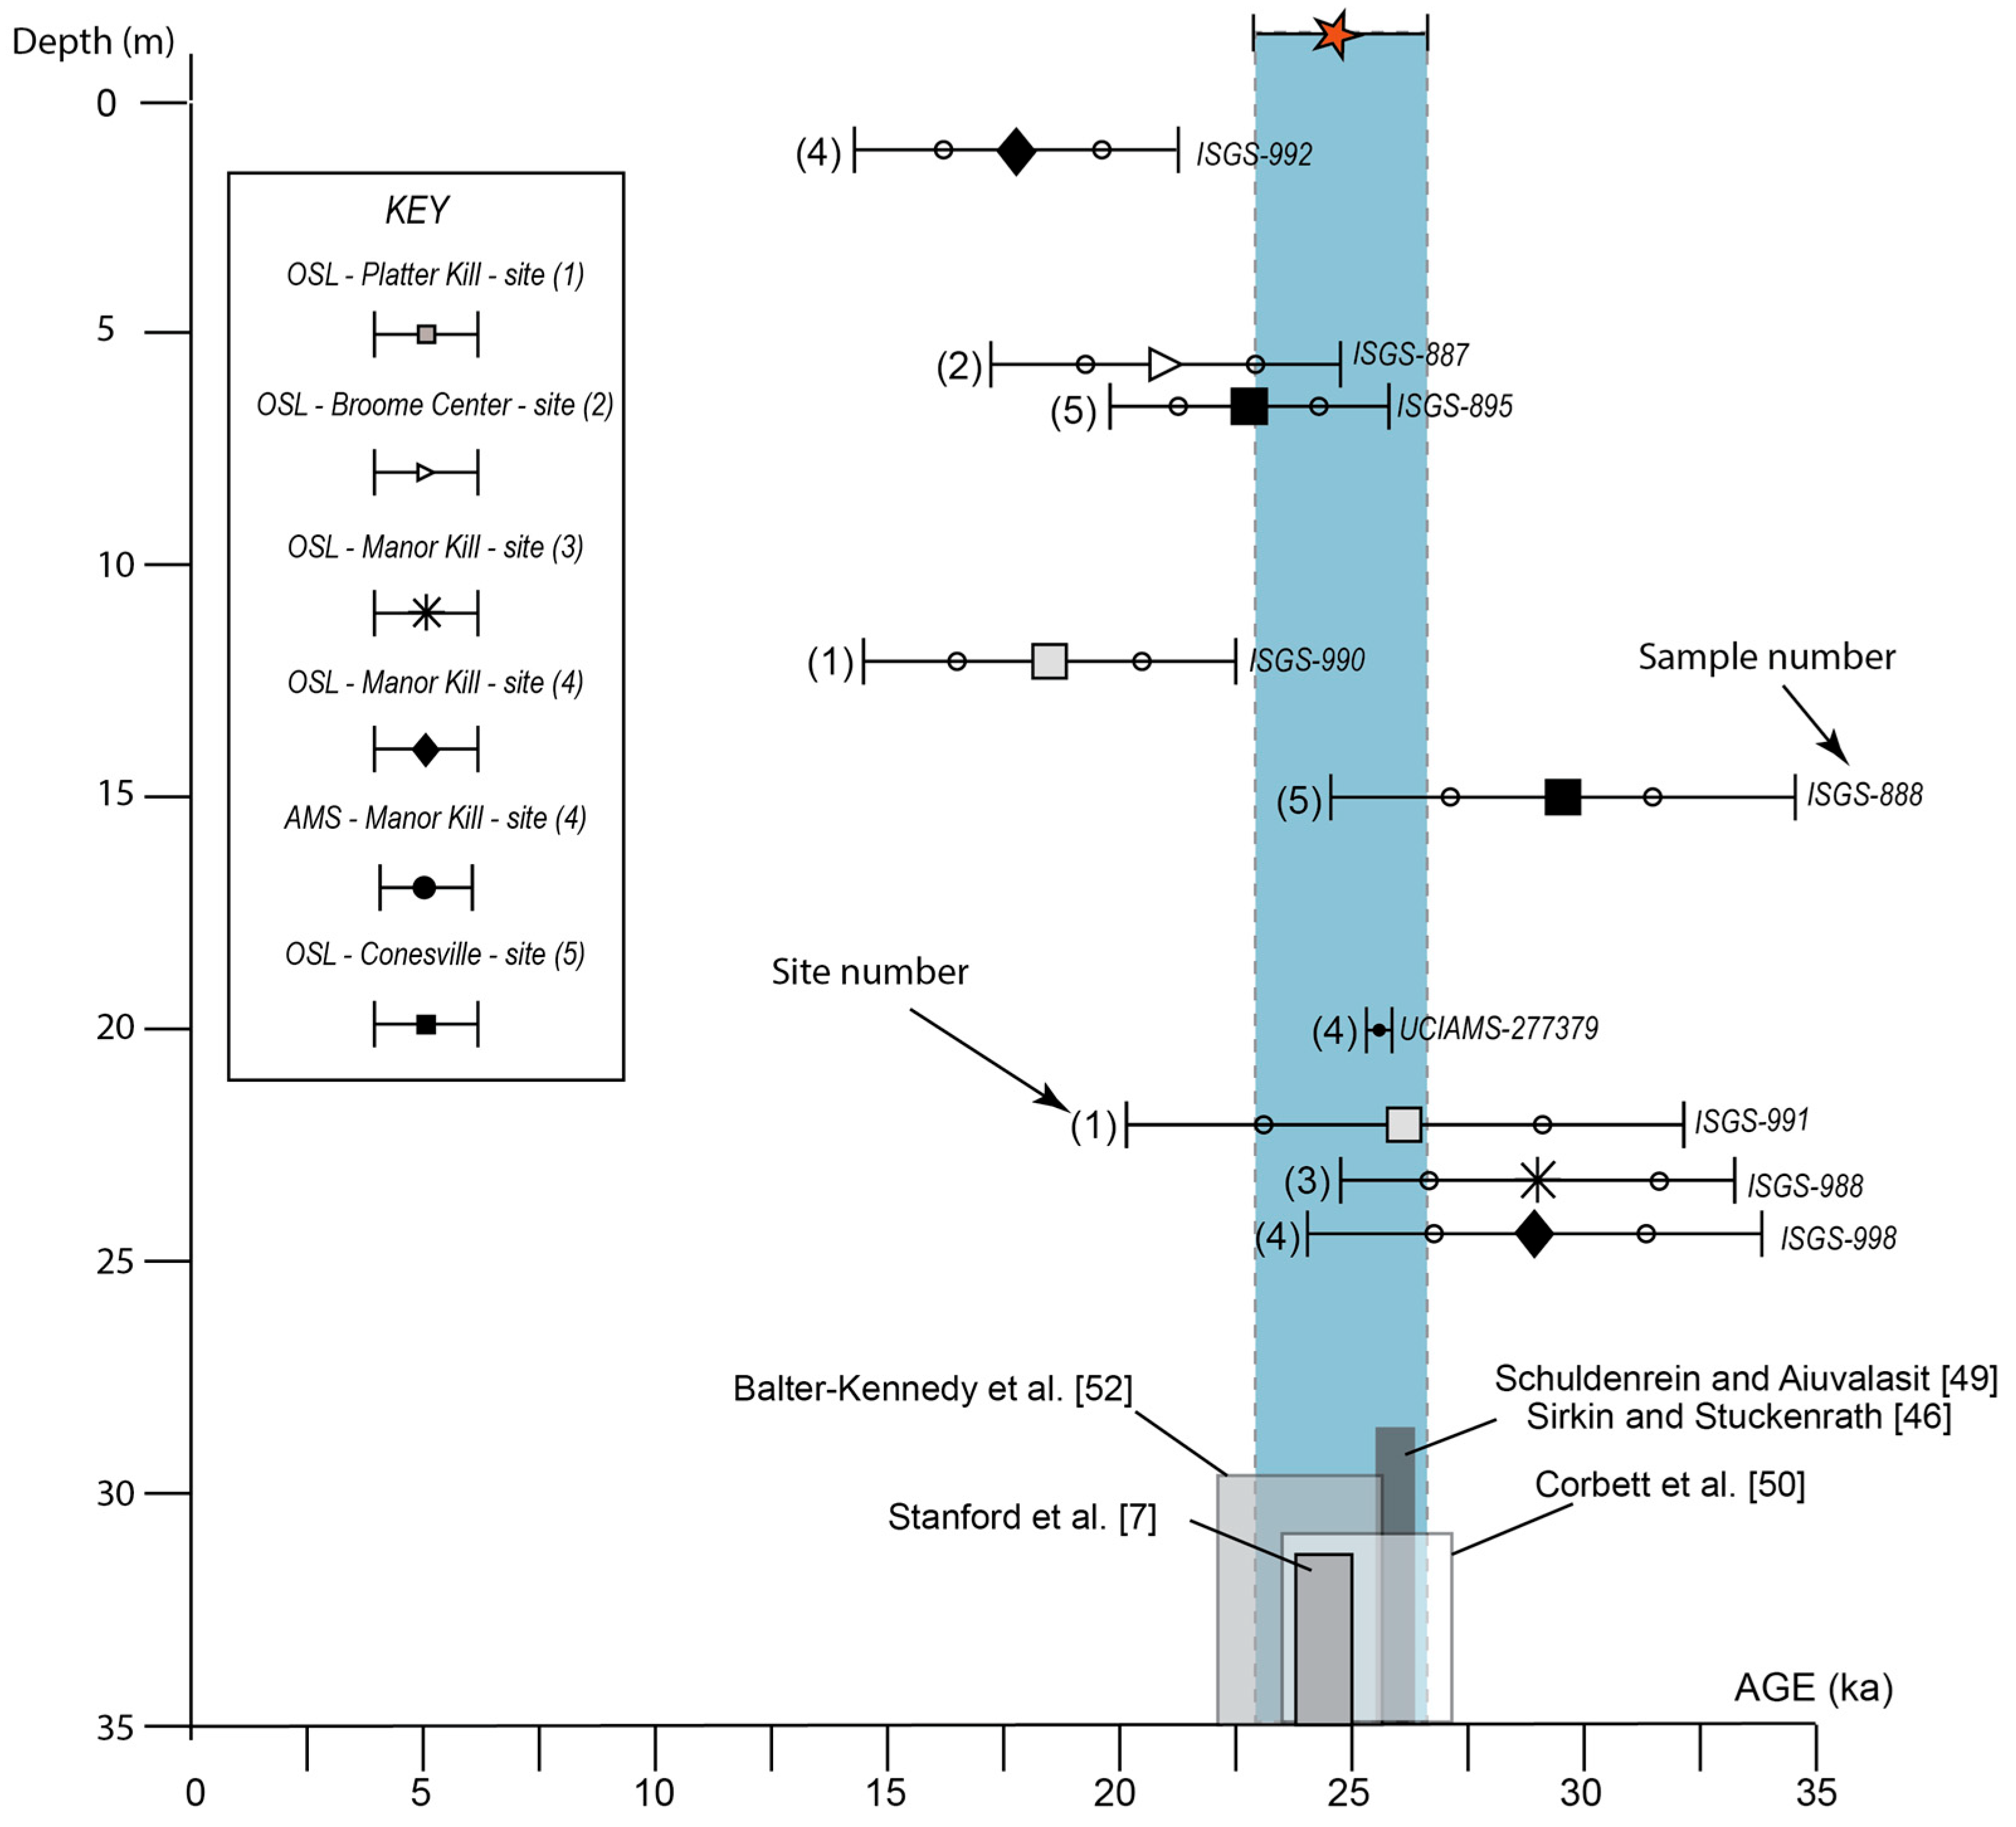
Geochronologic data collected as part of this study consist of nine samples that span an age range from 30 ka to 18 ka. The majority of new geochronologic information is from OSL dating, although one new radiocarbon date with a calibrated median age of 25.8 ka was also obtained (Figure 20). While there is considerable overlap in probable (2σ) age range yielded by the geochronologic data in this study, two general trends or groups appear on the plot. The first observable trend in the data is that sediments at depth or lower in elevation appear to have been buried (deposited) earlier, with a central mass of ages between 24 ka and 33 ka. Conversely, the other group of data suggests sediments buried at higher elevation or shallower depths yield younger ages with a central age between 18 ka and 22 ka. In general, the geochronologic data is consistent with the stratigraphy and maintains superposition.

3.7. Discussion

3.7.1. Glacier-Fed Deltas

Deltas in the Manor Kill and Platter Kill Valleys associated with glacial Lake Grand Gorge, as well as the delta at Broome Center, are attributed to the development of an interlobate zone between glacial ice that flowed southward into the Schoharie Valley and west to southwestward from the Hudson Valley [35,36,37]. However, previous work lacked detail regarding the stratigraphy, sedimentology, and deglacial chronology associated with these deltas. Deltas form when a fluvial system enters a larger body of water and the resulting loss in velocity triggers sediment deposition [94,104]. With time, prograding sediments develop a distinct stratigraphic bedding pattern of bottomset, foreset, and topset beds [105]. If sedimentation rates remain high, the topset beds deposited by alluvial processes prograde into the basin and the resulting contact between foreset beds and topset beds demarcates the datum of the lake level.
The southern edge of Mohawk Lobe advanced into the Schoharie Valley to form the Schoharie Sublobe, which blocked drainage of preexisting tributaries and established the formation of ice-dammed lake(s) within the valley (see [35,36,37] for a detailed discussion). However, based on the stratigraphic data presented in this study it appears that as glacial ice of the Hudson Lobe thickened and expanded to occupy the Hudson Valley, its western edge expanded southwestward as the Westerlo Sublobe toward the NECM. Westerlo Sublobe ice moved west to southwestward and crossed Catskill Creek. It blocked drainage in the creek and encountered higher elevation bedrock along the escarpment, which forms the drainage divide between the Schoharie Valley and the Hudson Valley. The ice continued to advance over the NECM and into an existing proglacial lake within the Schoharie Valley, where it deposited till and formed drumlins along the uplands and valley walls between the Platter Kill and Manor Kill Valleys. Although the western extent of the Westerlo Sublobe advance is unknown, small topographically controlled recessional ice margins in the Manor Kill Valley [35,36] suggest that ice advanced as far west as the center of the Schoharie Valley and possibly to the central escarpment to the Grand Gorge outlet. The Schoharie Sublobe must not have advanced far enough south by this time to block or deflect the westward advance of the Westerlo Sublobe.
Recession of the Westerlo Sublobe appears to have begun prior to the advance of the Schoharie Sublobe based on ice marginal positions in the Manor Kill Valley and the Platter Kill Delta. Later, a 4 km wide tongue of Westerlo Sublobe ice stalled on the drainage divide near Broome Center, NY, and wedged itself between Leonard Mountain (part of the drainage divide) and the adjacent Schoharie Sublobe (Figure 3 and Figure 13). Five kilometers southward along the NECM, Westerlo Sublobe ice was positioned in and along cols along the escarpment and carved distinct U-shaped glacial passes (Figures S12 and S13). These cols fed tongues of ice into the Manor Kill Valley that developed as the glacier thinned and topography exerted greater control upon the ice margins. The same cols also fed meltwater and sediment from the retreating ice front into the Manor Kill Valley near Conesville, NY.
The two large deltas built into the Platter Kill and Manor Kill Valleys (Platter Kill and Conesville Deltas, respectively) along the eastern shore of glacial Lake Grand Gorge were created by sediment and meltwater issued from the Westerlo Sublobe (Hudson Lobe of [35,36,37]). Deltas formed by meltwater streams flowing directly from glaciers have distinct sedimentological and stratigraphic characteristics compared to deltas formed by meteoric precipitation and distal sources [106,107]. Glacier-fed deltas follow Gilbert-type deltaic architecture consisting of bottomsets, foresets, and thin topset beds [94,98,108]. The deltas of the Platter Kill and Manor Kill Valleys associated with glacial Lake Grand Gorge have well-preserved bottomset sequences (Figure 6) and foreset sequences (Figure 11, Figure 18 and Figure 19). Here we document the distinguishing coarse-grained topset sequences (Figure 12) composed of braided glacial outwash supplied by meltwater streams that grade to the 488 m elevation of glacial Lake Grand Gorge. The coarse deposits described as topsets (PK-Unit 1 and CV-Unit 1) in the Platter Kill and Manor Kill Valleys confirm that glaciers supplied both sediment and meltwater for delta construction. Likewise, modern geologic mapping [76] alongside 1 m resolution LiDAR imagery indicates that the delta at 592 m elevation in Broome Center has a close association to other constructional glacial landforms including eskers, moraines, and hummocky knob and kettle terrain in its near vicinity (Figure 13). Formation of the delta at Broome Center requires a proximal ice dam in the Keyser Kill.

3.7.2. Geochronology

Part of the rationale and motivation for this investigation is that very little available geochronologic information exists regarding the Pleistocene events which shaped the Schoharie Valley and the northern Catskill Mountains. General sequences of deglaciation and lake stages have been proposed [35,36,37] but no modern attempts utilizing geochronology to decipher the age of glacial Lake Grand Gorge have, until now, been attempted. The existing estimates of deglacial timing were based on tracing of ice margins from 1:24,000 topographic maps and end moraine correlations [37,74,80,109] between the Mohawk Valley and the Hudson Valley regions of New York.
Multiple phases of ice-dammed glacial lakes have been proposed for the Schoharie Valley by earlier researchers [35,36,37], and the focus of this paper is the Grand Gorge Phase. Although the landforms (deltas) and lake stage (Grand Gorge Phase) examined in this study generally agree with the deglacial event sequence proposed by earlier work, the geochronologic data obtained from this study do not align with the deglacial chronology previously proposed for this region [37,38,47,74]. Previous interpretations of the deglacial chronology in this part of New York have correlated the timing of deglaciation with the Rosendale Readvance (Figure 1) at approximately 16.1 ka [37,47,80] and later revised it to be greater than 18.3 ka [38,81].
The glacier-fed deltas observed at an elevation of 488 m confirm the presence of an ice-dammed lake at an elevation controlled by the Grand Gorge outlet. The mean OSL age of the deepest sediments collected from Sites 1, 3, 4 and 5, representing the oldest sediments examined as part of this study, indicates that glacial Lake Grand Gorge existed by around 28 ka. Previous researchers have suggested that impoundment of this lake would require the Schoharie Sublobe in the Schoharie Valley to have advanced south of Middleburgh, NY, to block drainage to the southeast by way of Catskill Creek (see Figure 2) through the Franklinton Channel [35,36,37]. However, the southwestward advance of the Westerlo Sublobe would also have blocked eastward drainage and triggered westward drainage via Grand Gorge. In the Manor Kill Valley at Site 3, westward-dipping, coarse-grained cobble–boulder deposits overlying well-sorted sands with a reported OSL age of 29 ± 2 ka indicate a substantial increase to meltwater energy occurred, possibly because a more proximal source to supply coarse sediments became available.
A clear and unmistakable ice margin extending perpendicularly across the Manor Kill Valley [35] occurs 1 km from Site 3. In addition, well-defined east-to-west-oriented drumlins (Figure 15) occur along the southern wall of the Manor Kill Valley behind the ice margin. These landforms and deposits are consistent with one another and indicate that glacial ice from the Westerlo Sublobe may have thinned and become more topographically controlled utilizing cols in the NECM during retreat. Supporting evidence of proximal Westerlo Sublobe ice is provided by the deposition of coarse boulder-laden turbidite deposits observed in the bottomset units (PK-Unit 3) within the Platter Kill Delta. The turbidite deposits that incise the bottomset units require a source which, based on paleo-flow data, was most likely proximal outwash driven by meltwater pulses or mass wasting from a nearby glacier in the Platter Kill Valley.
Data from subsurface cores collected in the Manor Kill Basin (Site 4; MB) provide additional information regarding the late-Pleistocene event history of the field area, particularly with respect to glacial Lake Grand Gorge. The OSL age of 29 ± 2 ka recovered at a depth of 23.8 m from the well-sorted medium sands (MB-Unit 3; Figure 16) of a subaqueous outwash unit that directly overlies glacial till provides context for ice recession. This OSL age is consistent with other OSL ages from deeper deposits (Sites 1 and 3) associated with glacial Lake Grand Gorge. Three meters above the stratum that provided the OSL sample, a twig recovered in a fine sand unit (base of MB-Unit 2) yielded a calibrated median age of 25.8 ka. The same stratigraphic interval also yielded very small, winged insects (Figure 17). Collectively, the twig and the insects suggest that a crude ecosystem existed at the time that the fine sand was deposited. Higher in MB-Unit 2, sediments continue to fine upward into silt–clay rhythmites. Taken in total, the stratigraphy preserved in the valley-filling sediments at Site 4 within the Manor Kill Basin is consistent with a deglacial stratigraphic succession [110,111,112].
The OSL burial age of 30 ± 3 ka from the deeper foresets at the Conesville Delta is consistent with two other ages collected in this study from close proximity (<5 km) within the same valley. The consistency of OSL ages reinforces that glacial Lake Grand Gorge was established by this time. However, we must also recognize the limitations of the resolution of our OSL data. While all three basal OSL dates in the Manor Kill Basin appear to be consistently the same age (29 to 30 ka), the context of the landforms and the radiocarbon date can be used to provide additional constraints for the geologic sequence of events in the Manor Kill Basin. We interpret Site 3 as a grounding line ice marginal position, and upstream there is an ice margin (morainal bank) to the east between Site 4 and the Conesville Delta at the head of the valley. Both the grounding line and morainal bank are below 488 m, the elevation of glacial Lake Grand Gorge. From a simple relative-age perspective, the grounding line must have formed prior to the morainal bank and the Conesville Delta must have formed last in the landform sequence. Based on the geochronologic and stratigraphic data from the Site 4 coring, we can suggest that the age of 29 ± 2 ka of the grounding line fan provides a maximum age for the morainal bank to the east. Likewise, the radiocarbon date of 25.8 ka at the base of the lake sediment sequence, behind the morainal bank, serves as the maximum age for glacial Lake Grand Gorge and the minimum age for deglaciation (Figure 16). The OSL age from Site 3 and the radiocarbon date from Site 4 bracket the age of the ice margin.
More interesting is the context provided by the uppermost OSL age from the Conesville Delta, 23 ± 1.5 ka near the topset interface. This age allows insight into the duration of the ice-front configuration that supplied sediment and meltwater. Glacial ice from the Westerlo Sublobe must have remained within 4 km east of the delta, at or near the divide of the glacial pass along the NECM (Figure 3), or else meltwater and sediment input would have ceased or substantially diminished.
The high-elevation delta near Broome Center (592 m; Figure 13) can also help to illuminate the potential ice-front configuration because the site preserves a remarkably clear relationship between the required ice dam and the existing delta. It is important to clarify that this location is a zone of interlobate convergence, and landforms observed on the 1 m LiDAR indicate that impoundment of the Keyser Kill was due to Schoharie Sublobe ice. However, east of the high-elevation delta are eskers and hummocky topography, as well as small ice margins produced by Westerlo Sublobe ice. The orientation of the delta and westward dip of the foreset beds indicate that the delta was also fed by Westerlo Sublobe meltwater. The OSL age of 21 ± 2 ka from the sediments of the Broome Center Delta is nearly identical to the age of the uppermost sediments sampled at the Conesville Delta, and both sites are at the same longitude (see Table 1). Thus, it is plausible they demarcate the western edge of the Westerlo Sublobe at approximately 22 ka. Well-developed and incised meltwater channels (Figure 13 and Figure 15) draining west to the deltas in both the Platter Kill and Manor Kill Valleys below the NECM support the suggestion that the Westerlo Sublobe may have persisted at or near the drainage divide.
To summarize, the sedimentologic details and OSL geochronology presented in this work indicate that sedimentation into an ice-dammed lake in the Schoharie Valley had begun to grow deltas to the glacial Lake Grand Gorge level (488 m) by about 29 ka. Radiocarbon dating of plant macrofossils from lacustrine sediments deposited in the Manor Kill Basin (Site 4), 1 km east of a prominent ice margin in the Manor Kill Valley, support the presence of glacial Lake Grand Gorge at 25.8 ka. The OSL ages from the Broome Center and Conesville Deltas provide further chronologic constraints to indicate that meltwater and sediment supplied by the Westerlo Sublobe persisted until at least 22 ka. We considered the possibility that the OSL ages may be too old based on numerous studies [113] that show dating proglacial sediments with luminescence is complicated by the largely underwater transport paths of the sediment during meltwater phases, which limit sunlight exposure that is needed to reset luminescence of the grains (partial bleaching). We attempted to ameliorate this problem by sampling topset or foreset deltaic deposits when possible (Table 1), analyzing quartz as it is the mineral that needs the least amount of sunlight to reset on transport (Table 2), accepting only the fast component OSL characteristics that respond best to established laboratory protocols (see Supplementary Materials), and by measuring a large number of aliquots (75–190+ aliquots for each sample; Table 2) with a strict rejection protocol which optimized the measured ages to avoid partial bleaching bias (see Supplementary Materials).
Thus, a synthesis of the new geochronologic data presented herein demonstrates that the Westerlo Sublobe had crossed the NECM into an existing lake and then receded, building constructional landforms into glacial Lake Grand Gorge for a period potentially spanning 7000 years between 29 ka and 22 ka. The mean of all seven OSL ages obtained from sediments within the footprint of glacial Lake Grand Gorge is 24.7 ± 2.4 ka and the AMS radiocarbon age from the twig recovered from associated lacustrine sediments is 25.8 ka.
Although the glacier-fed deltas described in this paper were constructed from the Westerlo Sublobe ice, the recession of the western edge of the Westerlo Sublobe eastward sometime after 22 ka did not mean the demise of glacial Lake Grand Gorge. Lake level was controlled by the outlet at Grand Gorge and the ice dam formed by the Schoharie Sublobe. Northward recession of the Schoharie Sublobe by a distance of ~15 km would have been required in order to allow lake level to drop to the lower level of the outlet of the Franklinton Channel (366 m) and into Catskill Creek. Further, for eastward drainage to be possible, the Westerlo Sublobe would have necessarily thinned to an elevation lower than 488 m and/or retreated north of Catskill Creek.
The preserved stratigraphy of the valley-filling sediments in the Manor Kill Basin (Site 4) does not provide any stratigraphic, sedimentologic, or structural evidence of later glacial readvance into the basin. Further, neither the stratigraphy nor the sediments (diamicton, till) evaluated at any of the sites examined in this study provided any evidence of glacial oscillations (signs of readvance such as multiple till units, deformation, and shearing of underlying sediments) after the original deposition. The postglacial/deglacial record at all sites described generally suggests deposition, sometimes proximal, followed by recession.

3.7.3. Analysis of Regional Deglacial Context

The interval of 29 ka to 22 ka defined in this study as the time period when the western edge of the Westerlo Sublobe had crossed the NECM (Figure 21) and supplied sediment and meltwater to build deltas into ice-dammed lakes in the Schoharie Valley is a significant departure from the optimum/maximum ice margins at the LGM [3]. However, this configuration actually closely reflects the minimum ice extent portrayed by Dalton et al. [3] which was drawn to account for 14C dates in the 25–23 ka range from the Lake Erie basin.
Our data also differs from more specific models of ice configuration along the southeastern edge of the LIS in New York State [38,77,114]. In New York, 29–22 ka has generally been accepted as the age range for the last glacial maximum (LGM) during the Marine Isotope Stage 2 (MIS 2) ice advance [7,38,46,50,52,81]. The conventional belief is that the MIS 2 ice advance covered nearly all of New York State with glacial ice, which deposited the Olean Till (see Supplementary Materials), the exception being the Salamanca Reentrant in western New York and the southern half of Long Island [7,46]. After the LGM, existing deglacial models [38,81] based on data from older moraine tracing efforts [37,74,80] of correlated ice margins suggested the Grand Gorge Phase ice margin, referred to as the Rosendale margin by Ridge [38], was older than 18.3 ka. More recently, Halstead et al. [114] reported five cosmogenic exposure ages from boulders on Peekamoose Mountain, NY, 48 km south of our study area. The ages span a range from 18.1 ± 0.5 ka to 19.5 ± 0.4 ka and are interpreted to represent rapid ice sheet thinning during the last deglaciation. While the chronology we propose in this study with nine new data points may not align precisely with ages reported by Halsted et al. [114], our study is based on comprehensive geologic mapping that has carefully evaluated sediment–landform relationships and stratigraphy that provides a solid context for our interpretations. We suggest the discrepancies in age results between our two studies may simply be the result of dynamic ice movement of the Westerlo Sublobe.
Considering all possibilities to explain the discrepancy between the new chronologic data collected as part of this study and the existing paradigm, we asked ourselves the following questions: (1) Could the lake that formed these landforms have been subglacial? (2) Could the chronological data represent the buildup of the LIS prior to overriding and coverage of the landscape by glaciers, rather than a deglacial age? and (3) Are there any existing proxies in the Great Lakes or New England glaciated regions where ice-free enclaves have been identified?
Although subglacial lakes have been increasingly recognized in both modern glacial settings and ancient glaciated terrains [115,116,117], three pieces of data from this study preclude the possibility that the phase of glacial Lake Grand Gorge examined in this study could have been subglacial. First, the consistent elevations of the deltas in the Platter Kill and Manor Kill Valleys indicate a stable lake level controlled by the stable outlet at Grand Gorge at an elevation of 488 m. The deltas are relatively large and were fed by meltwater and sediment from the edge of a glacier, not the underside of an ice sheet. Secondly, the drill cores collected in the Manor Kill Valley at Site 4 recovered winged insects and a twig with an AMS radiocarbon age of 25.8 ka in a deglacial lake sequence. While far from absolute confirmation, these macrofossils suggest that a crude ecosystem was present at this time, and it is highly unlikely that these organisms were alive within, or survived transport through, a subglacial environment. Third, there is no stratigraphic evidence of an ice sheet overriding the deltas or depositing a readvance till; the observed succession of glacial landforms and stratigraphy is consistent with a single phase of deglaciation.
The results of this study imply an intriguing scenario. On one hand, to form stable deltas at 488 m elevation requires a stable outlet draining into the Delaware River Valley, and the macrofossil record and absence of overriding (advancing) tills further suggest an open and subaerial setting. On the other hand, the evidence of ice-dammed lakes and the geochronologic ages obtained here are a plausible signal of ice sheet buildup during the MIS 2 advance. The absence of evidence (readvance tills and glacially overridden sediment) does not eliminate a theory; it could simply indicate that additional investigation is required. There is a growing body of thought that perhaps lobes of the LIS in the Great Lakes region were asynchronous and more dynamic than previously understood [29,118,119,120,121]. The data presented herein imply the western edge of the Westerlo Sublobe was at the NECM between 29 ka and 22 ka. The center of the Hudson Valley is approximately 50 km east of the NECM and 670 m lower in elevation. The Hudson Valley is the lowest elevation terrain in eastern New York State, having minimal topographic relief as compared to the Catskill Mountains. A proglacial lake system was likely present upon ice advance and retreat into the Hudson Valley and would provide basal lubrication in the form of saturated silt/clay, lowering the shear stress and allowing for a thinner ice lobe that would preferentially divert ice south toward Long Island. The physiography is ideally suited for ice to flow unimpeded southward to New Jersey and Long Island, the accepted location of the MIS 2 terminal moraine [7,50]. Perhaps the new ages presented here for landforms and sediment deposited at high elevation along the NECM represent an early buildup of ice during the MIS 2 ice advance. This new geochronology may constrain the thickening and westward lateral expansion of the Westerlo Sublobe, followed by an early recession back to the NECM. Recently, Balter-Kennedy et al. [52] suggested that 4 kyr age variations in moraine ages along the terminal moraine may reflect early fluctuations that occurred during the LGM. Perhaps our data records similar early fluctuations.
There is other evidence beyond that presented here. Rayburn et al. [70] report an OSL age with 1 sigma error age of 28 ± 0.74 ka on quartz sand within a subtill varve unit from ice-dammed proglacial lake sediments in the Catskill Mountains, which could only have been deposited as Hudson Lobe ice blocked eastward drainage from Esopus Creek along the eastern front of the mountains. This age coincides within the geochronologic results of this study and further supports the interpretation that the Catskill Mountains were not completely overlain by a continental ice sheet at this time.
The data presented in this work challenges the convention that the northern Catskill Mountains of New York State were covered by glacial ice during the LGM (MIS 2) ice advance. However, recent work in northern Michigan [28,29,122] has identified very similar ice-free windows in an upland setting at a location of interlobate convergence that coincide with both the LGM and an earlier buildup of the LIS. Similarly, ice-free zones along the Sturgis Moraine are reported by Erber et al. [121] in southern Michigan. In their study, three OSL ages provide a mean age of 28.0 ± 1.7 ka and a fourth sample from an ice-walled lake plain yielded an age of 22.2 ± 0.8 ka. The mean age of these four samples is ~26.5 ± 1.5 ka. Interestingly, the OSL ages in the ice-free zones near the Sturgis uplands are nearly identical to those obtained in this study in the uplands of the northern Catskill Mountains; both locations share a similar latitude and are situated at zones of interlobate convergence. While additional work is needed to explore the causation of ice-free enclaves within the LIS, there is precedent elsewhere in the glaciated Great Lakes region to suggest that such conditions could and did occur.

4. Conclusions

This study sought to investigate the age and construction of landforms and deposits formed by sublobes of the LIS that resulted in the formation of glacial Lake Grand Gorge. This investigation has also allowed us to deduce glacial event timing and associated dynamics of the Schoharie Sublobe and the Westerlo Sublobe. The collection of seven OSL ages provides new chronologic information yielding a mean age of 25 ± 2 ka. While concerns about partial bleaching of OSL samples remain a consideration among quaternary geologists, a median age of 25.8 ka from a twig recovered from lacustrine sediments in the same basin supports the OSL ages obtained in this study. Thus, based on the available chronological data from this study, it appears that glacial Lake Grand Gorge formed in an ice-free interlobate zone within the northern Catskill Mountains during the last glacial maximum and free drainage out of the Delaware River Valley was possible, controlled by the Grand Gorge outlet at an elevation of 488 m. The recovery of small, winged insects in the drill core from a depth of 20 m within fine-grained lacustrine sediments in the Manor Kill Basin is also telling. While the insects have not yet been identified, they were recovered from the same stratigraphic unit that yielded the twig sample which has been dated by AMS radiocarbon dating. Although many researchers may equate the LGM to a time of maximum cold and ice sheet development, the macrofossil assemblage suggests the possibility that an ecosystem containing small woody plants and insects may have existed, and that the climate of this region was moderated by the presence of a large lake system. Further work to identify the recovered insects is warranted.
The deltas and ice margins described in this study were built along embayments on the eastern edge of glacial Lake Grand Gorge and likely represent the thickening and westward lateral expansion of the Westerlo Sublobe of the larger Hudson Lobe during the MIS 2 advance. Westerlo Sublobe ice fed meltwater and sediment westward to construct deltas in the Manor Kill, Platter Kill, and Keyser Kill tributary valleys until the sublobe retreated eastward over the NECM sometime after 22 ka. However, glacial Lake Grand Gorge was still controlled by the ice dam of the Schoharie Sublobe and likely existed until the Schoharie Sublobe retreated northward to allow eastward drainage out of the Franklinton Channel. This would have happened provided that the Westerlo Sublobe had thinned to an elevation lower than the 488 m Grand Gorge outlet and/or retreated north of Catskill Creek. The duration of time required for that retreat is unknown at present and further work is needed to resolve the timing of the demise of glacial Lake Grand Gorge.
New surficial geological mapping on a high-resolution 1 m LiDAR basemap, combined with detailed examination of stratigraphy, sediments, and landforms, has allowed us to carefully reevaluate the geologic context of glacial Lake Grand Gorge, a 171 km2 ice-dammed lake in the Schoharie Valley of the northern Catskill Mountains. A combined OSL and AMS radiocarbon dataset provide nine new points of geochronologic information and indicate that this lake existed from approximately 30 ka to at least 22 ka. Glacier-fed deltas that could only be formed in an ice-dammed lake provide the context to define an ice-free enclave at the locus of an interlobate area in eastern New York during the LGM. The dates presented herein differ from earlier interpretations of the deglacial history of New York in this region. Recent geological mapping and stratigraphic investigations have allowed fresh opportunities to collect data and to evaluate theories proposed by earlier researchers. Continued thorough testing of the hypothesis we present can spark continued interest in the deglacial history of the northern Catskill Mountains, as well as geological mapping and glaciological study in general.

Supplementary Materials

The following supporting information can be downloaded at: https://www.mdpi.com/article/10.3390/quat9030046/s1, Luminescence Supplemental Data and Supplemental discussion on the Olean Till [123,124,125,126,127,128,129,130,131,132,133,134,135,136,137,138,139,140,141,142].

Author Contributions

Conceptualization, A.L.K.; methodology, A.L.K., K.J.B. and R.S.F.; investigation, A.L.K., R.A.F., K.J.B., H.M.F., R.S.F. and S.A.M.; data curation, A.L.K., K.J.B. and S.A.M.; writing original draft preparation, A.L.K.; writing review and editing, H.M.F., R.A.F., K.J.B. and S.A.M.; visualization, A.L.K., K.J.B., and R.S.F.; supervision, A.L.K.; project administration, A.L.K. and R.S.F.; funding acquisition, A.L.K. All authors have read and agreed to the published version of the manuscript.

Funding

Financial support for this research was provided by the Great Lakes Geological Mapping Coalition program (award #G21AC10697) and STATEMAP program (award #G22AC00366) administered by the National Cooperative Geologic Mapping Program of the U.S. Geological Survey.

Data Availability Statement

The original contributions presented in this study are included in the article/Supplementary Material. Further inquiries can be directed to the corresponding author.

Acknowledgments

We are grateful for the cooperative agreement, partnership, and federal funding to the New York State Geological Survey. Additional financial support was provided by the New York State Museum Research & Collections—Research funds operating under the guidance of the New York State Education Department. Special thanks to Steve Young, Dave Merwin, and Eric Dahlberg for site access. We would like to thank Michelle Balint of the Greene County Soil and Water Conservation District for directing us to the Site 3 exposure. We would also like to thank Parratt-Wolff, Inc. and Aardvark Drilling, Inc. for providing excellent technical skills in recovering subsurface drill cores. In addition, we would like to thank the Illinois State Geological Survey Geochronology Laboratory for processing OSL samples. Assistance with luminescence sampling was provided by Sean Grasing; for his efforts we are most grateful. This paper is dedicated to Dany Davis with the New York City Department of Environmental Protection, who encouraged the lead author to pursue glacial geologic research in the Catskill Mountains. Any use of trade, firm, or product names is for descriptive purposes only and does not imply endorsement by the U.S. Government.

Conflicts of Interest

The authors declare no conflict of interest.

References

  1. Heath, S.L.; Loope, H.M.; Curry, B.B.; Lowell, T.V. Pattern of southern Laurentide Ice Sheet margin position changes during Heinrich Stadials 2 and 1. Quat. Sci. Rev. 2018, 201, 362–379. [Google Scholar] [CrossRef] [Scilit]
  2. Gowan, E.J.; Zhang, X.; Khosravi, S.; Rovere, A.; Stocchi, P.; Hughes, A.L.; Gyllencreutz, R.; Mangerud, J.; Svendsen, J.I.; Lohmann, G. A new global ice sheet reconstruction for the past 80,000 years. Nat. Commun. 2021, 12, 1199. [Google Scholar] [CrossRef] [Scilit] [PubMed]
  3. Dalton, A.S.; Dulfer, H.E.; Margold, M.; Heyman, J.; Clague, J.J.; Froese, D.G.; Gauthier, M.S.; Hughes, A.L.; Jennings, C.E.; Norris, S.L.; et al. Deglaciation of the north American ice sheet complex in calendar years based on a comprehensive database of chronological data: NADI-1. Quat. Sci. Rev. 2023, 321, 108345. [Google Scholar] [CrossRef] [Scilit]
  4. Gandy, N.; Astfalck, L.C.; Ives, G.L.; Rivers, G.E. Ice sheet speed-dating: Using expert judgement to identify “good” simulations of the last glacial maximum North American ice sheets. Quat. Sci. Rev. 2024, 333, 108690. [Google Scholar] [CrossRef] [Scilit]
  5. Loope, H.M.; Antinao, J.L.; Monaghan, G.W.; Autio, R.J.; Curry, B.B.; Grimley, D.A.; Huot, S.; Lowell, T.V.; Nash, T.A. At the edge of the Laurentide Ice Sheet: Stratigraphy and chronology of glacial deposits in central Indiana. In Ancient Oceans, Orogenic Uplifts, and Glacial Ice: Geologic Crossroads in America’s Heartland; Geological Society of America: Boulder, CO, USA, 2018; Volume 51, p. 245. [Google Scholar]
  6. Carson, E.C.; Attig, J.W.; Rawling, J.E., III; Hanson, P.R.; Dodge, S.E. Chronology of advance and recession dynamics of the southern Green Bay Lobe of the Laurentide Ice Sheet, south-central Wisconsin, USA. Quat. Res. 2020, 95, 142–153. [Google Scholar] [CrossRef] [Scilit]
  7. Stanford, S.D.; Stone, B.D.; Ridge, J.C.; Witte, R.W.; Pardi, R.R.; Reimer, G.E. Chronology of Laurentide glaciation in New Jersey and the New York City area, United States. Quat. Res. 2021, 99, 142–167. [Google Scholar]
  8. Ives, L.R.W.; Rawling, J.E., III. Quaternary Geology of Jefferson County, Wisconsin: Wisconsin Geological and Natural History Survey Bulletin; 1 plate, scale 1:100,000; Wisconsin Geological and Natural History Survey: Madison, WI, USA, 2022; Volume 118, 34p. [CrossRef] [Scilit]
  9. Berg, R.C.; Brown, S.E.; Thomason, J.F.; Hasenmueller, N.R.; Letsinger, S.L.; Kincare, K.A.; Esch, J.M.; Kehew, A.E.; Thorleifson, L.H.; Kozlowski, A.L.; et al. A multiagency and multijurisdictional approach to mapping the glacial deposits of the Great Lakes region in three dimensions. In Geoscience for the Public Good and Global Development: Toward a Sustainable Future; Geological Society of America: Boulder, CO, USA, 2016. [Google Scholar]
  10. Clague, J.J.; Evans, S.G. Geologic framework of large historic landslides in Thompson River Valley, British Columbia. Environ. Eng. Geosci. 2003, 9, 201–212. [Google Scholar] [CrossRef] [Scilit]
  11. Clague, J.J.; Roberts, N.J.; Stead, D. Landslide Hazard and Risk. Landslides; Clague, J.J., Stead, D., Eds.; Cambridge University Press: Cambridge, UK, 2012; pp. 1–9. [Google Scholar]
  12. Sherrod, L.; Schlosser, K.; Kozlowski, A.; Bird, B.; Werkema, D.D., Jr.; Swiontek, J. Geophysical characterization of the Keene Valley landslide in New York state. J. Environ. Eng. Geophys. 2014, 19, 139–155. [Google Scholar] [CrossRef] [Scilit]
  13. Shroder, J.F. Landslide Hazards, Risks, and Disasters; Elsevier: Amsterdam, The Netherlands, 2021. [Google Scholar]
  14. Berg, R.C.; Faulds, J.E. (Eds.) Economic Analysis of the Costs and Benefits of Geological Mapping in the United States of America from 1994 to 2019; American Geosciences Institute: Alexandria, VA, USA, 2025. [Google Scholar] [CrossRef] [Scilit]
  15. Benn, D.; Evans, D.J.A. Glaciers and Glaciation, 2nd ed.; Routledge: Abingdon, UK, 2010. [Google Scholar] [CrossRef] [Scilit]
  16. Carrivick, J.L.; Tweed, F.S. Proglacial lakes: Character, behavior and geological importance. Quat. Sci. Rev. 2013, 78, 34–52. [Google Scholar] [CrossRef] [Scilit]
  17. Kehew, A.E.; Lord, M.L. Origin and large-scale erosional features of glacial-lake spillways in the northern Great Plains. Geol. Soc. Am. Bull. 1986, 97, 162–177. [Google Scholar] [CrossRef] [Scilit]
  18. Clayton, L.; Attig, J.W.; Mickelson, D.M. Tunnel channels formed in Wisconsin during the last glaciation. In Glacial Processes Past and Present; Geological Society of America Special Paper; Mickelson, D.M., Attig, J.W., Eds.; Geological Society of America: Boulder, CO, USA, 1999; Volume 337, pp. 69–82. Available online: https://pubs.geoscienceworld.org/gsa/books/edited-volume/488/Glacial-Processes-Past-and-Present (accessed on 10 December 2025).
  19. Kozlowski, A.L.; Kehew, A.E.; Bird, B.C. Outburst flood origin of the central Kalamazoo River valley, Michigan, USA. Quat. Sci. Rev. 2005, 24, 2354–2374. [Google Scholar] [CrossRef] [Scilit]
  20. Kehew, A.E.; Lord, M.L.; Kozlowski, A.L.; Fisher, T.G. 7 Proglacial megaflooding along the margins of the Laurentide Ice Sheet. In Megaflooding on Earth and Mars; Cambridge University Press: Cambridge, UK, 2009; p. 104. [Google Scholar]
  21. Teller, J.T.; Kehew, A.E. Introduction to the late glacial history of large proglacial lakes and meltwater runoff along the Laurentide Ice Sheet. Quat. Sci. Rev. 1994, 13, 795–799. [Google Scholar] [CrossRef] [Scilit]
  22. Lønne, I. Sedimentary facies and depositional architecture of ice-contact glaciomarine systems. Sediment. Geol. 1995, 98, 13–43. [Google Scholar] [CrossRef] [Scilit]
  23. Lønne, I.; Nemec, W. High-arctic fan delta recording deglaciation and environment disequilibrium. Sedimentology 2004, 51, 553–589. [Google Scholar] [CrossRef] [Scilit]
  24. Dietrich, P.; Ghienne, J.F.; Normandeau, A.; Lajeunesse, P. Reconstructing ice-margin retreat using delta morphostratigraphy. Sci. Rep. 2017, 7, 16936. [Google Scholar] [CrossRef] [Scilit] [PubMed]
  25. Gobo, K.; Ghinassi, M.; Nemec, W. Gilbert-type deltas recording short-term base-level changes: Delta-brink morphodynamics and related foreset facies. Sedimentology 2015, 62, 1923–1949. [Google Scholar] [CrossRef] [Scilit]
  26. Nutz, A.; Ghienne, J.F.; Schuster, M.; Dietrich, P.; Roquin, C.; Hay, M.B.; Bouchette, F.; Cousineau, P.A. Forced regressive deposits of a deglaciation sequence: Example from the Late Quaternary succession in the Lake Saint-Jean basin (Québec, Canada). Sedimentology 2015, 62, 1573–1610. [Google Scholar] [CrossRef] [Scilit]
  27. Levy, J.S.; Rittenour, T.M.; Fountain, A.G.; O’Connor, J.E. Luminescence dating of paleolake deltas and glacial deposits in Garwood Valley, Antarctica: Implications for climate, Ross ice sheet dynamics, and paleolake duration. Bulletin 2017, 129, 1071–1084. [Google Scholar]
  28. Schaetzl, R.J.; Lepper, K.; Thomas, S.E.; Grove, L.; Treiber, E.; Farmer, A.; Fillmore, A.; Lee, J.; Dickerson, B.; Alme, K. Kame deltas provide evidence for a new glacial lake and suggest early glacial retreat from central Lower Michigan, USA. Geomorphology 2017, 280, 167–178. [Google Scholar] [CrossRef] [Scilit]
  29. Schaetzl, R.J.; Lepper, K.; Kincare, K.; Lusch, D.; Baish, C.J.; Lowell, T.; Esch, J.; Curry, B.B.; Post, A.; Gugel, R.; et al. Dynamics (40-17 ka) of the Mackinac Lobe of the Laurentide Ice Sheet in the Houghton Lake Basin, Michigan, USA. Quat. Res. 2026; in review.
  30. Lang, J.; Lauer, T.; Winsemann, J. New age constraints for the Saalian glaciation in northern central Europe: Implications for the extent of ice sheets and related proglacial lake systems. Quat. Sci. Rev. 2018, 180, 240–259. [Google Scholar] [CrossRef] [Scilit]
  31. Chamberlain, E.L.; Wallinga, J. Seeking enlightenment of fluvial sediment pathways by optically stimulated luminescence signal bleaching of river sediments and deltaic deposits. Earth Surf. Dyn. 2019, 7, 723–736. [Google Scholar] [CrossRef] [Scilit]
  32. Gao, L.; Long, H.; Zhang, P.; Tamura, T.; Feng, W.; Mei, Q. The sedimentary evolution of Yangtze River delta since MIS3: A new chronology evidence revealed by OSL dating. Quat. Geochronol. 2019, 49, 153–158. [Google Scholar] [CrossRef] [Scilit]
  33. Reheis, M.C.; Caskey, J.; Bright, J.; Paces, J.B.; Mahan, S.; Wan, E. Pleistocene lakes and paleohydrologic environments of the Tecopa basin, California: Constraints on the drainage integration of the Amargosa River. Bulletin 2020, 132, 1537–1565. [Google Scholar]
  34. Fisher, T.G.; Dziekan, M.R.; McDonald, J.; Lepper, K.; Loope, H.M.; McCarthy, F.M.; Curry, B.B. Minimum limiting deglacial ages for the out-of-phase Saginaw Lobe of the Laurentide Ice Sheet using optically stimulated luminescence (OSL) and radiocarbon methods. Quat. Res. 2020, 97, 71–87. [Google Scholar] [CrossRef] [Scilit]
  35. Rich, J.L. Glacial Geology of the Catskills; New York State Museum Bulletin; New York State Education Department: Albany, NY, USA, 1935; Volume 299, 180p.
  36. LaFleur, R.G. Trip 5, Glacial geology of the Schoharie valley. In New England Intercollegiate Geological Conference, 61st Annual Meeting, Guidebook for Field Trips in New York, Massachusetts, and Vermont; University of New Hampshire: Durham, NH, USA, 1969; pp. 1–20. [Google Scholar]
  37. Cadwell, D.H. Late Wisconsinan stratigraphy of the Catskill Mountains. In The Wisconsinan Stage of the First Geological District, Eastern New York; New York State Museum: Albany, NY, USA, 1986; pp. 73–88. [Google Scholar]
  38. Ridge, J.C. The last deglaciation of the northeastern United States: A combined varve, paleomagnetic, and calibrated 14C chronology. In Geoarcheology of Landscapes in the Glaciated Northeast; New York State Museum Bulletin; New York State Education Department: Albany, NY, USA, 2003; Volume 497. [Google Scholar]
  39. Chamberlin, T.C. Preliminary Paper on the Terminal Moraine of the Second Glacial Epoch; U.S. Geological Survey Annual Report 3; U.S. Government Printing Office: Washington, DC, USA, 1883; pp. 291–402.
  40. Spencer, J.W.W. Origins of the basins of the Great Lakes of America. Geol. Soc. Lond. Q. J. 1890, 46, 523–533. [Google Scholar] [CrossRef] [Scilit]
  41. Upham, W.E. The Fiords and Great Lake basins of North America considered as evidence of preglacial continental elevation and of depression during the glacial period. Geol. Soc. Am. Bull. 1890, 1, 563–567. [Google Scholar]
  42. Tarr, R.S. Moraines of the Seneca and Cayuga Lake Valleys. Geol. Soc. Am. Bull. 1905, 16, 215–228. [Google Scholar] [CrossRef] [Scilit]
  43. Woodworth, J.B. Ancient Water Levels of the Champlain and Hudson Valleys; New York State Museum Bulletin; New York State Education Department: Albany, NY, USA, 1905; Volume 84, pp. 65–265.
  44. Brigham, A.P. Mohawk glacial lobe. Geol. Soc. Am. Bull. 1911, 22, 725–726. [Google Scholar]
  45. Leverett, F.; Taylor, F.B. The Pleistocene of Indiana and Michigan, and the History of the Great Lakes; U.S. Geological Survey Monograph; US Government Printing Office: Washington, DC, USA, 1915; Volume 53, 529p.
  46. Sirkin, L.; Stuckenrath, R. The Portwashingtonian warm interval in the northern Atlantic coastal plain. Geol. Soc. Am. Bull. 1980, 91, 332–336. [Google Scholar] [CrossRef] [Scilit]
  47. Muller, E.H.; Calkin, P.E. Timing of Pleistocene glacial events in New York state. Can. J. Earth Sci. 1993, 30, 1829–1845. [Google Scholar] [CrossRef] [Scilit]
  48. Peteet, D.M.; Beh, M.; Orr, C.; Kurdyla, D.; Nichols, J.; Guilderson, T. Delayed deglaciation or extreme Arctic conditions 21-16 cal. kyr at southeastern Laurentide Ice Sheet margin? Geophys. Res. Lett. 2012, 39, L11706. [Google Scholar] [CrossRef] [Scilit]
  49. Schuldenrein, J.; Aiuvalasit, M. Urban geoarchaeology and sustainability: A case study from Manhattan Island, New York City, USA. Geol. Soc. Am. Spec. Pap. 2011, 476, 153–172. [Google Scholar]
  50. Corbett, L.B.; Bierman, P.R.; Stone, B.D.; Caffee, M.W.; Larsen, P.L. Cosmogenic nuclide age estimate for Laurentide Ice Sheet recession from the terminal moraine, New Jersey, USA, and constraints on latest Pleistocene ice sheet history. Quat. Res. 2017, 87, 482–498. [Google Scholar] [CrossRef] [Scilit]
  51. Gorokhovich, Y.; Nelson, M.; Eaton, T.; Wolk-Stanley, J.; Sen, G. Geochronology and geomorphology of the Jones Point glacial landform in Lower Hudson Valley (New York): Insight into deglaciation processes since the Last Glacial Maximum. Geomorphology 2018, 321, 87–102. [Google Scholar] [CrossRef] [Scilit]
  52. Balter-Kennedy, A.; Schaefer, J.M.; Balco, G.; Kelly, M.A.; Kaplan, M.R.; Schwartz, R.; Oakley, B.; Young, N.E.; Hanley, J.; Varuolo-Clarke, A.M. The Laurentide Ice Sheet in southern New England and New York during and at the end of the Last Glacial Maximum: A cosmogenic-nuclide chronology. Clim. Past. 2024, 20, 2167–2190. [Google Scholar] [CrossRef] [Scilit]
  53. MacClintock, P.; Apfel, E.T. Correlation of the drifts of the Salamanca re-entrant, New York. Bull. Geol. Soc. Am. 1944, 55, 1143–1164. [Google Scholar] [CrossRef] [Scilit]
  54. Moss, J.H.; Ritter, D.F. New evidence regarding the Binghamton substage in the region between the Finger Lakes and Catskills, New York. Am. J. Sci. 1962, 260, 81–106. [Google Scholar] [CrossRef] [Scilit]
  55. Crowl, G.H.; Sevon, W.D. Glacial Border Deposits of Late Wisconsinan Age in Northeastern Pennsylvania; General Geology Report; Pennsylvania Geological Survey: Harrisburg, PA, USA, 1980.
  56. Braun, D.D. The glaciation of Pennsylvania, USA. In Developments in Quaternary Sciences; Elsevier: Amsterdam, The Netherlands, 2011; Volume 15, pp. 521–529. [Google Scholar]
  57. Kirkland, J.T. Deglaciation events in the western Catskill Mountains, New York. Geol. Soc. Am. Bull. 1979, 90, 521–524. [Google Scholar] [CrossRef] [Scilit]
  58. Ozsvath, D.L. Glacial Geomorphology and Late Wisconsinan Deglaciation of the Western Catskill Mountains, New York. Doctoral Dissertation, State University of New York at Binghamton, Vestal, NY, USA, 1985. [Google Scholar]
  59. Cadwell, D.H. Late Wisconsinan Deglaciation Chronology of the Chenango River Valley and Vicinity, New York. Doctoral Dissertation, State University of New York at Binghamton, Vestal, NY, USA, 1972. [Google Scholar]
  60. Reimer, P.; Austin, W.E.N.; Bard, E.; Bayliss, A.; Blackwell, P.G.; Bronk Ramsey, C.; Butzin, M.; Cheng, H.; Edwards, R.L.; Friedrich, M.; et al. The IntCal20 Northern Hemisphere radiocarbon age calibration curve (0-55 cal kBP). Radiocarbon 2020, 62, 725–757. [Google Scholar] [CrossRef] [Scilit]
  61. Karrow, P.F.; Bloom, A.L.; Haas, J.N.; Heiss, A.G.; McAndrews, J.H.; Miller, B.B.; Morgan, A.V.; Seymour, K.L. The Fernbank interglacial site near Ithaca, New York, USA. Quat. Res. 2009, 72, 132–142. [Google Scholar] [CrossRef] [Scilit]
  62. Karig, D.E.; Miller, N.G. Middle Wisconsin glacial advance into the Appalachian Plateau, Sixmile Creek, Tompkins Co., NY. Quat. Res. 2013, 80, 522–533. [Google Scholar] [CrossRef] [Scilit]
  63. Kozlowski, A.L.; Bird, B.C.; Lowell, T.V.; Smith, C.A.; Feranec, R.S.; Graham, B.L. Minimum age of the Mapleton, Tully, and Labrador Hollow moraines indicates correlation with the Port Huron Phase in central New York State. In Quaternary Glaciation of the Great Lakes Region: Process, Landforms, Sediments, and Chronology; Geological Society of America: Boulder, CO, USA, 2018; Volume 530, p. 191. [Google Scholar]
  64. Kozlowski, A.; Bird, B.; Leone, J.; Graham, B. Surficial Geology of the Union Springs Quadrangle, Cayuga County, New York. Map & Chart Series 88. 2016. Available online: https://nysm.nysed.gov/sites/default/files/mc88_unionsprings.pdf (accessed on 8 December 2025).
  65. Kozlowski, A.; Bird, B.; Mahan, S.; Leone, J.; Backhaus, K.; Graham, B. Subsurface Geology of the Great Gully Buried Valley System, Cayuga County, New York. Map and Chart Series #105. 2019. Available online: https://nysm.nysed.gov/sites/default/files/2026-02/MC105_SubsurfaceGreattGully.pdf (accessed on 8 December 2025).
  66. Kozlowski, A.; Backhaus, K.; Leone, J. Glacial Stratigraphic Framework of the Cayuga Inlet Valley and Ithaca Delta Plain: Ithaca West Quadrangle, Town of Ithaca, Tompkins County, New York. 2020. Available online: https://nysm.nysed.gov/sites/default/files/mc132_cayinletstrat.pdf (accessed on 9 December 2025).
  67. Hall, J. On the geology of the southern counties of New York and adjoining parts of Pennsylvania, especially with reference to the age and structure of the Catskill mountain range. Am. Assoc. Adv. Sci. Proc. 1875, 24, 80–84. [Google Scholar]
  68. Guyot, A. On the physical structure and hypsometry of the Catskill Mountain region. Am. J. Sci. 1880, 3, 429–451. [Google Scholar] [CrossRef] [Scilit]
  69. Darton, N.H. Examples of stream-robbing in the Catskill Mountains. Bull. Geol. Soc. Am. 1896, 7, 505–507. [Google Scholar]
  70. Rayburn, J.A.; De Simone, D.J.; Staley, A.E.; Mahan, S.A.; Stone, B.D. Age of an Ice Dammed Lake on the Lee Side of the Catskill Mountains, New York, and Rough Estimates for the Rate of Ice Advance to the Last Glacial Maximum. Geological Society of America Meeting Abstract (Paper No. 283-12). Geological Society of America Abstracts with Programs. Vol. 47, No. 7, p.713. 2015. Available online: https://gsa.confex.com/gsa/2015AM/webprogram/Paper268684.html (accessed on 9 January 2026).
  71. Ruedemann, R. Development of drainage of Catskills. Am. J. Sci. 1932, 5, 337–349. [Google Scholar] [CrossRef] [Scilit]
  72. Brigham, A.P. Mohawk Glacial Lobe and Moraine; New York State Museum Bulletin; New York State Education Department: Albany, NY, USA, 1910; Volume 121, p. 18.
  73. Rich, J.L. Divergent ice flow on the plateau northeast of the Catskill Mountains as revealed by ice-molded topography. Geol. Soc. Am. Bull. 1914, 25, 68–70. [Google Scholar]
  74. Dineen, R.J. Deglaciation of the Hudson Valley between Hyde Park and Albany, New York. In The Wisconsinan Stage of the First Geological District, Eastern New York, Albany; New York State Museum Bulletin; New York State Education Department: Albany, NY, USA, 1986; Volume 455, pp. 89–108. [Google Scholar]
  75. Kozlowski, A.L.; Backhaus, K.J.; Leone, J.R.; Frieman, R.A.; Grasing, S.P.; Bird, B.C.; Forgeng, H.M. Surficial Geology of Albany County, New York. New York State Museum Map & Chart Series # 164. N. Y. State Geol. Surv. 2026; in press.
  76. Kozlowski, A.L.; Backhaus, K.J.; Frieman, R.A. Surficial Geology of the Livingstonville 7.5-Minute Quadrangle, Albany, Greene and Schoharie Counties, New York. New York State Museum Map & Chart Series #159. 2024. Available online: https://www.nysm.nysed.gov/sites/default/files/mc159_livingstonville.pdf (accessed on 7 November 2025).
  77. Halsted, C.T.; Bierman, P.R.; Shakun, J.D.; Davis, P.T.; Corbett, L.B.; Drebber, J.S.; Ridge, J.C. A critical re-analysis of constraints on the timing and rate of Laurentide Ice Sheet recession in the northeastern United States. J. Quat. Sci. 2024, 39, 54–69. [Google Scholar]
  78. Cadwell, D.H.; Dineen, R.J. Surficial Geologic Map of New York-Hudson-Mohawk Sheet; Scale 1:250,000, New York State Museum-Geological Survey Map and Chart Series # 40; New York State Museum (NYSM): Albany, NY, USA, 1987.
  79. Cadwell, D.H. Surficial Geologic Map of New York-Lower Hudson Sheet; Scale 1: 250,000, New York State Museum-Geological Survey Map and Chart Series # 40; New York State Museum (NYSM): Albany, NY, USA, 1989.
  80. Connally, G.G.; Sirkin, L.A. Woodfordian ice margins, recessional events, and pollen stratigraphy of the mid-Hudson Valley. In The Wisconsinan Stage of the First Geological District, Eastern New York; University of the State of New York, State Education Department: New York, NY, USA, 1986; Volume 455, pp. 50–72. [Google Scholar]
  81. Ridge, J.C. The Quaternary glaciation of western New England with correlations to surrounding areas. In Developments in Quaternary Sciences; Elsevier: Amsterdam, The Netherlands, 2004; Volume 2, pp. 169–199. [Google Scholar]
  82. Connally, G.G.; Sirkin, L.A. Wisconsinan History of the Hudson-Champlain Lobe. Geol. Soc. Am. Mem. 1973, 136, 47–69. [Google Scholar] [CrossRef] [Scilit]
  83. Gilmore, R.C.; Madau, P.; Primack, J.R.; Somerville, R.S. Modeling Gamma-Ray Attenuation in High Redshift GeV Spectra. In AIP Conference Proceedings; American Institute of Physics: College Park, MD, USA, 2008; Volume 1085, pp. 577–580. [Google Scholar]
  84. Postma, G.; Roep, T.B. Resedimented conglomerates in the bottomsets of Gilbert-type gravel deltas. J. Sediment. Res. 1985, 55, 874–885. [Google Scholar] [CrossRef] [Scilit]
  85. Postma, G.; Nemec, W.; Kleinspehn, K.L. Large floating clasts in turbidites: A mechanism for their emplacement. Sediment. Geol. 1988, 58, 47–61. [Google Scholar] [CrossRef] [Scilit]
  86. Nemec, W. Aspects of sediment movement on steep delta slopes. In Coarse-Grained Deltas; Colella, A., Prior, B.D., Eds.; International Association of Sedimentologists Special Publication: Oxford, UK, 1990; Volume 10, pp. 29–73. [Google Scholar]
  87. Mueller, P.; Tamburelli, S.; Menegoni, N.; Perozzo, M.; Amadori, C.; Crispini, L.; Federico, L.; Seno, S.; Maino, M. Concurrence of load-and-flame structures, balls-and-pillows, clastic injectites and shear deformation bands as indicator of seismicity in mixed siliciclastic-carbonate successions (Finale Ligure Basin, Italy). Mar. Pet. Geol. 2023, 155, 106345. [Google Scholar] [CrossRef] [Scilit]
  88. Jiang, B.; He, Y.; Ouyang, W.; Li, Z.; Cao, Z. Morphological characteristics and formation conditions of braided rivers over gentle and steep slopes in the Tibetan Plateau. Catena 2025, 250, 108717. [Google Scholar] [CrossRef] [Scilit]
  89. Bridge, J.S.; Lunt, I.A. Depositional Models of Braided Rivers. In Special Publication 36: International Association of Sedimentologists; Blackwell Publishing: Oxford, UK, 2006; Volume. 36, pp. 11–50. [Google Scholar]
  90. Gao, P.; Li, Z.; You, Y.; Zhou, Y.; Piégay, H. Assessing functional characteristics of a braided river in the Qinghai-Tibet Plateau, China. Geomorphology 2022, 403, 108180. [Google Scholar] [CrossRef] [Scilit]
  91. Cheetham, G.H. Flow competence in relation to stream channel form and braiding. Geol. Soc. Am. Bull. 1979, 90, 877–886. [Google Scholar] [CrossRef] [Scilit]
  92. Maizels, J.K. Proglacial Aggradation and Changes in Braided Channel Patterns During a Period of Glacier Advance: An Alpine Example. Geogr. Ann. Ser. A Phys. Geogr. 1979, 61, 87–101. [Google Scholar] [CrossRef] [Scilit]
  93. Kavan, J.; Strzelecki, M.C.; Benn, D.I.; Luckman, A.; Roman, M.; Zagórski, P. Glacier surge as a trigger for the fastest delta growth in the Arctic. Commun. Earth Environ. 2024, 5, 700. [Google Scholar] [CrossRef] [Scilit]
  94. Gilbert, G.K. The Topographic Features of Lake Shores; U.S. Geological Survey: Washington, DC, USA; US Government Printing Office: Washington, DC, USA, 1885; Volume 5, pp. 104–108.
  95. Longhitano, S.G. Sedimentary facies and sequence stratigraphy of coarse-grained Gilbert-type deltas within the Pliocene thrust-top Potenza Basin (Southern Apennines, Italy). Sediment. Geol. 2008, 210, 87–110. [Google Scholar] [CrossRef] [Scilit]
  96. Martini, I.; Ambrosetti, E.; Sandrelli, F. The role of sediment supply in large-scale stratigraphic architecture of ancient Gilbert-type deltas (Pliocene Siena-Radicofani Basin, Italy). Sediment. Geol. 2017, 350, 23–41. [Google Scholar] [CrossRef] [Scilit]
  97. Winsemann, J.; Lang, J.; Polom, U.; Loewer, M.; Igel, J.; Pollok, L.; Brandes, C. Ice-marginal forced regressive deltas in glacial lake basins: Geomorphology, facies variability and large-scale depositional architecture. Boreas 2018, 47, 973–1002. [Google Scholar] [CrossRef] [Scilit]
  98. Budai, S.; Colombera, L.; Mountney, N.P. Quantitative characterization of the sedimentary architecture of Gilbert-type deltas. Sediment. Geol. 2021, 426, e106022. [Google Scholar] [CrossRef] [Scilit]
  99. Powell, R.D. Glacimarine processes at grounding-line fans and their growth to ice-contact deltas. In Glacimarine Environments: Processes and Sediment; Special Publications 53; Dowdeswell, J.A., Scourse, J.D., Eds.; Geological Society: London, UK, 1990; pp. 53–73. [Google Scholar]
  100. Benn, D.I. Subglacial and subaqueous processes near a glacier grounding line: Sedimentological evidence from a former ice-dammed lake, Achnasheen Scotland. Boreas 1996, 25, 23–36. [Google Scholar] [CrossRef] [Scilit]
  101. Hunter, L.E.; Powell, R.D.; Smith, G.W. Facies architecture and grounding-line fan processes of morainal banks during the deglaciation of coastal Maine. Geol. Soc. Am. Bull. 1996, 108, 1022–1038. [Google Scholar] [CrossRef] [Scilit]
  102. Goldring, W. The oldest known petrified forest. Sci. Mon. 1927, 24, 514–529. [Google Scholar]
  103. Stein, W.E.; Mannolini, F.; Hernick, L.V.; Landing, E.; Berry, C.M. Giant cladoxylopsid trees resolve the enigma of the Earth’s earliest forest stumps at Gilboa. Nature 2007, 446, 904–907. [Google Scholar] [CrossRef] [Scilit] [PubMed]
  104. Bates, C.C. Rational theory of delta formation. AAPG Bull. 1953, 37, 2119–2162. [Google Scholar] [CrossRef] [Scilit]
  105. Patruno, S.; Helland-Hansen, W. Clinoforms and clinoform systems: Review and dynamic classification scheme for shorelines, subaqueous deltas, shelf edges and continental margins. Earth-Sci. Rev. 2018, 185, 202–233. [Google Scholar] [CrossRef] [Scilit]
  106. Koteff, C.; Larsen, F.D. Postglacial Uplift in Western New England: Geologic Evidence for Delayed Rebound. In Earthquakes at North-Atlantic Passive Margins: Neotectonics and Postglacial Rebound; Springer: Dordrecht, The Netherlands, 1989; pp. 105–123. [Google Scholar]
  107. Hooke, R.L.; Ridge, J.C. Glacial lake deltas in New England record continuous, not delayed, postglacial rebound. Quat. Res. 2016, 85, 399–408. [Google Scholar] [CrossRef] [Scilit]
  108. Postma, G. Sea-level-related architectural trends in coarse-grained delta complexes. Sediment. Geol. 1995, 98, 3–12. [Google Scholar] [CrossRef] [Scilit]
  109. Fleisher, P.J. Glacial Geology and Late Wisconsinan Stratigraphy, Upper Susquehanna Drainage Basin, New York; New York State Museum Bulletin; New York State Education Department: Albany, NY, USA, 1986; Volume 455, pp. 121–142.
  110. Powell, R.D.; Cooper, J.M. A glacial sequence stratigraphic model for temperate, glaciated continental shelves. In Glacier-Influenced Sedimentation on High-Latitude Continental Margins; Geological Society of London: London, UK, 2002; Volume 203, p. 215. [Google Scholar]
  111. Fiore, J.; Girardclos, S.; Pugin, A.; Gorin, G.; Wildi, W. Würmian deglaciation of western Lake Geneva (Switzerland) based on seismic stratigraphy. Quat. Sci. Rev. 2011, 30, 377–393. [Google Scholar] [CrossRef] [Scilit]
  112. Dietrich, P.; Ghienne, J.F.; Lajeunesse, P.; Normandeau, A.; Deschamps, R.; Razin, P. Deglacial sequences and glacio-isostatic adjustment: Quaternary compared with Ordovician glaciations. Geol. Soc. Lond. Spec. Publ. 2019, 475, 149–179. [Google Scholar]
  113. Mahan, S.A.; Rittenour, T.M.; Nelson, M.S.; Ataee, N.; Brown, N.; DeWitt, R.; Durcan, J.; Evans, M.; Feathers, J.; Frouin, M.; et al. Guide for interpreting and reporting luminescence dating results. Bulletin 2024, 135, 1480–1502. [Google Scholar]
  114. Halsted, C.T.; Bierman, P.R.; Shakun, J.D.; Davis, P.T.; Corbett, L.B.; Caffee, M.W.; Hodgdon, T.S.; Licciardi, J.M. Rapid southeastern Laurentide Ice Sheet thinning during the last deglaciation revealed by elevation profiles of in situ cosmogenic 10Be. Geol. Soc. Am. Bull. 2023, 135, 2075–2087. [Google Scholar]
  115. Siegert, M.J. Antarctic subglacial lakes. Earth-Sci. Rev. 2000, 50, 29–50. [Google Scholar] [CrossRef] [Scilit]
  116. Livingstone, S.J.; Utting, D.J.; Ruffell, A.; Clark, C.D.; Pawley, S.; Atkinson, N.; Fowler, A.C. Discovery of relict subglacial lakes and their geometry and mechanism of drainage. Nat. Commun. 2016, 7, ncomms11767. [Google Scholar] [CrossRef] [Scilit] [PubMed]
  117. Livingstone, S.J.; Li, Y.; Rutishauser, A.; Sanderson, R.J.; Winter, K.; Mikucki, J.A.; Björnsson, H.; Bowling, J.S.; Chu, W.; Dow, C.F.; et al. Subglacial lakes and their changing role in a warming climate. Nat. Rev. Earth Environ. 2022, 3, 106–124. [Google Scholar] [CrossRef] [Scilit]
  118. Kehew, A.E.; Nicks, L.P.; Straw, W.T. Palimpsest tunnel valleys: Evidence for relative timing of advances in an interlobate area of the Laurentide ice sheet. Ann. Glaciol. 1999, 28, 47–52. [Google Scholar] [CrossRef] [Scilit]
  119. Kehew, A.E.; Esch, J.M.; Kozlowski, A.L.; Ewald, S.K. Glacial landsystems and dynamics of the Saginaw Lobe of the Laurentide Ice Sheet, Michigan, USA. Quat. Int. 2012, 260, 21–31. [Google Scholar] [CrossRef] [Scilit]
  120. Curry, B.B.; Kehew, A.E.; Antinao, J.L.; Esch, J.; Huot, S.; Caron, O.J.; Thomason, J.F. Deglacial Kankakee Torrent, source to sink. In Untangling the Quaternary Period—A Legacy of Stephen C. Porter; Geological Society of America: Boulder, CO, USA, 2021; pp. 317–332. [Google Scholar]
  121. Erber, N.R.; Kehew, A.E.; Schaetzl, R.J.; Gillespie, R.; Sultan, M.E.; Esch, J.; Yellich, J.; Curry, B.B.; Huot, S.; Abotalib, A.Z. Revisiting the timing of Saginaw lobe ice retreat and implications for drainage adjustments across southern Michigan, USA. Catena 2023, 233, 107510. [Google Scholar] [CrossRef] [Scilit]
  122. Schaetzl, R.J.; Forman, S.L. OSL ages on glaciofluvial sediment in northern Lower Michigan constrain expansion of the Laurentide ice sheet. Quat. Res. 2008, 70, 81–90. [Google Scholar] [CrossRef] [Scilit]
  123. Brooks, C.; Hart, S.R.; Wendt, I. Realistic use of two-error regression treatments as applied to rubidium-strontium data. Rev. Geophys. 1972, 10, 551–577. [Google Scholar] [CrossRef] [Scilit]
  124. Durcan, J.A.; Duller, G.A.T. The fast ratio: A rapid measure for testing the dominance of the fast component in the initial OSL signal from quartz. Radiat. Meas. 2011, 46, 1065–1072. [Google Scholar] [CrossRef] [Scilit]
  125. Galbraith, R.F.; Roberts, R.G.; Laslett, G.M.; Yoshida, H.; Olley, J.M. Optical dating of single and multiple grains of quartz from Jinmium rock shelter, northern Australia: Part I, experimental design and statistical models. Archaeometry 1999, 41, 339–364. [Google Scholar] [CrossRef] [Scilit]
  126. Gilmore, G.R. Practical Gamma-Ray Spectrometry, 2nd ed.; John Wiley & Sons, Ltd.: Hoboken, NJ, USA, 2008. [Google Scholar]
  127. Guérin, G.; Mercier, N.; Adamiec, G. Dose-rate conversion factors: Update. Anc. TL 2011, 29, 5–8. [Google Scholar] [CrossRef] [Scilit]
  128. Ludwig, K.R. Mathematical-Statistical Treatment of Data and Errors for Th-230/U Geochronology; Bourdon, B., Henderson, G.M., Lundstrom, C.C., Turner, S.P., Eds.; Uranium-Series Geochemistry; Mineralogical Society of America: Chantilly, VA, USA, 2003; pp. 631–656. [Google Scholar]
  129. Murray, A.S.; Wintle, A.G. Luminescence dating of quartz using an improved single-aliquot regenerative-dose protocol. Radiat. Meas. 2000, 32, 57–73. [Google Scholar] [CrossRef] [Scilit]
  130. Murray, A.S.; Wintle, A.G. The single aliquot regenerative dose protocol: Potential for improvements in reliability. Radiat. Meas. 2003, 37, 377–381. [Google Scholar] [CrossRef] [Scilit]
  131. Nathan, R.P. Numerical Modelling of Environmental Dose Rate and Its Application to Trapped-Charge Dating; Social Sciences Division, University of Oxford: Oxford, UK; School of Archaeology, St. Hugh’s College, University of Oxford: Oxford, UK, 2011; p. 207. [Google Scholar]
  132. Vandenberghe, D.; De Corte, F.; Buylaert, J.P.; Kučera, J.; Van den Haute, P. On the internal radioactivity in quartz. Radiat. Meas. 2008, 43, 771–775. [Google Scholar] [CrossRef] [Scilit]
  133. Wintle, A.G.; Murray, A.S. A review of quartz optically stimulated luminescence characteristics and their relevance in single-aliquot regeneration dating protocols. Radiat. Meas. 2006, 41, 369–391. [Google Scholar] [CrossRef] [Scilit]
  134. Zimmerman, J. The radiation-induced increase of the 100 °C thermoluminescence sensitivity of fired quartz. J. Phys. C Solid State Phys. 1971, 4, 3265–3276. [Google Scholar] [CrossRef] [Scilit]
  135. Coates, D.R. General geology of south-central New York. In Geology of South-Central New York; N.Y. State Geology Association Guidebook to Field Trips, 35th Annual Meeting; Coates, D.R., Ed.; SUNY at Binghamton: Binghamton, NY, USA, 1963; pp. 19–57. [Google Scholar]
  136. Denny, C.S. Wisconsin drifts in the Elmira region, New York, and their possible equivalents in New England. Am. J. Sci. 1956, 254, 82–95. [Google Scholar] [CrossRef] [Scilit]
  137. Flint, R.F. Probable Wisconsin substages and late-Wisconsin events in northeastern United States and southeastern Canada. Geol. Soc. Am. Bull. 1953, 64, 897–920. [Google Scholar] [CrossRef] [Scilit]
  138. Kirkland, J.T. Glacial Geology of the Western Catskills. Doctoral Dissertation, State University of New York at Binghamton, Binghamton, NY, USA, 1973. [Google Scholar]
  139. Muller, E.H. Quaternary Geology of New York, Niagara Sheet. In New York State Museum and Science Service Map and Chart Series # 28; New York State Education Department: Albany, NY, USA, 1977. [Google Scholar]
  140. Muller, E.H.; Cadwell, D.H. Surficial Geologic Map of New York-Hudson-Finger Lakes Sheet. In Scale 1:250,000; New York State Museum-Geological Survey Map and Chart Series # 40; U.S. Geological Survey: Reston, VA, USA, 1986. [Google Scholar]
  141. Szabo, J.P. Reevaluation of early Wisconsinan stratigraphy of northern Ohio. The Last Interglacial-Glacial Transition in North America. In Geological Society of America Special Paper; Geological Society of America: Boulder, CO, USA, 1992; Volume 270, p. 99. [Google Scholar]
  142. Szabo, J.P.; Totten, S.M. Multiple pre-Wisconsinan glaciations along the northwestern edge of the Allegheny Plateau in Ohio and Pennsylvania. Can. J. Earth Sci. 1995, 32, 2081–2089. [Google Scholar] [CrossRef] [Scilit]
Figure 1. Map location of study area and geographic extent of glacial Lake Grand Gorge (GG) and glacial Lake Broome Center (BC) in the Schoharie Valley in the northern Catskill Mountains of New York State. Blue dashed lines represent segments of selected, mapped ice margin positions. The terminal moraine (TM) represents the last glacial maximum (MIS 2); the Rosendale (RO), Middleburgh (MB), and Valley Heads (VH) ice margins are shown in central and eastern New York. Figure adapted from [38].
Quaternary 09 00046 g001
Figure 2. LiDAR terrain elevation model of northern Catskill Mountains and Hudson Valley region discussed in text. Northeastern escarpment (NECM) and central escarpment (CECM) of Catskill Mountains displayed. Location and extent of glacial Lakes Grand Gorge (488 m) and Broome Center (592 m) appears as dark gray shading. Drainage of glacial lakes occured through the outlet at Grand Gorge (blue arrow) into the East Branch of the Delaware River.
Quaternary 09 00046 g002
Figure 3. LiDAR terrain elevation model along the NECM in eastern New York state. Major landforms discussed and figure locations are labeled. Topographic profiles of glacial passes appear in Supplementary Materials.
Quaternary 09 00046 g003
Figure 4. LiDAR terrain and topographic profile of Site 1 Platter Kill Delta. Note braided pattern on surface northeast of quarry and hummocky kettles. Topographic profile (A-A’) displays gradation of outwash surface to 488 m level of glacial Lake Grand Gorge. See Figure 3 for regional context.
Quaternary 09 00046 g004
Figure 5. Basic stratigraphic column displaying the three principal geologic units exposed within the Platter Kill Sand and Gravel quarry. OSL ages of sediment samples are displayed with dashed lines to sample location.
Quaternary 09 00046 g005
Figure 6. Upper photograph (A) displays ripple bottomset beds of fine–medium sand in Platter Kill Delta deposited into glacial Lake Grand Gorge near Gilboa, NY. Lower photograph (B) shows sedimentological details of ripple bottomset beds and location of OSL sample ISGS # 991-Gilboa-OSL-2.
Quaternary 09 00046 g006
Figure 7. Oversized cobbles and gravels deposited in bottomset sediments (Unit 3) at Platter Kill Sand and Gravel quarry. Clasts may have been ice-rafted into glacial Lake Grand Gorge.
Quaternary 09 00046 g007
Figure 8. Turbidite deposited onto ripple bottomsets (Unit 3) in the Platter Kill Delta near Gilboa, NY. GPS unit at base of sand beds is 16 cm tall for scale.
Quaternary 09 00046 g008
Figure 9. Turbidite in bottom of Platter Kill Quarry near Gilboa, NY. Turbidite likely originated as high-energy meltwater or mass-wasting debris pulse discharged into glacial Lake Grand Gorge before being deposited onto well-sorted rippled sand bottomsets (Unit 3) of the delta. Note graded bedding at front (photo right) of turbidite.
Quaternary 09 00046 g009
Figure 10. Detail of flame structures and soft sediment deformation in Unit 3 Platter Kill Sand and Gravel quarry. Turbidite left of flame structures.
Quaternary 09 00046 g010
Figure 11. Upper photograph (A) displays coarsening upward topset sequence (Unit 1) overlying erosional contact of dipping foreset beds of sand (Unit 2). Lower photograph (B) is close-up of contact between Unit 1 and Unit 2. Dashed line demarcates units.
Quaternary 09 00046 g011
Figure 12. Upper photo (A) displays imbricated clast-supported cobble gravel interpreted as outwash-topset beds (Unit 1) at top of the Platter Kill Sand and Gravel quarry near Gilboa, NY. Lower photo (B) displays coarse grain size of boulders and cobbles sourced from the outwash. Coarse clast size is inferred to be related to close proximity of glacier that supplied sediment and meltwater as braided outwash that prograded westward into the glacial Lake Grand Gorge basin.
Quaternary 09 00046 g012
Figure 13. LiDAR terrain map displaying location of 592 m elevation deltas constructed into glacial Lake Broome Center and location of Site 2 OSL sample. This location is at the confluence of the Schoharie Sublobe advancing southward and the western edges of the Westerlo Sublobe along the NECM. Gray arrows represent direction of ice flow.
Quaternary 09 00046 g013
Figure 14. Photograph of Site 3 Manor Kill stream exposure. Upper photo (A) displays location of OSL sample. Lower photo (B) displays sharp contact between dipping sand unit and overlying boulder–gravel unit. Note openwork clast-supported nature of the deposit.
Quaternary 09 00046 g014
Figure 15. LiDAR terrain map displaying morainal bank (dashed line) between Site 3 and Site 4 in the Manor Kill Valley. Site 5 at the Conesville Delta is also displayed. Note drumlins (lines with circle) and orientation of bedrock striations (blue arrow).
Quaternary 09 00046 g015
Figure 16. Composite stratigraphic column of valley fill deposits at Site 4 in the Manor Kill Valley, near Conesville, New York. Available geochronologic and macrofossil information is displayed.
Quaternary 09 00046 g016
Figure 17. Insect remains recovered from fine sand–silt unit at a depth of 20 m below ground surface in exploration core BH2402 in the Manor Kill Valley near Conesville, NY.
Quaternary 09 00046 g017
Figure 18. Conesville Delta. Upper photo (A) displays foresets looking south into wall of lower quarry exposure. Lower photo (B) displays location of OSL sample LVE-22-OSL1 (red tube end) within bed of sand dipping west.
Quaternary 09 00046 g018
Figure 19. Photo (A) looking south at westward-dipping foreset beds of CV-Unit 2; geologists for scale in oval. Photo (B) looking east into foreset beds (Unit 2) of the Conesville Delta. Note folding shovel (0.75 m) for scale at base of sand bed. Abrupt, graded gravel contact above sand unit displays evidence of higher energy pulses of meltwater eastward into glacial Lake Grand Gorge.
Quaternary 09 00046 g019
Figure 20. Chart of depth versus age for geochronologic data from Sites 1–5. Small circles represent 1σ range, full bar is 2σs range for OSL data. Site 4 AMS radiocarbon date (UCIAMS) is for the 2σ range. Red star above chart and shaded column is the mean OSL age 24.7 ± 2.4 ka of (7) OSL samples collected from glacial Lake Grand Gorge basin sites. Shaded bars at base of chart represent previously published age range predicted for the Hudson Lobe during the last glacial maximum at Long Island and New Jersey [7,46,49,50,52].
Quaternary 09 00046 g020
Figure 21. Hypothesized sequence and timing of sublobe movements associated with the formation of glacial Lake Grand Gorge in the Schoharie Valley. Initial advance (A) of Westerlo Sublobe (black arrows indicate direction of ice flow). Recession (B) of Westerlo Sublobe leads to formaton of Platter Kill Delta and morainal bank in Manor Kill Valley. Continued eastward recession (C) of Westerlo Sublobe and advance of Schoharie Sublobe results in an ice dam that forms glacial Lake Broome Center and Conesville Delta (Site 5). Glacial Lake Grand Gorge drains eastward into the East Branch of the Delaware River. Meltwater direction shown with blue arrows.
Quaternary 09 00046 g021
Table 1. Location and geochronology of all samples.
Site NumberLocationNYSGS SampleLaboratory
Sample Number
OSL Reported AgeRadiocarbon Median AgeDepth Below Surface (m)LatitudeLongitudeSurface
Elevation (m)
Site 1Platter Kill DeltaGilboa-OSL#1ISGS-99018.5 ± 2.0 kaN/A12.242.418831−74.409331499
Site 1Platter Kill DeltaGilboa-OSL#2ISGS-99126.1 ± 3.0 kaN/A22.842.418161−74.410125499
Site 2Broom Center DeltaLVE-21-OSL2ISGS-88721.1 ± 1.9 kaN/A6.142.482123−74.343200592
Site 3Manor Kill
Basin
LVG-OSL-1-23ISGS-98828.9 ± 2.1 kaN/A24.442.38479−74.3747100421
Site 4Manor Kill
Basin (core)
BH2301-OSL1ISGS-99829.2 ± 2.4 kaN/A23.842.387904−74.341207440
Site 4Manor Kill
Basin (core)
NYSM-QM-309UCIAMS-277379N/A25.8 ka20.442.387904−74.341207440
Site 4Manor Kill
Basin—valley wall
Young/Merwin pitISGS-99217.9 ± 1.7 kaN/A1.7542.383719−74.339894470
Site 5Conesville DeltaLVE-22-OSL1ISGS-88829.7 ± 2.6 kaN/A1042.387278−74.322731487
Site 5Conesville DeltaLVE-22-OSL2ISGS-89522.8 ± 1.5 kaN/A2.442.387278−74.322731487
Table 2. OSL sample data.
Lab CodeSample NameEquivalent Dose (Gy)Dose Rate (Gy/ka)Age (ka)Overdispersion (%)n (Accepted/Total)
ISGS-990Gilboa-OSL#139 ± 42.11 ± 0.0918.5 ± 2.032 ± 451/170
ISGS-991Gilboa-OSL#264 ± 72.45 ± 0.1126.1 ± 3.039 ± 631/95
ISGS-887LVE-21-OSL283 ± 63.92 ± 0.1621.1 ± 1.943 ± 734/189
ISGS-988LVG-OSL-1-2369 ± 42.38 ± 0.1128.9 ± 2.137 ± 549/223
ISGS-998BH2301-OSL180 ± 52.75 ± 0.1129.2 ± 2.40 ± 07/135
ISGS-992Young/Merwin Pit42 ± 42.36 ± 0.0917.9 ± 1.736 ± 724/119
ISGS-895LVE-22-OSL274 ± 33.24 ± 0.1422.8 ± 1.523 ± 435/216
ISGS-888LVE-22-OSL1103 ± 73.48 ± 0.1629.7 ± 2.623 ± 517/74
All ages produced from quartz, equivalent doses measured using aliquots, modeled using the minimum age model. Other details outlined in supplemental.
Disclaimer/Publisher’s Note: The statements, opinions and data contained in all publications are solely those of the individual author(s) and contributor(s) and not of MDPI and/or the editor(s). MDPI and/or the editor(s) disclaim responsibility for any injury to people or property resulting from any ideas, methods, instructions or products referred to in the content.