


Abstract
Background/Objectives: To externally validate and compare four postoperative upper tract urothelial carcinoma (UTUC) nomograms in a contemporary Australian radical nephroureterectomy (RNU) cohort, and to identify independent clinicopathological predictors of survival. Methods: We conducted a retrospective study across a multi-site tertiary service in Victoria of patients who underwent RNU for localised UTUC between January 2011 and December 2021. Patients were excluded if RNU was performed for non-UTUC-related reasons or if they had incomplete data. Univariable and multivariable Cox models assessed prognostic factors. Discrimination of the nomograms was evaluated using Harrell’s C-index with bootstrap-corrected calibration. Results: Of 142 total patients undergoing RNU, 103 were included in the final study cohort. In our multivariable Cox regression analysis, increasing age, sessile architecture and higher tumour stage emerged as independent predictive factors for worse overall survival (OS). For cancer-specific survival (CSS), increasing age, higher tumour stage, tumour location in the kidney, and synchronous tumours in the kidney and ureter were statistically significant. Four nomograms (Seisen, Abdul-Muhsin, Cha and Roupret) were identified. External validation showed the best discrimination of CSS for Seisen (C-index 0.814, 95% confidence interval (CI) 0.687–0.915); Abdul-Muhsin had good OS but moderate CSS discrimination (C-index 0.708 and 0.651), Cha showed good CSS but excellent recurrence-free survival (RFS) discrimination (C-index 0.770 and 0.826) and Roupret CSS nomogram showed good CSS discrimination (C-index 0.789, 95% CI (0.653, 0.900). Conclusions: The Seisen nomogram provided the most accurate, well-calibrated five-year cancer-specific predictions after RNU, outperforming the Abdul-Muhsin, Cha and the Roupret models, likely due to its weighting of age, location, and sessile architecture, which are independent predictors of worse CSS. These data endorse a risk-adapted strategy using the Seisen nomogram to guide postoperative counselling, surveillance intensity, and consideration for adjuvant therapy.
1. Introduction
Upper tract urothelial carcinoma (UTUC) is a relatively rare disease, accounting for approximately 5% of all urothelial cancers. It is often aggressive, with approximately two-thirds of UTUC being invasive at the time of diagnosis, resulting in a historically poor prognosis with a five-year relative survival rate of approximately 57% [1,2]. Consequently, the European Association of Urology (EAU) recommends radical nephroureterectomy (RNU) as the gold standard for managing high-risk patients. High-risk UTUC is characterised by features such as high-grade urine cytology, high-grade ureteroscopic biopsy findings, local invasion on computed tomography (CT) or atypical histological features [3].
In addition to established high-risk features, other factors such as male sex, tumour location, and the presence of lymphovascular invasion (LVI) have also been identified in prior studies as independent predictors of poor prognosis [4]. As postoperative prognosis is highly heterogenous, several multivariable nomograms have been developed to predict recurrence-free survival (RFS), overall survival (OS) and cancer-specific survival (CSS) post-RNU. Although most models share a core of clinicopathological variables, each incorporates a different constellation of additional factors thought to influence survival.
A recent systematic review by Pallauf et al. [5] highlighted the breadth of this field, identifying 26 prognostic nomograms developed for postoperative UTUC. However, the authors found that only four of these models have been externally validated. Furthermore, the review noted significant study heterogeneity and a high overall risk of bias across the development studies, concluding that the lack of external validation severely limits their current clinical applicability. This underscores the critical need for independent validation in contemporary cohorts before these prognostic tools can be generalised for routine patient counselling.
This study aimed to externally validate and compare four previously published UTUC nomograms [6,7,8,9] in patients with UTUC who underwent RNU at a large tertiary institution. To our knowledge, this is the first Australian multi-site external validation and comparison of multiple postoperative UTUC nomograms.
2. Materials and Methods
A retrospective analysis was conducted at Monash Health, a multi-site tertiary healthcare network and the largest public health service in Victoria, Australia. Records of all patients who underwent RNU for UTUC between 1 January 2011, and 31 December 2021 were reviewed. This study was approved by the local institutional research ethics board (Ethic Committee Name: Monash Health Human Research Ethics Committee; Approval Code: RES-23-0000-581Q).
Patients who underwent RNU for localised UTUC at Monash Health were included in the cohort. Localised disease was evaluated based on preoperative imaging assessment. Patients were excluded if RNU was performed for non-UTUC-related reasons, or if they had incomplete data or pathological records. All cases were discussed at the department multidisciplinary tumour board (MDT) prior to surgery to establish treatment plans.
Data were collected to align with the EAU risk stratification parameters for UTUC. This included CT Urography (CTU) findings regarding tumour invasion and preoperative hydronephrosis, biopsy grade, tumour size, tumour multifocality, and the presence of histologic subtype. Additional information collected included patient age, sex, LVI, surgical margin and the final pathological stage and grade determined at RNU. Histopathological assessment of ureterorenoscopy (URS) biopsy, RNU specimen, and analysis of urine cytology were performed by pathologists at the institution and were reviewed by a uropathologist at the MDT. Tumour grade was classified using the 2004/2016 World Health Organisation (WHO)/International Society of Urologic Pathologists (ISUP) consensus classification. Specimens demonstrating mixed high- and low-grade features were categorised as high-grade.
RNU was performed using either an open or laparoscopic approach, as determined by the operating surgeon. The choice of surgical technique was based on preoperative imaging findings, intraoperative considerations, and recommendations from the MDT. In certain instances, formal bladder cuff excision was performed for removal of the distal ureter. Pluck and ligation techniques were also utilised in certain cases, particularly in comorbid patients (e.g., age > 80 years, history of extensive abdominal surgery, American Society of Anesthesiologists (ASA) score 3 or 4) or those with lower risk tumours. For the overall cohort, recurrence was defined as any tumour recurrence in the bladder, contralateral upper tract, or operative field, while progression was defined as the development of distant metastasis or pathological upstaging upon recurrence. However, given the significant heterogeneity in survival endpoints across the original derivation studies, we strictly aligned our definitions to match the respective models during external validation. Specifically, to validate the RFS nomogram proposed by Cha et al., disease recurrence was redefined as tumour relapse in the operative field, regional lymph nodes, and/or distant metastasis; occurrences of urothelial carcinoma in the bladder or contralateral upper tract were explicitly excluded from this specific endpoint to mirror the Cha et al. methodology.
Univariable and multivariable Cox regression analyses were used to evaluate the relationships of clinicopathological variables with OS and CSS. For external validation of nomograms, model discrimination was quantified using Harrell’s concordance index (C-index) and 95% confidence intervals, and calibration was assessed via bootstrap-corrected calibration. Statistical comparison of correlated C-indices was performed using the compareC package in R 4.5.0. Analyses were conducted in IBM SPSS v29 and R, with significance set at p < 0.05.
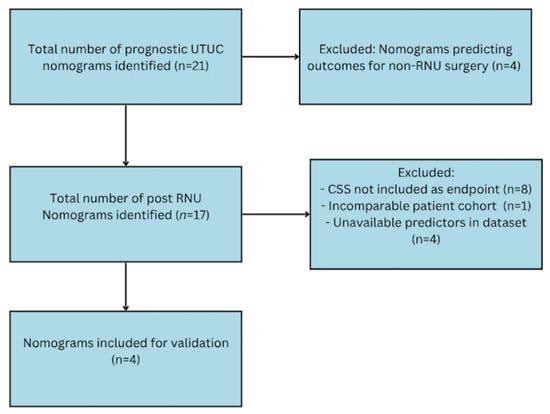
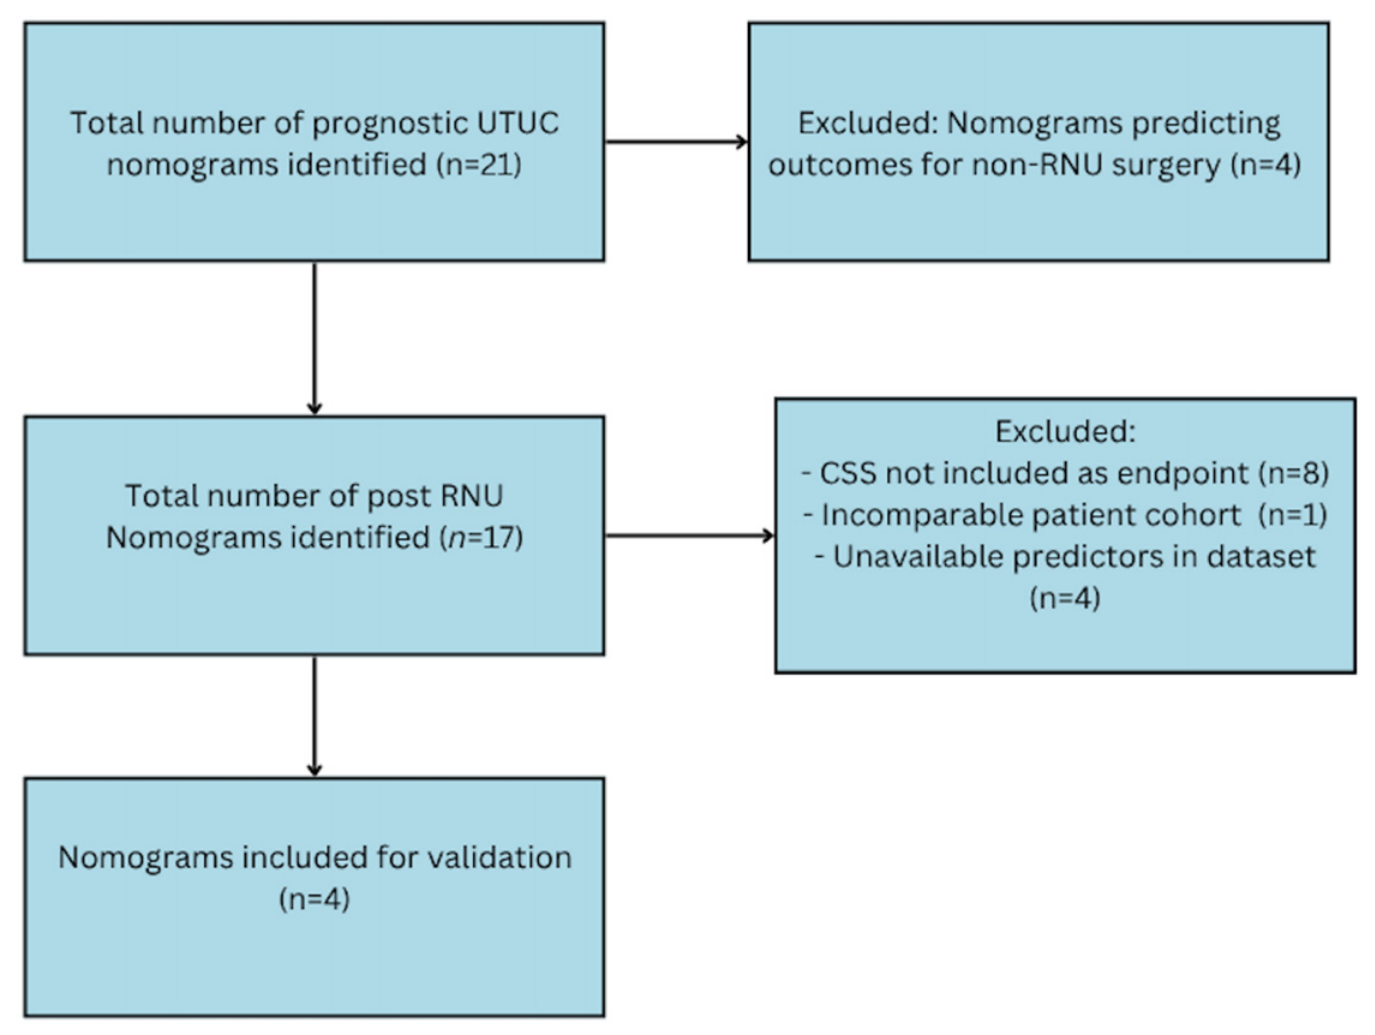
Candidate prediction models were initially identified through a recent systematic review by Pallauf et al. [5], supplemented by an updated literature search to capture any newly published tools. To be eligible for external validation in our cohort, nomograms had to meet several inclusion criteria. Firstly, the models had to be specifically designed for postoperative RNU populations, excluding those intended for preoperative prognostication or kidney-sparing surgeries. Secondly, our study’s primary endpoint of interest is CSS, as it provides a direct measure of oncological outcomes following surgery—eligible nomograms were required to predict this specific outcome. Finally, selection was further refined by data availability, ensuring that all required predictors for the chosen models were routinely recorded in our dataset. Four nomograms were included in the final validation (Figure 1).
Figure 1.
Flow-chart for nomogram selection. UTUC: upper tract urothelial carcinoma; RNU: radical nephroureterectomy; CSS; cancer-specific survival.
3. Results
A total of 142 patients underwent RNU at our tertiary health service between 1 January 2011 and 30 December 2021. Of these, 103 patients met the inclusion criteria and were included in the study. Among the 103 patients, 68 (66.02%) had high-grade tumours, while 35 (33.98%) were low-grade. Median follow-up was 70 months. Key characteristics such as age, gender, tumour location, imaging findings on CT (hydronephrosis and invasion), focality, and surgical margin characteristics were similar between the groups. Diagnostic URS was performed in 74 (71.8%) of patients.
Baseline characteristics of our external validation cohort and the original Seisen, Abdul-Muhsin, Cha and Roupret nomogram cohorts are summarised in Table 1. Overall, our patients were of similar age but had a higher proportion of low-grade tumours (34% vs. 2.8–19% in the derivation cohorts) and a larger share of Ta/Tis. Ureteric and renal-pelvic tumour location and the distribution of hydronephrosis were broadly comparable across cohorts. Notably, 26.2% of our patients received adjuvant chemotherapy, which is significantly higher than the original development cohorts, likely reflecting the evolution of practice patterns over the last decade.
Table 1.
Comparison of baseline clinicopathological characteristics between the external validation cohort and the original nomogram development cohorts.
3.1. Multivariable Cox Regression Analysis
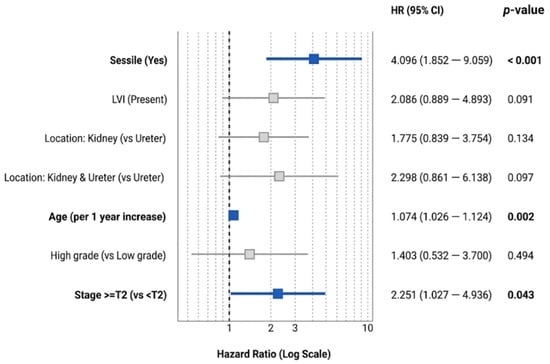
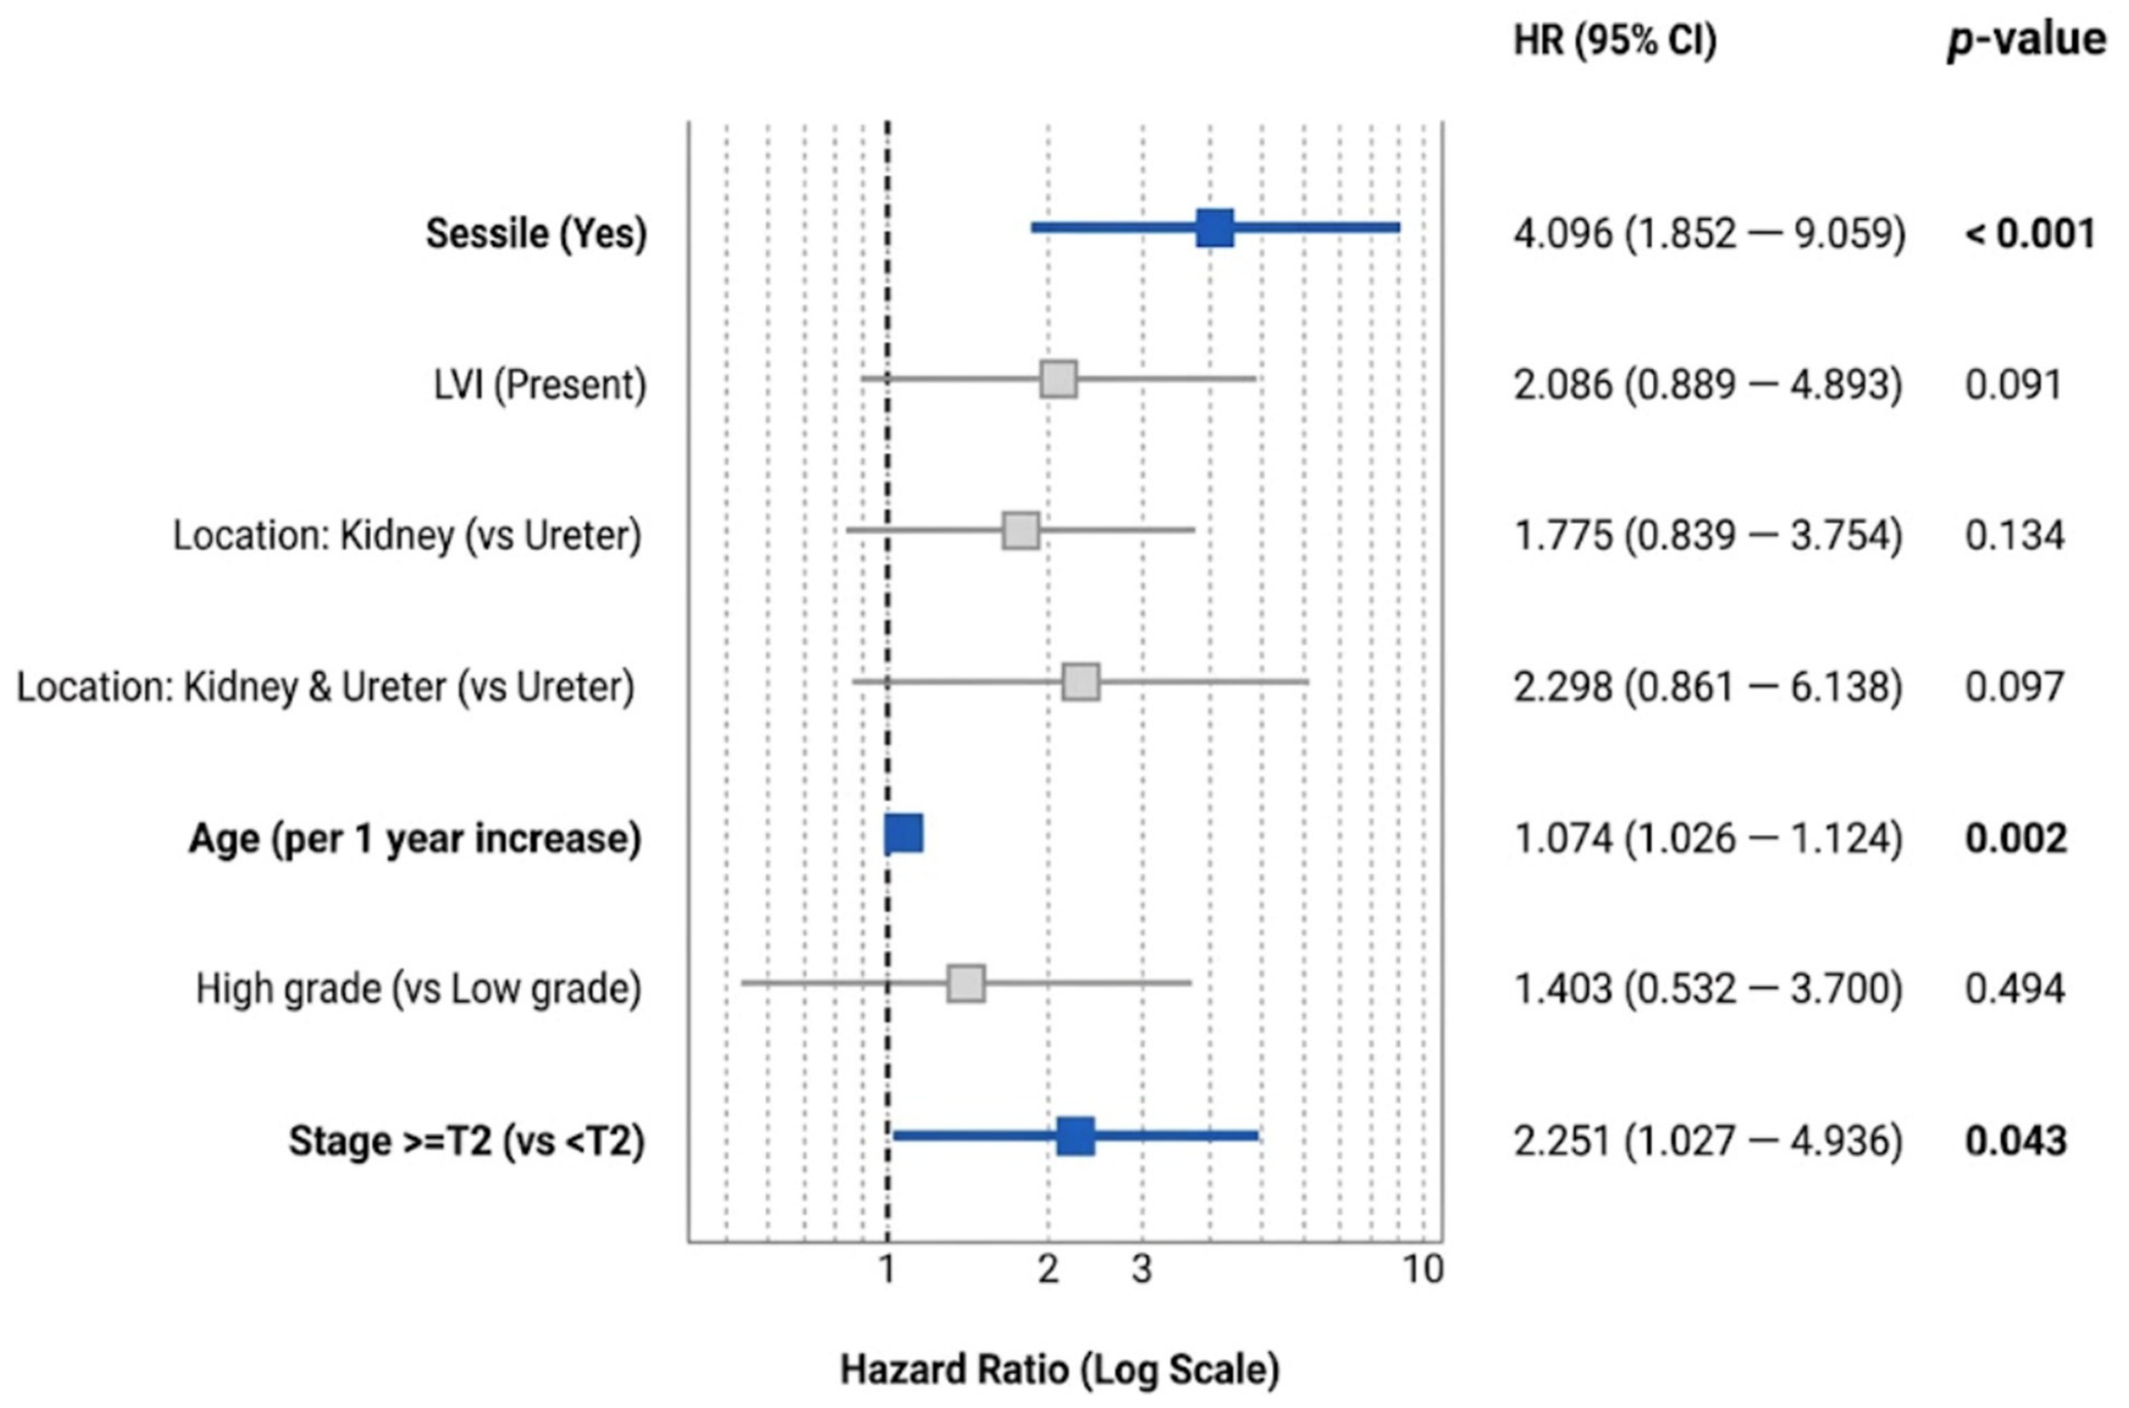
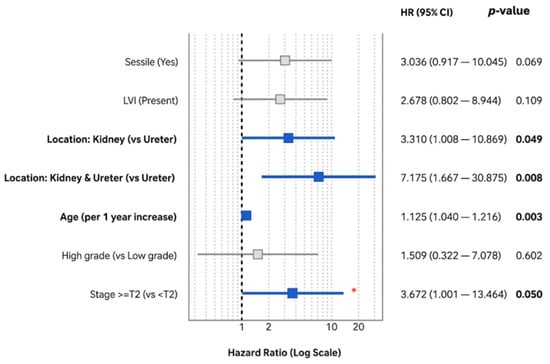
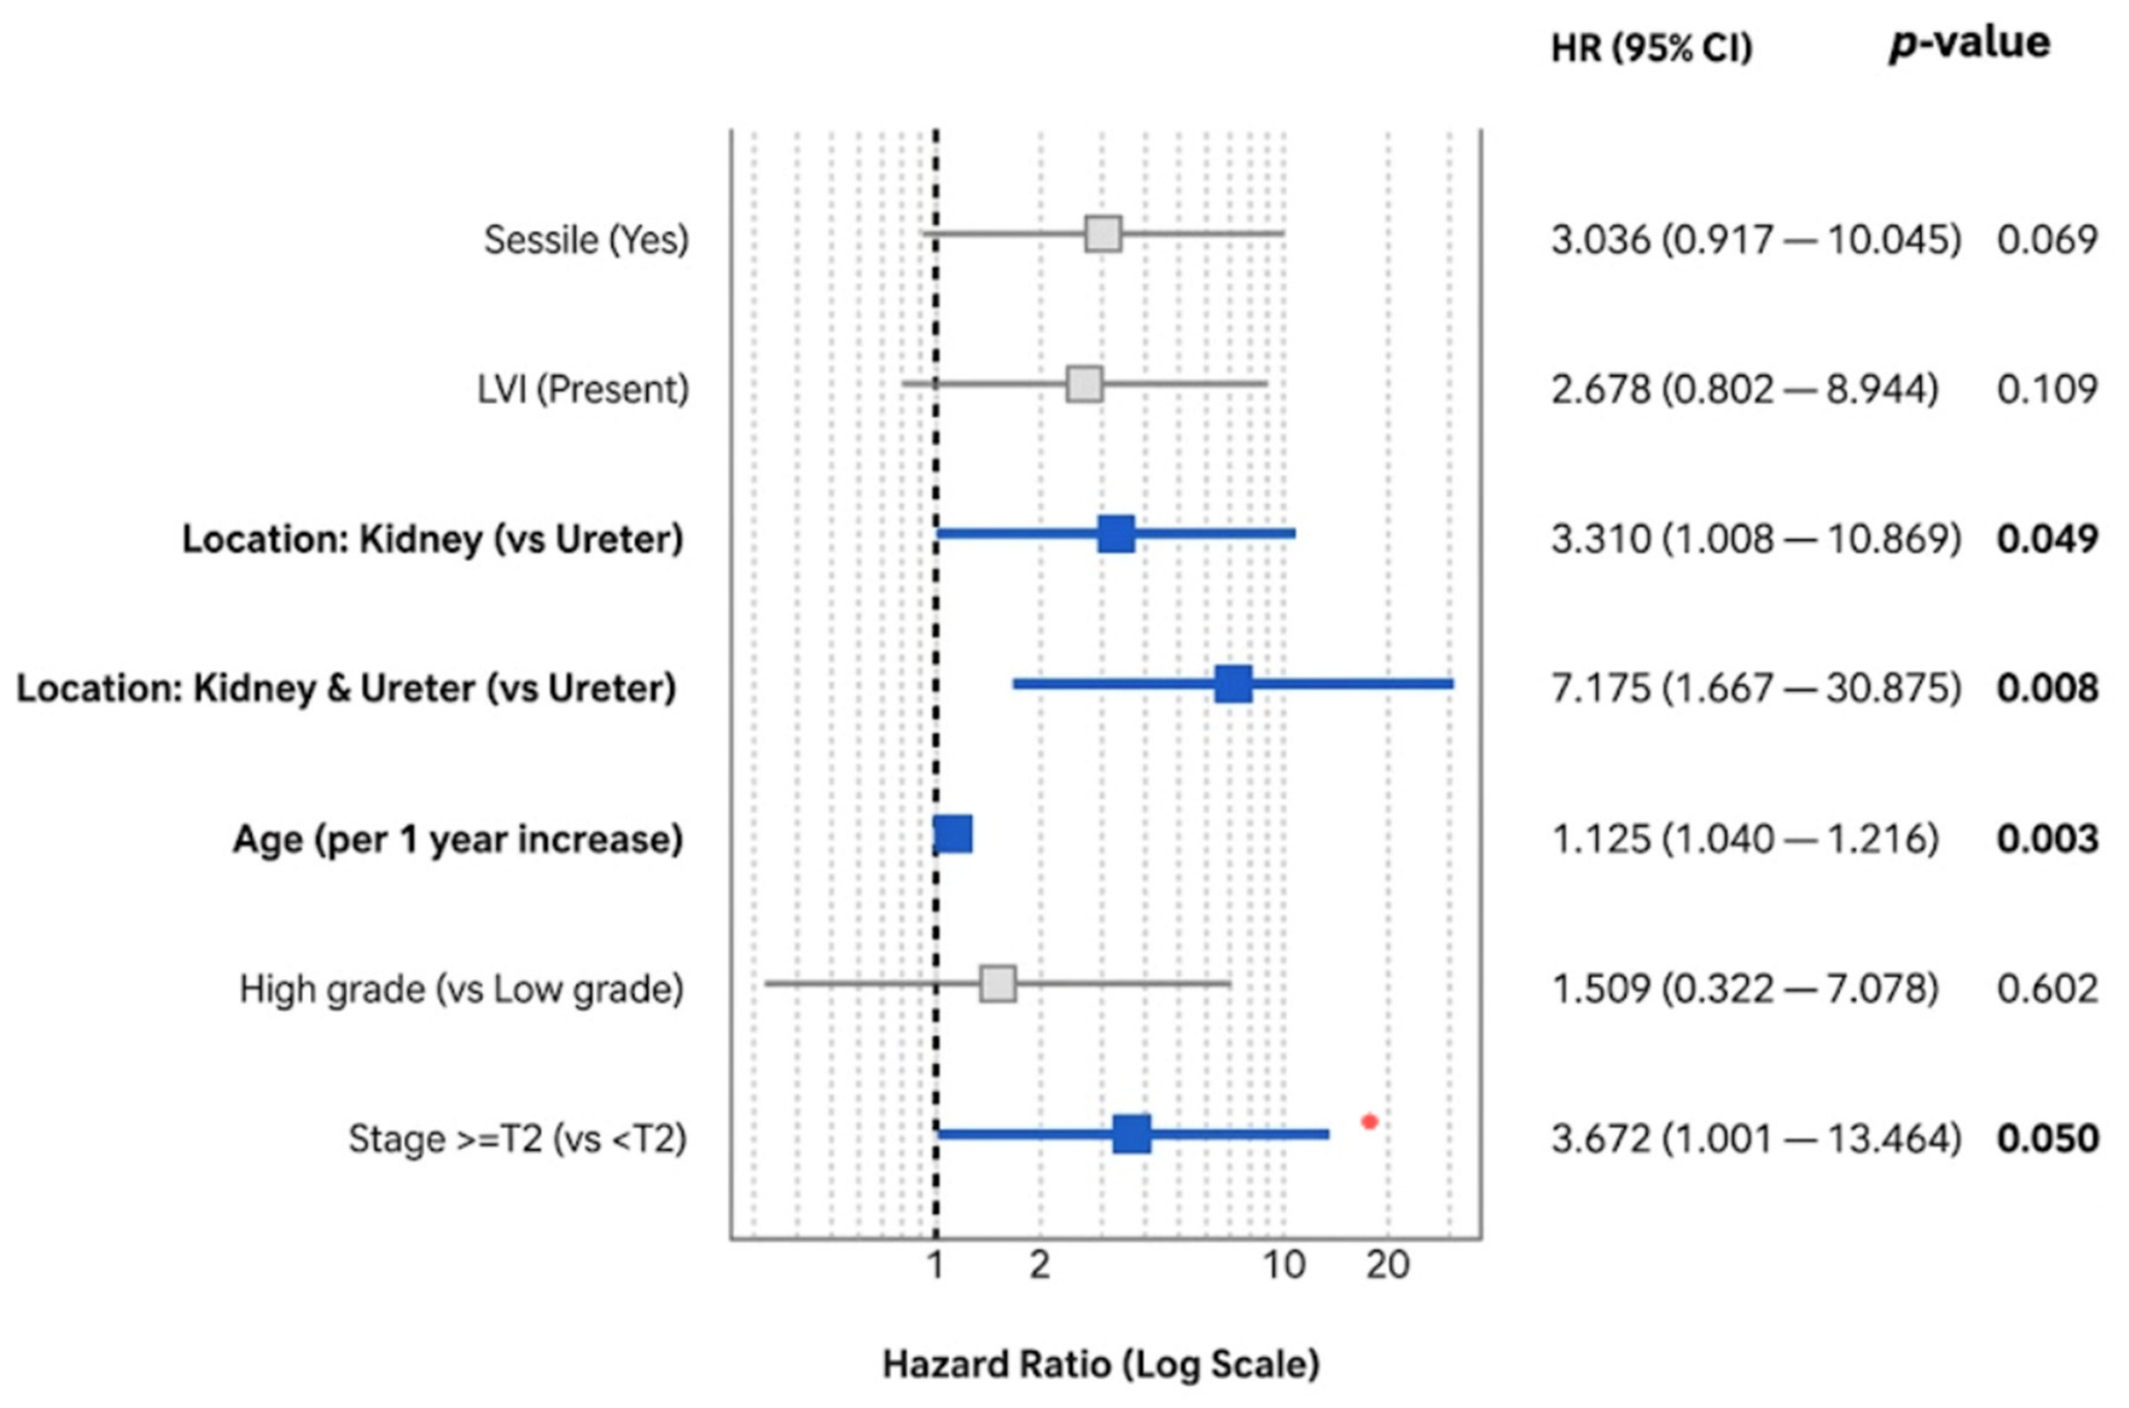
Our multivariable Cox regression analysis across the cohort yielded prognostic indicators consistent with the established nomograms. For OS, increasing age (hazard ratio (HR) 1.07, p = 0.002), sessile architecture (HR 4.1, p < 0.001), and higher tumour stage (HR = 2.25, p = 0.04) emerged as independent predictors (Figure 2). For CSS, increasing age (HR 1.13, p = 0.003), higher tumour stage (HR 3.67, p = 0.05) and tumour location in the kidney, and synchronous tumour at the kidney and ureter were statistically significant (Figure 3).
Figure 2.
Forest plot for multivariable cox regression analysis of overall survival (OS). LVI: lymphovascular invasion; HR: hazards ratio; CI: confidence interval. The vertical dashed line represents the null value (Hazard Ratio = 1). Squares indicate the Hazard Ratio point estimates for each variable, and the intersecting horizontal lines represent the 95% Confidence Intervals (CI). Bold text and blue squares denote statistically significant variables (p < 0.05), whereas grey squares denote non-significant variables.
Figure 3.
Forest plot for multivariable cox regression analysis of cancer-specific survival (CSS). LVI: lymphovascular invasion; HR: hazard ratio; CI: confidence interval. The vertical dashed line represents the null value (Hazard Ratio = 1). Squares indicate the Hazard Ratio point estimates for each variable, and the intersecting horizontal lines represent the 95% Confidence Intervals (CI). Bold text and blue squares denote statistically significant variables (p < 0.05), whereas grey squares denote non-significant variables.
3.2. Validation of Nomograms
Variables included in the evaluated nomograms are summarised in Table 2. The Seisen et al. nomogram demonstrated excellent discriminatory power for 5-year CSS, yielding a C-index of 0.814 (95% confidence interval (CI) 0.687–0.915). Abdul-Muhsin et al. showed good discrimination for 5-year OS, with a C-index of 0.708 (95% CI 0.622–0.797), but only moderate discrimination for 5-year CSS at 0.651 (95% CI 0.535–0.774). The Cha et al. [8] model achieved excellent discrimination for 5-year RFS (C-index 0.605, 95% CI 0.754–0.866) and good discrimination for 5-year CSS (C-index 0.770, 95% CI 0.695–0.844). Lastly, the Roupret et al. model achieved good discriminatory power for CSS, with a C-index 0.789 (95% CI 0.653, 0.900).
Table 2.
Variables included in nomograms. LVI: lymphovascular invasion; ASA: American Society of Anesthesiologists; CIS: carcinoma in situ; CSS: cancer free survival; OS: overall survival; RFS: recurrence free survival. The checkmarks indicate that the nomogram has included the indicated variable.
Comparative analysis of model performance revealed that the Seisen nomogram demonstrated significantly superior discrimination compared to the Abdul-Muhsin nomogram (p = 0.007). When compared to the Cha nomogram, the Seisen model achieved a higher C-index (0.814 vs. 0.770) and approached statistical significance (p = 0.051), suggesting a trend toward improved predictive accuracy that may be limited by sample size.
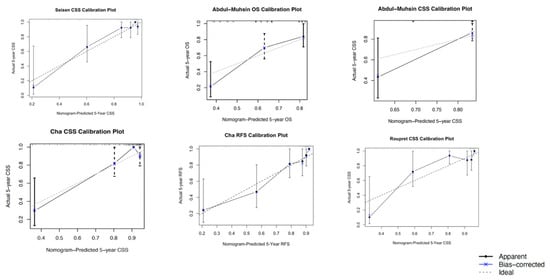
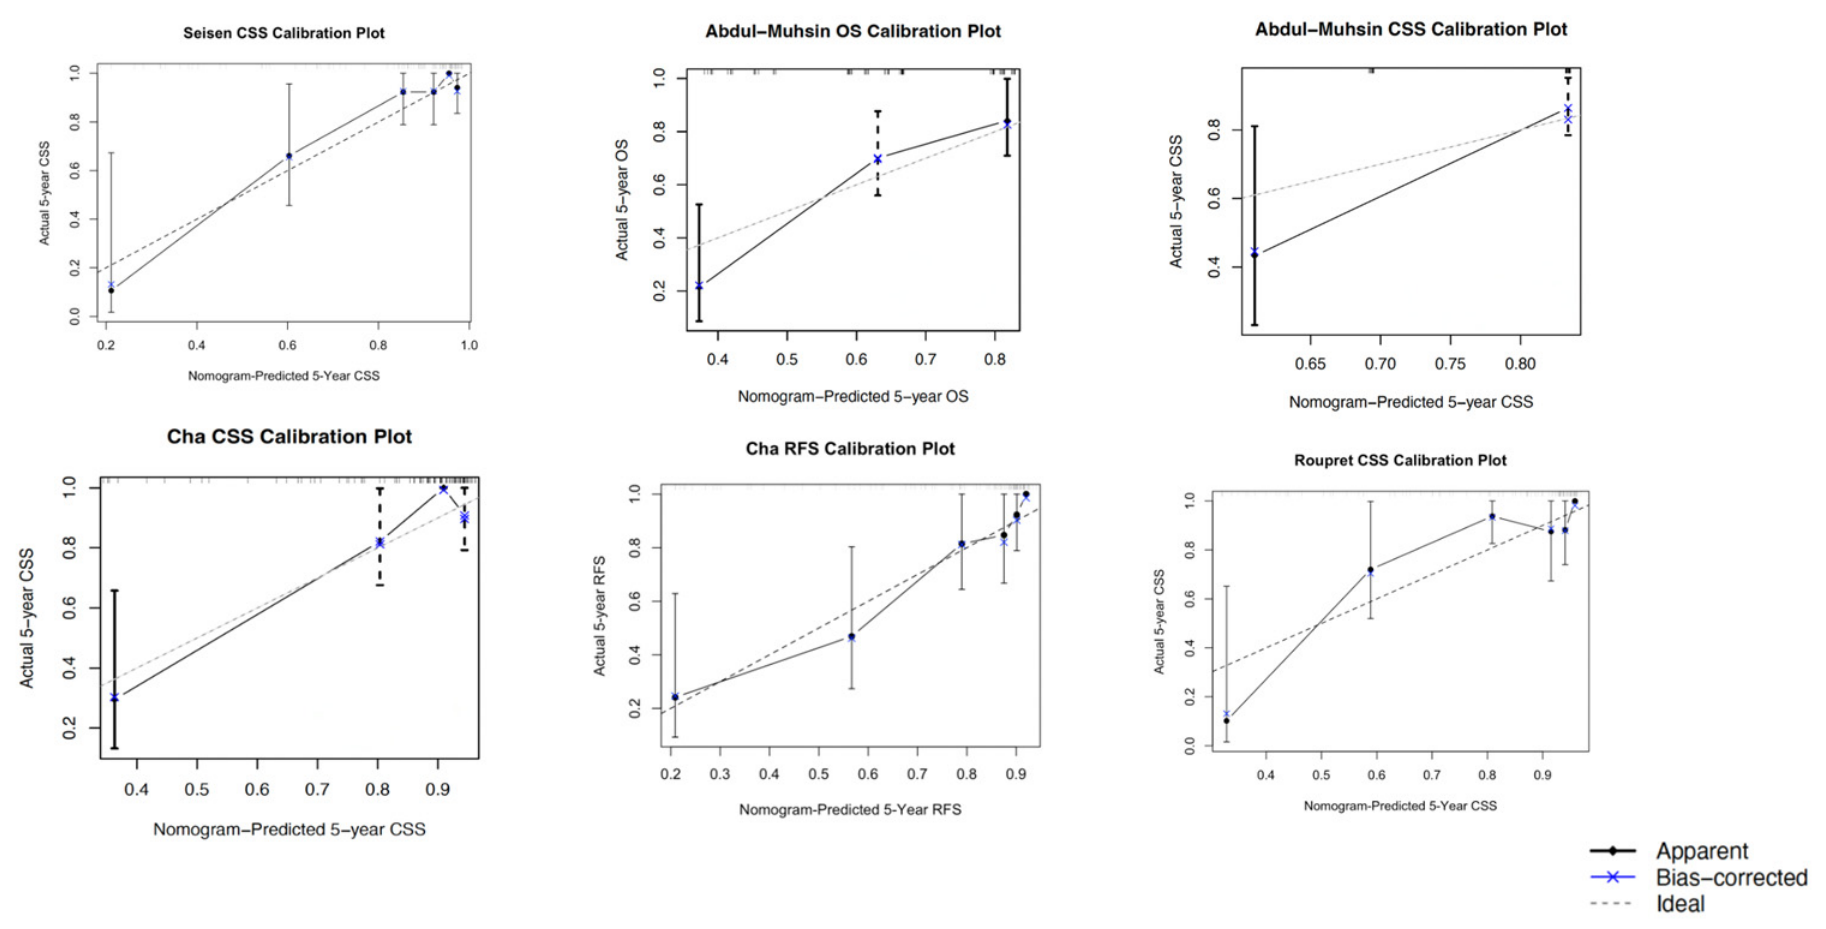
Bootstrap-corrected calibration curves (Figure 4) confirmed that the Seisen nomogram is well-calibrated, with bias-corrected predictions lying close to the 45-degree ideal. By comparison, the Abdul-Muhsin CSS curve showed pronounced miscalibration, over-estimating survival at lower predicted probabilities and under-estimating it at higher probabilities; the OS curve followed a similar pattern. The Cha CSS model was acceptably calibrated, deviating only slightly by over-predicting in the lower predicted probabilities and mildly under-predicting above 0.90. While the C-index for the Cha RFS model is excellent, it displayed some over-prediction around 0.5–0.6 in the calibration plot. Lastly, while the Roupret nomogram achieved a good C-index, the calibration is not optimal.
Figure 4.
Bootstrap corrected calibration plots. CSS: cancer-specific survival; OS; overall survival; RFS: recurrence-free survival.
4. Discussion
Multivariable Cox regression analysis revealed distinct prognostic drivers for overall and cancer-specific mortality in our cohort. For OS, increasing age, sessile tumour architecture and advanced pathological stage emerged as independent predictors. Notably, the profound impact of sessile architecture on OS (HR 4.1) underscores the aggressive biology of broad-based tumours. Papillary tumours typically grow exophytically into the lumen of the renal pelvis or ureter, often presenting as space-occupying lesions before they deeply invade. In contrast, sessile tumours have a broad, flat base of attachment and tend to grow endophytically, thereby facilitating deeper microscopic invasion and earlier systemic dissemination [10]. Advanced T-stage also predictably impacted OS (HR 2.3), reaffirming that locally advanced disease remains the strongest traditional indicator of worse outcomes.
While evaluating CSS, age and advanced stage remained significant, but anatomical location emerged as a critical variable. Specifically, renal pelvis tumours were associated with significantly worse CSS compared to ureteral tumours (HR 3.31). While many large registries identify ureteral location as a worse prognostic factor, ref. [11] our analysis interestingly demonstrated the opposite. We hypothesise this reflects the ‘silent growth’ potential of the spacious renal pelvis. Tumours here can grow larger before causing acute symptoms like obstruction, leading to delayed presentation. This theory is supported by a large retrospective study by Lwin et al. [12] Although they ultimately found worse survival for ureteral tumours- which may be due to less radical surgical management (56.4% vs. 84.3%; p < 0.01) the study clearly demonstrated that patients with renal pelvis tumours presented at a significantly higher tumour stage and grade. Specifically, patients with renal pelvis urothelial carcinoma presented with more than double the rate of locally advanced disease compared to ureteral urothelial carcinoma (16.3% vs. 7.7%). Compounding this delayed presentation, the renal pelvis features a thinner muscularis layer than the ureter and is intimately surrounded by a rich vascular and lymphatic network within the renal sinus, providing an easier anatomical route for micrometastasis.
Furthermore, synchronous presentation in both the kidney and ureter also demonstrated a remarkably high hazard ratio (HR 7.2) compared to isolated ureteric tumours for CSS, which is consistent with recent literature [13].
A notable finding in our multivariable analysis was the absence of independent prognostic significance for tumour grade, which contrasts with established UTUC literature and the derivation cohorts of Cha et al. and Seisen et al., where high tumour grade is a well-recognised adverse pathological factor. This finding is likely attributable to the strong collinearity between tumour grade, advanced pathological stage, and tumour architecture.
These cohort-specific findings directly illuminate the comparative performance of the validated nomograms. The Seisen model displayed the strongest predictive performance (C-index 0.814) precisely because its architecture captures the risk profile of our population. Seisen is the only model among the four that incorporates age, T-stage, tumour location, and architecture—all of which were independent drivers of mortality in our multivariable analysis. In comparison, Abdul-Muhsin’s models struggled with discrimination and calibration. Its CSS model relies on only three adverse pathological features (LVI, sarcomatoid differentiation, and positive surgical margins), completely omitting crucial factors like T-stage and tumour architecture that drove mortality in our patients.
The Cha model presents an interesting case, achieving good CSS discrimination (C-index 0.770) and strong RFS discrimination (C-index 0.826), likely by retaining well-established prognostic domains like age, T-stage, and architecture.
Lastly, the Roupret model achieved good CSS discrimination (C-index 0.789), its relative underperformance compared to Seisen is likely due to its omission of tumour grade and location.
Differences in baseline characteristics between our cohort and the original development cohorts may further explain the performance we observed. Our series contained a larger proportion of low-grade and Ta/Tis tumours and lower rates of LVI and sessile architecture than Seisen, as well as different patterns of bladder cuff management compared with Abdul-Muhsin. These shifts in case mix, together with contemporary perioperative management, likely contributed to calibration drift in Abdul-Muhsin and Cha but had less impact on the more pathology-rich Seisen model.
This study is constrained by several limitations, largely driven by the inherent rarity of UTUC. Due to the low incidence of the disease, assembling our cohort of 103 patients necessitated a retrospective design spanning more than a decade. Consequently, surgical techniques and follow-up schedules were not standardised, introducing potential procedural heterogeneity that may influence outcomes. Furthermore, pathology reports were generated over this extended period by multiple pathologists without central review. This risks inter-observer variation in grade assignment, architectural pattern, and LVI status, which could compromise the calibration of our nomogram. Additionally, a notable limitation specific to our external validation analysis is the potential for treatment-era confounding due to evolving perioperative management. In our contemporary cohort, a substantial proportion of patients (26.2%) received adjuvant chemotherapy. By contrast, the original derivation cohorts for the nomograms developed by Cha et al. and Seisen et al. explicitly excluded patients receiving neoadjuvant or adjuvant therapies. Because adjuvant chemotherapy is preferentially administered to patients with adverse pathological features, its application inherently alters expected survival trajectories. The diminished discriminative ability observed during our external validation of these specific nomograms may, therefore, partially reflect these modern multimodal treatment paradigms rather than intrinsic mathematical flaws within the prediction models themselves. Finally, while our sample size is notable for a single-institution UTUC study, it remains statistically small. Our survival outcomes may therefore reflect local practice patterns rather than universal real-world values, underscoring the vital need for larger, multi-centre prospective trials to robustly verify these findings.
5. Conclusions
In conclusion, increasing age, tumour location, stage, and sessile architecture are the key factors driving mortality in our cohort. Most importantly, we confirmed the superior performance of the Seisen nomogram in predicting CSS, and the Cha nomogram in predicting RFS in an Australian setting. Integrating this externally validated tool into practice can facilitate more precise patient risk stratification, helping to personalise surveillance and better inform discussions regarding adjuvant therapy.
Author Contributions
Conceptualization, W.R.; methodology, X.W.; software, X.W. formal analysis, X.W.; data curation, X.W.; writing—original draft preparation, X.W., S.A. and Y.K.; writing—review and editing, W.R., T.N.A.H. and J.B.; supervision, W.R., J.H., N.R., K.C., M.K., M.H. and S.D. All authors have read and agreed to the published version of the manuscript.
Funding
This research received no external funding.
Institutional Review Board Statement
The study was conducted in accordance with the Declaration of Helsinki and approved by the local institutional research ethics board (Ethic Committee Name: Monash Health Human Research Ethics Committee; Approval Code: RES-23-0000-581Q, approval date: 25 August 2023).
Informed Consent Statement
Patient consent was waived due to the retrospective nature of this study. The waiver of informed consent was granted by Monash Health under the framework of the Australian National Statement on Ethical Conduct in Human Research (2023). Specifically, under Section 2.3.10 of the National Statement, the ethics committee waived the requirement for consent as the research involves no more than low risk, there is no reason to believe participants would not have consented, and the requirement for consent would make the research impracticable.
Data Availability Statement
The datasets presented in this article are not readily available due to ethical and privacy restrictions protecting patient confidentiality. De-identified data supporting the findings of this study are available from the corresponding author upon reasonable request, subject to approval by the Monash Health Human Research Ethics Committee.
Conflicts of Interest
The authors declare no conflicts of interest.
References
- van Doeveren, T.; van der Mark, M.; van Leeuwen, P.J.; Boormans, J.L.; Aben, K.K.H. Rising incidence rates and unaltered survival rates for primary upper urinary tract urothelial carcinoma: A Dutch population-based study from 1993 to 2017. BJU Int. 2021, 128, 343–351. [Google Scholar] [CrossRef] [Scilit] [PubMed]
- Margulis, V.; Shariat, S.F.; Matin, S.F.; Kamat, A.M.; Zigeuner, R.; Kikuchi, E.; Lotan, Y.; Weizer, A.; Raman, J.D.; Wood, C.G.; et al. Outcomes of radical nephroureterectomy: A series from the Upper Tract Urothelial Carcinoma Collaboration. Cancer 2009, 115, 1224–1233. [Google Scholar] [CrossRef] [Scilit] [PubMed]
- Masson-Lecomte, A.; Birtle, A.; Pradere, B.; Capoun, O.; Compérat, E.; Domínguez-Escrig, J.L.; Liedberg, F.; Makaroff, L.; Mariappan, P.; Moschini, M.; et al. European Association of Urology Guidelines on Upper Urinary Tract Urothelial Carcinoma: Summary of the 2025 Update. Eur. Urol. 2025, 87, 697–716. [Google Scholar] [CrossRef] [Scilit] [PubMed]
- Gao, J.; Liu, J.; Liu, J.; Lin, S.; Ding, D. Survival and risk factors among upper tract urothelial carcinoma patients after radical nephroureterectomy in Northeast China. Front. Oncol. 2022, 12, 1012292. [Google Scholar] [CrossRef] [Scilit] [PubMed]
- Pallauf, M.; König, F.; D’Andrea, D.; Laukhtina, E.; Mostafaei, H.; Motlagh, R.S.; Quhal, F.; Aydh, A.; Yanagisawa, T.; Kawada, T.; et al. A Systematic Review and Meta-Analysis of Prognostic Nomograms After UTUC Surgery. Front. Oncol. 2022, 12, 907975. [Google Scholar] [CrossRef] [Scilit] [PubMed]
- Seisen, T.; Colin, P.; Hupertan, V.; Yates, D.R.; Xylinas, E.; Nison, L.; Cussenot, O.; Neuzillet, Y.; Bensalah, K.; Novara, G.; et al. Postoperative nomogram to predict cancer-specific survival after radical nephroureterectomy in patients with localised and/or locally advanced upper tract urothelial carcinoma without metastasis. BJU Int. 2014, 114, 733–740. [Google Scholar] [CrossRef] [Scilit] [PubMed]
- Abdul-Muhsin, H.; De Lucia, N.; Singh, V.; Faraj, K.; Rose, K.; Cha, S.; Zhang, N.; Judge, N.; Navaratnam, A.; Tyson, M.; et al. Outcome prediction following radical nephroureterectomy for upper tract urothelial carcinoma. Urol. Oncol. 2021, 39, 133.e9–133.e16. [Google Scholar] [CrossRef] [Scilit] [PubMed]
- Cha, E.K.; Shariat, S.F.; Kormaksson, M.; Novara, G.; Chromecki, T.F.; Scherr, D.S.; Lotan, Y.; Raman, J.D.; Kassouf, W.; Zigeuner, R.; et al. Predicting clinical outcomes after radical nephroureterectomy for upper tract urothelial carcinoma. Eur. Urol. 2012, 61, 818–825. [Google Scholar] [CrossRef] [Scilit] [PubMed]
- Rouprêt, M.; Hupertan, V.; Seisen, T.; Colin, P.; Xylinas, E.; Yates, D.R.; Fajkovic, H.; Lotan, Y.; Raman, J.D.; Zigeuner, R.; et al. Prediction of cancer specific survival after radical nephroureterectomy for upper tract urothelial carcinoma: Development of an optimized postoperative nomogram using decision curve analysis. J. Urol. 2013, 189, 1662–1669. [Google Scholar] [CrossRef] [Scilit] [PubMed]
- Hodges, K.B.; Lopez-Beltran, A.; Maclennan, G.T.; Montironi, R.; Cheng, L. Urothelial lesions with inverted growth patterns: Histogenesis, molecular genetic findings, differential diagnosis and clinical management. BJU Int. 2011, 107, 532–537. [Google Scholar] [CrossRef] [Scilit] [PubMed]
- Krajewski, W.; Nowak, Ł.; Małkiewicz, B.; Chorbińska, J.; Kiełb, P.; Poterek, A.; Sporniak, B.; Sut, M.; Moschini, M.; Lonati, C.; et al. The Impact of Primary Tumor Location on Long-Term Oncological Outcomes in Patients with Upper Tract Urothelial Carcinoma Treated with Radical Nephroureterectomy: A Systematic Review and Meta-Analysis. J. Pers. Med. 2021, 11, 1363. [Google Scholar] [CrossRef] [Scilit] [PubMed]
- Lwin, A.A.; Hsu, C.-H.; Chipollini, J. Urothelial Carcinoma of the Renal Pelvis and Ureter: Does Location Make a Difference? Clin. Genitourin. Cancer 2020, 18, 45–49.e1. [Google Scholar] [CrossRef] [Scilit] [PubMed]
- Huang, Y.-C.; Liu, J.-M.; Liu, H.-Y.; Chang, Y.-L.; Chen, C.-S.; Ho, D.-R.; Wu, C.-T.; Chen, M.-F.; Wang, H.-J.; Luo, H.-L. Clinical Determinants of Extraurinary Tract Recurrence and Survival after Radical Surgery for pT2 Upper Tract Urothelial Carcinoma. Cancers 2023, 15, 1858. [Google Scholar] [CrossRef] [Scilit] [PubMed]

Disclaimer/Publisher’s Note: The statements, opinions and data contained in all publications are solely those of the individual author(s) and contributor(s) and not of MDPI and/or the editor(s). MDPI and/or the editor(s) disclaim responsibility for any injury to people or property resulting from any ideas, methods, instructions or products referred to in the content. |
© 2026 by the authors. Published by MDPI on behalf of the Société Internationale d’Urologie. Licensee MDPI, Basel, Switzerland. This article is an open access article distributed under the terms and conditions of the Creative Commons Attribution (CC BY) license.