


Abstract
The development of an effective recognition interface is a critical step in biosensor design. In this study, aptamer- and antibody-functionalized gold surfaces were compared as capture interfaces for Bacillus cereus spores. Two aptamer sequences and different antibody immobilization approaches, including random and oriented immobilization, were investigated. Spore capture was evaluated by fluorescence imaging using either an aptamer–antibody sandwich assay or direct SYTO®9 staining, with Raman spectroscopy employed as a complementary characterization method. At the fixed spore concentration investigated, the aptamer-functionalized surfaces produced higher fluorescence responses than the antibody-functionalized surfaces under the tested experimental conditions. Raman bands associated with calcium dipicolinate provide additional evidence consistent with the presence of captured endospores. An opal/gold hybrid structure was also examined as a preliminary optical transduction platform. The immobilization of two distinct molecular recognition elements (MREs) was performed via spotter deposition, thus enhancing the signal-to-noise ratio. Our findings suggest that, in this configuration, aptamers outperform antibodies in capturing B. cereus spores and, therefore, are identified as the most useful MRE to be implemented in future biosensors. Furthermore, an easy method for the fluorescence labeling of spores, i.e., via SYTO®9, is proposed as an effective way to directly detect spore presence.
1. Introduction
The selection of the proper molecular recognition element (MRE) is crucial not only for the development of competitive biosensors, but in general for any assay based on the interaction between an antigen and an analyte, such as immunoassays, western blots, lateral flow assays, and Enzyme-Linked Immunosorbent Assays (ELISAs). MREs can be natural molecules, such as antibodies or enzymes, or synthetic, like aptamers. Aptamers are chemically synthesized single-stranded nucleic acids, DNA- or RNA-based, that bind a wide range of analytes with high affinity and high specificity. The binding occurs by modifying their 3D structure as a consequence of intramolecular folding with the analyte [1]. Another class of synthetic MREs is represented by molecularly imprinted polymers (MIPs), prepared by copolymerization of monomers and crosslinkers in the presence of the analyte (mold). After polymerization, the analyte is generally extracted by washing, thereby leaving molecular cavities complementary to the analyte [2].
Hydrogen bonding, electrostatic interactions, van der Waals forces, and hydrophobic interactions are the primary forces driving the recognition event. To ensure the efficient recognition of the target, the immobilization of the MRE onto the surface must preserve its native 3D structure, preventing denaturation or loss of activity. Different strategies, including physical or chemical adsorption, crosslinking, and affinity-based immobilization, can be used to efficiently immobilize an MRE on a surface, and the choice of the most appropriate method depends on both the nature of the surface and the characteristics of the MRE [3]. Antibodies are commonly immobilized using non-covalent and covalent methods in an oriented or random configuration [4]. Conversely, aptamers can be easily immobilized on a substrate by introducing a chemical group at the end of the sequence to enable direct covalent bonds on the surface, such as a thiol group for gold or silver surfaces or amino groups for carboxyl-terminated surfaces [5,6]. In contrast, MIPs are copolymerized directly on the surface; therefore, the affinity for their target only depends on the MIP structure.
The choice of the MRE also depends on the target analyte. Commercially available aptamers do not cover all targets, and aptamer synthesis remains a lengthy and costly process; similarly, antibody production and MIP synthesis are also complex tasks. The development of a functional interface is therefore driven first by the availability of the MRE and subsequently by the immobilization strategy.
As a practical example of an interface development approach, we addressed a critical agrifood issue related to the detection of bacterial spores.
In the dairy industry, and in particular in milk products, safety assurance is mandatory. Bacillus cereus group is the most important group of rod-shaped aerobic endospore formers responsible for the shelf life of pasteurized milk [7]. B. cereus is a Gram-positive bacterium that can contaminate food in two different ways, causing an emetic or diarrheal syndrome. The first contamination activity is caused by cereulide, a heat- and acid-stable toxin, while the second is caused by the ingestion of vegetative cells and/or their spores [8]. As a spore-forming organism able to survive in cold and thermal habitats, B. cereus can be found in many food products, either refrigerated or dehydrated.
Among the different MREs proposed for B. cereus spore recognition, we focused on aptamers and antibodies. Regarding aptamers, one of the first sequences identified for B. cereus was reported by Bruno & Carrillo in 2012 [9]. Although their primary aim was to develop aptamers against Bacillus anthracis spores from a library of 92 sequences, they ultimately demonstrated that the selected sequences could also bind B. thuringiensis and B. cereus spores. Using the same sequences utilized by Bruno, in 2019 Mazzaracchio et al. [10] immobilized the BAS-6R aptamer sequence directly on the gold surface of a screen-printed electrode and detected the B. cereus spores with an electrochemical impedance spectroscopy method. The second sequence proposed by Bruno (BAS-6F) was used by Moteshareie et al. [11,12] to compare its performance against an antibody assay using a sandwich strategy, where aptamers were immobilized on an ELISA plate to capture B. cereus spores, or were coupled to magnetic particles, and a biotinylated commercial antibody was used to detect the presence of the captured spores. Zheng et al. [13] reported the immobilization of the sequence onto magnetic nanoparticles for a competitive assay. The binding of B. cereus to these particles avoids binding with a complementary sequence linked to a fluorophore, resulting in an increase in the fluorescent signal in the solution. Fischer et al. [14,15] identified different aptamer sequences able to detect the B. cereus spores with an affinity constant in the low nanomolar range. They suggested that the use of a mixture of sequences is the best way to achieve spore recognition in buffer and also in milk, using real-time polymerase chain reaction (RT-PCR). Both aptamers reported by Bruno & Carrillo in 2012 [9] were tested in this study. Regarding the antibody-based strategy, some published works report the use of a specific antibody for the detection of vegetative cells or spores [11,16]. This antibody was selected for developing the antibody-based strategies: random antibody immobilization via physical adsorption or EDC/NHS carbodiimide chemistry results in arbitrary, heterogeneous orientations. This causes steric hindrance, structural distortion, or burial of the antigen-binding sites (Fab fragments) against the surface, significantly reducing antigen capture efficiency. In contrast, Fc-binding proteins (like Protein A, G, or L) specifically binds with high affinity to the conserved Fc region of IgG antibodies, directing them into an oriented, “heads-up” conformation with their Fc domain anchored to the surface and their Fab domains fully exposed to the solution. This optimal orientation maximizes antigen accessibility and increases the active binding capacity.
In addition to appropriate MRE selection, the choice of the surface biofunctionalization method was driven by the selected transducer. Here, a hybrid optical structure was considered as the final transducer target [17]. Among the optical sensors, photonic crystals (PhCs) and plasmonic metal nanostructures represent a well-exploited field. PhCs, characterized by the periodic arrangements of dielectric elements, such as nanospheres, produce a spatial modulation of the refractive index. If the modulation has a length scale comparable to the wavelength of interest, it strongly influences light propagation [18,19]. Among the several types of PhCs, opals are ideal candidates because of their good control over optical properties and their ease of fabrication. Coupling an opal structure with a gold layer enables free-electron oscillations generating plasmons when excited with electromagnetic waves resonant with the plasmonic modes, an effect further intensified by gold nanostructures present at the surface. The resulting electromagnetic field enhancement leads to intense localized fields in subwavelength volumes, dramatically amplifying light–matter interactions [17,20,21] and leading to great potential as sensing platforms. Their sensing capability arises from the enhancement of Raman signals or changes in static transmittance and reflectance spectra upon analyte binding.
In this work, a comparison of disposable MREs for B. cereus spores was performed to identify the most suitable candidate for immobilization onto a gold layer deposited onto a PhC structure. To this end, both aptamer- and antibody-based approaches were investigated, and different immobilization strategies were evaluated, including direct binding through the gold–thiol interaction and indirect immobilization using a lipoic acid intermediate layer followed by carbodiimide coupling chemistry. The experimental conditions associated with each strategy were optimized to maximize immobilization yield and obtain a stable and efficient recognition layer on the gold surface. In parallel, two fluorescence-based detection approaches were compared. The first relied on an indirect fluorescence assay using an aptamer–antibody sandwich format, whereas the second was based on the direct staining of the spores with the SYTO®9 dye. The results showed that the aptamer-based approach provided the most effective MRE layer for B. cereus spore recognition. Raman spectroscopy was then employed as an additional characterization tool to further confirm the interaction between the selected recognition layer and the target spores.
Overall, this work provides not only a practical and effective strategy for selecting the proper MRE for future biosensor development, but also suggests a simple spore detection strategy based on direct fluorescence staining.
2. Materials and Methods
2.1. Chemicals
Thermo Scientific™ Remel™ Bacillus cereus ATCC™ 11778™ Culti-Loops™, Difco™ broth and Corning™ Dulbecco’s Phosphate Buffered Saline (DPBS), Protein A (PtA), 1-ethyl-3-(3-dimethylaminopropyl) carbodiimide hydrochloride (EDC) and N-hydroxysulfosuccinimide (Sulfo-NHS) were purchased from Fisher (Milan, Italy). Glutaraldehyde solution, Grade I, 25% in H2O, Hexamethyldisilazane reagent grade, ≥99%, and ethanol were purchased from Merck Life Science S.r.l. (Milan, Italy). LIVE/DEAD™ BacLight™ Bacterial Viability and Counting Kit (L34856) and Goat anti-Rabbit IgG (H+L) Cross-Adsorbed Secondary Antibody Alexa Fluor™ 568 conjugated polyclonal secondary antibody were purchased from Thermo Scientific (Rockford, IL, USA).
HistoDenzTM, α-lipoic acid, ethanolamine (Et-NH2), Dithiothreitol (DTT), β-Mercaptoethanol (MP-ET), bovine serum albumin (BSA), mouse IgG (I5381, IgG mouse), Amicon® Ultra 10K, and powder for buffer solution were purchased from Sigma-Aldrich (Milan, Italy). Nonfat dried milk powder was purchased from Euroclone (Milan, Italy).
Rabbit polyclonal antibodies to Bacillus cereus/subtilis spores (primary antibody) were purchased from OriGene Technologies GmbH (Herford, Germany). DNA-aptamer sequences used, reported in Table S1, were HPLC-purified and were purchased from IDT Integrated DNA Technologies (Leuven, Belgium).
2.2. Bacteria and Spore Cultures
Spore formation in Bacillus species was promoted by the depletion of metabolizable carbon, nitrogen, and phosphorus sources. In vitro, sporulation can be induced using chemically defined media, such as Spizizen minimal glucose medium [22] or Modified Schaeffer’s sporulation medium [23]. In this study, Modified Schaeffer’s sporulation medium was used. The medium contains, per liter, 16 g of nutrient broth, 0.5 g MgSO4.7H2O, and 2.0 g KCl. The components were dissolved in deionized water, the pH was adjusted to 7.0, and the medium was autoclaved. After cooling to approximately 60 °C, stock solutions of Ca(NO3)2, MnCl2, and FeSO4 were added to final concentrations of 1, 0.1, and 1 mM, respectively. Strains of either B. subtilis or B. cereus were then cultured overnight (at least 16 h) at 37 °C with shaking (150 rpm) to allow time for spore formation. Spore formation can be examined visually under a phase contrast microscope, or samples can be subjected to heat challenge (i.e., 80 °C for 20 min) and then plate sample dilutions on solid media, like LB agar, to count colony formation and estimate sporulation efficiency.
Spores were then purified using a density gradient centrifugation with HistoDenzTM [24]: briefly, 0.2 mL of spores were added to 1 mL of HistoDenzTM prepared according to the manufacturer’s instructions, and centrifuged at 4500 g for 10 min, washed once in water, and finally resuspended in PBS buffer, ready for incubation on the surfaces.
Spore suspensions were quantified using both direct microscopic counting and viable plate counting. For direct enumeration, spores were stained with SYTO®9 and counted in a Thoma counting chamber by wide-field fluorescence microscopy. In parallel, serial dilutions of heat-treated spore suspensions (80 °C for 20 min) were plated on LB agar, and viable heat-resistant spores were enumerated as colony-forming units (CFU mL−1). Both measurements were used to determine and confirm the concentrations of the spore suspensions employed in the subsequent experiments.
2.3. Surface Preparation and Functionalization
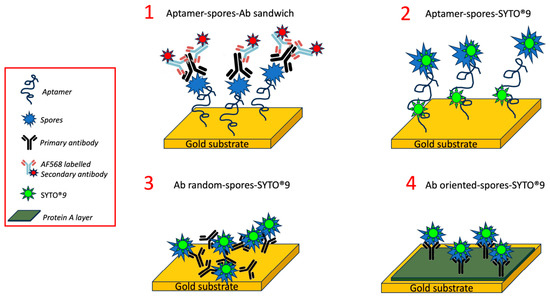
Gold substrates were first cleaned by argon plasma for 2 min at 6.8 W (power applied to RF coil) to remove organic contaminants, then different strategies to immobilize the specific MRE (aptamer or antibody) were employed (as reported in Scheme 1). The local MRE immobilization was achieved by using an array spotter (BiOdyssey Calligrapher MiniArrayer, Bio-Rad) equipped with a 310 μm solid pin in an array configuration in order to enhance the signal-to-noise fluorescent ratio.
Scheme 1.
Representation of the different functionalization and detection strategies.
Aptamer immobilization: after plasma cleaning, the aptamer solution was treated with two different strategies to unfold the sequence strands and make the thiol group available for the immobilization reaction. The first strategy, named thermal treatment, was based on a thermal shock (95 °C for 1 min, ice for 10 min), while the second (chemical reduction) was based on a DTT treatment. Chemical reduction was obtained by adding 10 mM DTT in 0.5 M sodium carbonate/bicarbonate with a pH of 9 to the aptamer solution for 1 h at room temperature and 400 rpm agitation. DTT was then removed with AmiconR Ultra-0.5 Centrifugal Filter Devices (Merck Life Science S.r.l.; Milan, Italy), and the final concentration of the aptamer was determined by spectrophotometry (Nanodrop ND-1000 spectrophotometer, Nanodrop Technologies, Wilmington, DE, USA). The aptamer deposition was performed by spotting the aptamer dissolved in 0.5 M sodium carbonate/bicarbonate buffer at pH 9, then leaving the substrates in a humid chamber overnight. After washing in the same buffer, a passivation step with 1 mM MP-ET prepared in the same buffer was performed for 30 min. A final wash in MilliQ water completed the protocol (Strategies 1 and 2 in Scheme 1).
Antibody immobilization (RANDOM): after plasma cleaning, substrates were immersed in 0.3 mM α-lipoic acid in MilliQ water overnight at room temperature. After incubation and three washes with MilliQ water, the activation of carboxylic groups was performed using a mixture of 40 mM EDC and 10 mM sulpho-NHS dissolved in 100 mM MES buffer pH 6 for 30 min in an orbital shaker at 100 rpm. Then, a 4 μM antibody solution was spotted in PBS buffer (10 mM phosphate buffer, 138 mM NaCl, 2.7 mM KCl, pH 7.4). Finally, after 2 h of incubation, surfaces with antibody arrays were washed three times in PBS buffer and passivated first with 1 mM Et-NH2 for 30 min and then with 1% w/v BSA for 30 min in an orbital shaker, completing the procedure by washing them in buffer (Strategy 3 in Scheme 1).
Antibody immobilization (ORIENTED): the same procedure as the random antibody immobilization was adopted for the oriented antibody immobilization, but an additional step before antibody spotting was added. This step was based on the deposition of a layer of Protein A. A solution of 0.05 mg/ml Protein A in PBS buffer was incubated on EDC/sNHS activated surface for 1 h on an orbital shaker. After washing in PBS, antibody spotting was performed as previously reported (Strategy 4 in Scheme 1).
2.4. Fluorescent Spores’ Detection
In accordance with Scheme 1, two different strategies were employed to detect the spores. The first strategy was based on the intercalation of a fluorescent dye (SYTO®9) directly into the genetic material inside the spores (Strategies 2–4 in Scheme 1), while the second relays on an antibody sandwich (Strategy 1 in Scheme 1). To stain the spores directly, a static incubation with 5 μM of SYTO®9 in TE buffer (10 mM Tris, 1 mM EDTA, pH 8) was performed for 15 min in the dark; the fluorescence signal was then analyzed as reported in the next paragraph. The antibody sandwich was instead prepared first by passivating the surfaces with 1% w/v BSA or 1% MILK w/v in PBS for 30 min at 100 rpm, and then incubating the surfaces with 0.5 mg/ml (1:10 dilution) of primary antibody in the same passivating solution for 30 min at 100 rpm. After washing the surfaces with PBS, a final incubation step using 2 μg/ml (1:1000 dilution) of secondary labeled antibody in the same passivating solution was performed for 30 min at 100 rpm. A further wash with PBS was performed before imaging the surfaces using a fluorescence microscope, as reported in the next paragraph.
2.5. Hybrid Device Preparation
Metallo-dielectric systems were obtained by growing a dielectric colloidal crystal on commercial silica monodisperse microspheres (290 nm in diameter), obtained as a 10% (volume) water suspension (Bang Laboratories Inc., Fishers, IN, USA; refractive index, nSiO2 = 1.45; standard deviation < 5%), using the vertical deposition technique [19]. Next, a thin film (20 ± 2 nm) of pure gold was evaporated on the top of microspheres by e-beam evaporation in a high-vacuum chamber.
2.6. Surface Characterization
Raman measurements were performed with the LabRAM Aramis (Horiba Jobin-Yvon, Oberursel, Germany), using the optical microscope with the 100X objective and 632.8 nm source wavelength on 5 independent points across the sample surface. Raman spectra analysis and data processing were performed using Origin (Pro) 2023b (OriginLab Corporation, Northampton, MA, USA). Specifically, a baseline correction was applied to eliminate the autofluorescence background, followed by signal smoothing using the Savitzky–Golay algorithm to improve the signal-to-noise ratio.
XPS analysis was performed using a Kratos Axis UltraDLD instrument (Kratos Analytical Ltd., Stretford, UK) equipped with a hemispherical analyzer and a monochromatic Al Kα (1486.6 eV) X-ray source, in spectroscopy mode. Survey spectra and the principal core levels (O 1s, C 1s and Au 4f) were acquired at 0° emission angle, and the relative elemental percentage was obtained by integrating the area under the core lines, applying the Shirley background subtraction, and correcting for the atomic sensitivity factors through dedicated software [25].
A Leica DMLA fluorescence microscope equipped with a mercury lamp and a fluorescence filter L5 (Leica Microsystems, Wetzlar, Germany) was used for measuring labeled spores. The fluorescence was measured with a cooled CCD camera (DFC420C, Leica Microsystems, Germany) using a 10X magnification objective, and fluorescence data were analyzed with the Fiji software [26].
2.7. Experimental Replicates and Statistical Analysis
Unless otherwise stated, each experiment was performed using three independently prepared and functionalized substrates. Multiple spots measured on the same substrate were considered technical replicates and were averaged to obtain one value for each substrate. Thus, the experimental unit was the independently prepared substrate, and n = 3 refers to three independent substrate preparations. Results were reported as the mean ± standard deviation. Statistical significance between groups was determined using Welch’s t-test, calculating the p-value using a one-tailed (right-tailed) distribution; differences were considered statistically significant at p < 0.05 (* p < 0.05, ** p < 0.01, *** p < 0.001).
3. Results and Discussion
3.1. Optimization of the MRE Immobilization
The several steps implemented for the optimal immobilization of MRE were characterized by different techniques. First, the chemical composition of the bare substrate was assessed using XPS analysis. Table S1 reports the elemental composition measured for the substrate (named “Gold deposited on silicon substrate”) in comparison with two areas of a substrate suitable for biosensing, i.e., “Gold coated opal on silica slide” and “Gold coated silica slide”. A hydrocarbon contamination was present on all substrates, as expected. Regarding the gold content, the percentage was relatively high (37%) on the gold layer deposited on the silicon substrate, enough to be explored for functionalization with MRE. The amount of gold measured on the other two substrates was higher, both when gold coated the silica slide directly and when opal was present. This result suggests an improved chemical condition for the preparation of MRE-functionalized surfaces for opal-based biosensors.
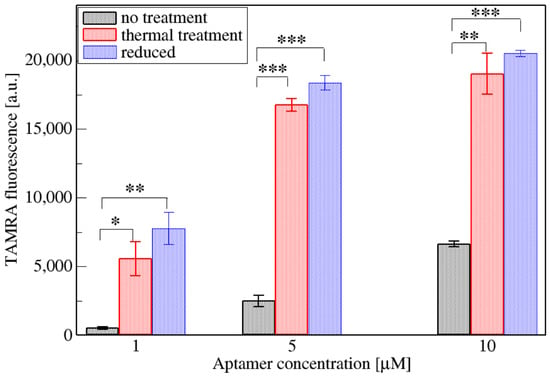
Regarding aptamers, their immobilization on the gold surface was optimized by comparing the two main protocols used, i.e., the first based on a chemical reduction and the second, which is both faster and easier, based on thermal treatment. The chemical reduction of a thiolated aptamer sequence is recommended by manufacturers, using dithiothreitol (DTT) or Tris(2-carboxyethyl) phosphine (TCEP). Several papers report the use of reducing agents for enhancing aptamer binding on the gold surface [27,28]. Moreover, several authors also use DTT as a passivating agent, without its removal from the solution after the reduction reaction [29,30,31]. This procedure is, however, long and laborious compared to thermal treatment, because it requires chemicals, centrifugation, filters, and quantification, leading to an overall procedure lasting 1 or 2 h. A thermal treatment consisting of 95 °C for 1 min and 10 min on ice [32,33] is simple and can be as efficient as the chemical reduction for achieving aptamer immobilization. The two protocols and immobilization without any treatment were compared in Figure 1 (the original fluorescence images related to the two treatments were reported in Figure S1).
Figure 1.
Comparison of the two aptamer treatments designed to enhance aptamer immobilization on the gold surface. An untreated condition was included as a reference, and three aptamer concentrations were tested. Bars represent the mean fluorescence intensity obtained from three independently prepared and functionalized substrates (n = 3). For each substrate, fluorescence intensity was averaged over at least three spots, considered technical replicates. Error bars represent the standard deviation among the three independent substrates. The significance of the differences between non-treated and treated aptamers was statistically evaluated with a Welch’s t-test (* p < 0.05, ** p < 0.01, *** p < 0.001).
Both thermal treatment and chemical reduction increase the amount of fluorescent aptamers on the surface compared to the “no treatment” condition (Figure 1). Moreover, the fluorescence due to the immobilized aptamers is very similar between thermal treatment and chemical reduction for all the aptamer concentrations tested. Notably, thermal treatment saves both time and reagents. Therefore, the thermal treatment was selected as the optimal pretreatment of aptamers before spotting on the gold surface. Besides aptamer treatment, Figure 1 shows different concentrations of aptamer solution used for spotting, highlighting that the higher the aptamer concentration, the higher the measured fluorescence. Accordingly, the aptamer solution concentration of 10 μM was selected to ensure a sufficiently high surface density.
Regarding antibodies, two strategies were tested for their immobilization on the gold surface. The first strategy is based on random immobilization, while the second is based on an oriented layer obtained with Protein A, which binds antibodies in an optimal configuration for analyte recognition. These two strategies were previously validated for different applications, such as the detection of bacteria [34] and proteins [35] for the oriented strategy, and the detection of enzymes [36] or proteins [37] for the random strategy.
3.2. Fluorescent Detection of the Spores (Strategy 1)
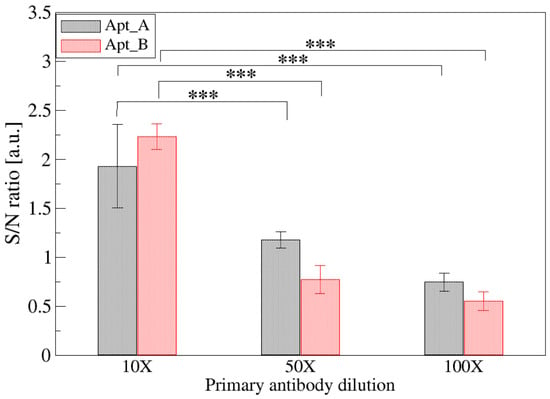
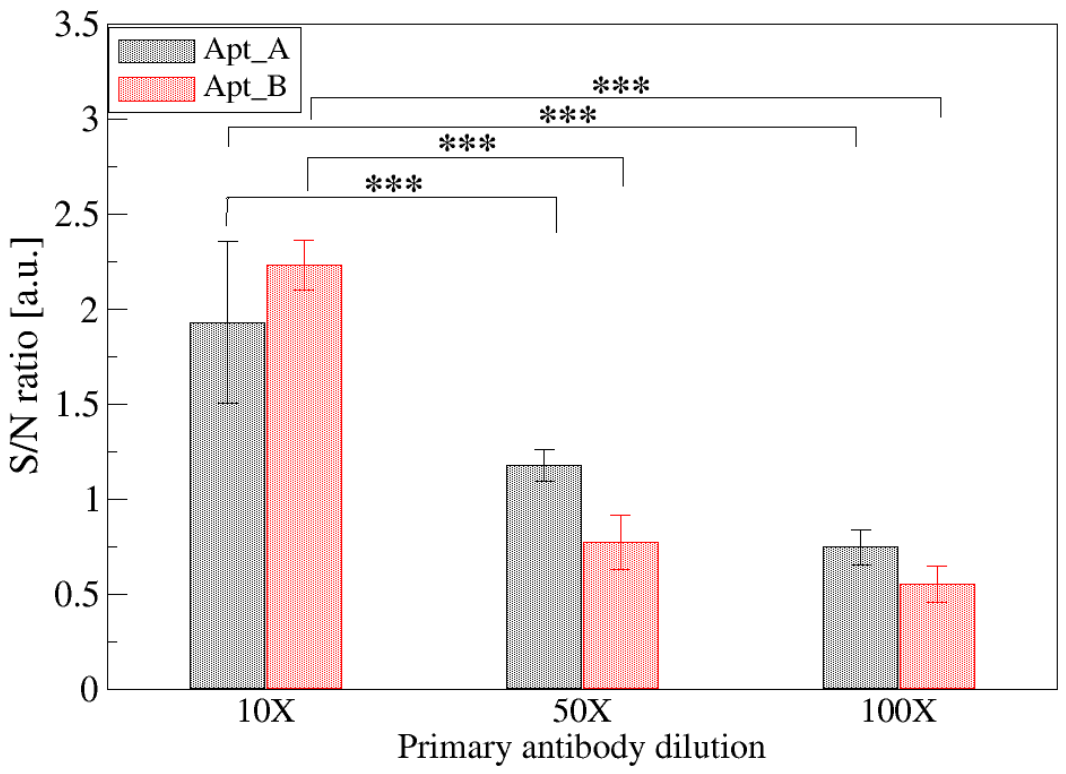
Two different strategies based on fluorescence were compared to detect bacterial spores, i.e., “Strategy 1” based on an aptamer–antibody sandwich and “Strategy 2” relying on SYTO®9 intercalation (Scheme 1). To optimize Strategy 1, the primary antibody that detects the spores captured by aptamers was diluted from 10 to 100 times. Figure 2 shows the signal-to-noise ratio obtained for two aptamer arrays prepared using two different aptamer sequences (reported in Table S2). Signals higher than 1 indicate that the fluorescence of the aptamer array is significantly higher than the background and therefore could be ascribed to the presence of bacterial spores.
Figure 2.
Effect of primary-antibody dilution on the fluorescence signal-to-noise ratio obtained with Apt_A- and Apt_B-functionalized arrays. The ratio was calculated by dividing the fluorescence intensity of each aptamer spot (signal) by that measured on the adjacent aptamer-free gold surface (noise). B. cereus spores were tested at a fixed concentration of (1.5 ± 0.2) × 106 spores mL−1. Bars represent the mean obtained from three independently prepared and functionalized substrates (n = 3). For each substrate, ratios from at least three spots, considered technical replicates, were averaged to obtain a single value. Error bars represent the standard deviation among the three independent substrates. The significance of the differences between 10× and 50× or 100× dilution antibodies is statistically evaluated with a Welch’s t-test (*** p < 0.001).
Results shown in Figure 2 clearly suggest that a 10-fold dilution of the primary antibody is needed for a reliable measurement of spores and therefore was selected for the next experiments. Negligible differences are found between arrays prepared with Apt_A and Apt_B.
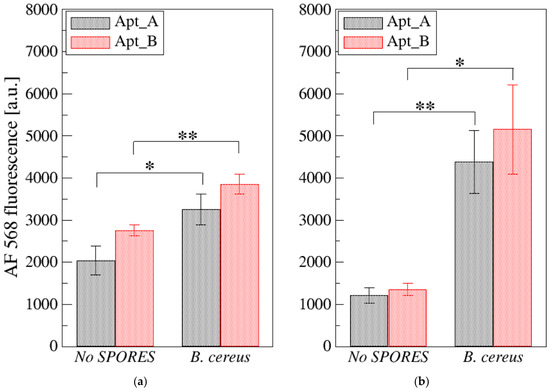
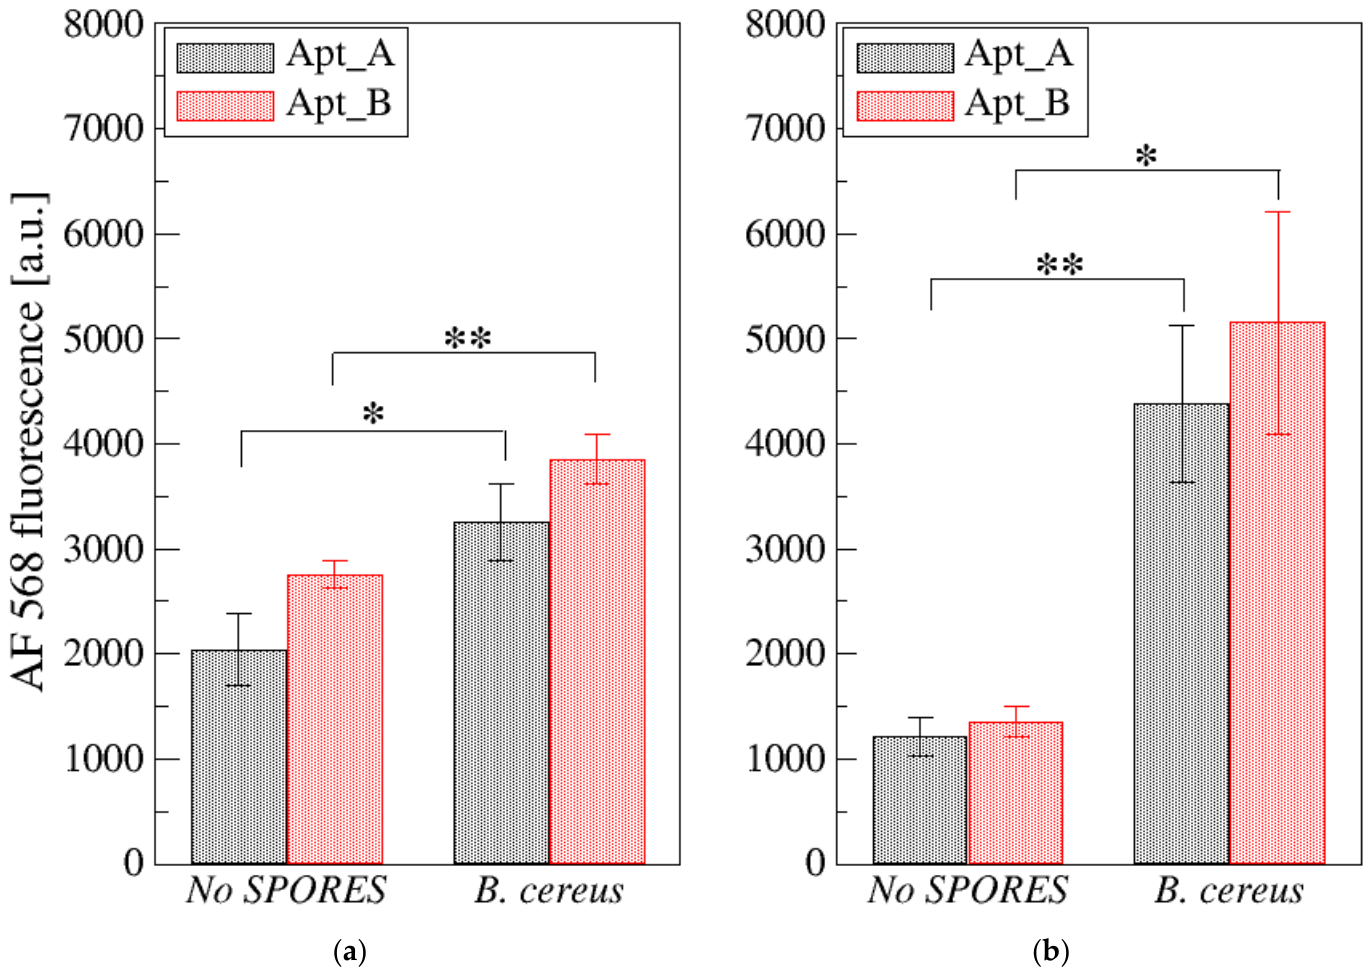
Another important aspect evidenced in Figure 2 is the quite high background found at the lower antibody concentrations, possibly due to the non-specific adsorption of antibodies on the surface. To enhance the performance of Strategy 1, it is crucial to find optimal passivating agents able to avoid the non-specific adsorption of molecules. To this purpose, two different molecules were tested, namely bovine serum albumin (BSA) and nonfat dried milk (MILK). The passivation protocol was the same for both reagents and was performed after spore incubation and prior to the sandwich reaction. Figure 3 reports the comparison between BSA (Figure 3a) and MILK (Figure 3b) passivation on the two aptamer arrays in terms of ability to enhance spore recognition with respect to the non-specific binding on the aptamer array without spores. Both blocking agents allow the detection of spores, but MILK was more effective in increasing signal intensity and in reducing the background. Non-specific adsorption of the fluorescent antibodies on the aptamer layer was indeed observed (condition named “No SPORES” in Figure 3), in particular when BSA was used for passivation.
Figure 3.
Effect of passivation with 1% (w/v) BSA (a) or 1% (w/v) nonfat dried milk (b) on the secondary-antibody fluorescence signal obtained from Apt_A- and Apt_B-functionalized arrays. Arrays incubated with buffer instead of spores and otherwise processed identically were used as no-spore controls (“No SPORES”). B. cereus spores were tested at a concentration of (1.5 ± 0.2) × 106 spores mL−1. Bars represent the mean fluorescence intensity obtained from three independently prepared and functionalized substrates (n = 3). For each substrate, measurements from at least three spots, considered technical replicates, were averaged to obtain a single value. Error bars represent the standard deviation among the three independent substrates. The significance of the differences between no spores and B. cereus spores on Apt_A- or Apt_B-functionalized arrays was statistically evaluated with a Welch’s t-test (* p < 0.05, ** p < 0.01).
Notably, the same experiment performed with B. subtilis spores gave no fluorescence signal for both the passivating agents tested (Figures S2 and S3). Since the primary antibody has previously been tested as equivalent in detecting spores of B. cereus and B. subtilis and the presence of spores is measured via direct staining (see next section), we hypothesize that the binding of the antibody is impeded by the aptamer binding. The long aptamer sequence could produce a 3D conformation that hinders the binding sites of the antibody, resulting in a fluorescence signal lower than the background signal. Moreover, the multi-step sandwich protocol requires primary and labeled secondary antibodies, which are prone to non-specific adsorption onto the surface, creating high background noise. Therefore, the hybrid aptamer–antibody approach (Strategy 1, Scheme 1) could have drawbacks related to the selection of an aptamer–antibody pair that effectively produces a suitable sandwich for spore detection.
To overcome this possible issue, an alternative approach was explored by directly staining the captured spores, eliminating the need for a bulky secondary recognition antibody, completely bypassing steric hindrance and non-specific antibody binding while providing a faster, single-step detection protocol. SYTO®9, a fluorescent intercalating dye that permeates the spore membrane and intercalates directly into the internal nucleic acids, is used to stain the genetic material of the spores (Strategy 2 in Scheme 1), as reported in the next paragraph.
3.3. MRE Comparison and Fluorescence Strategies 2–4
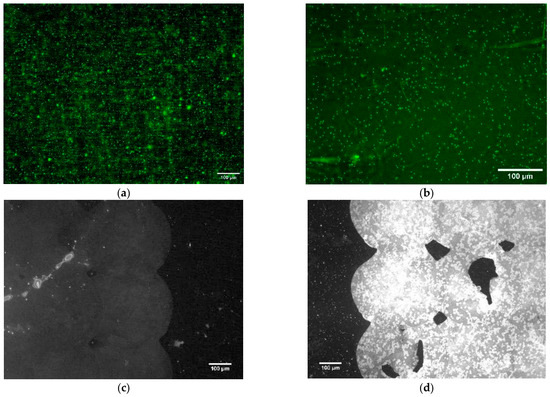
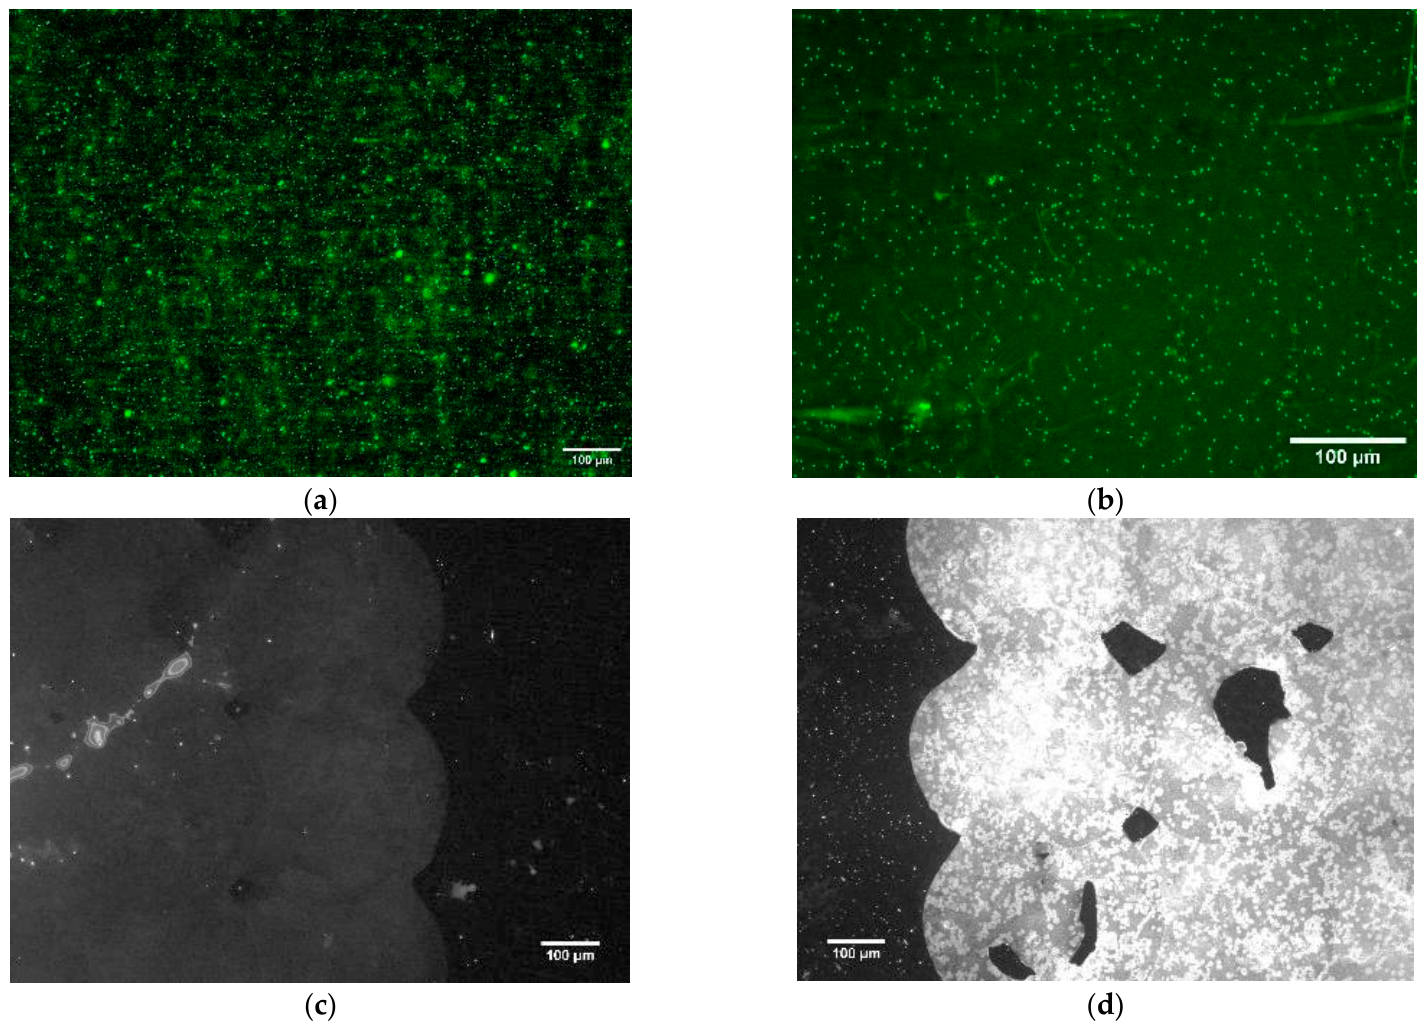
The SYTO®9 fluorescent dye was used to evaluate the presence of spores on the differently prepared substrates (i.e., Strategy 2, 3 and 4 in Scheme 1). SYTO®9 stains nucleic acids of both prokaryotic and eukaryotic cells by permeating cell membranes. The ability of this dye to stain even bacterial spores was first confirmed in solution by fluorescence microscopy. Figure 4 reports the staining of the spores of B. cereus (a) and of B. subtilis (b), highlighting that both spores are successfully stained. Therefore, SYTO®9 is suitable for evidencing the presence of spores on the functionalized surfaces.
Figure 4.
(a) B. cereus spores stained with SYTO®9 fluorophore in solution; (b) B. subtilis spores stained with SYTO®9 fluorophore in solution; (c) Apt_B array on gold surface without spores stained with SYTO®9 fluorophore; and (d) Apt_B array on gold surface with B. cereus spores stained with SYTO®9 fluorophore.
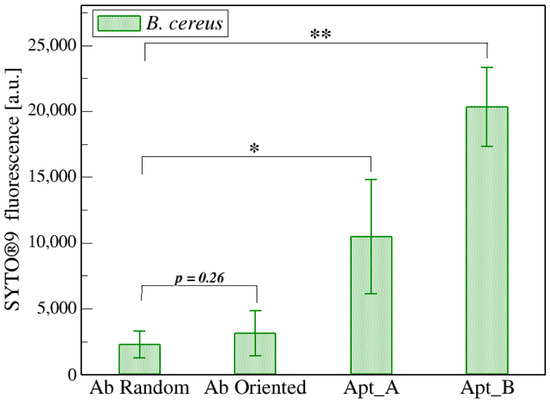
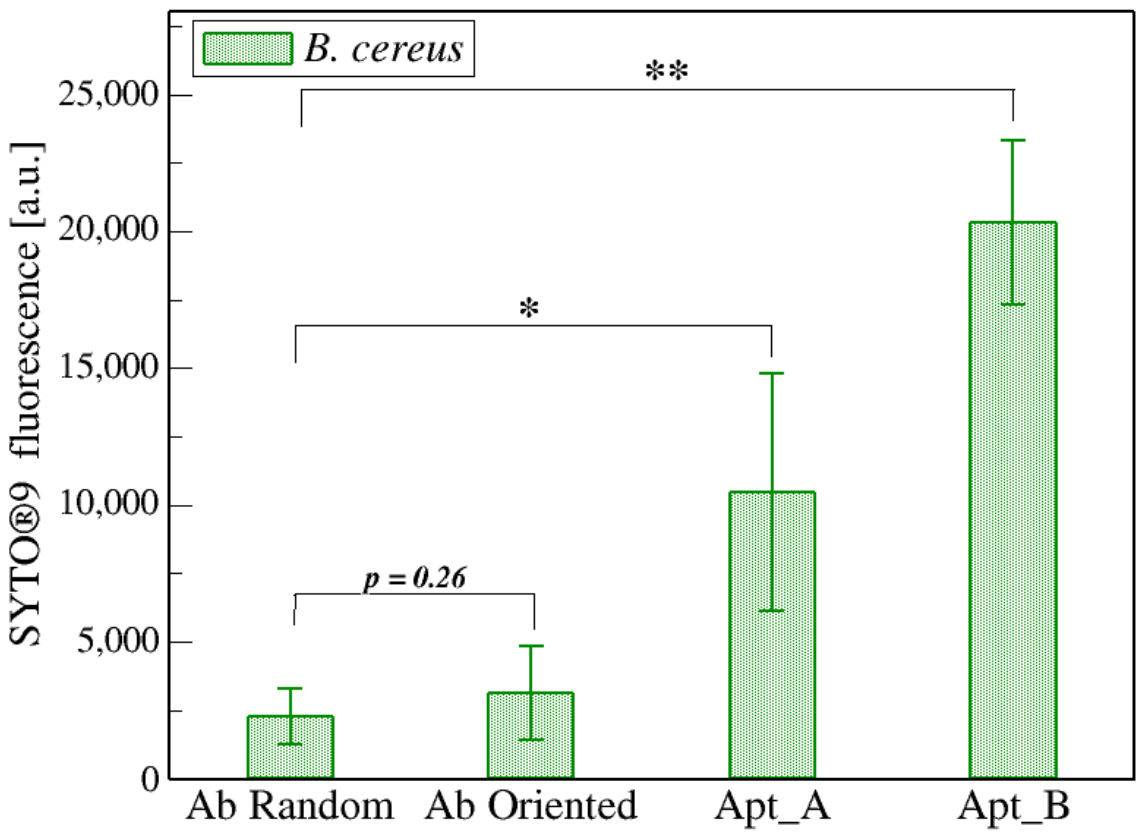
An example of the Apt_B array on gold without or with B. cereus spores stained with SYTO®9 is reported in Figure 4c and Figure 4d, respectively. A strong fluorescence signal is clearly visible when spores are incubated on the surface (Figure 4d), while a relatively low signal is measured on the aptamer array without spores. The presence of this modest signal could be due to the binding of SYTO®9 to the three-dimensional structure of the aptamer chain, which is quite long (see Table S2). In fact, when shorter aptamer sequences are used, negligible fluorescent signals are detected. The staining with SYTO®9 is used to compare the efficiency of strategies 2, 3, and 4 in terms of spore capture. The fluorescence signal measured for both aptamer arrays was 4- to 8-fold higher than the signal detected for the antibody-based strategies (Figure 5). The aptamer-based strategy was indeed more efficient in recognizing the B. cereus spores compared to the antibody-based strategies. In particular, the Apt_B sequence was the most efficient and was therefore selected for the subsequent functionalization of the gold substrate for Raman measurements.
Figure 5.
SYTO®9 fluorescence measured for arrays prepared following Strategy 2 (with two different aptamer sequences, Apt_A and Apt_B), or Strategy 3 and 4 (random or oriented immobilization of antibodies, respectively). Bars represent the mean fluorescence intensity obtained from three independently prepared and functionalized substrates (n = 3). For each substrate, measurements from four spots (subtracted for the array signal without bacterial spores), considered technical replicates, were averaged to obtain a single value. Error bars represent the standard deviation among the three independent substrates. Spores are incubated on the arrays for 1 h at (1.5 ± 0.2) × 106 spores mL−1. The significance of the differences between random antibody (Ab Random) and the other strategies was statistically evaluated with a Welch’s t-test (* p < 0.05, ** p < 0.01).
3.4. Raman Characterization of the Spore Recognized by the Best Identified MRE
To provide a label-free chemical validation of the capture efficiency, Raman spectroscopy was performed on the gold substrate functionalized with Apt_B and used for B. cereus spore capture. This technique allows a label-free, intrinsic chemical fingerprint without requiring fluorophores or secondary reagents, providing an orthogonal, definitive confirmation that intact B. cereus endospores are indeed captured on the functionalized surface. Measurements were performed using a 632.8 nm laser to minimize sample autofluorescence.
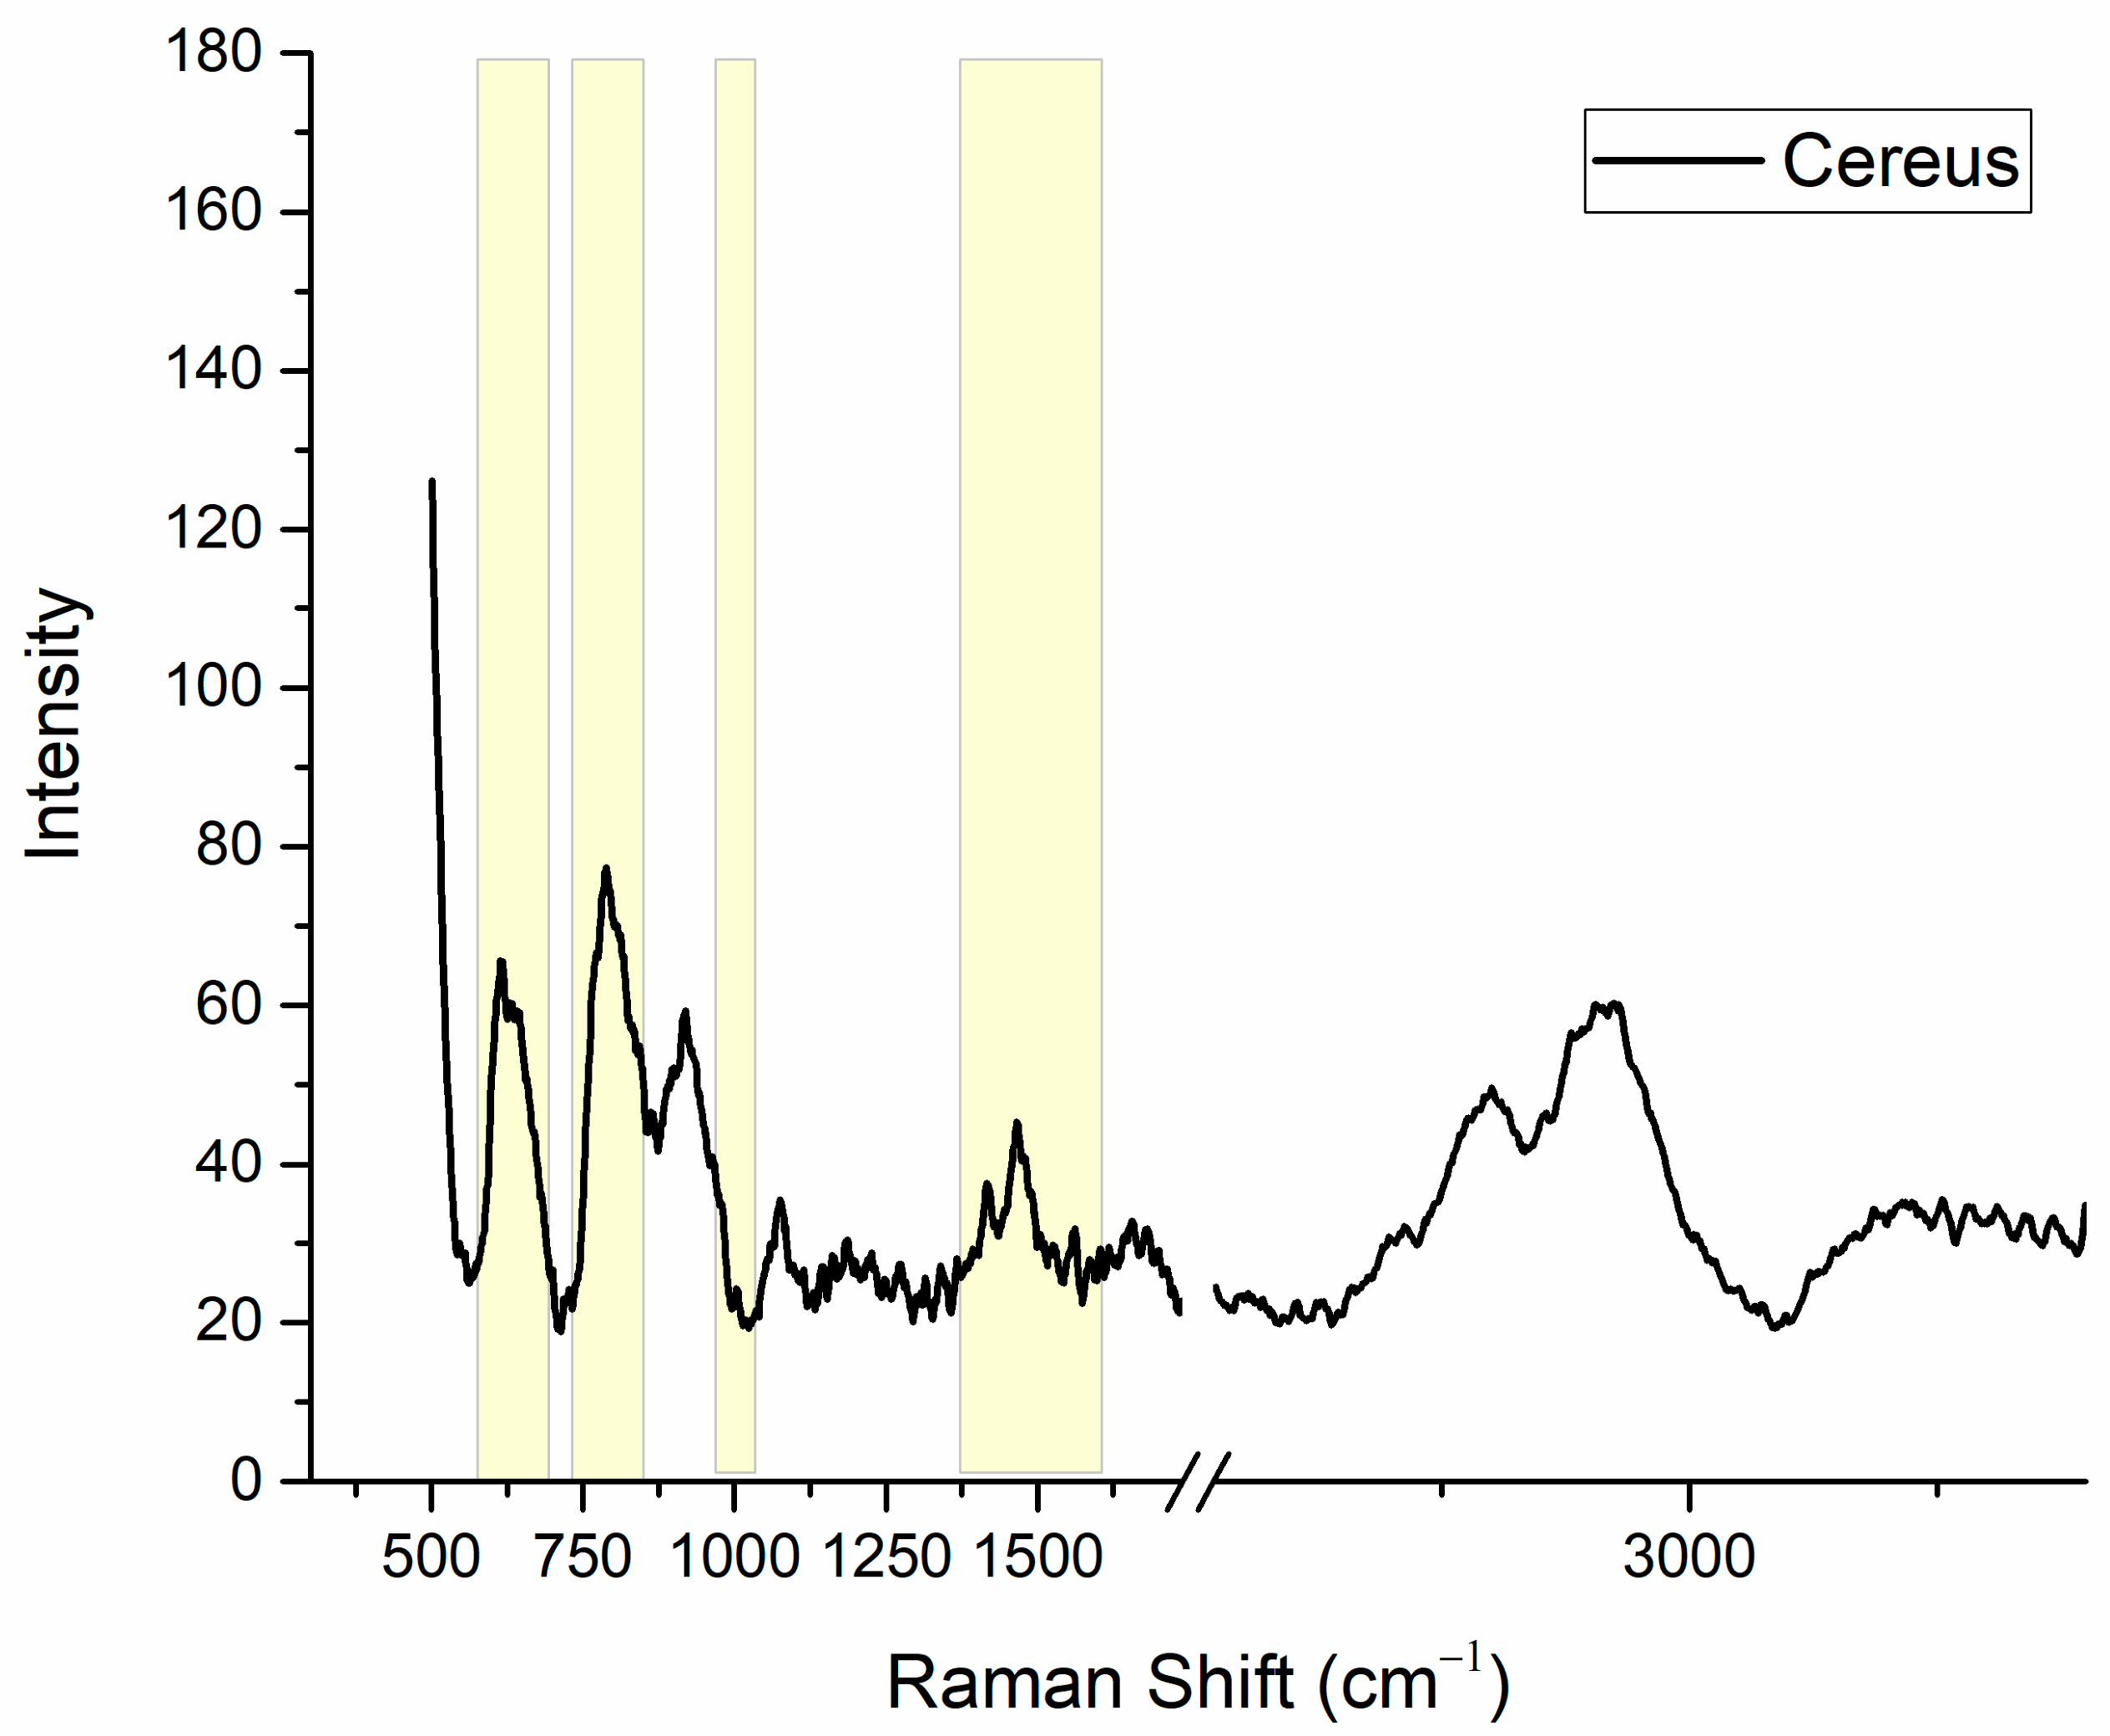
To ensure the correct interpretation of the molecular signatures, the Raman spectrum presented in Figure 6 was subjected to a data processing workflow, including baseline subtraction to remove the substrate background contribution and smoothing to improve the signal-to-noise ratio. As shown in Figure 6, the Raman spectrum for B. cereus spores is dominated by the signature of calcium dipicolinate (CaDPA), which is the definitive biomarker for bacterial endospores. CaDPA is indeed present at high concentration as a gel enclosed by a semi-crystalline inner spore membrane and therefore can be effectively detected using Raman spectroscopy [38].
Figure 6.
Substrate-subtracted and smoothed SERS spectra of B. cereus spores on an Apt_B-functionalized gold substrate, where the characteristic CaDPA features are highlighted in yellow.
To better understand the distinct features of the bacterial spores, Table 1 provides a comprehensive summary of the observed Raman shifts and their corresponding vibrational assignments [38,39]. Analysis of the fingerprint region (500–1800 cm−1) reveals characteristic CaDPA vibrations clearly resolved at 660 cm−1 (ring deformation), 825 cm−1 (C-H out-of-plane bending), and the carboxylate stretching modes at 1395 cm−1 (COO-symmetric) and 1575 cm−1 (COO-asymmetric).
Table 1.
Raman band assignments and species-specific markers.
In the high-wavenumber region (up to 3800 cm−1), a strong, broad band centered at 2935 cm−1 is observed. This band corresponds to the C-H stretching and is assigned to the aliphatic groups of proteins and lipids present in the spore coat. Additionally, a broad feature between 3200 and 3600 cm−1 (O-H and N-H stretching) suggests the presence of surface hydration and peptide-related nitrogen bonds, indicating that the spores maintain their biological integrity within the sensor environment.
3.5. Future Biosensors Perspective
Fluorescence and Raman spectroscopy confirmed the presence of B. cereus spores on the aptamer-functionalized gold substrate, suggesting the possible future implementation of this surface biofunctionalization in biosensors. Some biosensors based on electrochemical detection [10,40], lateral flow systems [41], surface plasmon resonance [42], or fluorescence [13,43,44] are proposed for B. cereus spore recognition, highlighting the relevance of developing easy, fast, and precise systems for early spore detection. A step toward this goal was taken by evaluating a hybrid opal/gold optical platform, recently proposed by our group [17]. This system can measure an optical variation when bacteria adhere to the sensing surface. In detail, the deposition of bacteria on the surface of the opal/gold hybrid induces a red shift of the transmission dip associated with the photonic band gap. Figure S4 shows the measurement of bacteria deposited on the platform surface compared to the reference without bacteria. The transmittance of the opal/gold hybrid without (red line) and with (black line) bacterial deposition shows a decrease in the presence of bacteria, and the fine spectral features of the opal are smoothed. These findings suggest that even bacterial spores could be easily detected, especially if the gold surface lying over opal is functionalized with aptamers. Therefore, a specific signal due to spore capture could be measured, allowing for their detection in more complex solutions and moving closer to real-world settings in biosensing.
4. Conclusions
The architecture of the biointerface is a critical determinant of biosensor performance, as the conformation, accessibility, surface density, and orientation of molecular recognition elements (MREs) directly govern target capture efficiency. In this study, different recognition elements and immobilization approaches were systematically evaluated for the detection of B. cereus spores on gold surfaces, including aptamer-based interfaces and antibody-based interfaces prepared using random or oriented immobilization strategies.
Under the experimental conditions investigated, aptamer-functionalized surfaces produced stronger analytical responses than those functionalized with the selected antibody. This result is specific to the recognition elements, surface chemistries, and assay conditions examined and should not be interpreted as demonstrating a general superiority of aptamers over antibodies. Fluorescence imaging demonstrated the detection of surface-captured spores using both an aptamer–antibody sandwich assay and direct SYTO®9 staining. Raman spectroscopy provided complementary evidence of endospore capture through the detection of characteristic calcium dipicolinate bands. Because SYTO®9 is a non-specific nucleic acid stain, the selectivity of the fluorescence assay is determined by the aptamer-based capture layer rather than by the dye itself. The opal/gold hybrid platform also exhibited measurable changes in its transmission spectrum following microbial deposition, supporting its potential use as an optical transduction platform; however, its integration with the selective aptamer-based capture system remains to be demonstrated.
Further studies should therefore assess concentration-dependent responses, limits of detection and quantification, inter- and intra-batch reproducibility, cross-reactivity toward other bacterial species, and performance in real food samples. Overall, the present findings identify the investigated aptamers as promising recognition elements for the development of optical biosensors for B. cereus spores, providing a basis for the subsequent analytical validation of the proposed sensing approaches.
Supplementary Materials
The following supporting information can be downloaded at https://www.mdpi.com/article/10.3390/colloids10050074/s1, Table S1: Elemental composition determined by XPS analysis at a take-off angle of 0°; the error does not exceed 1–2% of the reported value. The oxygen content is quite high for “Gold deposited on silicon substrate” as a result of the presence of a silicon signal typical of silicon oxide, suggesting an incomplete gold coating; Figure S1: images of fluorescent aptamer immobilized on flat gold surfaces after thermal treatment or DTT reduction; Table S2: aptamer sequences used in the work; Figure S2: Fluorescence signal of the secondary antibody using a MILK 1% w/v passivation on the two aptamer arrays. A comparison is reported with the array passivated and incubated with buffer instead of spores. Data are reported as the mean value of three spots, and error bars represent the standard deviation. B. cereus and B. subtilis spores are incubated at (1.5 ± 0.2) × 106 spores mL−1. Negative fluorescence signals are due to background subtraction; Figure S3: Fluorescence signal of the secondary antibody using a BSA 1% w/v (A) or MILK 1% w/v (B) passivation on the aptamer arrays. Top panels report the array without the spores; middle panels show the Apt_A array, and bottom panels show the Apt_B array. B. subtilis spores are incubated at (1.5 ± 0.2) × 106 spores mL−1; Figure S4: Inverse of the static transmittance spectra measured with the opal/gold hybrid platform at normal incidence (0°) without (red) and with (black) bacterial deposition. The spectra were obtained from the ratio of the probe transmission through the sample and the probe transmission in air.
Author Contributions
L.P.: Conceptualization, Methodology, Formal analysis, Investigation, Data Curation, Writing—Original Draft, Writing—Review & Editing. M.B.W.: Methodology, Formal analysis, Data Curation, Writing—Original Draft, Writing—Review & Editing; C.P.: Methodology, Formal analysis, Data Curation, Writing—Review & Editing; L.V.: Formal analysis, Investigation, Data Curation, Writing—Review & Editing; P.B.: Methodology Data Curation, Writing—Review & Editing; M.B.: Methodology, Formal analysis, Data Curation, Writing—Review & Editing; A.C.: Conceptualization, Methodology, Supervision, Formal analysis, Investigation, Data Curation, Resources, Funding acquisition, Writing—Original Draft, Writing—Review & Editing. All authors have read and agreed to the published version of the manuscript.
Funding
This work is supported by the project CNR “EPOCALE” (2022–2024), by “AGRITECH” project (Centro Nazionale per le Tecnologie dell’Agricoltura, Finanziato dall’Unione europea—Next Generation EU-PNRR 2022–2025), by PRIN2022 PNRR “ACONITE” (Finanziato dall’Unione europea—Next Generation EU, grant n◦ P2022HRTYH).
Data Availability Statement
The original contributions presented in this study are included in the article/Supplementary Material. Further inquiries can be directed to the corresponding author.
Conflicts of Interest
Author Laura Pasquardini was also employed in Indivenire Srl. The other authors declare that they have no known competing financial interests or personal relationships that could have appeared to influence the work reported in this paper.
References
- Wang, T.; Chen, C.; Larcher, L.M.; Barrero, R.A.; Veedu, R.N. Three decades of nucleic acid aptamer technologies: Lessons learned, progress and opportunities on aptamer development. Biotechnol. Adv. 2019, 37, 28–50. [Google Scholar] [CrossRef] [Scilit] [PubMed]
- Haupt, K.; Rangel, P.X.M.; Bui, B.T.S. Molecularly Imprinted Polymers: Antibody Mimics for Bioimaging and Therapy. Chem. Rev. 2020, 120, 9554–9582. [Google Scholar] [CrossRef] [Scilit] [PubMed]
- Chalyan, T.; Ottevaere, H.; Pasquardini, L. Optical biosensors: From working principles to detection methods of label-free devices. In Biophotonics and Biosensing: From Fundamental Research to Clinical Trials Through Advances of Signal and Image Processing; Elsevier: Amsterdam, The Netherlands, 2024; Chapter 2. [Google Scholar] [CrossRef] [Scilit]
- Trilling, A.K.; Beekwilder, J.; Zuilhof, H. Antibody orientation on biosensor surfaces: A minireview. Analyst 2013, 138, 1619–1627. [Google Scholar] [CrossRef] [Scilit] [PubMed]
- Odeh, F.; Nsairat, H.; Alshaer, W.; Ismail, M.A.; Esawi, E.; Qaqish, B.; Bawab, A.A.; Ismail, S.I. Aptamers Chemistry: Chemical Modifications and Conjugation Strategies. Molecules 2020, 25, 3. [Google Scholar] [CrossRef] [Scilit] [PubMed]
- Röthlisberger, P.; Hollenstein, M. Aptamer chemistry. Adv. Drug Deliv. Rev. 2018, 134, 3–21. [Google Scholar] [CrossRef] [Scilit] [PubMed]
- Vidic, J.; Chaix, C.; Manzano, M.; Heyndrickx, M. Food Sensing: Detection of Bacillus cereus Spores in Dairy Products. Biosensors 2020, 10, 15. [Google Scholar] [CrossRef] [Scilit] [PubMed]
- Jovanovic, J.; Ornelis, V.F.M.; Madder, A.; Rajkovic, A. Bacillus cereus food intoxication and toxicoinfection. Compr. Rev. Food Sci. Food Saf. 2021, 20, 3719–3761. [Google Scholar] [CrossRef] [Scilit] [PubMed]
- Bruno, J.G.; Carrillo, M.P. Development of aptamer beacons for rapid presumptive detection of Bacillus spores. J. Fluoresc. 2012, 22, 915–924. [Google Scholar] [CrossRef] [Scilit] [PubMed]
- Mazzaracchio, V.; Neagu, D.; Porchetta, A.; Marcoccio, E.; Pomponi, A.; Faggioni, G.; D’Amore, N.; Notargiacomo, A.; Pea, M.; Moscone, D.; et al. A label-free impedimetric aptasensor for the detection of Bacillus anthracis spore simulant. Biosens. Bioelectron. 2019, 126, 640–646. [Google Scholar] [CrossRef] [Scilit] [PubMed]
- Moteshareie, H.; Hassen, W.M.; Dirieh, Y.; Groulx, E.; Dubowski, J.J.; Tayabali, A.F. Rapid, Sensitive, and Selective Quantification of Bacillus cereus Spores Using xMAP Technology. Microorganisms 2022, 10, 1408. [Google Scholar] [CrossRef] [Scilit] [PubMed]
- Moteshareie, H.; Hassen, W.M.; Vermette, J.; Dubowski, J.J.; Tayabali, A.F. Strategies for capturing Bacillus thuringiensis spores on surfaces of (001) GaAs-based biosensors. Talanta 2022, 236, 122813. [Google Scholar] [CrossRef] [Scilit] [PubMed]
- Zheng, H.; Sheng, R.; Li, H.; Ahmad, W.; Chen, Q. Rapid and selective detection of Bacillus cereus in food using cDNA-based up-conversion fluorescence spectrum copy and aptamer modified magnetic separation. Spectrochim. Acta Part A Mol. Biomol. Spectrosc. 2022, 267, 120618. [Google Scholar] [CrossRef] [Scilit] [PubMed]
- Fischer, C.; Hünniger, T.; Jarck, J.-H.; Frohnmeyer, E.; Kallinich, C.; Haase, I.; Hahn, U.; Fischer, M. Food Sensing: Aptamer-Based Trapping of Bacillus cereus Spores with Specific Detection via Real Time PCR in Milk. J. Agric. Food Chem. 2015, 63, 8050–8057. [Google Scholar] [CrossRef] [Scilit] [PubMed]
- Fischer, C.; Fischer, M. Aptamer-Based Trapping: Enrichment of Bacillus cereus Spores for Real-Time PCR Detection. In Methods in Molecular Biology; Humana Press: New York, NY, USA, 2017; Volume 1600, pp. 61–68. [Google Scholar] [CrossRef] [Scilit] [PubMed]
- Pal, S.; Alocilja, E.C.; Downes, F.P. Nanowire labeled direct-charge transfer biosensor for detecting Bacillus species. Biosens. Bioelectron. 2007, 22, 2329–2336. [Google Scholar] [CrossRef] [Scilit] [PubMed]
- Florio, D.; Chiappini, A.; Pasquardini, L.; Barozzi, M.; Bollani, M.; Stagira, S.; Virgili, T. Controlling Ultrafast Photonic-Plasmonic Coupling in a Hybrid Platform for Biosensing Applications. Adv. Opt. Mater. 2026, 14, e03745. [Google Scholar] [CrossRef] [Scilit]
- Yablonovitch, E. Photonic band-gap crystals. J. Phys. Condens. Matter 1993, 5, 2443. [Google Scholar] [CrossRef] [Scilit]
- Mudi, R.; Carpentiero, A.; Bollani, M.; Barozzi, M.; Debnath, K.; Chiappini, A.; Bhaktha, B.N.S. Inverse opal optical Tamm state for sensing applications. Photonics Nanostruct.—Fundam. Appl. 2024, 62, 101315. [Google Scholar] [CrossRef] [Scilit]
- Yu, H.; Peng, Y.; Yang, Y.; Li, Z.-Y. Plasmon-enhanced light–matter interactions and applications. npj Comput. Mater. 2019, 5, 45. [Google Scholar] [CrossRef] [Scilit]
- Giannini, V.; Fernández-Domínguez, A.I.; Heck, S.C.; Maier, S.A. Plasmonic nanoantennas: Fundamentals and their use in controlling the radiative properties of nanoemitters. Chem. Rev. 2011, 111, 3888–3912. [Google Scholar] [CrossRef] [Scilit] [PubMed]
- Spizizen, J. Transformation of biochemically deficient strains of Bacillus Subtilis by deoxyribonucleate. Proc. Natl. Acad. Sci. USA 1958, 44, 1072–1078. [Google Scholar] [CrossRef] [Scilit] [PubMed]
- Schaeffer, P.; Millet, J.; Aubert, J.P. Catabolic repression of bacterial sporulation. Proc. Natl. Acad. Sci. USA 1965, 54, 704–711. [Google Scholar] [CrossRef] [Scilit] [PubMed]
- Li, L.; Jin, J.; Hu, H.; Deveau, I.F.; Foley, S.L.; Chen, H. Optimization of sporulation and purification methods for sporicidal efficacy assessment on Bacillus spores. J. Ind. Microbiol. Biotechnol. 2022, 49, kuac014. [Google Scholar] [CrossRef] [Scilit] [PubMed]
- Speranza, G.; Canteri, R. RxpsG a new open project for Photoelectron and Electron Spectroscopy data processing. SoftwareX 2019, 10, 100282. [Google Scholar] [CrossRef] [Scilit]
- Schneider, C.A.; Rasband, W.S.; Eliceiri, K.W. NIH Image to ImageJ: 25 years of image analysis. Nat. Methods 2012, 9, 671–675. [Google Scholar] [CrossRef] [Scilit] [PubMed]
- Balamurugan, S.; Obubuafo, A.; Soper, S.A.; Spivak, D.A. Surface immobilization methods for aptamer diagnostic applications. Anal. Bioanal. Chem. 2008, 390, 1009–1021. [Google Scholar] [CrossRef] [Scilit] [PubMed]
- Liu, Y.; Canoura, J.; Alkhamis, O.; Xiao, Y. Immobilization Strategies for Enhancing Sensitivity of Electrochemical Aptamer-Based Sensors. ACS Appl. Mater. Interfaces 2021, 13, 9491–9499. [Google Scholar] [CrossRef] [Scilit] [PubMed]
- Wang, Y.; Feng, J.; Tan, Z.; Wang, H. Electrochemical impedance spectroscopy aptasensor for ultrasensitive detection of adenosine with dual backfillers. Biosens. Bioelectron. 2014, 60, 218–223. [Google Scholar] [CrossRef] [Scilit] [PubMed]
- Liang, P.; Canoura, J.; Yu, H.; Alkhamis, O.; Xiao, Y. Dithiothreitol-Regulated Coverage of Oligonucleotide-Modified Gold Nanoparticles To Achieve Optimized Biosensor Performance. ACS Appl. Mater. Interfaces 2018, 10, 4233–4242. [Google Scholar] [CrossRef] [Scilit] [PubMed]
- Li, Y.; Zhao, M.; Wang, H. Label-free peptide aptamer based impedimetric biosensor for highly sensitive detection of TNT with a ternary assembly layer. Anal. Bioanal. Chem. 2017, 409, 6371–6377. [Google Scholar] [CrossRef] [Scilit] [PubMed]
- Mascini, M.; Tombelli, S. Biosensors for biomarkers in medical diagnostics. Biomark. Biochem. Indic. Expo. Response Susceptibility Chem. 2008, 13, 637–657. [Google Scholar] [CrossRef] [Scilit] [PubMed]
- Pasquardini, L.; Berneschi, S.; Barucci, A.; Cosi, F.; Dallapiccola, R.; Insinna, M.; Lunelli, L.; Conti, G.N.; Pederzolli, C.; Salvadori, S.; et al. Whispering gallery mode aptasensors for detection of blood proteins. J. Biophotonics 2013, 6, 178–187. [Google Scholar] [CrossRef] [Scilit] [PubMed]
- Pasquardini, L.; Vanzetti, L.; Canteri, R.; Cennamo, N.; Arcadio, F.; Perri, C.; D’Agostino, G.; Pitruzzella, R.; Rovida, R.; Chiodi, A.; et al. Optimization of the immunorecognition layer towards Brucella sp. on gold surface for SPR platform. Colloids Surf. B. Biointerfaces 2023, 231, 113577. [Google Scholar] [CrossRef] [Scilit] [PubMed]
- Vaghi, V.; Potrich, C.; Lunelli, L.; Facci, P.; Pasquardini, L.; Vanzetti, L.; Pederzolli, C. Bio-functional surfaces for the immunocapture of AGO2-bound microRNAs. Colloids Surf. B Biointerfaces 2016, 146, 746–753. [Google Scholar] [CrossRef] [Scilit] [PubMed]
- Pasquardini, L.; Cennamo, N.; Malleo, G.; Vanzetti, L.; Zeni, L.; Bonamini, D.; Salvia, R.; Bassi, C.; Bossi, A.M. A Surface Plasmon Resonance Plastic Optical Fiber Biosensor for the Detection of Pancreatic Amylase in Surgically-Placed Drain Effluent. Sensors 2021, 21, 3443. [Google Scholar] [CrossRef] [Scilit] [PubMed]
- Favaretto, R.; Ardoino, N.; Pucker, G.; Bellotto, N.; Mancinelli, M.; Piccoli, G.; Bernard, M.; Vanzetti, L.; Potrich, C.; Lunelli, L.; et al. A ring resonators optical sensor for multiple biomarkers detection. Talanta 2025, 282, 127035. [Google Scholar] [CrossRef] [Scilit] [PubMed]
- Salbreiter, M.; Wagenhaus, A.; Rösch, P.; Popp, J. Raman spectroscopy as a comprehensive tool for profiling endospore-forming bacteria. Analyst 2025, 150, 1652–1661. [Google Scholar] [CrossRef] [Scilit] [PubMed]
- Wu, C.; Liu, X.; Dong, X. Syntrophomonas erecta subsp. sporosyntropha subsp. nov., a spore-forming bacterium that degrades short chain fatty acids in co-culture with methanogens. Syst. Appl. Microbiol. 2006, 29, 457–462. [Google Scholar] [CrossRef] [Scilit] [PubMed]
- Sentic, M.; Rizzotto, F.; Novakovic, Z.; Karajic, A.; Heddi, B.; Vidic, J. Improving electrochemical aptasensor sensitivity for Bacillus cereus spore detection in food safety applications. Talanta 2026, 299, 129147. [Google Scholar] [CrossRef] [Scilit] [PubMed]
- Tian, J.; Zhang, Z.; Shi, Y.; Wu, Z.; Shao, Y.; Wang, L.; Xu, X.; Xin, Z. Flower-Shaped PCR Scaffold-Based Lateral Flow Bioassay for Bacillus cereus Endospores Detection. Int. J. Mol. Sci. 2024, 25, 11286. [Google Scholar] [CrossRef] [Scilit] [PubMed]
- Manceau, M.; Farre, C.; Lagarde, F.; Mathey, R.; Buhot, A.; Vidic, J.; Léguillier, V.; Hou, Y.; Chaix, C. Investigation of the Affinity of Aptamers for Bacteria by Surface Plasmon Resonance Imaging Using Nanosomes. ACS Appl. Mater. Interfaces 2024, 16, 29645–29656. [Google Scholar] [CrossRef] [Scilit] [PubMed]
- Wu, J.; Xiao, Z.; Du, Y.; Luo, M.; Zhang, J.; Guo, P.; Chen, Z.; Yang, B.; Chen, T. Generation of Stable 2’-F/OMe-RNA Aptasensors for Bacillus cereus 5/B/6 Metallo-β-Lactamase. ACS Synth. Biol. 2025, 14, 4756–4770. [Google Scholar] [CrossRef] [Scilit] [PubMed]
- Zhou, Z.; Lan, X.; Zhu, L.; Zhang, Y.; Chen, K.; Zhang, W.; Xu, W. Portable dual-aptamer microfluidic chip biosensor for Bacillus cereus based on aptamer tailoring and dumbbell-shaped probes. J. Hazard. Mater. 2023, 445, 130545. [Google Scholar] [CrossRef] [Scilit] [PubMed]

Disclaimer/Publisher’s Note: The statements, opinions and data contained in all publications are solely those of the individual author(s) and contributor(s) and not of MDPI and/or the editor(s). MDPI and/or the editor(s) disclaim responsibility for any injury to people or property resulting from any ideas, methods, instructions or products referred to in the content. |
© 2026 by the authors. Licensee MDPI, Basel, Switzerland. This article is an open access article distributed under the terms and conditions of the Creative Commons Attribution (CC BY) license.