


Abstract
This study investigates the combined influence of multi-walled carbon nanotube (MWCNT) concentration and structural architecture on the compressive behavior of fused filament fabrication (FFF)-printed PLA components. Neat PLA and PLA reinforced with 1.0 and 2.0 wt% carboxyl-functionalized MWCNTs were characterized by Raman spectroscopy, DSC, TGA, compression testing, statistical analysis, and scanning electron microscopy. Thermal characterization showed that MWCNT incorporation caused only minor changes in PLA thermal degradation while altering its crystallization behavior. For nearly solid specimens (90% infill), compressive strength increased from 53.4 MPa for neat PLA to 73.6 MPa at 2.0 wt% MWCNTs, although differences among MWCNT concentrations were not statistically significant. Honeycomb structures exhibited the highest mechanical performance at 1.0 wt% MWCNTs, reaching a compressive strength of 33.3 MPa, approximately 59% higher than that of neat PLA, with significant improvements in both compressive strength and elastic modulus. Two-way ANOVA revealed significant interactions between structural architecture and MWCNT concentration for both compressive strength and elastic modulus, demonstrating an architecture-dependent reinforcement response. SEM provided complementary morphological evidence consistent with the observed mechanical trends. These findings demonstrate that the most effective MWCNT concentration depends on structural architecture, highlighting the importance of simultaneously optimizing material composition and geometry in FFF-manufactured polymer nanocomposites.
1. Introduction
Additive manufacturing (AM) has revolutionized the production of engineering components by enabling unprecedented geometric freedom, material efficiency, and rapid prototyping while minimizing manufacturing waste. Among the various AM technologies, fused filament fabrication (FFF) has become the most widely adopted process for thermoplastic polymers because of its simplicity, low processing cost, and capability to manufacture customized components with complex geometries. In addition to material selection, FFF allows designers to tailor the internal architecture of printed components through slicing parameters such as infill density, raster orientation, and infill pattern, making the structural response highly dependent on both material composition and geometric design [1,2].
Poly(lactic acid) (PLA) is one of the most extensively employed polymers in FFF owing to its renewable origin, biodegradability, excellent printability, and dimensional stability. Consequently, PLA has found widespread application in biomedical devices, lightweight structures, automotive components, and consumer products. Nevertheless, its relatively low fracture toughness, limited thermal resistance, and brittle mechanical behavior still restrict its use in structural applications subjected to high mechanical loads or impact conditions [1,2,3].
To overcome these limitations, considerable attention has been devoted to the incorporation of nanoscale carbon reinforcements into PLA. Among the available nanofillers, multi-walled carbon nanotubes (MWCNTs) have emerged as one of the most promising alternatives because of their exceptional stiffness, tensile strength, thermal conductivity, electrical conductivity, and high aspect ratio. When homogeneously dispersed within the polymer matrix, MWCNTs promote efficient stress transfer across the polymer–nanotube interface, delay crack propagation, and modify the crystallization behavior of PLA, resulting in simultaneous improvements in mechanical, thermal, and multifunctional properties. Previous investigations have demonstrated significant enhancements in stiffness, strength, electrical conductivity, thermal stability, and weathering resistance of FFF-printed PLA/MWCNT nanocomposites, confirming the remarkable reinforcing potential of carbon nanotubes [1,2,3,4,5].
Despite these advances, the reinforcing efficiency of MWCNTs is strongly dependent on several factors, including nanotube dispersion, interfacial adhesion, processing conditions, and nanotube concentration. Yang et al. [1], Vidakis et al. [2], and Bortoli et al. [3] demonstrated that improvements in mechanical and thermal properties are directly associated with the quality of nanotube dispersion within the PLA matrix, whereas Younus et al. [4] and Da Silva et al. [5] reported that thermal history and processing conditions may considerably modify the crystallization behavior and final performance of PLA/MWCNT nanocomposites. These findings indicate that optimizing nanocomposite composition remains a major challenge for maximizing the performance of FFF-manufactured components.
Besides material formulation, the internal architecture generated during the FFF process has a decisive influence on the structural response of printed components. Unlike conventionally manufactured materials, FFF structures are composed of deposited filaments whose arrangement defines preferential load–transfer paths, local stress concentrations, deformation mechanisms, and failure modes. Consequently, parameters such as infill pattern and cellular geometry may substantially influence stiffness, strength, energy absorption, and structural stability under compressive loading. Recent studies have shown that triangular, concentric, and honeycomb-based architectures exhibit distinct deformation mechanisms owing to differences in filament continuity and stress distribution, emphasizing that structural geometry is itself an important design variable [6,7,8,9].
Recently, our research group systematically investigated the influence of concentric, hexagonal, and triangular infill architectures on the tensile, flexural, and impact behavior of FFF-manufactured PLA solid and honeycomb structures. However, the compressive response of these architectures, particularly after the incorporation of carbon nanotubes, remained unexplored. That study demonstrated that structural architecture governs load–transfer mechanisms, fracture behavior, and energy absorption, establishing infill geometry as one of the primary design variables controlling the mechanical response of printed PLA components [10]. However, all analyses were restricted to neat PLA, leaving unanswered whether the reinforcing efficiency of carbon nanotubes remains independent of the selected architecture or whether different architectures require distinct nanotube concentrations to achieve optimum performance.
Although extensive research has independently addressed MWCNT reinforcement in PLA [1,2,3,4,5] and the influence of infill architecture on FFF-manufactured structures [6,7,8,9,10], the interaction between these two design variables remains insufficiently understood. Previous PLA/MWCNT studies have predominantly evaluated nanofiller concentration using a fixed printing architecture, thereby treating reinforcement efficiency mainly as a material-level response. Conversely, studies focused on infill and cellular architectures, including our previous work [10], have primarily investigated unreinforced PLA and therefore do not establish whether changes in load-bearing geometry alter the mechanical effectiveness of nanotube reinforcement. Consequently, a specific scientific gap remains: it is not known whether a MWCNT concentration that improves the mechanical response of a nearly solid FFF component will provide the same reinforcing efficiency when the same nanocomposite is incorporated into a cellular architecture governed by different deformation and load-transfer mechanisms. The originality of the present study therefore lies in experimentally coupling nanocomposite composition with structural architecture and directly comparing their interaction under compressive loading. By evaluating the same PLA/MWCNT formulations in nearly solid and honeycomb configurations, this work investigates whether the most effective MWCNT concentration is architecture-dependent rather than solely an intrinsic characteristic of the nanocomposite. Addressing this gap provides a material–architecture perspective for the design of FFF polymer nanocomposites that has not been explicitly considered in the aforementioned studies.
To address this scientific gap, the present study systematically evaluates how carbon nanotube reinforcement interacts with structural architecture to determine the thermal, structural, and compressive behavior of FFF-manufactured PLA components. Initially, nearly solid specimens with concentric, hexagonal, and triangular infill patterns were evaluated to identify the most suitable architecture for nanocomposite manufacturing. Subsequently, neat PLA and PLA reinforced with 1.0 and 2.0 wt% carboxyl-functionalized multi-walled carbon nanotubes (MWCNTs–COOH) were characterized by Raman spectroscopy, thermogravimetric analysis (TGA), differential scanning calorimetry (DSC), compression testing, and scanning electron microscopy (SEM). Finally, the selected material systems were applied to honeycomb structures in order to investigate the interaction between nanoreinforcement and structural geometry under compressive loading. The central hypothesis of this work is that the reinforcing efficiency of MWCNTs is architecture-dependent, such that the optimum nanotube concentration varies according to the structural configuration of the printed component rather than being an intrinsic characteristic of the nanocomposite itself.
2. Materials and Methods
2.1. Materials
Commercial polylactic acid (PLA) filament (3D FILA, Belo Horizonte, Brazil), with a nominal diameter of 1.75 mm, was used as the polymer matrix. According to the manufacturer’s technical information, the PLA has a tensile strength of 50–65 MPa, tensile modulus of 3.0–3.8 GPa, elongation at break of 4–10%, flexural strength of 80–110 MPa, flexural modulus of 3.0–4.0 GPa, density of 1.24–1.27 g/cm3, and notched Izod impact resistance of 15–25 J/m.
Carboxyl-functionalized multi-walled carbon nanotubes (MWCNTs–COOH), supplied by NanoView Nanotecnologia (Belo Horizonte, Brazil), were used as nanofillers. According to the supplier, the MWCNTs–COOH have an outer diameter of 10–30 nm, a length of 1–10 μm, purity above 95%, a specific surface area (BET) of 162 m2/g, and electrical conductivity above 100 S/cm. The nanotubes were synthesized by chemical vapor deposition (CVD) and subsequently subjected to acid treatment for the introduction of carboxyl (–COOH) functional groups.
2.2. Preparation of PLA/MWCNT Nanocomposite Filaments
The experimental workflow adopted for nanocomposite preparation, filament production, FFF manufacturing, material characterization, compression testing, and post-test morphological analysis is summarized in Figure 1.
Figure 1.
Experimental workflow adopted for the preparation, processing, additive manufacturing, characterization, and mechanical evaluation of the PLA/MWCNT nanocomposites. The workflow comprises raw-material preparation, filament extrusion, FFF manufacturing, printed specimens, Raman spectroscopy, thermogravimetric analysis (TGA), differential scanning calorimetry (DSC), compression testing, and post-test morphological analysis by scanning electron microscopy (SEM).
Prior to nanocomposite preparation, the commercial PLA filament was sectioned into small pieces and dried in an oven at 50 °C for 3 h to minimize the presence of absorbed moisture. After drying, the PLA was transferred to a glove box, where the MWCNTs–COOH were weighed and manually mixed with the polymer. The glove box provided a controlled environment for handling the nanopowder, minimizing its dispersion into the laboratory environment and reducing potential airborne exposure during weighing and mixing.
Two nanocomposite formulations containing 1.0 and 2.0 wt% MWCNTs–COOH were prepared. The nanotube contents were calculated relative to the initial PLA mass, corresponding to 1.0 and 2.0 g of MWCNTs–COOH per 100 g of PLA, respectively. The resulting formulations were designated PLA/1.0 wt% MWCNTs and PLA/2.0 wt% MWCNTs, while unmodified PLA was used as the reference material.
The manually prepared mixtures were subsequently melt compounded using a Filmaq3D CV single-screw extruder (Filmaq3D, Curitiba, Brazil), equipped with a single heating zone and a die designed for the production of 1.75 mm filament. The extrusion temperature was maintained at 157 °C throughout processing. The material was gravity-fed through the hopper; therefore, no independently controlled feed rate was imposed. Likewise, the die temperature was not independently controlled from the extrusion temperature.
Each PLA/MWCNT formulation was subjected to two consecutive extrusion cycles under identical processing conditions. After the first extrusion cycle, the resulting material was reprocessed through the extruder to promote a more homogeneous distribution of the MWCNTs within the PLA matrix and to produce continuous nanocomposite filaments suitable for subsequent FFF manufacturing. Figure 2 shows neat PLA and the PLA/MWCNT nanocomposites after extrusion and sectioning.
Figure 2.
PLA and PLA/MWCNT materials after extrusion and sectioning: (a) neat PLA and (b) PLA reinforced with 1.0 wt% carboxyl-functionalized multi-walled carbon nanotubes (MWCNTs–COOH).
It should be emphasized that the degree of MWCNT dispersion within the PLA matrix was not directly quantified in the present study. In addition, the second extrusion cycle increased the thermal and shear history experienced by the polymer and may have promoted some degree of PLA chain scission or molecular-weight reduction. Although PLA was dried prior to processing to minimize moisture-induced hydrolytic degradation and extrusion was performed at 157 °C, molecular weight was not experimentally determined. Consequently, possible changes in PLA molecular weight resulting from repeated melt processing cannot be excluded and are considered a limitation of the processing characterization.
2.3. Specimen Design and FFF Manufacturing
Cylindrical compression specimens were designed according to the dimensions specified in ASTM D695–15 [11], with a nominal diameter of 12.7 mm and a height of 25.4 mm. Two load-bearing configurations were investigated: a nearly solid architecture and a honeycomb cellular architecture. The nearly solid specimens were manufactured with an infill density of 90%, whereas the honeycomb specimens were designed according to the geometric parameters proposed by Soltani et al. [6]. CAD representations of the external geometry and internal architectures of the compression specimens are presented in Figure 3.
Figure 3.
CAD models of the compression specimens used in this study: (a) external view of the nearly solid cylindrical specimen; (b) internal triangular infill architecture of the nearly solid specimen (90% infill density); (c) external view of the honeycomb specimen; and (d) internal cellular architecture of the honeycomb specimen with hexagonal cells. Both specimen configurations have a nominal diameter of 12.7 mm and a height of 25.4 mm.
The three-dimensional models were exported as STL files and sliced using PrusaSlicer software (version 2.9.6). Printing parameters were maintained constant throughout the study and included a nozzle diameter of 0.2 mm, layer height of 0.1 mm, printing temperature of 190 °C, print bed temperature of 25 °C, infill density of 90%, and raster angle of 0°. Three infill patterns were investigated: concentric, hexagonal, and triangular.
These processing parameters were selected to provide consistent material deposition and dimensional resolution while maintaining comparable manufacturing conditions among the investigated formulations and architectures. The combination of a 0.2 mm nozzle and a 0.1 mm layer height provided controlled deposition for the specimen geometries, whereas the nozzle temperature of 190 °C provided suitable processing conditions for the PLA-based filaments. The 90% infill condition was adopted for the nearly solid specimens to provide a high material fraction while retaining a defined internal deposition architecture, allowing the influence of infill pattern and MWCNT incorporation to be evaluated under comparable conditions. Maintaining these parameters constant throughout the study minimized processing-related variability and enabled the mechanical response to be evaluated primarily in relation to material composition and structural architecture.
All specimens were manufactured using a STELLA 3 LITE FFF printer (Boa Impressão 3D, Curitiba, Brazil) with a build volume of 220 × 220 × 250 mm. During printing, the extrusion flow setting was maintained at 90%, the cooling fan speed at 30%, and the nozzle temperature at 190 °C.
An infill density of 90% was adopted for the nearly solid specimens throughout the study. Accordingly, these specimens are referred to as “nearly solid (90% infill)” rather than “solid” throughout the manuscript to accurately reflect their internal material fraction. By keeping the infill density constant, differences in compressive behavior could be primarily attributed to the investigated infill patterns and nanocomposite formulations, while minimizing the influence of porosity and preserving the characteristic deposition strategy of the FFF process.
The experimental design was structured to distinguish the effect of MWCNT concentration from the effect of the load-bearing architecture. First, neat PLA specimens with concentric, hexagonal, and triangular infill patterns were evaluated to establish a reference architecture under identical manufacturing conditions. After selecting the triangular pattern, the material composition was systematically varied (0, 1.0, and 2.0 wt% MWCNTs) while maintaining the same printing parameters and infill pattern. These three material formulations were then evaluated in both nearly solid and honeycomb configurations. Consequently, each MWCNT concentration was tested under two distinct load-bearing conditions without simultaneously changing the material formulation or deposition pattern. This controlled comparison allows the reinforcing response of a given PLA/MWCNT formulation to be directly compared between a nearly continuous load-bearing section and a cellular architecture governed by cell-wall deformation and collapse. Therefore, within the investigated concentration range and structural configurations, differences in the concentration-dependent mechanical response between the two geometries can be attributed to the interaction between MWCNT reinforcement and structural architecture rather than to changes in printing parameters or infill pattern.
2.4. Raman Spectroscopy
Raman spectroscopy was performed to evaluate the characteristic vibrational features of neat PLA and the PLA/MWCNT nanocomposites and to verify the presence and structural characteristics of the MWCNTs after processing. The analyses were carried out using a LabRAM HR Evolution Raman spectrometer (HORIBA, France SAS, Palaiseau, France) equipped with 514 and 633 nm excitation lasers. Spectra were acquired using a 20× objective over the spectral range of 40–3800 cm−1. For each measurement, five accumulations of 90 s were collected using a laser power of 1.44 mW at the sample surface. The resulting spectra were subsequently compared among neat PLA and the nanocomposite formulations containing 1.0 and 2.0 wt% MWCNTs–COOH.
2.5. Thermogravimetric Analysis (TGA)
The thermal stability of neat PLA and the PLA/MWCNT nanocomposites was evaluated by thermogravimetric analysis (TGA) using an SDT Q600 thermogravimetric analyzer (TA Instruments, New Castle, DE, USA). Samples with masses ranging from 3 to 10 mg were placed in alumina crucibles and heated from 30 to 600 °C at a heating rate of 10 °C min−1 under a nitrogen (N2) atmosphere at a gas flow rate of 100 mL min−1. Thermogravimetric (TGA) and derivative thermogravimetric (DTG) curves were obtained to evaluate the thermal degradation behavior and the temperature corresponding to the maximum degradation rate of the investigated materials.
2.6. Differential Scanning Calorimetry (DSC)
Differential scanning calorimetry (DSC) was performed on neat PLA and the PLA/MWCNT nanocomposites using a DSC Q2000 calorimeter (TA Instruments). Samples with masses ranging from 5 to 10 mg were subjected to a single heating run from 50 to 300 °C at a heating rate of 10 °C min−1 under a nitrogen (N2) atmosphere at a flow rate of 50 mL min−1. The resulting thermograms were used to determine the glass transition temperature (Tg), cold-crystallization temperature (Tcc), cold-crystallization enthalpy (ΔHcc), melting temperature (Tm), and melting enthalpy (ΔHm) of the investigated materials. The degree of crystallinity (Xc) was subsequently calculated from the melting and cold-crystallization enthalpies according to Equation (1).
where ΔHm is the melting enthalpy, ΔHcc is the cold-crystallization enthalpy, ΔHm0 is the theoretical melting enthalpy of 100% crystalline PLA (93 J g−1), and wf is the mass fraction of MWCNTs in the nanocomposite.
2.7. Compression Tests
Compression tests were performed according to ASTM D695–15 [11] using an INTERMETRIC universal testing machine (model iM, Mogi das Cruzes, Brazil) equipped with a 50 kN load cell and a computerized data-acquisition system. The tests were conducted at a crosshead displacement rate of 1.3 ± 0.3 mm min−1. Five specimens (n = 5) were tested for each experimental condition.
The mechanical evaluation was conducted in two stages. In the first stage, neat PLA specimens manufactured with concentric, hexagonal, and triangular infill patterns were tested in both nearly solid and honeycomb configurations. This comparison was used to evaluate the influence of the deposition pattern on the compressive response and to select the infill pattern employed in the subsequent nanocomposite experiments.
Based on the results of the first stage, the triangular infill pattern was selected for the second experimental stage. Neat PLA and PLA containing 1.0 and 2.0 wt% MWCNTs–COOH were then tested using both nearly solid and honeycomb architectures. Five specimens were evaluated for each combination of material composition and structural architecture. Considering both experimental stages, a total of 50 specimens were subjected to compression testing.
Compressive stress–strain curves were obtained from the recorded load and displacement data, and the compressive strength and compressive modulus were determined for each experimental condition. The results were subsequently expressed as mean ± standard deviation and subjected to statistical analysis as described in Section 2.9. Figure 4 illustrates the specimen before testing, during compression, and after failure.
Figure 4.
Representative stages of the ASTM D695 compression test performed on the FFF-printed specimens: (a) printed cylindrical specimen, (b) experimental compression setup showing the specimen positioned between the loading platens, and (c) representative fractured specimen after testing.
2.8. Scanning Electron Microscopy (SEM)
Post-test morphological analysis was performed by scanning electron microscopy (SEM) on selected fracture surfaces obtained from specimens subjected to compression testing. Prior to observation, the samples were sputter-coated with a gold layer approximately 10–15 nm thick for 150 s at 20 mA under an argon atmosphere at approximately 2 × 10⁻¹ mbar.
SEM observations were performed using a TESCAN MIRA3 scanning electron microscope (TESCAN Brno, s.r.o., Brno, Czech Republic), operating in secondary-electron mode at an accelerating voltage of 5.0 kV. The micrographs were used to qualitatively examine fracture morphology and microstructural features associated with the different material compositions and specimen architectures.
Because conventional SEM does not provide sufficient spatial resolution or chemical specificity to directly establish the nanoscale dispersion state of individual MWCNTs within the PLA matrix, the micrographs were interpreted qualitatively and were not used as direct evidence of nanotube dispersion or agglomeration.
2.9. Statistical Analysis
Statistical analyses were performed using GraphPad Prism version 10 (GraphPad Software, Boston, MA, USA). Mechanical-property data are reported as mean ± standard deviation, with five specimens (n = 5) evaluated for each experimental condition. Statistical significance was established at (p < 0.05).
For the first experimental stage, involving the comparison of concentric, hexagonal, and triangular infill patterns in neat PLA, compressive strength and compressive modulus were analyzed separately using one-way analysis of variance (ANOVA), followed by Tukey’s multiple-comparison test.
For the second experimental stage, the effects of structural architecture (nearly solid and honeycomb) and MWCNT concentration (0, 1.0, and 2.0 wt%) were evaluated using two-way ANOVA. The interaction between structural architecture and MWCNT concentration was also included in the statistical model. Compressive strength and compressive modulus were analyzed separately.
3. Results and Discussion
3.1. Selection of the Optimal Infill Pattern
Figure 5 and Table 1 present the compressive strength and elastic modulus obtained for the nearly solid PLA specimens printed with the three infill patterns. The triangular configuration exhibited the highest mean compressive strength and elastic modulus, reaching 53.4 ± 4.5 MPa and 1.37 ± 0.05 GPa, respectively. The hexagonal specimens showed an intermediate mean compressive strength of 48.6 ± 6.7 MPa, while the concentric configuration presented the lowest average value, 45.9 ± 6.5 MPa. For the elastic modulus, the concentric and hexagonal patterns reached 1.24 ± 0.16 and 1.12 ± 0.16 GPa, respectively. Overall, the differences in compressive strength among the three patterns were moderate, whereas the triangular configuration displayed a more noticeable increase in stiffness relative to the other architectures.
Figure 5.
Mechanical properties of nearly solid PLA specimens (90% infill) with different infill patterns: (a) compressive strength and (b) elastic modulus. Data are presented as mean ± standard deviation (SD) (n = 5).
Table 1.
Compressive properties of nearly solid FFF-printed PLA and PLA/MWCNT specimens (90% infill density). Values are reported as mean ± standard deviation (n = 5).
The relatively limited variation in compressive strength can be attributed primarily to the high infill density adopted during fabrication. At 90% infill, the specimens behave as nearly solid structures, reducing the influence of the specific filament arrangement on the global stress distribution [7,8,12]. Under these conditions, the compressive load is predominantly supported by the continuous polymer volume and by the interlayer bonding developed during deposition rather than exclusively by the topology of the internal pattern.
Nevertheless, the internal architecture still affects the manner in which the applied load is transferred through the printed structure. The triangular pattern forms an interconnected network of deposited roads with multiple load-bearing directions, which may favor a more distributed transmission of compressive stresses and restrict localized deformation. In contrast, differences in filament orientation and connectivity in the concentric and hexagonal patterns may promote greater local bending, rotation, or deformation of individual deposited roads. Such architecture-dependent behavior is consistent with previous studies showing that the mechanical response of FFF-manufactured polymers is governed not only by material properties and infill density, but also by the orientation, connectivity, and arrangement of the deposited filaments [7,8,9,10,12].
Therefore, the higher mean strength and modulus observed for the triangular pattern can be interpreted as resulting from the combined effect of high relative density and a more interconnected internal load-transfer network. However, because local filament deformation, inter-road bonding, and void distribution were not independently quantified in the present study, these mechanisms should be regarded as physically plausible interpretations rather than direct experimental observations. Based on its overall compressive response, the triangular pattern was selected as the reference architecture for the subsequent evaluation of MWCNT incorporation.
3.2. Thermal and Structural Characterization
3.2.1. Raman Spectroscopy
The Raman spectra of neat PLA, pristine MWCNTs, and the PLA/MWCNT nanocomposites are presented in Figure 6. To obtain a more detailed interpretation of the vibrational features, both the first-order (1200–1700 cm−1) and second-order (2550–3050 cm−1) spectral regions were deconvoluted. This approach enabled the identification of the individual contributions associated with the disorder-related carbon bands (DL, DR, DLO, Dmiddle, and D’), the graphitic bands (Gout and Ginn), and the second-order components (2DL1, 2DL2, 2DR1, and 2DR2), allowing the main disorder-related, graphitic, and second-order spectral contributions to be compared before and after processing.
Figure 6.
Deconvoluted Raman spectra of neat PLA, pristine MWCNTs, and PLA/MWCNT nanocomposites. (a–d) First-order spectral region (1200–1700 cm−1) and (e–h) second-order spectral region (2550–3050 cm−1). Orange lines represent the experimental Raman spectra, black solid lines represent the overall fitted curves, gray lines represent the individual deconvoluted components, and black dashed vertical lines indicate the reference positions of the Raman bands used for comparison. The fitted components reveal the characteristic disorder-induced (D) and graphitic (G) bands together with the second-order (2D) contributions used to compare the structural characteristics of the MWCNTs before and after melt compounding and FFF processing.
The Raman spectrum of neat PLA (Figure 6c,g) is characterized by vibrational bands associated with the polymer matrix, whereas pristine MWCNTs (Figure 6d,h) exhibit the characteristic D and G bands of sp2-hybridized carbon materials, as widely reported for PLA/MWCNT systems [3,4,5]. The D band is associated with disorder and defects in the graphitic structure, whereas the G band is related to the in-plane stretching vibration of sp2-bonded carbon. The second-order spectral region also contains the characteristic 2D contributions associated with graphitic carbon structures. Similar Raman features have been reported for carbon nanotubes and PLA/CNT-based nanocomposites, supporting the assignment of the spectral components observed in the present study [3,4,5].
After incorporation into the PLA matrix, the spectra of the composites containing 1.0 and 2.0 wt% MWCNTs (Figure 6a,b,e,f) exhibited overlapping contributions from PLA and the carbon nanotubes. In the first-order region, the relatively intense PLA response partially overlaps the weaker nanotube-related features, making some disorder-related components less clearly distinguishable. Nevertheless, the Gout and Ginn components remained identifiable in both nanocomposite formulations. Their persistence after melt compounding and FFF processing confirms the presence of the characteristic graphitic contribution of the MWCNTs within the processed PLA/MWCNT materials.
In the second-order region, the nanocomposites also retained spectral contributions associated with the 2D band. The observation of these features after extrusion and FFF processing is consistent with the persistence of the characteristic carbon structure of the MWCNTs. The deconvolution was used primarily to distinguish overlapping spectral contributions and to enable a qualitative comparison among the investigated materials. Accordingly, quantitative intensity or integrated-area ratios, such as ID/IG, were not used to infer changes in defect density or nanotube structural quality.
From a processing perspective, the persistence of the characteristic graphitic Raman features indicates that the MWCNT-related vibrational response remained detectable after the thermal and shear history imposed during filament extrusion and subsequent FFF manufacturing. This observation is relevant because melt processing can modify the polymer–nanofiller system through thermal, shear, and interfacial effects. However, the present spectra do not provide sufficient evidence to attribute the observed spectral behavior to a specific interfacial mechanism or to quantify structural changes in the nanotubes. Therefore, the Raman results are interpreted primarily as evidence of the preservation of identifiable MWCNT-related graphitic features after processing.
It should also be emphasized that Raman spectroscopy does not, by itself, establish the homogeneous spatial distribution of MWCNTs within the PLA matrix. The presence of nanotube-related bands at the analyzed locations confirms their spectroscopic contribution but does not quantify their distribution throughout the bulk material. Consequently, the present Raman results should not be interpreted as direct evidence of homogeneous MWCNT dispersion or as proof of the absence of agglomerates. Such conclusions would require complementary nanoscale characterization specifically designed to assess nanotube distribution within the polymer matrix.
Therefore, the Raman analysis provides structural evidence that the characteristic graphitic features of the MWCNTs remained detectable in both nanocomposite formulations after filament extrusion and FFF processing. These results provide a structural basis for the subsequent thermal and mechanical analyses, while the possible influence of nanotube distribution and polymer–nanotube interactions on the measured properties is discussed only as a plausible contribution were supported by the corresponding experimental results.
3.2.2. Thermogravimetric Analysis (TGA)
The thermal stability of neat PLA and the MWCNT-reinforced composites was evaluated by thermogravimetric (TGA) and derivative thermogravimetric (DTG) analyses, as presented in Figure 7. All materials exhibited a similar degradation profile, characterized by a single dominant mass-loss event occurring between approximately 280 and 360 °C. This overall similarity indicates that the incorporation of MWCNTs at the investigated concentrations did not substantially alter the main thermal degradation behavior of the PLA matrix, which is consistent with previous observations for PLA/MWCNT systems [3,4,5,13].
Figure 7.
Thermogravimetric (TGA) and derivative thermogravimetric (DTG) curves of neat PLA and PLA/MWCNT nanocomposites containing 1.0 and 2.0 wt% carboxyl-functionalized multi-walled carbon nanotubes (MWCNTs–COOH). Thick and thin lines represent the TGA and DTG curves, respectively.
The DTG curves showed that the temperature corresponding to the maximum degradation rate (Tmax) was 352.03 °C for neat PLA, 346.21 °C for PLA/1.0 wt% MWCNTs, and 350.17 °C for PLA/2.0 wt% MWCNTs. Thus, the incorporation of 1.0 wt% MWCNTs resulted in a decrease of approximately 5.8 °C relative to neat PLA, whereas the 2.0 wt% formulation exhibited a (Tmax) only approximately 1.9 °C lower than that of the unreinforced polymer. These relatively small variations, together with the similar shape and temperature range of the degradation profiles, indicate that MWCNT addition produced only a limited effect on the thermal degradation behavior of PLA under the investigated conditions.
The absence of a pronounced increase in (Tmax) indicates that, within the investigated concentration range, the MWCNTs did not produce a substantial thermal-stabilization effect. Although carbon nanotubes can potentially influence polymer degradation through barrier effects, restrictions on molecular mobility, and polymer–nanotube interfacial interactions, the magnitude and direction of these effects depend strongly on nanotube concentration, dispersion, functionalization, and the processing history of the nanocomposite [3,4,5,13]. In the present system, these possible stabilizing contributions were not sufficiently pronounced to shift the main PLA degradation event toward substantially higher temperatures.
The slightly lower (Tmax) observed for the nanocomposites may also reflect the combined influence of nanofiller incorporation and the additional thermal and shear history imposed during nanocomposite preparation. As described in Section 2.2, the PLA/MWCNT formulations were subjected to two extrusion cycles. Repeated melt processing can potentially promote PLA chain scission and reduce molecular weight, particularly when thermal and shear histories are increased. A reduction in molecular weight could, in turn, facilitate thermal decomposition and contribute to a modest displacement of the degradation maximum toward lower temperatures. However, because molecular weight was not measured in the present study, this mechanism cannot be directly confirmed and should be regarded only as a possible contribution to the observed behavior.
The non-monotonic variation of (Tmax), with a larger decrease at 1.0 wt% than at 2.0 wt% MWCNTs, further indicates that the thermal response cannot be interpreted simply as a concentration-dependent stabilization or destabilization effect. Instead, the small differences among the formulations likely result from the combined influence of the polymer processing history and nanofiller-related effects. Moreover, because MWCNT dispersion was not quantitatively characterized, differences in nanotube distribution within the PLA matrix cannot be directly correlated with the observed DTG behavior.
Thus, the TGA/DTG results demonstrate that the incorporation of up to 2.0 wt% MWCNTs–COOH preserved the characteristic single-stage degradation profile of PLA and produced only minor variations in the temperature of maximum degradation rate. Therefore, under the conditions investigated, MWCNT incorporation modified the thermal degradation behavior of PLA only slightly rather than producing a substantial improvement or deterioration in its thermal stability.
3.2.3. Differential Scanning Calorimetry (DSC)
Figure 8 presents the DSC thermograms of neat PLA and the PLA/MWCNT nanocomposites, while the corresponding thermal parameters are summarized in Table 2. Neat PLA exhibited a glass-transition temperature (Tg) of 59.09 °C, which decreased to 54.92 °C and 55.78 °C after the incorporation of 1.0 and 2.0 wt% MWCNTs, respectively. In contrast, the melting temperature (Tm) remained nearly unchanged, with values of 151.94 °C for neat PLA, 151.05 °C for PLA/1.0 wt% MWCNTs, and 151.62 °C for PLA/2.0 wt% MWCNTs. The limited variation in (Tm) indicates that MWCNT incorporation did not substantially modify the melting temperature of the crystalline PLA domains under the investigated conditions.
Figure 8.
DSC thermograms of neat PLA and PLA reinforced with 1.0 and 2.0 wt% MWCNTs–COOH. The thermograms highlight the characteristic thermal transitions of the materials, including the glass transition (Tg), cold crystallization (Tcc), and melting temperature (Tm), with the corresponding transition temperatures indicated for each formulation.
Table 2.
Thermal parameters obtained from DSC analysis of neat PLA and PLA/MWCNT nanocomposites.
A more pronounced effect was observed for the cold-crystallization temperature (Tcc). Neat PLA exhibited a (Tcc) of 108.47 °C, whereas the nanocomposites containing 1.0 and 2.0 wt% MWCNTs showed values of 99.74 and 101.29 °C, respectively. Therefore, MWCNT incorporation shifted cold crystallization toward lower temperatures by approximately 8.7 °C for the 1.0 wt% formulation and 7.2 °C for the 2.0 wt% formulation. A reduction in (Tcc) in PLA-based nanocomposites is commonly associated with a reduction in the energetic barrier for crystallization during heating, and carbon-based nanofillers may provide heterogeneous nucleation sites that facilitate the organization of PLA chains into crystalline structures [3,4,5,13].
In this context, the lower (Tcc) values observed for both nanocomposite formulations are consistent with a possible heterogeneous nucleation effect of the MWCNTs during the DSC heating scan. The nanotube surface can provide interfaces at which PLA chain segments may begin to organize, allowing cold crystallization to occur at a lower temperature than in neat PLA. However, the effectiveness of this process depends not only on the presence of nucleating surfaces but also on polymer-chain mobility, nanotube functionalization, interfacial interactions, nanofiller distribution, and the thermal history imposed during processing [3,4,5,13]. Therefore, the reduction in (Tcc) should be interpreted as evidence of altered crystallization behavior during heating rather than as direct evidence of increased crystallinity in the as-processed specimens.
This distinction is supported by the enthalpy data. The cold-crystallization enthalpy (ΔHcc) increased from 3.46 J g−1 for neat PLA to 5.12 and 4.89 J g−1 for the 1.0 and 2.0 wt% nanocomposites, respectively. Similarly, the melting enthalpy (ΔHm) increased from 3.86 J g−1 for neat PLA to 5.46 and 5.15 J g−1 for the corresponding nanocomposites. Because the increases in (ΔHm) and (ΔHcc) were of similar magnitude, their difference remained small, resulting in calculated crystallinity values (Xc) of only 0.43% for neat PLA, 0.37% for PLA/1.0 wt% MWCNTs, and 0.29% for PLA/2.0 wt% MWCNTs.
Thus, despite the shift in cold crystallization toward lower temperatures, the calculated (Xc) values show that all investigated materials remained predominantly amorphous after processing. The MWCNTs therefore appear to have influenced the temperature at which PLA chains reorganized during the DSC heating scan without producing a measurable increase in the initial crystalline fraction of the processed material. This behavior illustrates the distinction between nucleation kinetics during heating and the crystalline fraction established during FFF processing. A nanofiller may facilitate crystallization when sufficient thermal energy and chain mobility become available during DSC heating while the rapid and spatially nonuniform thermal history associated with FFF may still limit crystallization during specimen fabrication.
The small decrease in (Tg) observed after MWCNT incorporation may indicate changes in the local mobility of the PLA chains. However, because the variation was limited and no complementary molecular-mobility or molecular-weight measurements were performed, a specific mechanism cannot be established from the present DSC data alone. In particular, possible contributions from polymer–nanotube interactions and the additional thermal history associated with repeated extrusion cannot be separated experimentally in the present study. Accordingly, the (Tg) variation should be interpreted cautiously rather than attributed exclusively to the presence of MWCNTs.
Overall, the DSC results indicate that MWCNT incorporation had a more evident effect on the cold-crystallization behavior of PLA than on its melting behavior or final degree of crystallinity. The reduction in (Tcc) is consistent with facilitated crystallization during heating, potentially through heterogeneous nucleation at the nanotube–polymer interface [3,4,5,13], whereas the very low (Xc) values demonstrate that this effect did not translate into increased crystallinity in the as-processed FFF material.
3.3. Compressive Behavior of Nearly Solid Specimens
The compressive behavior of the nearly solid specimens is presented in Figure 9 and Table 1. Figure 9 presents representative compressive stress–strain curves, whereas Table 1 summarizes the corresponding compressive strength and elastic modulus values for the investigated nearly solid configurations. Compared with neat PLA, the incorporation of MWCNTs resulted in progressively higher average compressive strength with increasing nanotube concentration, while the elastic modulus exhibited a non-monotonic response, reaching its highest average value for the composite containing 2.0 wt% MWCNTs. These results indicate a tendency toward improved compressive load-bearing capability with increasing nanotube content in the nearly solid structures, particularly in terms of compressive strength [14,15,16,17,18,19,20].
Figure 9.
Representative compressive stress–strain curves of nearly solid FFF-printed specimens, including neat PLA with concentric, hexagonal, and triangular infill patterns, and PLA reinforced with 1.0 and 2.0 wt% MWCNTs–COOH printed using the selected triangular architecture.
Neat PLA manufactured with the selected triangular infill pattern exhibited an average compressive strength of 53.4 ± 4.5 MPa and an elastic modulus of 1.37 ± 0.05 GPa. With the incorporation of 1.0 wt% MWCNTs, the average compressive strength increased slightly to 55.5 ± 17.5 MPa, while the elastic modulus decreased to 0.97 ± 0.68 GPa. At 2.0 wt% MWCNTs, the highest average values were obtained, reaching 73.6 ± 15.0 MPa for compressive strength and 2.43 ± 1.72 GPa for elastic modulus. Despite these numerical variations, the differences among the investigated MWCNT concentrations were not statistically significant for either compressive strength or elastic modulus according to the ANOVA and Tukey post hoc analyses (p > 0.05).
The representative stress–strain curves provide additional insight into the deformation behavior of the investigated materials. All specimens exhibited the characteristic compressive response of thermoplastic polymers, consisting of an initial approximately linear region followed by yielding and progressive deformation [21,22]. The curves also reveal differences in the stress levels sustained by the investigated formulations throughout compression. In particular, the representative specimen containing 2.0 wt% MWCNTs reached the highest stress level among the investigated conditions, consistent with the higher average compressive strength obtained for this composition. However, the substantial experimental variability observed for the nanocomposite specimens should be considered when interpreting differences among individual representative curves.
The increase in the mean compressive strength observed at 2.0 wt% MWCNTs is consistent with the reinforcing potential of carbon nanotubes in polymer matrices. Owing to their high stiffness and aspect ratio, MWCNTs can contribute to stress transfer within the polymer when adequate interaction between the nanotubes and surrounding matrix is established [17,23,24,25,26]. Carboxyl functionalization may also modify nanotube–polymer interfacial interactions, potentially contributing to stress transfer between the PLA matrix and the reinforcing phase [17,23,24,25,26]. However, the effectiveness of this reinforcement depends strongly on factors such as nanotube distribution, interfacial interaction, processing history, and the presence of defects within the printed material [17,23,24,25,26].
In the nearly solid architecture, the high material fraction provides a relatively continuous load-bearing volume. Under compression, a large proportion of the applied load can therefore be transmitted through the polymer-rich cross-section and interconnected deposited roads. In this configuration, a possible local reinforcing contribution of the MWCNTs can be distributed through a comparatively large load-bearing volume, reducing the dependence of the global response on the deformation of individual cellular walls. This interpretation is consistent with the general mechanics of high-relative-density and cellular structures, in which increasing the amount of load-bearing material reduces the dominance of local bending and instability mechanisms [27,28,29,30,31,32,33,34,35,36].
The thermal and structural characterizations presented in the previous sections provide complementary information for interpreting these mechanical results. Raman spectroscopy demonstrated that the characteristic graphitic structure of the nanotubes remained preserved after extrusion and FFF processing, while DSC showed that MWCNT incorporation modified the crystallization behavior of PLA during heating. TGA, in turn, revealed only minor variations in the thermal degradation behavior of the investigated formulations. Therefore, the higher average compressive strength observed after MWCNT incorporation is more reasonably associated with the potential reinforcing contribution of the nanotubes and their interaction with the PLA matrix than with changes in the thermal stability of the polymer [3,4,5,14,15,16].
Nevertheless, the relatively large standard deviations obtained for the nanocomposite specimens, particularly for elastic modulus, indicate considerable variability in their mechanical response. Such variability may arise from the combined effects of FFF-related heterogeneity, including local voids, interfilament interfaces, and variations in interlayer bonding quality, together with variations introduced during nanocomposite processing [18,19,20,21,22,27,28]. Since nanotube dispersion was not directly quantified, the observed mechanical response cannot be attributed to a specific MWCNT distribution state. Therefore, the higher average values obtained at 2.0 wt% MWCNTs should be interpreted together with the statistical analysis presented in Section 3.5, rather than as evidence, by themselves, of a definitive concentration-dependent improvement.
The fracture mechanisms associated with these trends are further discussed in Section 3.6, where scanning electron microscopy provides complementary insight into changes in fracture morphology and interlayer cohesion after MWCNT incorporation.
3.4. Compressive Behavior of Honeycomb Structures
The compressive behavior of the honeycomb structures differed markedly from that observed for the nearly solid specimens, highlighting the important role of structural architecture in the mechanical response of the PLA/MWCNT nanocomposites. Figure 10 presents the average compressive strength and elastic modulus as a function of MWCNT concentration, while the corresponding numerical values are summarized in Table 3. Unlike the nearly solid specimens, which exhibited a tendency toward progressively higher average compressive strength with increasing MWCNT concentration, the honeycomb structures displayed a non-monotonic response, suggesting that their mechanical performance results from the interaction between material reinforcement and the deformation mechanisms associated with the cellular architecture [17,19,29,30,31].
Figure 10.
Mechanical properties of triangular honeycomb structures as a function of MWCNT concentration: (a) compressive strength and (b) elastic modulus. Data are presented as mean ± standard deviation (SD) (n = 5).
Table 3.
Compressive properties of FFF-printed honeycomb PLA and PLA/MWCNT specimens. Values are reported as mean ± standard deviation (n = 5).
As summarized in Table 3, the neat PLA honeycomb specimens exhibited average compressive strengths ranging from 19.8 ± 5.2 to 21.0 ± 2.5 MPa and elastic moduli ranging from 0.38 ± 0.05 to 0.48 ± 0.11 GPa, depending on the infill pattern. Among the neat PLA configurations, the triangular architecture exhibited a compressive strength of 21.0 ± 2.5 MPa and an elastic modulus of 0.42 ± 0.04 GPa and was subsequently used as the reference configuration for evaluating the effect of MWCNT incorporation.
The incorporation of 1.0 wt% MWCNTs produced the highest mechanical response among the investigated honeycomb compositions. As shown in Figure 10 and Table 3, the compressive strength increased from 21.0 ± 2.5 MPa for neat PLA with the triangular architecture to 33.3 ± 2.2 MPa for PLA/1.0 wt% MWCNTs, corresponding to an increase of approximately 59%. The elastic modulus increased from 0.42 ± 0.04 to 0.87 ± 0.30 GPa, corresponding to an increase of approximately 107%.
This improvement is consistent with the reinforcing potential of MWCNTs within polymer matrices. Owing to their high aspect ratio and stiffness, MWCNTs can contribute to stress transfer and restrict local polymer deformation when sufficiently coupled to the surrounding matrix [17,23,24,25,26]. In the honeycomb architecture, such changes in the local mechanical response of the material forming the cell walls may have a comparatively large effect on the global compressive behavior because the applied load is transmitted through relatively slender structural elements that are susceptible to bending, buckling, and progressive collapse [29,30,31,32,33,34,35,36].
Increasing the MWCNT concentration to 2.0 wt%, however, did not produce a further improvement. The compressive strength decreased to 20.9 ± 4.5 MPa and the elastic modulus to 0.36 ± 0.20 GPa (Figure 10 and Table 3), approaching the values obtained for the unreinforced triangular honeycomb specimens. Therefore, the mechanical response was clearly non-monotonic within the investigated concentration range, with the highest average strength and stiffness occurring at 1.0 wt% MWCNTs.
Several factors may contribute to the reduced reinforcement efficiency at the higher nanotube concentration. Increasing MWCNT content can potentially modify melt flow, nanofiller distribution, polymer–nanotube interactions, and local heterogeneity within the extruded and subsequently printed material [17,23,24,25,26]. In a cellular architecture, these effects may become particularly important because local variations in the material forming an individual cell wall can influence wall stability and consequently the macroscopic compressive response [29,30,31,32,33,34,35,36]. Nevertheless, MWCNT dispersion, melt rheology, local porosity, and interfacial strength were not quantitatively characterized in the present study. These mechanisms therefore cannot be established as the specific cause of the lower mechanical performance observed at 2.0 wt% MWCNTs.
The distinct response of the honeycomb structures can also be interpreted in terms of their characteristic deformation mechanisms. Unlike nearly solid specimens, where the applied load is distributed through a comparatively continuous load-bearing section, cellular architectures transmit compression through relatively slender walls that may undergo bending, buckling, and progressive collapse [32,33,35,36,37]. Under these conditions, local variations in filament deposition, interlayer bonding, and material distribution may have a proportionally greater influence on structural stability. Such local heterogeneities may act as preferential sites for deformation or instability and could therefore limit the extent to which additional material reinforcement is translated into improved macroscopic performance [17,19,29,30,31,35].
Representative compressive stress–strain curves for the honeycomb specimens are presented in Figure 11. The curves provide additional insight into the architecture-dependent deformation behavior and complement the average mechanical properties reported in Figure 10 and Table 3.
Figure 11.
Representative compressive stress–strain curves of honeycomb FFF-printed specimens, including neat PLA with concentric, hexagonal, and triangular infill patterns, and PLA reinforced with 1.0 and 2.0 wt% MWCNTs–COOH manufactured using the selected triangular architecture.
As shown in Figure 11, the honeycomb specimens exhibited the characteristic compressive response of cellular structures, consisting of an initial approximately linear region followed by progressive deformation associated with cell-wall collapse and, at larger strains, increasing stress as the cellular structure became progressively compacted [32,33,38]. The representative specimen containing 1.0 wt% MWCNTs sustained higher stress levels over much of the deformation range, consistent with its higher average compressive strength and elastic modulus. In contrast, the representative specimen containing 2.0 wt% MWCNTs sustained lower stress levels over much of the deformation range, further illustrating the non-monotonic dependence of the honeycomb response on MWCNT concentration. These representative curves should be interpreted together with the average mechanical properties shown in Figure 10 and Table 3 and with the statistical analyses presented in Section 3.5.
A direct comparison between the nearly solid and honeycomb specimens demonstrates that the mechanical contribution of MWCNT incorporation depends on the load-bearing architecture. Whereas the nearly solid specimens exhibited a tendency toward progressively higher average compressive strength with increasing MWCNT concentration, the honeycomb structures showed their highest average mechanical performance at 1.0 wt% MWCNTs within the investigated concentration range. This contrast indicates that the most effective nanotube concentration cannot be regarded solely as an intrinsic characteristic of the nanocomposite, but also depends on the architecture through which the applied loads are transmitted. The statistical significance of this architecture-dependent response is examined in Section 3.5, while the corresponding fracture morphologies are discussed in Section 3.6 through scanning electron microscopy.
3.5. Statistical Analysis
Statistical analyses were performed considering the two stages of the experimental design. First, one-way analysis of variance (ANOVA) followed by Tukey’s post hoc test was used to evaluate the influence of infill pattern on the mechanical response of neat PLA specimens. Subsequently, the combined effects of structural architecture and MWCNT concentration were evaluated by two-way ANOVA, including the architecture × MWCNT concentration interaction term. This second analysis was performed to determine whether the mechanical effect of MWCNT incorporation depended on the load-bearing architecture.
For the nearly solid PLA specimens, the influence of the infill pattern depended on the evaluated mechanical property. Although the triangular architecture exhibited the highest average compressive strength, the three infill patterns remained statistically comparable for this property (p = 0.1765). This result indicates that, at the 90% infill density adopted in this study, differences in internal filament arrangement were not sufficient to produce statistically significant differences in compressive strength. Conversely, the elastic modulus was more sensitive to the printing architecture (p = 0.0425). Tukey’s pairwise comparisons showed that the triangular configuration exhibited significantly higher stiffness than the hexagonal pattern (adjusted p = 0.0344), whereas the concentric specimens remained statistically indistinguishable from both configurations. The complete one-way ANOVA and Tukey results for compressive strength and elastic modulus are presented in Table 4, Table 5, Table 6 and Table 7, respectively. These findings, together with the higher mean values obtained for the triangular configuration, support its selection as the reference infill pattern for the subsequent nanocomposite investigation.
Table 4.
One-way ANOVA for the compressive strength of nearly solid PLA specimens with different infill patterns.
Table 5.
Tukey’s multiple comparison test for the compressive strength of nearly solid PLA specimens with different infill patterns.
Table 6.
One-way ANOVA for the elastic modulus of nearly solid PLA specimens with different infill patterns.
Table 7.
Tukey’s multiple comparison test for the elastic modulus of nearly solid PLA specimens with different infill patterns.
After establishing the triangular pattern as the reference configuration, the mechanical responses of the nearly solid and honeycomb specimens were analyzed jointly to determine whether the effect of MWCNT concentration depended on structural architecture. Structural architecture and MWCNT concentration were considered fixed factors, and the architecture × MWCNT concentration interaction was explicitly evaluated. This approach distinguishes the individual contributions of composition and architecture from their interaction and, more importantly, tests whether changing MWCNT concentration produces the same mechanical response in the two structural configurations.
For compressive strength, structural architecture exhibited a significant main effect (F(1,24) = 98.96, p < 0.0001), reflecting the substantially different load-bearing capacities of the nearly solid and honeycomb configurations. In contrast, the main effect of MWCNT concentration was not statistically significant (F(2,24) = 2.76, p = 0.0831). Importantly, however, the architecture × MWCNT concentration interaction was statistically significant (F(2,24) = 6.20, p = 0.0067), demonstrating that the effect of nanotube concentration on compressive strength depended on the structural architecture (Table 8).
Table 8.
Two-way ANOVA for the effects of structural architecture and MWCNT concentration on compressive strength.
A similar interaction-dependent response was observed for the elastic modulus. Structural architecture exhibited a significant main effect (F(1,24) = 13.75, p = 0.0011), whereas the main effect of MWCNT concentration was not statistically significant (F(2,24) = 1.35, p = 0.2786). Nevertheless, the architecture × MWCNT concentration interaction was statistically significant (F(2,24) = 4.10, p = 0.0294), demonstrating that the influence of nanotube concentration on stiffness also depended on structural configuration (Table 9).
Table 9.
Two-way ANOVA for the effects of structural architecture and MWCNT concentration on elastic modulus.
The significant interaction terms are particularly important because they demonstrate that the effect of MWCNT concentration cannot be interpreted independently of structural architecture. In other words, the absence of a significant overall main effect of MWCNT concentration does not imply that nanotube incorporation had no mechanical effect. Rather, the response to MWCNT concentration changed according to the architecture in which the nanocomposite was employed. This interpretation is consistent with the mechanical trends described in Section 3.3 and Section 3.4: the nearly solid specimens showed a tendency toward increasing average compressive strength with increasing MWCNT concentration, whereas the honeycomb specimens exhibited a non-monotonic response, with their highest average strength and modulus at 1.0 wt% MWCNTs.
Because significant architecture × concentration interactions were identified, simple-effects analyses were subsequently performed to determine the effect of MWCNT concentration within each structural architecture. One-way ANOVA followed by Tukey’s multiple-comparison test showed that no pairwise differences among MWCNT concentrations reached statistical significance for either compressive strength or elastic modulus in the nearly solid specimens. In contrast, significant concentration-dependent differences were observed within the honeycomb architecture. The complete pairwise comparisons are summarized in Table 10.
Table 10.
Tukey’s multiple-comparison test for the effect of MWCNT concentration within each structural architecture.
For the nearly solid specimens, the apparent increase in average compressive strength with MWCNT concentration did not reach statistical significance. The comparison between neat PLA and 2.0 wt% MWCNTs approached, but did not reach, the significance threshold (adjusted p = 0.0854). Likewise, no significant differences in elastic modulus were observed among the three MWCNT concentrations. Therefore, although the 2.0 wt% formulation exhibited the highest mean strength and modulus, the experimental variability prevents these numerical increases from being interpreted as statistically confirmed improvements.
A markedly different response was observed for the honeycomb architecture. For compressive strength, the 1.0 wt% MWCNT formulation was significantly higher than both neat PLA (adjusted p = 0.00017) and the 2.0 wt% formulation (adjusted p = 0.00015), whereas neat PLA and 2.0 wt% MWCNTs were statistically indistinguishable (adjusted p = 0.9981). The same pattern was observed for elastic modulus: the 1.0 wt% formulation exhibited significantly higher stiffness than neat PLA (adjusted p = 0.0150) and 2.0 wt% MWCNTs (adjusted p = 0.0072), while no significant difference was observed between neat PLA and 2.0 wt% MWCNTs (adjusted p = 0.9137). These results statistically confirm the non-monotonic response observed in Section 3.4 and demonstrate that, within the investigated honeycomb architecture, increasing MWCNT content beyond 1.0 wt% did not provide additional mechanical benefit.
Taken together, the statistical analyses provide direct evidence that the mechanical response to MWCNT incorporation depended on the load-bearing architecture. Importantly, this comparison was performed using the same PLA/MWCNT formulations (0, 1.0, and 2.0 wt%), the same triangular deposition pattern, and identical manufacturing parameters for both structural configurations. The significant architecture × MWCNT concentration interactions for compressive strength and elastic modulus therefore demonstrate that the same changes in material composition produced different mechanical responses depending on whether the nanocomposite was arranged in a nearly solid or cellular load-bearing configuration. Within the investigated design space, 1.0 wt% MWCNTs represented the most effective reinforcement condition for the triangular honeycomb architecture, whereas no statistically significant concentration-dependent improvement was established for the nearly solid configuration. The morphological features associated with these contrasting mechanical responses are examined in Section 3.6.
3.6. Fractographic Analysis by Scanning Electron Microscopy
Scanning electron microscopy was employed to examine the post-compression fracture morphologies of the nearly solid and honeycomb specimens. The fracture surfaces presented in Figure 12 and Figure 13 reveal differences in interfacial separation, fracture-path morphology, and material deformation as a function of structural architecture and MWCNT concentration. These observations provide complementary morphological evidence for interpreting the mechanical and statistical responses discussed in Section 3.3, Section 3.4 and Section 3.5. However, the SEM observations are interpreted qualitatively and are not considered direct evidence of the nanoscale dispersion state of the MWCNTs within the PLA matrix.
Figure 12.
SEM micrographs of the fracture surfaces of nearly solid specimens (90% infill): (a) neat PLA with concentric infill, (b) neat PLA with hexagonal infill, (c) neat PLA with triangular infill, (d) PLA/1.0 wt% MWCNTs with triangular infill, and (e) PLA/2.0 wt% MWCNTs with triangular infill. All micrographs are presented with a 200 µm scale bar.
Figure 13.
SEM micrographs of the fracture surfaces of honeycomb specimens: (a) neat PLA with concentric infill, (b) neat PLA with hexagonal infill, (c) neat PLA with triangular infill, (d) PLA/1.0 wt% MWCNTs with triangular infill, and (e) PLA/2.0 wt% MWCNTs with triangular infill. All micrographs are presented with a 200 µm scale bar.
3.6.1. Nearly Solid Structures
The fracture morphologies of the nearly solid specimens are presented in Figure 12. The micrographs include neat PLA manufactured with concentric, hexagonal, and triangular infill patterns, together with the PLA/1.0 wt% MWCNT and PLA/2.0 wt% MWCNT specimens manufactured using the selected triangular pattern. This comparison enables the effects of both deposition architecture and nanofiller incorporation on the post-compression morphology to be qualitatively assessed.
The fracture surface of the concentric specimen (Figure 12a) is characterized by relatively flat regions separated by well-defined raster interfaces. Localized voids and partially detached filaments are also visible, indicating that fracture propagation occurred preferentially along some of the interfaces between adjacent deposited filaments. Such behavior is consistent with the heterogeneous and anisotropic structure generated by FFF, in which interfaces between deposited roads can act as mechanically weaker regions and preferential paths for crack propagation [18,19,20,21,22,27,28].
The hexagonal specimen (Figure 12b) exhibits a comparatively more continuous fracture morphology, with less pronounced interfacial separation than that observed for the concentric pattern. Although localized discontinuities remain visible, the fracture surface appears more homogeneous, suggesting that fracture propagation was less strongly localized along individual raster interfaces. This morphological difference is consistent with the influence of filament arrangement and connectivity on stress transfer and crack propagation in FFF-manufactured structures [18,19,20,21,22].
The triangular specimen (Figure 12c) shows a rougher and more irregular fracture surface, with greater local material deformation and a less clearly defined separation between adjacent deposited roads. This morphology suggests that the triangular arrangement promoted a more distributed deformation process before fracture, rather than failure being strongly localized along a limited number of interfilament interfaces. Such behavior is consistent with the interconnected load-transfer paths associated with the triangular architecture and with its comparatively high average compressive strength and elastic modulus reported in Section 3.1. Nevertheless, the SEM images represent post-fracture surfaces and therefore do not independently establish the sequence of crack initiation and propagation during loading.
After MWCNT incorporation, changes in the fracture morphology are also evident. The PLA/1.0 wt% MWCNT specimen (Figure 12d) exhibits an irregular surface with localized deformation and regions in which the boundaries between adjacent deposited filaments remain visible. Compared with neat PLA with triangular infill, the morphology indicates that MWCNT incorporation altered the post-compression fracture surface, although the micrograph alone does not establish whether this change resulted directly from nanotube–matrix interactions, changes in interfilament bonding, or other processing-related effects.
The PLA/2.0 wt% MWCNT specimen (Figure 12e) exhibits pronounced surface irregularity and more extensive local material deformation. The fracture path appears comparatively tortuous, with fewer large flat regions than those observed in the neat PLA specimens. A more irregular fracture path can be consistent with increased resistance to localized crack propagation because the crack is required to propagate through a geometrically more complex path [17,23,24,25,26]. This morphology is therefore qualitatively consistent with the higher average compressive strength obtained for the 2.0 wt% MWCNT nearly solid specimens.
Importantly, however, the mechanical differences among the MWCNT concentrations in the nearly solid configuration were not statistically significant, as demonstrated in Section 3.5. Therefore, the morphology observed in Figure 12e should not be interpreted as direct proof of superior reinforcement at 2.0 wt% MWCNTs. Instead, the SEM observations provide complementary qualitative evidence consistent with the higher mean mechanical response while also illustrating the heterogeneous fracture behavior characteristic of the printed nanocomposite.
Furthermore, the magnification and imaging conditions employed in the present SEM analysis do not permit the spatial distribution of individual MWCNTs within the PLA matrix to be directly resolved. Consequently, features observed in Figure 12 cannot be used to demonstrate homogeneous nanotube dispersion, nanotube agglomeration, or the quality of the nanoscale PLA–MWCNT interface. Direct assessment of these phenomena would require complementary high-resolution characterization specifically designed for nanoscale dispersion analysis.
3.6.2. Honeycomb Structures
The post-compression fracture morphologies of the honeycomb specimens are presented in Figure 13. In contrast to the nearly solid configuration, the honeycomb architecture transmits the applied compressive load through comparatively slender cellular walls. Consequently, local deformation, interfilament separation, wall bending, and progressive cell collapse can exert a proportionally greater influence on the macroscopic mechanical response [29,30,31,32,33,34,35,36].
For the neat PLA honeycomb specimen (Figure 13a), the fracture surface exhibits clearly identifiable filament boundaries and localized interfacial separation. These features indicate that deformation and fracture occurred not only through the polymer material itself but also along interfaces generated during filament deposition. In cellular structures, such local discontinuities may be particularly important because the load-bearing capacity depends directly on the integrity and stability of the individual walls forming the cellular network [29,30,31,32,33,34,35].
The PLA/1.0 wt% MWCNT honeycomb specimen (Figure 13b) exhibits a comparatively more irregular fracture morphology, with evidence of greater local material deformation and less extensive separation along some of the deposited-filament interfaces. This morphology is qualitatively consistent with the mechanical results reported in Section 3.4, in which the 1.0 wt% formulation exhibited the highest compressive strength and elastic modulus among the honeycomb specimens. The statistical analysis further demonstrated that these increases were significant relative to both neat PLA and the 2.0 wt% formulation.
From a cause-and-effect perspective, the improvement observed at 1.0 wt% may be associated with a more effective translation of the local reinforcing contribution of the MWCNT-containing PLA into the load-bearing cellular walls. Carbon nanotubes can contribute to stress transfer and restrict local polymer deformation when effective interaction with the surrounding matrix is established [17,23,24,25,26]. Because honeycomb compression is strongly governed by wall bending, buckling, and progressive collapse [29,30,31,32,33,34,35,36], an improvement in the local mechanical response of the wall material can produce a comparatively large change in the global response of the structure.
In contrast, the PLA/2.0 wt% MWCNT honeycomb specimen (Figure 13c) exhibits more evident localized deformation and separation along interfilament boundaries, with a less extensive cohesive-looking deformation morphology than that observed for the 1.0 wt% specimen. This observation is qualitatively consistent with the reduction in compressive strength and elastic modulus observed when the MWCNT concentration was increased from 1.0 to 2.0 wt%. The statistical results reinforce this distinction, since the 2.0 wt% formulation was statistically indistinguishable from neat PLA for both mechanical properties.
Nevertheless, the SEM observations do not establish the nanoscale mechanism responsible for the lower mechanical response of the 2.0 wt% honeycomb specimens. In particular, the present micrographs do not provide direct evidence that the reduction resulted from MWCNT agglomeration, inadequate nanotube dispersion, or reduced PLA–MWCNT interfacial adhesion. Other factors associated with nanocomposite processing and FFF manufacturing, including local material heterogeneity and interfilament bonding, may also contribute to the observed response [17,19,23,24,25,26,27,28,29,30,31]. Accordingly, the SEM results should be interpreted as complementary morphological evidence rather than direct proof of a specific nanoscale reinforcement mechanism.
Taken together, Figure 12 and Figure 13 reinforce the architecture-dependent interpretation established by the mechanical and statistical analyses. The nearly solid configuration distributes the compressive load through a comparatively continuous material volume and exhibited increasing mean strength with MWCNT concentration, although the differences among compositions were not statistically significant. In contrast, the honeycomb configuration was more sensitive to MWCNT concentration, exhibiting a statistically confirmed optimum at 1.0 wt%. The corresponding fracture morphologies suggest that differences in local deformation and interfilament separation accompany these contrasting mechanical responses.
Thus, the combined mechanical, statistical, and morphological results indicate that MWCNT reinforcement cannot be interpreted independently of the architecture in which the nanocomposite is employed. The same material formulations produced distinct mechanical responses when incorporated into nearly solid and cellular load-bearing configurations, supporting the central hypothesis that reinforcement efficiency in FFF-printed PLA/MWCNT nanocomposites is architecture-dependent.
4. Conclusions
This study demonstrated that the mechanical response of FFF-manufactured PLA/MWCNT components depends on the interaction between nanocomposite composition and load-bearing architecture. Raman spectroscopy confirmed the characteristic graphitic contribution of the MWCNTs after processing, while thermal characterization indicated that MWCNT incorporation produced only minor changes in PLA thermal degradation and affected its crystallization behavior.
The mechanical and statistical analyses revealed distinct concentration-dependent responses for the two investigated structural configurations. In the nearly solid specimens, the differences among MWCNT concentrations were not statistically significant. In contrast, the honeycomb structures exhibited their highest mechanical performance at 1.0 wt% MWCNTs, with significantly higher compressive strength and elastic modulus than both neat PLA and the 2.0 wt% formulation. The significant architecture × MWCNT concentration interactions for compressive strength and elastic modulus confirmed that the effect of MWCNT incorporation depended on structural configuration.
SEM observations provided complementary morphological evidence consistent with these mechanical trends, without being interpreted as direct proof of the underlying reinforcement mechanisms. Overall, the results show that MWCNT concentration and structural architecture should be considered jointly when designing FFF-manufactured PLA nanocomposites. Within the investigated design space, 1.0 wt% MWCNTs provided the most effective reinforcement for the triangular honeycomb architecture, highlighting the importance of integrating material formulation and structural design in additively manufactured polymer nanocomposites.
Future work should extend the present findings toward application-oriented manufacturing conditions by evaluating PLA/MWCNT components over a broader range of infill densities and processing parameters. In particular, lower infill densities should be investigated to determine whether the architecture-dependent reinforcing behavior observed under the present 90% infill condition is maintained in lighter structures with greater potential for material and weight reduction. In parallel, future studies should systematically investigate MWCNT distribution within the PLA matrix using higher-resolution characterization techniques and evaluate the effects of compounding and extrusion parameters on nanofiller dispersion and PLA degradation. These investigations would help establish processing–dispersion–architecture relationships and support the translation of the present findings toward practical lightweight FFF components.
Author Contributions
Conceptualization, D.C.F. and D.S.S.; methodology, D.C.F. and D.S.S.; investigation, D.C.F. and D.S.S.; formal analysis, D.C.F., D.M.P., M.A.P., M.E.S.d.S., A.J.G.d.S., D.S.S. and R.F.P.J.; writing—review and editing, S.N.M. and M.A.L.d.R.; supervision, S.N.M. and M.A.L.d.R.; resources, S.N.M.; funding acquisition, S.N.M. All authors have read and agreed to the published version of the manuscript.
Funding
This study was financed in part by the National Council for Scientific and Technological Development—Brazil (CNPq), number code: 150581/2025-4.
Data Availability Statement
The raw data supporting the conclusions of this article will be made available by the authors on request.
Acknowledgments
The authors acknowledge the Laboratory of Vibrational Spectroscopy and High Pressure (LEVAP), Federal University of Pará (UFPA), for providing the facilities used for Raman spectroscopy analyses. In addition, the authors acknowledge the Laboratory of Materials Characterization, Federal University of Pará (UFPA), Ananindeua Campus, for providing the facilities used to perform the mechanical compression tests.
Conflicts of Interest
The authors declare no conflicts of interest.
References
- Yang, L.; Li, S.; Zhou, X.; Liu, J.; Li, Y.; Yang, M.; Yuan, Q.; Zhang, W. Effects of carbon nanotube on the thermal, mechanical, and electrical properties of PLA/MWCNT printed parts in the FFF process. Synth. Met. 2019, 253, 122–130. [Google Scholar] [CrossRef] [Scilit]
- Vidakis, N.; Petousis, M.; Kourinou, M.; Velidakis, E.; Mountakis, N.; Fischer-Griffiths, P.E.; Grammatikos, S.; Tzounis, L. Additive manufacturing of multifunctional polylactic acid (PLA)–multiwalled carbon nanotubes (MWCNTs) nanocomposites. Nanocomposites 2021, 7, 184–199. [Google Scholar] [CrossRef] [Scilit]
- De Bortoli, L.S.; de Farias, R.; Mezalira, D.Z.; Schabbach, L.M.; Fredel, M.C. Functionalized carbon nanotubes for 3D-printed PLA-nanocomposites: Effects on thermal and mechanical properties. Mater. Today Commun. 2022, 31, 103402. [Google Scholar] [CrossRef] [Scilit]
- Younus, M.M.; Naguib, H.M.; Fekry, M.; Elsawy, M.A. Pushing the limits of PLA by exploring the power of MWCNTs in enhancing thermal, mechanical properties, and weathering resistance. Sci. Rep. 2023, 13, 16588. [Google Scholar] [CrossRef] [Scilit]
- da Silva, F.U.; Luna, C.B.B.; da Silva, F.S.; Barreto, J.V.M.; Schmitz, D.P.; Soares, B.G.; Wellen, R.M.R.; Araújo, E.M. Exploring the effect of annealing on PLA/carbon nanotube nanocomposites: In search of efficient PLA/MWCNT nanocomposites for electromagnetic shielding. Polymers 2025, 17, 246. [Google Scholar] [CrossRef] [Scilit]
- Soltani, A.; Noroozi, R.; Bodaghi, M.; Zolfagharian, A.; Hedayati, R. 3D printing on-water sports boards with bio-inspired core designs. Polymers 2020, 12, 250. [Google Scholar] [CrossRef] [Scilit]
- Wang, S.; Ma, Y.; Deng, Z.; Zhang, S.; Cai, J. Effects of fused deposition modeling process parameters on tensile, dynamic mechanical properties of 3D printed polylactic acid materials. Polym. Test. 2020, 86, 106483. [Google Scholar] [CrossRef] [Scilit]
- Aboelella, M.G.; Ebeid, S.J.; Sayed, M.M. Layer combination of similar infill patterns on the tensile and compression behavior of 3D printed PLA. Sci. Rep. 2025, 15, 11759. [Google Scholar] [CrossRef] [Scilit]
- Sun, Q.; Potu, S.T.; Man, J.; Tan, X.; Yin, K.; Cao, B.; Eberl, C. Effect of infill pattern on the mechanical properties and stress relaxation behavior of 3D printed PEEK. J. Mater. Res. Technol. 2025, 39, 5306–5318. [Google Scholar] [CrossRef] [Scilit]
- Farias, D.C.; Santos, A.J.G.; Silva, D.S.; Junio, R.F.P.; Monteiro, S.N.; Reis, M.A.L. Influence of infill architecture on the mechanical performance and fracture behavior of FDM-manufactured PLA solid and honeycomb structures. J. Mater. Res. Technol. 2026, 43, 4836–4854. [Google Scholar] [CrossRef] [Scilit]
- ASTM D695-15; Standard Test Method for Compressive Properties of Rigid Plastics. ASTM International: West Conshohocken, PA, USA, 2015.
- Enriconi, M.; Rodriguez, R.; Araújo, M.; Rocha, J.; García-Martín, R.; Ribeiro, J.; García-Martín, R.; Ribeiro, J.; Pisonero, J.; Rodríguez-Martín, M. A comprehensive review of fused filament fabrication: Numerical modeling approaches and emerging trends. Appl. Sci. 2025, 15, 6696. [Google Scholar] [CrossRef] [Scilit]
- Vu, T.; Nikaeen, P.; Chirdon, W.; Khattab, A.; Depan, D. Improved weathering performance of poly(lactic acid) through carbon nanotubes addition: Thermal, microstructural, and nanomechanical analyses. Biomimetics 2020, 5, 61. [Google Scholar] [CrossRef] [Scilit]
- Mi, D.; Zhao, Z.; Bai, H. Improved yield and electrical properties of poly(lactic acid)/carbon nanotube composites by shear and anneal. Materials 2023, 16, 4012. [Google Scholar] [CrossRef] [Scilit]
- Pantani, R.; De Santis, F.; Sorrentino, A.; De Maio, F.; Titomanlio, G. Crystallization kinetics of virgin and processed poly(lactic acid). Polym. Degrad. Stab. 2010, 95, 1148–1159. [Google Scholar] [CrossRef] [Scilit]
- Yasuniwa, M.; Iura, K.; Dan, Y. Melting behavior of poly(L-lactic acid): Effects of crystallization temperature and time. Polymer 2007, 48, 5398–5407. [Google Scholar] [CrossRef] [Scilit]
- Li, Z.; Liu, H.; Li, Y. Study on mechanical properties of carbon nanotube reinforced composites. Polymers 2023, 15, 3362. [Google Scholar] [CrossRef] [Scilit]
- Kumaresan, R.; Kadirgama, K.; Samykano, M.; Harun, W.S.W.; Thirugnanasambandam, A.; Kanny, K. In-depth study and optimization of process parameters to enhance tensile and compressive strengths of PETG in FFF technology. J. Mater. Res. Technol. 2025, 37, 397–416. [Google Scholar] [CrossRef] [Scilit]
- Turaka, S.; Jagannati, V.; Pappula, B.; Makgato, S. Impact of infill density on morphology and mechanical properties of 3D printed ABS/CF-ABS composites using design of experiments. Heliyon 2024, 10, e29920. [Google Scholar] [CrossRef] [Scilit]
- Sandanamsamy, L.; Harun, W.S.W.; Ishak, I.; Kadirgama, K.; Samykano, M.; Tank, G. Revealing anisotropic properties in material extrusion/polylactic acid through multiplane printing. J. Mater. Eng. Perform. 2025, 34, 22853–22872. [Google Scholar] [CrossRef] [Scilit]
- Scipioni, S.I.; Lambiase, F. Yielding and post-yielding behavior of FFF parts under compression stress at different strain rates. Int. J. Adv. Manuf. Technol. 2023, 128, 1199–1211. [Google Scholar] [CrossRef] [Scilit]
- Bernard, C.A.; Correia, J.P.M.; Ahzi, S.; Bahlouli, N. Numerical implementation of an elastic-viscoplastic constitutive model to simulate the mechanical behaviour of amorphous polymers. Int. J. Mater. Form. 2017, 10, 607–621. [Google Scholar] [CrossRef] [Scilit]
- Parnian, P.; D’Amore, A. Fabrication of high-performance CNT reinforced polymer composite for additive manufacturing by phase inversion technique. Polymers 2021, 13, 4007. [Google Scholar] [CrossRef] [Scilit]
- Nurazzi, N.M.; Sabaruddin, F.A.; Harussani, M.M.; Kamarudin, S.H.; Rayung, M.; Asyraf, M.R.M.; Aisyah, H.A.; Norrrahim, M.N.F.; Ilyas, R.A.; Abdullah, N.; et al. Mechanical performance and applications of CNT reinforced polymer composites—A review. Nanomaterials 2021, 11, 2186. [Google Scholar] [CrossRef] [Scilit]
- Wongchai, B.; Chomphan, S. Correlation between infill density and mechanical properties in 3D printing. GEOMATE J. 2026, 30, 131–138. [Google Scholar] [CrossRef] [Scilit]
- Smoleń, P.; Czujko, T.; Komorek, Z.; Grochala, D.; Rutkowska, A.; Osiewicz-Powęzka, M. Mechanical and electrical properties of epoxy composites modified by functionalized multiwalled carbon nanotubes. Materials 2021, 14, 3325. [Google Scholar] [CrossRef] [Scilit]
- Gain, A.K.; Zhang, L. Design and characterization of durable glass fibre (GF)-reinforced PLA and PEEK biomaterials. Polymers 2025, 17, 2536. [Google Scholar] [CrossRef] [Scilit]
- Guo, S.; Ivanov, E.; Georgiev, V.; Stanley, P.; Radecka, I.; Eissa, A.M.; Tolve, R.; Tchuenbou-Magaia, F. Enhancing processability and multifunctional properties of polylactic acid–graphene/carbon nanotube composites with cellulose nanocrystals. Polymers 2026, 18, 99. [Google Scholar] [CrossRef] [Scilit]
- Deshpande, V.S.; Fleck, N.A.; Ashby, M.F. Effective properties of the octet-truss lattice material. J. Mech. Phys. Solids 2001, 49, 1747–1769. [Google Scholar] [CrossRef] [Scilit]
- Britto, J.J.J.; Vasanthanathan, A.; Krishnasamy, S.; Amudhan, K. Mechanical property study of 3D printed honeycomb structures with carbon fiber reinforcement: A finite element analysis and experimental approach. Discov. Mater. 2025, 5, 104. [Google Scholar] [CrossRef] [Scilit]
- Al-Ketan, O.; Abu Al-Rub, R.K. Multifunctional mechanical metamaterials based on triply periodic minimal surface lattices. Adv. Eng. Mater. 2019, 21, 1900524. [Google Scholar] [CrossRef] [Scilit]
- Gibson, L.J.; Ashby, M.F. Cellular Solids: Structure and Properties, 2nd ed.; Cambridge University Press: Cambridge, UK, 1997. [Google Scholar]
- Gibson, L.J. Mechanical behavior of metallic foams. Annu. Rev. Mater. Sci. 2000, 30, 191–227. [Google Scholar] [CrossRef] [Scilit]
- Zheng, X.; Lee, H.; Weisgraber, T.H.; Shusteff, M.; DeOtte, J.; Duoss, E.B.; Kuntz, J.D.; Biener, M.M.; Ge, Q.; Jackson, J.A.; et al. Ultralight, ultrastiff mechanical metamaterials. Science 2014, 344, 1373–1377. [Google Scholar] [CrossRef] [Scilit]
- Liu, R.; Chen, W.; Zhao, J. A review on factors affecting the mechanical properties of additively-manufactured lattice structures. J. Mater. Eng. Perform. 2024, 33, 4685–4711. [Google Scholar] [CrossRef] [Scilit]
- Ashby, M.F.; Evans, A.G.; Fleck, N.A.; Gibson, L.J.; Hutchinson, J.W.; Wadley, H.N.G. Metal Foams: A Design Guide; Butterworth-Heinemann: Oxford, UK, 2000. [Google Scholar]
- Song, W.; Zhao, L.; Liu, J.; Liu, S.; Yu, G.; Qin, B.; Xiao, L. Mechanical behavior of topology-optimized lattice structures fabricated by additive manufacturing. Materials 2025, 18, 3614. [Google Scholar] [CrossRef] [Scilit]
- Maskery, I.; Aboulkhair, N.T.; Aremu, A.O.; Tuck, C.J.; Ashcroft, I.A. Compressive failure modes and energy absorption in additively manufactured double gyroid lattices. Addit. Manuf. 2017, 16, 24–29. [Google Scholar] [CrossRef] [Scilit]
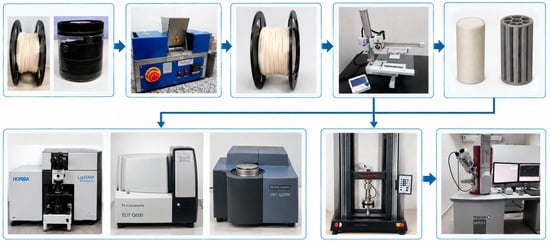
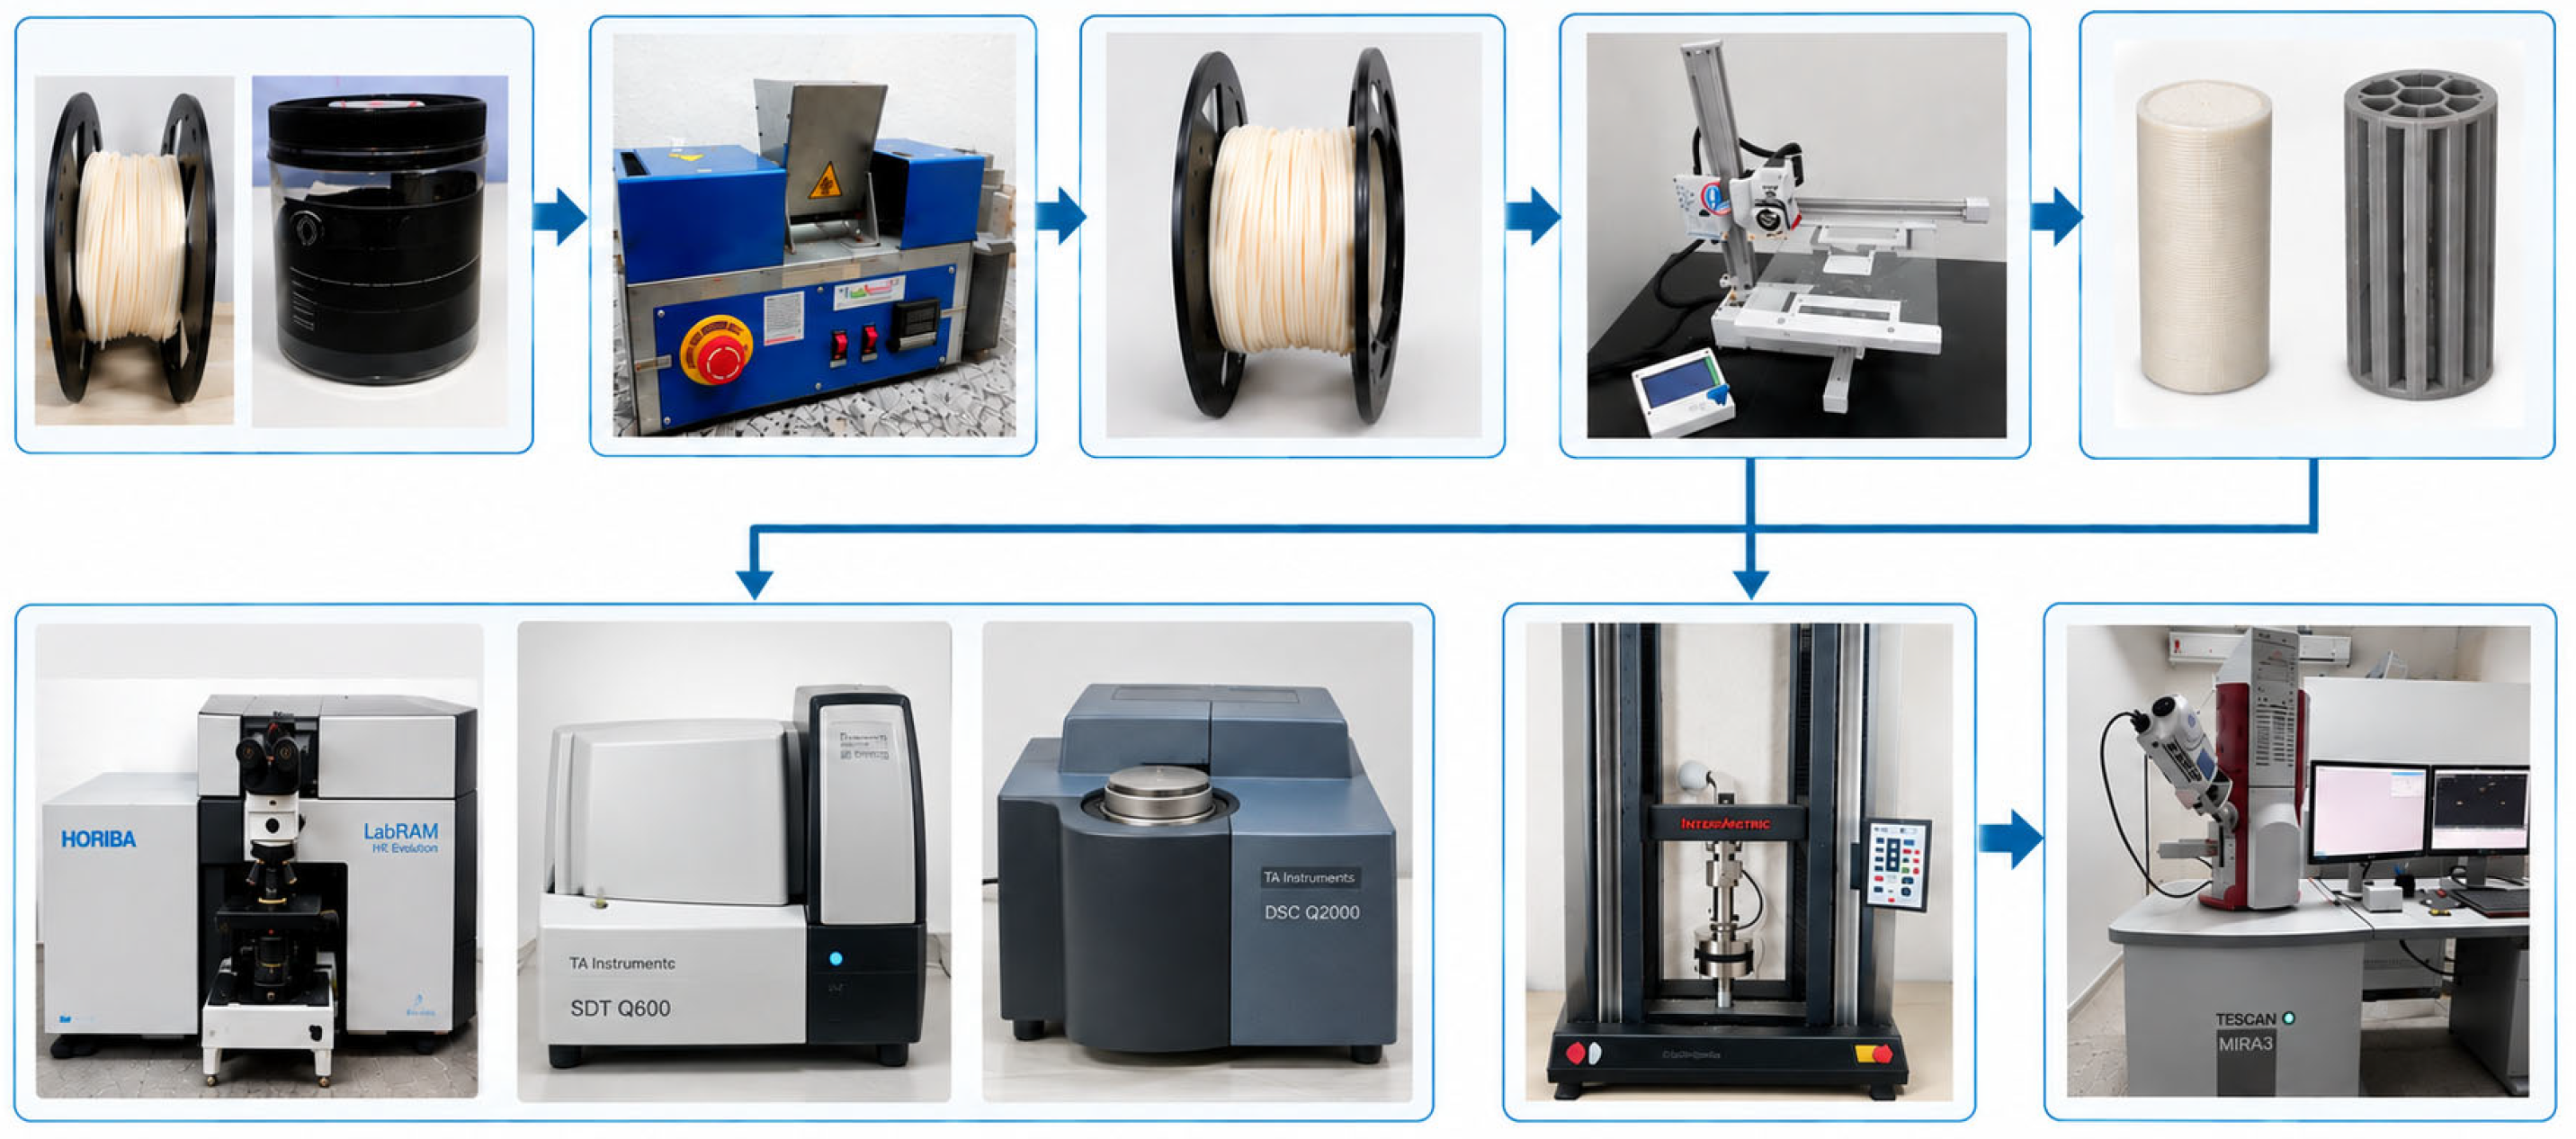
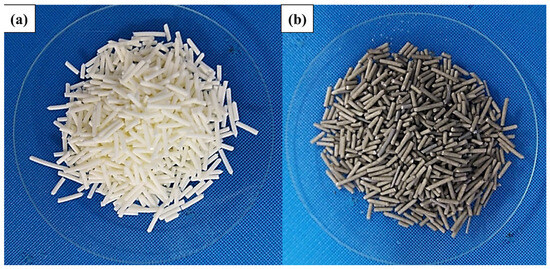
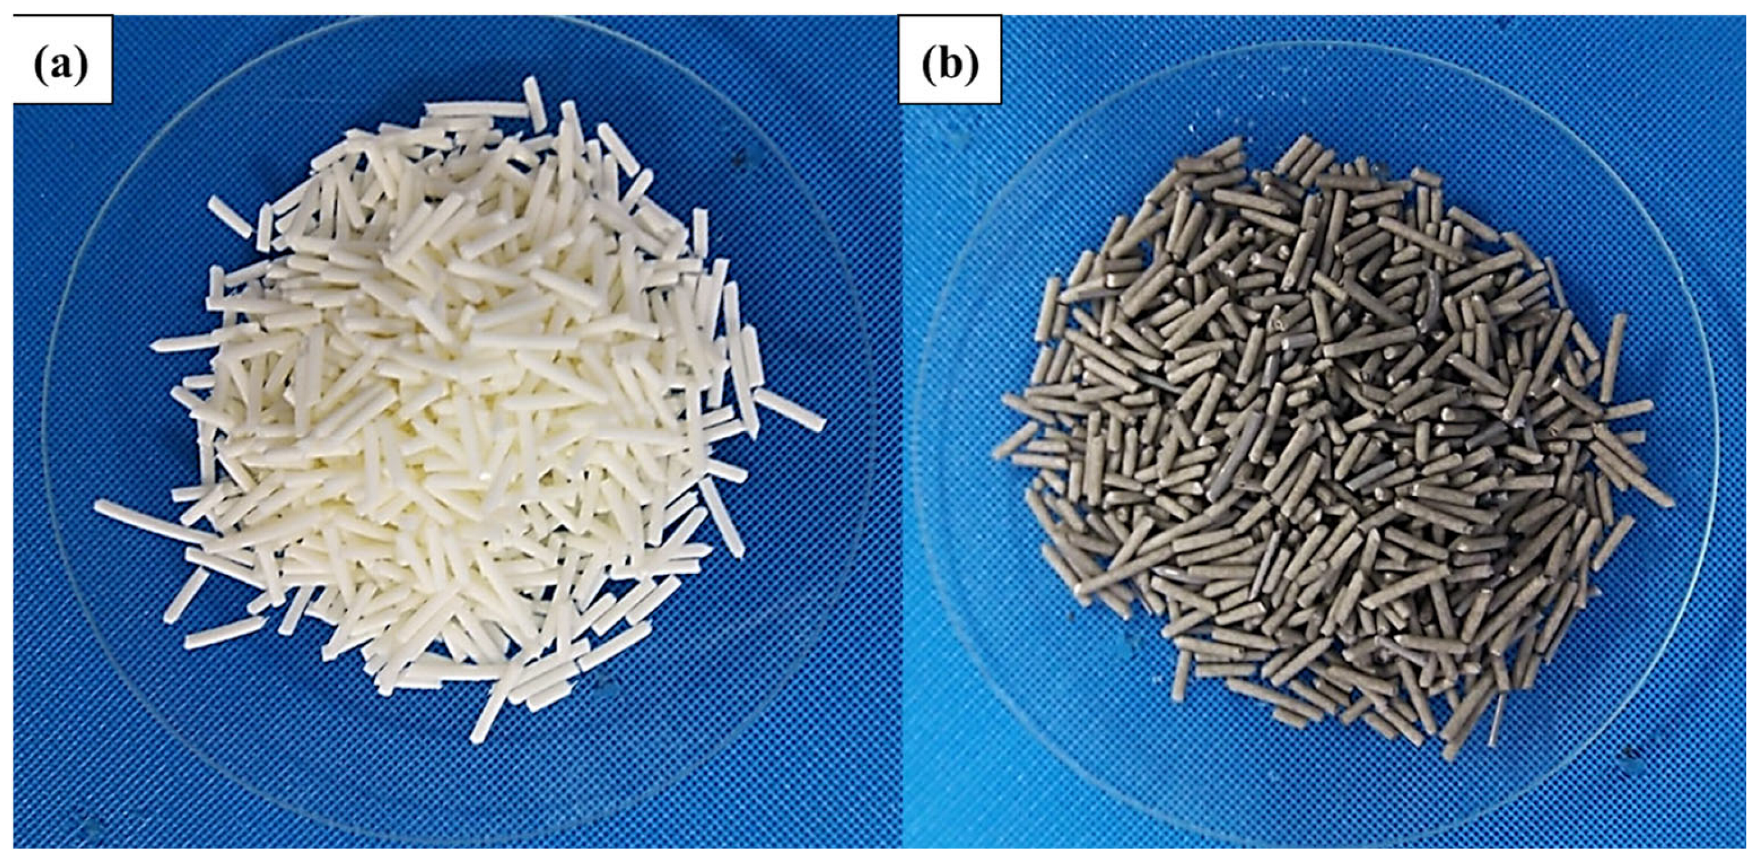
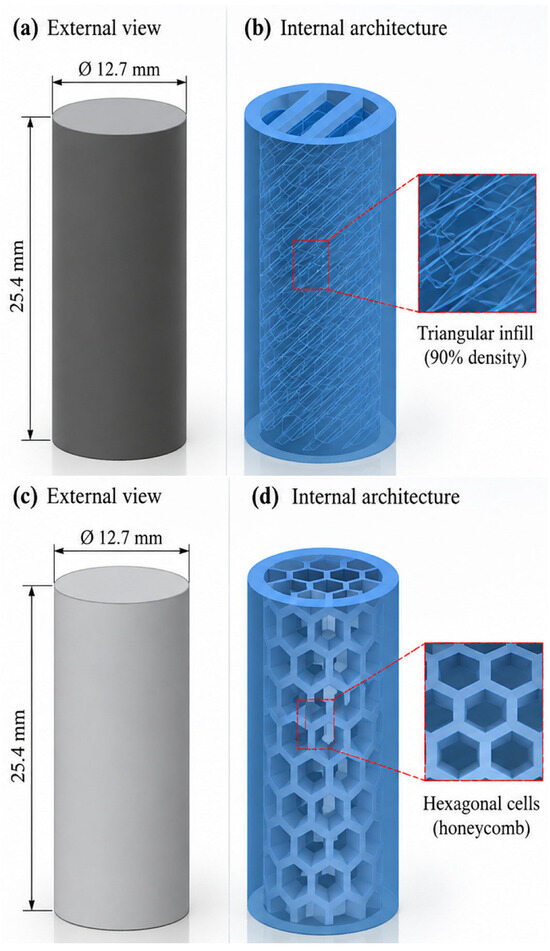
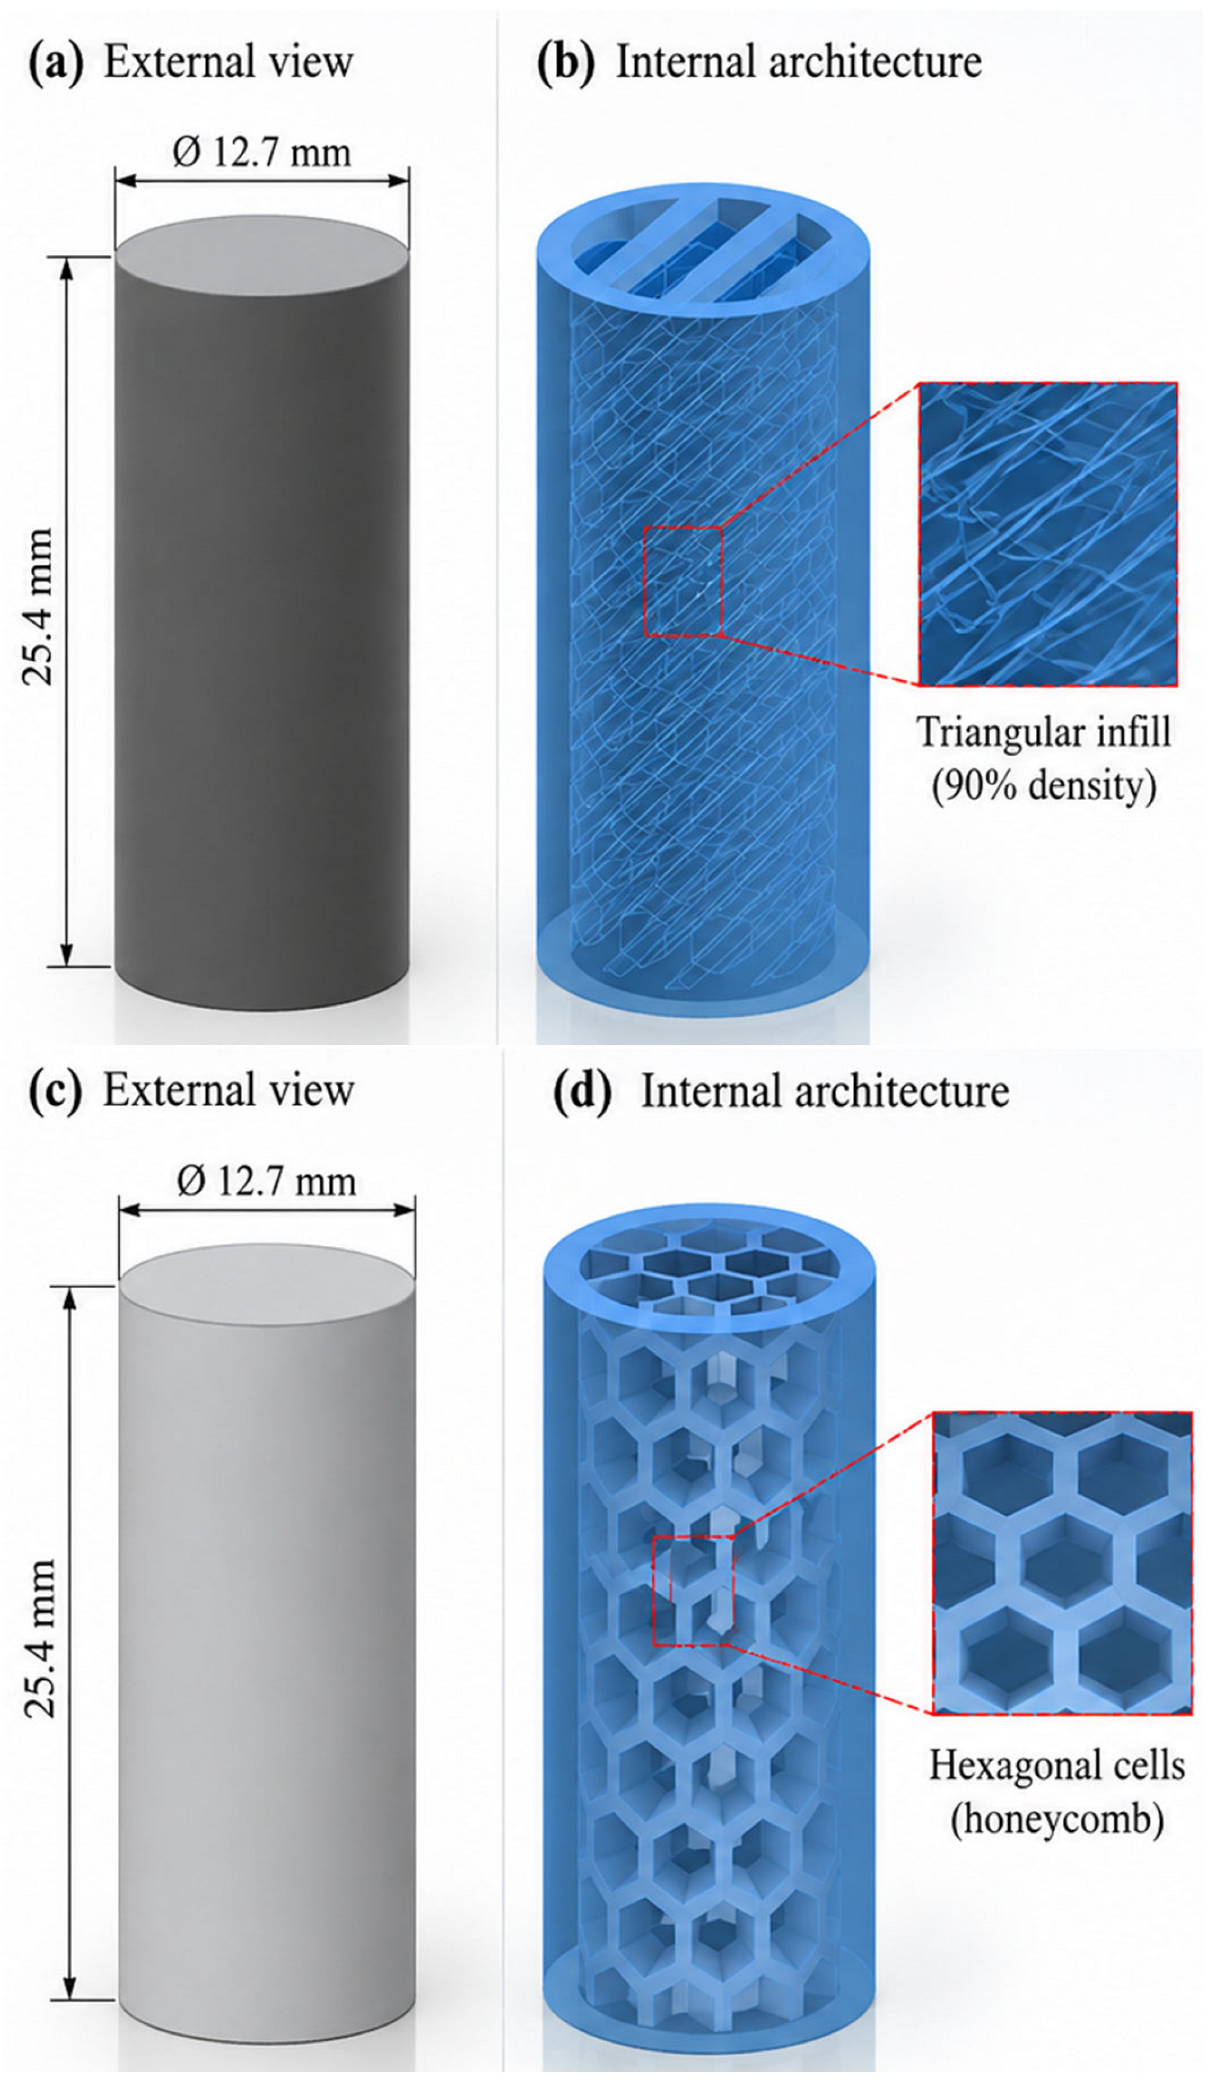
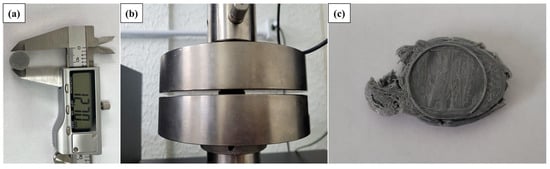
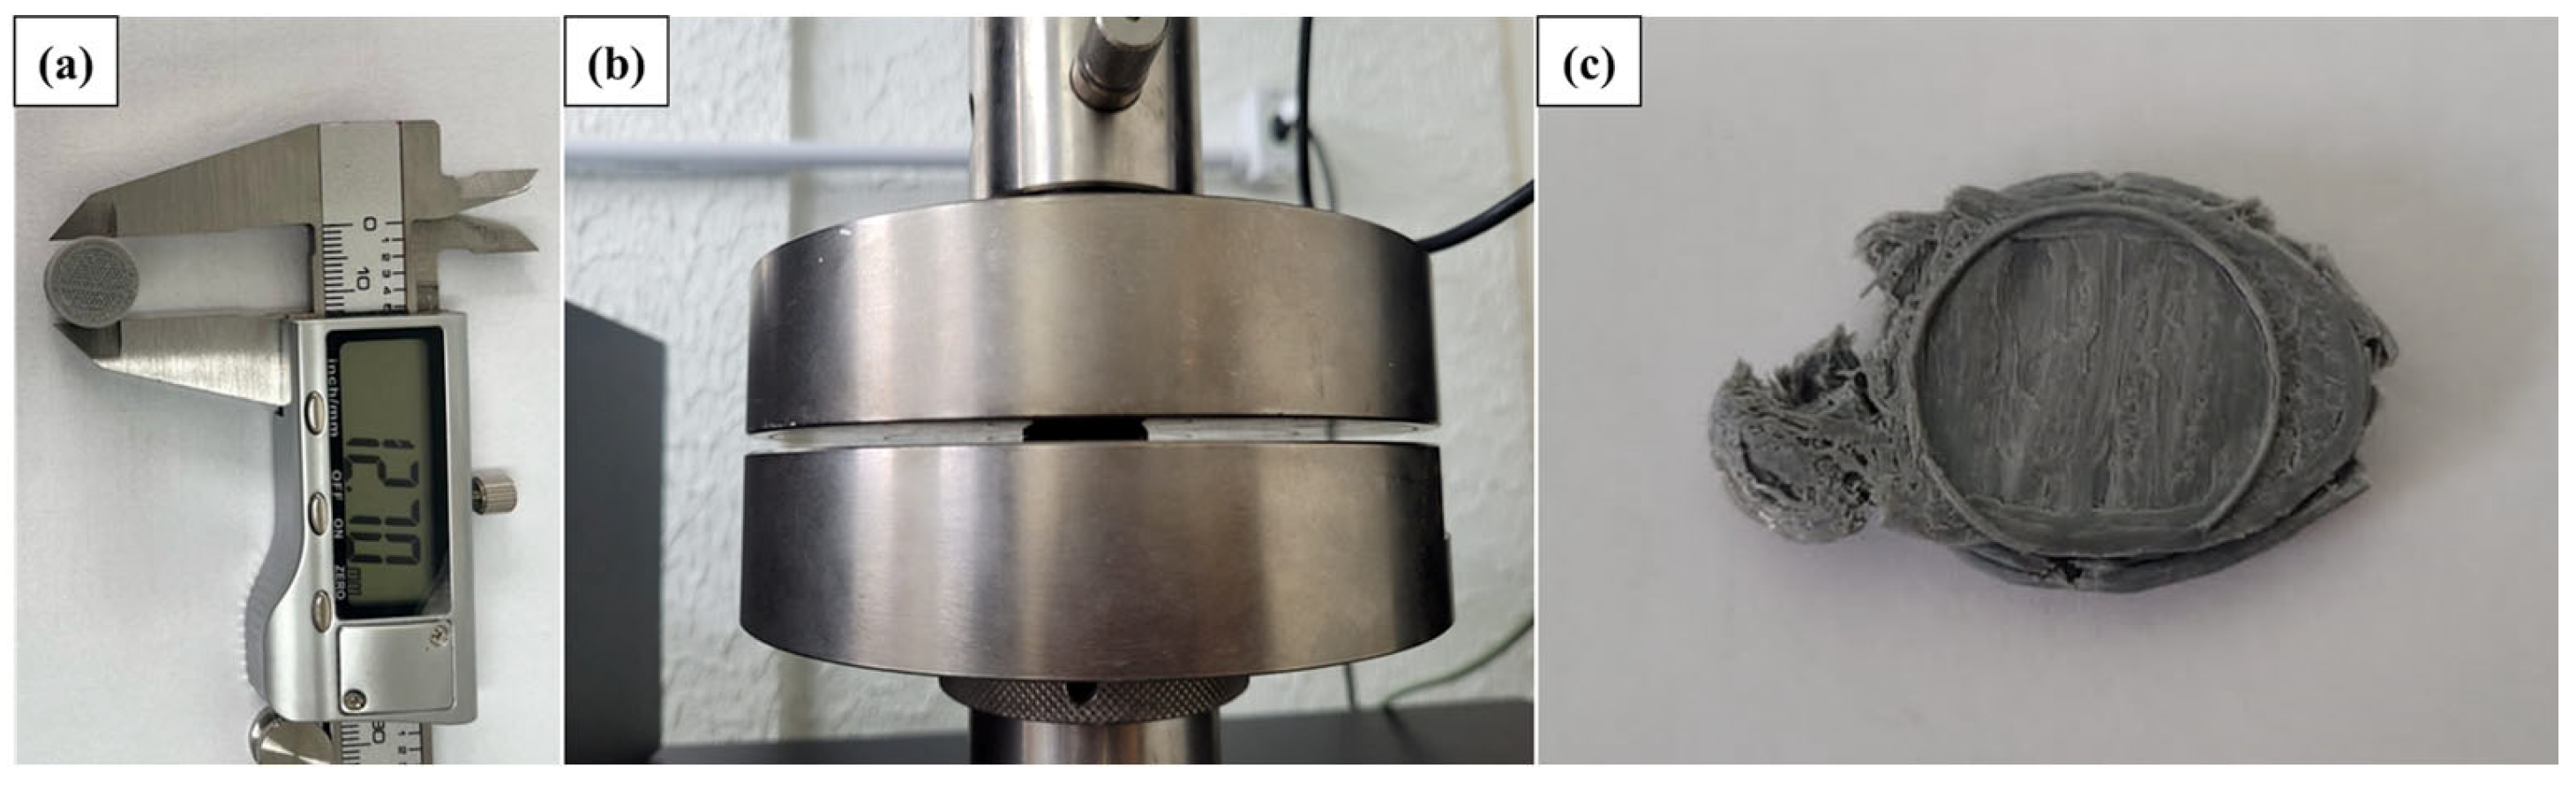
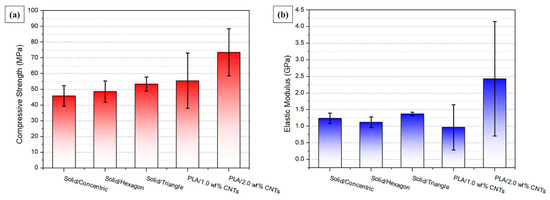
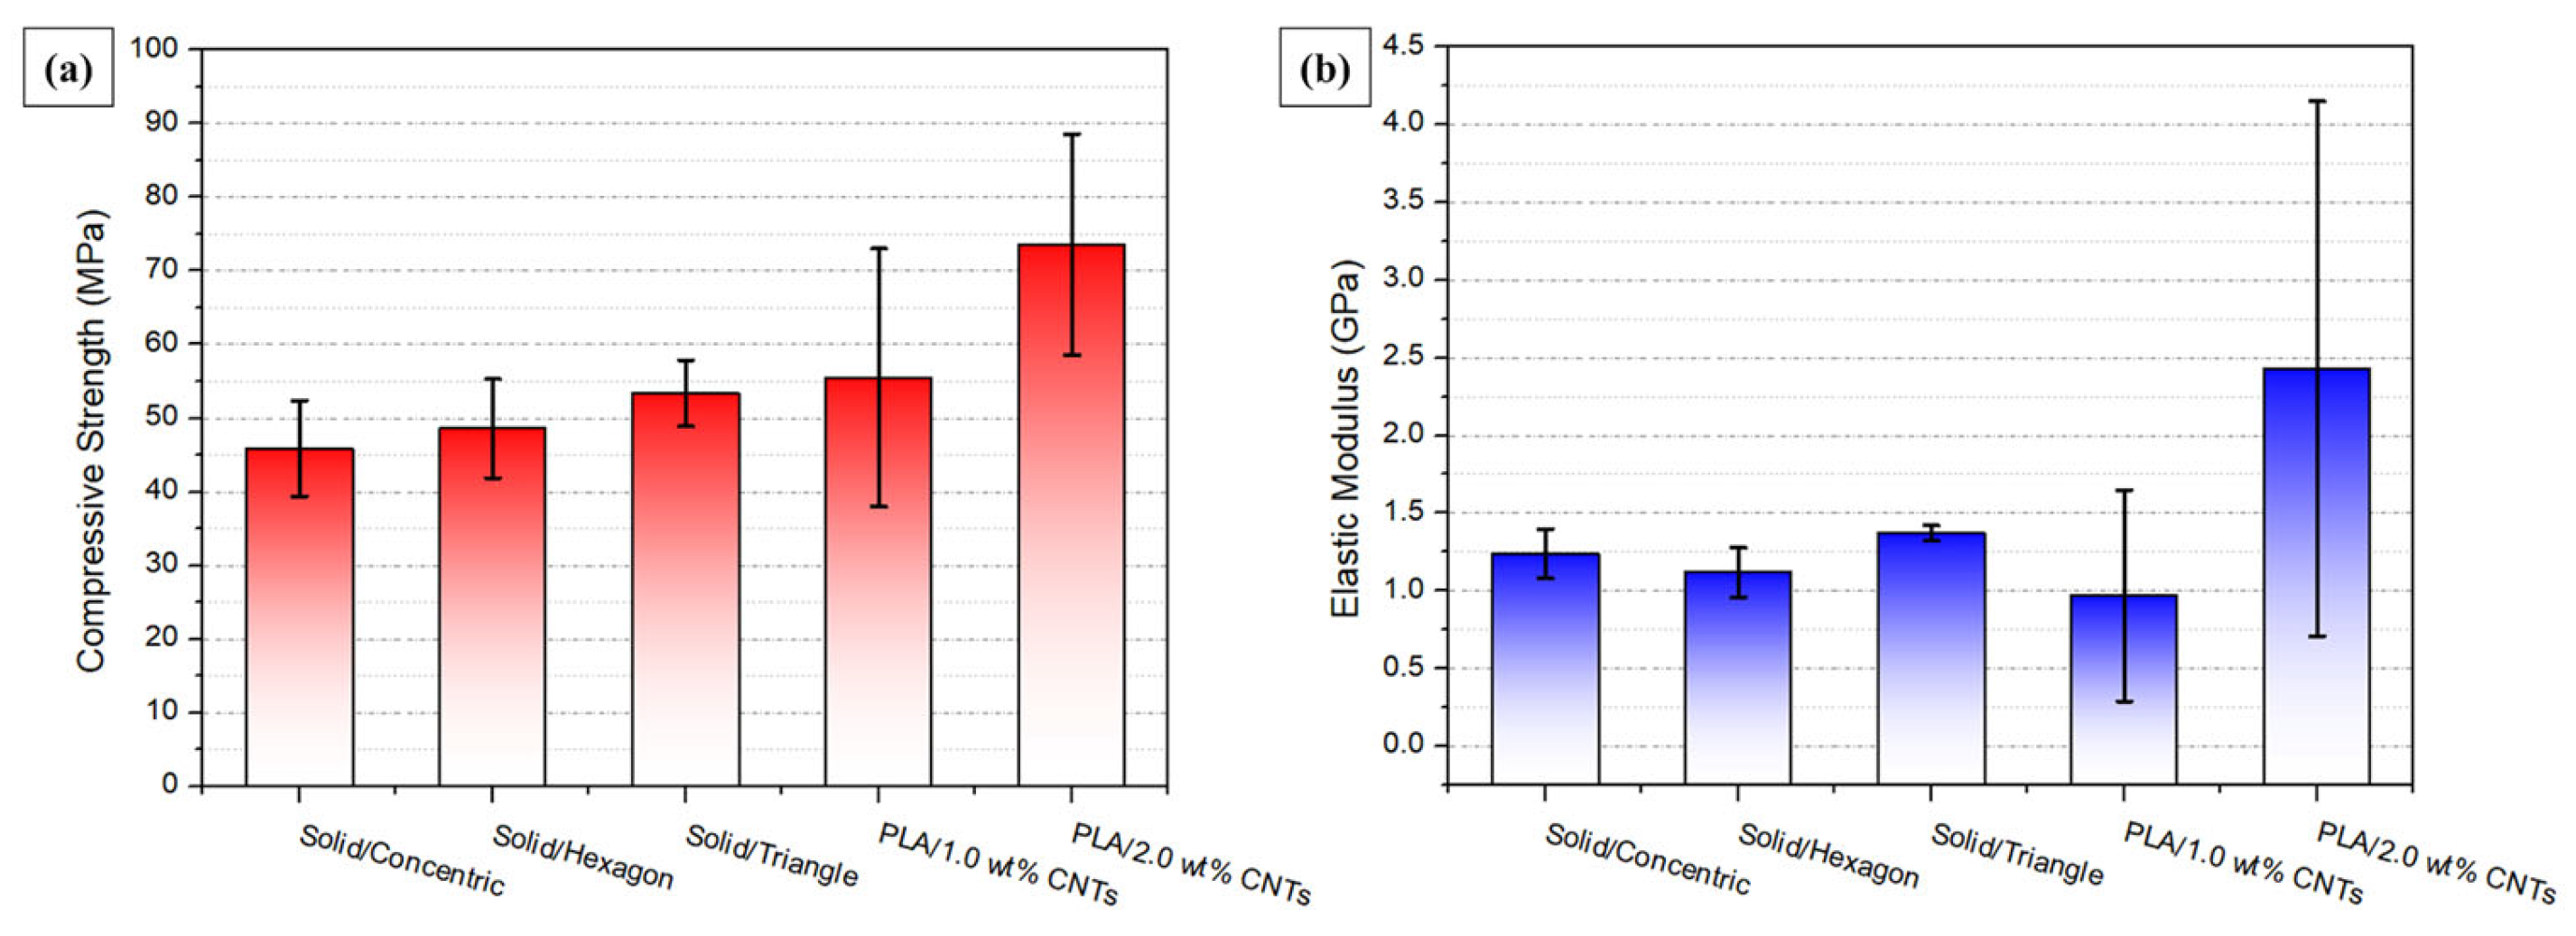
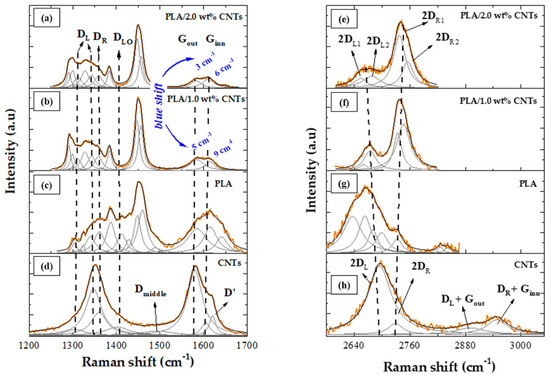
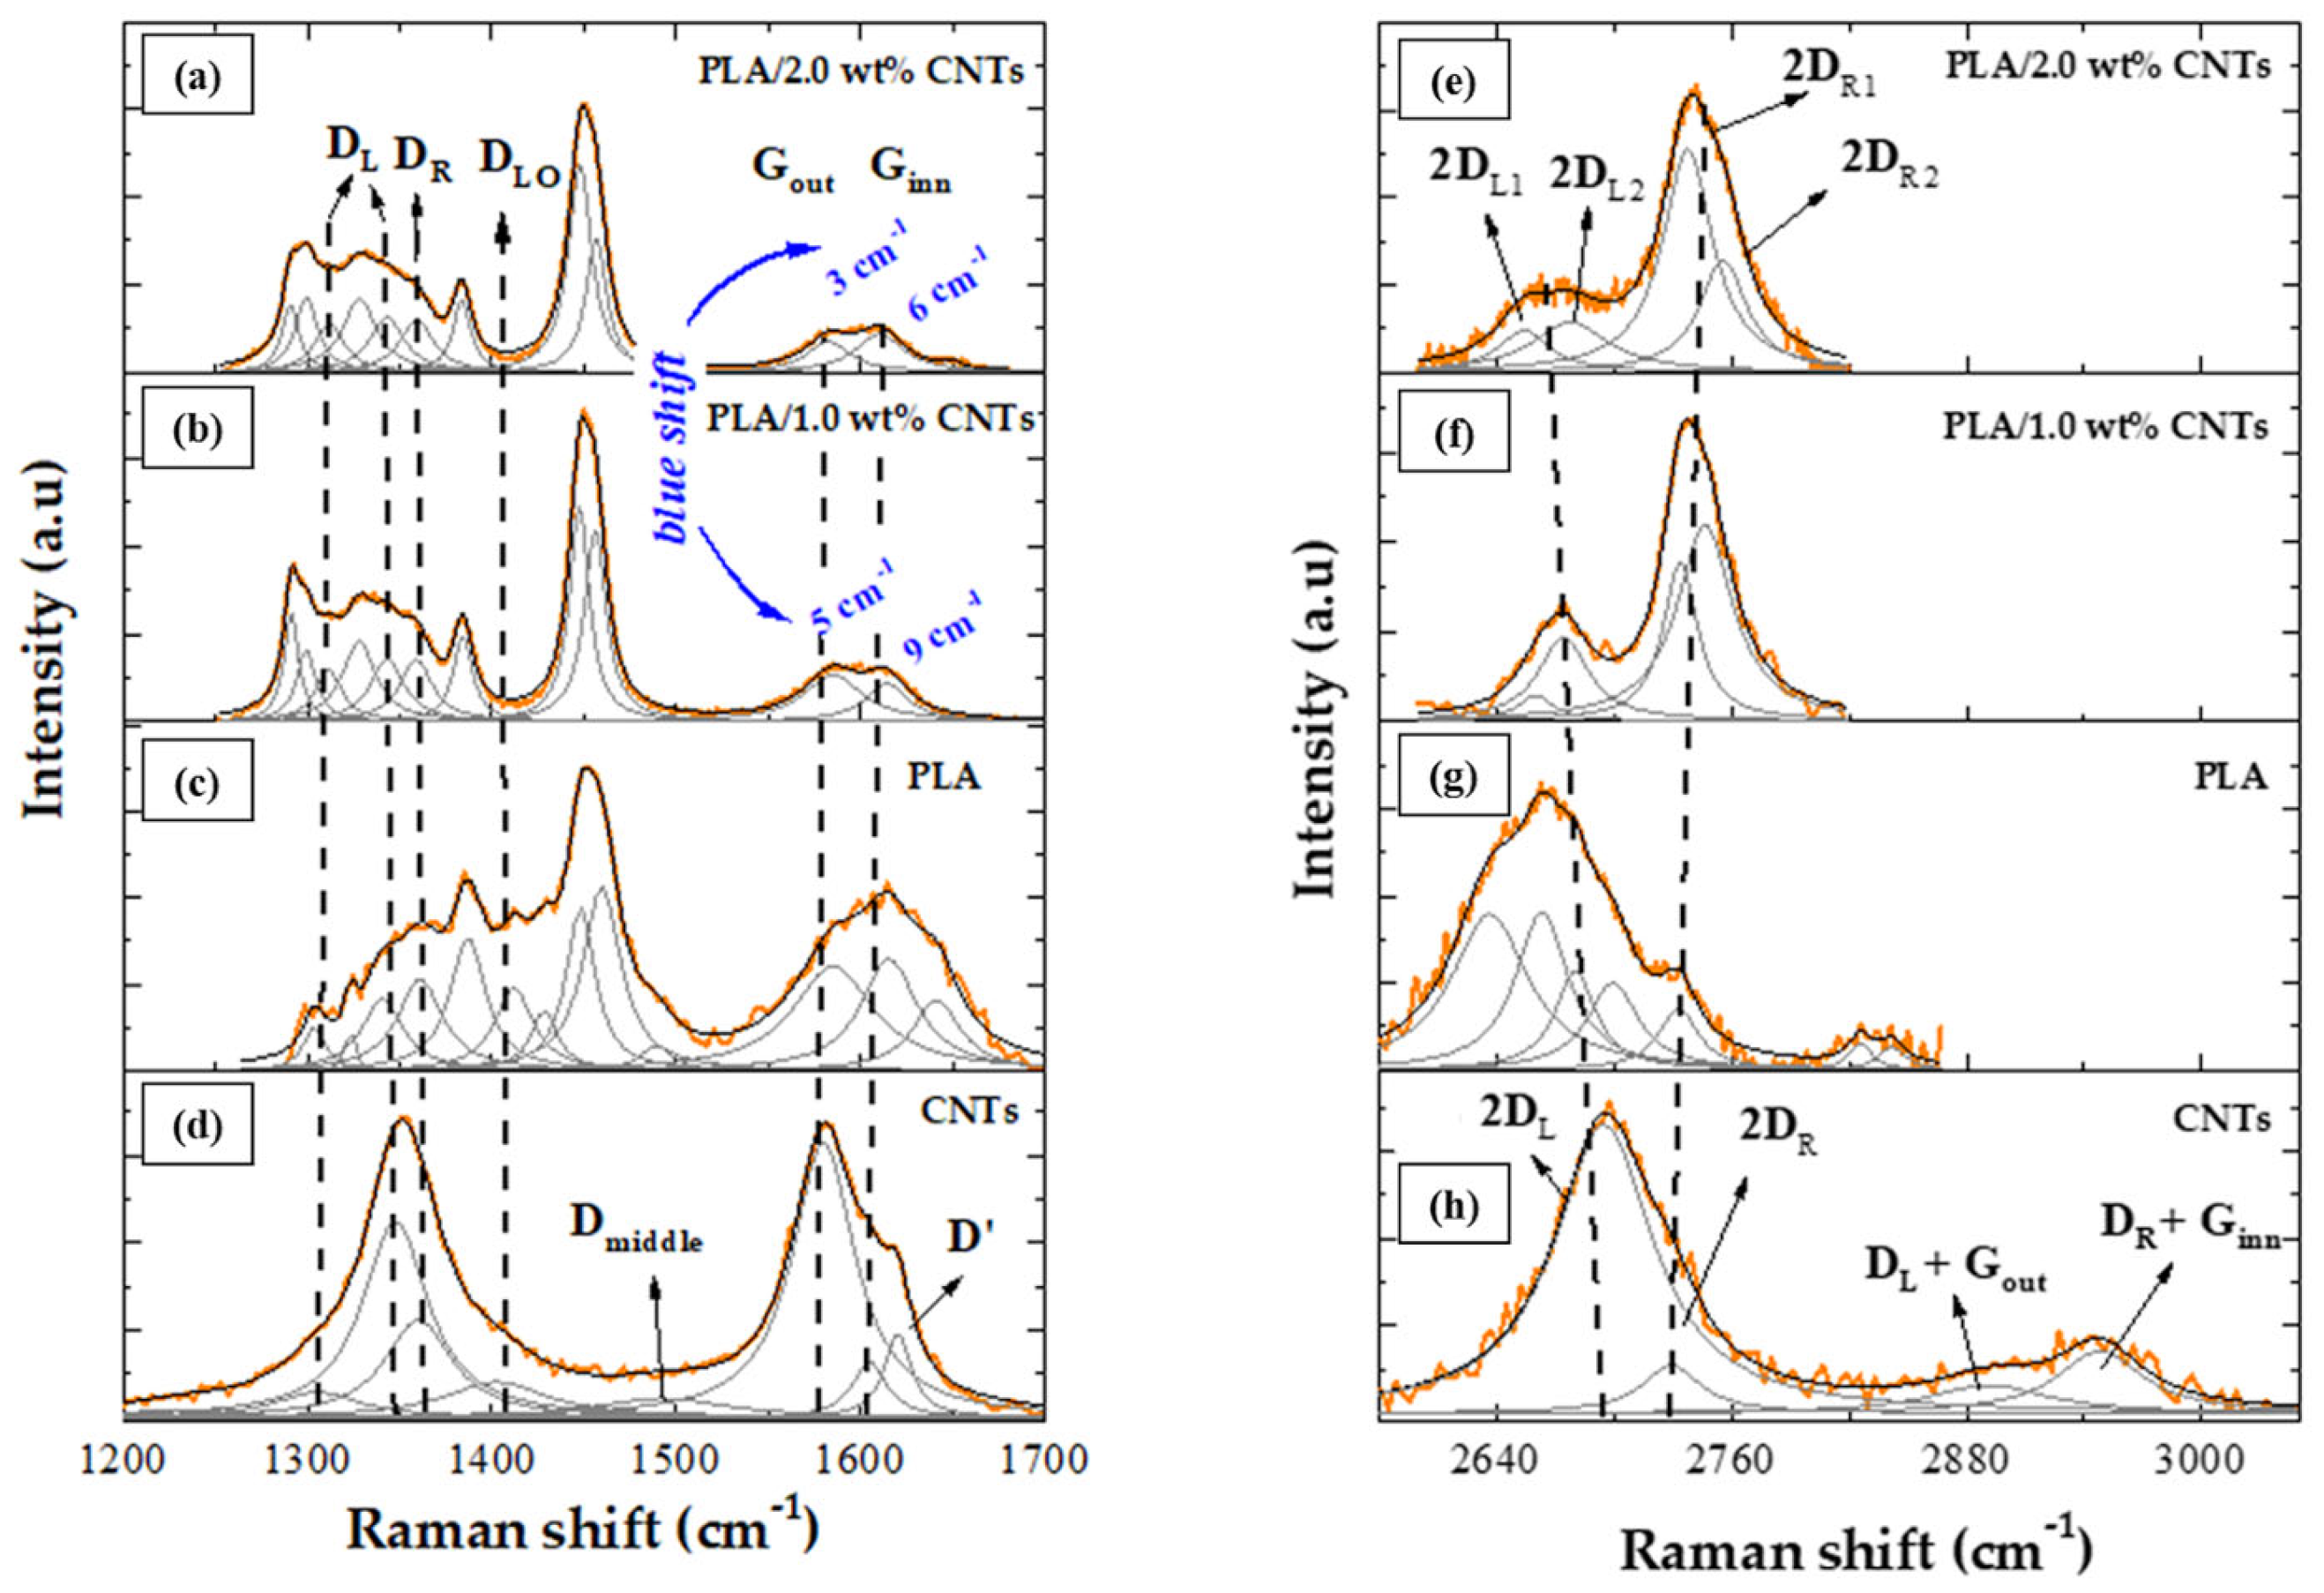
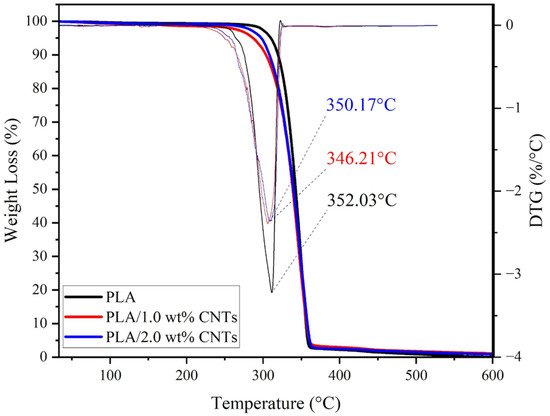
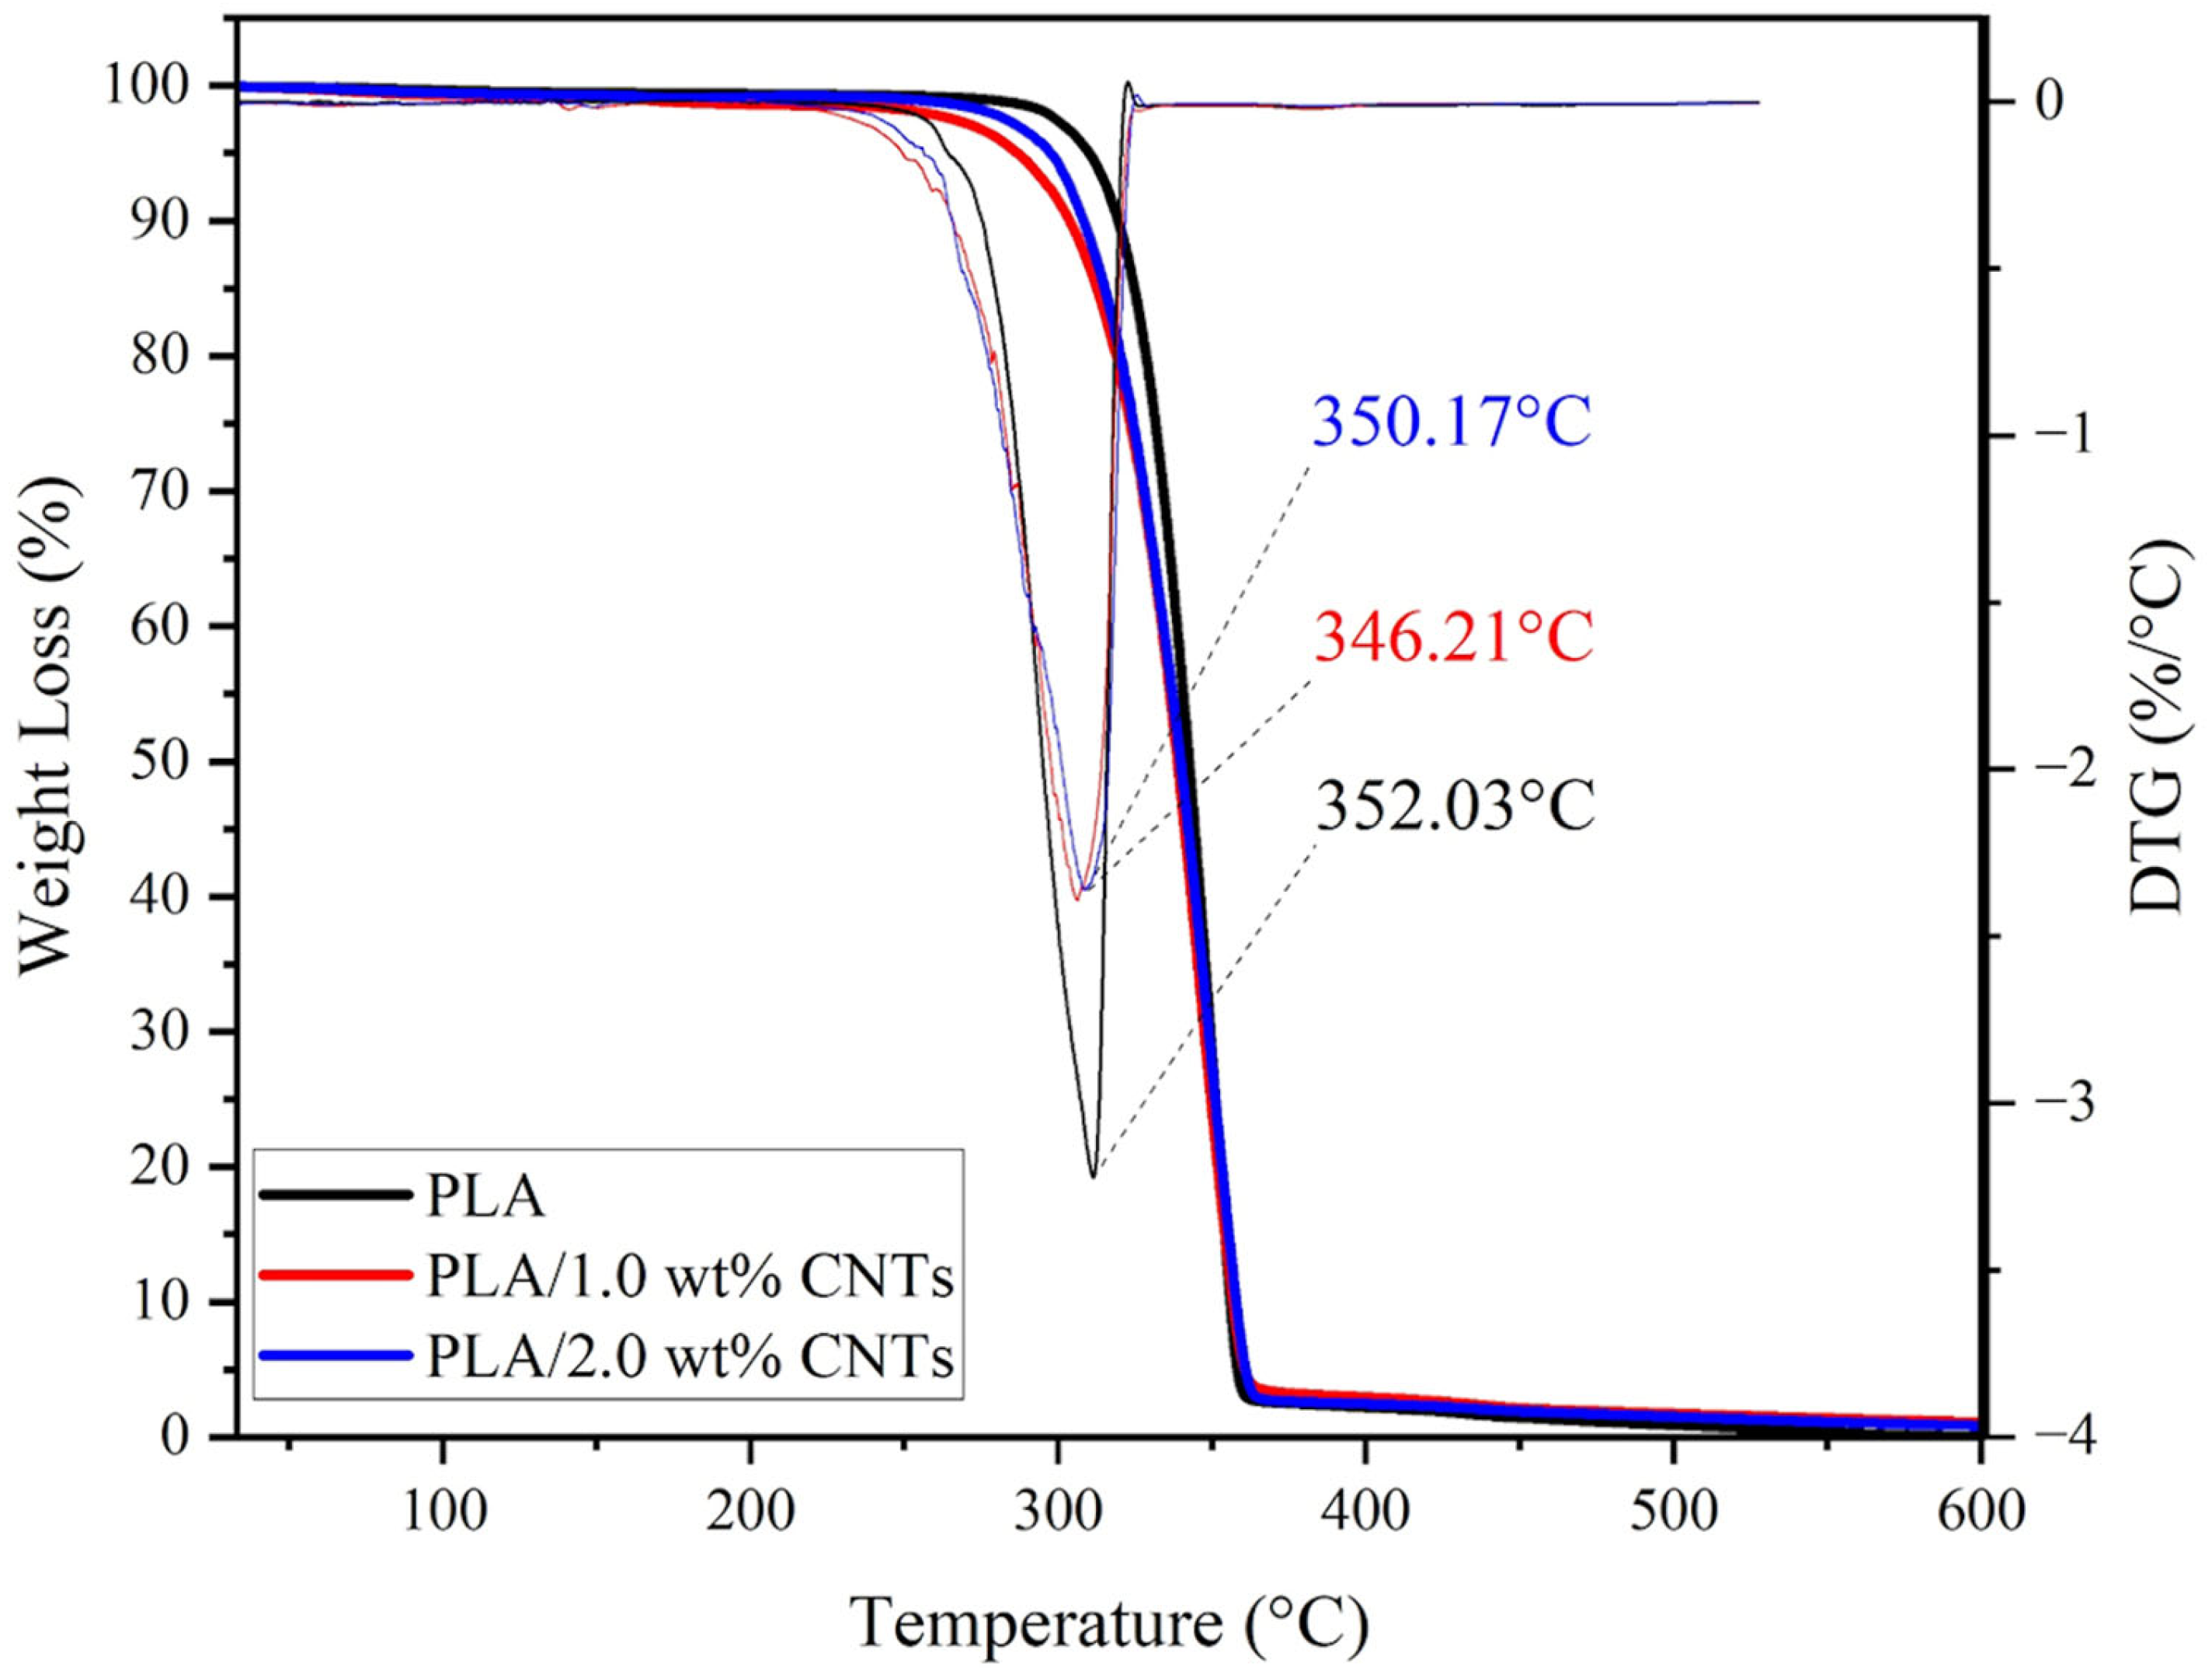
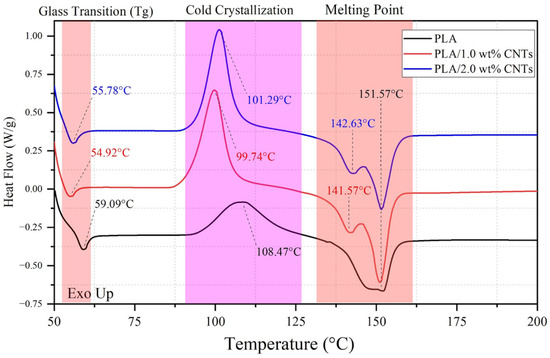
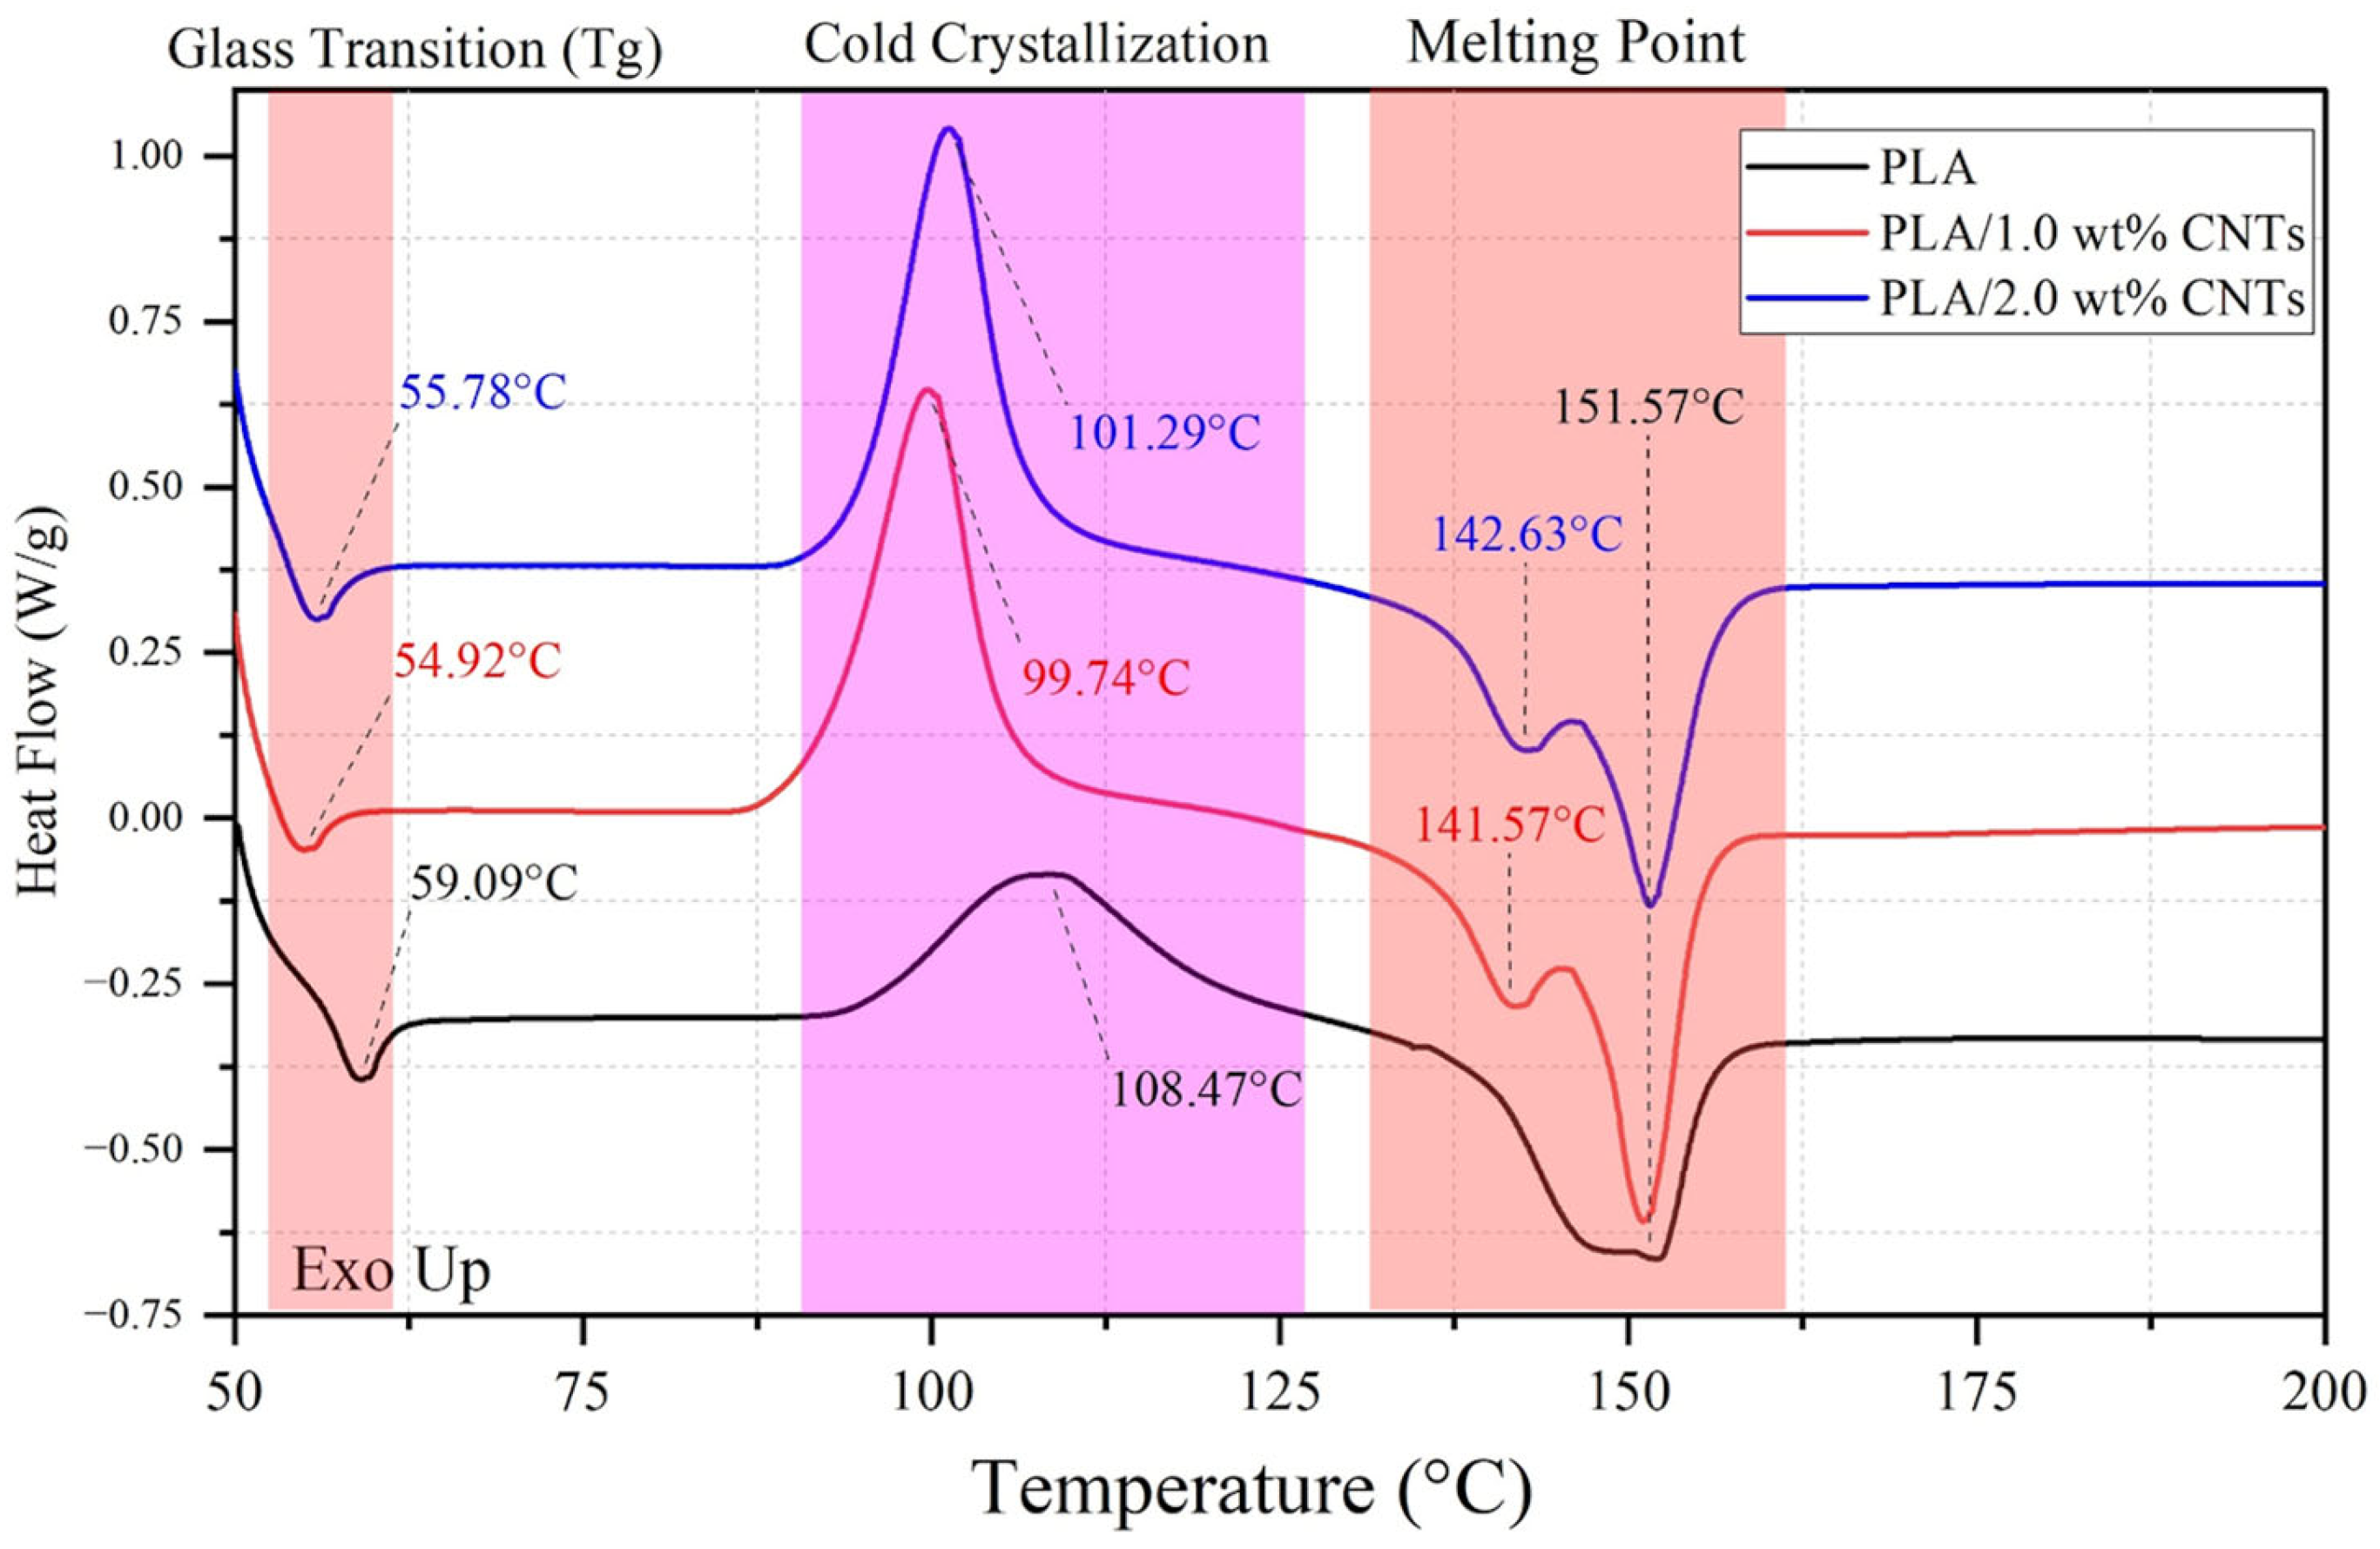
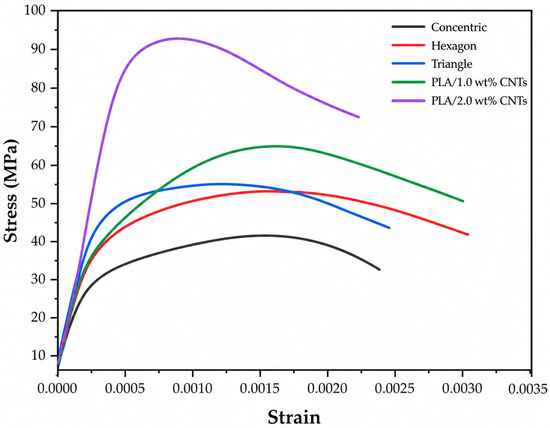
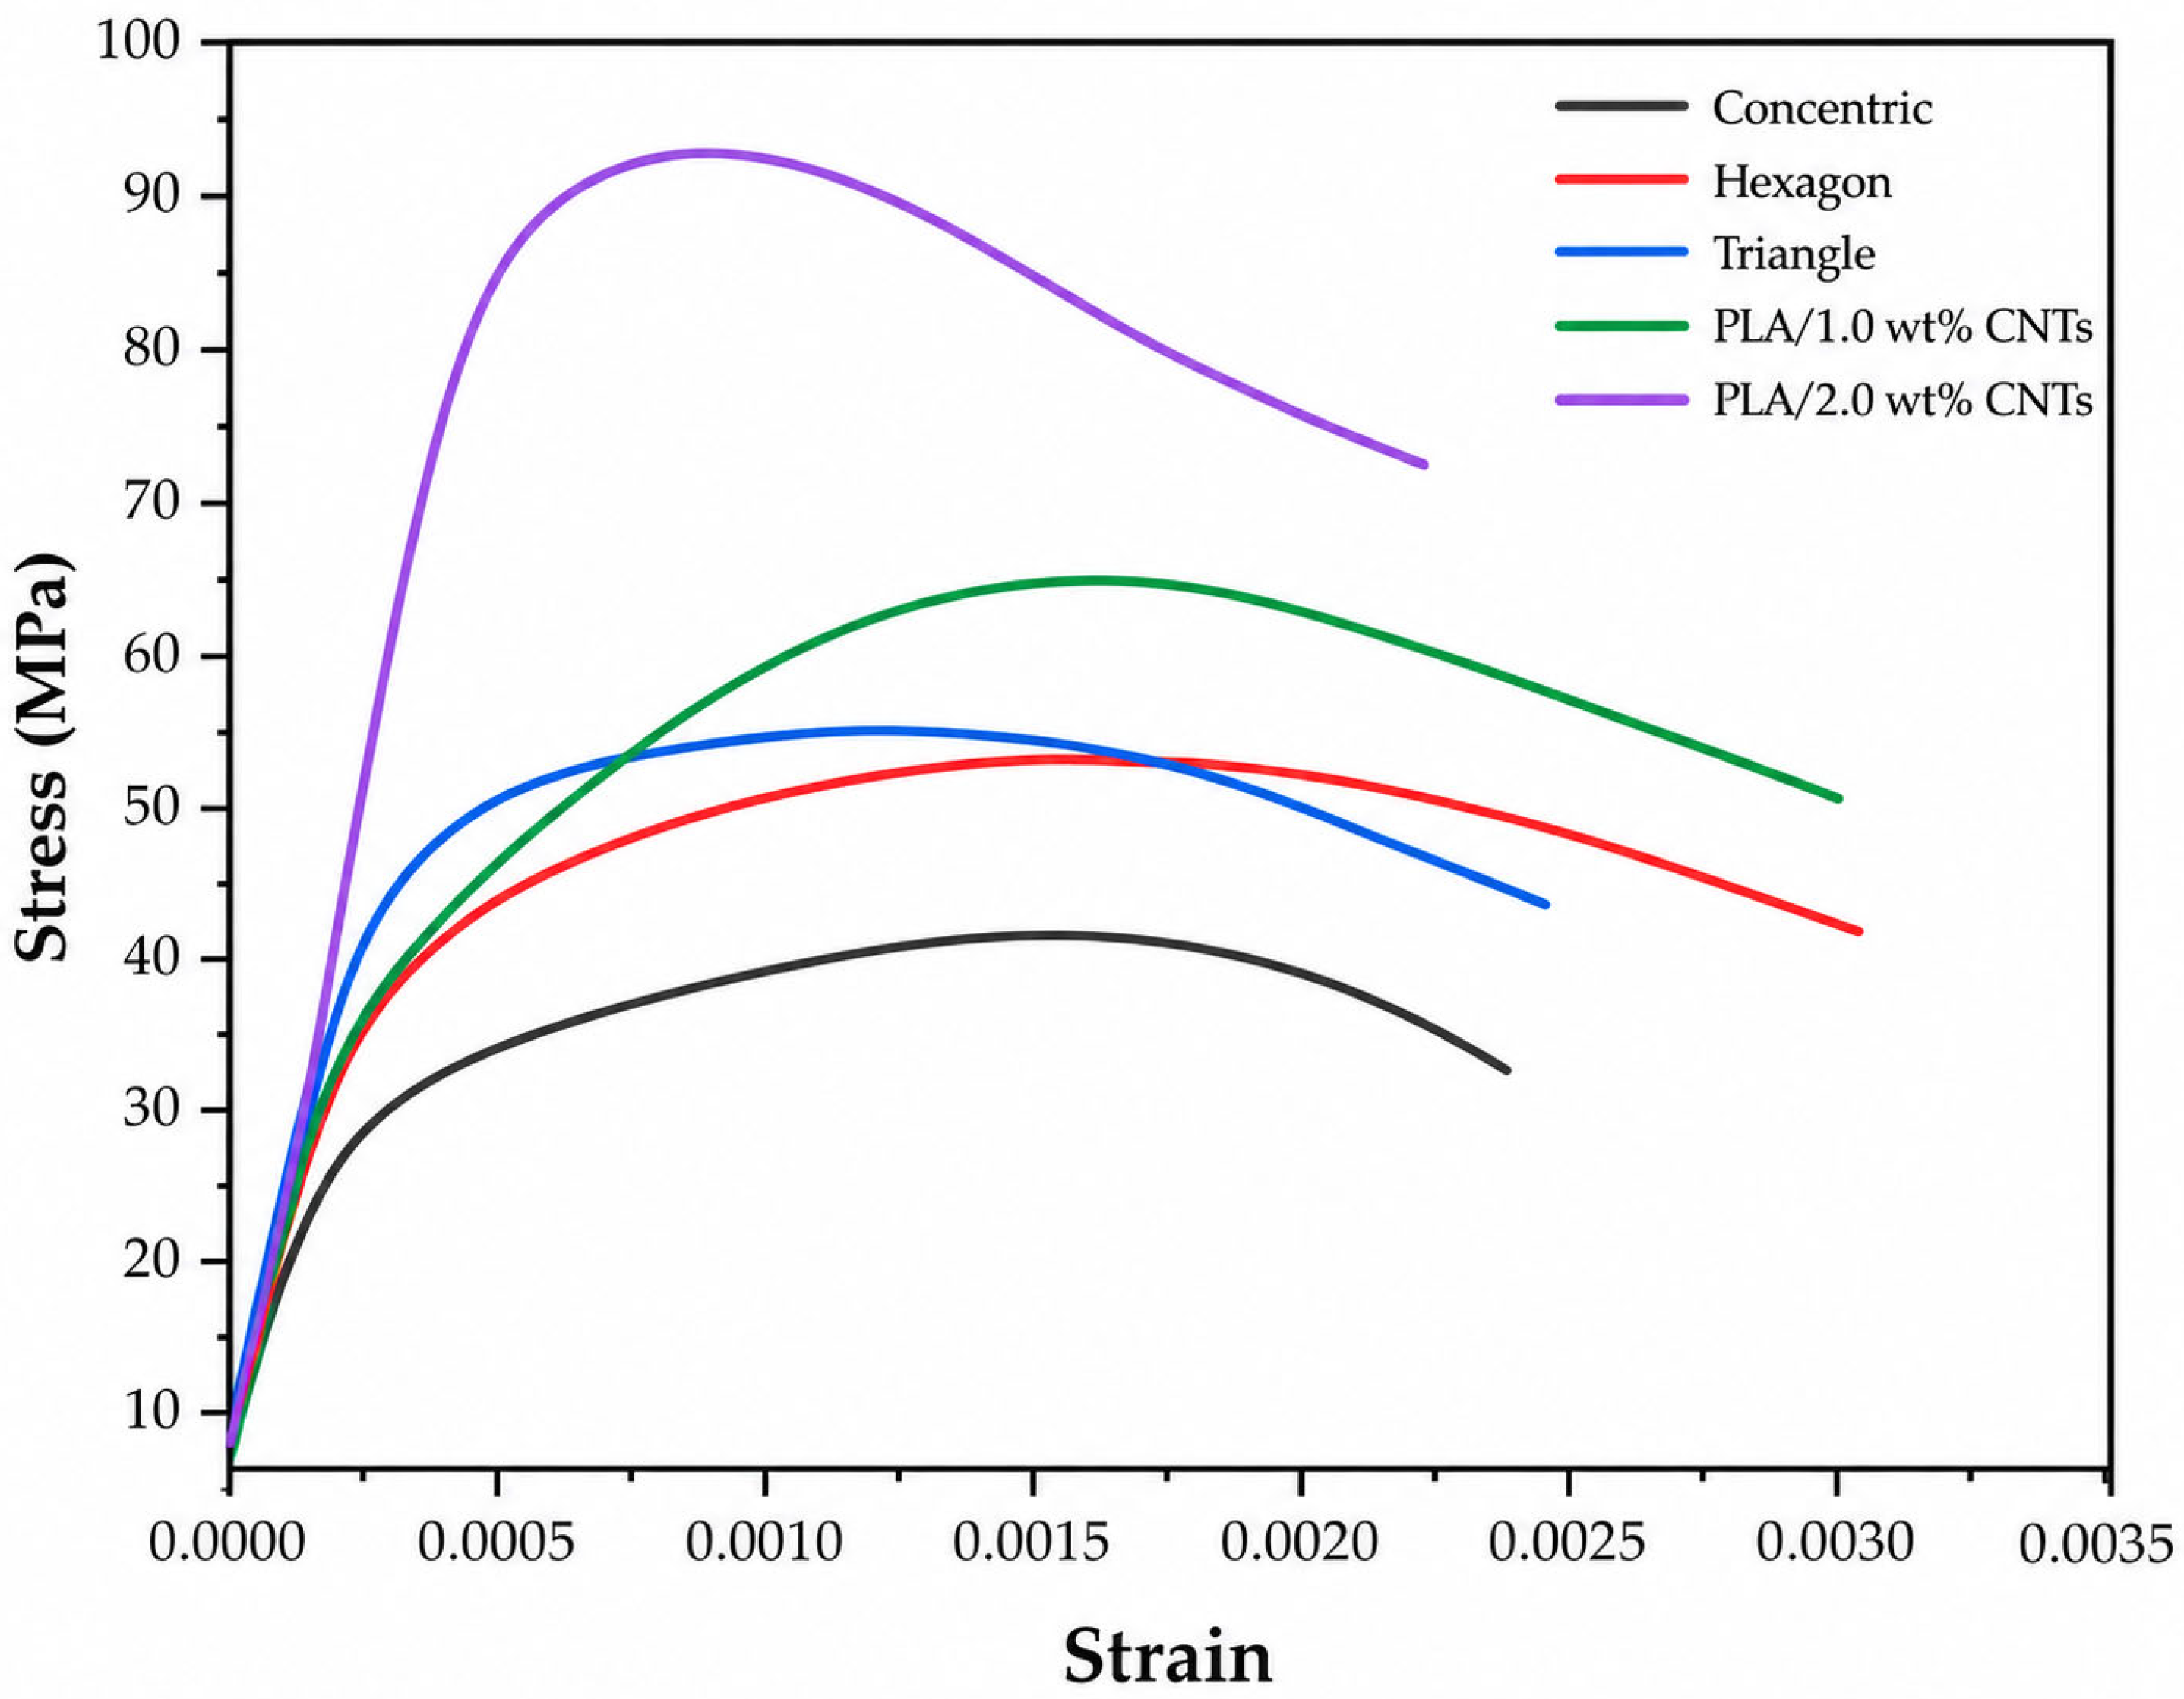
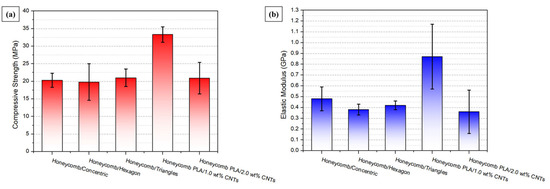
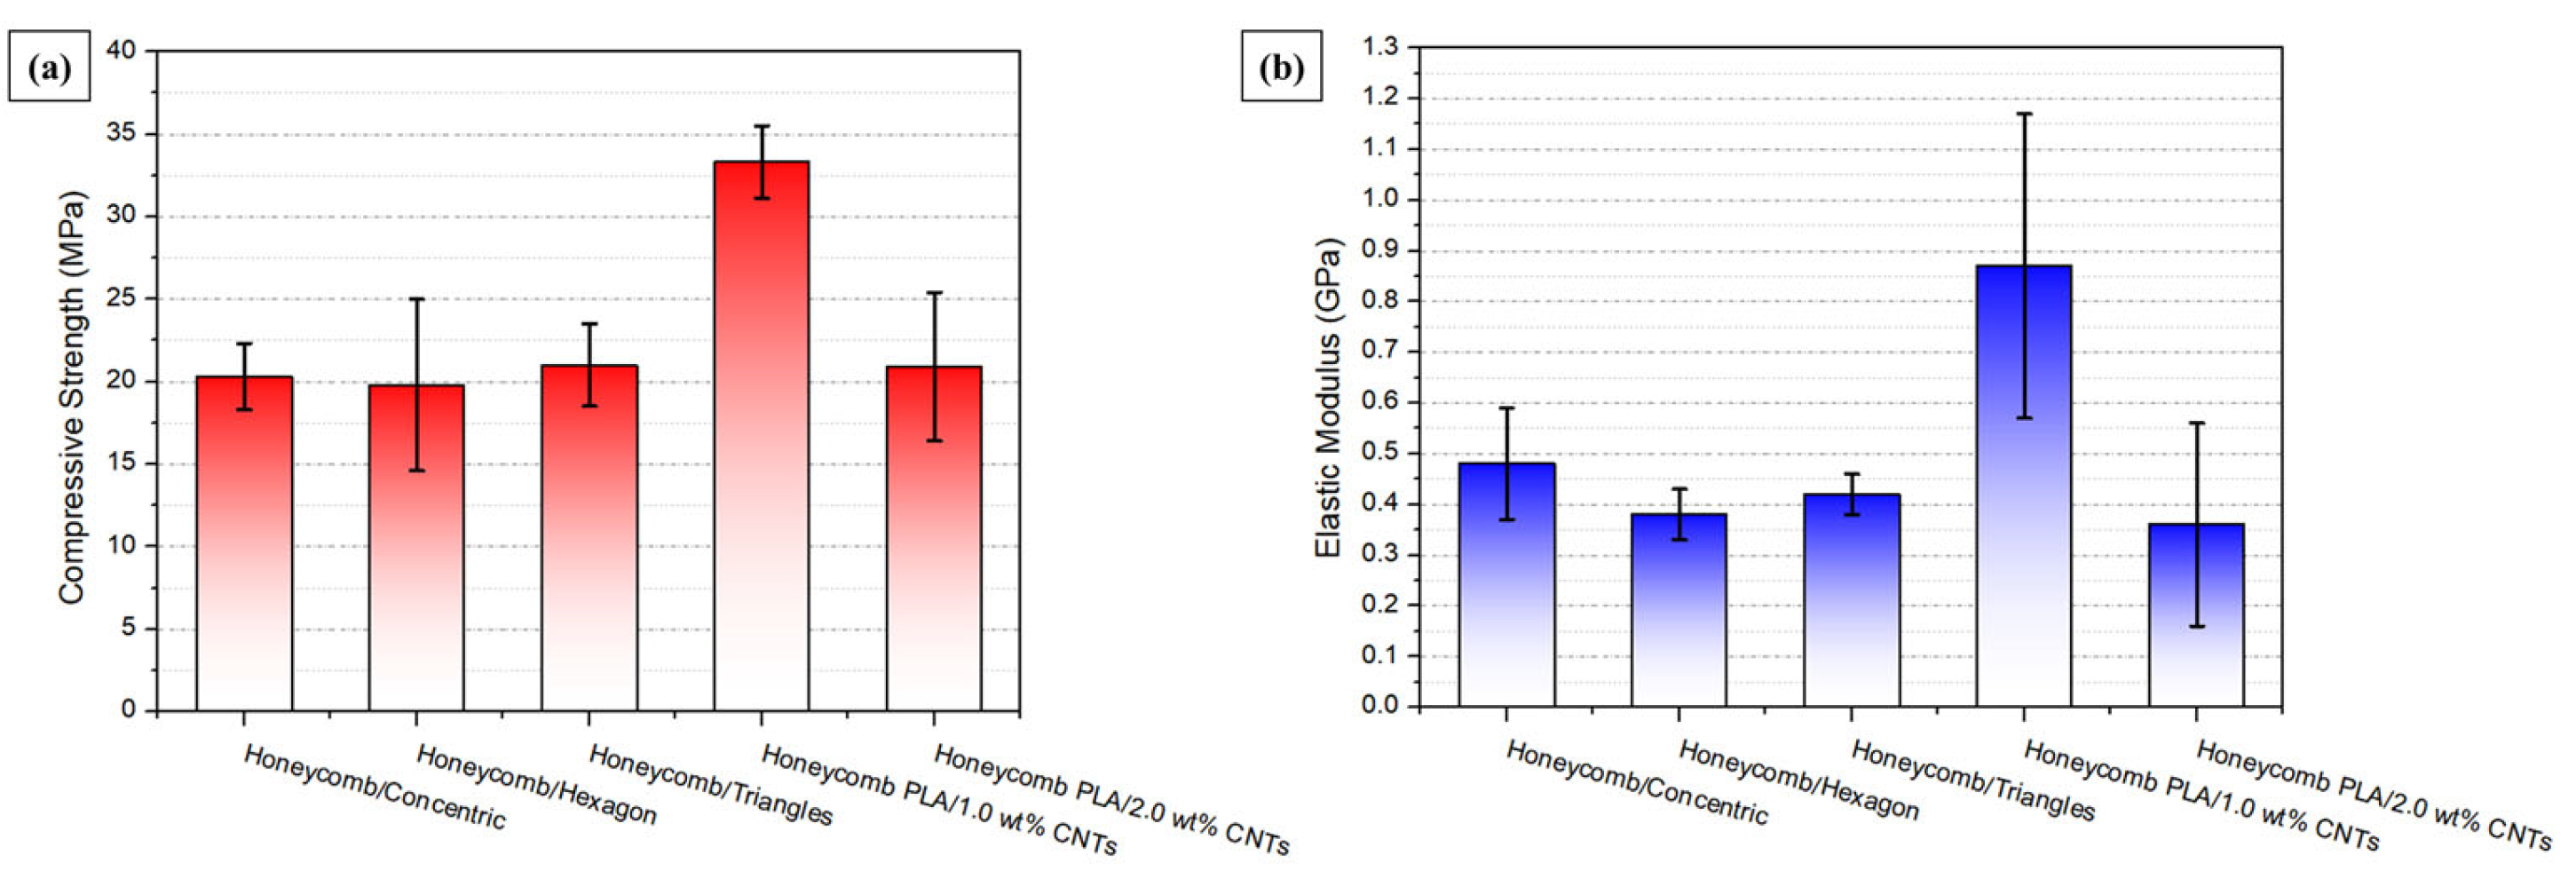
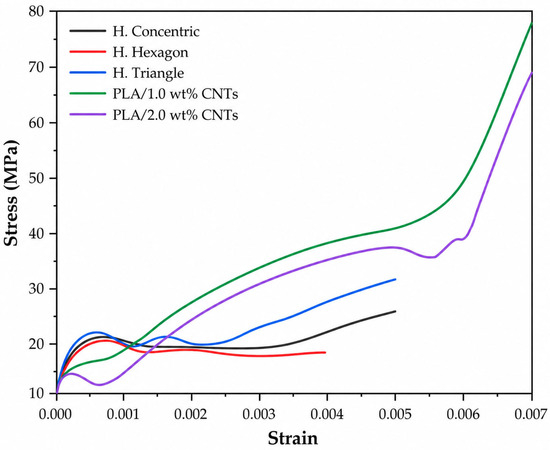
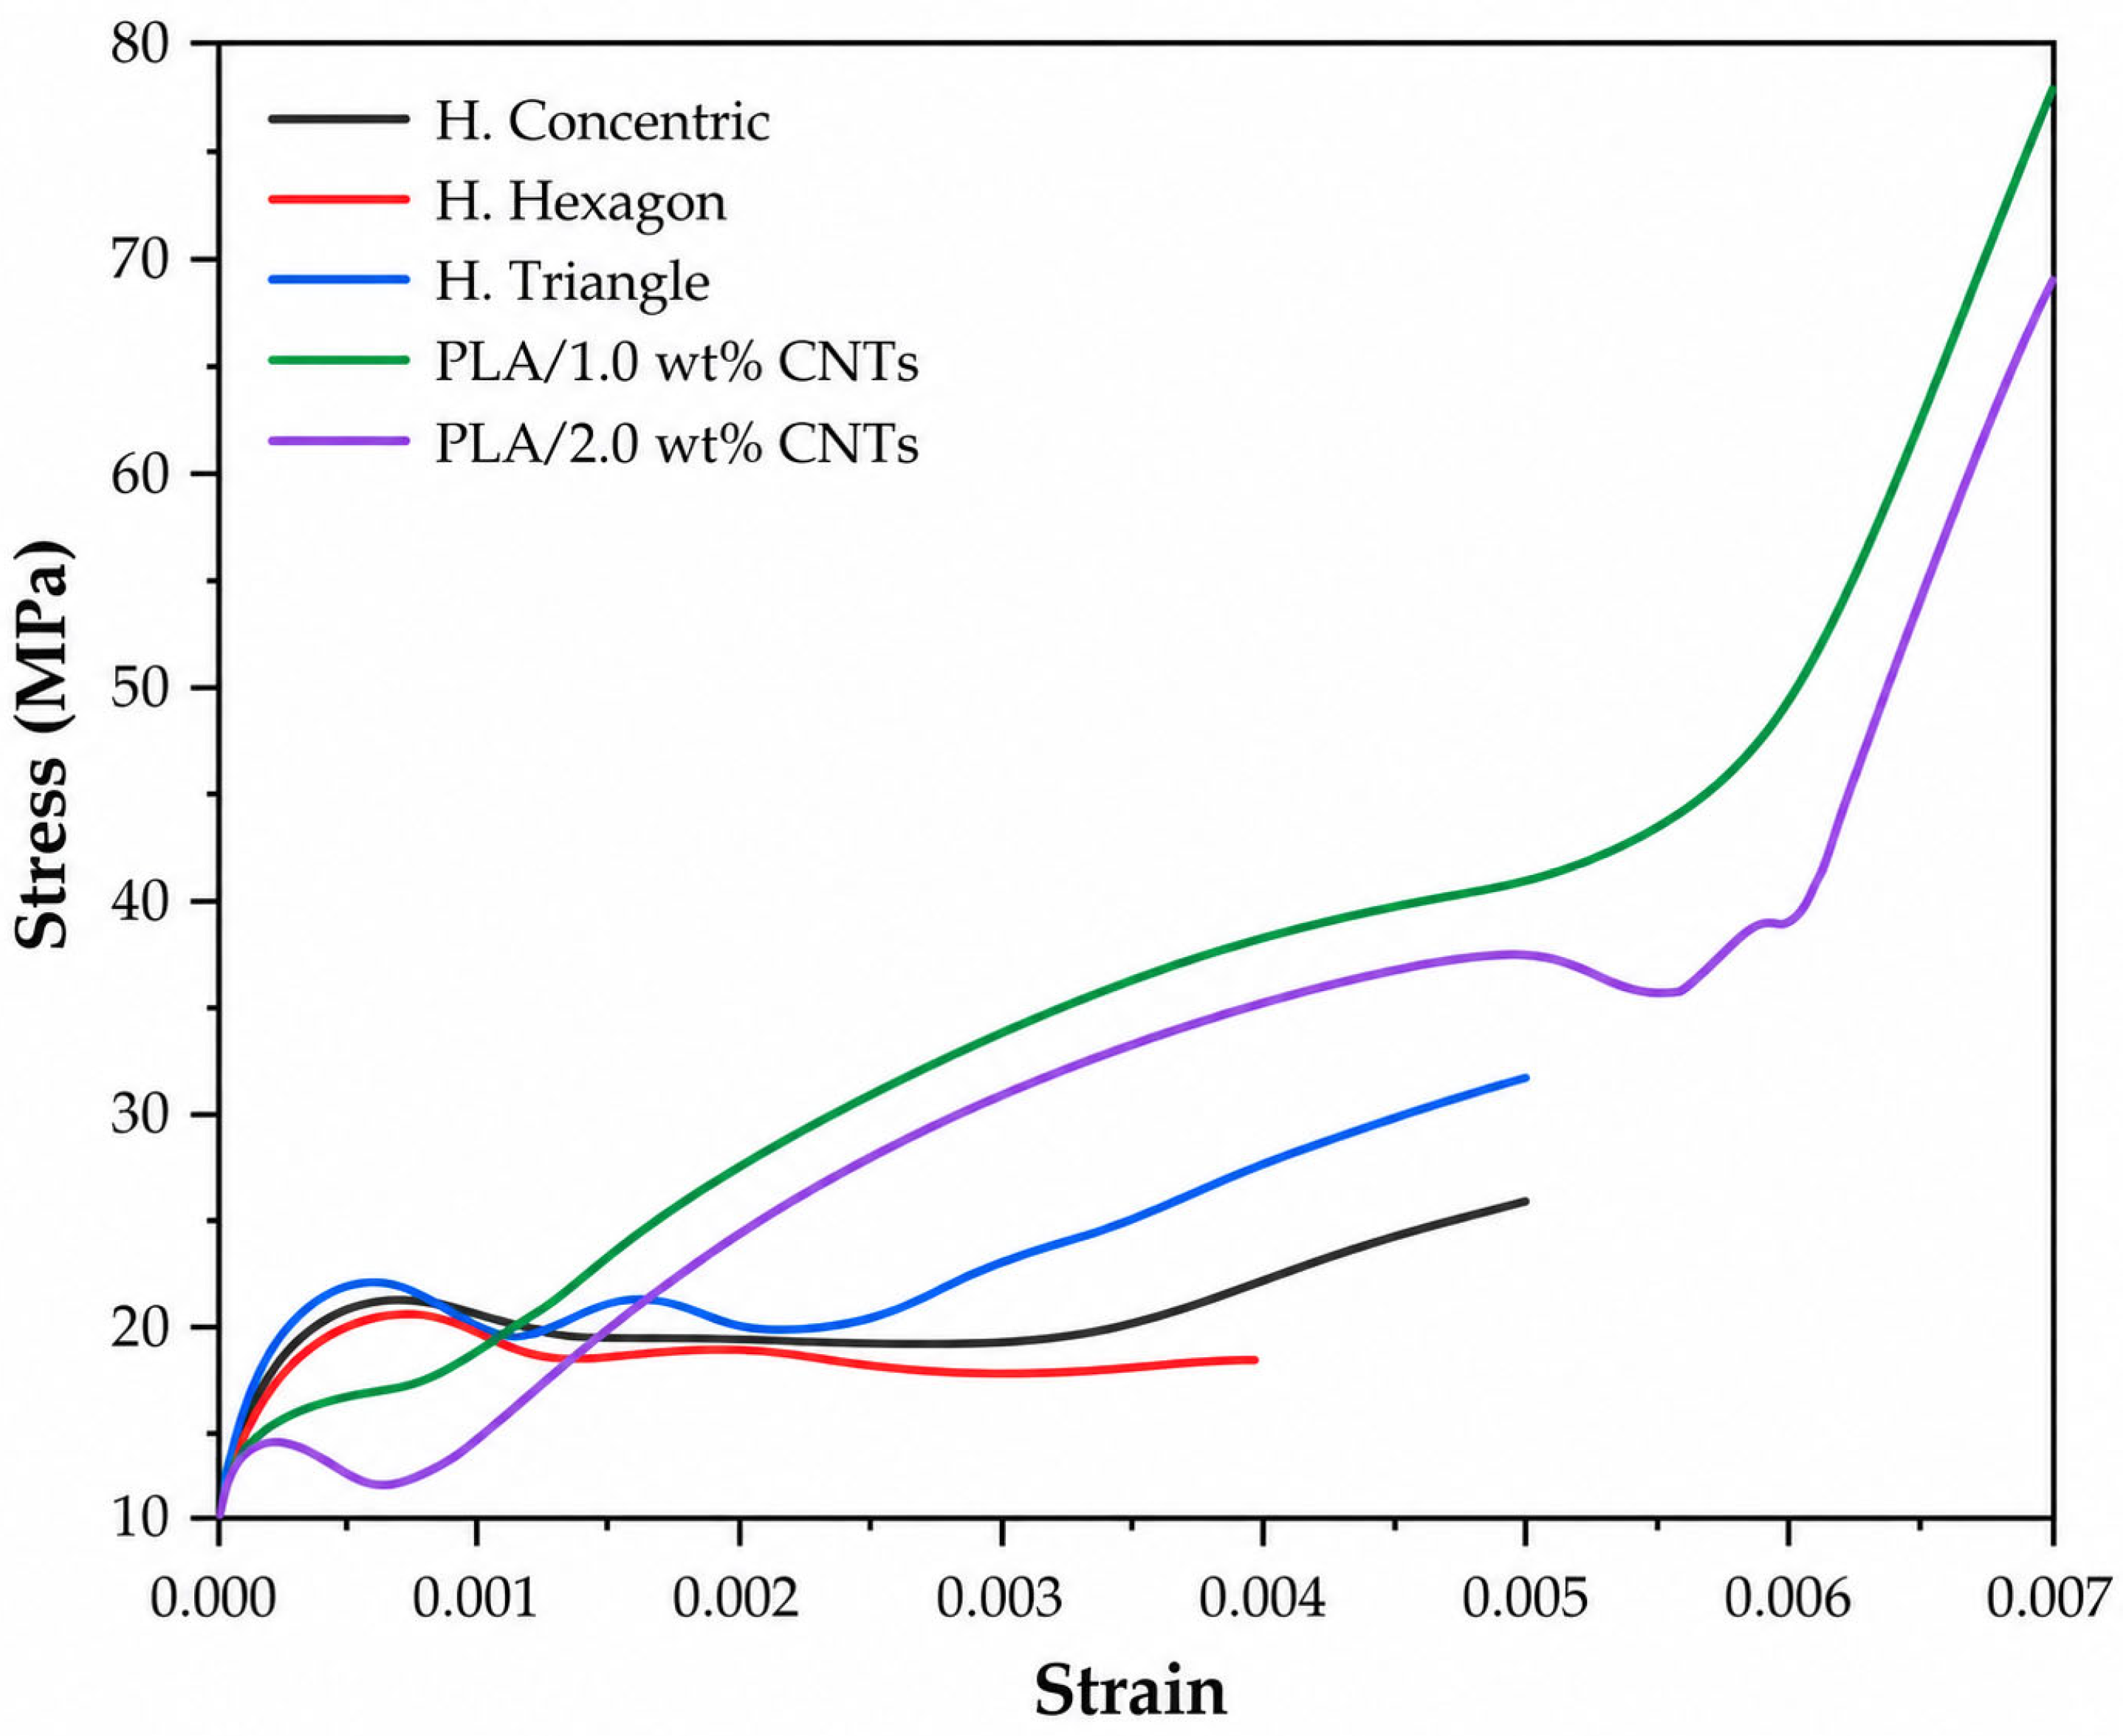
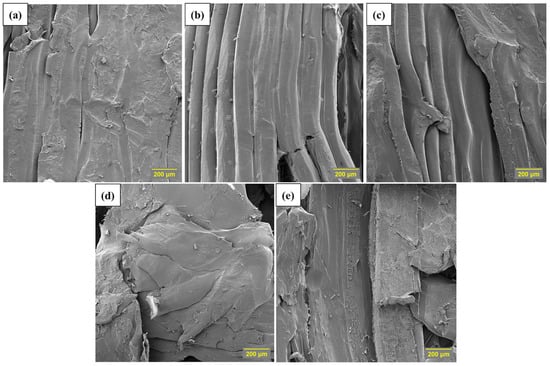
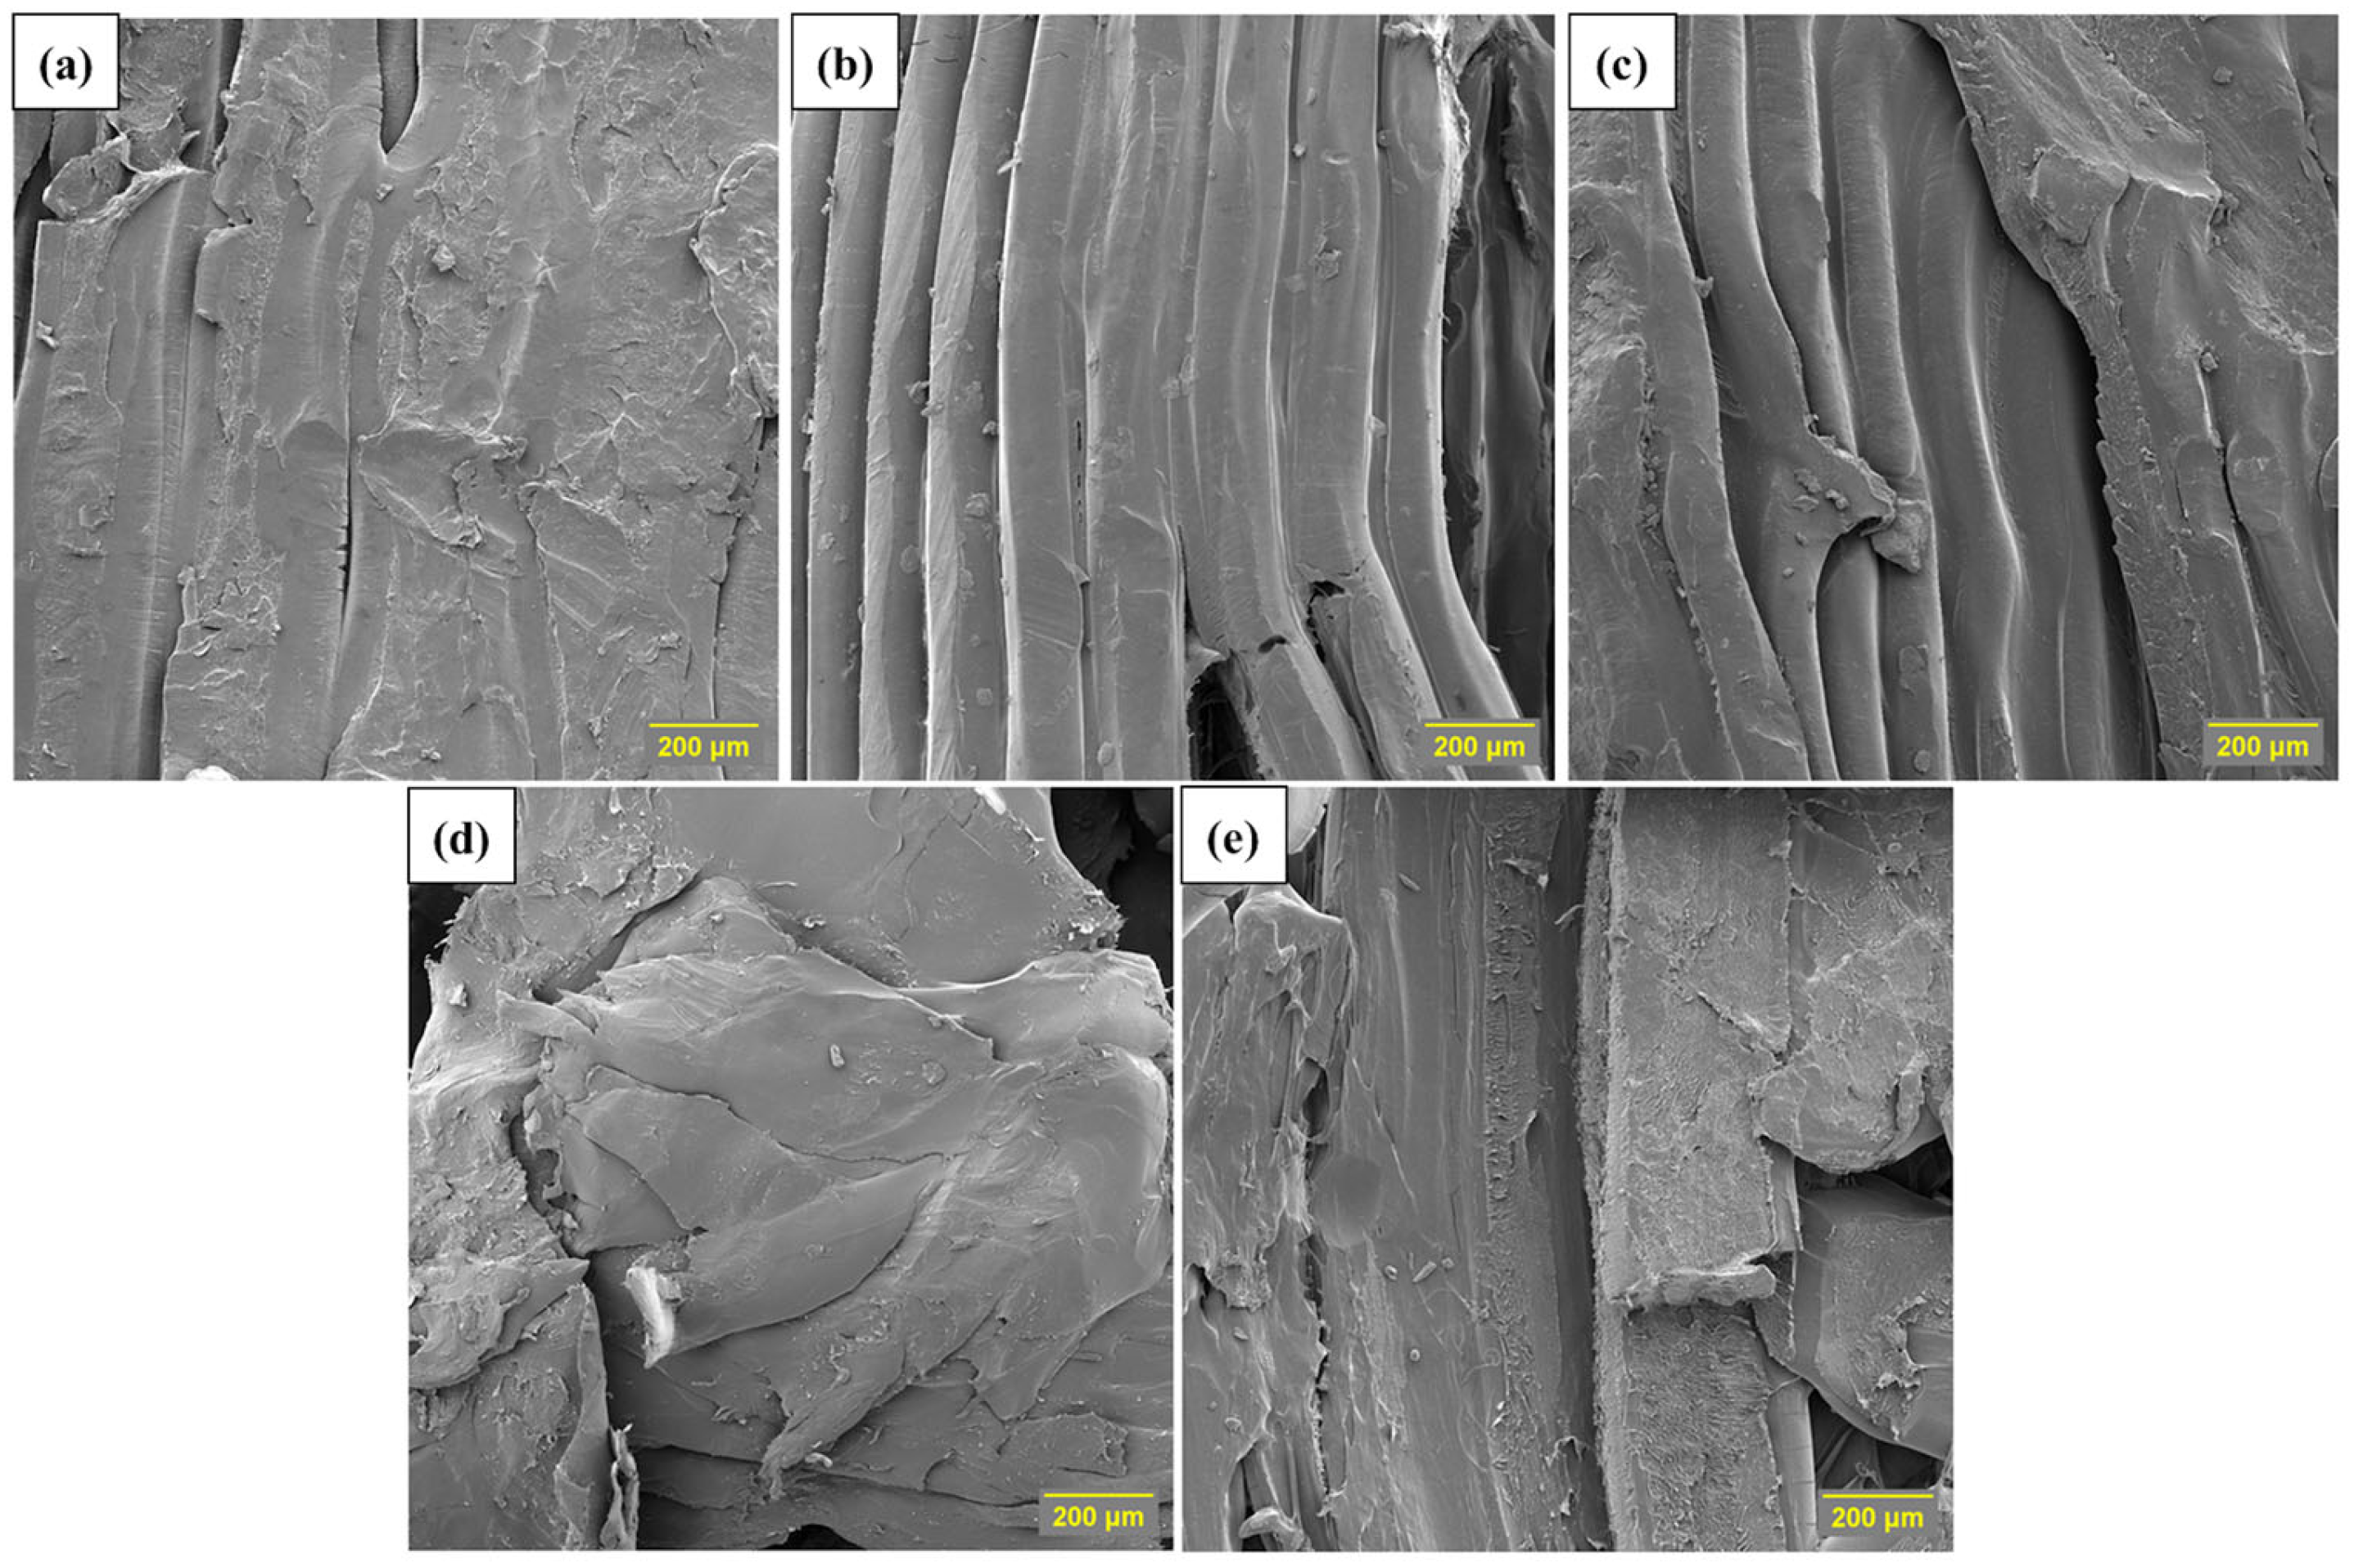
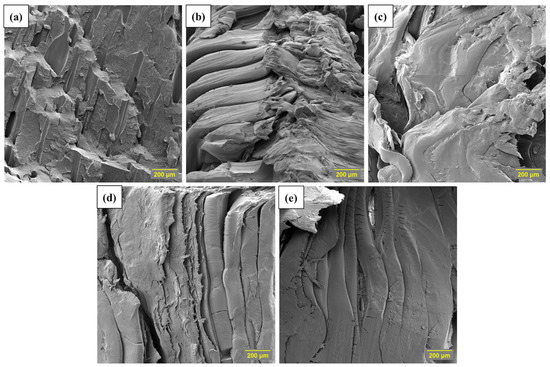
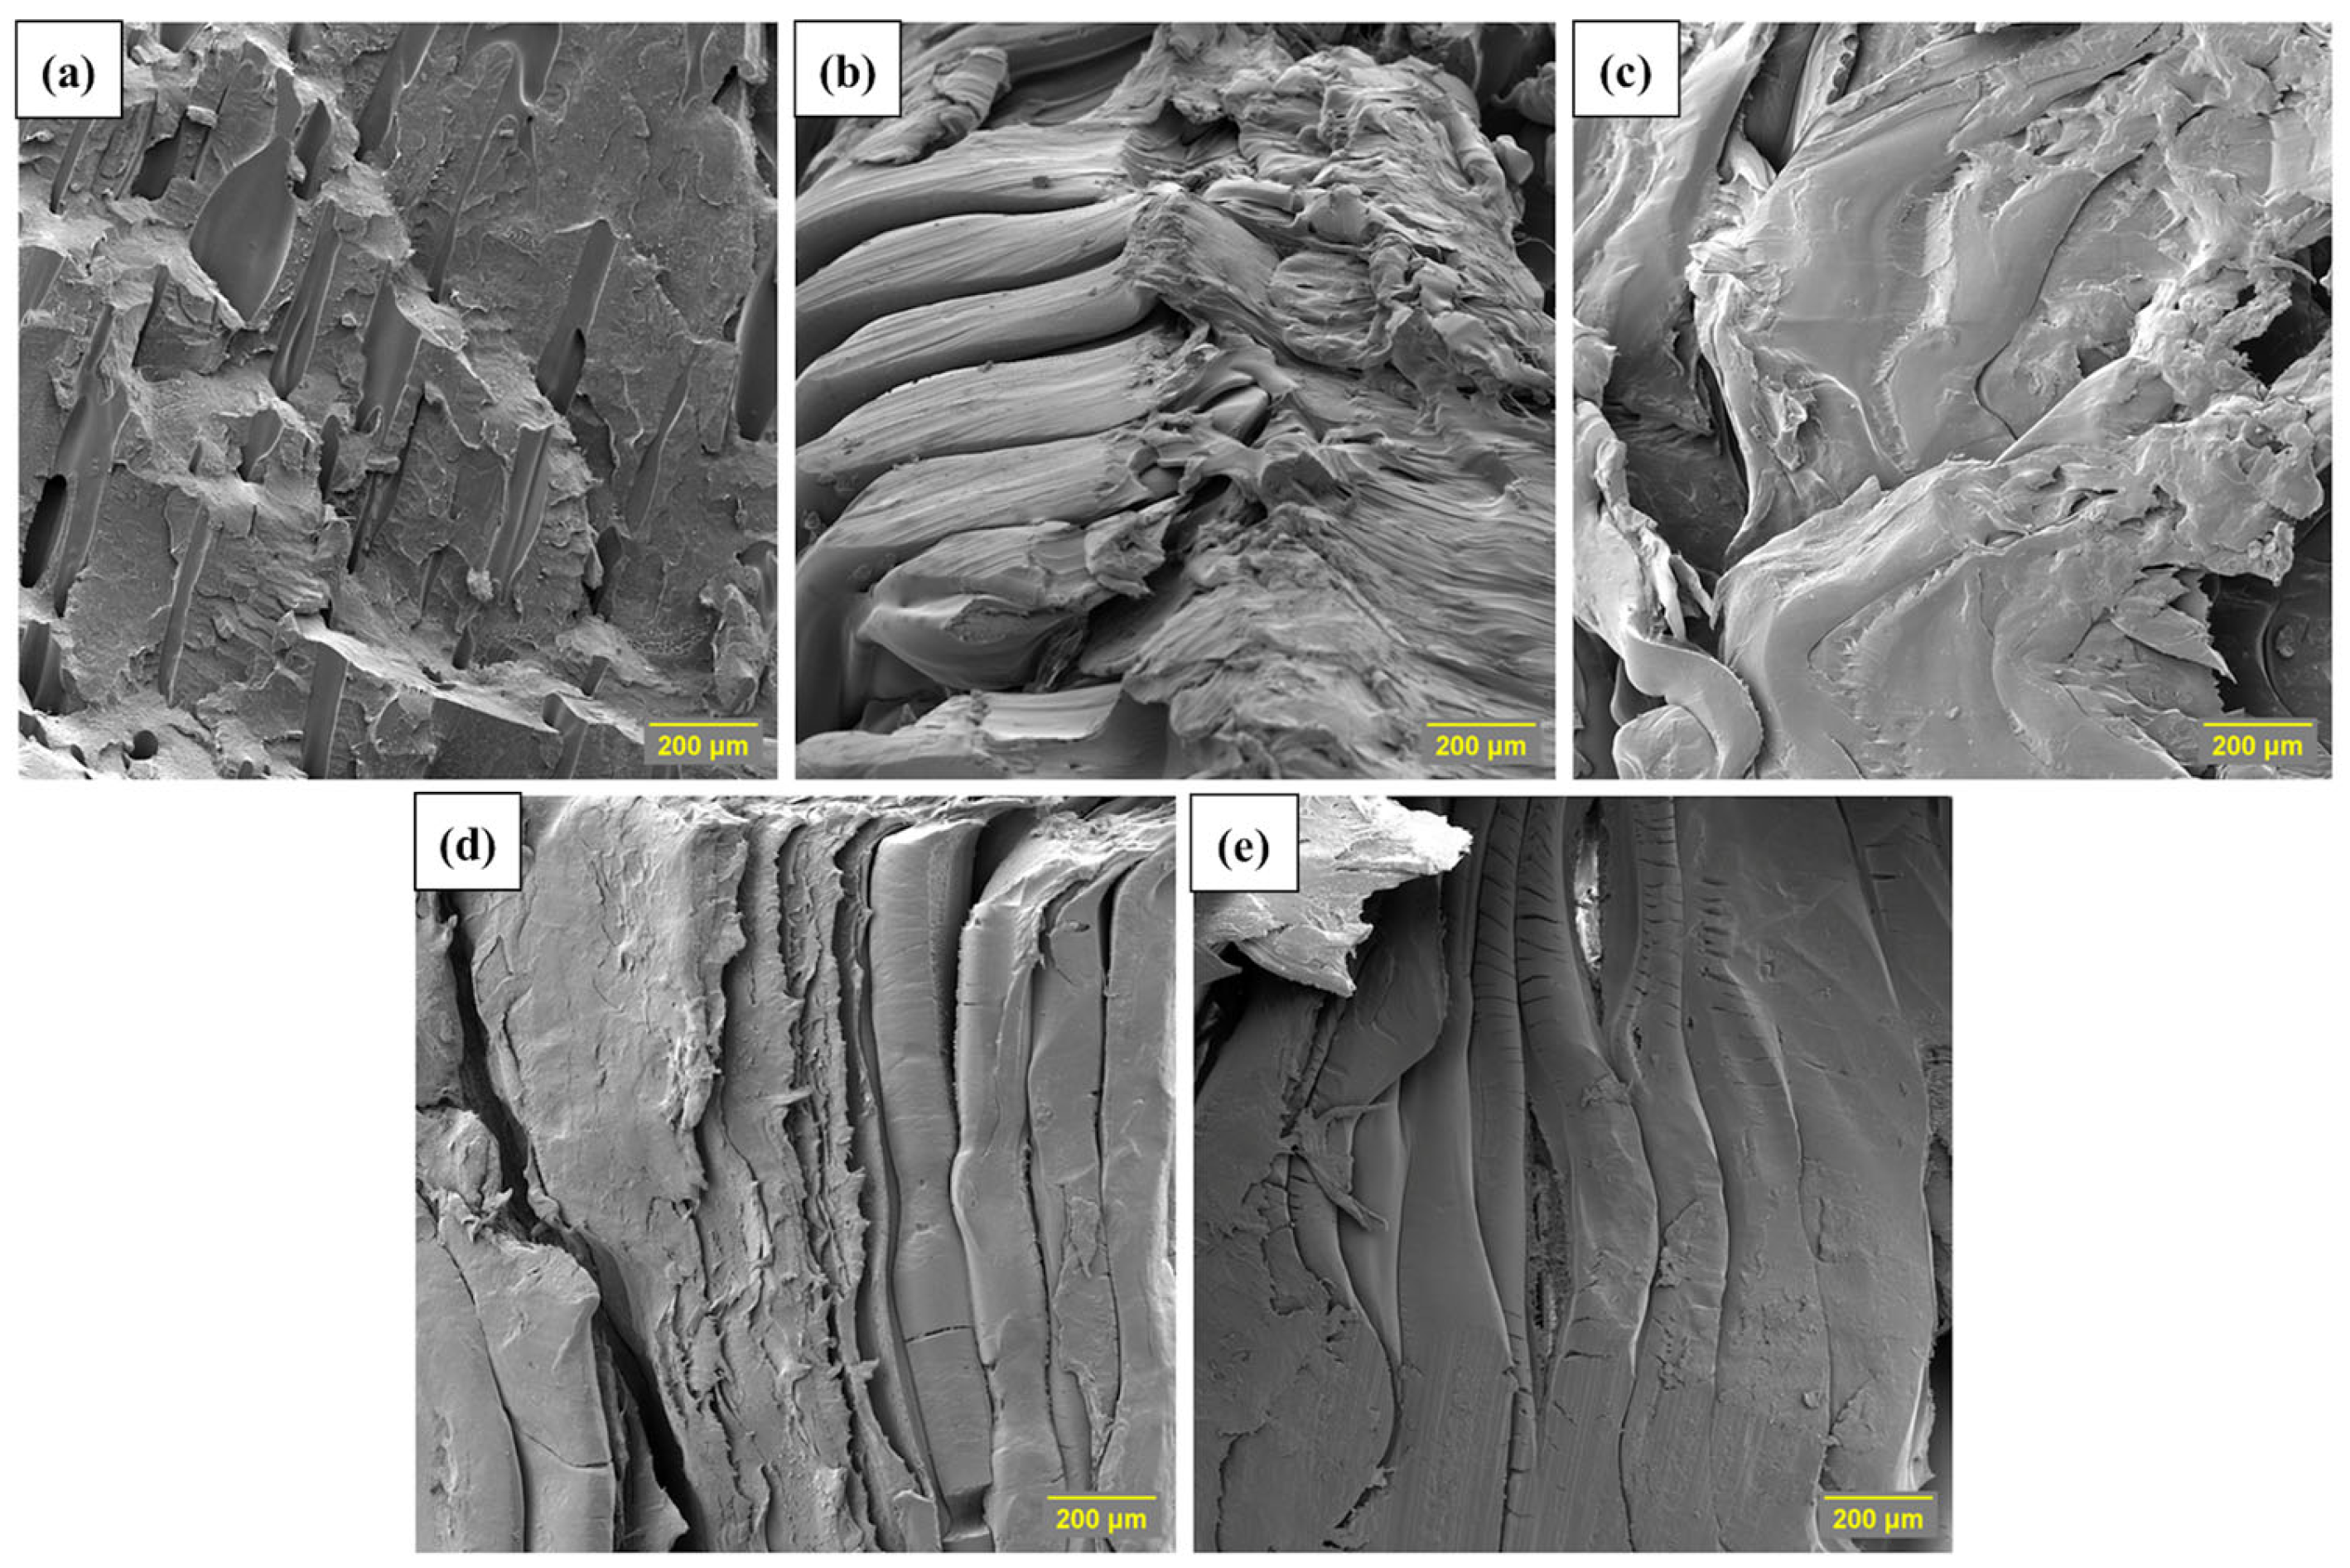

Disclaimer/Publisher’s Note: The statements, opinions and data contained in all publications are solely those of the individual author(s) and contributor(s) and not of MDPI and/or the editor(s). MDPI and/or the editor(s) disclaim responsibility for any injury to people or property resulting from any ideas, methods, instructions or products referred to in the content. |
© 2026 by the authors. Licensee MDPI, Basel, Switzerland. This article is an open access article distributed under the terms and conditions of the Creative Commons Attribution (CC BY) license.