


Abstract
Mass timber elements such as glued laminated timber (Glulam) and cross-laminated timber (CLT) have become increasingly prominent in sustainable construction due to their structural efficiency and reduced environmental impact. However, fire performance remains a critical consideration for structural safety. This paper presents a comparative assessment of experimentally measured and code-predicted fire performance parameters for Glulam and CLT, including charring rate, effective charring depth, zero-strength layer (ZSL) thickness, and residual mechanical properties. The evaluation covers major international fire design standards: Eurocode 5 (EC5), the Australian Standard (AS/NZS 1720.4), the Swedish Handbook (Swedish), American Wood Council (AWC TR10), and the Canadian Standard (CSA O86). Across all Glulam datasets, charring rate predictions agreed with tests within approximately ±20%, while AS/NZS 1720.4 consistently over predicted charring and effective char depth by around 40%. In contrast, CLT demonstrates greater variability, primarily due to adhesive degradation, delamination, and lamella orientation, which influence heat transfer and post-fire capacity. CLT data exhibited higher scatter, with effective charring depth showing standard deviations of approximately 30 to 40%, ZSL thickness averaging about 2.5 times the typical 7 mm assumption, and residual stiffness commonly reducing to around 20 to 25% of initial values after standard fire exposure. Overall, findings suggest that current standards adequately address Glulam performance but require refinement to capture the complex fire response of CLT. Continued experimental research and targeted code development, particularly within the Australian Standard, are essential to improve reliability and confidence in performance-based fire design for mass timber structures.
1. Introduction
1.1. Background and Context
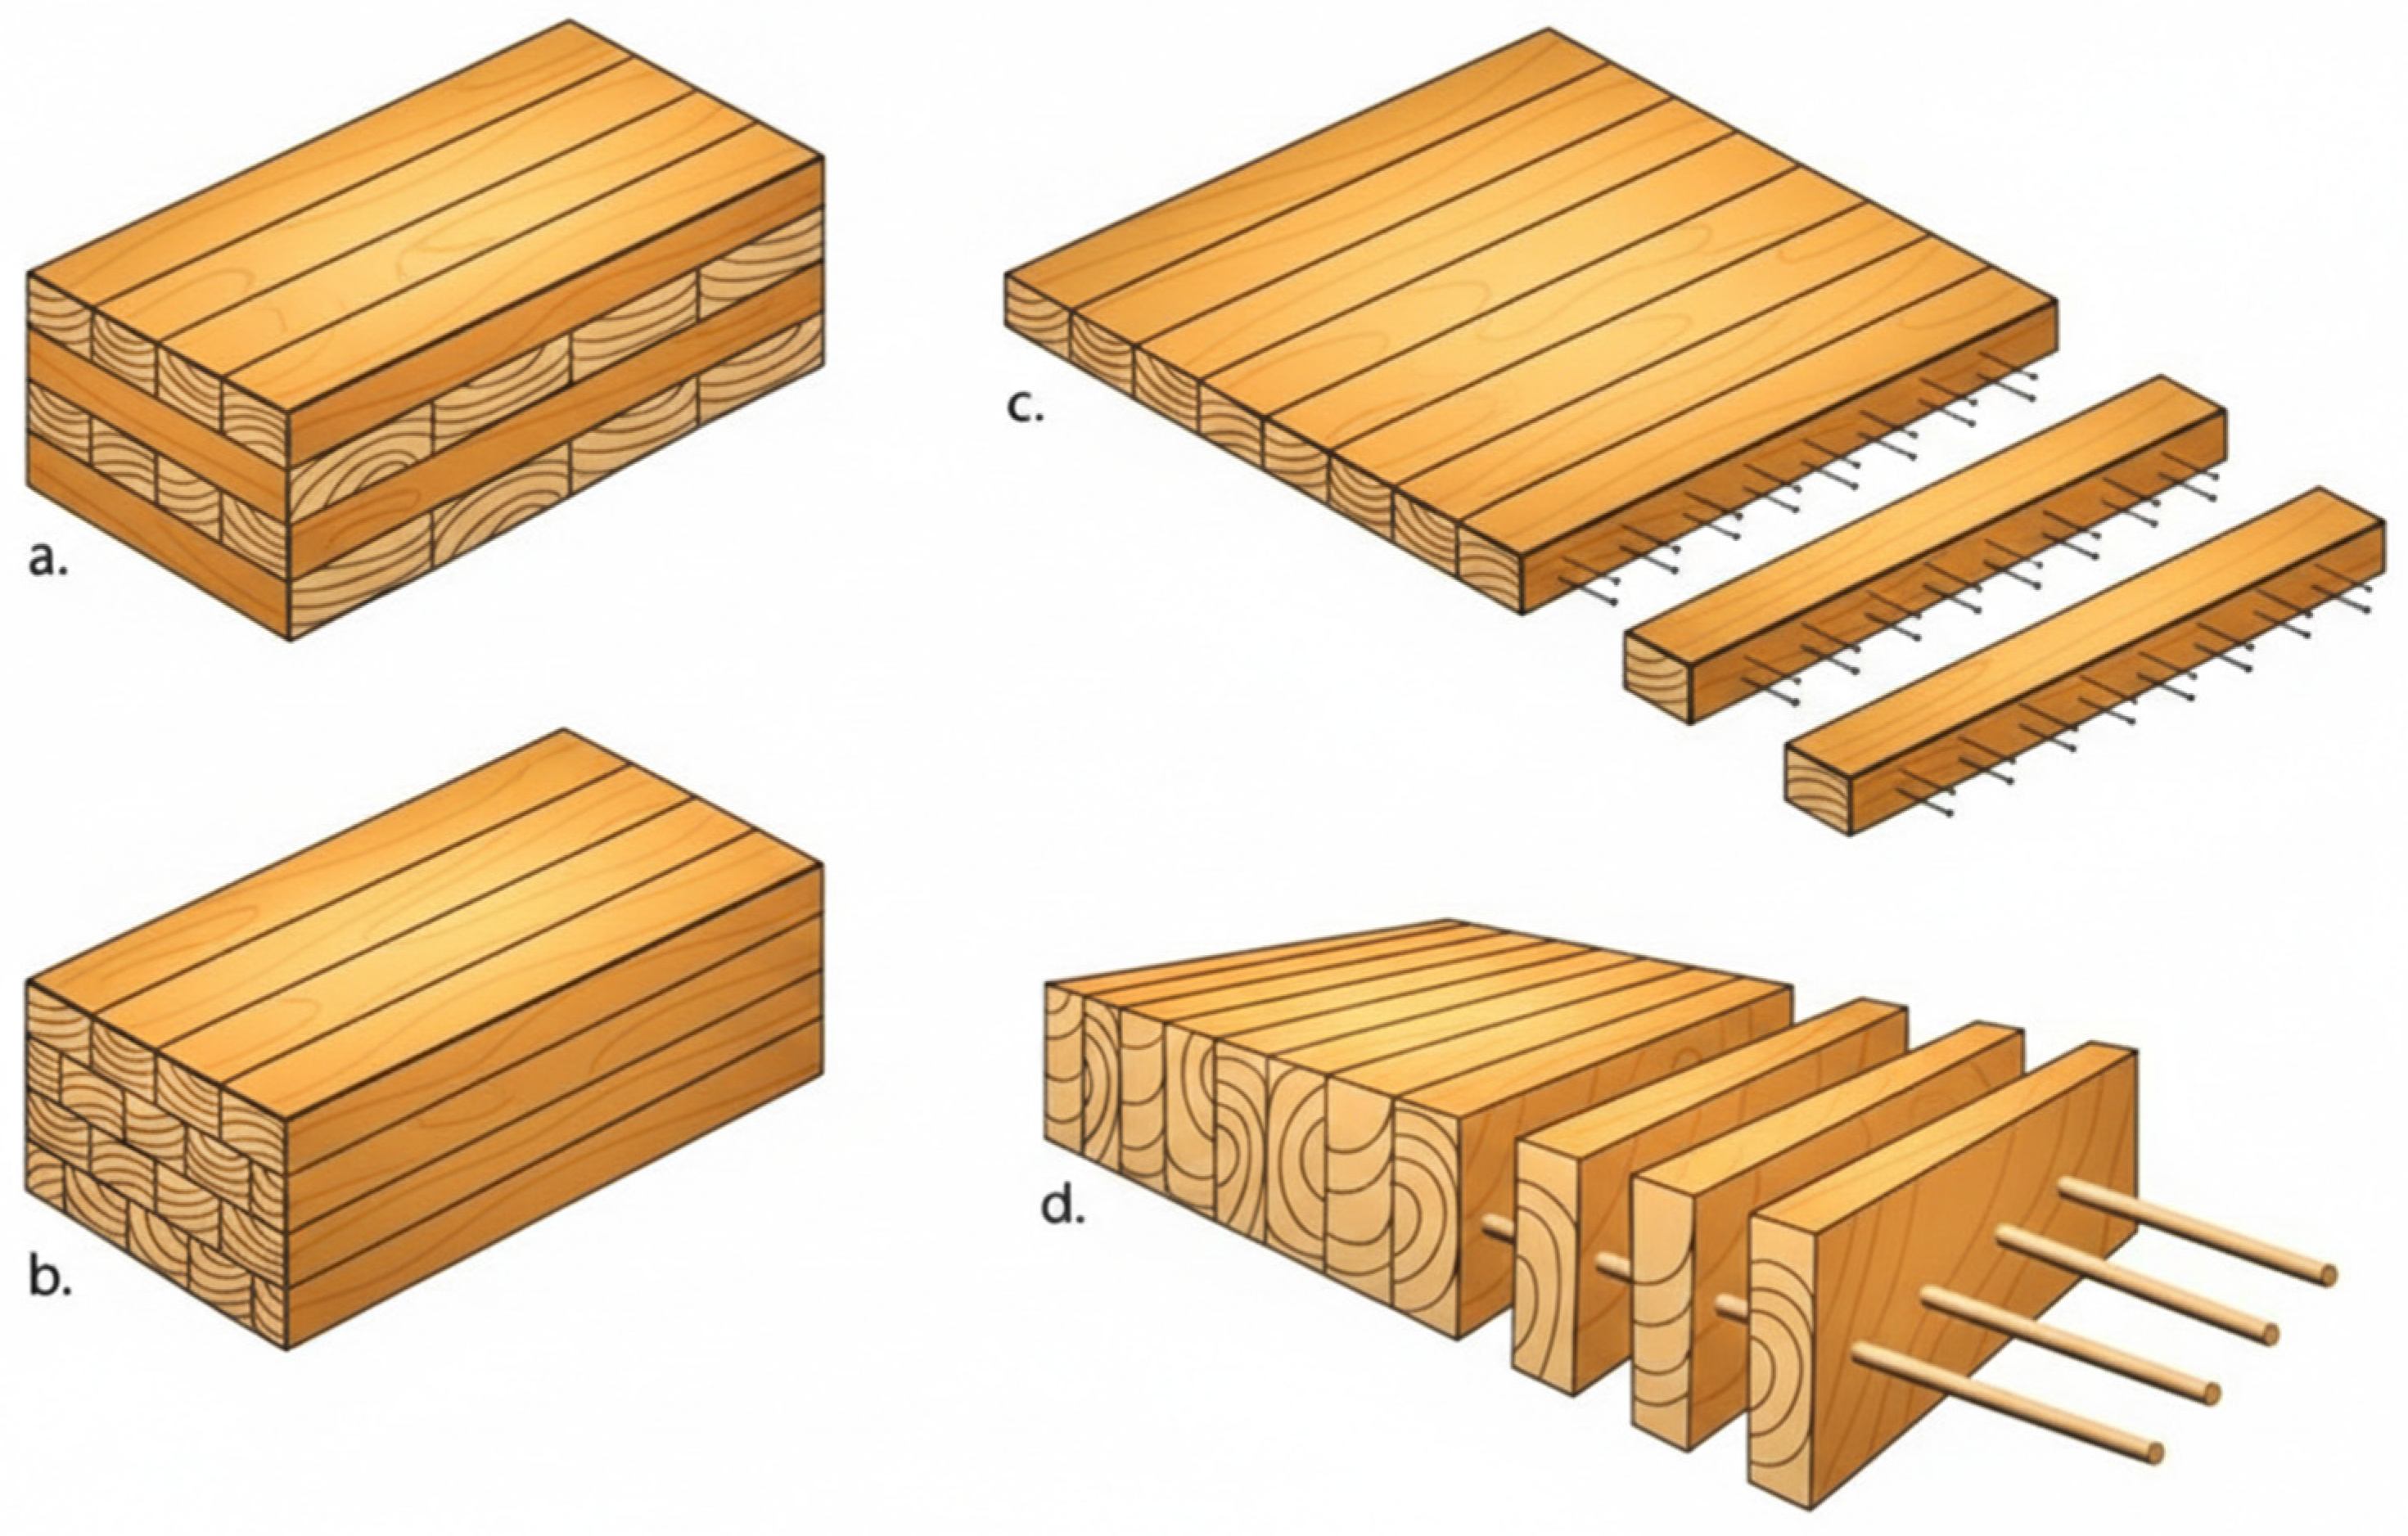
Mass timber represents a transformative advancement in sustainable construction materials, offering a strong and environmentally responsible alternative to conventional materials such as concrete and steel. It encompasses a family of large, engineered wood products that serve as primary load-bearing components in modern buildings [1]. In mass timber construction, timber functions as the principal structural system supporting floors, walls, and roofs [2]. Common mass timber products include cross-laminated timber (CLT), glued laminated timber (Glulam), nail-laminated timber (NLT), and dowel-laminated timber (DLT), as illustrated in Figure 1. Among the most prominent components in this system are CLT and Glulam. Each plays a distinct role in structural design, and together, they enable architects and engineers to create innovative, high-performance buildings.
CLT has emerged as a key innovation in modern timber construction, offering both structural efficiency and environmental benefits [3]. It is produced by layering lumber boards at right angles and bonding them with structural adhesives, creating a material with high dimensional stability and strength, as illustrated in Figure 1a. The timber used in CLT is machine stress-graded and kiln-dried to approximately 12% moisture content to ensure uniformity and durability [1]. These panels are generally composed of an odd number of layers, most commonly three, five, or seven, with dimensions that vary according to the manufacturer. CLT panels can reach lengths of up to 18 m, widths of 5 m, and thicknesses of 500 mm, making them suitable for use in floors, walls, and roof systems. Structurally, CLT provides a strong and sustainable alternative to conventional materials such as concrete and steel [3]. Crosswise layering provides excellent dimensional stability and allows for the prefabrication of large wall and floor assemblies, which supports efficient installation and enhanced design flexibility [4].
Glulam is another versatile engineered timber product that is widely used in both architectural and structural applications [5]. Glulam members consist of multiple layers of dimensional lumber, with each layer having the grain oriented parallel to the length of the member, as illustrated in Figure 1b. These laminations are bonded together using durable, moisture-resistant adhesives that produce components with high strength, stiffness, and visual appeal. Depending on the manufacturer, Glulam members typically range from 180 to 630 mm in thickness, 66 to 200 mm in width, and can be produced in lengths up to 50 m. This manufacturing flexibility allows Glulam to be produced in large sizes or curved geometries to meet both structural and architectural design requirements. Glulam exhibits a very high strength-to-weight ratio, which makes it stronger than structural steel when compared by weight, and it is therefore ideal for long span and load-bearing applications.
Contemporary mass timber construction often employs hybrid systems that combine Glulam and CLT to enhance overall structural efficiency. In these configurations, Glulam beams and columns form the primary load-bearing skeleton, while CLT panels function as horizontal diaphragms for floor and roof assemblies. This integrated approach leverages the high bending and axial strength of Glulam members complemented by CLT’s inherent dimensional stability and ease of installation, resulting in a robust and streamlined building system.
A major challenge associated with timber construction, when compared to conventional materials such as concrete and steel, is its inherent vulnerability to fire, a concern that becomes more critical in tall buildings due to extended evacuation times. Understanding the fire performance of mass timber structures is essential for ensuring safety and resilience. When timber is subjected to elevated temperatures, it undergoes pyrolysis, a thermal decomposition process that results in the formation of a char layer [6,7,8]. This charring significantly affects the fire resistance of wood components. The char layer develops between the exposed surface and the pyrolysis front, which is commonly associated with the 300 °C isotherm [7,9,10,11]. Due to its low thermal conductivity, the char acts as an insulating shield, protecting the underlying uncharred wood from further heat exposure and thereby reducing the rate at which heat penetrates the material.
The charring depth refers to the distance between the original outer surface of a timber element and the location of the char front formed during fire exposure. The charring rate, which quantifies the progression of this depth over time, is a fundamental parameter in evaluating the fire performance of timber structures [7,12,13,14]. It enables engineers to determine the dimensions of the residual cross-section that remains structurally effective during and after a fire event. Charring rate is influenced by a range of material and environmental factors, including wood species, density, moisture content, permeability, fire exposure conditions, and the orientation of heat flow relative to the grain direction [10,13,14,15,16,17,18,19]. However, in practical design scenarios, only a subset of these variables is typically accounted for due to limitations in available data and standardisation.
For instance, Eurocode 5, EN 1995-1-2 [11] prescribes fixed charring rates for commonly used species based on a minimum characteristic density of 290 kg/m3. Softwoods such as pine and spruce are assigned a charring rate of 0.65 mm/min, while hardwoods like beech, ash, and oak are given rates of 0.7 mm/min, 0.6 mm/min, and 0.5 mm/min, respectively. These values serve as conservative benchmarks for fire design across Europe. In the United States, the National Design Specification (NDS) [20] provides more nuanced guidance, incorporating nonlinear charring behaviour and variable char depths for exposed wood elements. This approach allows for more refined fire resistance calculations, particularly in performance-based design. In Canada, the CSA O86 [21] standard adopts a simplified methodology, specifying a one-dimensional charring rate of 0.65 mm/min for softwoods and engineered wood products such as Glulam and CLT. This value aligns closely with European practice and supports consistent fire design across timber applications. Similarly, in Australia and New Zealand, the AS/NZS 1720.4 [22] standard offers species-specific charring rates, enabling designers to tailor fire resistance assessments to local timber types and construction practices.
Several studies have identified a correlation between wood density and charring rate [14,23,24]. Notably, as wood density increases from 400 to 600 kg/m3 at a moisture content of 12%, the charring rate tends to decrease [25,26]. While the thermal conductivity of solid wood is influenced by its moisture content, variations in conductivity below 300 °C have minimal impact on the charring rate. During fire exposure, the internal temperature of wood remains relatively stable at approximately 100 °C until all moisture has evaporated, which is the primary mechanism through which moisture affects charring behaviour.
The influence of wood species and density on charring rate is largely attributed to differences in chemical composition. The relative amounts of lignin, hemicellulose, and cellulose, each with distinct pyrolysis characteristics and decomposition sequences, play a critical role in determining the extent of mass loss and the degree of strength degradation during fire exposure [14,15,18,27]. These intrinsic properties underscore the importance of species-specific analysis in fire design for timber structures.
In general, timber products with larger cross-sectional dimensions exhibit enhanced fire resistance. During fire exposure, the cross-sectional area of the timber diminishes progressively, governed by the species-specific charring rate. The remaining uncharred portion continues to contribute to the structural load-bearing capacity. As such, the charring rate is a critical parameter in assessing the fire resistance and structural integrity of timber elements.
Ultimately, Glulam and CLT beams are central to the evolution of mass timber construction. Their complementary properties enable efficient, resilient, and beautiful buildings that meet modern performance demands while reducing environmental impact. As codes evolve and testing advances, the potential for timber to redefine urban architecture continues to grow.
Figure 1.
Different types of mass timber: (a) CLT; (b) Glulam; (c) NLT; (d) DLT [28].
1.2. Research Rationale and Gap
While extensive research has been conducted on the fire resistance of solid timber and Glulam, CLT presents distinct challenges arising from its layered configuration and adhesive interfaces. Existing design standards often generalize charring rates and residual strength parameters based on homogeneous materials, without adequately accounting for the effects of delamination, adhesive degradation, and interlaminar heat transfer. These oversights contribute to discrepancies between experimental observations and code-based predictions. The motivation for this study stems from the need to address these limitations through a detailed comparative investigation of Glulam and CLT fire performance, with the aim of improving the predictive reliability of major international design standards.
This research aims to evaluate and compare the charring behaviour of Glulam and CLT beams and floor assemblies using published experimental data, and to benchmark these results against established design codes and standards from Europe, Australia/New Zealand, Sweden, the United States, and Canada. After the reported charring depths are identified from the literature, a mechanical analysis is conducted using the effective cross-section method prescribed in these standards to assess the residual strength and stiffness of fire-exposed timber members. Additionally, the study applies the reduced properties method and the advanced thermal analysis approach outlined in Eurocode 5, EN 1995-1-2 [11] to provide a comprehensive evaluation of the residual mechanical performance of timber elements under elevated temperature conditions.
From a practical design standpoint, a direct comparison between Glulam and CLT is necessary because their fire response is governed by fundamentally different mechanisms. Glulam behaves largely as a laminated but directionally homogeneous section, for which residual section approaches are commonly applied. In contrast, CLT has a layered layup and adhesive bond lines that introduce interface phenomena, including heat-induced delamination and char fall-off that can expose fresh wood and alter the progression of damage in ways not captured by assumptions derived from homogeneous or simply laminated members [27,29,30,31]. Additionally, intermediate-scale and small-scale investigations on bond line behaviour in CLT demonstrate that adhesive degradation is a primary driver of structural reliability under fire [30,32].
This distinction has immediate implications for performance-based fire design. When designers rely on charring-based methods to demonstrate structural adequacy during and after fire, confidence in the underlying assumptions depends on how well those methods represent the dominant physical processes in each product. For Glulam, simplified methods are often sufficient; for CLT, adhesive behaviour, lamella thickness, and interlaminar heat transfer can govern residual capacity in ways that require careful interpretation of test data and, in many cases, a more explicit modelling of layer interactions [10,27,30,31,33]. 1 Furthermore, full-scale mass timber compartment studies have shown that exposed CLT influences fire dynamics and can prolong structural heating, reinforcing the need for product-specific evaluation [34,35].
Accordingly, the present study is motivated by the need to clarify where existing approaches remain fit for purpose and where product-specific considerations are required. By evaluating Glulam and CLT within a common framework and consistent terminology, the work aims to support reliable design decisions, inform the selection of analysis methods suited to each product, and highlight areas where additional adhesive sensitive testing and modelling detail are warranted for CLT [11,27,29]. Recent design guidance also emphasises the importance of integrating adhesive-focused modelling and advanced thermal analysis in CLT fire assessment, supporting the relevance of this study [36,37,38,39,40].
2. Review of International Fire Design Codes and Standards
2.1. Europe
In Europe, the fire design of timber structures is primarily governed by Eurocode 5, EN 1995-1-2 [11], which establishes harmonised methods for evaluating fire resistance, charring behaviour, and load-bearing capacity of solid timber and Glulam elements. As part of the Eurocode suite , this standard operates within the broader European Building Code framework and supports uniform fire safety and performance standards across member states [41]. Eurocode 5, EN 1995-1-2 [11] specifies two analytical approaches: the Simplified Method (SM), which uses prescribed charring rates and residual section parameters, and the Advanced Calculation Method (ACM), which employs temperature-dependent thermal–mechanical modelling to predict fire-induced behaviour with greater accuracy. However, Eurocode 5, EN 1995-1-2 [11] does not explicitly include provisions for CLT elements, as the material was not yet standardised at the time of publication. Consequently, CLT fire design in Europe typically relies on national annexes, technical assessments, and supplementary design documents such as the CLT Handbook [42] and research-based guidelines [43,44], which extend Eurocode principles to include CLT-specific charring, delamination, and adhesive performance behaviour.
2.1.1. Simplified Method (SM)
Eurocode 5, EN 1995-1-2 [11] specifies two distinct charring rates for fire design under the simplified method: the one-dimensional design charring rate under standard fire conditions (β0) and the notional charring rate (βn). When applying β0, the calculation of residual cross-sectional properties must account for the actual charring depth, including adjustments for corner rounding. In contrast, βn represents an equivalent charring rate that facilitates the use of a simplified rectangular residual cross-section for design purposes.
The standard provides charring rate values for softwoods, as outlined in Table 1. For softwoods with a characteristic density exceeding 290 kg/m3 and hardwoods above 450 kg/m3, Eurocode 5, EN 1995-1-2 [11] considers the charring rate to be independent of density. However, for hardwoods with densities ranging between 290 kg/m3 and 450 kg/m3, the charring rate is assumed to vary linearly with density.
Table 1.
Charring rate of wood for use with strength models of Eurocode 5, EN 1995-1-2 [11].
The charring depth of timber elements exposed to fire can be determined using two distinct equations, depending on the number of sides exposed to fire. For single-sided fire exposure, the one-dimensional design charring rate is adopted and assumed to remain constant with time. The corresponding design charring depth () is given by Equation (1), defined in Eurocode 5, EN 1995-1-2 [11].
where: = Design charring depth for one-dimensional charring in millimetres; = One-dimensional design charring rate under standard fire exposure in millimetres per minute; = Duration of fire exposure in minutes.
For three sides or more exposed to fire, the notional design charring rate is applied, which accounts for the influence of corner roundings and surface fissures. The corresponding notional design charring depth () is given by Equation (2), defined in Eurocode 5, EN 1995-1-2 [11].
where: = Notional design charring depth, incorporating the effects of corner roundings in millimetres; = Notional design charring rate, which includes the effects of corner roundings and fissures in millimetres per minute; = Duration of fire exposure in minutes.
Equations (1) and (2) assume that the rate of charring remains constant over time under standard fire conditions, allowing for simplified estimation of the depth of material degradation in timber members subjected to varying fire exposure conditions. Once the charring depth has been determined, Eurocode 5, EN 1995-1-2 [11] outlines two distinct strength assessment models under the simplified method for conducting the subsequent mechanical analysis.
Reduced Cross-Section Method (RCM)
The Reduced Cross-Section Method (RCM) considers the effective cross-section of a timber member exposed to fire, as shown in Figure 2, to evaluate its residual load-bearing capacity. The effective cross-section is determined by reducing the initial cross-section by the effective charring depth, which accounts for both the charred layer and the adjacent weakened layer of material near the char line. The effective charring depth is given by Equation (3), defined in Eurocode 5, EN 1995-1-2 [11].
where: = Effective charring depth in millimetres; = Notional design charring depth in millimetres, determined using Equation (2); = Correction factor representing the thickness of the zero-strength layer (ZSL); = Reference thickness of the ZSL, typically 7 mm.
Figure 2.
Definition of residual cross-section and effective cross-section [11].
It is assumed that the layer of thickness , located immediately beneath the char line, has zero strength and stiffness, whereas the strength and stiffness properties of the remaining residual cross-section are considered unaffected. This approach enables the estimation of the effective load-bearing capacity of timber elements under fire exposure by accounting for both the material loss due to charring and the thermal softening of the heat-affected zone.
For unprotected timber surfaces, the value of is given by Equations (4) and (5), defined in Eurocode 5, EN 1995-1-2 [11]:
where: = Duration of fire exposure in minutes.
For shorter exposure periods, the increased reflects the accelerated charring and strength loss near the surface, while for exposure durations of 20 min or longer, the charring rate stabilises and remains constant.
Reduced Properties Method (RPM)
The Reduced Properties Method (RPM) considers the degradation of mechanical properties within the residual cross-section of a timber element exposed to fire. The residual cross-section is defined in accordance with the configuration shown in Figure 2.
For fire exposure durations of t ≥ 20 min, the modification factor for fire () used to account for the reduction in bending strength is given by Equation (6), defined in Eurocode 5, EN 1995-1-2 [11].
where: = Perimeter of the fire-exposed residual cross-section in meters; = Area of the residual cross-section in square meters.
For unprotected members subjected to shorter fire exposure durations (0 ≤ t ≤ 20 min), the modification factor is determined by linear interpolation between the initial and 20 min values, as expressed in Equation (7) of Eurocode 5, EN 1995-1-2 [11].
Equations (6) and (7) indicate the gradual reduction in bending strength with increasing fire exposure duration, accounting for the heat-induced deterioration of material properties within the residual cross-section.
2.1.2. Advanced Calculation Method (ACM)
The Advanced Calculation Method (ACM) outlined in Eurocode 5, EN 1995-1-2 [11] is a conductive thermal model based on two- or three-dimensional transient heat transfer differential equations. This approach incorporates temperature-dependent thermal properties to simulate the behaviour of timber under fire conditions. While the model does not explicitly account for phenomena such as internal mass transfer, pyrolysis-induced reaction energy, material degradation, or charcoal cracking which can enhance heat transfer within the char layer, Eurocode 5, EN 1995-1-2 [11] addresses these effects implicitly by prescribing equivalent thermal properties. These equivalent properties include thermal conductivity, specific heat capacity, and the density ratio (defined as the ratio of wood density at a given temperature to the density of dry wood), as presented in Table 2. Eurocode 5, EN 1995-1-2 [11] specifies that the thermal conductivity values for the char layer are apparent values, intended to reflect the increased heat transfer resulting from shrinkage cracks that form above approximately 500 °C and promote convection and radiation. The specific heat capacity values also account for the latent heat required to evaporate moisture, explaining the elevated values observed between 99 °C and 120 °C. All thermal property values provided in Eurocode 5, EN 1995-1-2 [11] are calibrated for softwood species under service class 1 conditions, corresponding to a moisture content of approximately 12%.
Table 2.
Density ratio, conductivity, and specific heat capacity as a function of temperature for use with the conductive model of Eurocode 5, EN 1995-1-2 [11].
The Advanced Conductive Model (ACM), as applied in this study, was implemented using the finite element software SAFIR2025a2 [45], a specialised program developed at the University of Liège (Belgium) for simulating structural behaviour under fire conditions. SAFIR performs coupled thermal–mechanical analyses, enabling detailed evaluation of temperature distributions, heat transfer mechanisms, and structural responses of timber members at elevated temperatures. The software has been widely validated in both academic and professional research for assessing the fire performance of timber structures.
2.2. Australia/New Zealand
In Australia and New Zealand, the fire design of timber structures is primarily governed by AS/NZS 1720.4 [22], which provides analytical and empirical procedures for determining the fire resistance, charring behaviour, and residual load-bearing capacity of solid timber, Glulam, laminated veneer lumber (LVL), and plywood members. This standard operates in conjunction with AS 1720.1 [46], which establishes the general structural design principles and load capacity calculations for timber under ambient conditions. Within Australia, both standards are referenced by the National Construction Code [47] as deemed-to-satisfy (DTS) documents for demonstrating compliance with structural performance and fire resistance requirements. AS/NZS 1720.4 [22] specifies methods for evaluating notional and effective charring rates, reduced cross-section geometry, and strength degradation under standard fire exposure conditions consistent with AS 1530.4 [48] fire testing. However, similarly to Eurocode 5, EN 1995-1-2 [11], the standard does not explicitly address CLT design, and therefore, CLT fire performance assessment in Australia and New Zealand typically relies on manufacturer data, full-scale fire testing, or supplementary technical publications [22,46,47].
According to AS/NZS 1720.4 [22], the notional charring rate for unprotected timber members is determined either by using the empirical expression, referring the values listed in Table 3 for common timber species, or standard fire testing.
Table 3.
Notional charring rates for common timber species [22]. Source: Table 2.5.1, AS/NZS 1720.4:2019. Used with permission from Standards Australia.
The notional charring rate is given by Equation (8), defined in AS/NZS 1720.4 [22].
where: = Notional charring rate in millimetres per minute; = Timber density at a moisture content of 12% in kg/m3.
For engineered wood products, the density should be based on the primary timber species used, excluding any adhesive content.
The effective depth of charring for unprotected surfaces is given by Equation (9), defined in AS/NZS 1720.4 [22].
where: = Effective depth of charring in millimetres; = Notional charring rate in millimetres per minute; = Duration of fire exposure in minutes.
The additional 7.0 mm represents the layer of heated yet uncharred timber that provides no strength or stiffness to the residual cross-section and corresponds to the ZSL thickness defined in Eurocode 5, EN 1995-1-2 [11]. The effective residual section is determined by subtracting the calculated effective depth of charring from all fire-exposed faces of the timber member, as illustrated in Figure 3.
Figure 3.
Loss of section due to charring [22]. Source: Figure 2.7, AS/NZS 1720.4:2019. Used with permission from Standards Australia.
2.3. Sweden
In Sweden, the fire resistance design of timber structures is governed by the Swedish Building Regulations, Boverkets byggregler [50], used in conjunction with Eurocode 5, EN 1995-1-2 [11]. The BBR establishes the national performance-based requirements for fire safety, including structural integrity, load-bearing capacity, and fire resistance, while Eurocode 5, EN 1995-1-2 [11] provides the analytical framework for evaluating charring behaviour, effective residual cross-sections, and fire resistance ratings for solid timber and Glulam members. Swedish practice extends these European provisions through national guidelines and design aids developed by Swedish Wood, ensuring compliance with both the BBR and Eurocode principles [11,50].
The Glulam Handbook Volume 2 [51] and Glulam Handbook Volume 3 [52], published by Swedish Wood, provide detailed guidance on the fire resistance design of Glulam elements. These handbooks reference Eurocode 5, EN 1995-1-2 [11] for calculating charring rates, residual section geometry, and load-bearing capacity under standard fire exposure, as discussed in Section 2.1. The documents integrate experimental data and practical design examples, offering engineers refined calculation methods consistent with both European and Swedish regulatory frameworks [51,52].
Unlike Eurocode 5, EN 1995-1-2 [11] and AS/NZS 1720.4 [22], the CLT Handbook [42] published by Swedish Wood provides comprehensive procedures for assessing the fire resistance of CLT elements, accounting for charring behaviour, adhesive performance, and lamella configuration. The handbook distinguishes between melamine-urea-formaldehyde (MUF) adhesives, which are non-delaminating, and polyurethane (PUR) adhesives, which may delaminate under heat, influencing charring progression. Fire performance relationships are defined according to lamella gap size and number of exposed faces, with key design equations illustrated in Figure 4 and Figure 5 [42].
Figure 4.
CLT cross-section: (a) Cross-section at normal temperature; (b) Residual cross-section layer and on-load-bearing layer, for single-sided fire exposure [42].
Figure 5.
Charring of CLT with non-fire-resistant adhesive (with delamination) and fire-resistant adhesive (no delamination) [42].
For CLT panels with gaps of less than 2 mm between boards, the one-dimensional charring depth is given by Equation (10), defined in CLT Handbook [42].
where: = One-dimensional charring depth in millimetres; = One-dimensional design charring rate for standard fire = 0.65 mm/min; = Fire exposure time in minutes.
If the gaps between boards are ≥2 mm but <6 mm, the notional charring depth is given by Equation (11), defined in CLT Handbook [42].
where: = Notional charring rate, taken as 0.8 mm/min for CLT softwood construction timber.
When PUR adhesives are used and delamination occurs, the charring rate for the first 25 mm of each lamella is doubled (2 β0).
The effective cross-section method follows principles similar to those presented in Eurocode 5, EN 1995-1-2 [11]. In this approach, the effective cross-section of a timber element is used to determine the residual load-bearing capacity of timber members exposed to fire. The effective cross-section is obtained by reducing the original cross-section of the member by the effective charring depth (), which represents the total loss of structural material due to both complete charring and thermal degradation.
The effective charring depth is given by Equation (12), defined in CLT Handbook [42].
where: = Charring depth in millimetres as per Equation (10) or Equation (11); = Thickness of the non-load-bearing heated layer in millimetres, representing the zero-strength layer adjacent to the char line, which is determined empirically based on the number of layers and exposure conditions, as summarised in Table 4.
Table 4.
Non-load-bearing layer, , for t = 0–120 min for CLT panels [42].
2.4. The United States
In the United States, the fire design of timber structures is governed by a coordinated framework comprising the International Building Code [53], the National Design Specification for Wood Construction [20], and the American Wood Council (AWC) Technical Report No. 10 (TR10) [54]. While the IBC establishes the overarching regulatory fire resistance requirements for mass timber construction and references the NDS for structural provisions, detailed analytical and empirical procedures for fire performance evaluation are presented in AWC TR10 [54]. This report serves as the primary technical reference for determining the fire resistance, effective char depth, and residual load-bearing capacity of sawn timber, Glulam, and CLT elements. Unlike Eurocode 5, EN 1995-1-2 [11] and AS/NZS 1720.4 [22], AWC TR10 [54] explicitly includes CLT fire design guidance, accounting for adhesive type, delamination behaviour, and charring rate variations among engineered timber products. The provisions of AWC TR10 [54] complement NFPA 5000 [55], which governs fire safety and construction performance criteria, thereby ensuring regulatory alignment between structural fire design and fire protection systems. Consequently, AWC TR10 [54] provides a comprehensive and experimentally calibrated framework for assessing the fire resistance and structural performance of timber elements under fire exposure.
The AWC TR10 [54] report advances the modelling of timber behaviour under fire exposure by introducing a nonlinear charring rate approach, which differs from the linear charring assumptions used in other international standards. The nonlinear char rate is derived from nominal one-hour char rate data and is given by Equation (13), defined in AWC TR10 [54].
where: = Nonlinear char rate constant in inches per hour0.813; = Nominal char rate constant in inches per hour, based on one-hour exposure = 1.5 in/h ≈ 0.64 mm/min for Glulam, CLT, and other solid timber products; = Fire exposure time in hours.
The corresponding char depth for Glulam and other solid timber products is given by Equation (14), defined in AWC TR10 [54].
where: = Char depth in inches; = Nonlinear char rate constant in inches per hour; = Total fire exposure time in hours.
For CLT, AWC TR10 [54] introduces additional considerations for layer fall-off and delamination, based on observations from full-scale fire tests. The time required for the char front to reach the glue line for each lamination is given by Equation (15), defined in AWC TR10 [54].
where: = Time for the char front to reach the ith glue line in hours; = Thickness of the ith lamination in inches; = Nonlinear char rate constant in inches per hour.
For CLT panels with uniform lamination thickness, the total char depth is given by Equations (16)–(18), defined in AWC TR10 [54].
where: = Time for the char front to reach the first glue line in hours; = number of charred laminations; = Nonlinear char rate constant in inches per hour; = Total fire exposure time in hours.
For structural analysis, AWC TR10 [54] recommends using an effective char depth to represent the weakened layer adjacent to the char front, given by Equation (19), defined in AWC TR10 [54].
where: = Effective char depth in inches; = Calculated char depth in inches.
The Effective Cross-Section Method (ECSM) presented in AWC TR10 [54] evaluates the fire resistance of exposed timber members by reducing the original cross-section to account for material loss caused by charring. In this approach, the effective cross-section is determined by subtracting the effective char depth () from the initial section dimensions. The effective char depth is defined as 1.2 times the calculated char depth (), thereby incorporating a 20% allowance for the heated zone with reduced strength and stiffness adjacent to the char front. The 1.2 factor (or 20%) in Equation (19) represents this reduction and corresponds to the ZSL concept described in Eurocode 5, EN 1995-1-2 [11]. The remaining effective section is then used for structural analysis under ambient design stresses to estimate residual load-bearing capacity after fire exposure. The corresponding char depths and effective char depths for various fire-resistance durations for Glulam and CLT are summarised in Table 5 and Table 6, respectively.
Table 5.
Char Depth and Effective Char Depth for Glulam (for βn = 1.5 inc/h ≈ 0.64 mm/min).
Table 6.
Char Depth and Effective Char Depth for CLT (for βn = 1.5 inches/h ≈ 0.64 mm/min).
2.5. Canada
In Canada, the fire design of timber structures is primarily governed by CSA O86 [21], which provides the national framework for the structural design and fire performance evaluation of timber members. This standard operates in conjunction with the National Building Code of Canada (NBCC) [56], which establishes the overarching fire safety, structural integrity, and performance-based compliance requirements for buildings. The NBCC references CSA O86 [21] as the primary technical standard for verifying the fire resistance of timber structural elements, while coordination with the National Fire Code of Canada (NFCC) [57] ensures consistency between structural fire resistance and building fire protection systems.
Annex B of CSA O86 [21] provides analytical procedures for determining the charring depth, ZSL, and effective residual cross-section for solid timber, Glulam, and CLT members exposed to standard fire conditions. The one-dimensional and notional charring rates, denoted as β0 and βn, respectively, are prescribed based on the material type and application, as presented in Table 7. For example, Glulam and CLT members are assigned β0 = 0.65 mm/min and βn = 0.70 mm/min, which align closely with the rates adopted in Eurocode 5, EN 1995-1-2 [11] but are calibrated to reflect Canadian timber properties and manufacturing standards, including ANSI/APA PRG 320 [58]. The corresponding one-dimensional and notional charring depths, and , are calculated using Equations (20) and (21), defined in CSA O86 [21].
where: = Duration of fire exposure in minutes.
Table 7.
One-Dimensional and Notional Charring Rates for Timber Products [21]. Source: Table B.2, CSA O86:24, Engineering design in wood. © 2024 Canadian Standards Association. Please visit www.store.csagroup.org.
To account for the strength reduction in the heated wood beyond the char front, CSA O86 [21] introduces a ZSL that is subtracted from the residual section. The thickness of this layer, , is given by Equation (22), defined in CSA O86 [21].
The effective cross-section method outlined in CSA O86 [21] follows principles similar to those presented in Eurocode 5, EN 1995-1-2 [11]. In this approach, the effective cross-section of a timber element exposed to fire is determined by reducing the initial section by both the calculated char layer depth and the ZSL on each exposed surface. This reduction accounts for the material degradation near the char front, where strength and stiffness are significantly diminished. The remaining effective section is then used to evaluate the residual load-bearing capacity using standard equations for cross-sectional area, section modulus, and moment of inertia. The geometric representation of this method is illustrated in Figure 6.
Figure 6.
Schematic showing effective cross-section for a member exposed to fire on all sides [21]. Source: Figure B.3, CSA O86:24, Engineering design in wood. © 2024 Canadian Standards Association. Please visit www.store.csagroup.org.
3. Review of Fire Testing and Behaviour of Glulam and CLT Elements
3.1. Literature Review
Understanding the fire performance of mass timber elements such as Glulam and CLT is fundamental to ensuring structural safety and advancing the reliability of design standards. Fire testing provides critical data on charring progression, temperature distribution, delamination behaviour, and residual mechanical performance, enabling validation of theoretical models and regulatory provisions. This section presents a consolidated review of experimental investigations on Glulam and CLT elements exposed to standard fire conditions. In this study, a total of six Glulam and CLT element fire experiments were reviewed, as listed in Table 8, providing the experimental foundation for evaluating and comparing the predictive accuracy of international fire design standards. It draws upon key studies that evaluate charring rates, ZSL thickness, stiffness degradation, and adhesive effects, providing a foundation for refining predictive design models and identifying limitations in existing fire resistance criteria.
Table 8.
List of publications on Glulam and CLT elements fire experiments reviewed.
Darmon & Lalu [59] conducted fire testing of a simply supported Glulam beam. The test beam was subjected to fire on three sides following the ISO 834 standard fire curve [65]. The beam, measuring 180 mm by 440 mm in cross-section with a 3500 mm span, consisted of 11 layers, each 44 mm thick, as illustrated in Figure 7. It was loaded uniformly with 6.10 kN/m on its upper surface. To measure temperature changes, four thermocouples were placed at varying depths from the bottom of the beam. The timber beam had a moisture content of 11.6% and a dry density of 338 kg/m3. Temperatures measured with the thermocouples, together with the corresponding temperature profiles, are presented in Figure 8. The authors developed an analytical model that calculated a charring rate of 0.75 mm/min, aligning well with the Eurocode standard. However, the experimental charring rate was observed to be 0.566 mm/min, lower than the predicted value. The test results revealed that the ZSL exceeded the commonly adopted value, suggesting that the Eurocode 5, EN 1995-1-2 [11] method may be non-conservative and requires revision.
Figure 7.
Experimental fire test setup [59].
Figure 8.
Temperature measured with the thermocouples and corresponding simulated data [59].
Fahrni et al. [60] conducted six fire resistance tests at the SP fire laboratory in Stockholm. These experiments utilised a model-scale furnace with dimensions of 1.0 m × 1.0 m × 1.0 m and were conducted as four-point bending tests. The tests focused on the central section of the beams, which was subjected to the standard ISO 834 fire curve [65] on three sides, while the top was insulated with stone wool. Measurements of the residual cross-section were taken at five equally spaced points along the beam, with the central point located at the midpoint of the fire-exposed section. After sectioning the beams, images were captured for CAD software analysis to determine the centroid’s location and the area’s second moment of inertia, considering the actual residual shape. The width and height of the remaining section were estimated based on uniform charring depths. The average notional charring rate of six test specimens was found to be 0.73 mm/min, aligning with the 0.7 mm/min rate specified in Eurocode 5, EN 1995-1-2 [11]. For each beam, the notional charring rate βn and the one-dimensional charring rate β0 were established, considering the average charring on both sides of each cut and across all five cuts. The bottom two lamellas were excluded from analysis due to their exposure to fire from multiple directions, which would not represent the one-dimensional basic design charring rate β0. The average β0 for beams ranged from 0.63 mm/min to 0.72 mm/min. These data, combined with the fire resistance duration and ambient temperature bending strength, were used to compute the ZSL, d0. From four fire tests on Glulam beams under bending stress, an average ZSL thickness of 6.4 mm was identified (minimum 1.5 mm, maximum 11.8 mm), aligning with Eurocode 5, EN 1995-1-2 [11] of 7 mm ZSL thickness.
Navaratnam et al. [61] investigated the fire resistance of glued laminated timber (GLT) beams to address research gaps related to the limited understanding of loaded beam behaviour, internal temperature distribution, and post-fire stiffness degradation. Experimental tests were conducted on three non-load bearing (NLB) GLT beams measuring 280 mm × 560 mm × 1400 mm and one load bearing (LB) GLT beam measuring 280 mm × 560 mm × 5400 mm. The beams were fabricated from spruce pine (GL24h) with densities of 467 to 474 kg/m3 and moisture contents ranging from 9.3 to 10.3%. All specimens were exposed to the ISO 834 standard fire curve [65] for 120 min, with the LB beam subjected to a four-point bending load of 100 kN. Figure 9a–f present the Glulam beam exposed surfaces during fire at different intervals. Flaming began at around 2 min, with charred surfaces cracking by 22 min (Figure 9a,b). By 52 min, char layers detached naturally (Figure 9c). No adhesive failure occurred, demonstrating glue-line integrity, while timber combustion progressed with significant flaming. The mean charring rates were 0.70 mm/min for NLB beams and 0.71 mm/min for the LB beam, within an overall range of 0.43 to 0.81 mm/min. Charring along the beam depth was greater than along the width due to more intense heat transfer from the vertical sides. Variations in results were attributed to differences in timber density, moisture content, and adhesive heat resistance. The LB beam retained 22% of its initial flexural stiffness after 120 min of fire exposure, reducing from 35,600 kNm2 to 7700 kNm2, while maintaining serviceability with a mid-span deflection of 32.5 mm, within the L/150 limit. Reliability analysis showed that beams loaded to 75% and 50% of their design moment capacity could resist fire for about 30 min and 60 min, respectively. The study concluded that GLT beams maintained structural integrity under fire but that AS/NZS provisions were overly conservative. Further research was recommended on insulated GLT, density–moisture interactions, and numerical modelling of stiffness degradation to enhance reliability-based fire design.
Figure 9.
Fire-exposed sides of Glulam beams at test time: (a) 1 min and 50 s; (b) 22 min and 14 s; (c) 52 min and 56 s; (d) 69 min and 10 s; (e) 81 min and 46 s; (f) 115 min and 40 s; (g) 1 min and 26 s after the test; (h) 16 min and 26 s after the test [61].
Lineham et al. [62] conducted experimental tests on 12 one-way spanning CLT beams under four-point bending with identical overall dimensions. Four control specimens were tested to failure under displacement control at ambient temperature, while the remaining eight were subjected simultaneously to sustained mechanical loading and intense radiant heating following the ISO 834 standard fire curve [65]. The heated element length was assumed to be 500 mm instead of 300 mm, based on post-test observations showing approximately 500 mm charring due to three-dimensional heat transfer, as illustrated for a typical specimen in Figure 10. The results showed that the assumption of a constant 7 mm ZSL thickness is invalid for non-standard heating exposures. The concepts of constant ZSL thickness and reduced cross-section analysis proved inadequate for accurately predicting the structural behaviour or fire resistance of CLT beams under the tested conditions. Although earlier studies by Schaffer et al. [24] had identified the limitations of the 7 mm ZSL thickness, this research was the first to experimentally demonstrate the shortcomings of the reduced cross-section method outlined in Eurocode 5, EN 1995-1-2 [11] in capturing the relevant physical phenomena during non-standard fire scenarios. The findings highlight the need to replace the ZSL concept with more detailed thermo-mechanical cross-sectional analyses that properly account for the structural effects of real fire exposures. The authors recommend discarding the ZSL approach and developing new methodologies for predicting the structural fire response of CLT elements. Once validated, such approaches could provide more realistic and reliable fire safety designs.
Figure 10.
Photos of the representative CLT sample after testing(a) [62].
Xing et al. [63] investigated the fire resistance and ZSL thickness of CLT floor elements to address research gaps regarding ZSL variability, charred layer shedding, and the influence of natural versus standard fire conditions. Six CLT floor specimens measuring 3400 mm × 420 mm × 105 mm were tested, with an exposed fire area of approximately 3000 mm × 380 mm and one face exposed to fire. The specimens comprised three-ply (3 × 35 mm) and five-ply (5 × 21 mm) configurations bonded with a one-component polyurethane adhesive, which tends to weaken under high temperatures and promote charred layer fall-off. The panels were fabricated from spruce timber with an average density of 580 kg/m3 and moisture content of 12%. Fire resistance tests were performed under both ISO 834 standard fire and natural fire curves with load ratios of 10%, 20%, and 30%. The mean charring rate under ISO 834 [65] fire exposure was 0.69 mm/min, slightly higher than the 0.65 mm/min specified by Eurocode 5, EN 1995-1-2 [11], whereas under natural fire, the rate exceeded 1.0 mm/min due to faster heating and higher peak temperatures. The ZSL thickness ranged from 5 to 34 mm, depending on lamella configuration, fire type, and char layer shedding, contrasting with the constant 7 mm or 0.2 × charring depth assumptions in international codes. The results indicated that the five-ply specimens experienced more pronounced layer shedding and greater ZSL variation than three-ply specimens, attributed to the PUR adhesive’s thermal softening. Numerical simulations using Abaqus accurately replicated the observed charring behaviour and validated a new theoretical model for ZSL evolution. The study concluded that applying constant ZSL or charring rates in design codes may underestimate risk for CLT exposed to natural fires. It recommended developing time-dependent predictive models incorporating adhesive degradation, heat transfer, and residual strength loss to enhance fire-resilient design of mass timber structures.
Bai et al. [64] investigated the scaling effects on the fire resistance of CLT floors to address gaps in understanding size-dependent charring behaviour, ZSL development, and residual thermo-mechanical performance under standard fire exposure. Six CLT floor specimens were tested (F11, F23, F12 without load; R11, R23, R12 under 30% load) at three geometric scales: full-scale 3400 mm × 420 mm × 105 mm, 2:3 scale 2267 mm × 280 mm × 70 mm, and 1:2 scale 1700 mm × 210 mm × 53 mm. Each specimen had one face exposed to fire, with the exposed region corresponding to the middle one-third of the span. All were five-ply CLT floor elements constructed from spruce-pine-fir and bonded with a one-component polyurethane (PUR) adhesive, having an average density of 416.9 kg/m3 and moisture content of 11.8%. The specimens were subjected to the ISO 834 standard fire curve [65] for up to 120 min. Results showed that the mean charring rates for F11, F23, and F12 were approximately 0.63, 0.86, and 1.10 mm/min, respectively, with smaller specimens exhibiting faster charring due to reduced thermal inertia. The ZSL thickness ranged between 6 and 25 mm, influenced by scale, adhesive degradation, and exposure time, contradicting the constant 7 mm assumption in Eurocode 5, EN 1995-1-2 [11] and ANSI/APA PRG 320 [58]. Loaded specimens (R11, R23, R12) achieved fire resistance times of 39 min, 19 min, and 11 min, with mid-span deflections of 77 mm, 56 mm, and 48 mm, and retained approximately 20 to 25% of their initial stiffness after exposure. The study concluded that scale effects and adhesive behaviour critically influenced charring, ZSL formation, and residual stiffness, while existing code-based models underestimated these effects. It recommended developing scale-adjusted, time-dependent predictive models incorporating adhesive deterioration and temperature-dependent stiffness loss to improve the fire design of mass timber floors.
3.2. Discussion and Key Insights from the Literature Review
Experimental investigations on Glulam and CLT elements reveal distinct behavioural characteristics under fire exposure. For Glulam, experimental findings generally validate the steady-state charring and residual strength assumptions adopted in international fire design standards. Darmon & Lalu [59] reported an experimental charring rate of 0.566 mm/min, lower than both the analytically predicted 0.75 mm/min and the 0.7 mm/min value specified in Eurocode 5, EN 1995-1-2 [11], suggesting that the prescribed design rate may be slightly conservative. However, their results also indicated that the ZSL exceeded the standard 7 mm assumption, implying that the Eurocode 5, EN 1995-1-2 [11] approach may be non-conservative for residual strength assessment. Similarly, Fahrni et al. [60] observed mean charring rates ranging from 0.63 to 0.72 mm/min and an average ZSL thickness of 6.4 mm, in close agreement with the code-based assumption. Complementary tests by Navaratnam et al. [61] yielded comparable charring rates of 0.70–0.71 mm/min, with loaded GLT beams retaining 22% of their initial flexural stiffness after 120 min of ISO 834 [65] exposure.
In contrast, CLT elements exhibit more complex fire behaviour due to cross-laminated layering and adhesive-dependent delamination. Lineham et al. [62] demonstrated that the constant 7 mm ZSL assumption is invalid under non-standard heating, as delamination and char fall-off caused greater variability in residual cross-sectional loss. Xing et al. [63] reported mean charring rates of 0.69 mm/min under ISO 834 [65] exposure and over 1.0 mm/min under natural fire conditions, with ZSL thicknesses ranging from 5 to 34 mm, influenced by lamella configuration and adhesive softening. Similarly, Bai et al. [64] identified scale-dependent charring behaviour, with mean rates increasing from 0.63 mm/min for full-scale to 1.10 mm/min for small-scale specimens, and ZSL values between 6 and 25 mm. Loaded CLT floors retained only 20–25% of their initial stiffness, underscoring the combined effects of geometric scaling, adhesive degradation, and heat-induced stiffness reduction.
Overall, the reviewed studies confirm that while Glulam behaviour aligns closely with current code predictions, CLT performance diverges significantly due to material heterogeneity and interface-driven thermal failure mechanisms. Adhesive degradation and delamination remain the dominant contributors to accelerated charring and reduced post-fire stiffness [63,64]. The literature review consistently highlights the need for time-dependent and scale-adjusted predictive models that incorporate adhesive thermal resistance, layer separation, and variable ZSL evolution. These insights form the foundation for the present study, which systematically benchmarks Glulam and CLT experimental results against international design standards to evaluate their predictive accuracy and practical implications for fire-resilient mass timber design.
4. Comparative Analysis of Fire Performance Parameters of Glulam and CLT Elements
This section provides a comprehensive analysis of the fire testing data for Glulam and CLT elements presented in Section 3 and compares the experimental findings with the predictions derived from the international design codes and standards discussed in Section 2. The comparison focuses on key performance parameters, including charring rate, effective charring depth, ZSL thickness, and the residual mechanical properties such as strength and stiffness after exposure to standard fire conditions. The aim of this assessment is to determine the accuracy and consistency of various code-based models in predicting the thermal and mechanical degradation behaviour of mass timber members, while identifying areas where these models may be overly conservative. Results for each performance parameter are examined in Section 4.1, Section 4.2, Section 4.3, Section 4.4 and Section 4.5.
4.1. Charring Rate
Figure 11 and Figure 12 presented a comprehensive evaluation of the charring rates of Glulam and CLT elements under standard fire exposure. The experimental results for Glulam and CLT elements presented in Section 3 were compared with predictions from internationally recognised standards, including Eurocode 5, EN 1995-1-2 [11] (EC5), Australia and New Zealand [22] (AS/NZS 1720.4), the Swedish Handbook [42,51,52] (Swedish), the American Wood Council [54] (AWC TR10), and Canada [21] (CSA O86). The abbreviations provided in parentheses are consistently used in the figures, graphs, and comparisons throughout this research to ensure clarity and uniform reference to each standard.
Figure 11.
Comparison of Glulam beam charring rate: Experimental test data vs. international codes/standards: (a) Charring rate of individual test samples TS-01 to TS-09; (b) Normalised charring rate of individual test samples; (c) Mean of normalised charring rate; (d) Standard deviation of normalised charring rate. Normalised values are referenced to experimental test data.
Figure 12.
Comparison of CLT beam/floor charring rate: Experimental test data vs. international codes/standards: (a) Charring rate of individual test samples TS-10 to TS-17; (b) Charring rate of individual test samples TS-18 to TS-23; (c) Charring rate of individual test samples TS-24 to TS-29; (d) Mean of normalised charring rate; (e) Standard deviation of normalised charring rate. Normalised values are referenced to experimental test data.
Figure 11 comprised four subplots: (a) charring rate of individual test samples, (b) normalised charring rate of individual samples, (c) mean of normalised charring rates, and (d) standard deviation of normalised charring rates. In Figure 11a, the charring rates of individual Glulam beam test samples demonstrated that the experimental data remained relatively consistent across all test samples. Most of the international standards produced charring rate predictions relatively close to the measured data (typically within about ≤10–20%), with minor deviations (generally in the ~10–20% band). However, the AS/NZS 1720.4 [22] standard consistently predicted higher charring rates than both the experimental results and other standards, indicating a conservative bias of roughly ≥20% on average. Conversely, Eurocode 5, EN 1995-1-2 [11] (both EC5 (SM) and EC5 (ACM)), Swedish [42,51,52], and CSA O86 [21] standards exhibited close agreement (clustered within ±10% of tests across datasets). The AWC TR10 [54] performed moderately, with underestimations typically in the 10–20% range across the test results. The normalised charring rates, shown in Figure 11b, provided a clearer comparison by expressing each standard’s predictions relative to the experimental measurements. Most standards clustered around a normalised value near unity, signifying good correspondence (≈≤10–20%) with the test data. Figure 11c summarised the mean of normalised charring rates for each dataset. The mean values for EC5 (SM), EC5 (ACM), Swedish, AWC TR10, and CSA O86 remained close to 1.0 (generally within ±10%), further substantiating their compatibility with the measured data. By contrast, AS/NZS 1720.4 exhibited normalised values predominantly greater than 1.2, confirming its tendency to overestimate charring behaviour. The variability of the normalised charring rate predictions is depicted in Figure 11d through the standard deviation. The experimental data, together with EC5 (SM), Swedish, and CSA O86, exhibited low standard deviations (below 10%), suggesting reliable and consistent performance. The EC5 (ACM) model showed moderate predictive deviation exceeding 15%. Conversely, AS/NZS 1720.4 exhibited a markedly higher standard deviation of nearly 25%, together with a mean normalised value above 1.2, indicating greater variability and reduced predictive reliability.
Figure 12 consists of five subplots. Figure 12a–c illustrate the individual charring rates of the CLT elements, while Figure 12d,e depict the mean and standard deviation of the normalised charring rates, respectively. The charring rates of the CLT elements were determined using three available standards: Swedish, AWC TR10, and CSA O86, as the charring rates for CLT elements are not yet incorporated in Eurocode 5, EN 1995-1-2 or AS/NZS 1720.4. As shown in Figure 12a–c, all three standards exhibited noticeable discrepancies in charring rates of individual CLT samples when compared with the corresponding experimental test data. Both underestimation and overestimation of charring rates were observed across the datasets from Lineham et al. [62] (maximum overestimation of 60%), Xing et al. [63] (minimum underestimation of 55%), and Bai et al. [63] (ranging from +27% to −54%). This inconsistency indicates that none of the existing standards provided a fully reliable prediction for the charring behaviour of CLT elements under standard fire exposure. The observed variation can be attributed to the complex thermo-physical properties of CLT, including adhesive bond line performance, layer orientation, and delamination tendencies, which significantly affect the progression of the char front and heat transfer mechanisms through the panel thickness. Although the mean normalised charring rate presented in Figure 12d appears close to unity (within ±10%), suggesting apparent agreement between predicted and measured values, this mean value is somewhat misleading. When considered alongside the individual test results, it becomes evident that the mean conceals substantial variability among the predictions. This observation is further confirmed by the standard deviation data shown in Figure 12e, where all standards demonstrated deviations exceeding 30%. Such high variability indicates limited predictive precision and poor repeatability when modelling CLT charring rates using current design codes. The greater variability in CLT compared with Glulam is consistent with previous research [29], which reported that adhesive interfaces and cross-laminated layer configurations can promote char detachment and increase localised heat penetration, thereby accelerating the effective charring rate in some regions.
Beyond their influence on effective charring depth, CLT layer interfaces fundamentally alter the governing heat transfer mechanisms during fire exposure. Once the advancing pyrolysis front reaches an adhesive bond line, temperature-dependent degradation of the adhesive reduces inter-laminar shear and tensile strength, increasing the likelihood of partial or full delamination. This intermittently removes the insulating char layer, locally increases heat flux to newly exposed timber, and accelerates the progression of the char front beyond that assumed in one-dimensional charring models. Existing design codes largely idealise CLT as a layered but thermally continuous system; consequently, they do not explicitly capture adhesive softening, intermittent char fall-off, or the coupling between thermal degradation and mechanical response, which explains the increased scatter and bias observed in the CLT datasets [7,30,66,67].
The experimental datasets synthesised in this study originate from multiple testing programs that employed different timber density, loading ratio, fire exposed area, fire exposure duration, number of CLT layers, lamella thickness, adhesive type, and the fire curve. These variations inevitably influence measured charring rates and residual capacity through differences in thermal inertia, permeability, cracking behaviour, and boundary conditions. The following subsections synthesise the figure-based comparisons for Glulam and CLT, using normalised values with respect to the corresponding experimental test data, and evaluate trends using grouped parameter bins rather than absolute values.
4.1.1. Timber Density
Density is commonly adopted as a proxy for thermal inertia and permeability under ISO-type heating. For homogeneous or laminated softwood members, several studies report modest reductions in one-dimensional charring rate with increasing density, whereas layered systems may not exhibit a clear monotonic trend because interlayer interfaces govern heat transfer and char loss [13,14,19]. In CLT, adhesive performance and glue-line reach are frequently the controlling mechanisms, as reflected in engineering guidance and experimental programmes addressing delamination behaviour [42].
Figure 13a–d present normalised charring rate as a function of timber density bins for the experimental datasets examined in this study. Across the Glulam datasets in Figure 13a, for density bins below 450 kg/m3, the mean normalised charring rates predicted by all codes were close to unity (within ±8%), with the exception of AS/NZS 1720.4, which significantly overpredicted (close to 30%) charring rates at lower densities. This overestimation was identified as the primary contributor to the conservative Glulam predictions reported earlier in Figure 11. For density bins above 450 kg/m3, all codes predicted normalised values within ±10%, except EC5 (ACM) and AWC TR10, which underestimated charring rates by approximately 20%.
Figure 13.
Charring rate vs. timber density: (a) Mean of normalised charring rate of Glulam beam; (b) Standard deviation of normalised charring rate of Glulam beam; (c) Mean of normalised charring rate of CLT beam/floor; (d) Standard deviation of normalised charring rate of CLT beam/floor. All charring rate values are normalised with respect to the corresponding experimental test data.
The corresponding standard deviations shown in Figure 13b for Glulam datasets were within 15% for density bins below 450 kg/m3, again with the exception of AS/NZS 1720.4, which exhibited a standard deviation of approximately 27%. For density bins above 450 kg/m3, standard deviations for all codes were within 8%. These bin-wise differences are consistent with ISO-based evidence indicating that timber species and density produce relatively small but measurable variations in charring rate for solid and glue-laminated members [13,14,15,19].
For CLT elements with density bins below 450 kg/m3 (Figure 13c), the mean normalised charring rate predicted by AWC TR10 was close to unity (within 2%), whereas the Swedish and CSA O86 provisions underestimated the mean by approximately 20%. In contrast, for density bins above 450 kg/m3, the Swedish and CSA O86 provisions predicted mean normalised values within 5%, while AWC TR10 overestimated by approximately 20%. However, the standard deviation for CLT predictions (Figure 13d) was substantially larger than that for Glulam, reaching approximately 20% and 35% for the lower- and higher-density bins, respectively.
A modest contrast between bins was observed. The lower-density group (<450 kg/m3) exhibited slightly higher mean normalised charring rates (by approximately 3–8%) and higher standard deviations (by approximately 5–10% absolute) than the higher-density group. This suggests increased susceptibility to early glue-line reach and intermittent char shedding in lower-density lay-ups. The absence of a clear monotonic density trend supports the interpretation developed from the beam and floor tests reviewed in Section 3, namely that interface-controlled mechanisms, including adhesive softening, delamination, and layer fall-off, rather than bulk density, predominantly govern effective charring behaviour in CLT under ISO and faster heating regimes [29,30,62,63,64,66,68,69]. Further discussion of adhesive type, lamella count, and lamella thickness is provided in Section 4.1.5, Section 4.1.6 and Section 4.1.7.
4.1.2. Loading Ratio
Loading ratio primarily influences deformation and failure modes, whereas the progression of the pyrolysis front, and hence the charring rate, is governed predominantly by thermal conditions. Accordingly, simplified design models do not explicitly include load effects in the definition of charring rate. Nevertheless, sustained mechanical loading can influence crack development and increase result scatter, particularly for CLT systems with thermally sensitive interfaces [7,11,62].
Figure 14a–d illustrate normalised charring rates as a function of loading ratio bins for the experimental datasets reviewed in this study. For Glulam elements, all codes predicted mean normalised charring rates within ±5%, with the exception of EC5 (ACM), which underestimated by approximately 13%, and AS/NZS 1720.4, which overestimated by up to 50%.
Figure 14.
Charring rate vs. loading ratio: (a) Mean of normalised charring rate of Glulam beam; (b) Standard deviation of normalised charring rate of Glulam beam; (c) Mean of normalised charring rate of CLT beam/floor; (d) Standard deviation of normalised charring rate of CLT beam/floor. All charring rate values are normalised with respect to the corresponding experimental test data.
Standard deviations for all codes were below 10% for loading ratio bins greater than 15%. In contrast, for loading ratios below 15%, substantially higher standard deviations were observed, particularly for EC5 (ACM) at approximately 30% and AS/NZS 1720.4 at approximately 40%.
For CLT elements, the mean normalised charring rates predicted by all codes were within ±20% for loading ratios below 30%. However, for loading ratios exceeding 30%, the mean values were underestimated by approximately 30%. Similarly, the standard deviation increased to around 30% across all loading ratio bins, reflecting greater dispersion in the CLT datasets. This behaviour aligns with sustained-load fire tests in which crack opening and intermittent delamination increased the variability of effective section loss [54,62].
Overall, the results indicate that Glulam charring predictions remain comparatively stable across loading ratios for codes clustered near unity, including EC5 (SM), EC5 (ACM), Swedish, and CSA O86. In contrast, CLT elements exhibit increased scatter rather than a systematic shift in mean values, with higher variability at elevated load levels, reflecting the sensitivity of interlayer interfaces under combined thermal and mechanical actions [11,54,62].
4.1.3. Fire-Exposed Area
When multiple faces of a timber member are exposed to fire, the combined effects of corner rounding and surface fissuring are commonly represented through a notional charring rate, as adopted in EC5, to approximate multi-sided exposure under ISO conditions [11].
Figure 15a–d present normalised charring rates plotted against fire-exposed area ratio (defined as the ratio of fire-exposed surface area to total surface area) for the experimental datasets examined in this study. For Glulam elements, EC5 (SM), Swedish, and CSA O86 predictions remained tightly clustered around unity for both lower and higher exposure ratios, with mean normalised charring rates within ±5% and standard deviations below 15%. EC5 (ACM) and AWC TR10 exhibited similar variability (within ±15%), indicating that the notional approach reasonably captures multi-sided exposure scenarios such as three- and four-sided heating.
Figure 15.
Charring rate vs. fire-exposed area ratio: (a) Mean of normalised charring rate of Glulam beam; (b) Standard deviation of normalised charring rate of Glulam beam; (c) Mean of normalised charring rate of CLT beam/floor; (d) Standard deviation of normalised charring rate of CLT beam/floor. All charring rate values are normalised with respect to the corresponding experimental test data.
In contrast, AS/NZS 1720.4 produced consistently higher values at larger exposure ratios, with mean normalised charring rates of approximately 1.40 and standard deviations exceeding 35%. These trends are consistent with furnace tests of beams exposed on three sides, in which increased exposed perimeter led to greater section loss, while notional methods generally captured the change effectively [60].
For CLT elements, most code predictions overestimated the mean normalised charring rates by approximately 40% in the lower exposure bin (exposed area ratio < 20%), whereas in the higher exposure bin (exposed area ratio > 40%), the mean values were underestimated by approximately 20%. At the same time, the standard deviation increased to approximately 20–25% in the higher exposure bin, while remaining below 10% in the lower exposure bin. This pattern is consistent with the increased likelihood of glue-line reach and char fall-off as exposed area increases, intermittently revealing fresh wood surfaces. Compartment-scale observations similarly indicate that exposed CLT can sustain heating and contribute fuel when delamination occurs [29].
4.1.4. Fire Exposure Period
Under ISO 834 conditions, most design standards assume a near-constant charring rate for Glulam members. AWC TR10 incorporates a time exponent to represent early- and late-stage behaviour, whereas AS/NZS 1720.4 applies effective depth rules that may diverge from measured section loss at longer fire durations [11,21,22,54].
Figure 16a–d present normalised charring rates plotted against fire exposure period. For Glulam elements, all codes except AS/NZS 1720.4 predicted mean charring rates within ±10% for both short- and long-duration exposure bins. AS/NZS 1720.4 overestimated mean charring rates by approximately 15% for short durations and by approximately 30% for longer durations. Standard deviations were generally within 5% for short exposure periods but increased at longer durations, reaching approximately 25% for EC5 (ACM) and 35% for AS/NZS 1720.4.
Figure 16.
Charring rate vs. fire exposure period: (a) Mean of normalised charring rate of Glulam beam; (b) Standard deviation of normalised charring rate of Glulam beam; (c) Mean of normalised charring rate of CLT beam/floor; (d) Standard deviation of normalised charring rate of CLT beam/floor. All charring rate values are normalised with respect to the corresponding experimental test data.
For CLT elements, the largest scatter occurred during early exposure periods (less than 30 min), with mean charring rates underestimated by approximately 30–40%. This behaviour is attributed to early glue-line reach and potential delamination, which can accelerate effective section loss. Both the Swedish CLT handbook and AWC TR10 recognise increased early-stage layer loss, including potential doubling of the charring rate over the first approximately 25 mm where delamination is expected [42,54].
As fire exposure progressed through successive lamellae, the mean normalised charring rates for CLT often returned toward unity (within ±5%) for exposure periods between 30 and 60 min, before becoming overestimated by approximately 40% for exposure periods exceeding 60 min. However, variability remained high across all bins (approximately 25%), indicating that time-dependent behaviour in CLT reflects layer-by-layer interactions rather than a single stationary charring rate [11,21,22,42,54].
4.1.5. Number of CLT Layers
An increase in the number of CLT plies increases the number of interlayer interfaces and, consequently, the likelihood that a glue line will be reached at an earlier stage of fire exposure. Where heat-softening adhesives are used, this can promote delamination and increase scatter in effective charring behaviour, even when standards-based mean predictions remain close to test data [30,42,62,64,66].
Figure 17a,b groups the normalised charring rate data according to CLT ply count. Within these bins, the Swedish, AWC TR10, and CSA O86 provisions produced mean normalised charring rates within ±20% of unity, indicating that ply count did not produce a systematic shift in average charring rates. Instead, the principal effect was an increase in dispersion, with standard deviations approaching 35% in both ply-count bins. Because none of the examined standards explicitly incorporates ply count as a parameter, differences are manifested primarily as increased scatter rather than changes in the mean prediction [30,42,62,64,66].
Figure 17.
Charring rate vs. number of CLT layers: (a) Mean of normalised charring rate of CLT beam/floor; (b) Standard deviation of normalised charring rate of CLT beam/floor. All charring rate values are normalised with respect to the corresponding experimental test data.
4.1.6. CLT Lamella Thickness
CLT lamella thickness governs the time required for the char front to reach the first glue line. Design guidance that explicitly accounts for glue-line reach or early-layer effects is therefore sensitive to this parameter. The Swedish CLT guidance permits doubling of the charring rate over the first approximately 25 mm where delamination is likely, while AWC TR10 incorporates a thickness-dependent relationship and an effective char depth factor [42,54].
Figure 18a,b stratifies the normalised charring rate data by CLT layer thickness. Thinner lamella groups exhibited mean normalised charring rates elevated by approximately 40%, with standard deviations near 15%. Medium and thicker lamella groups were closer to unity, albeit with higher standard deviations of approximately 35%. These trends are consistent with scaling tests reporting charring rates of approximately 1.10 mm/min under ISO exposure for thin lamella surrogates, compared with approximately 0.63 mm/min for full-scale specimens from the same test programme [64].
Figure 18.
Charring rate vs. CLT layer thickness: (a) Mean of normalised charring rate of CLT beam/floor; (b) Standard deviation of normalised charring rate of CLT beam/floor. All charring rate values are normalised with respect to the corresponding experimental test data.
Among the standards, AWC TR10 most clearly captured thickness sensitivity, while the Swedish and CSA O86 provisions maintained mean normalised charring rates near unity for the thickest lamella groups but shared the increase in variability for thinner lamellae [42,54,64].
4.1.7. Type of Adhesive in CLT
Adhesive thermal resistance plays a critical role in CLT fire performance, as it governs whether lamellae remain bonded or delaminate under elevated temperatures. Design guidance commonly distinguishes between non-delaminating systems (e.g., MUF and PRF) and heat-softening systems (e.g., PUR), the latter being associated with layer fall-off and renewed exposure of fresh wood surfaces during fire exposure [30,42,69].
Experimental and material characterisation studies show that commonly used structural adhesives exhibit markedly different thermal degradation thresholds. Heat-softening adhesives such as 1C-PUR can experience significant reductions in bond strength at temperatures as low as 80–120 °C, leading to progressive loss of inter-laminar shear capacity well before the surrounding timber undergoes pyrolysis [30,67]. In contrast, thermosetting adhesives such as MUF and PRF retain a substantial proportion of their bond strength up to approximately 200–250 °C, thereby delaying or preventing delamination [66,67]. These differences directly influence the timing and extent of layer fall-off and the stability of the insulating char layer.
Figure 19a,b compares normalised charring rates for CLT elements grouped by adhesive type. For CLT panels bonded with MUF adhesives, all design codes overestimated the mean normalised charring rate, with the largest overprediction (approximately 40%) observed for AWC TR10, while standard deviations remained below 10% across all codes. In contrast, for CLT panels bonded with 1C-PUR adhesives, mean normalised charring rates were underestimated by approximately 20%, accompanied by significantly higher variability, with standard deviations approaching 25%.
Figure 19.
Charring rate vs. type of adhesive: (a) Mean of normalised charring rate of CLT beam/floor; (b) Standard deviation of normalised charring rate of CLT beam/floor. All charring rate values are normalised with respect to the corresponding experimental test data.
These results indicate that CLT panels manufactured with thermosetting adhesives exhibit limited or no delamination, resulting in conservative charring rate predictions, whereas panels bonded with heat-softening adhesives experience earlier and more frequent delamination, leading to underestimation of effective charring rates. Similar trends have been reported in [70], where CLT panels bonded with PRF and MUF adhesives demonstrated lower susceptibility to delamination than those manufactured using PUR and EPI adhesives. Overall, the findings confirm that adhesive type is a first-order parameter influencing both the magnitude and variability of charring behaviour. Current design codes do not explicitly account for temperature-dependent adhesive degradation or inter-layer bond strength loss, instead implicitly averaging adhesive effects within prescribed charring rates, which contributes to systematic bias for heat-softening adhesive systems [7,66].
4.1.8. Fire Curve
Heating histories characterised by faster early temperature growth and higher initial heat flux, such as natural fire curves with rapid pre-flashover development, can increase charring rates relative to ISO 834 conditions. This effect is particularly significant for CLT elements, where earlier glue-line reach and delamination dominate effective section loss [12,63].
Figure 20a,b compare CLT normalised charring rates for standard fire exposure (ISO 834) and natural fire curves. Under standard fire conditions, all codes overestimated the mean normalised charring rates, with the highest overprediction (approximately 20%) observed for AWC TR10. The corresponding standard deviation under standard fire conditions was approximately 30% for all codes.
Figure 20.
Charring rate vs. fire curve: (a) Mean of normalised charring rate of CLT beam/floor; (b) Standard deviation of normalised charring rate of CLT beam/floor. All charring rate values are normalised with respect to the corresponding experimental test data.
In contrast, under natural fire exposure, the mean normalised charring rates were underestimated by approximately 40%, while standard deviations reduced to approximately 10%. These results demonstrate that CLT panels exposed to natural fire curves with rapid temperature rise and higher peak temperatures experience higher effective charring rates that are not fully captured by the Swedish, AWC TR10, and CSA O86 provisions.
The comparison between standard and natural fire exposures highlights a fundamental limitation of existing charring-based design provisions, which are predominantly calibrated against ISO 834 furnace tests [7,66]. Under natural fire curves characterised by rapid temperature rise and higher early heat flux, CLT elements exhibit earlier glue-line reach, increased delamination frequency, and higher effective charring rates than predicted by current models [30,64,67,71,72]. While these codes remain suitable for prescriptive design under standard fire assumptions, their direct application to non-standard fire scenarios may be non-conservative for CLT systems unless additional safety factors or project-specific fire modelling are employed [64,71,72,73].
4.2. Effective Charring Depth
Figure 21 and Figure 22 illustrate the comparison of effective charring depth between experimental test data and predictions from several international design standards. The effective charring depth represents the combined thickness of the charred layer and the adjacent ZSL, signifying the depth to which timber loses its structural capacity under fire exposure [33]. This parameter is fundamental in determining the residual cross-section and assessing the post-fire load-bearing capacity of Glulam and CLT elements.
Figure 21.
Comparison of Glulam beam effective charring depth: Experimental test data vs. international codes/standards: (a) Effective charring depth of individual test sample TS-01 to TS-09; (b) Normalised effective charring depth of individual test samples; (c) Mean of normalised effective charring depth; (d) Standard deviation of normalised effective charring depth. Normalised values are referenced to experimental test data.
Figure 22.
Comparison of CLT beam/floor effective charring depth: Experimental test data vs. international codes/standards: (a) Effective charring depth of individual test samples TS-10 to TS-17; (b) Effective charring depth of individual test samples TS-18 to TS-23; (c) Effective charring depth of individual test samples TS-24 to TS-29; (d) Mean of normalised effective charring depth; (e) Standard deviation of normalised effective charring depth. Normalised values are referenced to experimental test data.
In Figure 21a, the effective charring depth for Glulam beams exhibited substantial variation across the test series, with measured values typically ranging between 30 mm and 90 mm, depending on exposure duration and specimen configuration. The test data showed a consistent increase in charring depth with prolonged fire exposure. In contrast, the effective charring depth of individual Glulam beam test samples predicted from all international standards demonstrated that the experimental data remained relatively consistent across all test samples with minor deviations (≈10–20% on average) except AS/NZS 1170.4, which showed higher deviations (maximum up to 210%).
Figure 21b,c present the normalised effective charring depth and the corresponding mean values, respectively. The normalised data indicated that most codes yielded predictions within ±20% of the reference data, suggesting reasonable global agreement. However, AS/NZS 1720.4 consistently produced mean values around 1.4, signifying an overestimation of approximately 40% compared with the normalised reference depth. The overprediction from AS/NZS 1720.4 was consistent with previous observations in charring rate results. Conversely, EC5 (ACM) showed the least variability, remaining within 2%, while EC5 (SM), Swedish, AWC TR10, and CSA O86 exhibited moderate variability of up to 16%.
The standard deviation results illustrated in Figure 21d confirmed this pattern of variability. All standards, except AS/NZS 1720.4, exhibited deviations within 10%, while EC5 (ACM) and AS/NZS 1720.4 displayed higher deviations of around 20% and 30%, respectively. This inconsistency aligned with its overestimation trends in charring rate (Figure 11), demonstrating that the simplified treatment of thermal degradation and charring front progression in AS/NZS 1720.4 limited its reliability for performance-based fire design.
Figure 22 extends the analysis to CLT beam and floor elements. Figure 22a–c show that the effective charring depth of CLT exhibited wider variation than Glulam, with experimental results ranging between 25 mm and 90 mm depending on panel thickness and lamella configuration. The codes again produced consistent but slightly overestimated predictions relative to the experimental data. As shown in Figure 22d, the mean normalised effective charring depth for all standards ranged from 1.3 to 1.4, comparable to those for Glulam. However, Figure 22e reveals that the standard deviation for CLT was substantially higher, ranging from 30% to 40%, nearly double the variability observed for Glulam.
This elevated variability for CLT was primarily attributed to its layered construction and the complex interaction between lamella orientation, adhesive degradation, and heat transfer. Previous studies [29] reported that adhesive failure and delamination under elevated temperatures caused premature exposure of inner layers, resulting in irregular char formation and increased scatter in effective depth measurements. The inability of current codes to explicitly account for these phenomena contributed to their inconsistent predictions.
Overall, the results demonstrated that while most codes provided reasonable predictions for Glulam within ±20% of reference values, AS/NZS 1720.4 continued to overestimate effective charring depth due to its oversimplified treatment of thermal degradation. For CLT, all codes yielded mean values between 1.3 and 1.4, similarly to Glulam, but exhibited considerably higher variability due to the structural heterogeneity of CLT panels and the sensitivity of adhesives to thermal exposure. These findings underscore the necessity for refined material-specific models that incorporate adhesive performance and layer configuration to improve predictive accuracy for modern mass timber systems.
4.3. Zero-Strength Layer (ZSL) Thickness
Figure 23 and Figure 24 illustrate the comparison of ZSL thickness between experimental test data and predictions from various international codes and standards. The ZSL represents the depth of timber immediately behind the char front that has lost all effective strength due to thermal degradation and is excluded from the residual load-bearing section in fire design [10]. Accurately estimating this layer is essential for determining the residual capacity of timber elements after prolonged fire exposure.
Figure 23.
Comparison of Glulam beam ZSL thickness: Experimental test data vs. international codes/standards: (a) ZSL thickness of individual test samples TS-01 to TS-09; (b) Normalised ZSL thickness of individual test samples; (c) Mean of normalised ZSL thickness; (d) Standard deviation of normalised ZSL thickness. Normalised values are referenced to a constant reference thickness of 7 mm for consistency across different codes and datasets.
Figure 24.
Comparison of CLT beam/floor ZSL thickness: Experimental test data vs. international codes/standards: (a) ZSL thickness of individual test samples TS-10 to TS-17; (b) ZSL thickness of individual test samples TS-18 to TS-23; (c) ZSL thickness of individual test samples TS-24 to TS-29; (d) Mean of normalised ZSL thickness; (e) Standard deviation of normalised ZSL thickness. Normalised values are referenced to a constant reference thickness of 7 mm for consistency across different codes and datasets.
Figure 23 shows that the ZSL thickness for Glulam beams ranged between approximately 2 mm and 12 mm, while the data were normalised to a constant reference thickness of 7 mm for consistency across different codes and datasets. The resulting distribution of normalised ZSL thicknesses is depicted in Figure 23b. Figure 23c shows that the mean of the normalised ZSL thickness values for EC5 (SM), AS/NZS 1720.4, Swedish, and CSA O86 remained near unity. This result was expected, as all four codes/standards specified a constant ZSL thickness of typically 7 mm, irrespective of the timber species, density, or exposure duration. Consequently, the corresponding standard deviation, as shown in Figure 23d, was effectively zero for these codes/standards.
In contrast, the AWC TR10 defined ZSL thickness as 20% of the charring depth, producing values that varied with the measured charring rate. When normalised to 7 mm, AWC TR10 overestimated the mean value by approximately 20% and exhibited a standard deviation roughly 40% higher than the other codes. This increased variability arose from the proportional relationship between ZSL and the charring rate, which amplified prediction scatter when experimental charring behaviour fluctuated between tests. The AWC TR10 approach therefore yielded a more conservative but less consistent estimate of ZSL thickness.
It is important to note that all ZSL data in Figure 23 were normalised to 7 mm rather than to the experimental test data themselves, as many fire tests did not explicitly report measured ZSL values. Hence, the calculated means and standard deviations reflected normalised theoretical predictions rather than direct test comparisons. Overall, the Glulam results suggested that the constant ZSL assumption adopted by most standards provided a practical and conservative design simplification, with AWC TR10 being slightly more conservative (≈+20% mean; SD ≈ +40% vs. others) due to its proportional formulation.
Figure 24a–c illustrate the ZSL thickness for CLT beam and floor elements that varied substantially, ranging from approximately 6 mm to 44 mm, again normalised to a 7 mm baseline. The corresponding Figure 24d–e show that all international codes/standards underpredicted the ZSL thickness when compared to the experimental results. The mean ZSL derived from the test data was approximately 2.5 times the 7 mm reference value, while the standard deviation exceeded 140%, indicating substantial variability. Among the codes, AWC TR10 and CSA O86 produced mean normalised values closest to unity (within ±3% of the 7 mm reference ZSL thickness), whereas Swedish showed a larger mean normalised ZSL (37% above the 7 mm reference ZSL thickness). AWC TR10 displayed a standard deviation exceeding 50%, indicating substantial dispersion, compared with 26% and 9% for Swedish and CSA O86, respectively. These results highlighted that current code formulations, originally derived from Glulam or solid timber data assuming a 7 mm ZSL thickness, did not fully capture the complex thermal behaviour of CLT elements in fire conditions.
These investigations demonstrated that CLT fire performance is strongly influenced by construction configuration and material interfaces rather than solely by bulk density. The number of lamellae, their thickness, and the adhesive bond lines played a critical role in determining char progression. The alternating grain direction reduced heat conduction perpendicular to the lamellae but enhanced it along the bond lines, further contributing to the scatter in measured ZSL values. The combination of adhesive performance, lamella geometry, and delamination risk explained the broad range of experimental results seen in Figure 24.
In summary, the mean ZSL thickness for Glulam averaged approximately 7 mm across codes, demonstrating a relatively stable and predictable response, whereas CLT displayed significantly higher mean values and markedly greater variability. The results confirmed that the constant ZSL assumption, while adequate for Glulam, was not appropriate for CLT design, where structural layering and adhesive characteristics played dominant roles. Consequently, the results suggested that future design codes should incorporate parameters for lamella count, bond-line type, and delamination potential when defining ZSL for CLT systems to improve fire-resistance prediction accuracy.
4.4. Residual Strength
Figure 25 and Figure 26 illustrate the comparison of residual strength between experimental test data and predictions from international codes and standards. The residual strength represents the proportion of load-bearing capacity retained by timber members after fire exposure, accounting for charring, thermal degradation, and the formation of the ZSL. In this study, only bending strength was considered, as it provided the most direct measure of structural performance degradation under fire exposure. It served as a critical parameter for assessing post-fire structural integrity and ensuring reliable performance-based design of mass timber systems. Accurate estimation of residual strength was therefore essential to predict the residual capacity of structural timber elements following prolonged fire exposure [10,33].
Figure 25.
Comparison of Glulam beam residual strength: Experimental test data vs. international codes/standards: (a) Residual strength of individual test samples TS-01 to TS-09; (b) Normalised residual strength of individual test samples; (c) Mean of normalised residual strength; (d) Standard deviation of normalised residual strength. Normalised values are referenced to experimental test data.
Figure 26.
Comparison of CLT beam/floor residual strength: Experimental test data vs. international codes/standards: (a) Residual strength of individual test samples TS-10 to TS-17; (b) Residual strength of individual test samples TS-18 to TS-23; (c) Residual strength of individual test samples TS-24 to TS-29; (d) Mean of normalised residual strength; (e) Standard deviation of normalised residual strength. Normalised values are referenced to experimental test data.
Figure 25 compares the residual strength of Glulam beams derived from experimental results with predictions from EC5 (SM), EC5 (RCM), EC5 (ACM), AS/NZS 1720.4, Swedish, AWC TR10, and CSA O86. In Figure 25a, the individual test results show residual strengths between approximately 20% and 40%, with moderate variability across test conditions. Most standards produced values comparable to experimental data, suggesting that their predictive models provided reasonable estimations of post-fire performance. However, AS/NZS 1720.4 consistently predicted lower residual strengths than the experimental results, indicating a conservative bias (typically normalised values < 0.7, i.e., ≳30% lower than tests). This reflected its assumption of greater charring depths and thicker ZSL values, as observed in Figure 11 and Figure 23.
The normalised residual strength data presented in Figure 25b,c show that most standards clustered near unity, indicating a strong correlation with the experimental findings and consistent predictive capability (generally within about ±10–20%). In contrast, AS/NZS 1720.4 results were predominantly below 0.7, reaffirming its tendency to underestimate residual strength. This underprediction was consistent with its previously observed overestimation of charring rate and ZSL thickness, both of which reduced the effective load-bearing cross-section. Eurocode 5 (RCM and RPM), Swedish, AWC TR10, and CSA O86 maintained mean values close to unity (generally within about ±10%), demonstrating reliable and balanced performance across all test datasets. Eurocode 5 (ACM) marginally overestimated the mean value, exceeding 1.2, indicating a less conservative but still acceptable prediction of residual strength. Overall, the combined mean and individual normalised data confirmed that most international standards provided consistent estimations of post-fire residual strength, with the exception of AS/NZS 1720.4, which remained distinctly conservative.
The standard deviation results in Figure 25d indicate low variability (close to 20%) for most standards, reflecting stable predictions. AS/NZS 1720.4 again exhibited slightly greater dispersion (often approaching ≈ 20%), consistent with its rigid yet overly conservative approach. The combined influence of higher charring rate and thicker ZSL assumptions explained its lower and more inconsistent strength predictions. Overall, Glulam residual strength predictions generally aligned well with experimental data, except for AS/NZS 1720.4, which remained conservative.
Figure 26 presents similar comparisons for CLT beams and floor panels. Figure 26a–c illustrate residual strengths from various studies, showing extensive scattered data ranging from 10% to 70% depending on lamella configuration, adhesive performance, and degree of delamination. Compared to Glulam, CLT results were far more variable due to complex interlaminar heat transfer, adhesive degradation, and partial delamination between layers. These phenomena reduced structural integrity irregularly, making consistent strength prediction difficult [33].
Figure 26d shows that Swedish, AWC TR10, and CSA O86 standards all overestimated the mean residual strength when compared with the normalised reference data. The mean normalised residual strength values were approximately 1.45 for Swedish, 1.36 for AWC TR10, and 1.61 for CSA O86, indicating a consistent tendency among these standards to predict higher residual capacities for CLT elements. This overestimation suggested that current code formulations did not fully capture the complex degradation mechanisms within CLT assemblies, particularly those related to interlaminar charring and adhesive debonding. The corresponding standard deviation results, illustrated in Figure 26e, approached 100% for all standards, highlighting the substantial variability of predictions compared with Glulam outcomes. This pronounced inconsistency was primarily attributed to the heterogeneous structure of CLT panels, where variations in lamella orientation, adhesive performance, and the number of layers significantly influenced char formation and residual strength. Such factors introduced a level of uncertainty that is not present in more homogeneous Glulam elements. Consequently, despite some standards producing mean values close to unity when averaged across datasets, the overall variability remained considerable, underscoring the need for refined modelling approaches that incorporate lamella configuration and adhesive performance in predicting the residual strength of CLT elements under fire conditions.
Overall, the residual strength of Glulam beams correlated well with experimental findings. EC5, Swedish, AWC TR10, and CSA O86 standards produced accurate and stable estimates (typically with mean value within approximately ±10–20% and standard deviation around 20%), while AS/NZS 1720.4 exhibited greater strength degradation (mean value ≳30% and standard deviation around 20%) due to its conservative fire design assumptions. For CLT, all codes showed significant variation in both mean and standard deviation (mean ≳60% and standard deviation around 100%), highlighting ongoing uncertainty in modelling residual strength under fire. The greater scatter in CLT results reflected its layered composition, adhesive degradation, and interlaminar charring behaviour, underscoring the need for improved models that account for delamination and lamella configuration in future fire design standards.
4.5. Residual Stiffness
Figure 27 and Figure 28 illustrate the comparison of residual stiffness between experimental test data and predictions from various international codes and standards. The residual stiffness represents the proportion of the member’s bending stiffness retained after fire exposure, accounting for thermal degradation, charring, and the formation of a ZSL. In this study, only bending stiffness was considered, as it provided a direct measure of the member’s deformation response under post-fire loading.
Figure 27.
Comparison of Glulam beam residual stiffness: Experimental test data vs. international codes/standards: (a) Residual stiffness of individual test samples TS-01 to TS-09; (b) Normalised residual stiffness of individual test samples; (c) Mean of normalised residual stiffness; (d) Standard deviation of normalised residual stiffness. Normalised values are referenced to experimental test data.
Figure 28.
Comparison of CLT beam/floor residual stiffness: Experimental test data vs. international codes/standards: (a) Residual stiffness of individual test samples TS-10 to TS-17; (b) Residual stiffness of individual test samples TS-18 to TS-23; (c) Residual stiffness of individual test samples TS-24 to TS-29; (d) Mean of normalised residual stiffness; (e) Standard deviation of normalised residual stiffness. Normalised values are referenced to experimental test data.
Figure 27 presents the comparison between experimental residual stiffness of Glulam beams and the predictions obtained from the international standards, including Eurocode 5 (EC5), AS/NZS 1720.4, Swedish, AWC TR10, and CSA O86. In Figure 27a, the residual stiffness of individual test samples varied between approximately 10% and 45%, indicating noticeable degradation due to prolonged exposure to elevated temperatures. Most international standards predicted residual stiffness values that diverged considerably from the test data, showing poor consistency. This discrepancy was attributed to differences in how each standard modelled the effective section modulus and the assumptions regarding temperature-dependent stiffness reduction. The AS/NZS 1720.4 model tended to underestimate residual stiffness, reflecting its overall conservative treatment of fire-exposed timber elements. Conversely, EC5 (RCM and ACM) and CSA O86 produced higher stiffness predictions, suggesting fewer conservative assumptions.
The normalised residual stiffness results presented in Figure 27b,c showed that most standards exhibited considerable scatter when compared with the experimental data, indicating inconsistency in predicting post-fire stiffness retention for Glulam beams. The normalised values varied widely across all codes, reflecting differences in their underlying assumptions regarding temperature-dependent material degradation and section property reduction. The AS/NZS 1720.4 standard consistently underpredicted residual stiffness, with normalised values generally below unity (around 10% lower than test mean data), a trend consistent with earlier observations for residual strength (Figure 25) and ZSL thickness (Figure 23).
In contrast, the mean normalised residual stiffness values derived from EC5 (RCM and RPM), Swedish, AWC TR10, and CSA O86 standards ranged between 1.3 and 1.5, indicating a general tendency to overestimate stiffness recovery. The EC5 (ACM) formulation produced the highest mean value of approximately 1.8, suggesting a pronounced overprediction of residual stiffness. Despite these differences, all codes displayed notable deviations from the experimental data, confirming that current design formulations lacked the precision required to accurately model stiffness degradation under fire conditions.
The variability of predictions, as shown in Figure 27d, revealed moderate to high standard deviations across all codes, ranging between 40% and 90%. This elevated variability indicated that residual stiffness was more sensitive to localised charring, adhesive degradation, and moisture-induced softening than residual strength. These factors collectively contributed to the wide dispersion observed in the results, underscoring the need for further refinement of predictive models to capture the complex stiffness reduction mechanisms in Glulam members exposed to fire.
Figure 28 presents the corresponding comparison of CLT elements. Figure 28a–c show the residual stiffness of individual CLT beam and floor samples obtained from experimental studies and predictions from Swedish, AWC TR10, and CSA O86. The results revealed significant variability, with residual stiffness ranging from 10% to 50% of the initial stiffness. Compared with Glulam, the CLT results exhibited greater scatter, primarily due to the composite layer configuration and interlaminar adhesive behaviour. The loss of stiffness in CLT members was largely influenced by delamination and adhesive degradation, which caused separation between lamellae and hindered stress transfer during and after exposure [27,30,31].
The mean of the normalised residual stiffness, as shown in Figure 28d, demonstrated that all standards overestimated the stiffness retention of CLT elements. The mean normalised values exceeded unity for all codes, with Swedish, AWC TR10, and CSA O86 models producing mean values of approximately 1.46, 1.47, and 1.65, respectively. This overestimation indicated that existing code formulations failed to account for the progressive loss of interlaminar shear stiffness and layer separation effects, which significantly reduced the global stiffness of CLT members under fire conditions. The standard deviation results in Figure 28e exceeded 200% across all standards, highlighting extreme variability and poor correlation with test data.
Overall, the residual stiffness predictions for both Glulam and CLT were inconsistent with the experimental data. The results highlighted that current international design standards lacked sufficient provisions for accurately predicting the post-fire stiffness of mass timber elements. The complexity of adhesive degradation, lamella interaction, and charring progression required more advanced analytical models and empirical calibration to improve the reliability of stiffness predictions in fire design applications.
5. Discussion
The results presented in Section 4 demonstrate clear and systematically distinct behavioural differences between Glulam and CLT when exposed to fire. Glulam specimens exhibited steady and predictable charring behaviour, consistent with the assumptions embedded in EC5, AS/NZS 1720.4, and CSA O86. Although measured charring rates were marginally lower than design values, the experimentally observed ZSL was often thicker than assumed in most codes. This indicates that while current charring models remain slightly conservative, residual strength predictions may be non-conservative for extended exposure durations. Overall, these findings support the continued use of simplified analytical models for Glulam, provided that additional safety factors are applied to post-fire strength assessments.
In contrast, CLT demonstrated a more complex and less predictable thermal response, as evidenced by the increased scatter and bias observed across the experimental datasets analysed in Section 4.1.1, Section 4.1.2 and Section 4.1.3. Cross-lamination, adhesive softening, and inter-layer interfaces promoted delamination, intermittently exposing previously uncharred layers to renewed heating and accelerating effective charring beyond code-based assumptions. The influence of lamella thickness, member geometry, and exposed surface configuration (Section 4.1.4, Section 4.1.5 and Section 4.1.6) further contributed to this variability, highlighting scale-dependent behaviour that is not explicitly addressed in current charring formulations. As a result, constant charring rates and fixed ZSL assumptions are insufficient to represent the inherently non-steady and interface-controlled degradation process governing CLT fire performance.
The adhesive-dependent behaviour discussed in Section 4.1.7 provides a critical explanation for the observed divergence between experimental results and code predictions. CLT panels bonded with thermosetting adhesives (e.g., MUF and PRF) generally exhibited limited delamination and more stable char development, leading to conservative charring predictions. In contrast, panels manufactured with heat-softening adhesives (e.g., PUR) experienced earlier bond degradation, increased delamination frequency, and accelerated charring, resulting in systematic underestimation by existing design models. The strong sensitivity of both charring rate variability and residual stiffness to adhesive performance underscores a key limitation of current codes, which implicitly average adhesive effects rather than explicitly modelling temperature-dependent bond degradation.
When comparing international standards, Eurocode 5 and CSA O86 provided the closest agreement with experimental charring rates for Glulam, whereas AWC TR10 and AS/NZS 1720.4 were consistently more conservative. For CLT, however, none of the evaluated standards adequately captured the magnitude or variability of the observed charring behaviour, reinforcing the need for time-dependent, adhesive-sensitive, or interface-aware correction factors. The results also confirmed that residual mechanical properties, particularly stiffness, are strongly influenced by inter-laminar interaction and adhesive degradation—parameters that are not currently incorporated into existing design formulations.
From a design perspective, these findings highlight the importance of performance-based verification for mass timber structures, particularly CLT systems, where simplified code assumptions may not ensure adequate safety margins under all fire scenarios. Incorporating experimentally derived modifiers that account for adhesive performance, lamella configuration, delamination behaviour, and heating regime could substantially improve predictive reliability. Future research should focus on coupling advanced thermo-mechanical modelling with large-scale fire testing to refine design provisions that reflect the layered and anisotropic nature of CLT.
Overall, while Glulam demonstrated reliable and reproducible fire performance across all evaluated parameters, CLT exhibited inherently more complex and variable behaviour driven by its layered construction and interface-controlled degradation mechanisms. These findings confirm that fire design standards originally developed for solid or laminated timber are insufficient for accurately modelling CLT fire performance. Refining code formulations to explicitly include adhesive behaviour, lamella configuration, and delamination mechanisms is therefore essential for advancing performance-based fire design and enabling the safe and efficient use of mass timber in modern construction.
6. Findings and Conclusions
Based on the comparative analyses and discussions presented above, this study provides a comprehensive evaluation of the fire performance of Glulam and CLT structural elements benchmarked against international design standards. The results demonstrate that Glulam generally exhibits consistent and predictable behaviour, while CLT displays greater variability due to its layered composition and adhesive sensitivity under fire exposure.
Key findings are summarised as follows:
- Most international standards predicted Glulam charring rates within ±20% of experimental data. AS/NZS 1720.4 consistently overpredicted charring rates and effective charring depths by approximately 40%, resulting in conservative yet less accurate outcomes.
- CLT exhibited higher variability in effective charring depth, with standard deviations between 30% and 40%, primarily due to adhesive degradation and delamination.
- For Glulam, all considered design codes predicted charring rates within ±20% for timber densities greater than 450 kg/m3, with the lowest standard deviations (≤8%). For timber densities below 450 kg/m3, charring rate predictions were within ±8% except for AS/NZS 1720.4 (~30% overprediction). CLT charring rate predictions were within ±20% across all densities, but scatter was higher, with standard deviations of up to 35%.
- For CLT panels, all codes overpredicted charring rates for MUF adhesives, with the largest overprediction around 40% for AWC TR10 and standard deviations below 10%, while 1C-PUR adhesives were underpredicted by about 20%, with higher variability of 2%.
- Under standard fire, all codes overpredicted CLT charring rates, with a maximum of 20% for AWC TR10 and standard deviations around 30%. Under natural fire, charring rates were underpredicted by 40%, with variability of 10%.
- The ZSL for Glulam was accurately captured by fixed value models (around 7 mm), while CLT displayed significantly larger and more variable ZSLs due to interlaminar failure and adhesive degradation.
- Glulam residual strength predictions were reliable across all standards except AS/NZS 1720.4, which underestimated residual strength by 20% to 30%.
- CLT residual strength exhibited high scatter, with standard deviations exceeding 50%, caused by non-uniform charring and interlaminar shear loss.
- Residual stiffness predictions for both Glulam and CLT were inconsistent across all standards, generally overestimating stiffness recovery. CLT results exhibited variability approaching 100%, driven by delamination and adhesive softening.
In conclusion, the current suite of international design standards remains adequate for Glulam but insufficient for accurately predicting CLT fire performance. This study highlights the need for continued experimental research and refinement of design models, particularly within the Australian context where specific CLT fire provisions are currently lacking. Incorporating adhesive performance, lamella configuration, and delamination mechanisms into future standards will be essential to improve predictive reliability and support the development of safe, efficient, and performance-based fire design for mass timber structures.
By directly comparing Glulam and CLT within a unified analytical framework, this review clarifies where current design standards are dependable (Glulam) and where they are not (CLT). Practically, the results support confident use of simplified methods for Glulam (with attention to ZSL in long-duration fires), while recommending adhesive-sensitive, time-dependent models for CLT to account for delamination and char loss. For regulators, the outcomes provide evidence-based priorities for near-term updates, particularly in AS/NZS 1720.4 and guidance documents used in Australia, to incorporate adhesive qualification, lamella configuration, and ZSL evolution. For practice, the review underpins risk-consistent performance-based fire design, encouraging targeted testing (for example, heat-resistant adhesives) and advanced analyses where CLT is left exposed. These steps will help realise the safety, sustainability, and constructability benefits of mass timber at scale.
Author Contributions
Conceptualisation, S.M. and T.G.; methodology, S.M.; software, S.M.; formal analysis, S.M.; investigation, S.M.; data curation, S.M.; writing—original draft preparation, S.M.; writing—review and editing, S.M. and T.G.; visualisation, S.M. and T.G.; supervision, T.G. and P.M.; funding acquisition, T.G. and P.M. All authors have read and agreed to the published version of the manuscript.
Funding
This research was funded by the Australian Government Research Training Program Scholarship, which is provided by the Australian Commonwealth Government and the University of Melbourne.
Data Availability Statement
The original contributions presented in the study are included in the article; further inquiries can be directed to the corresponding authors.
Conflicts of Interest
The authors declare no conflicts of interest.
References
- Harte, A.M. Mass timber—The emergence of a modern construction material. J. Struct. Integr. Maint. 2017, 2, 121–132. [Google Scholar] [CrossRef]
- Evison, D.C.; Kremer, P.D.; Guiver, J. Mass timber construction in Australia and New Zealand—Status, and economic and environmental influences on adoption. Wood Fiber Sci. 2018, 50, 128–138. [Google Scholar] [CrossRef]
- Karacabeyli, E.; Douglas, B. CLT Handbook: Cross-Laminated Timber; FP Innovations: Pointe-Claire, QC, Canada, 2013. [Google Scholar]
- Kuilen, J.W.G.V.D.; Ceccotti, A.; Xia, Z.; He, M. Very Tall Wooden Buildings with Cross Laminated Timber. Procedia Eng. 2011, 14, 1621–1628. [Google Scholar] [CrossRef]
- Ong, C.B. Glue-laminated timber (Glulam). In Wood Composites; Woodhead Publishing: Sawston, UK, 2015; pp. 123–140. [Google Scholar] [CrossRef]
- Babrauskas, V. Ignition of Wood: A Review of the State of the Art. J. Fire Prot. Eng. 2002, 12, 163–189. [Google Scholar] [CrossRef]
- Buchanan, A.H.; Abu, A.K. Structural Design for Fire Safety, 2nd ed.; John Wiley & Sons, Ltd.: Hoboken, NJ, USA, 2017. [Google Scholar]
- Mikkola, E. Charring Of Wood Based Materials. Fire Saf. Sci. 1991, 3, 547–556. [Google Scholar] [CrossRef]
- Cachim, P.B.; Franssen, J.-M. Assessment of Eurocode 5 Charring Rate Calculation Methods. Fire Technol. 2010, 46, 169–181. [Google Scholar] [CrossRef]
- Schmid, J.; Just, A.; Klippel, M.; Fragiacomo, M. The Reduced Cross-Section Method for Evaluation of the Fire Resistance of Timber Members: Discussion and Determination of the Zero-Strength Layer. Fire Technol. 2015, 51, 1285–1309. [Google Scholar] [CrossRef]
- EN 1995-1-2; Eurocode 5 Design of Timber Structures, Part 1-2: General Structural Fire Design. CEN: Brussels, Belgium, 2004.
- Bartlett, A.I.; Hadden, R.M.; Bisby, L.A. A Review of Factors Affecting the Burning Behaviour of Wood for Application to Tall Timber Construction. Fire Technol. 2019, 55, 1–49. [Google Scholar] [CrossRef]
- Frangi, A.; Fontana, M. Charring rates and temperature profiles of wood sections. Fire Mater. 2003, 27, 91–102. [Google Scholar] [CrossRef]
- Friquin, K.L. Material properties and external factors influencing the charring rate of solid wood and glue-laminated timber. Fire Mater. 2010, 35, 303–327. [Google Scholar] [CrossRef]
- Babrauskas, V. Charring rate of wood as a tool for fire investigations. Fire Saf. J. 2005, 40, 528–554. [Google Scholar] [CrossRef]
- Bartlett, A.I.; Lange, D.; Anderson, J.; Hadden, R.M. Uncertainty Quantification Applied to a Fire-Exposed Glued-Laminated Timber Beam. In 14th International Probabilistic Workshop; Springer: Berlin/Heidelberg, Germany, 2017; pp. 203–213. [Google Scholar]
- Schmidt, L.; Hadden, R.M.; Fernando, D. Observations and impact of char layer formation and loss for engineered timber. Fire Saf. J. 2024, 147, 104196. [Google Scholar] [CrossRef]
- Wen, L.; Han, L.; Zhou, H. Charring rates of timbers from Chinese species and comparison with various charring rate models. Eur. J. Wood Wood Prod. 2018, 76, 1347–1351. [Google Scholar] [CrossRef]
- White, R.H.; Nordheim, E.V. Charring rate of wood for ASTM E 119 exposure. Fire Technol. 1992, 28, 5–30. [Google Scholar] [CrossRef]
- American Wood Council. National Design Specification (NDS) for Wood Construction; American Wood Council: Leesburg, VA, USA, 2024. [Google Scholar]
- CSA O86:2024; Engineering Design in Wood. Canadian Standards Association (CSA) Group: Rexdale, ON, Canada, 2024.
- AS/NZS 1720.4:2019; Timber Structures—Fire Resistance for Structural Adequacy and Insulation. Standards Australia: Sydney, Australia; Standards New Zealand: Wellington, New Zealand, 2019.
- Njankouo, J.M.; Dotreppe, J.C.; Franssen, J.M. Experimental study of the charring rate of tropical hardwoods. Fire Mater. 2004, 28, 15–24. [Google Scholar] [CrossRef]
- Schaffer, E.; Marx, C.; Bender, D.; Woeste, F. Strength Validation and Fire Endurance of Glued-Laminated Timber Beams; Research Paper FPL 467; U.S. Department of Agriculture, Forest Service, Forest Products Laboratory: Madison, WI, USA, 1986.
- Collier, P.C.R. Charring Rates of Timber: Study Report SR 42; Building Research Association of New Zealand (BRANZ): Judgeford, New Zealand, 1992. [Google Scholar]
- Collier, P.C.R.; Buchanan, A.H. Fire Resistance of Lightweight Timber Framed Walls. Fire Technol. 2002, 38, 125–145. [Google Scholar] [CrossRef]
- Brandon, D.; Dagenais, C. Fire Safety Challenges of Tall Wood Buildings—Phase 2: Experimental Study of Delamination of Cross-laminated Timber (CLT) in Fire; Fire Protection Research Foundation: Quincy, MA, USA, 2018. [Google Scholar]
- Abed, J.; Rayburg, S.; Rodwell, J.; Neave, M. A Review of the Performance and Benefits of Mass Timber as an Alternative to Concrete and Steel for Improving the Sustainability of Structures. Sustainability 2022, 14, 5570. [Google Scholar] [CrossRef]
- Hadden, R.M.; Bartlett, A.I.; Hidalgo, J.P.; Santamaria, S.; Wiesner, F.; Bisby, L.A.; Deeny, S.; Lane, B. Effects of exposed cross laminated timber on compartment fire dynamics. Fire Saf. J. 2017, 91, 480–489. [Google Scholar] [CrossRef]
- Miyamoto, B.; Bechle, N.J.; Rammer, D.R.; Zelinka, S.L. A Small-Scale Test to Examine Heat Delamination in Cross Laminated Timber (CLT). Forests 2021, 12, 232. [Google Scholar] [CrossRef]
- Zelinka, S.L.; Pei, S.; Bechle, N.; Sullivan, K.; Ottum, N.; Rammer, D.; Hasburgh, L. Performance of wood adhesive for cross laminated timber under elevated temperatures. In Proceedings of the World Conference on Timber Engineering, 2018; Korean Institute of Forest Science: Seoul, Republic of Korea, 2018. [Google Scholar]
- Zelinka, S.L.; Bourne, K.J.; Hasburgh, L.E.; Yedinak, K. Heat Delamination in Cross Laminated Timber: Intermediate Scale Test Based Upon the North American Standards. In Proceedings of the World Conference on Timber Engineering, Oslo, Norway, 19–22 June 2023; pp. 1559–1565. [Google Scholar]
- Frangi, A.; Bochicchio, G.; Ceccotti, A.; Lauriola, M. Natural Full-Scale Fire Test on a 3 Storey XLam Timber Building. In Proceedings of the 10th World Conference on Timber Engineering, Miyazaki, Japan, 2–5 June 2008. [Google Scholar]
- Pope, I.; Gupta, V.; Xu, H.; Wiesner, F.; Lange, D.; Torero, J.L.; Hidalgo, J.P. Fully-developed compartment fire dynamics in large-scale mass timber compartments. Fire Saf. J. 2023, 141, 104022. [Google Scholar] [CrossRef]
- Engel, T.; Werther, N. Impact of Mass Timber Compartment Fires on Façade Fire Exposure. Fire Technol. 2023, 59, 517–558. [Google Scholar] [CrossRef]
- Arup. Fire Safe Design of Mass Timber Buildings. Arup Guide; Arup: London, UK, 2024. [Google Scholar]
- Su, J.; Gibbs, E.; Weinfurter, M.; Lafrance, P.-S.; Gratton, K.; Frade, A.; Leroux, P. Large-Scale Fire Tests of a Mass Timber Building Structure for MTDFTP; National Research Council Canada: Ottawa, OT, Canada, 2023. [Google Scholar]
- Brandon, D.; Dagenais, C. Fire Safety Challenges of Tall Wood Buildings—Phase 2: Task 5—Experimental Study of Delamination of Cross Laminated Timber in Fire; FPRF-2018-05; Fire Protection Research Foundation: Pointe-Claire, Quebec, Canada, 2018. [Google Scholar]
- Su, J.; Lafrance, P.; Hoehler, M.; Bundy, M. Fire Safety Challenges of Tall Wood Buildings—Phase 2: Task 2 & 3—Cross Laminated Timber Compartment Fire Tests; FPRF-2018-01-01; Fire Protection Research Foundation: Pointe-Claire, Quebec, Canada,, 2018. [Google Scholar]
- Zelinka, S.L.; Hasburgh, L.E.; Bourne, K.J.; Tucholski, D.R.; Ouellette, J.P. Compartment Fire Testing of a TWO-Story Mass Timber Building; FPL-GTR-247; Department of Agriculture, Forest Service, Forest Products Laboratory: Madison, WI, USA, 2018; pp. 1–480. [Google Scholar]
- Regulation (EU) No. 305/2011 of the European Parliament and of the Council of 9 March 2011 laying down harmonised conditions for the marketing of construction products and repealing Council Directive 89/106/EEC. Off. J. Eur. Union L 2011, 88, 5–43.
- Swedish Wood. The CLT Handbook—CLT Structures—Facts and Planning; Swedish Wood: Stockholm, Sweden, 2019. [Google Scholar]
- Pettersson, C. A Review of Existing Knowledge. In Brandforsk Report 2023; Brandforsk: Stockholm, Sweeden, 2023. [Google Scholar]
- Schmid, J.; Brandon, D.; Just, A.; Werther, N. Fire Dynamics in Timber Structures—Extending the Current Design Limits for Future Timber Buildings: Final Report of the TimFix-Project (Pre-Project); ETH Zürich, Institut für Baustatik und Konstruktion (IBK): Zürich, Switzerland, 2022. [Google Scholar]
- Franssen, J.-M.; Gernay, T. Modeling structures in fire with SAFIR®: Theoretical background and capabilities. J. Struct. Fire Eng. 2017, 8, 300–323. [Google Scholar] [CrossRef]
- AS 1720.1:2010; Timber Structures—Design Methods. Standards Australia: Sydney, Australia, 2010.
- >Australian Building Codes Board. National Construction Code 2022—Building Code of Australia; Australian Building Codes Board: Amsterdam, Australia, 2022. [Google Scholar]
- AS 1530.4:2014; Methods for Fire Tests on Building Materials, Components and Structures—Fire-Resistance Tests for Elements of Construction. Standards Australia: Sydney, Australia, 2014.
- NZS 3603:1993; Timber Structures Standard. Standards New Zealand: Wellington, New Zealand, 1993.
- Boverket, the Swedish National Board of Housing, Building and Planning. Boverkets Byggregler (BBR, BFS 2011:6)—Swedish Building Regulations with Amendments; Boverket, the Swedish National Board of Housing, Building and Planning: Karlskrona, Sweden, 2011. [Google Scholar]
- Swedish Wood. The Glulam Handbook: Volume 2—Project Design of Glulam Structures; Swedish Wood: Stockholm, Sweden, 2024. [Google Scholar]
- Swedish Wood. The Glulam Handbook: Volume 3—Structural Design of Glulam Structures; Swedish Wood: Stockholm, Sweden, 2024. [Google Scholar]
- International Code Council. International Building Code (IBC 2024); International Code Council: Washington, DC, USA, 2024. [Google Scholar]
- American Wood Council. Calculating the Fire Resistance of Wood Members and Assemblies: Technical Report No. 10 (TR10); American Wood Council: Leesburg, VA, USA, 2021. [Google Scholar]
- National Fire Protection Association. NFPA 5000: Building Construction and Safety Code; National Fire Protection Association: Quincy, MA, USA, 2024. [Google Scholar]
- National Research Council Canada. National Building Code of Canada; National Research Council Canada: Ottawa, ON, Canada, 2020. [Google Scholar]
- National Research Council Canada. National Fire Code of Canada; National Research Council Canada: Ottawa, ON, Canada, 2020. [Google Scholar]
- American National Standards Institute (ANSI). Standard for Performance-Rated Cross-Laminated Timber; American National Standards Institute (ANSI): Washington, DC, USA; APA—The Engineered Wood Association: Tacoma, WA, USA, 2025. [Google Scholar]
- Dârmon, R.; Lalu, O. The fire performance of Cross Laminated Timber beams. Procedia Manuf. 2019, 32, 121–128. [Google Scholar] [CrossRef]
- Fahrni, R.; Klippel, M.; Just, A.; Ollino, A.; Frangi, A. Fire tests on glued-laminated timber beams with specific local material properties. Fire Saf. J. 2019, 107, 161–169. [Google Scholar] [CrossRef]
- Navaratnam, S.; Munmulla, T.; Rajeev, P.; Ponnampalam, T.; Tesfamariam, S. Experimental and reliability assessment of fire resistance of glue laminated timber beams. Resilient Cities Struct. 2025, 4, 101–114. [Google Scholar] [CrossRef]
- Lineham, S.A.; Thomson, D.; Bartlett, A.I.; Bisby, L.A.; Hadden, R.M. Structural response of fire-exposed cross-laminated timber beams under sustained loads. Fire Saf. J. 2016, 85, 23–34. [Google Scholar] [CrossRef]
- Xing, Z.; Wang, Y.; Zhang, J.; Ma, H. Comparative study on fire resistance and zero strength layer thickness of CLT floor under natural fire and standard fire. Constr. Build. Mater. 2021, 302, 124368. [Google Scholar] [CrossRef]
- Bai, Y.; Zhang, J.; Zhang, X. Scaling study on the fire resistance of cross-laminated timber floors. J. Build. Eng. 2024, 85, 108679. [Google Scholar] [CrossRef]
- ISO 834-1; Fire-Resistance Tests—Elements of Building Construction—Part 1: General Requirements. International Organization for Standardization: Geneva, Switzerland, 1999.
- Frangi, A.; Fontana, M.; Hugi, E.; Jübstl, R. Experimental analysis of cross-laminated timber panels in fire. Fire Saf. J. 2009, 44, 1078–1087. [Google Scholar] [CrossRef]
- Zelinka, S.L.; Sullivan, K.; Pei, S.; Ottum, N.; Bechle, N.J.; Rammer, D.R.; Hasburgh, L.E. Small scale tests on the performance of adhesives used in cross laminated timber (CLT) at elevated temperatures. Int. J. Adhes. Adhes. 2019, 95, 102436. [Google Scholar] [CrossRef]
- Kippel, M.; Leyder, C.; Frangi, A.; Fontana, M. Fire Tests on Loaded Cross-laminated Timber Wall and Floor Elements. Fire Saf. Sci. 2014, 11, 626–639. [Google Scholar] [CrossRef]
- Brandon, D.; Ostman, B.; Su, J.; Kimball, A.; Hoehler, M. Experimental Study of Fire-Induced-Delamination of Cross Laminated Timber; SFPE Europe: Brussels, Belgium, 2019. [Google Scholar]
- Hasburgh, L.; Pang, W.; Bourne, K.; Peralta, P.; Mitchell, P.; Schiff, S. Effect of Adhesives and Ply Configuration on the Fire Performance of Southern Pine Cross-Laminated Timber. In Proceedings of the World Conference of Timber Engineering, Vienna, Austria, 22–25 August 2016. [Google Scholar]
- Wiesner, F.; Hadden, R.; Deeny, S.; Bisby, L. Structural fire engineering considerations for cross-laminated timber walls. Constr. Build. Mater. 2022, 323, 126605. [Google Scholar] [CrossRef]
- Zhang, R.; Dai, H.; Smith, G.D. Investigation of the high temperature performance of a polyurethane adhesive used for structural wood composites. Int. J. Adhes. Adhes. 2022, 116, 102882. [Google Scholar] [CrossRef]
- Östman, B.; Brandon, D.; Frantzich, H. Fire safety engineering in timber buildings. Fire Saf. J. 2017, 91, 11–20. [Google Scholar] [CrossRef]
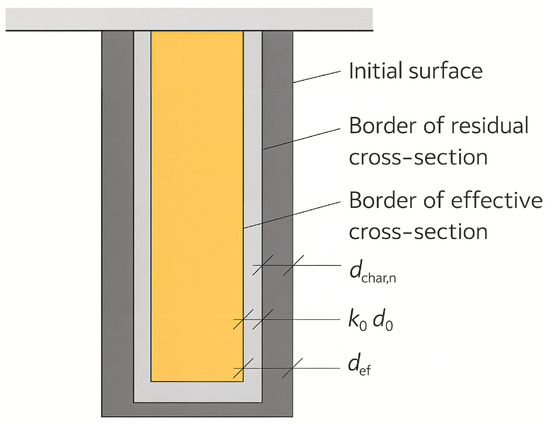
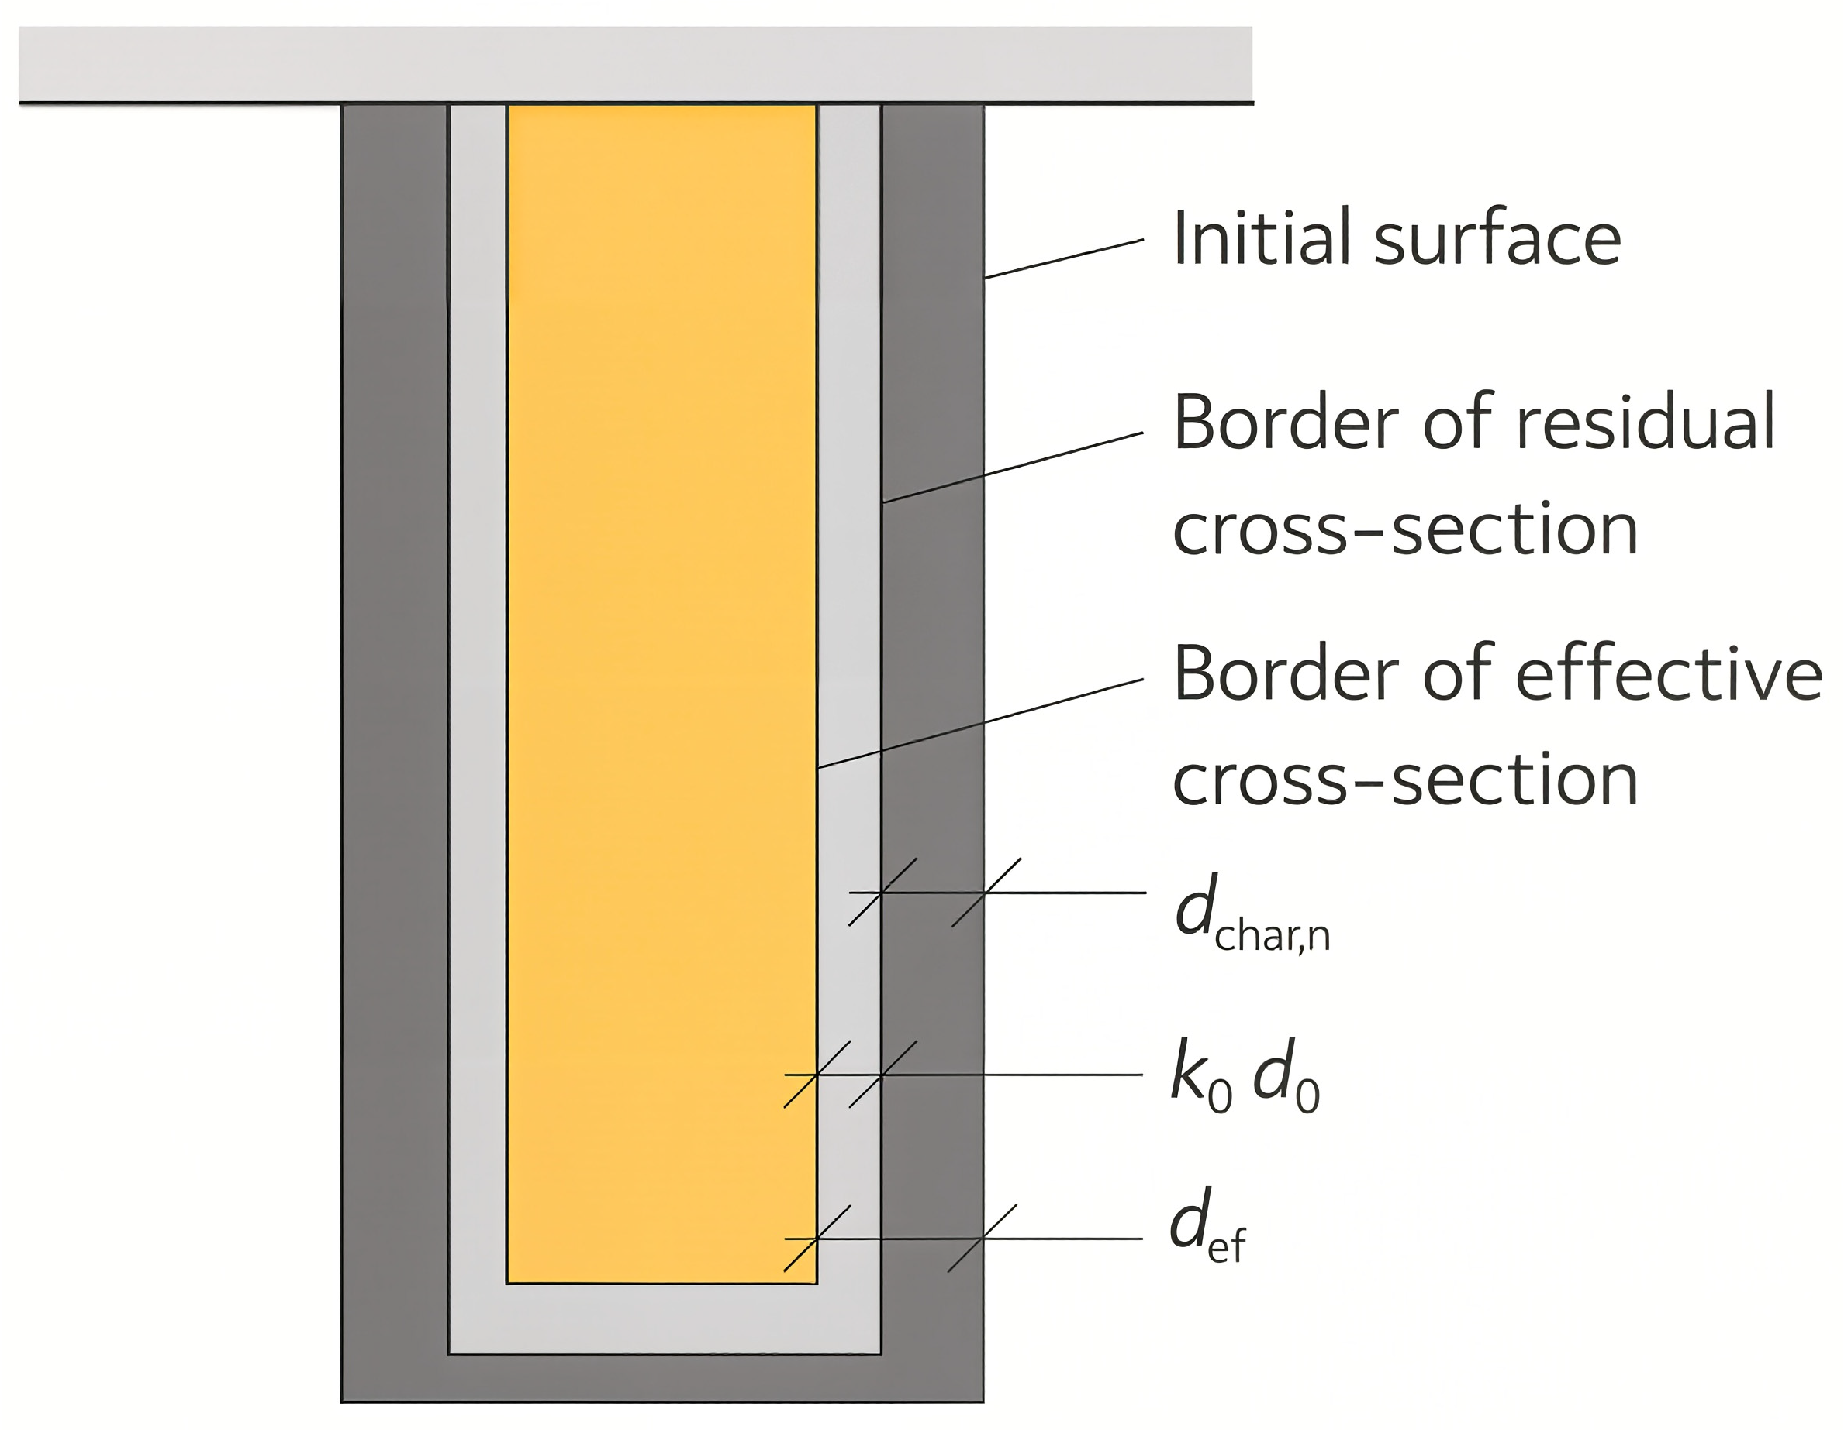
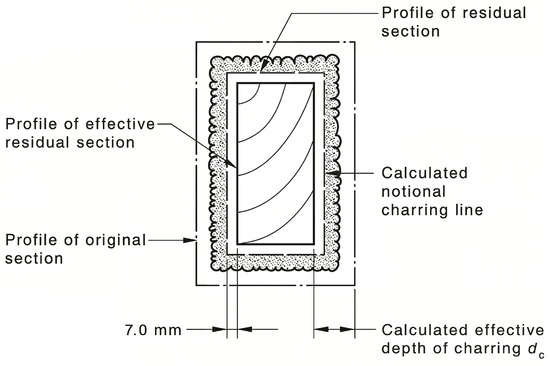
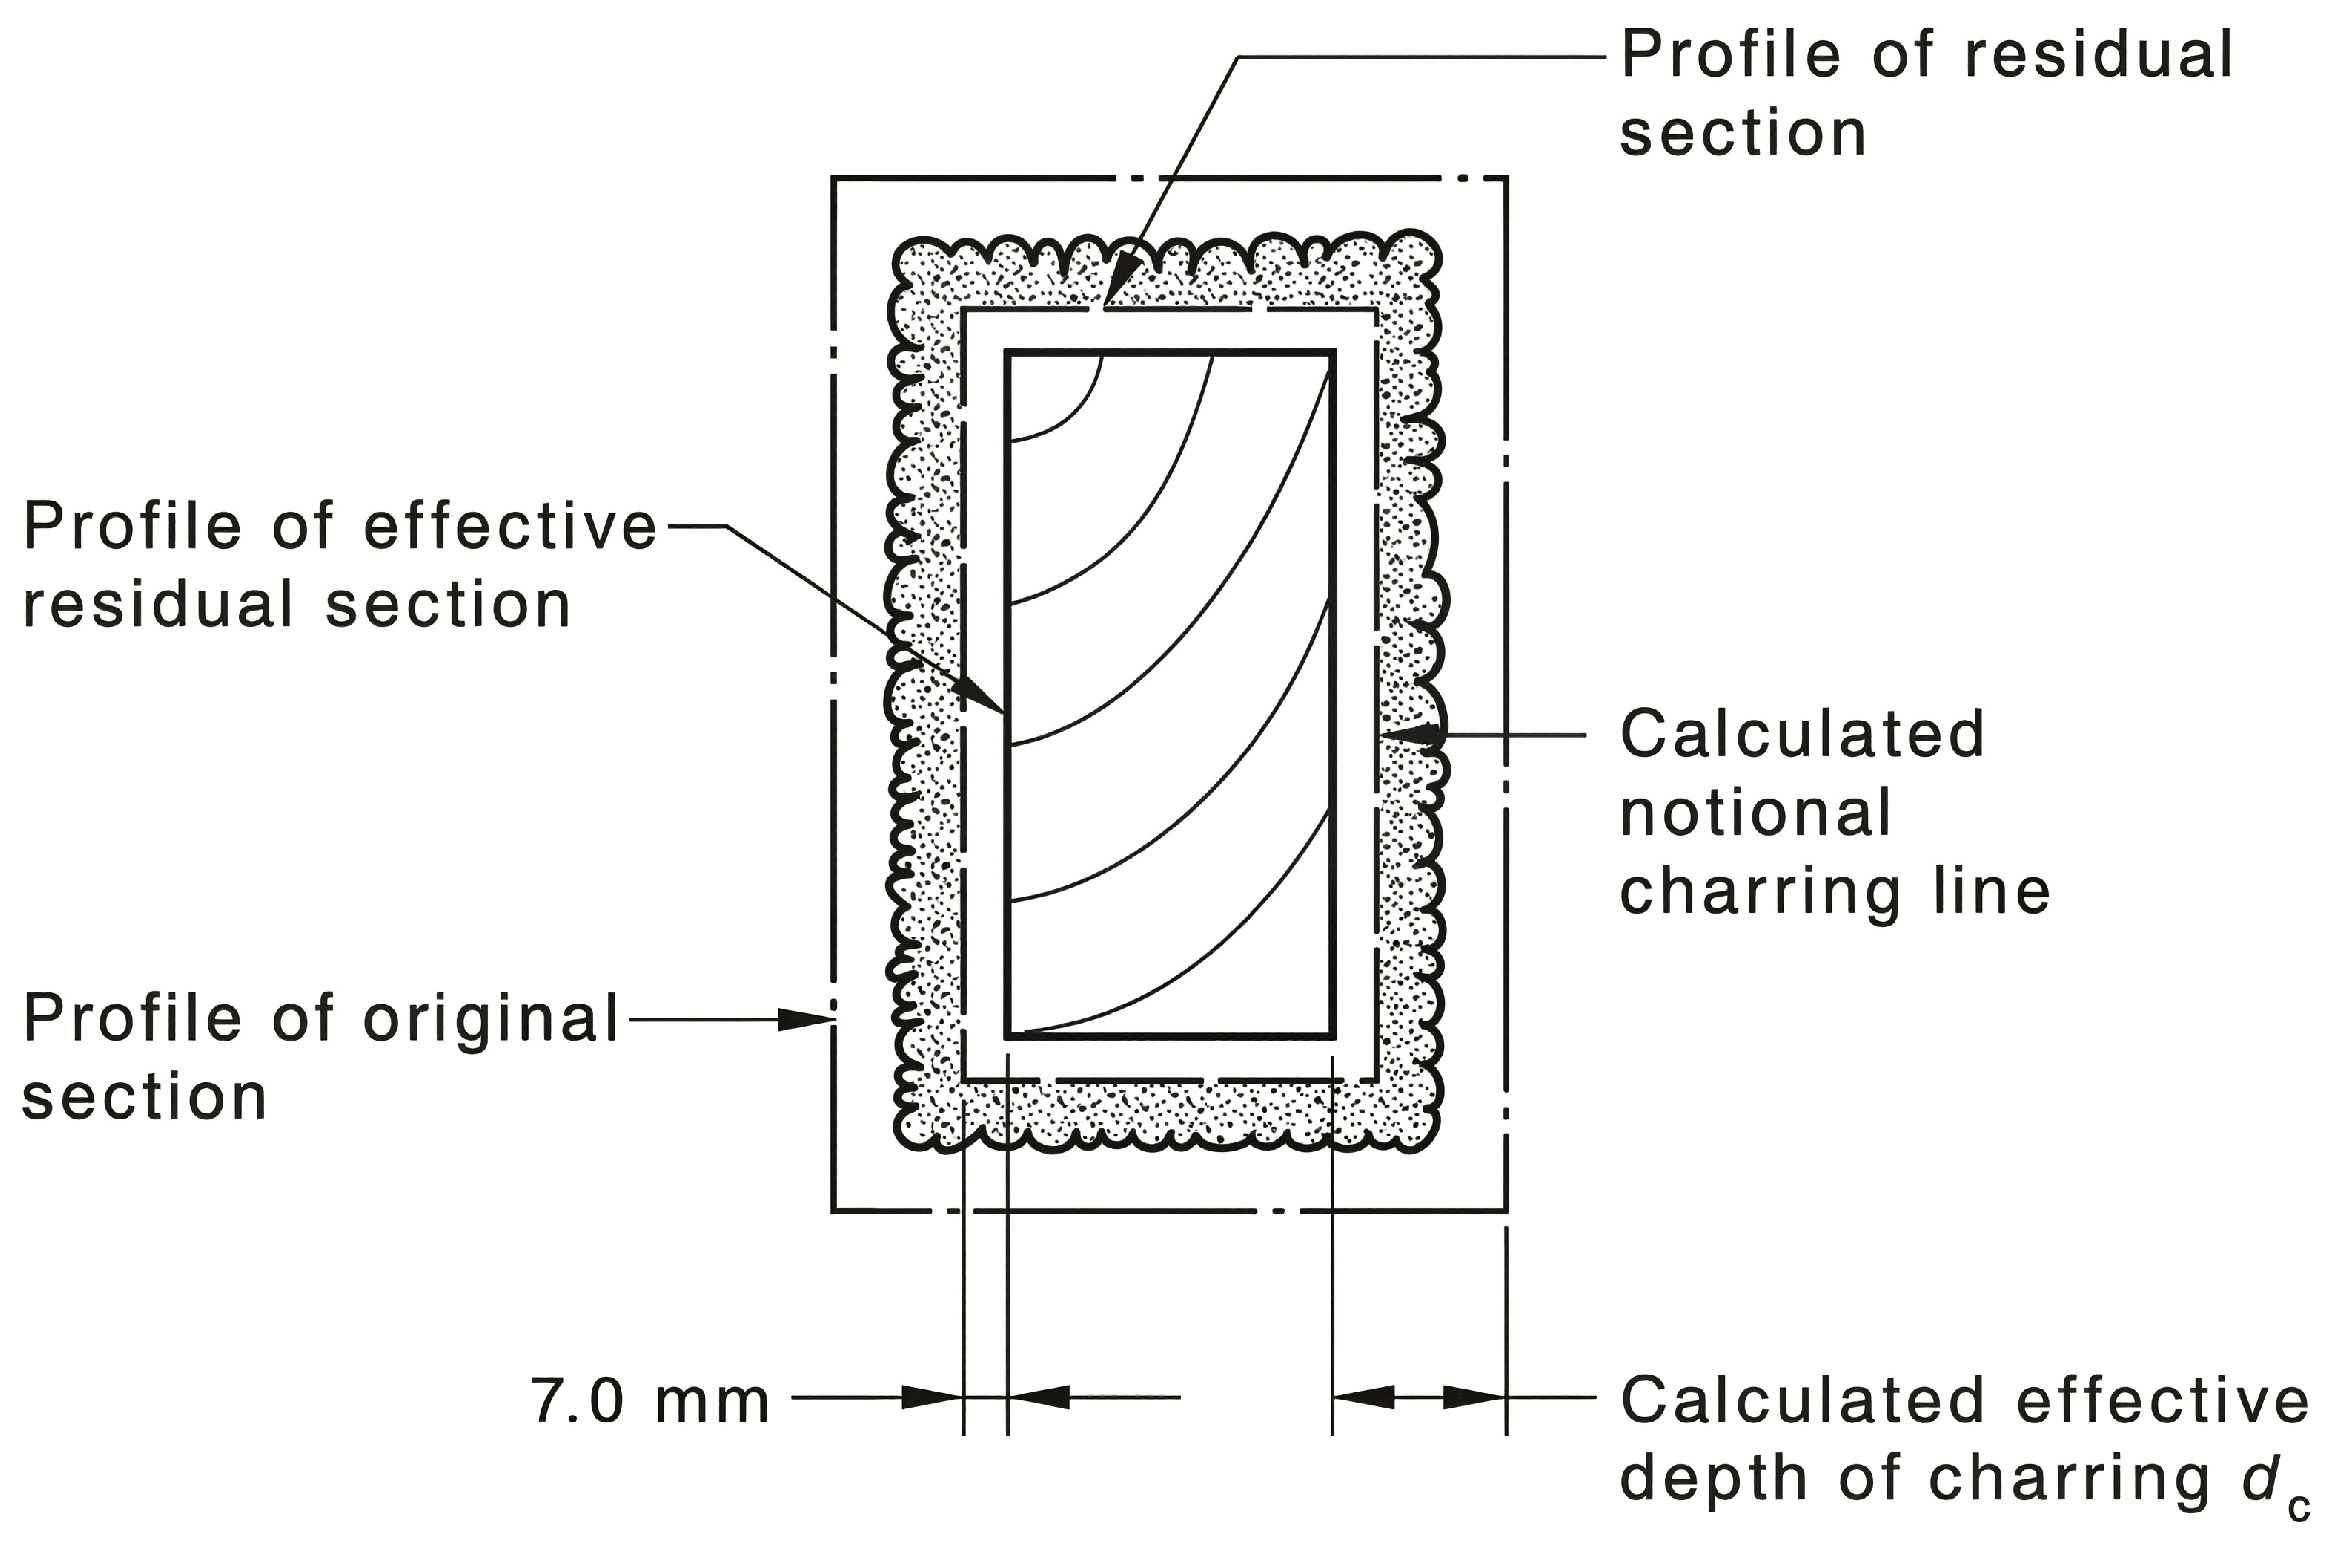
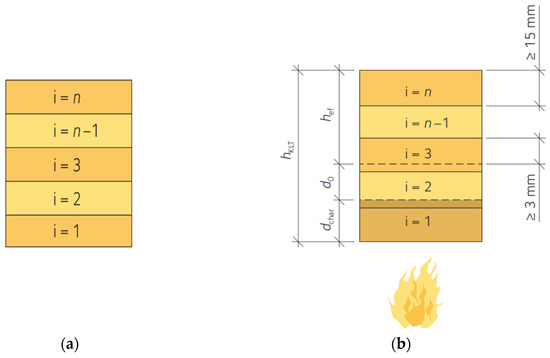
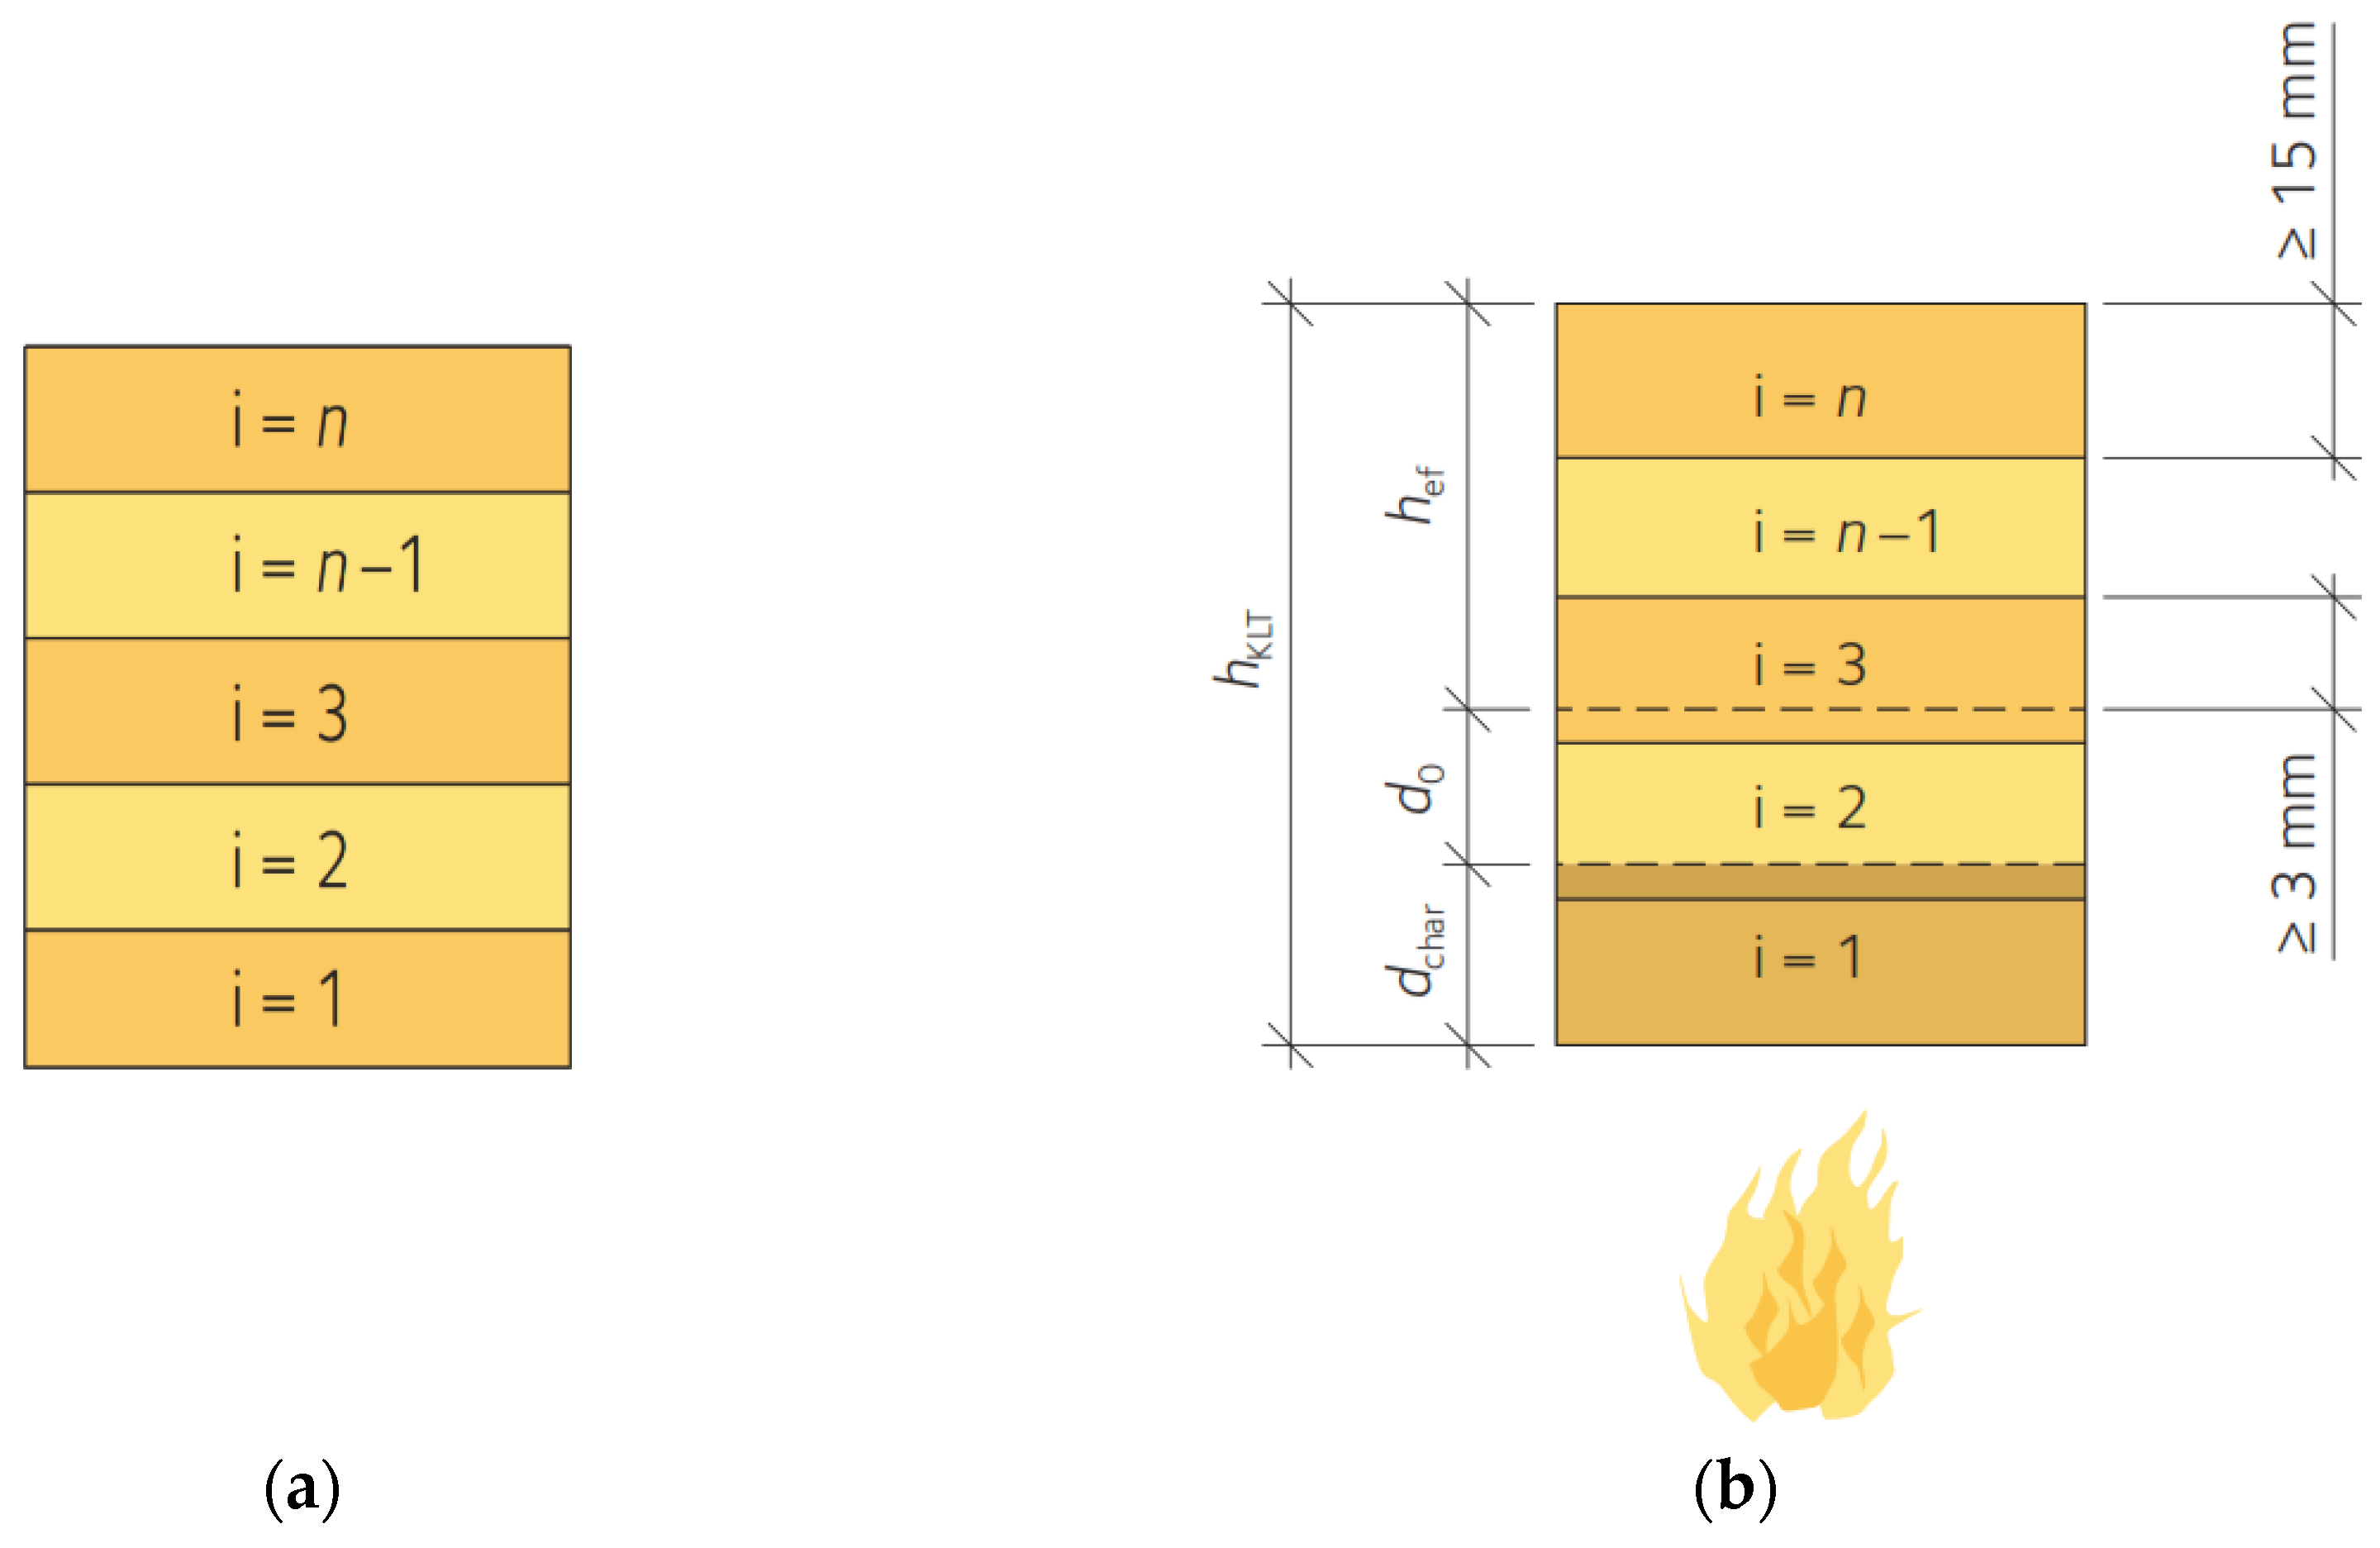
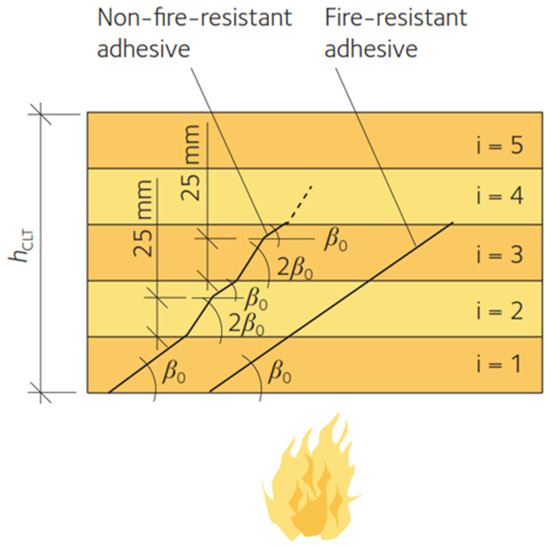
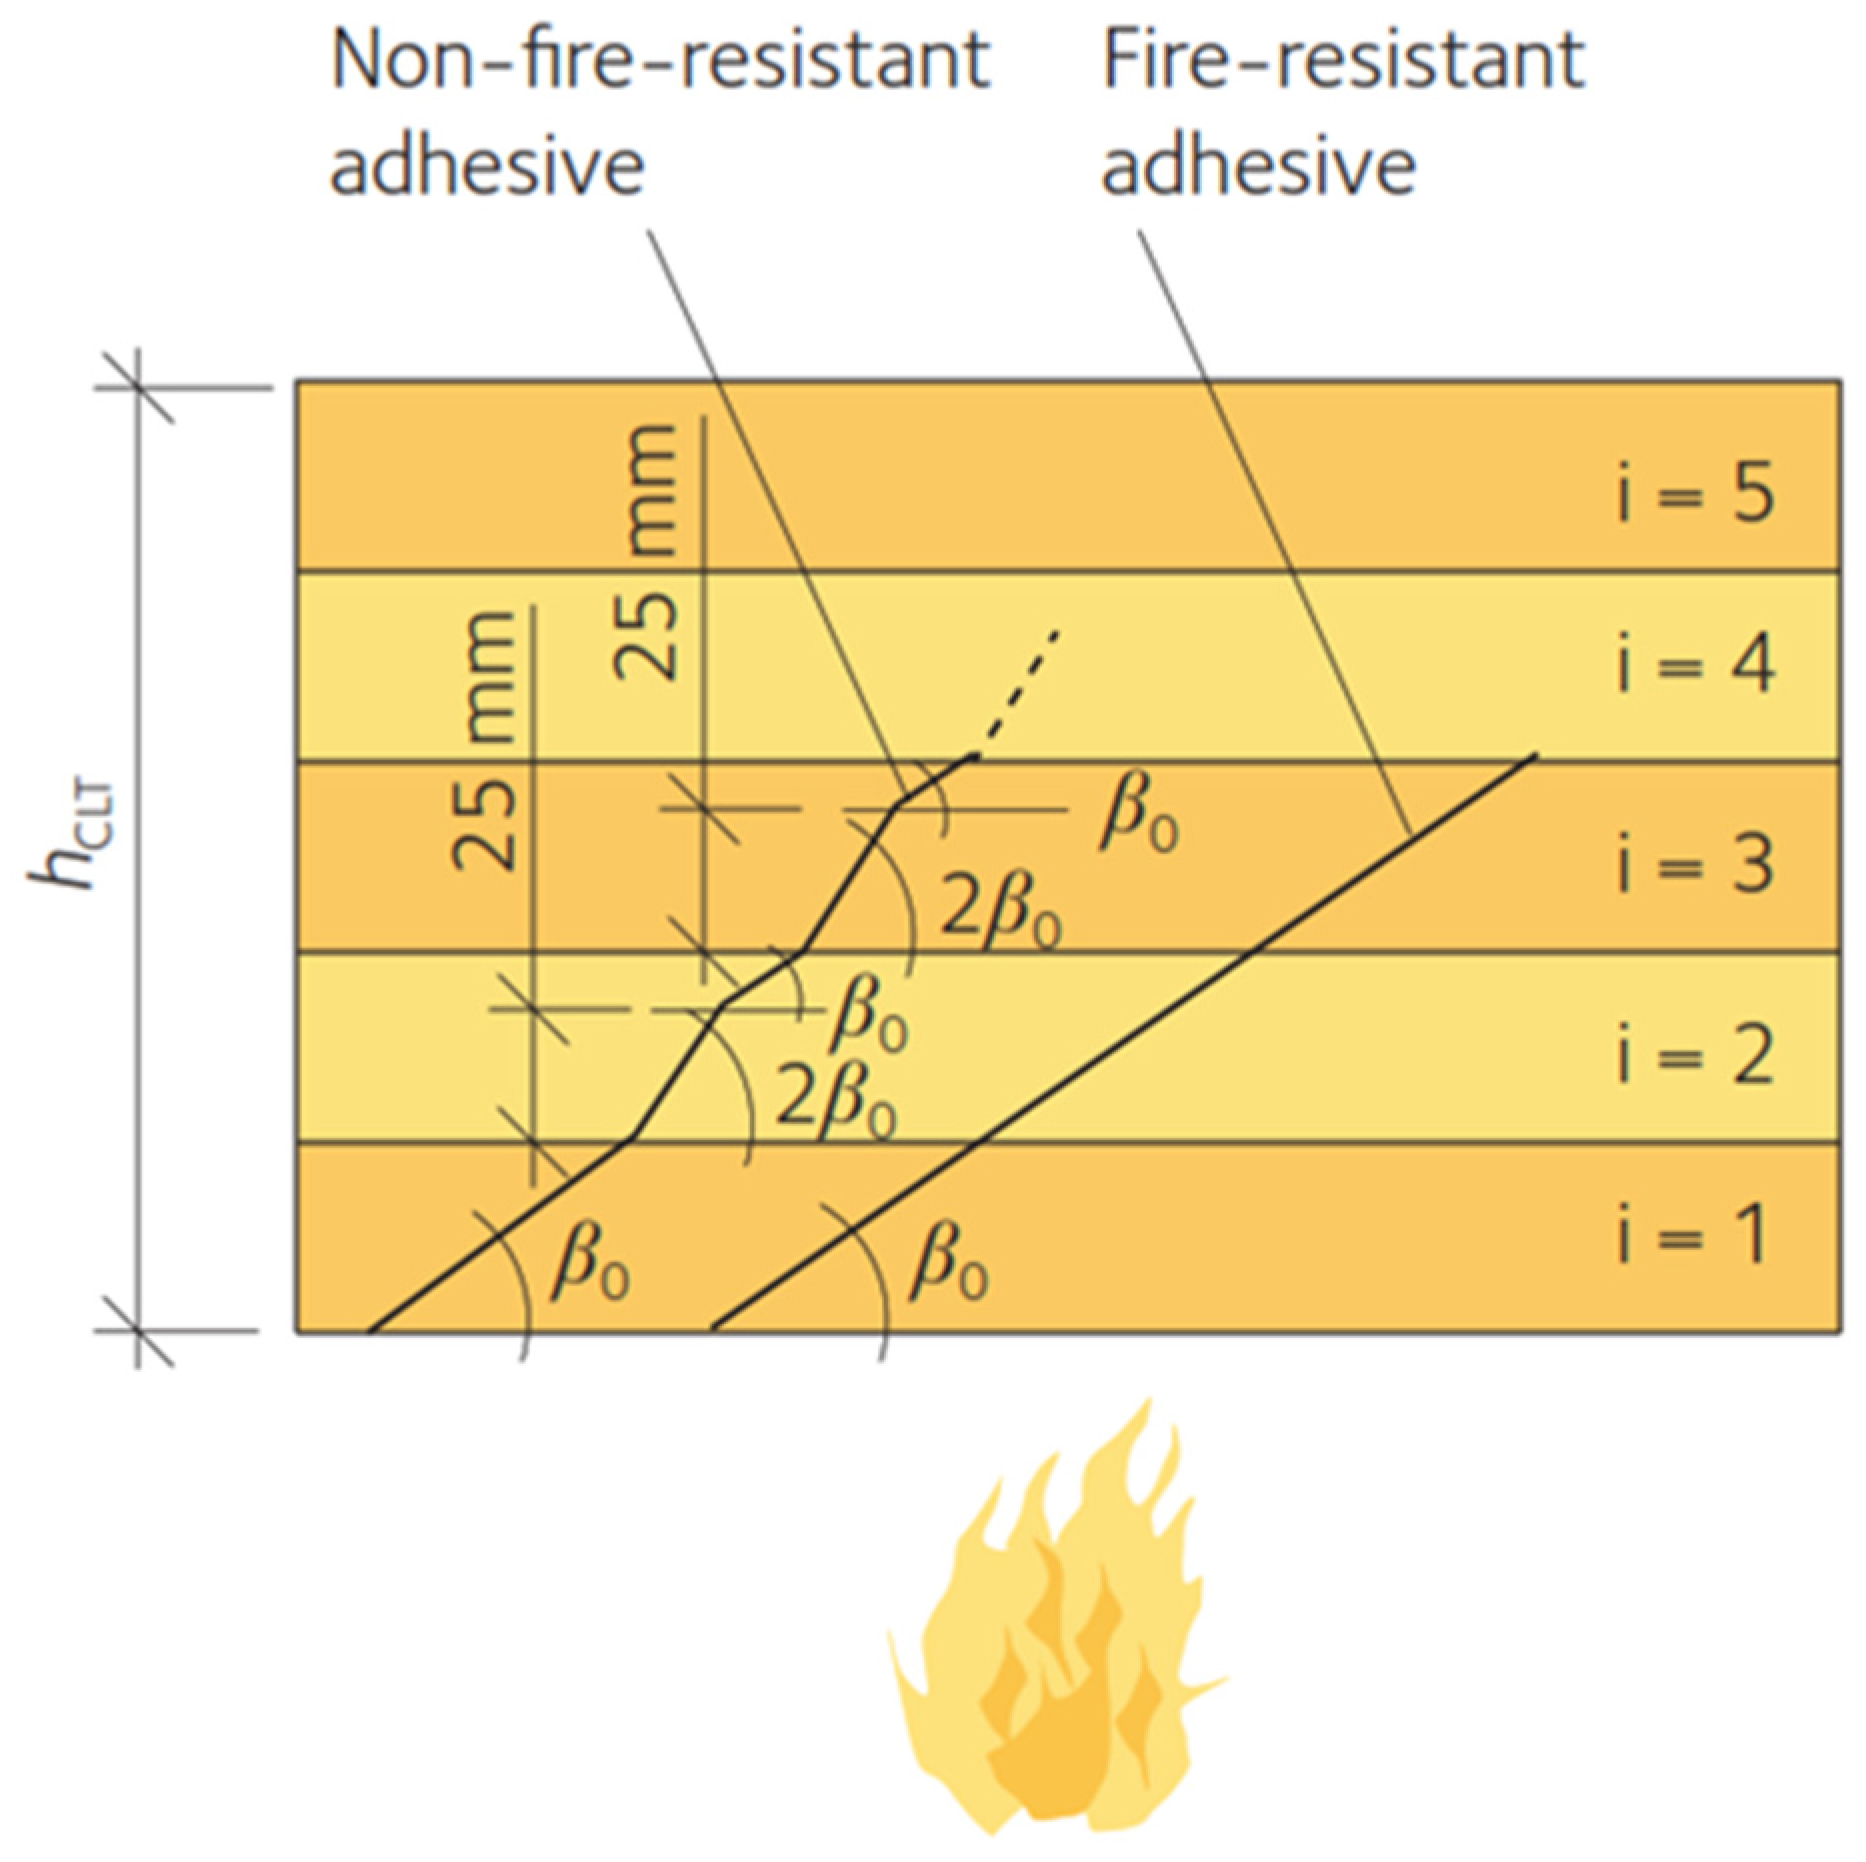
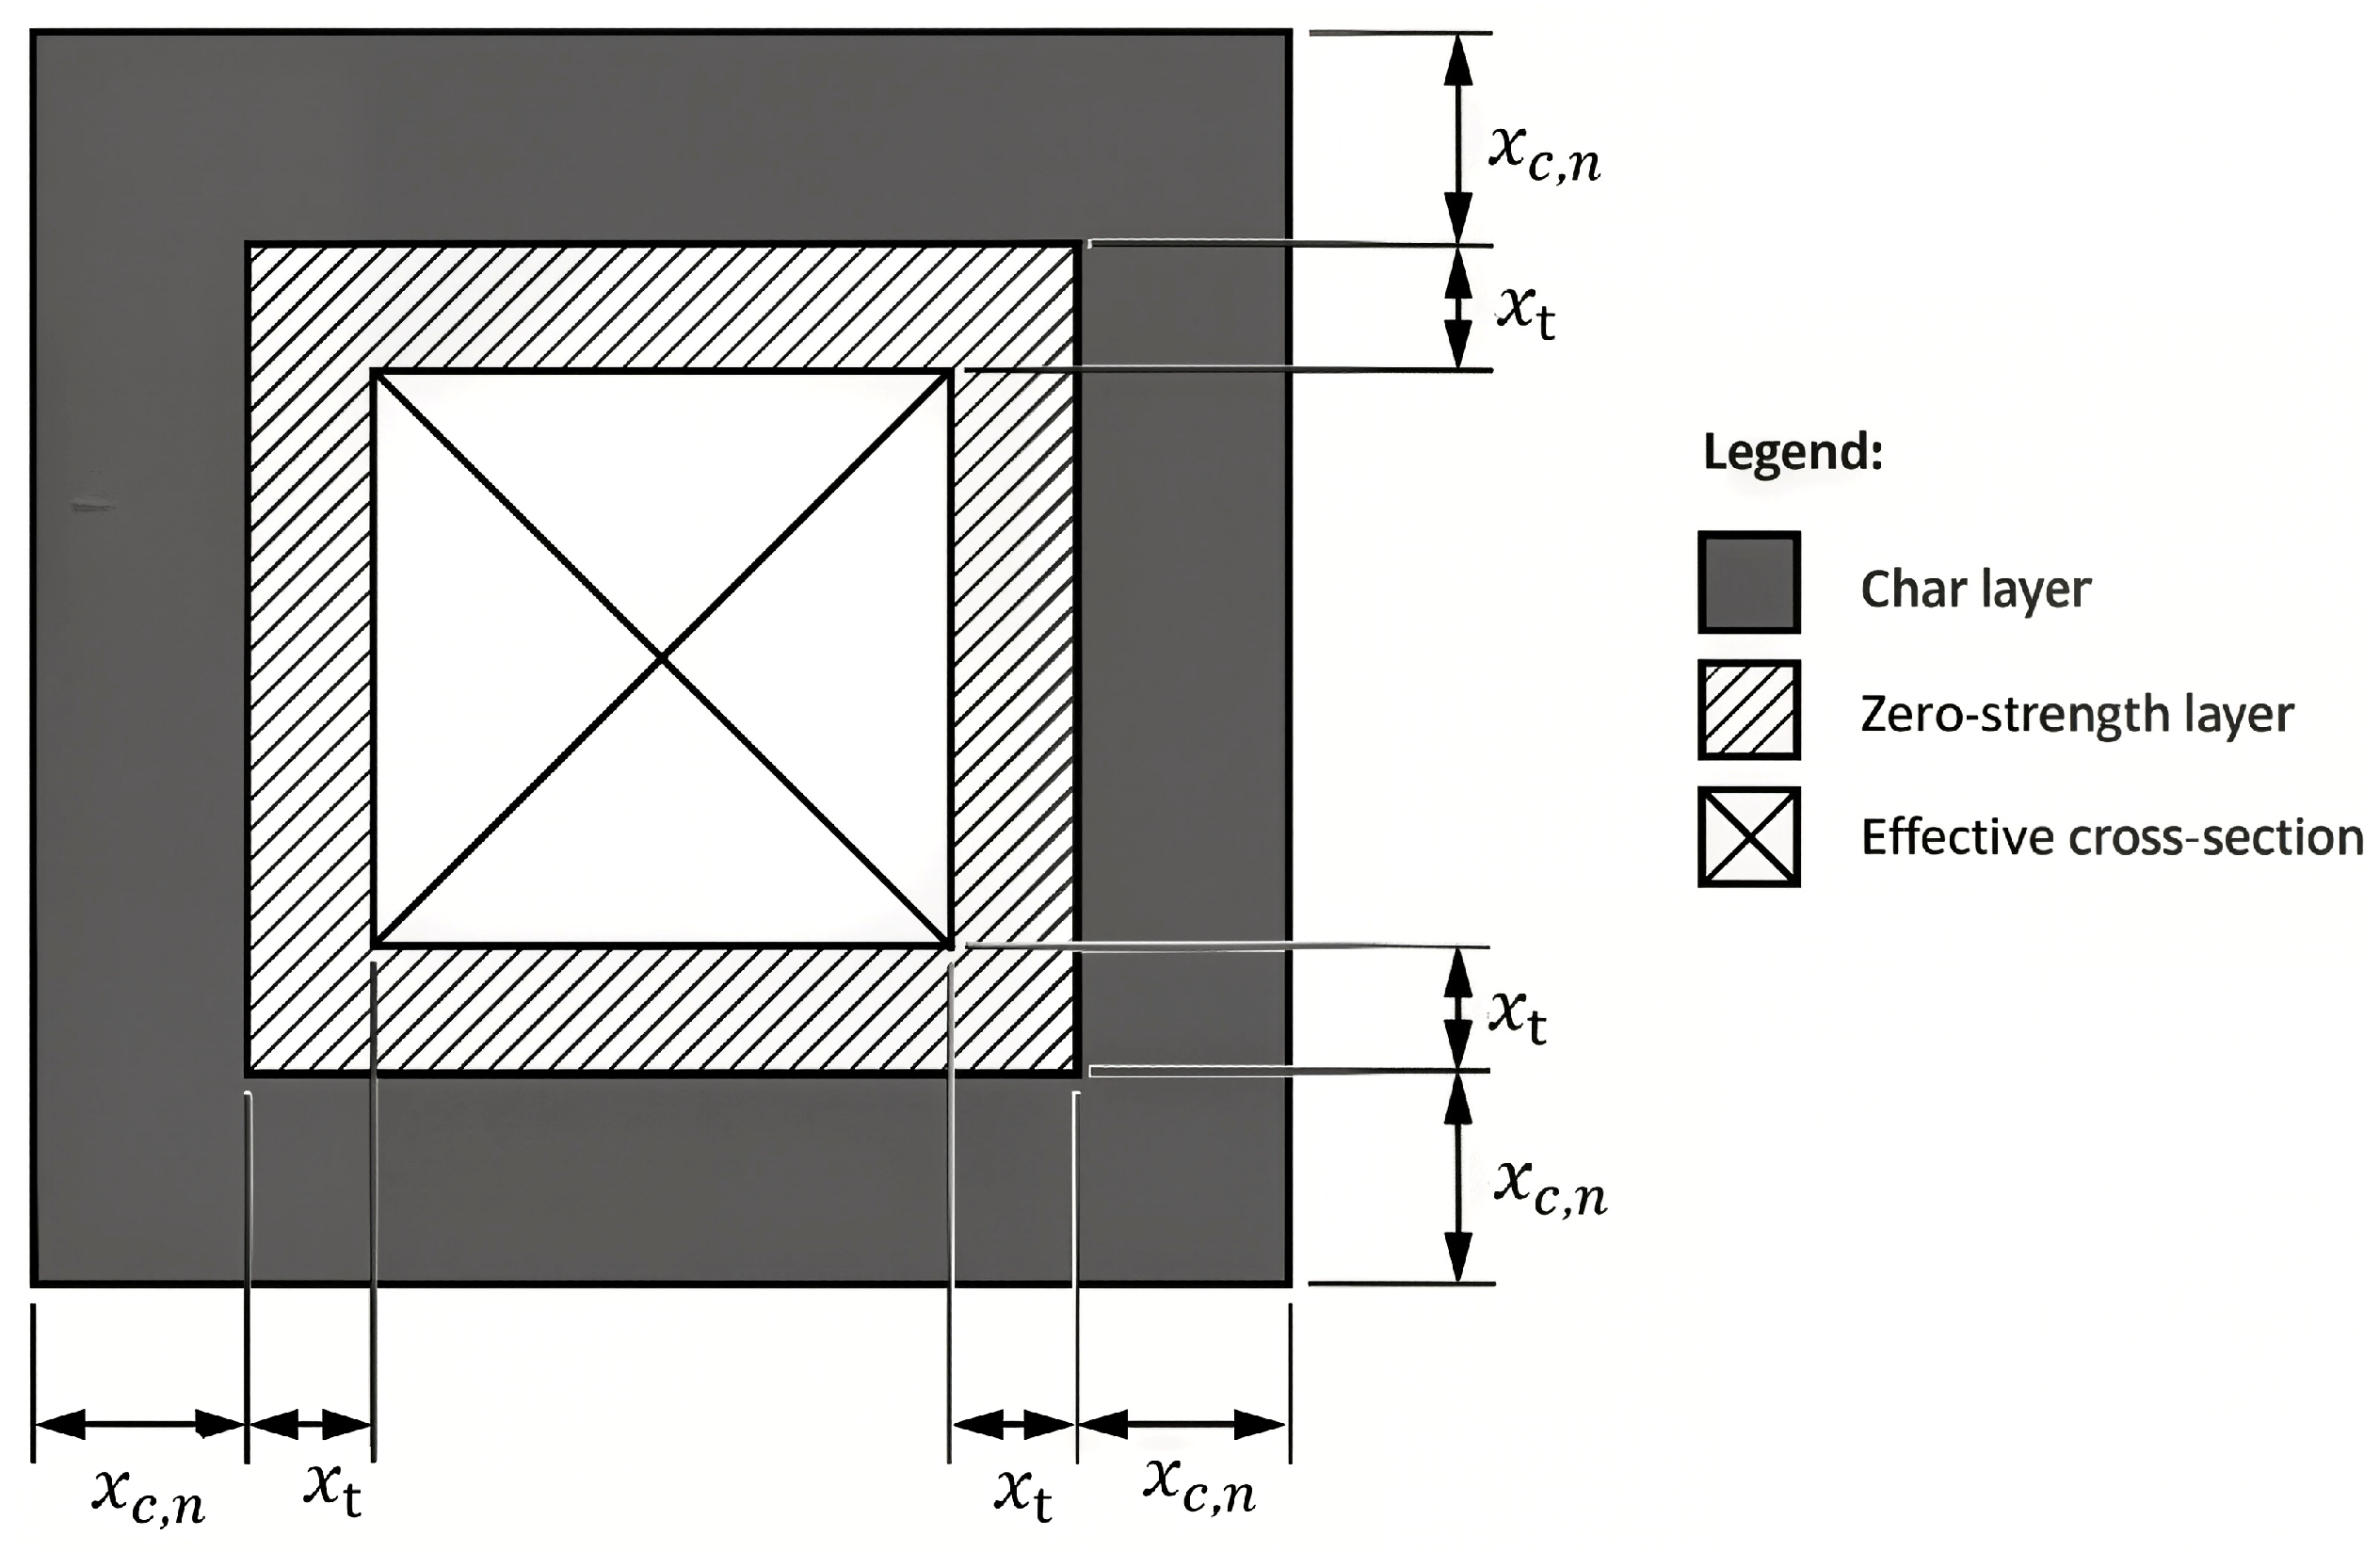
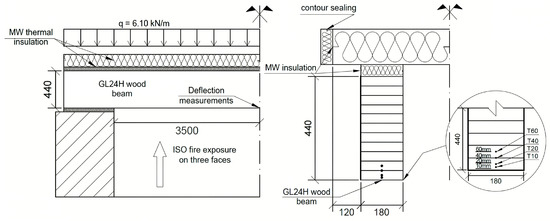
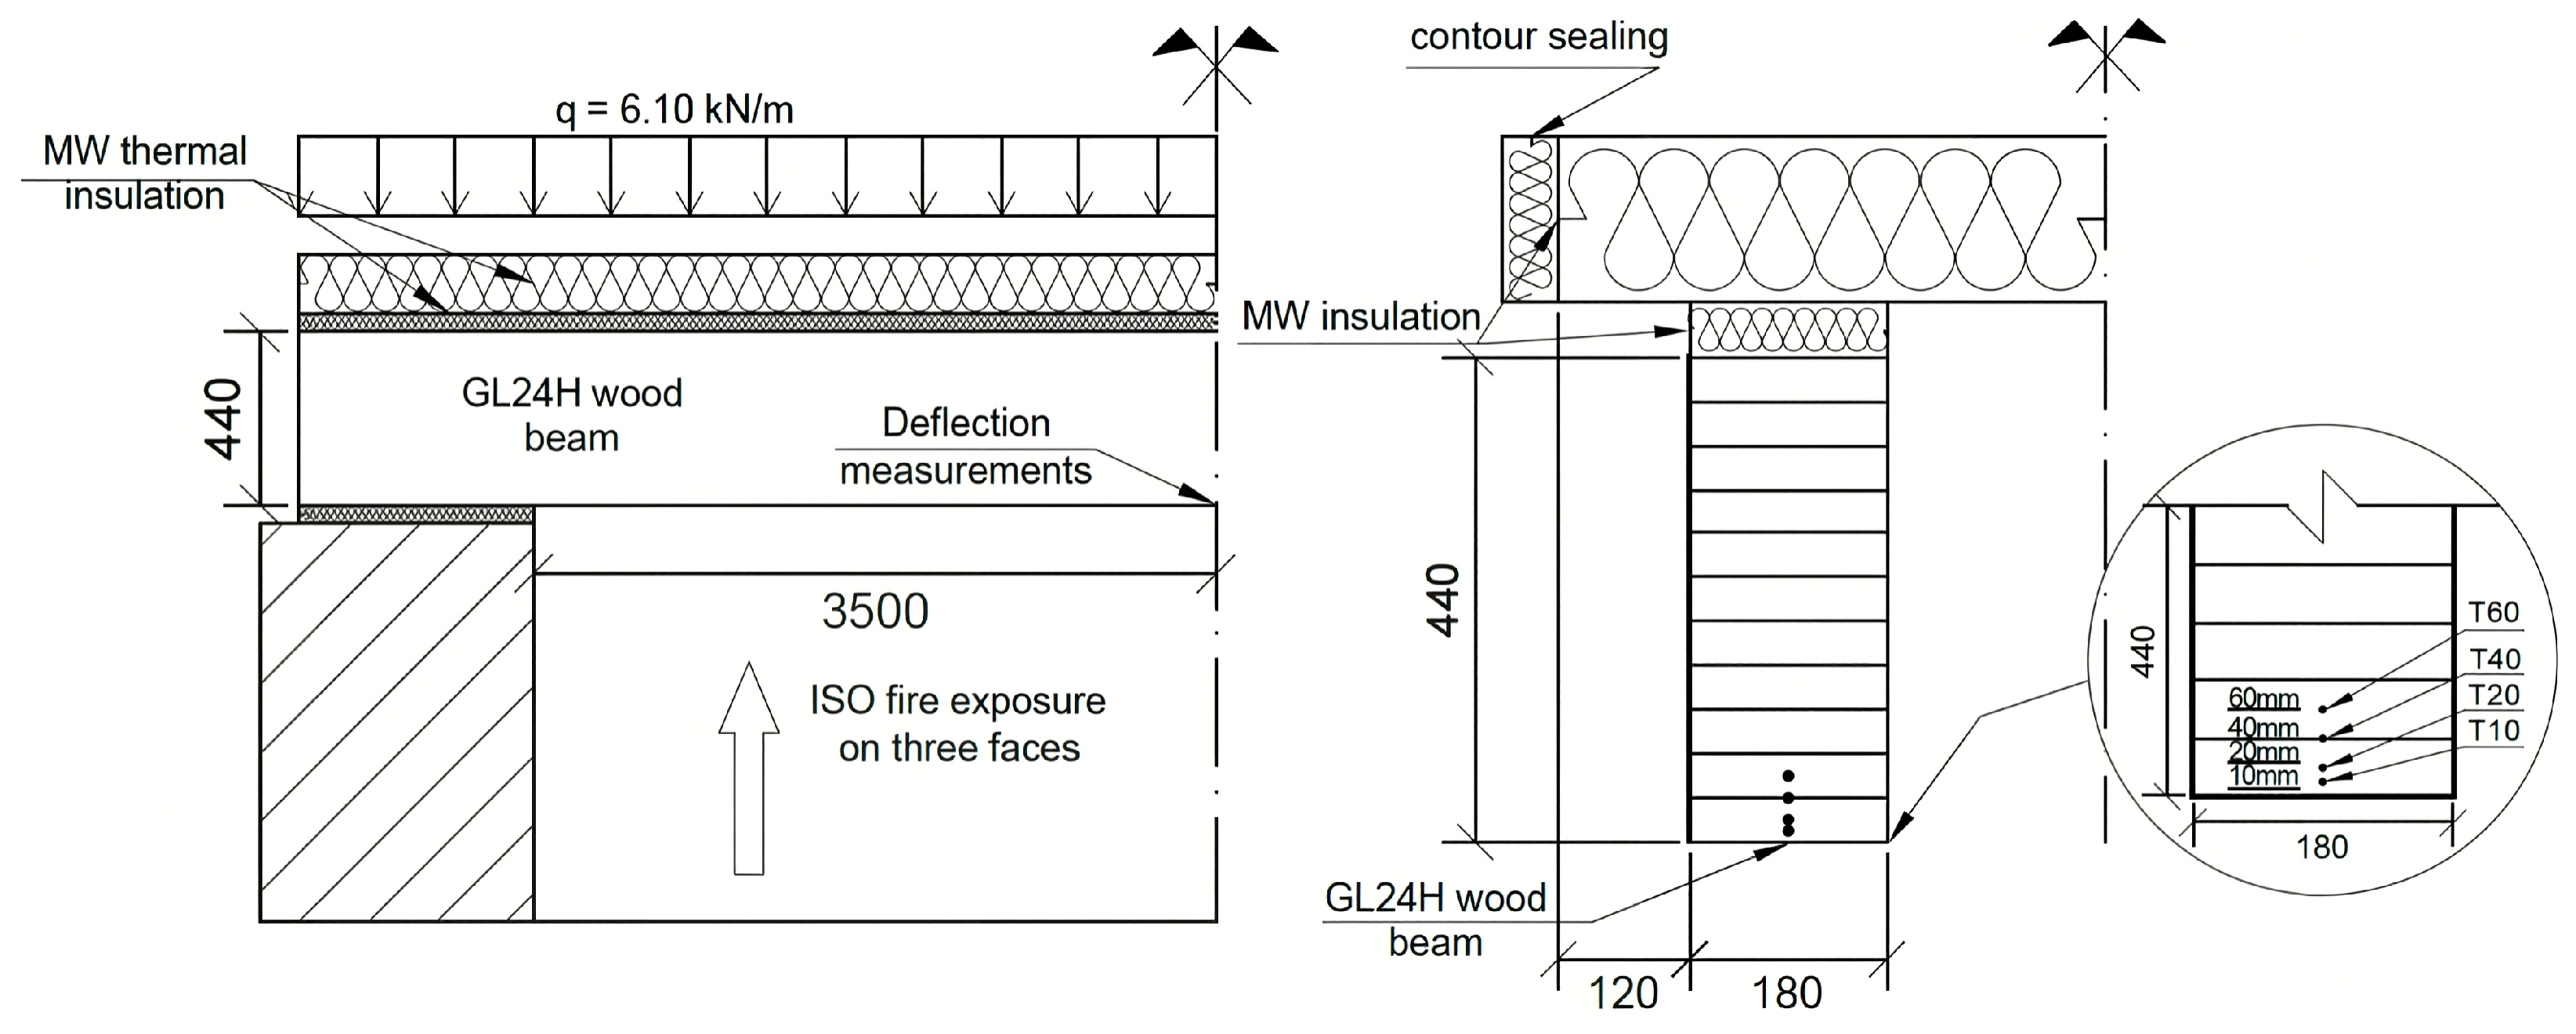
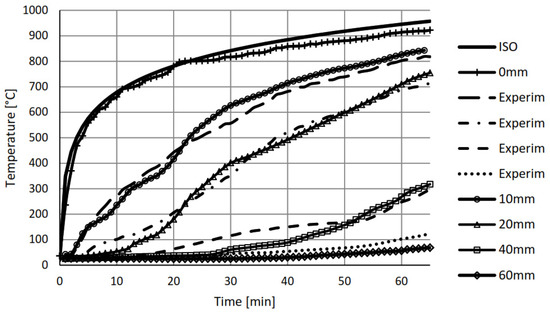
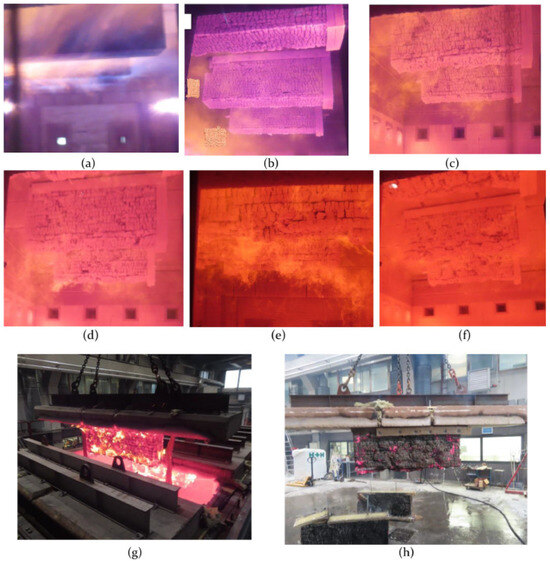
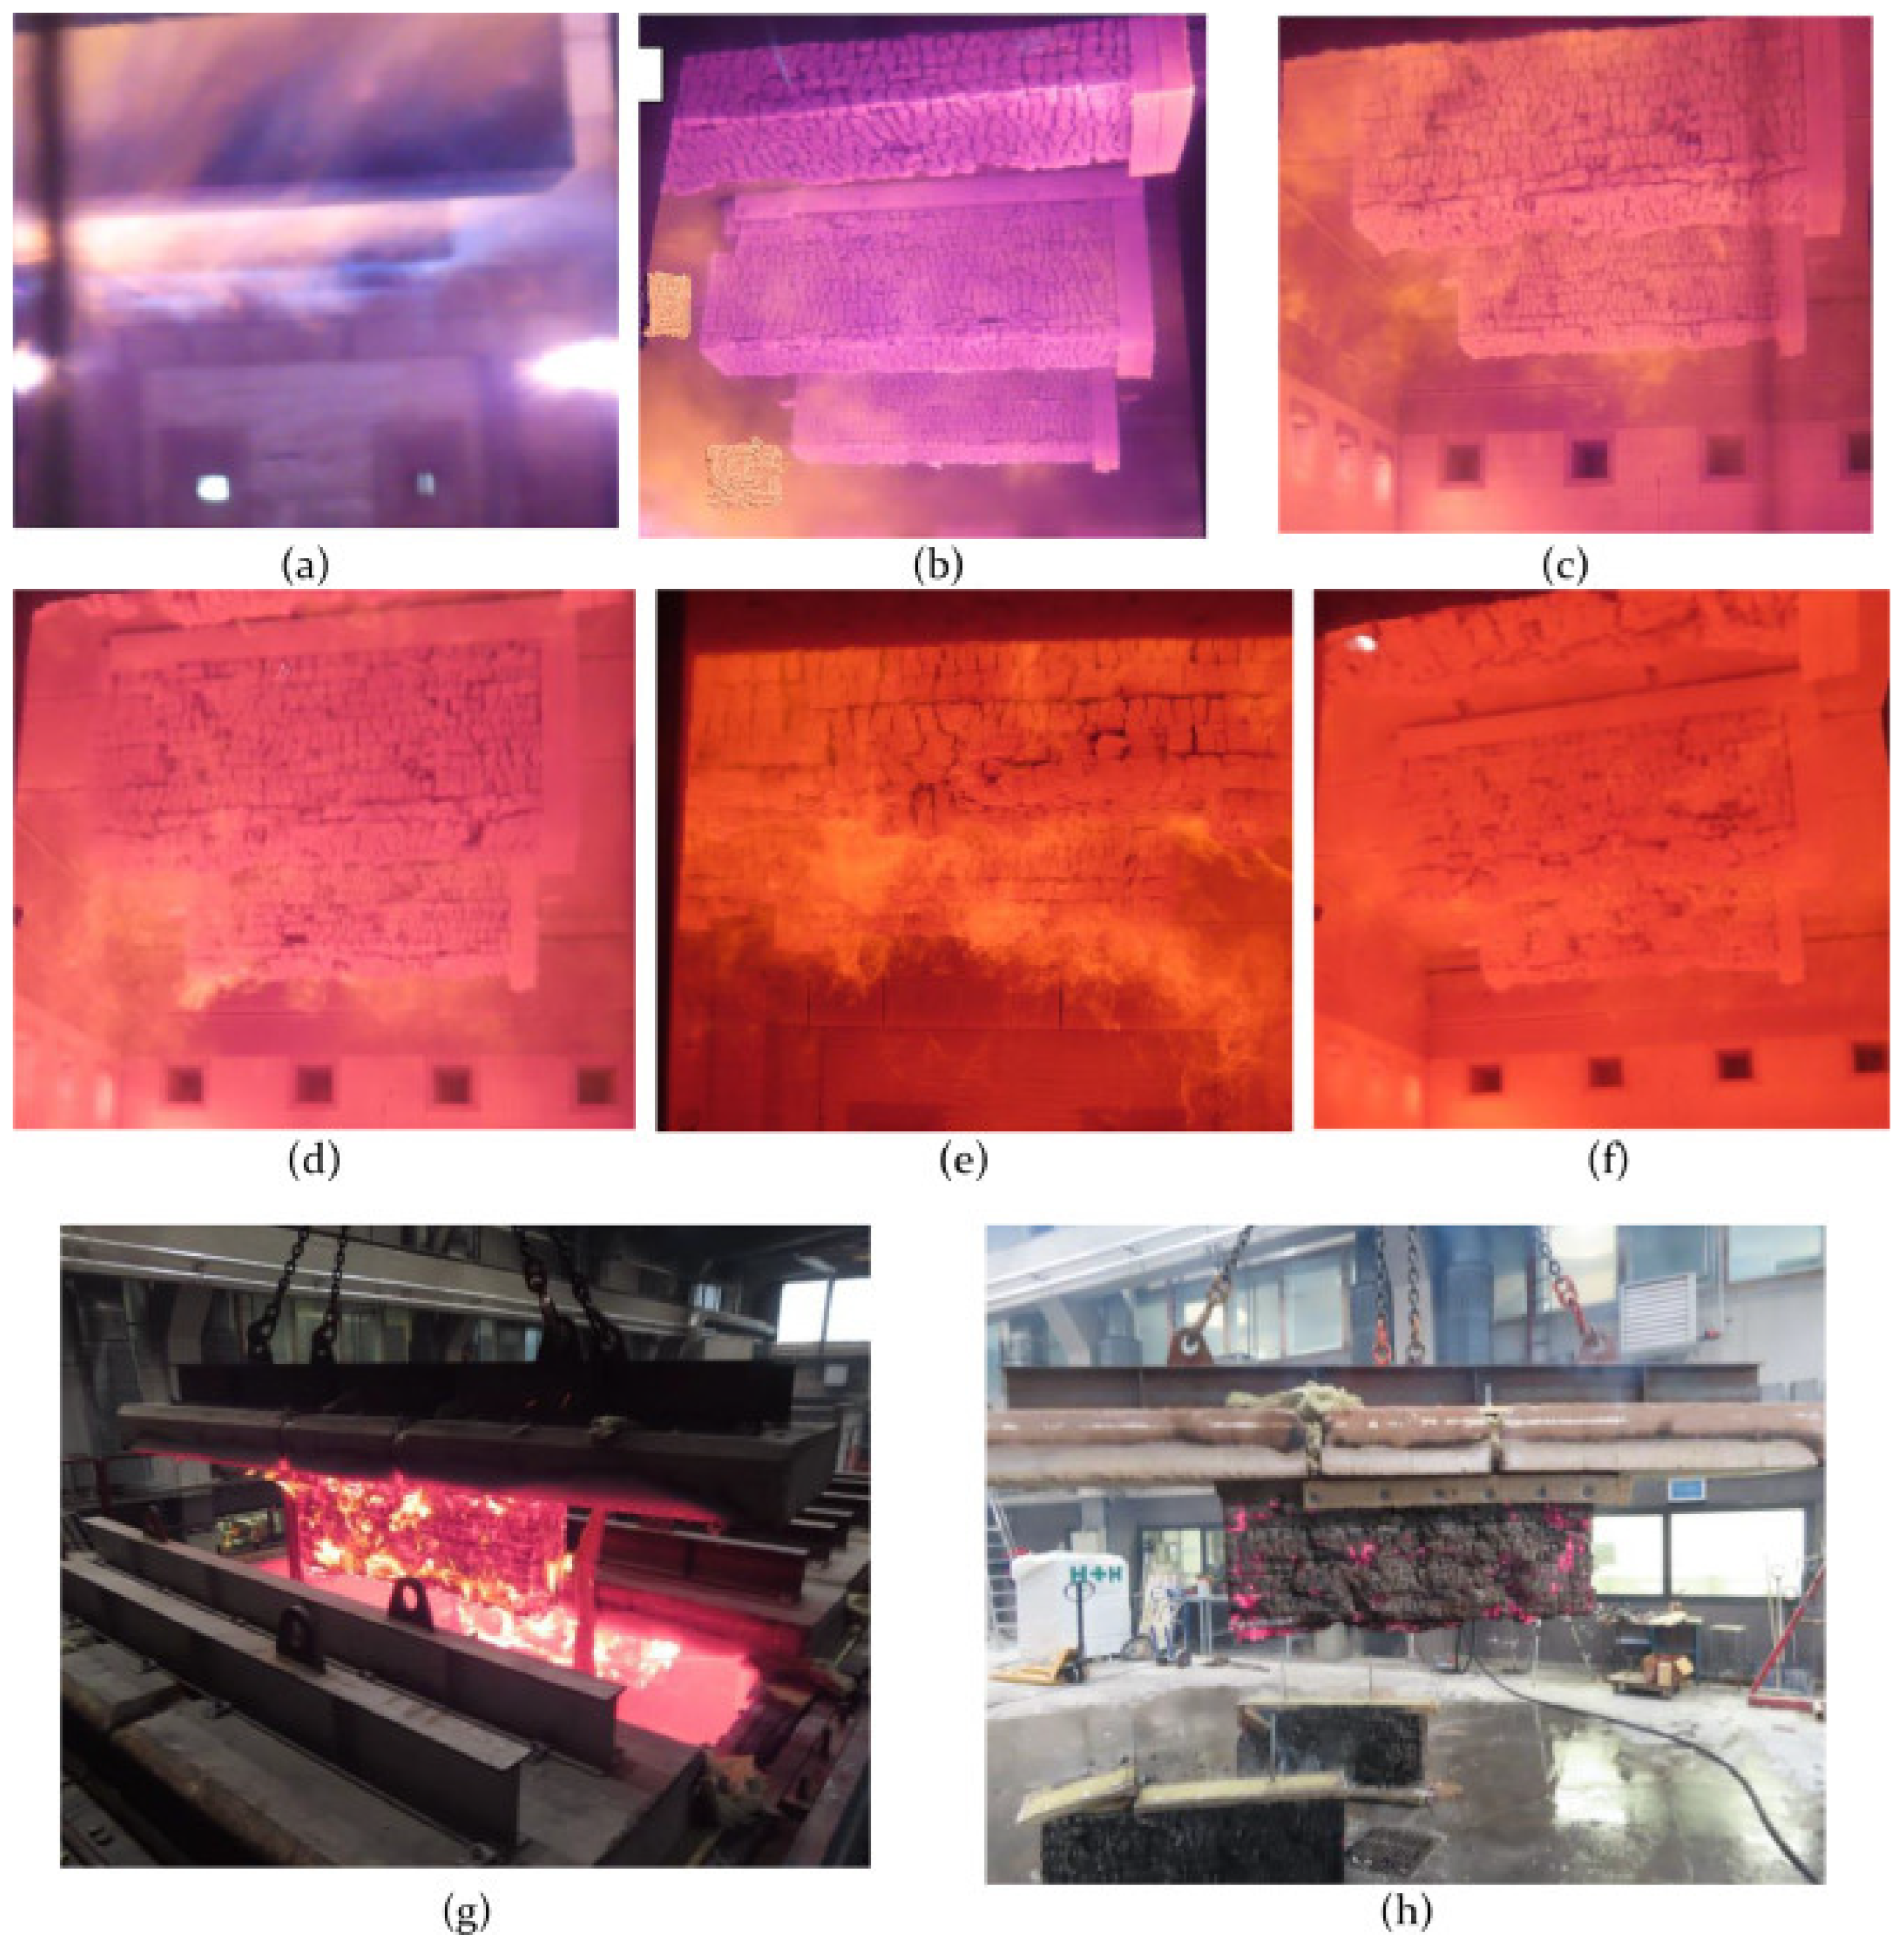
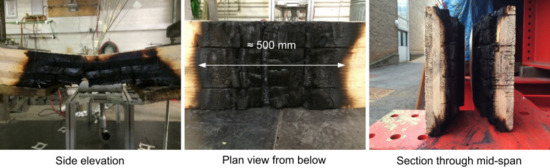
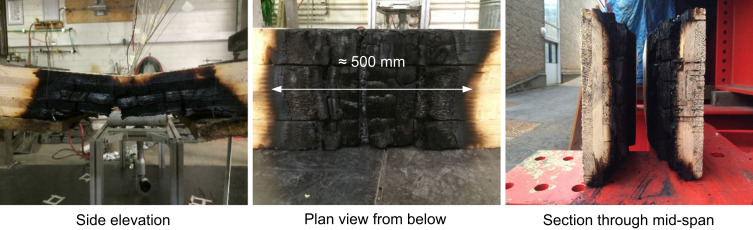
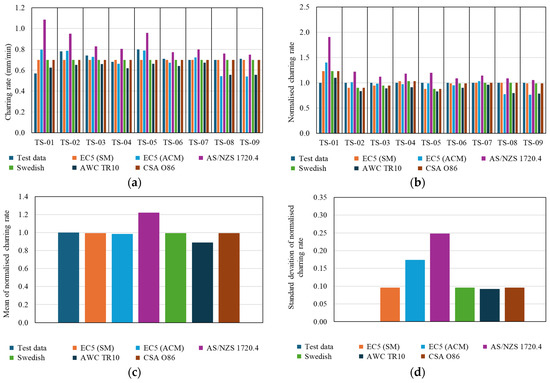
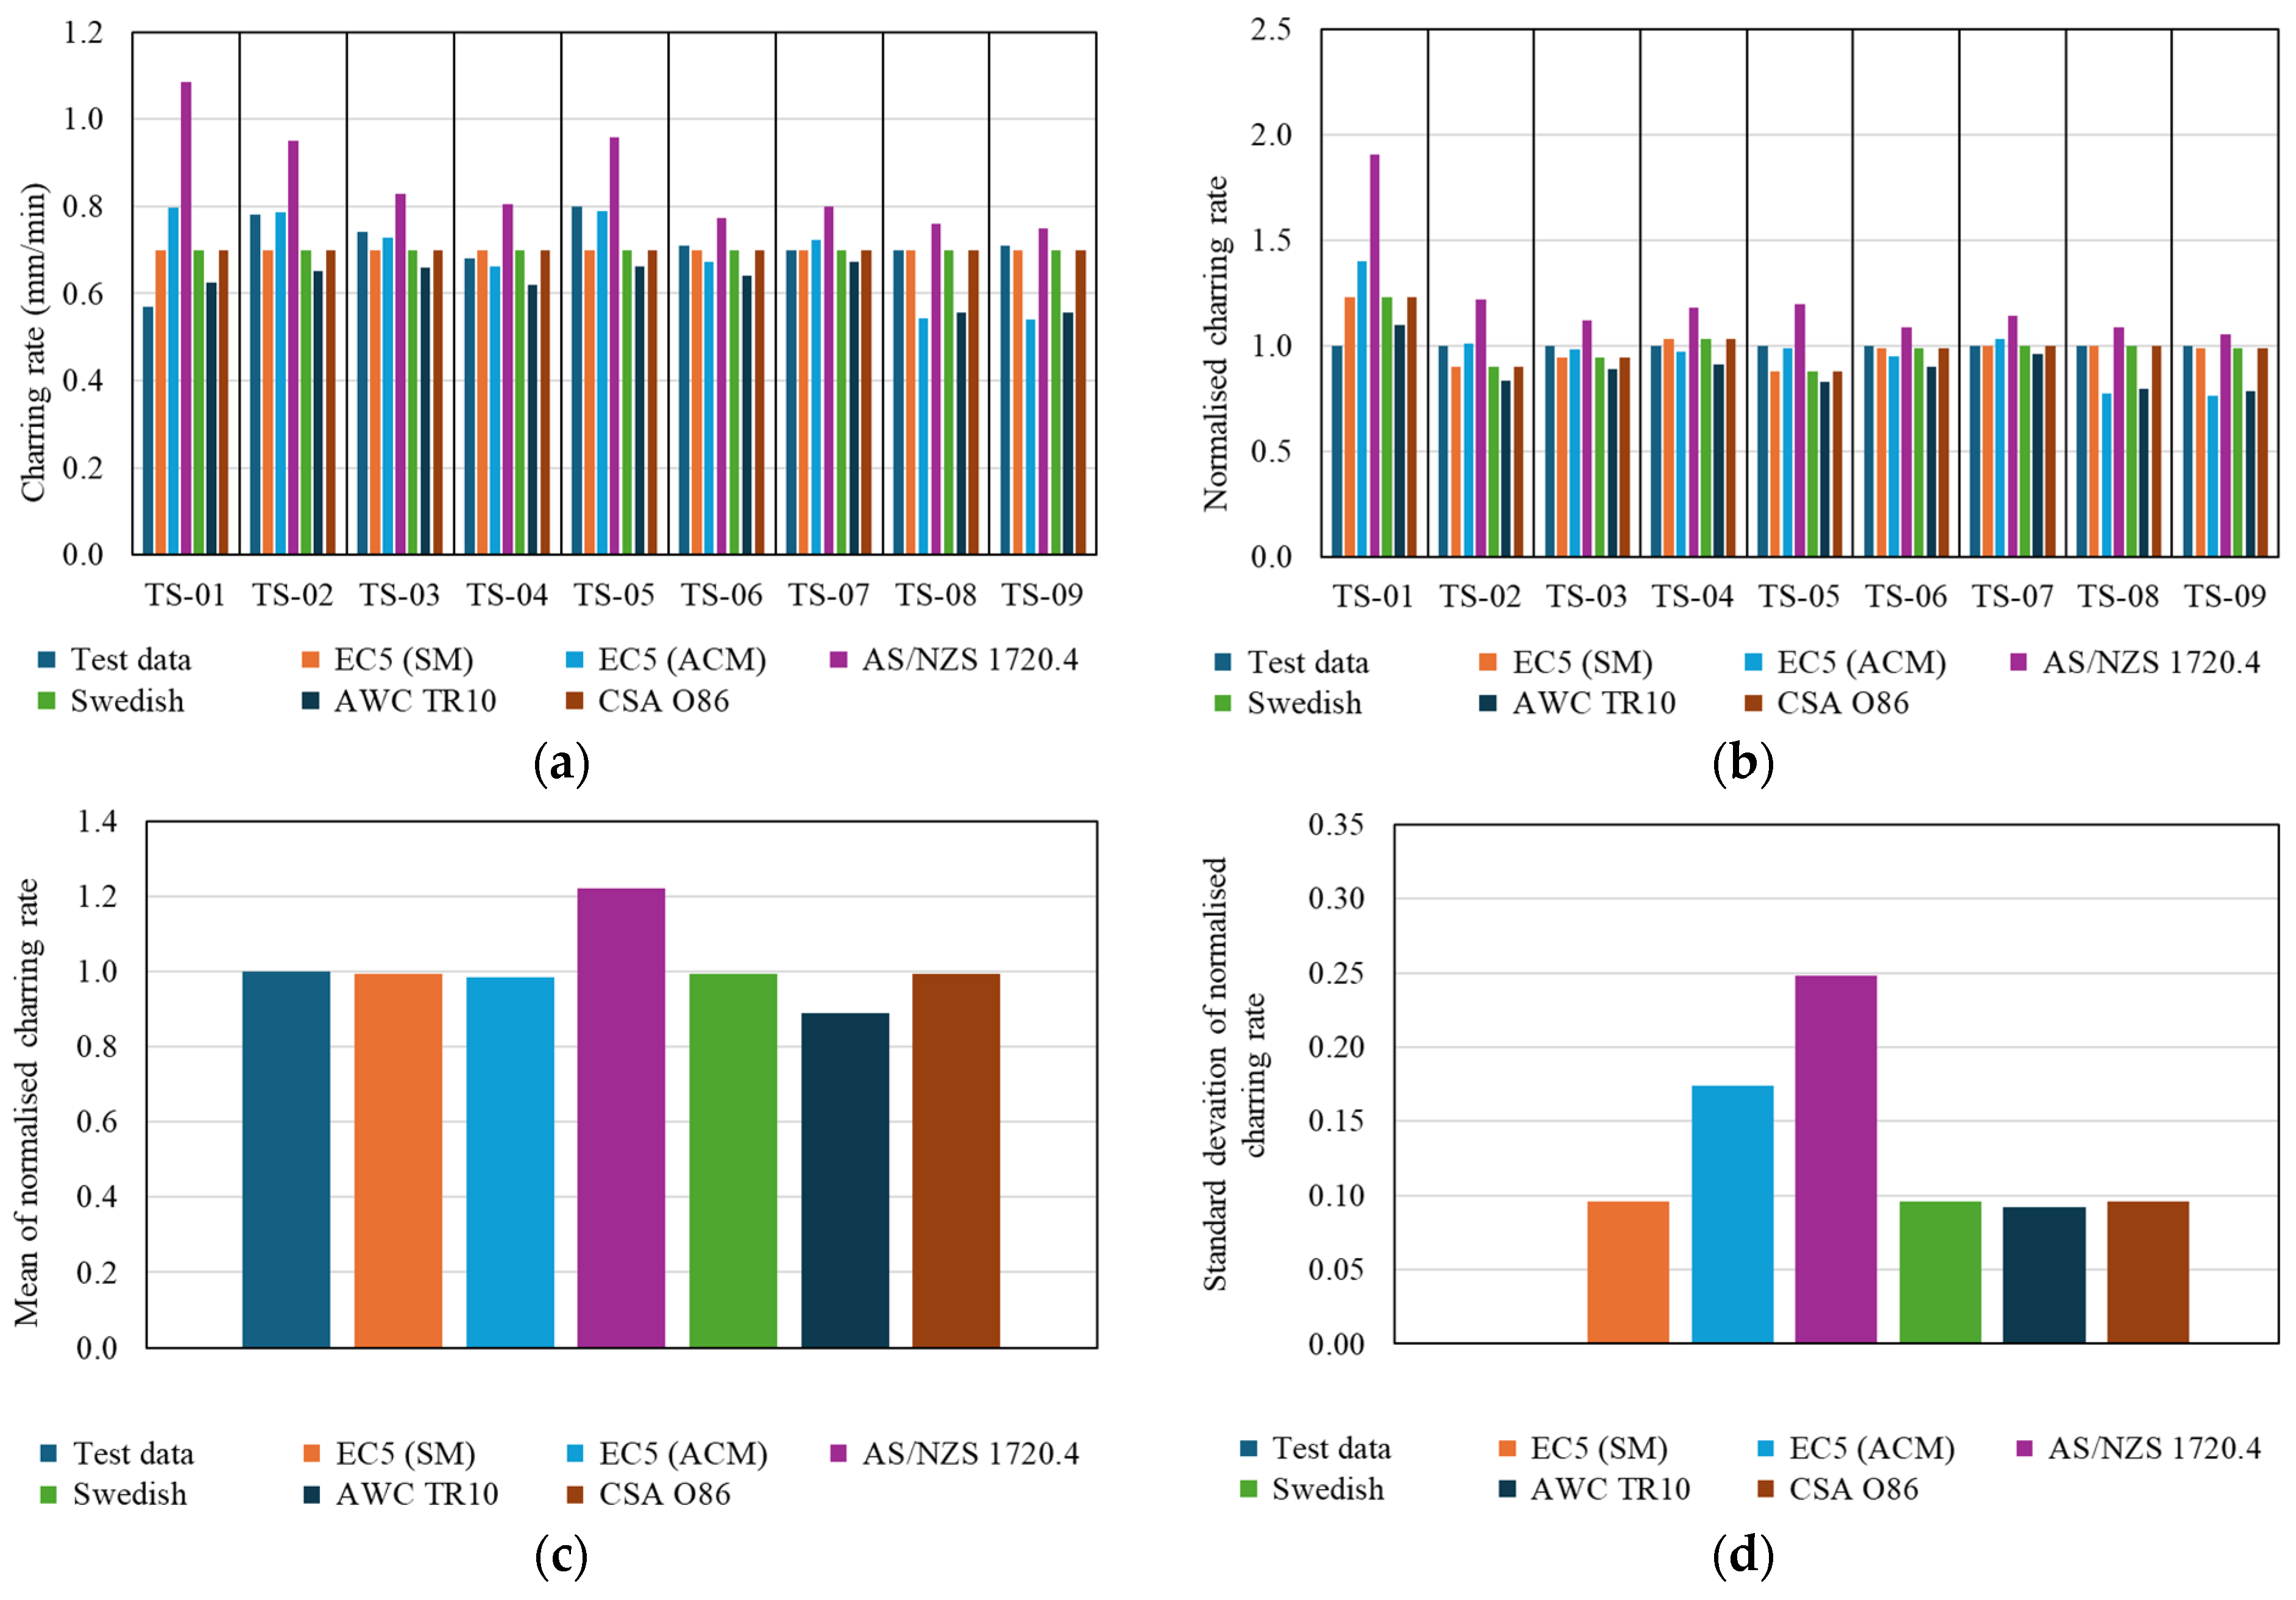
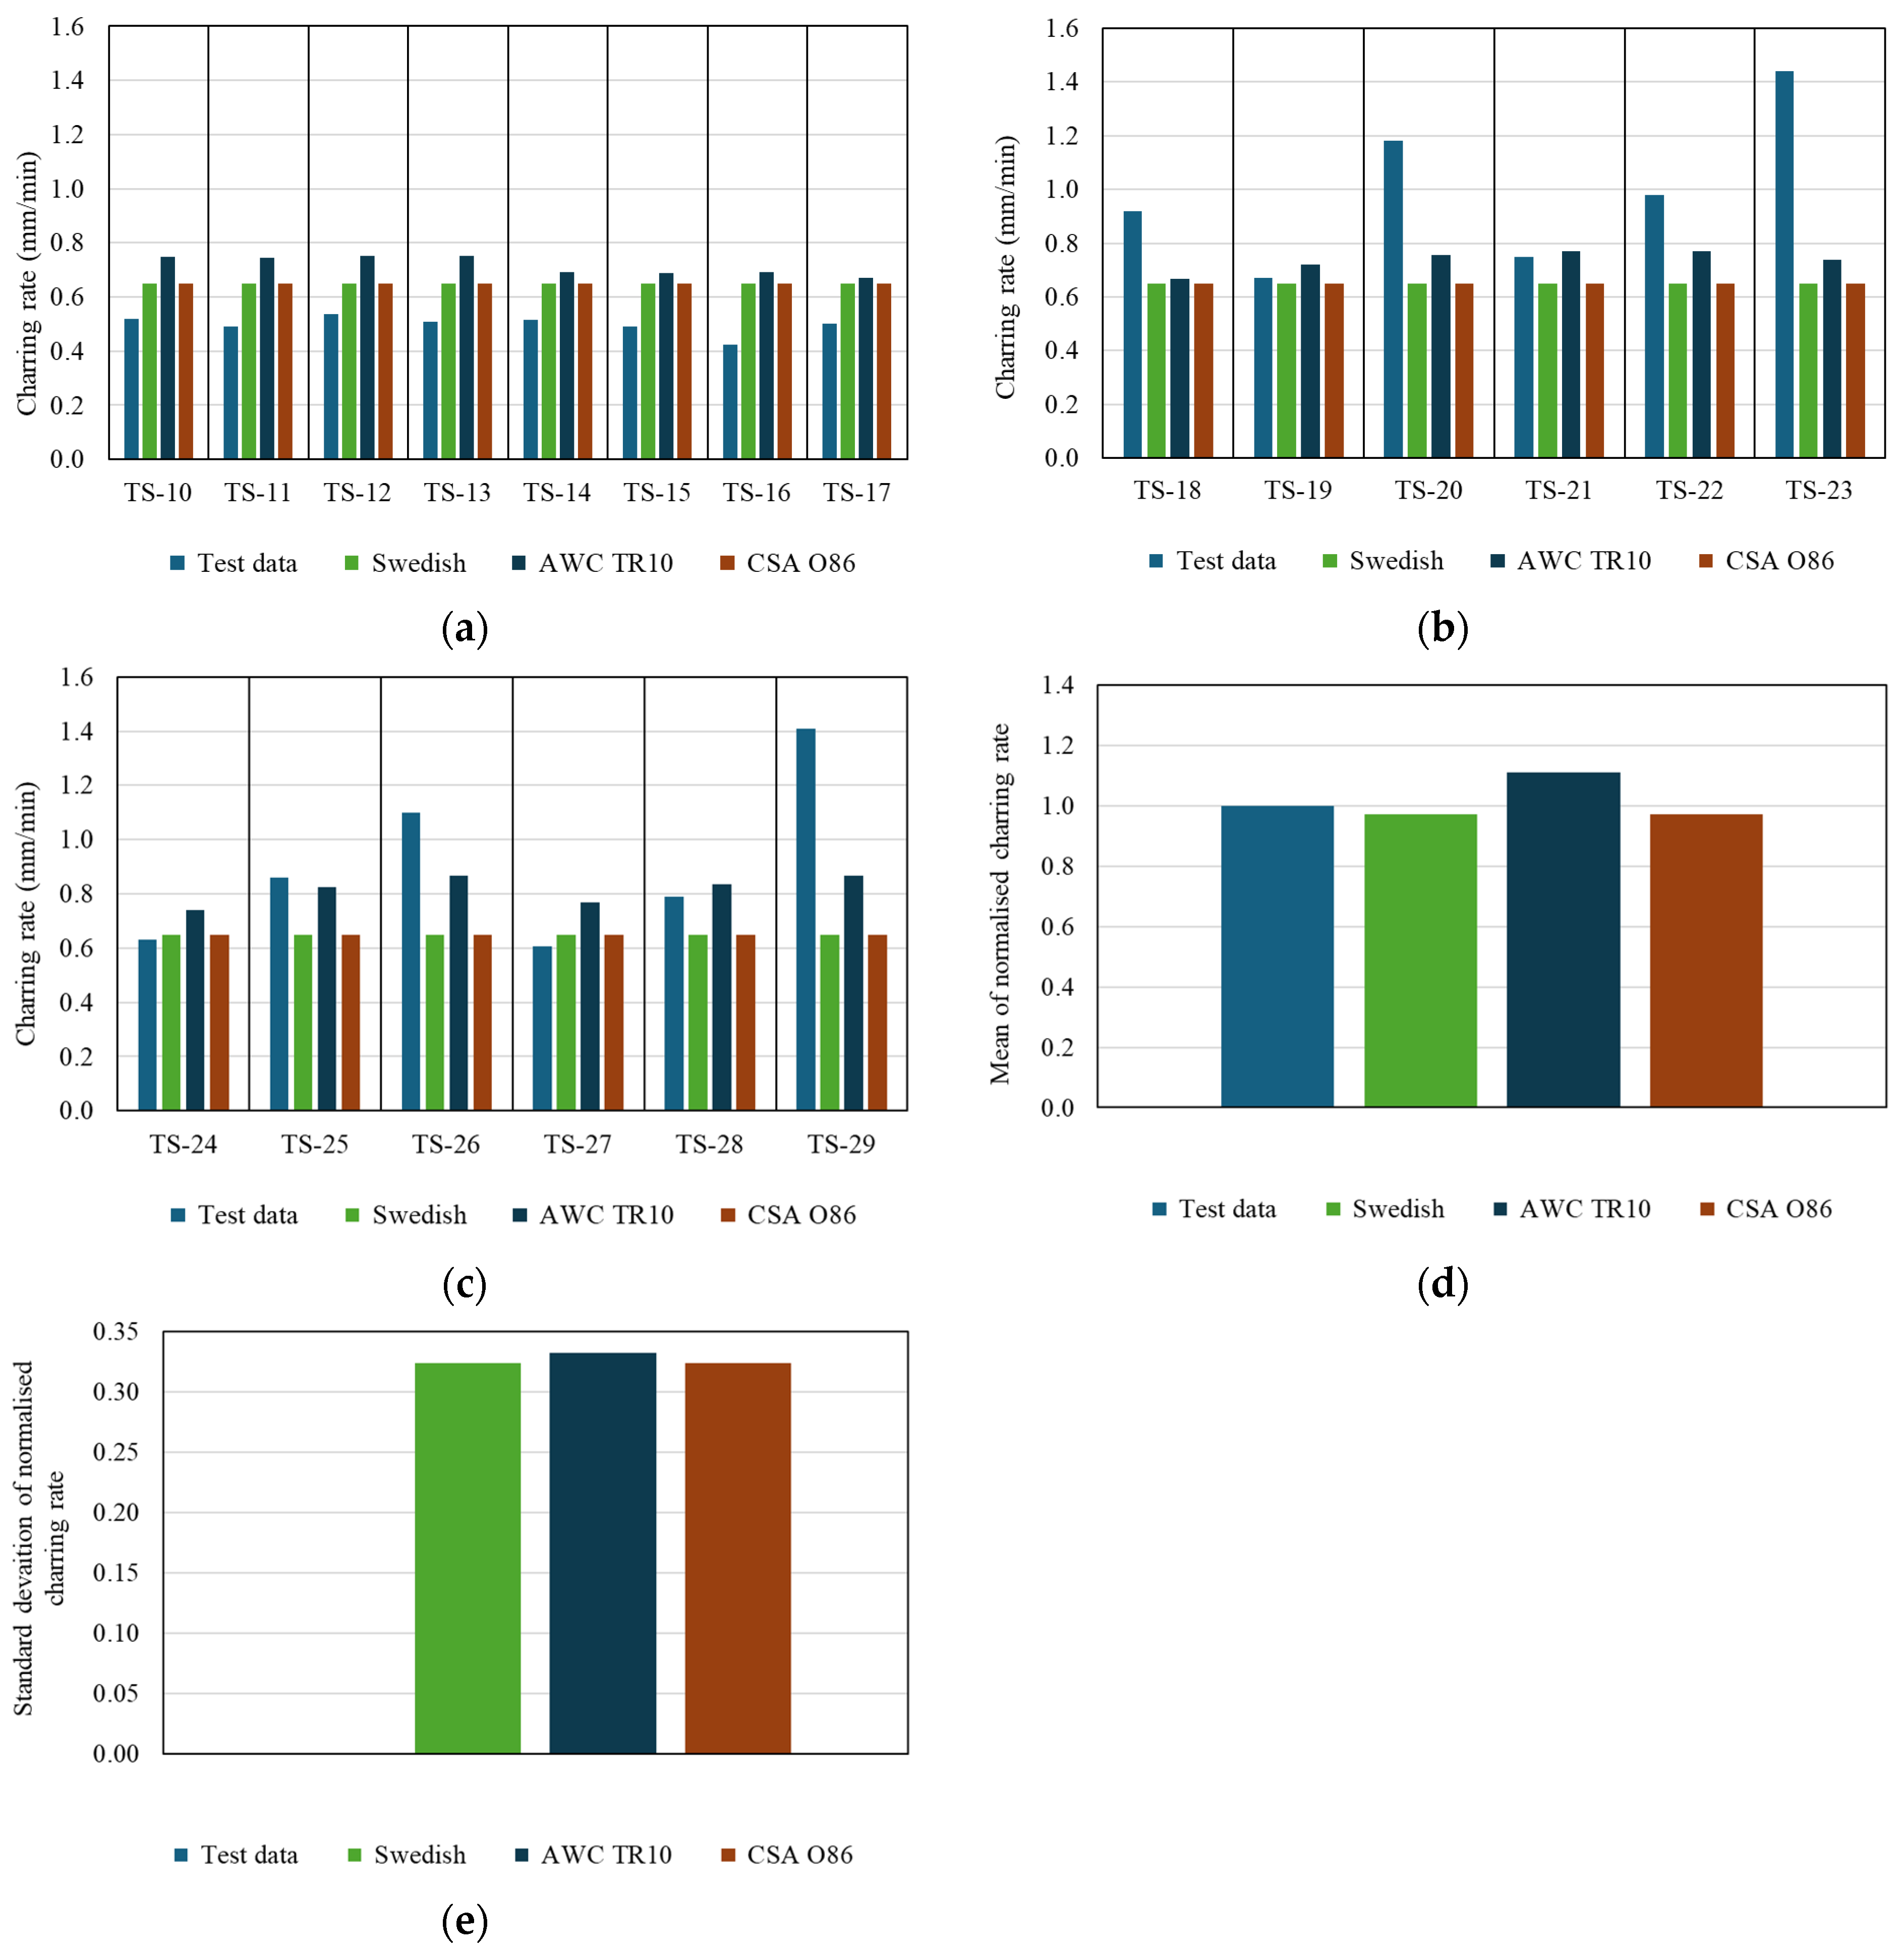
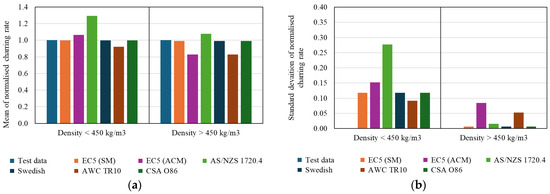
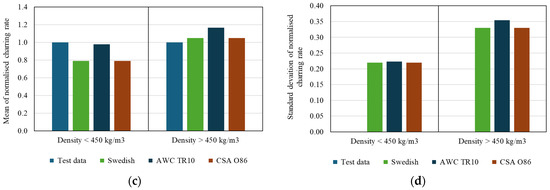
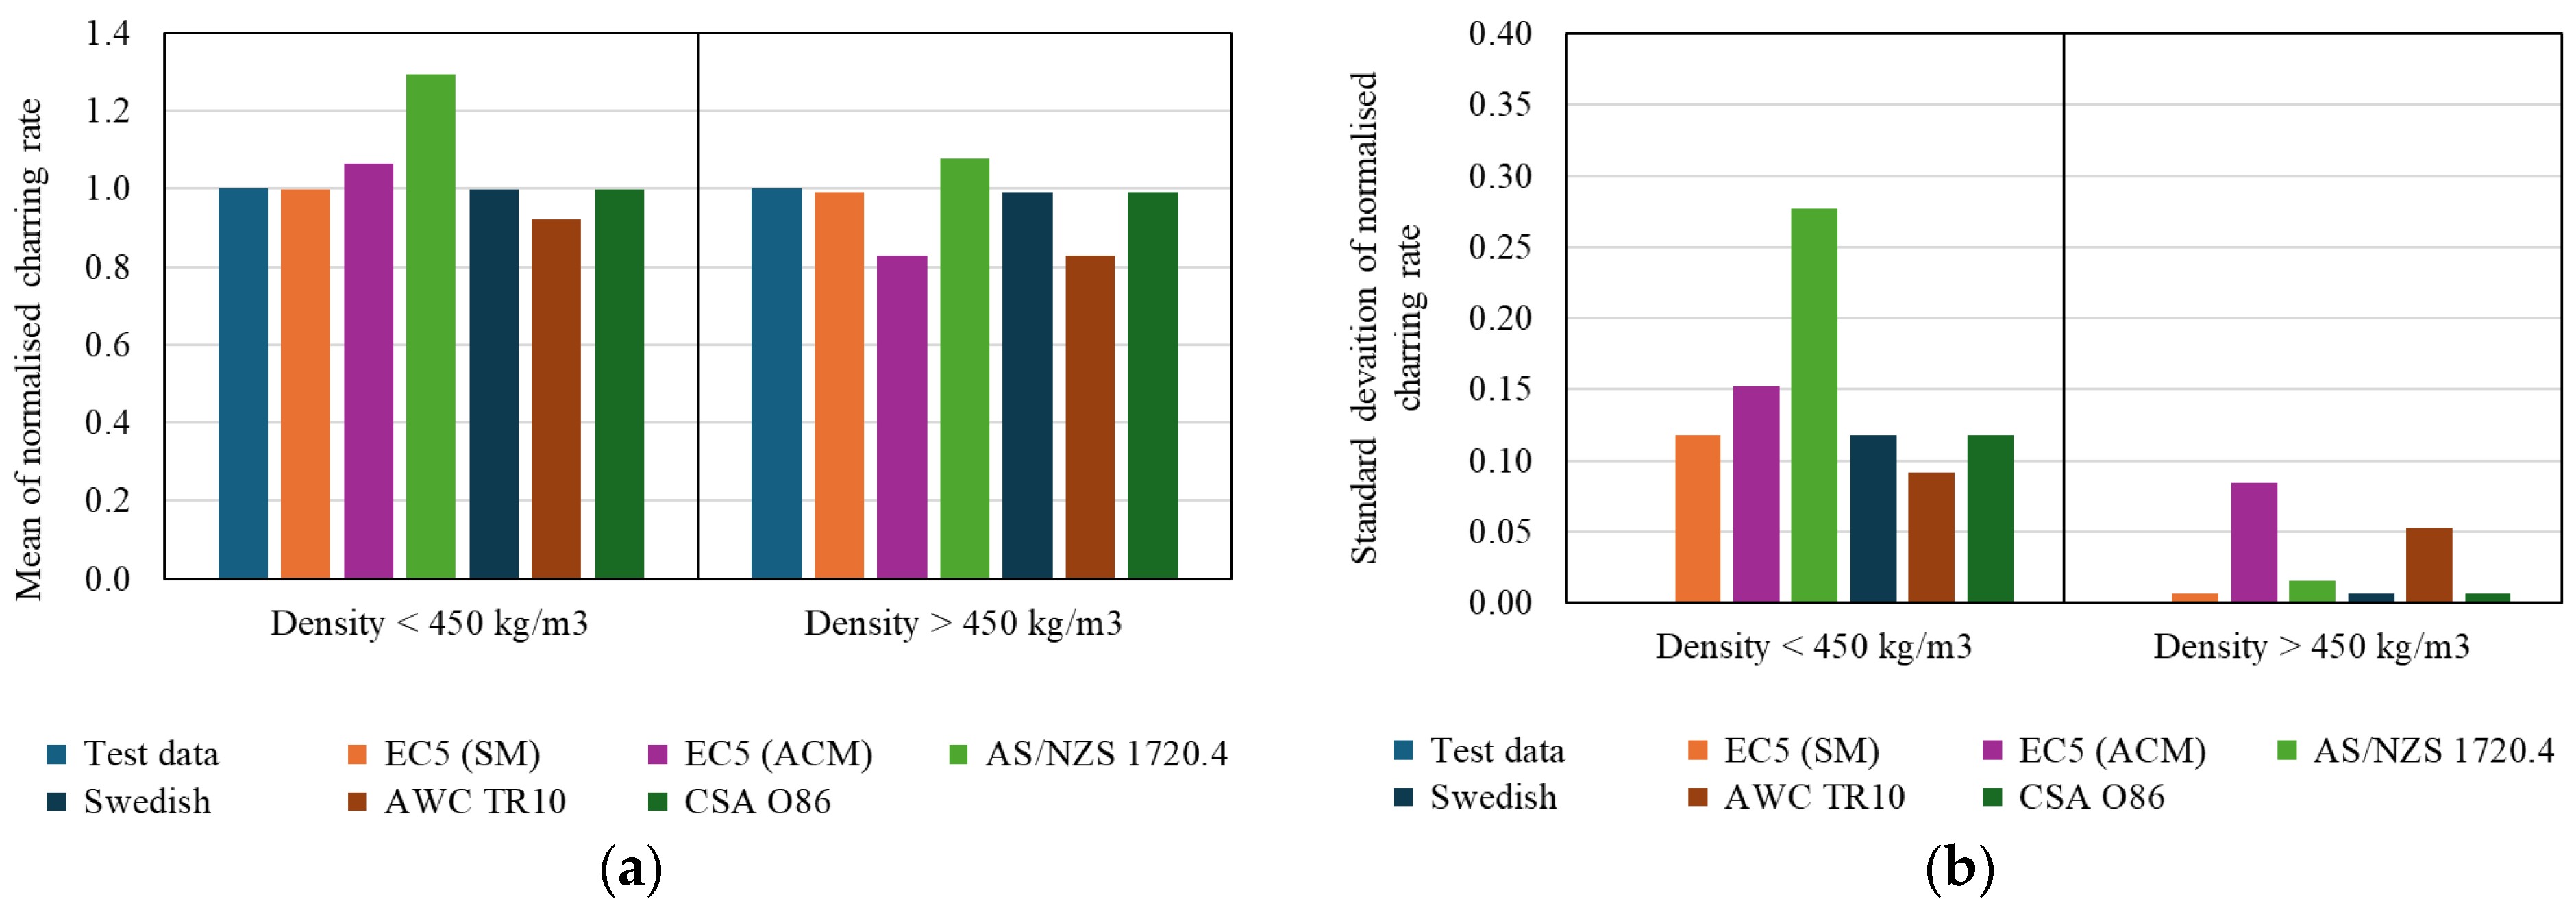
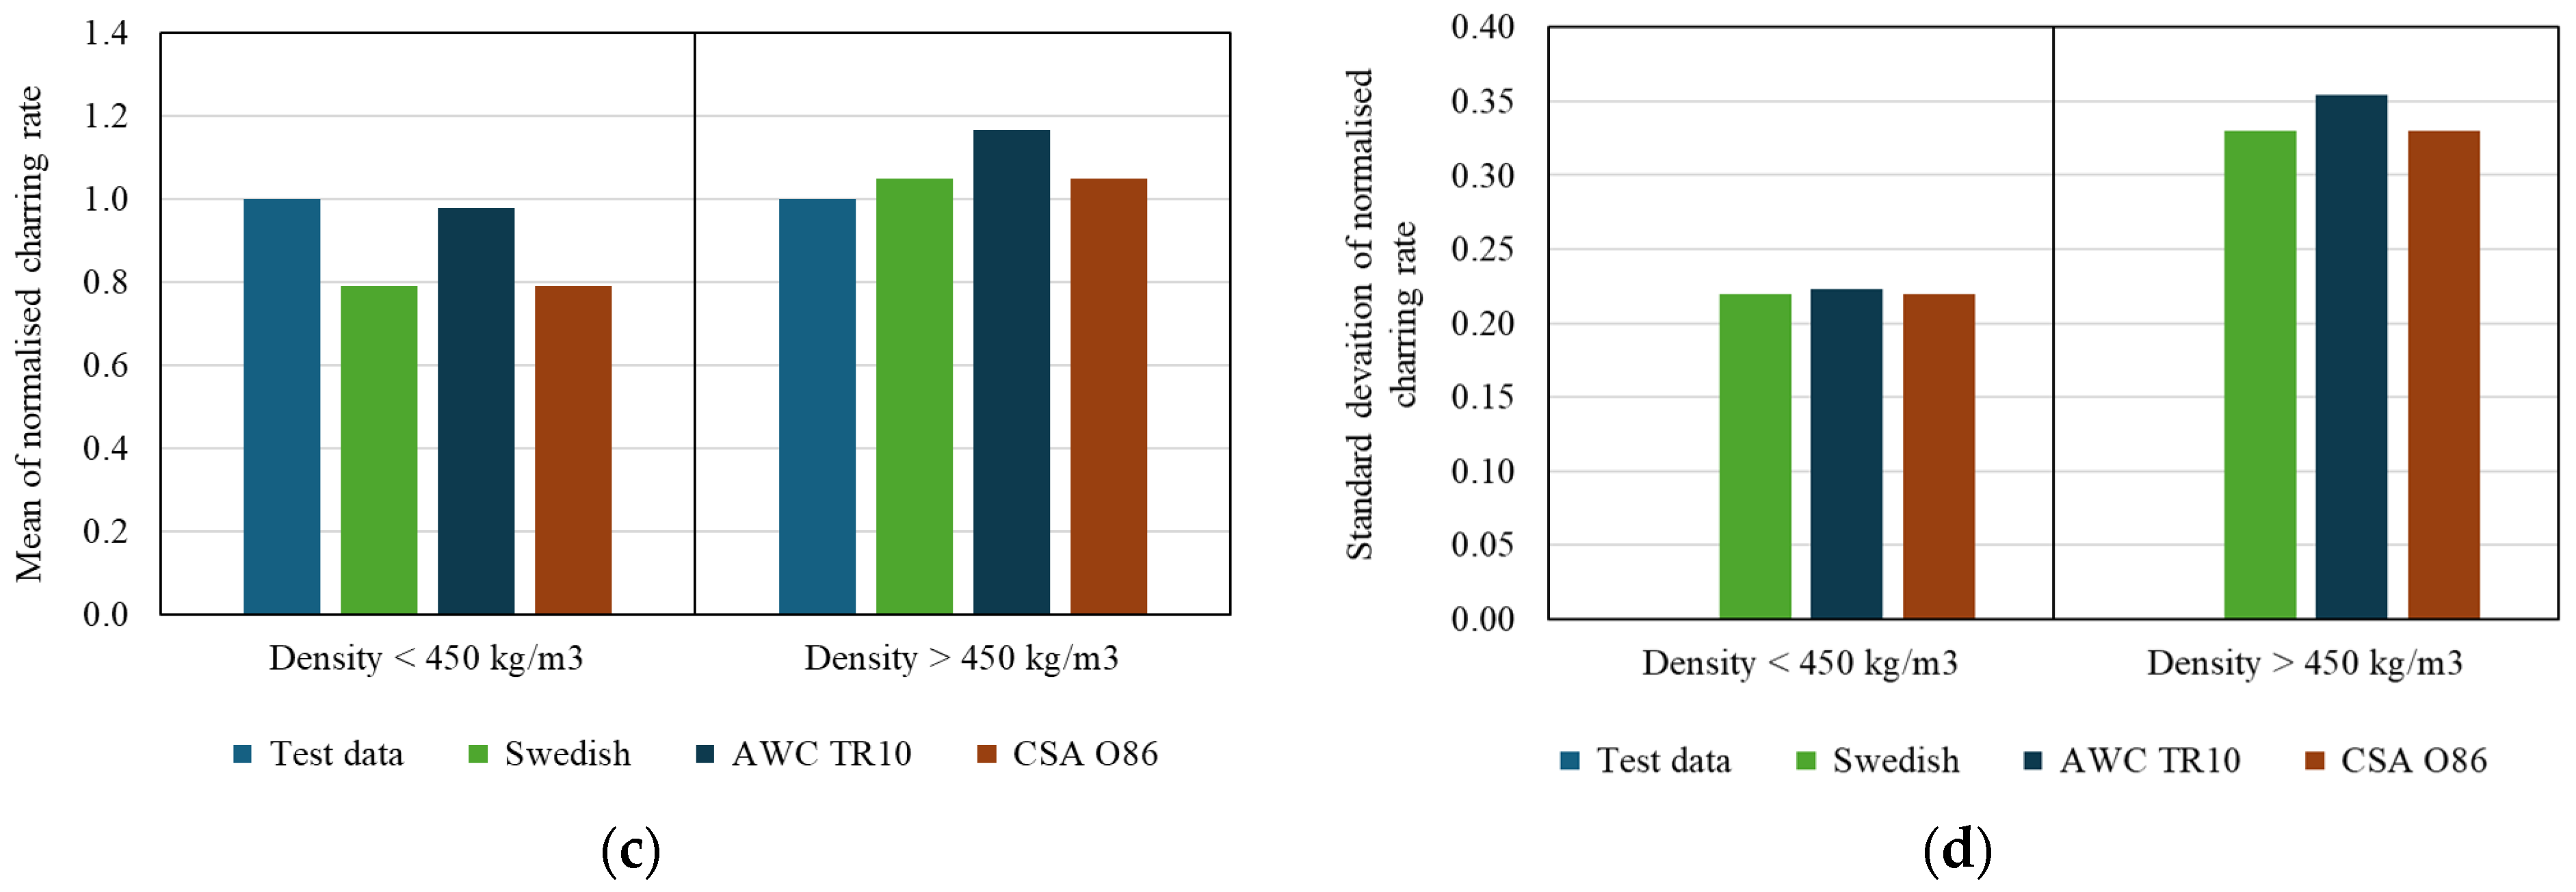
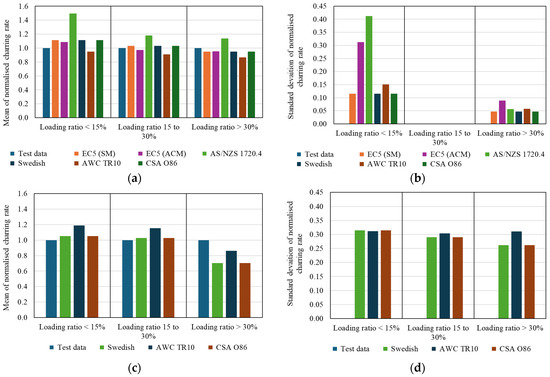
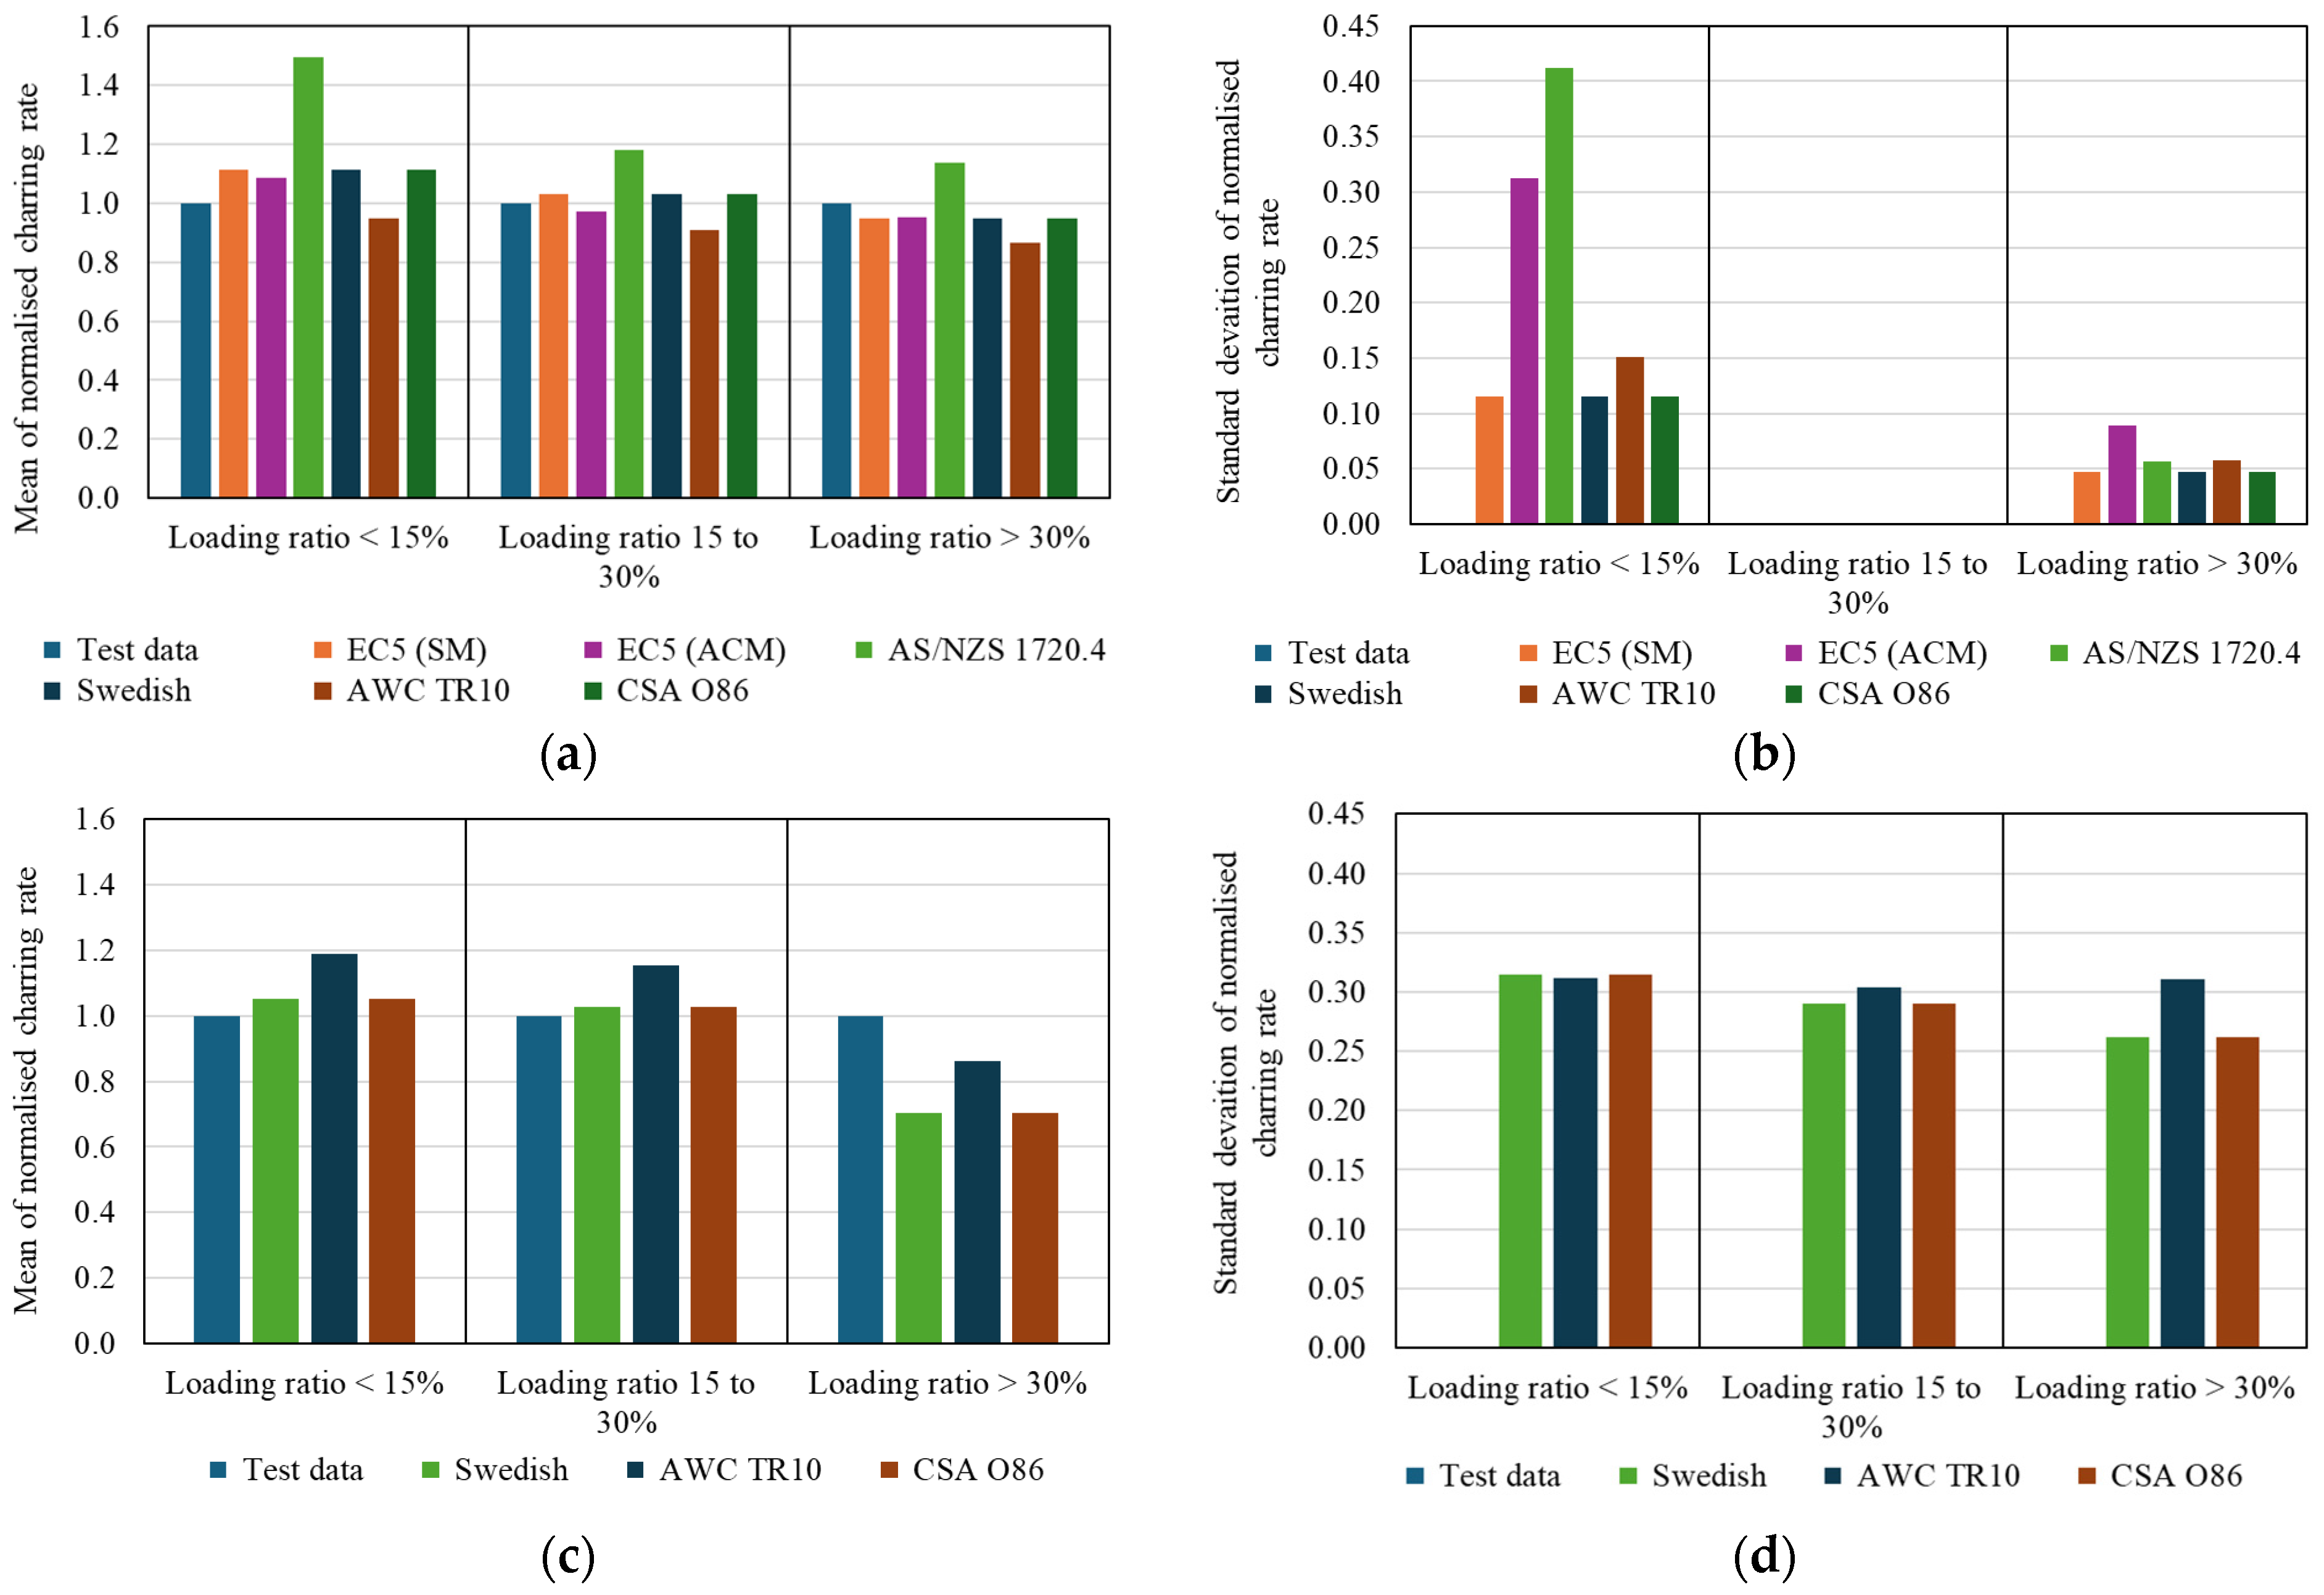
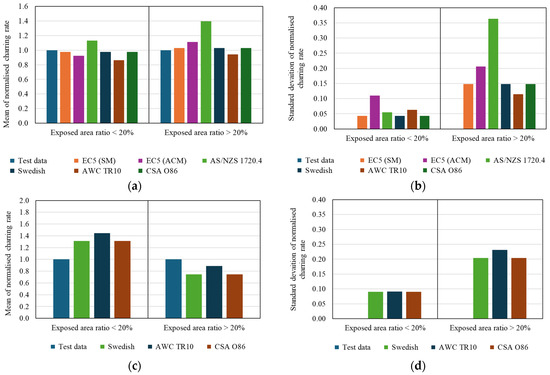
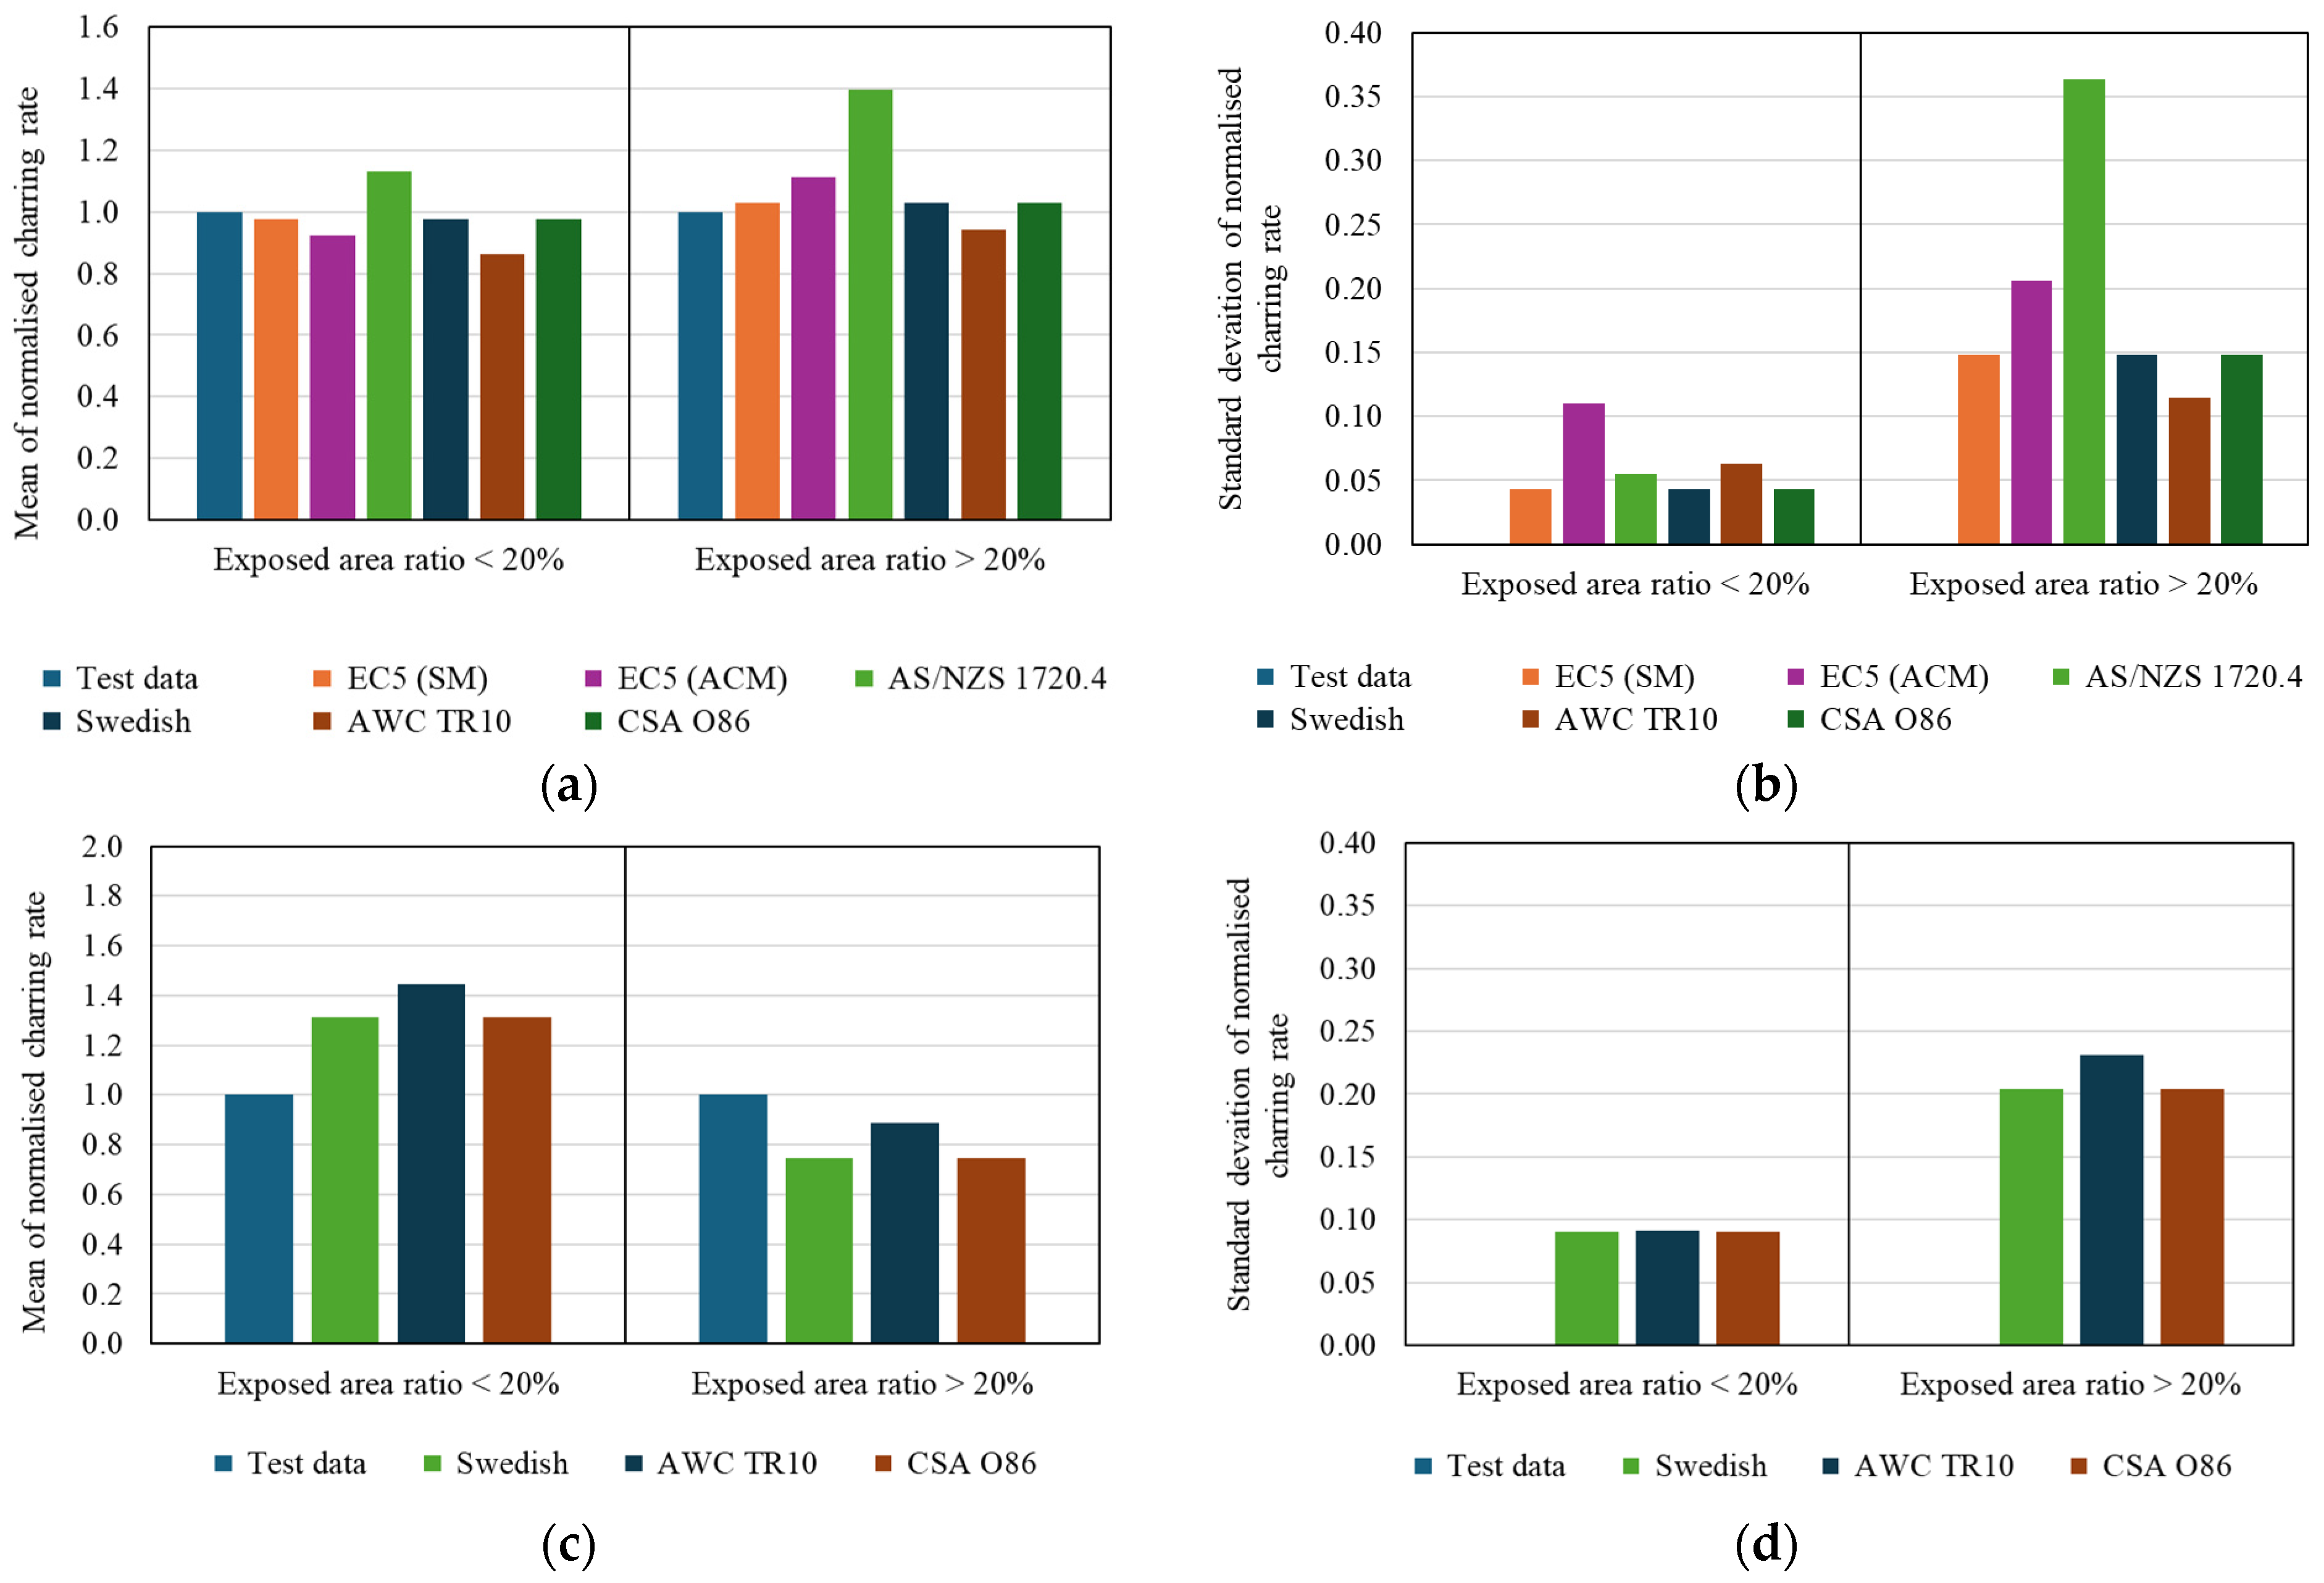
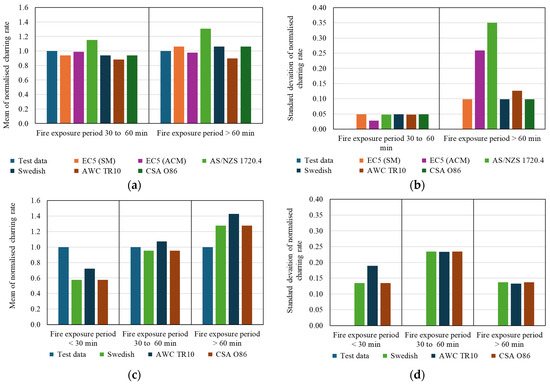
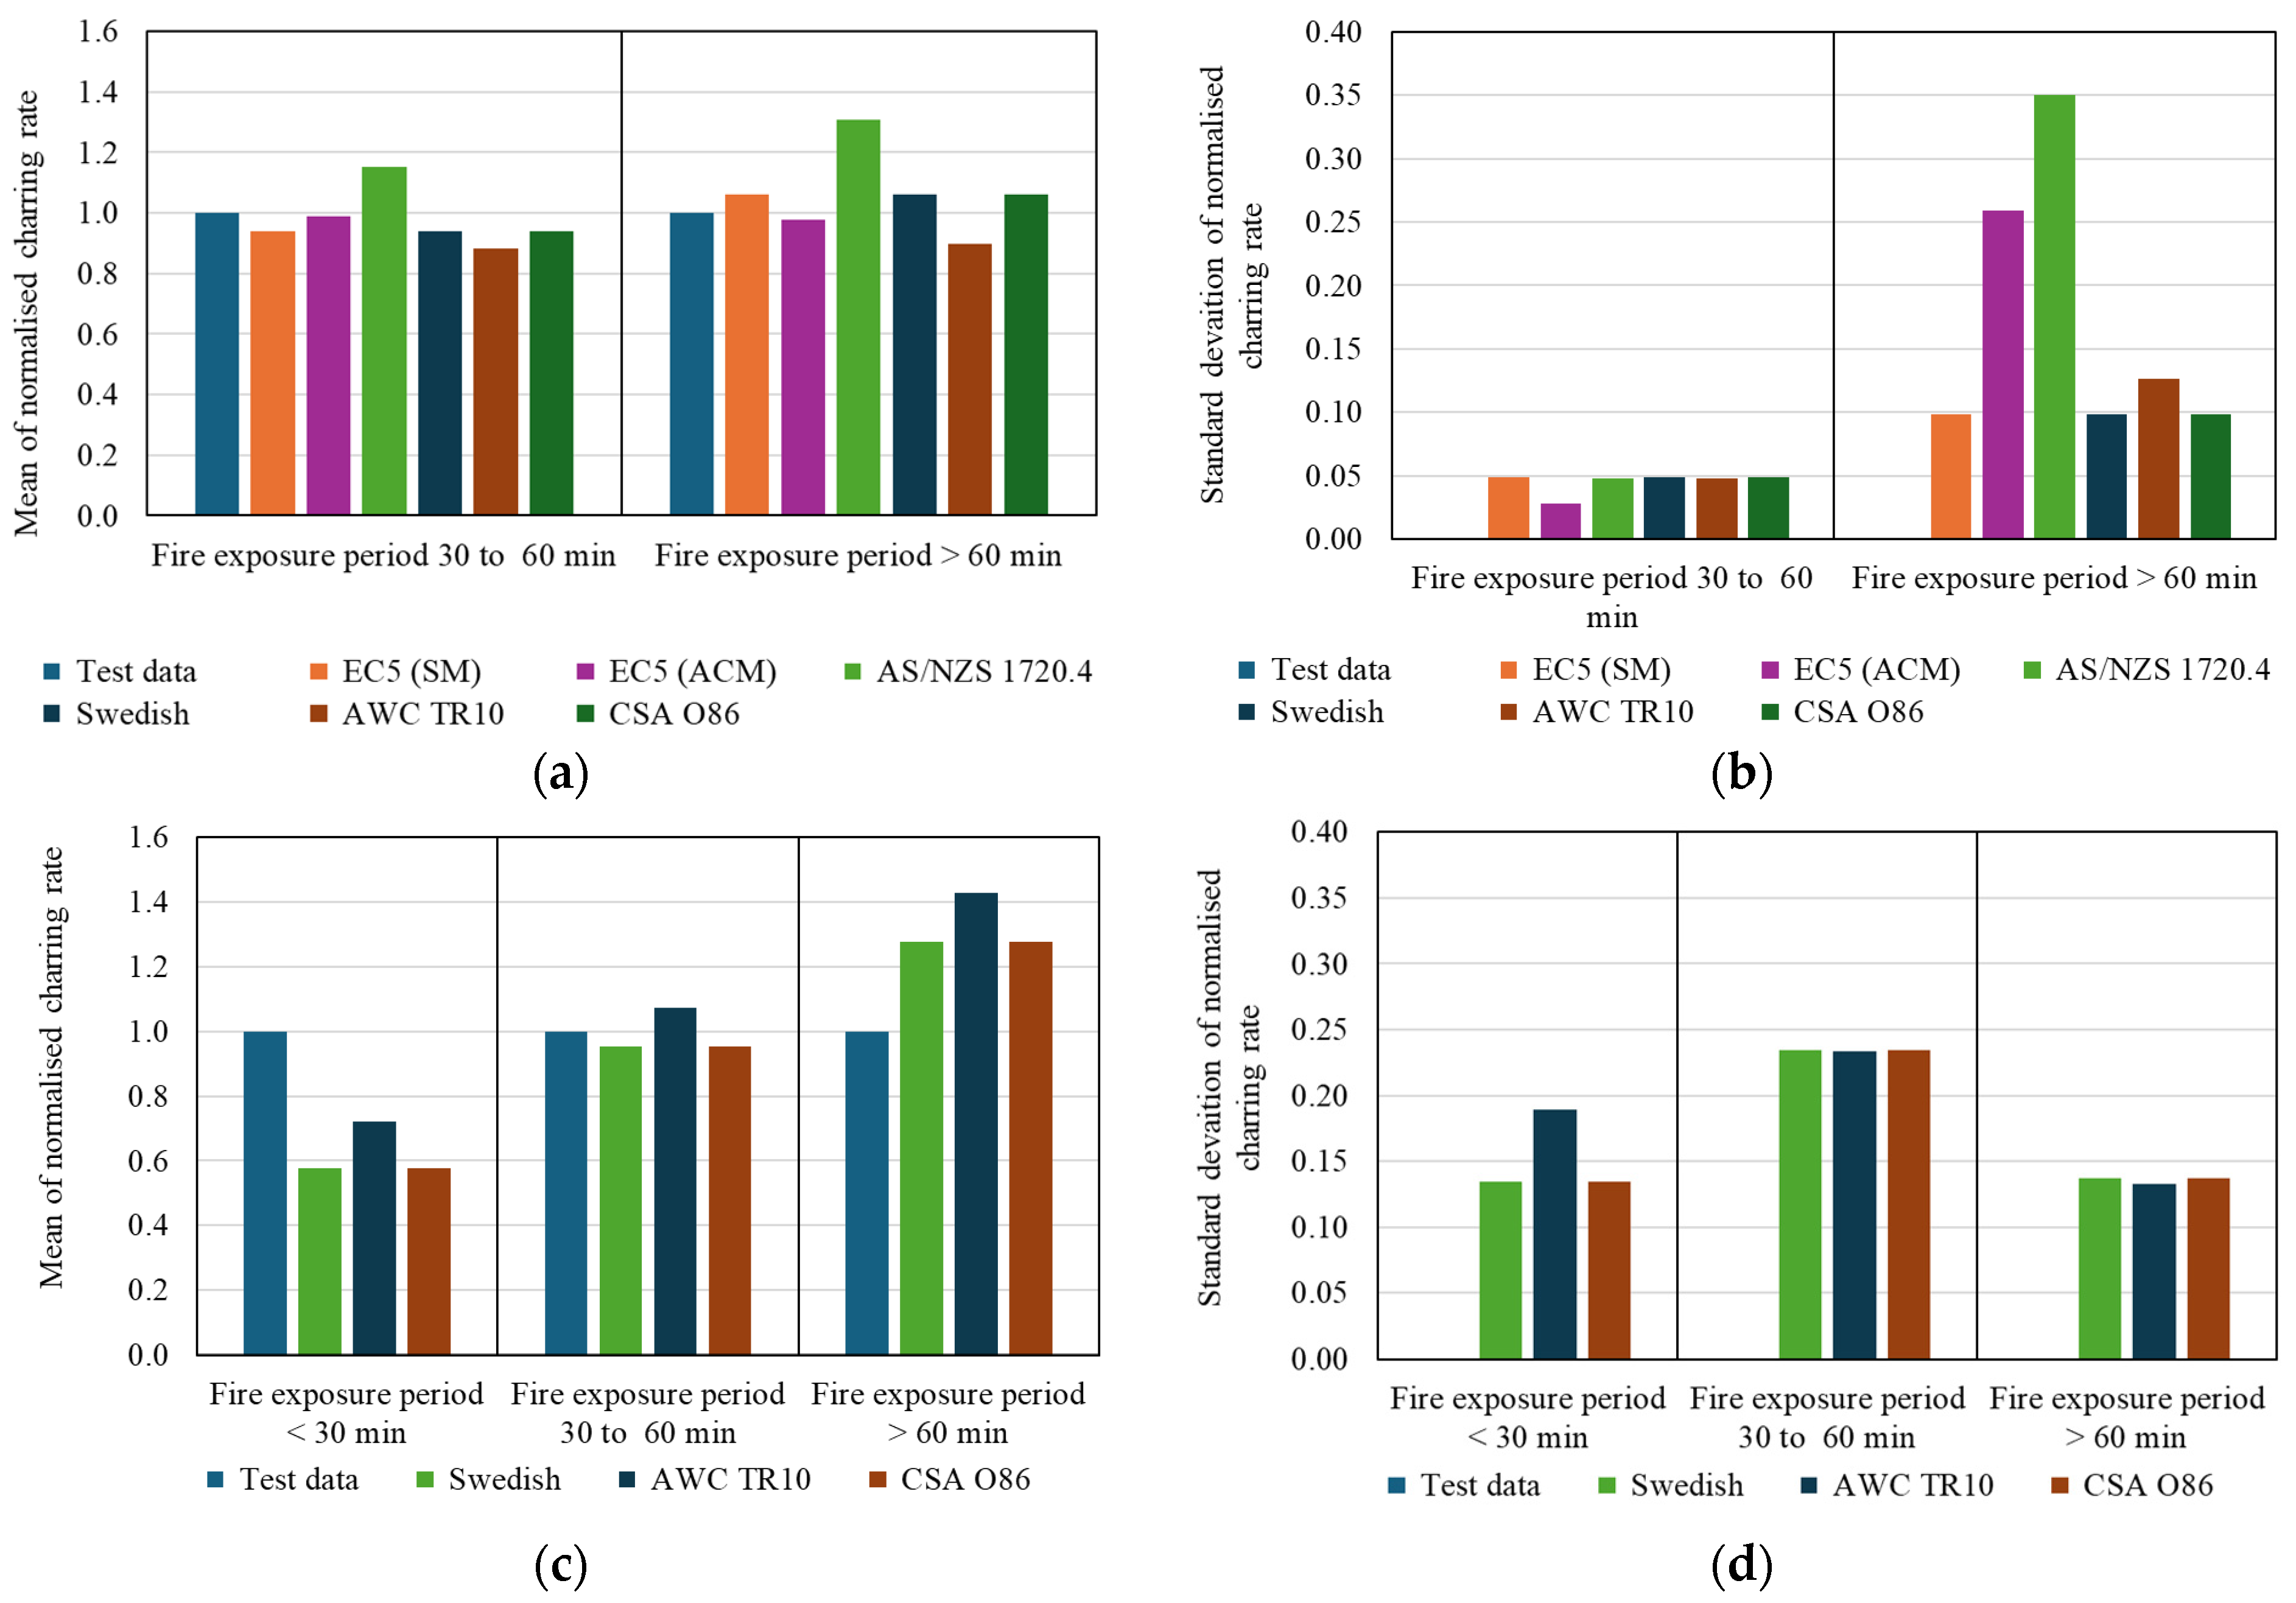
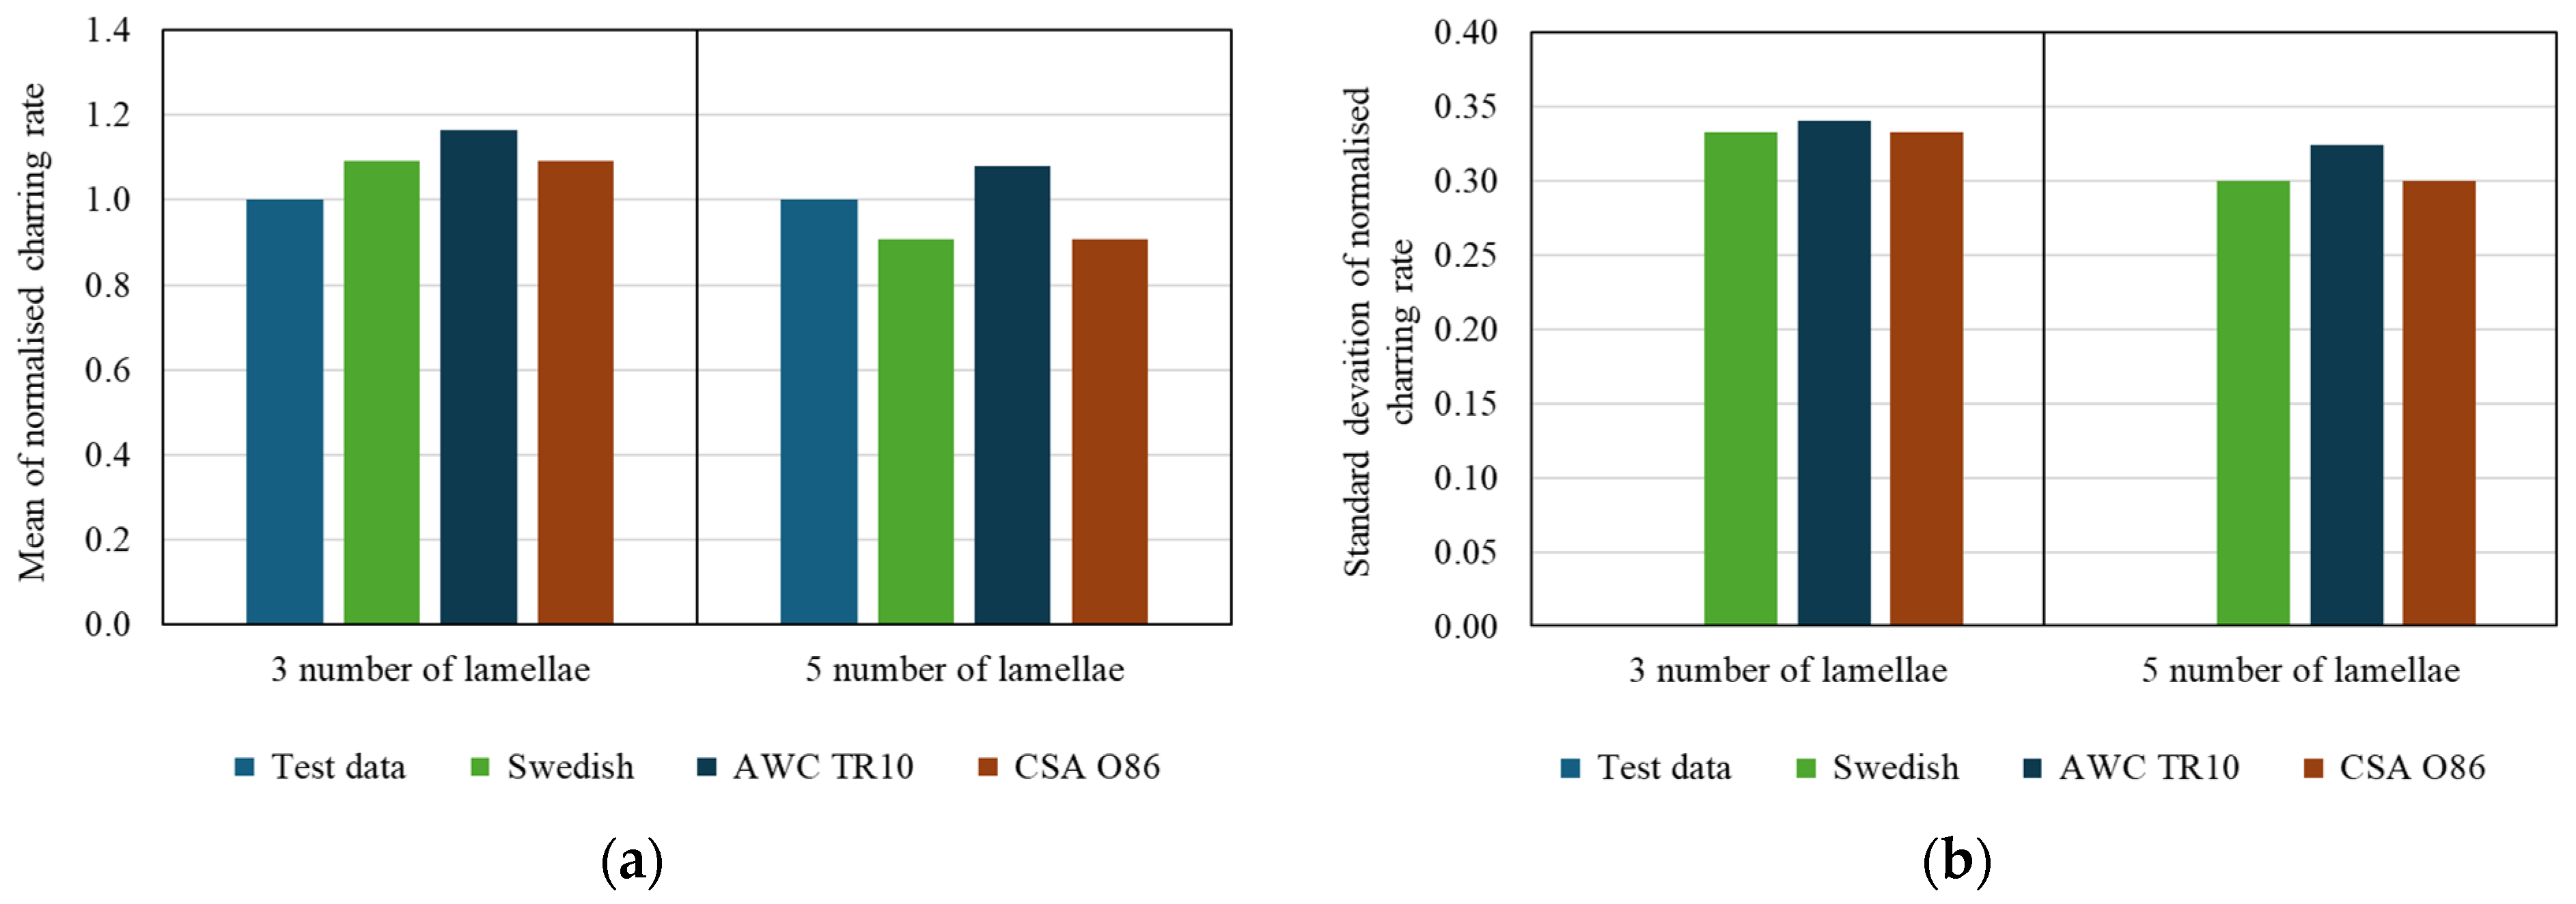
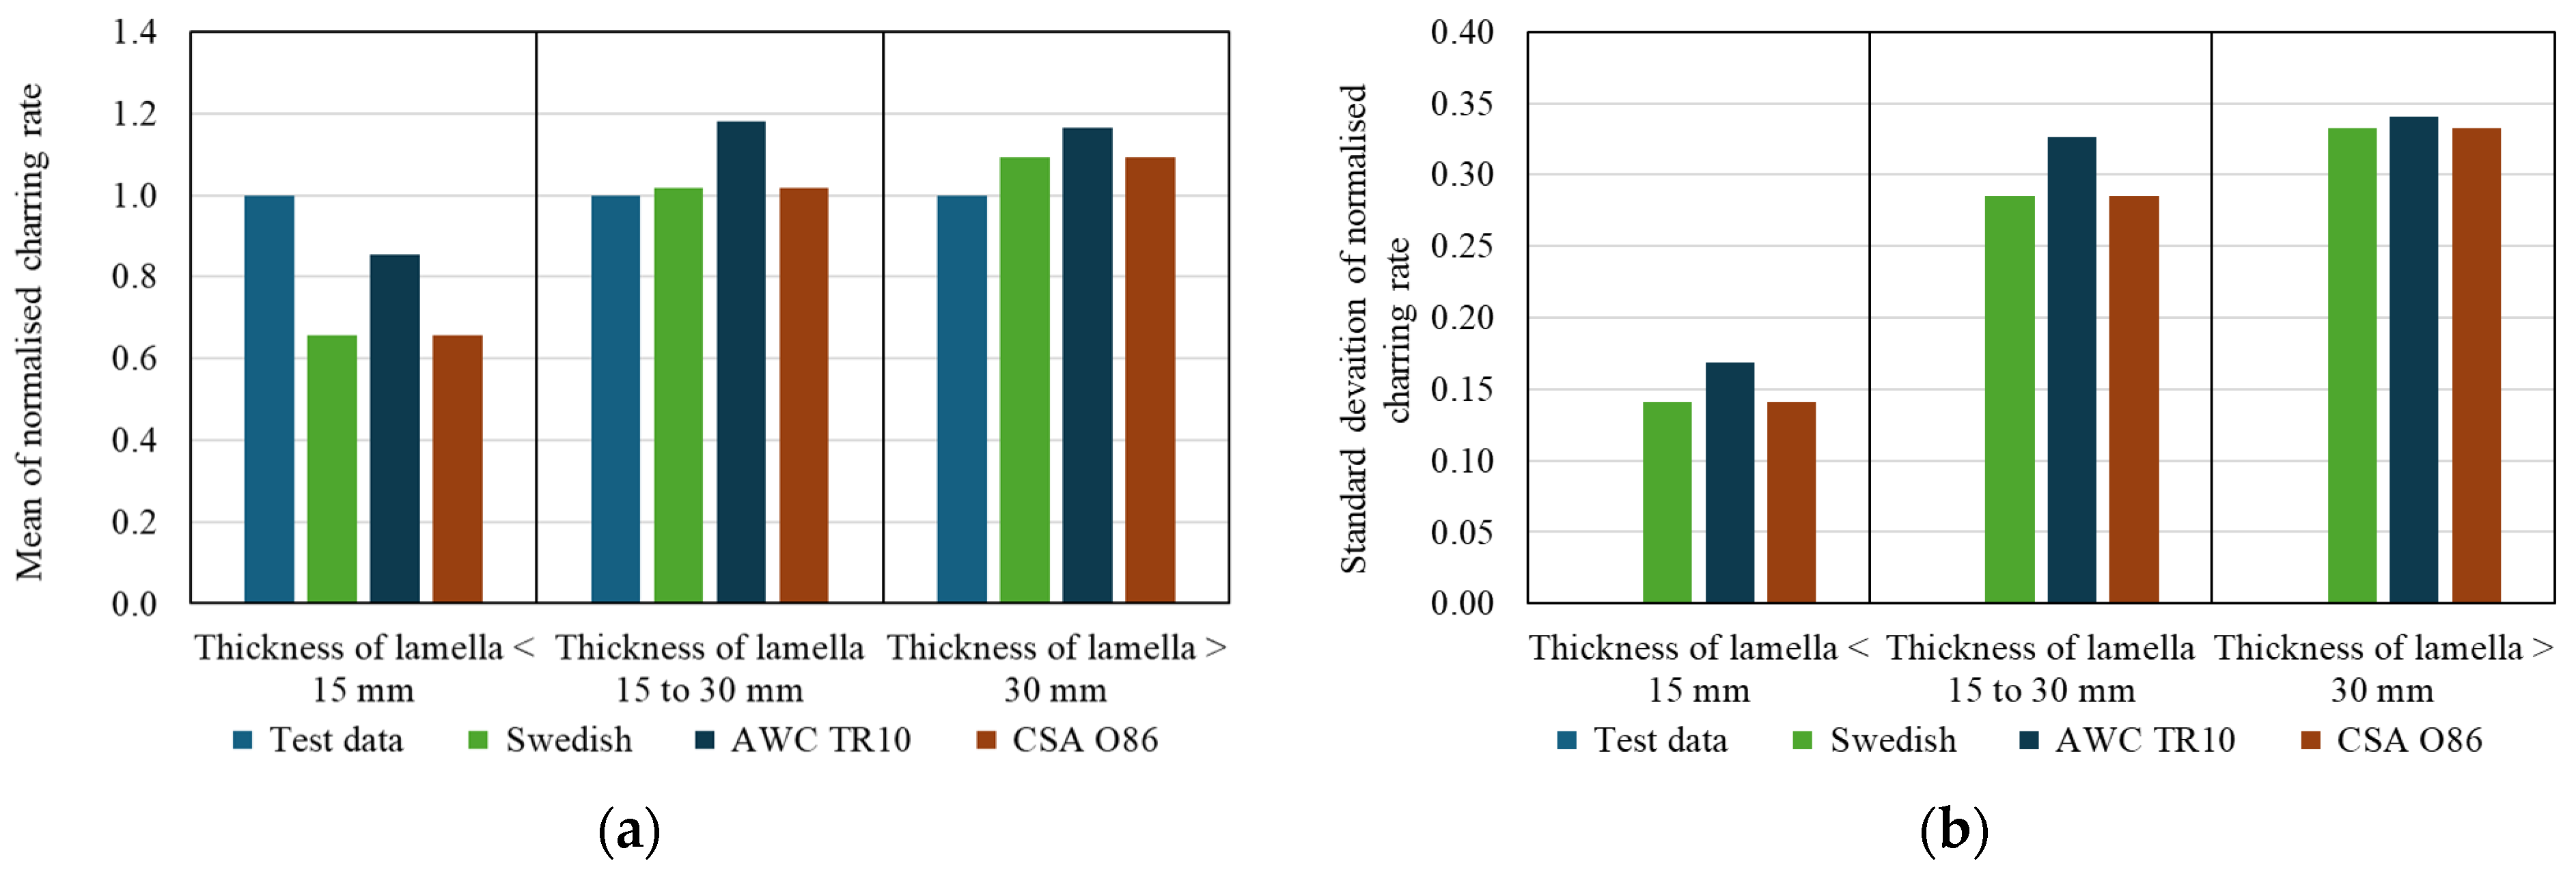
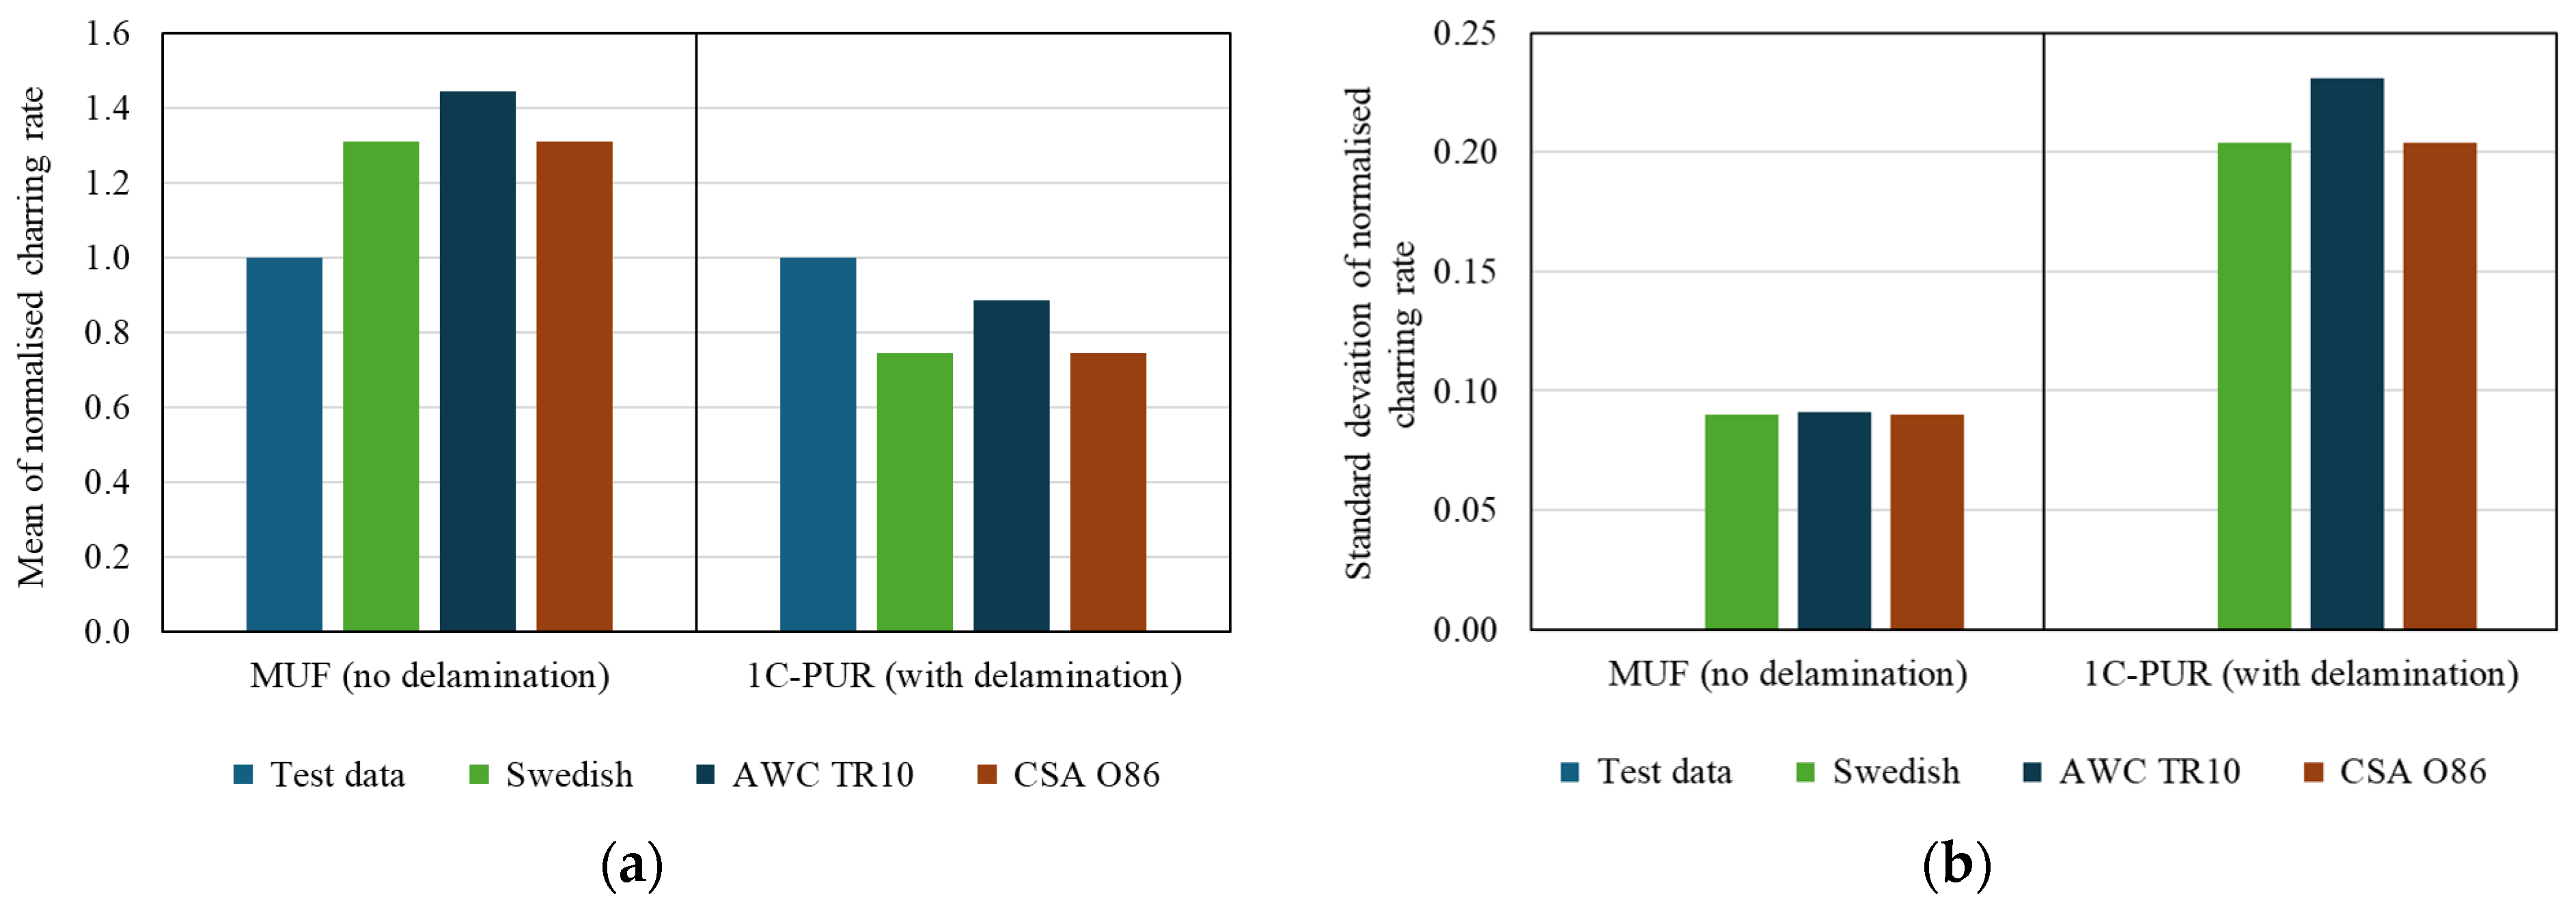
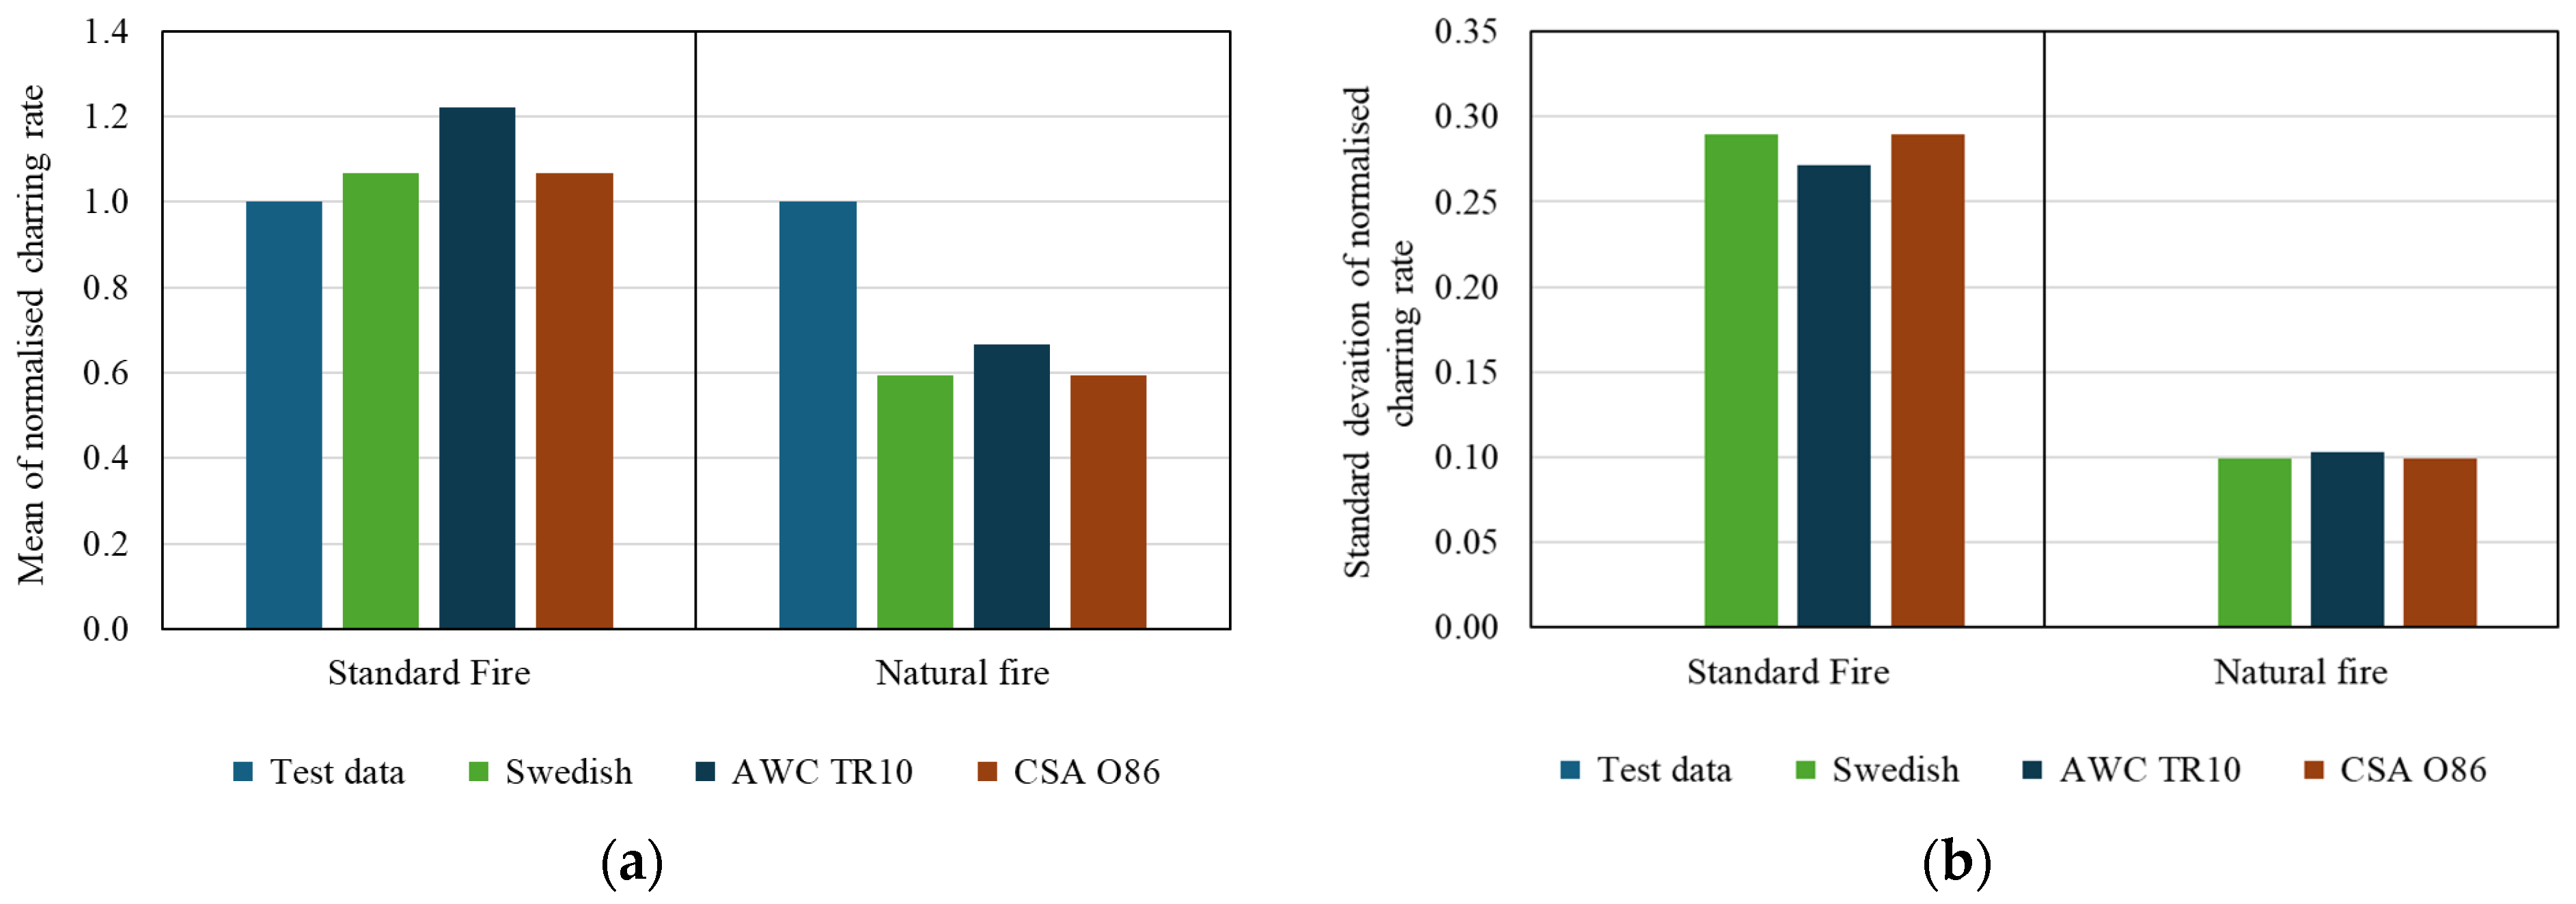
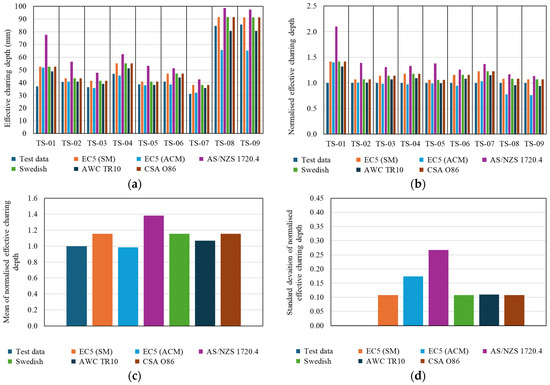
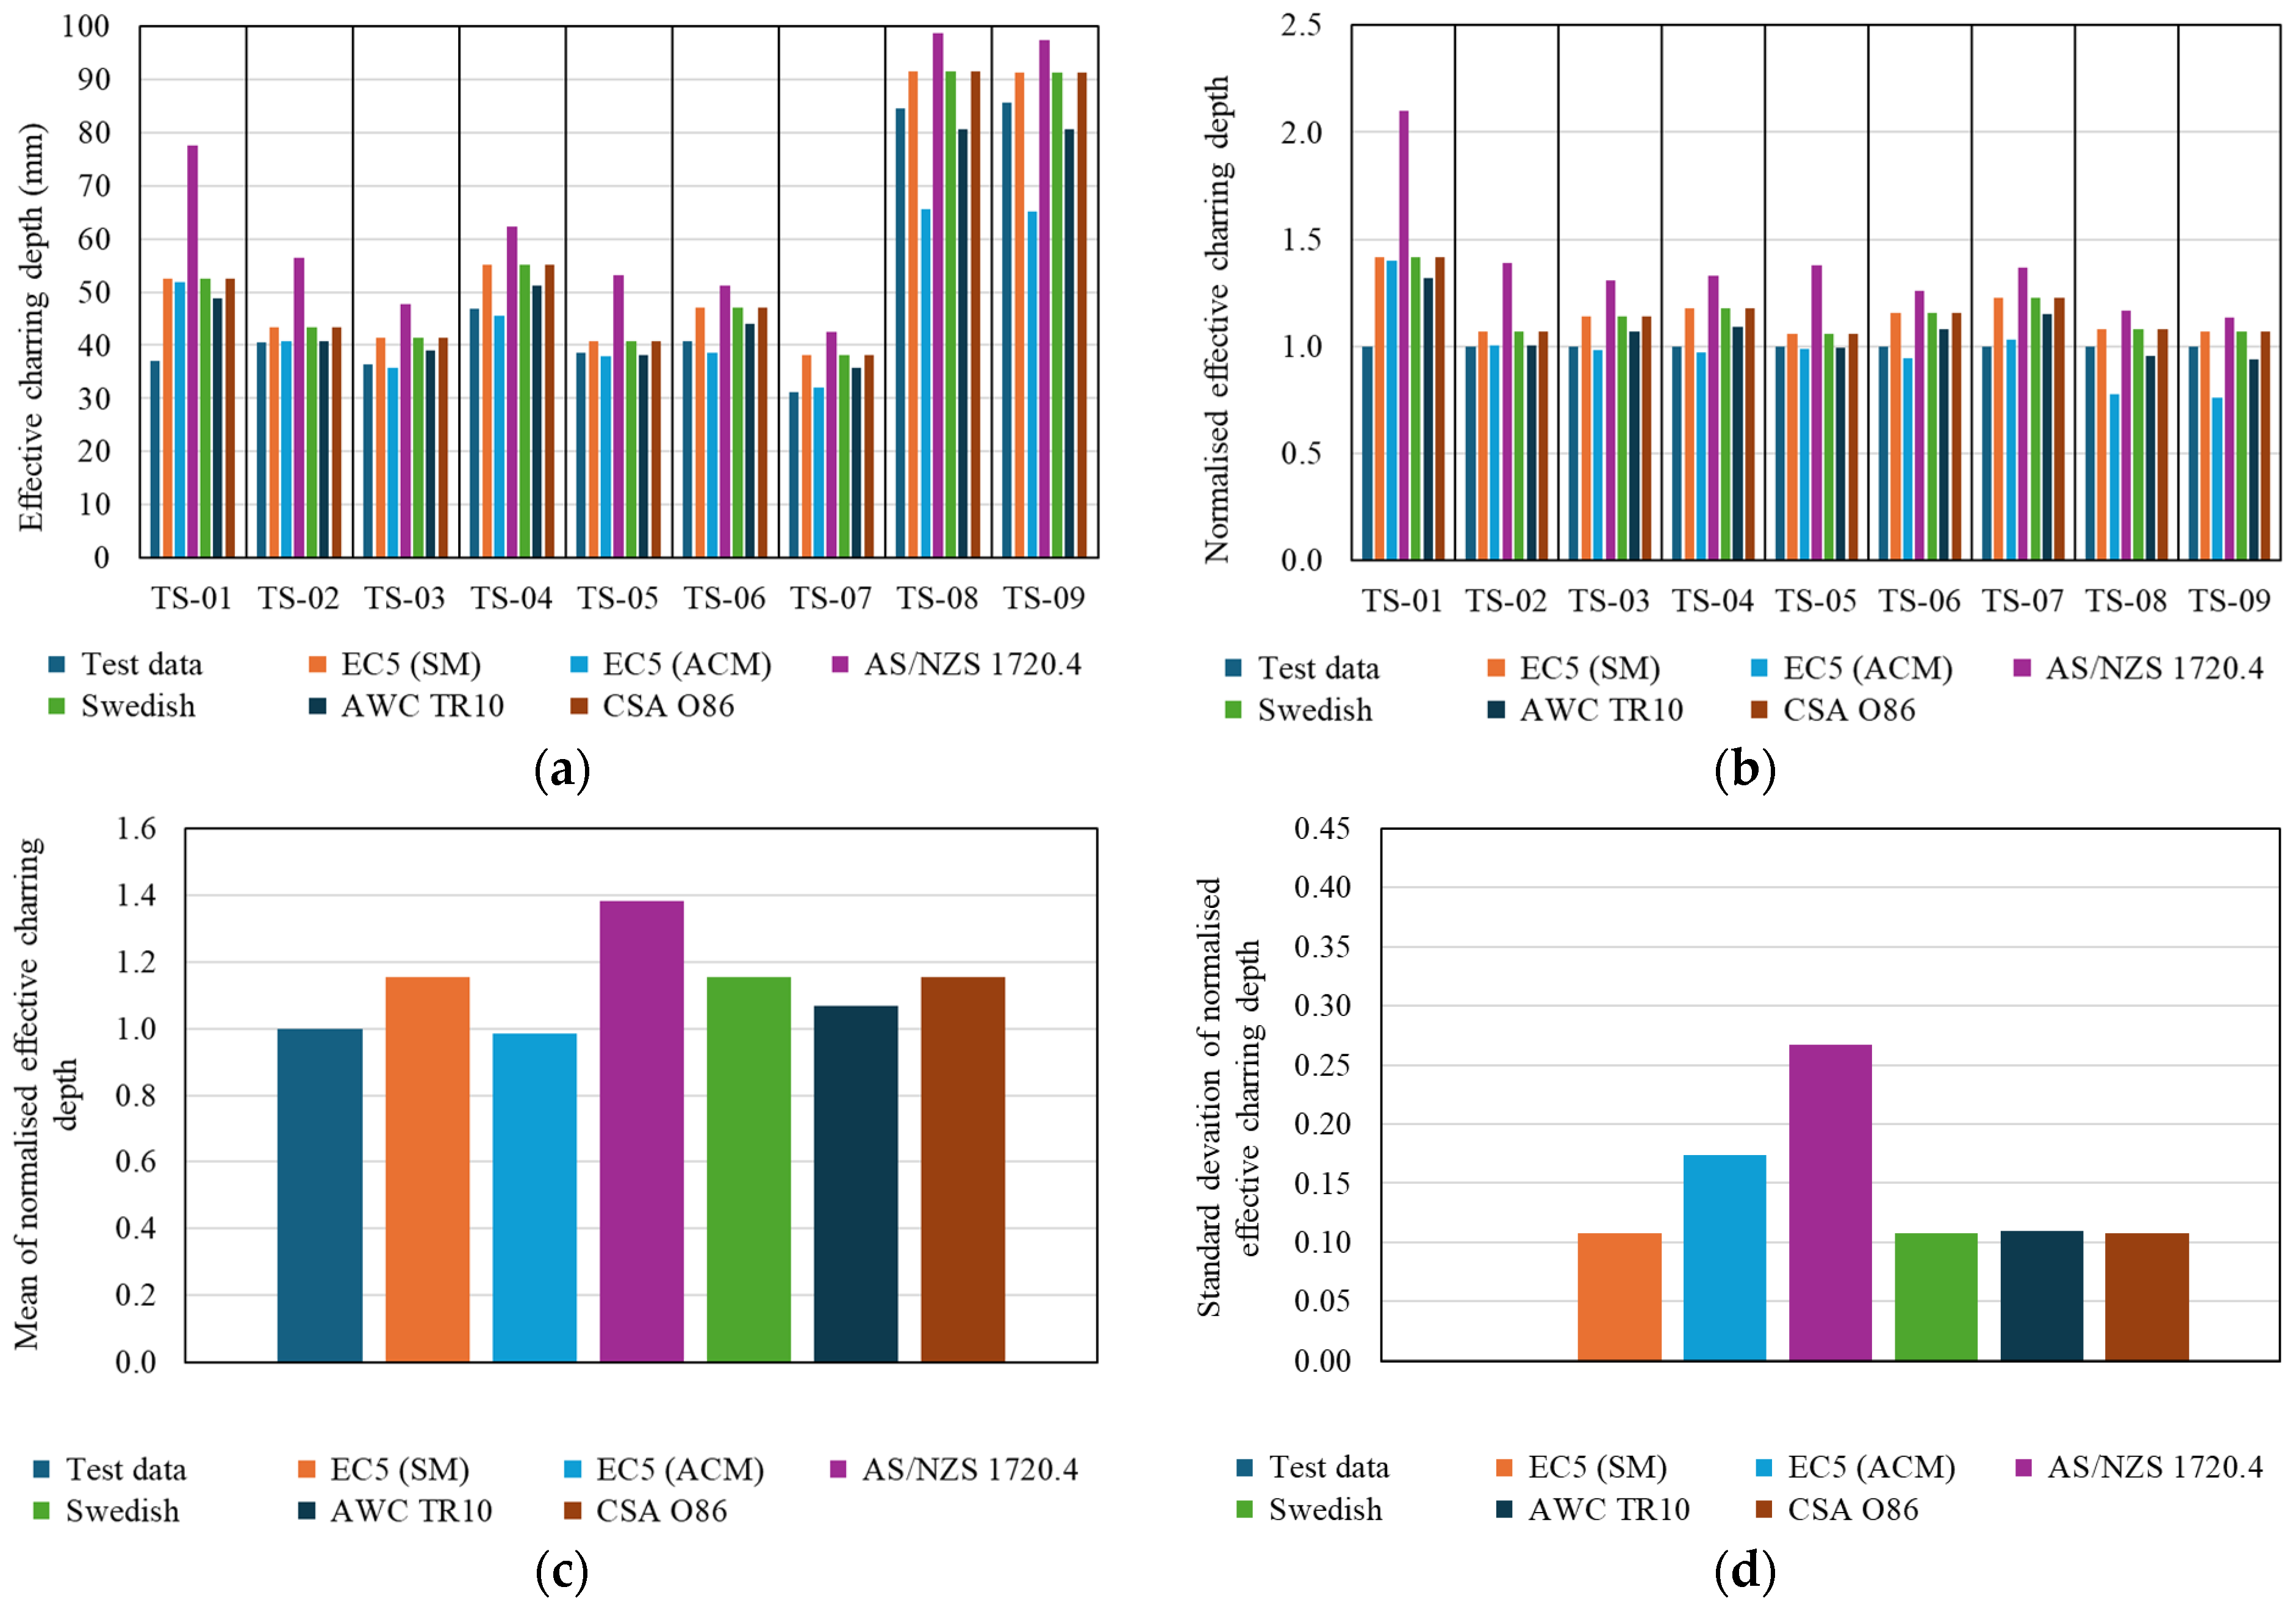
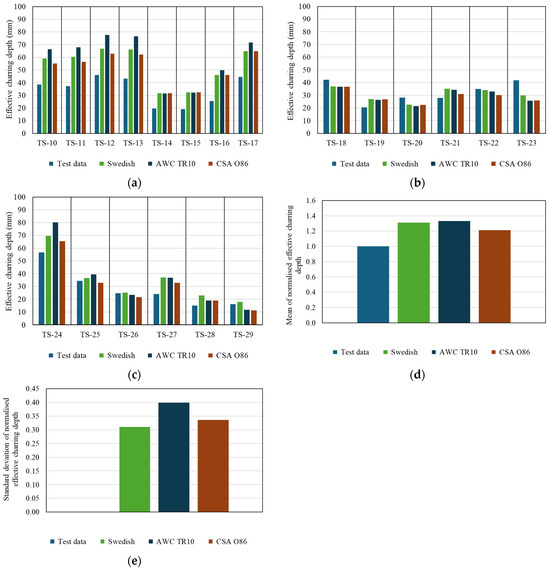
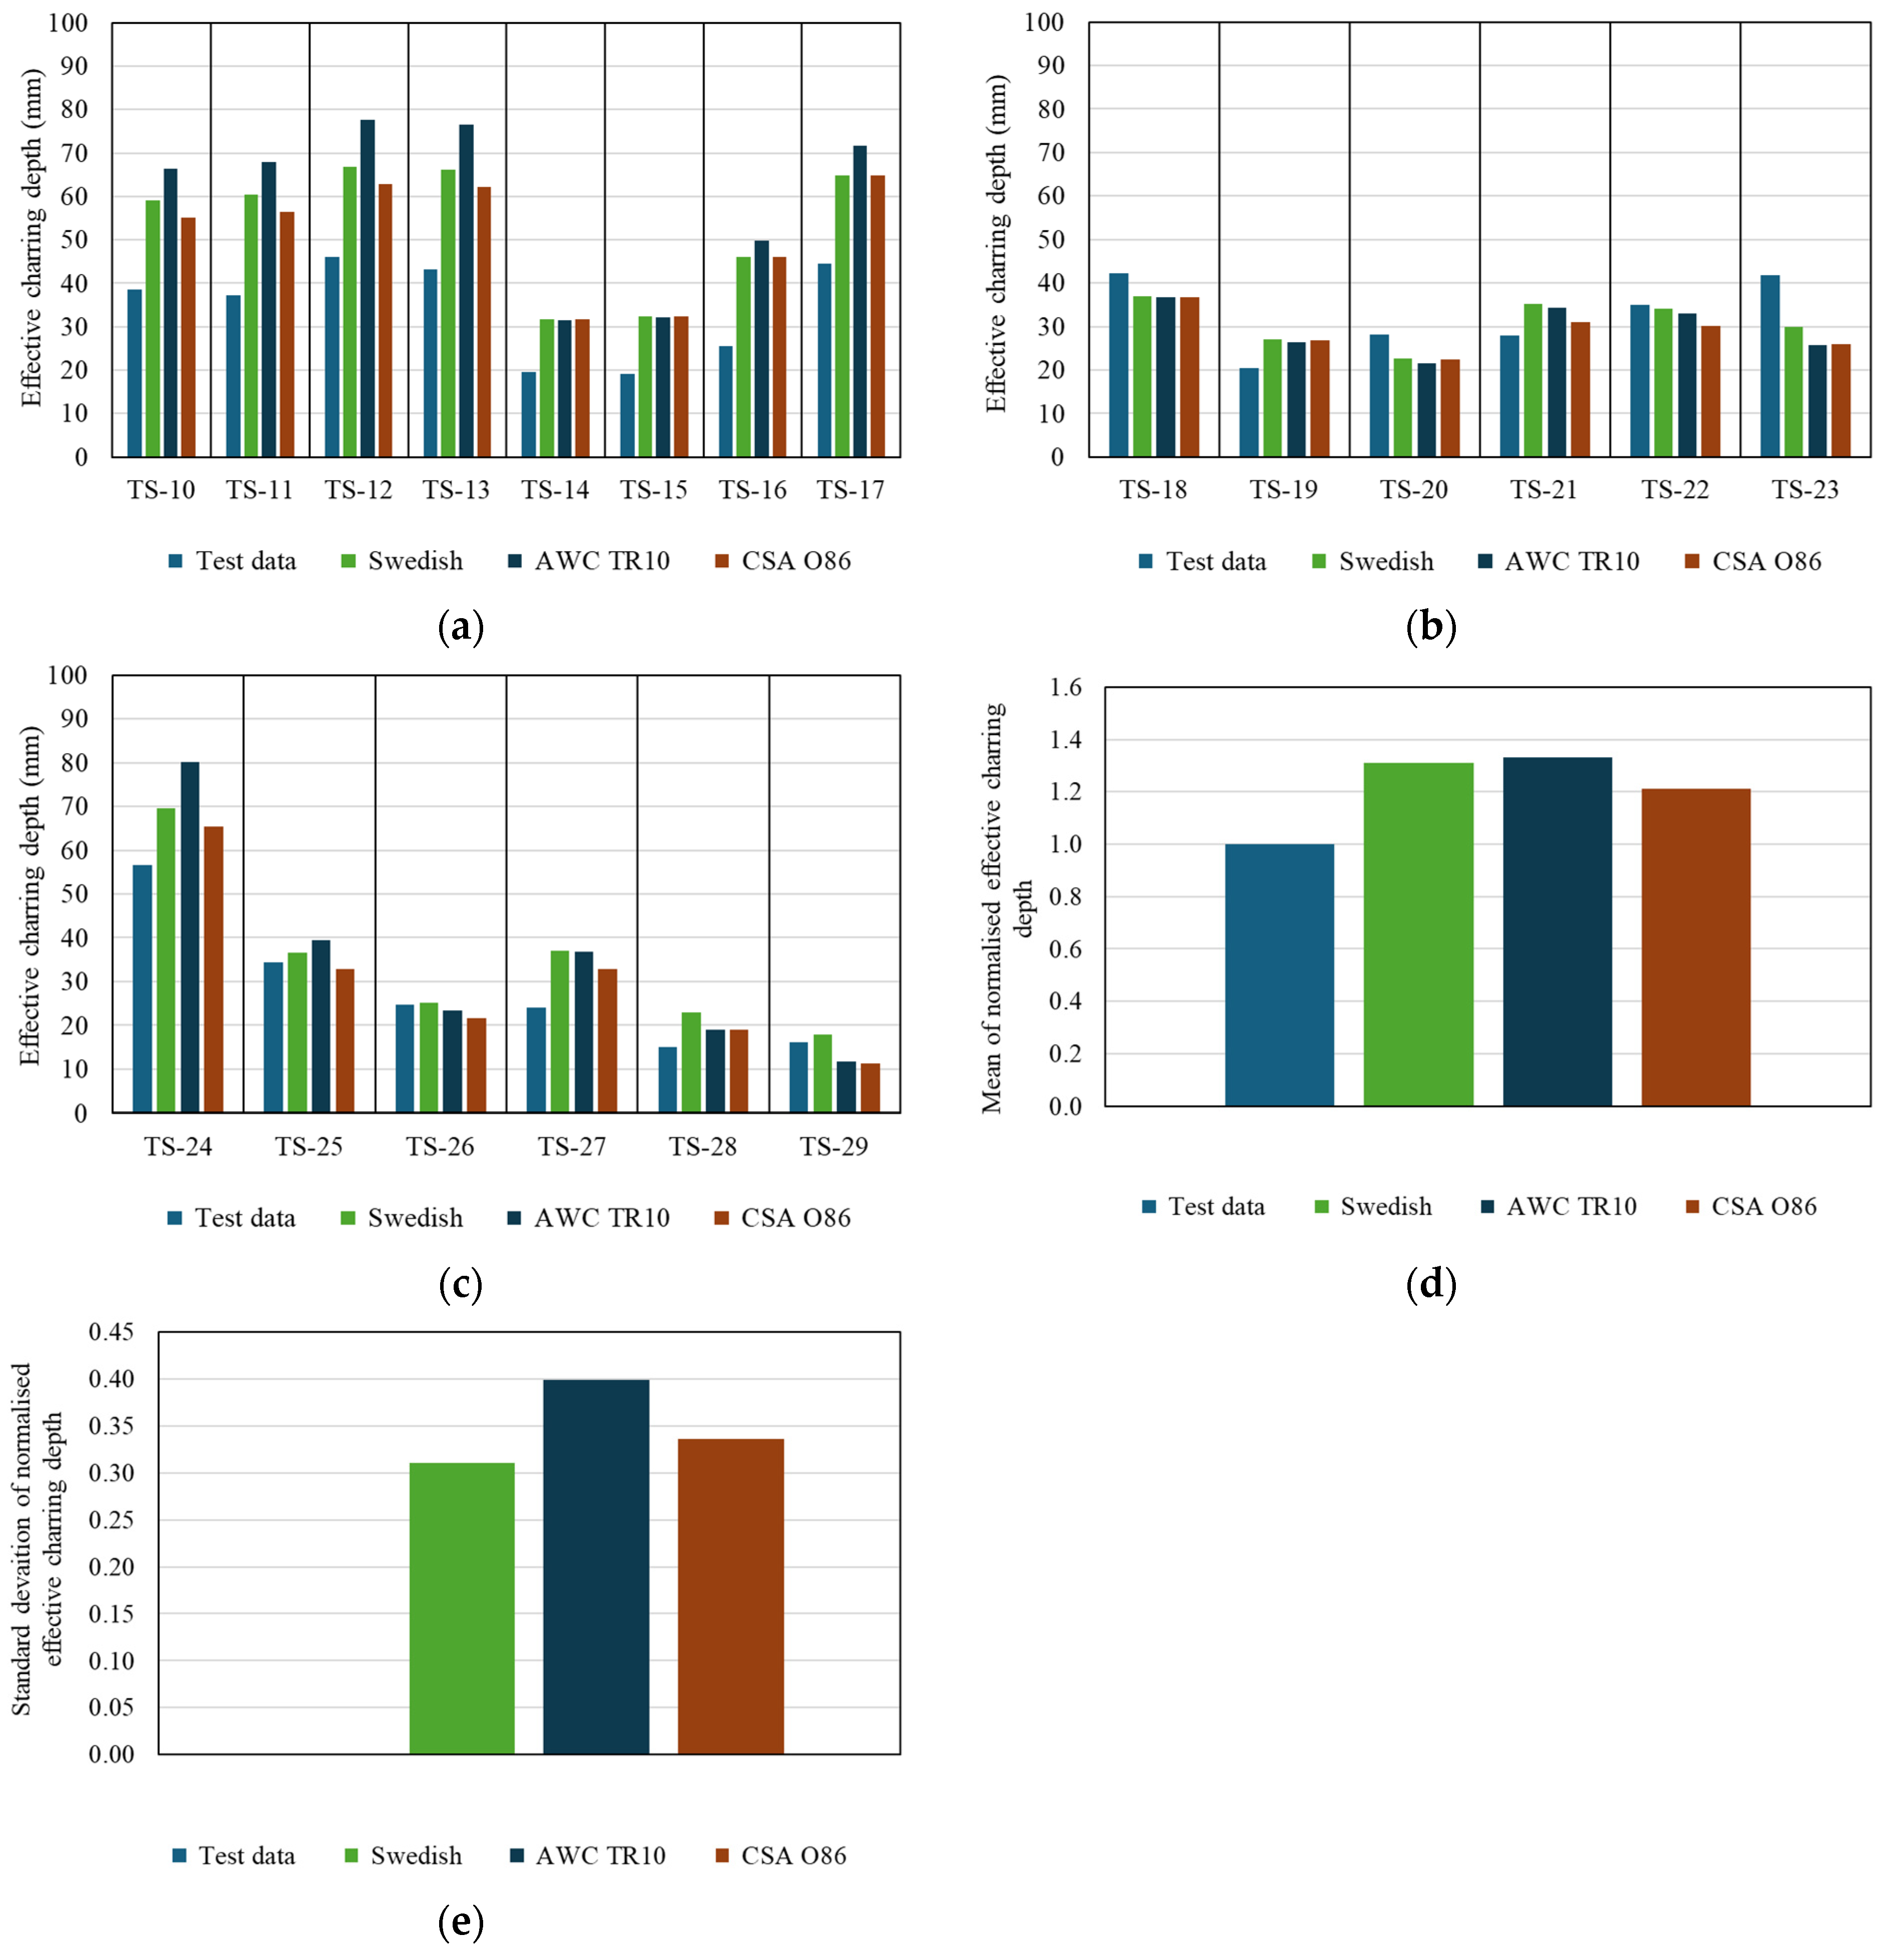
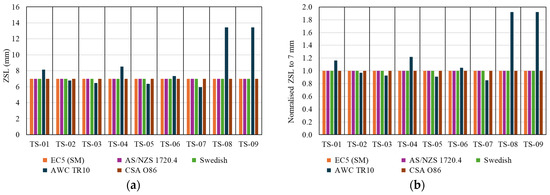
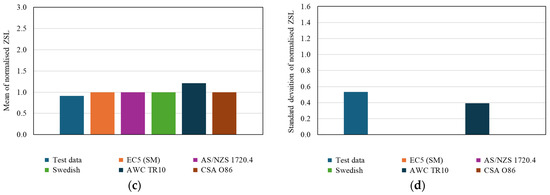
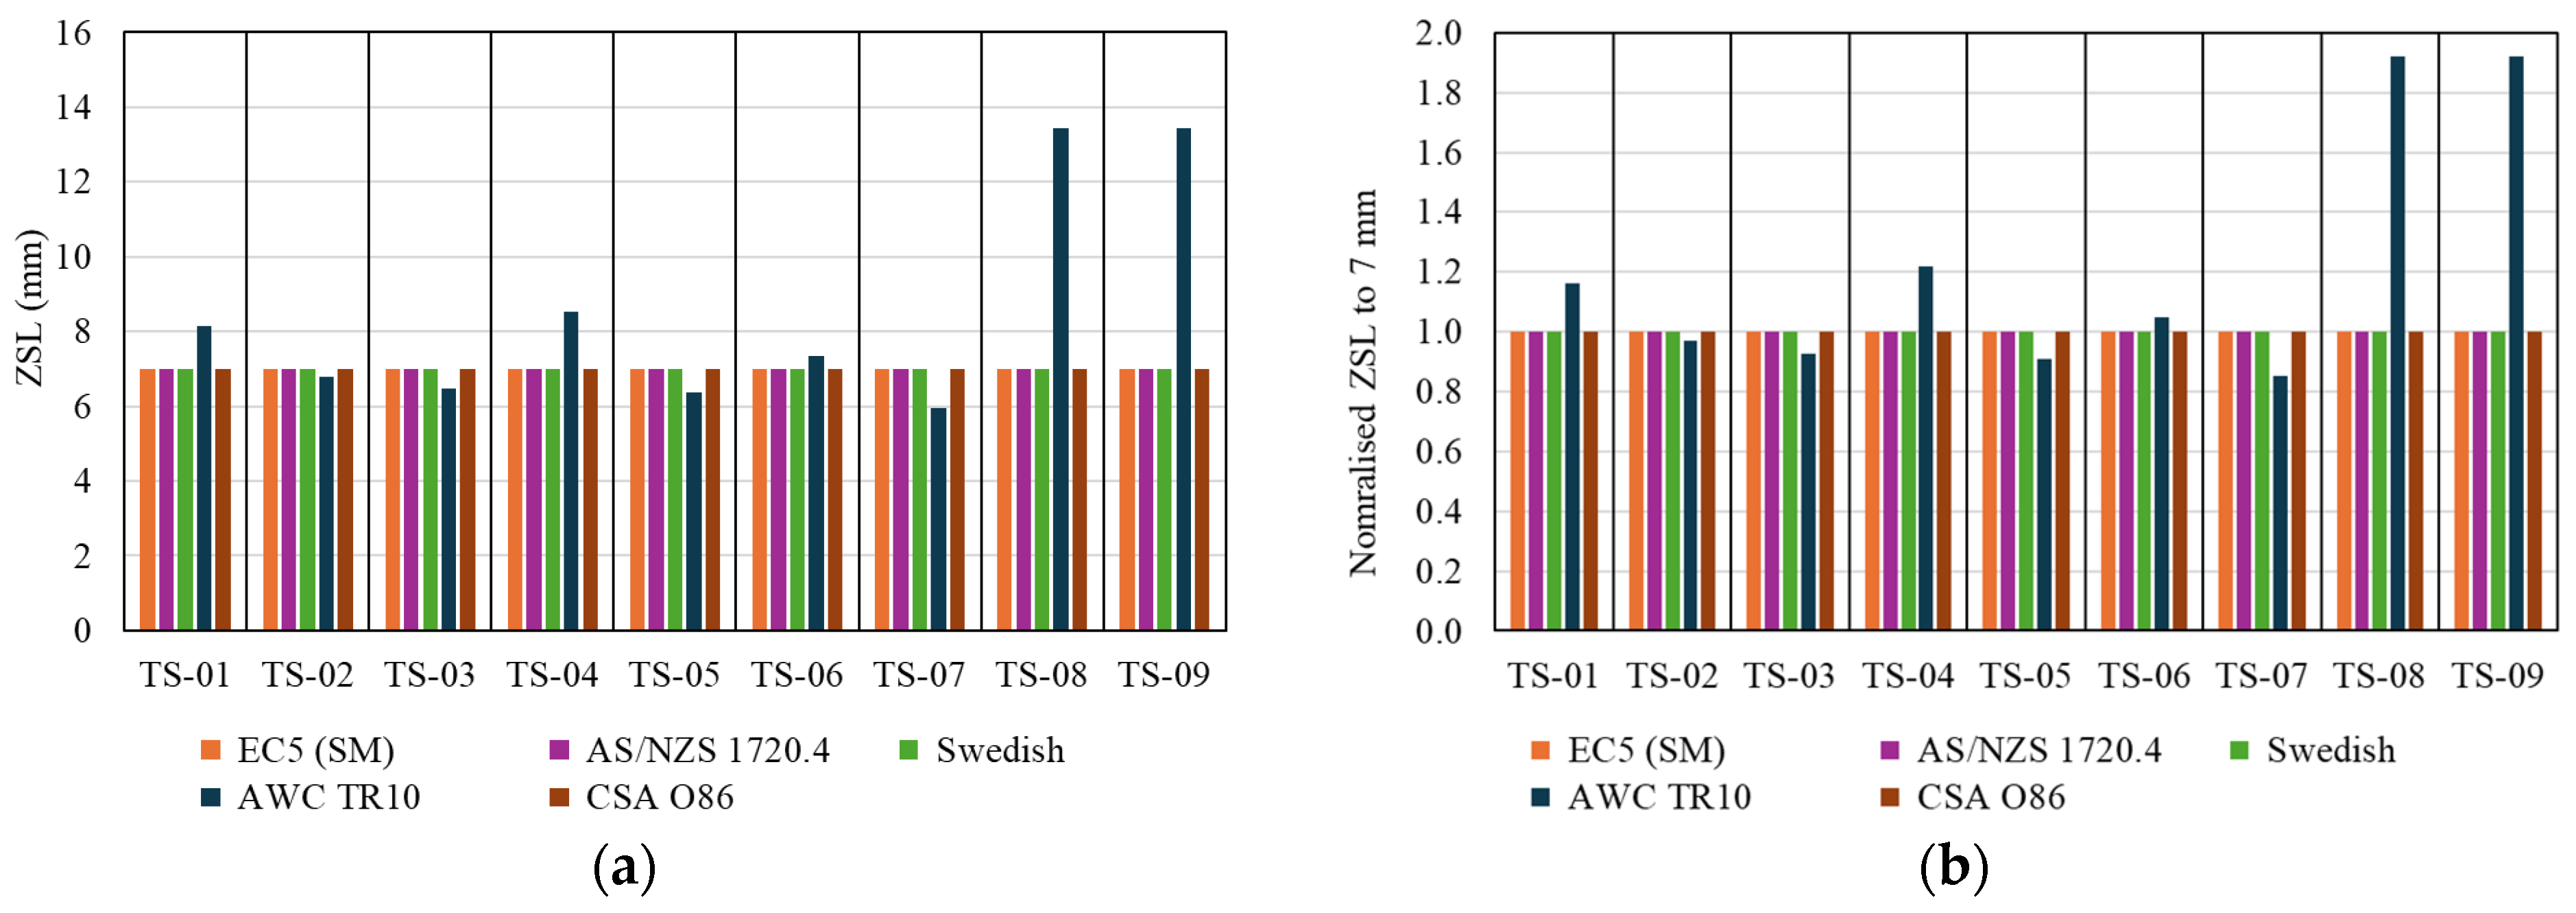
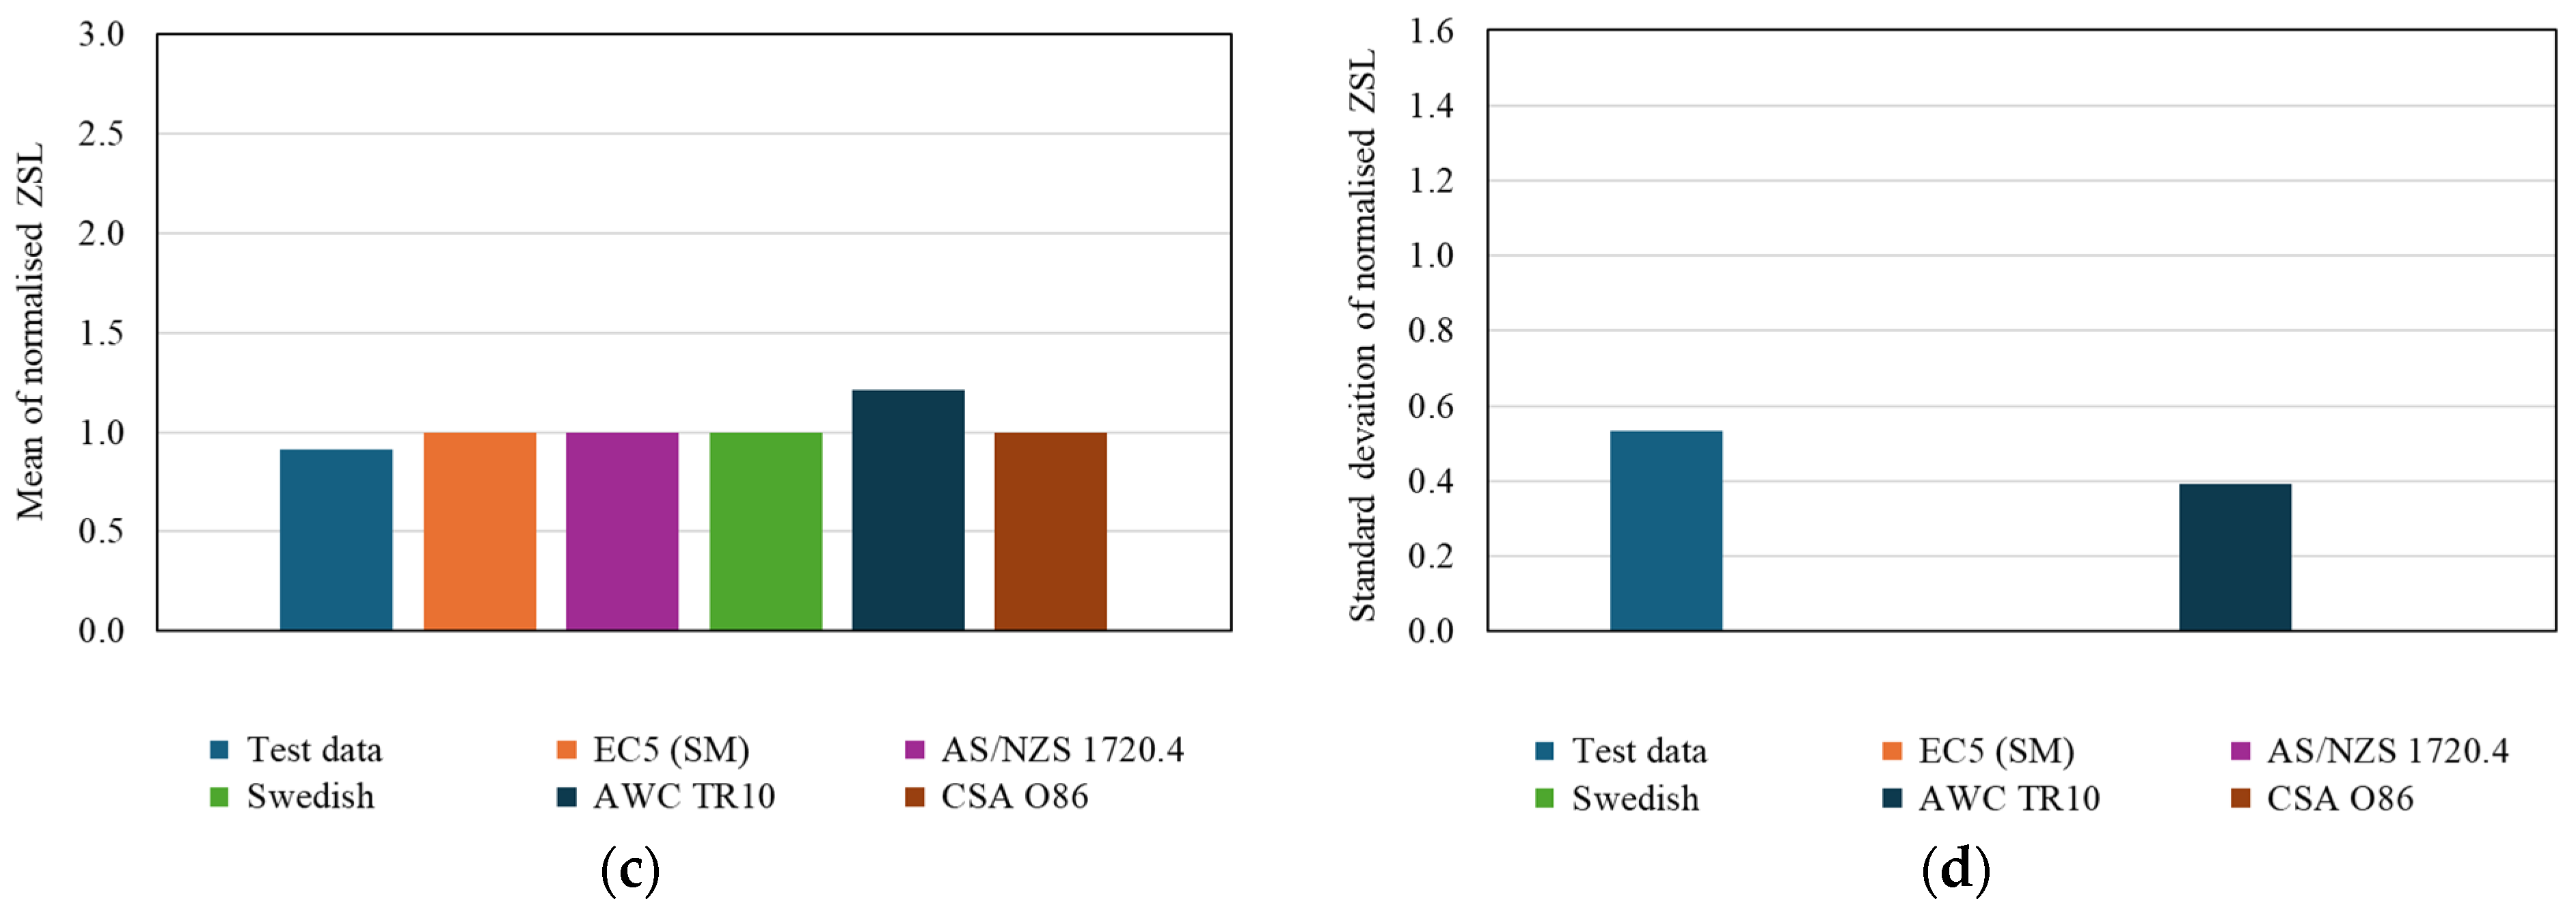
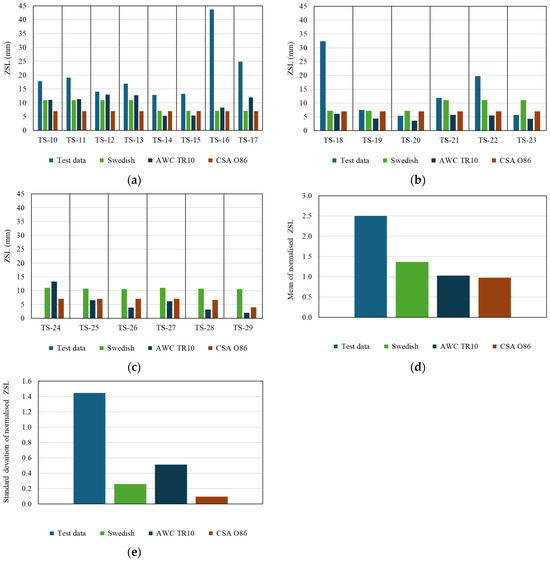
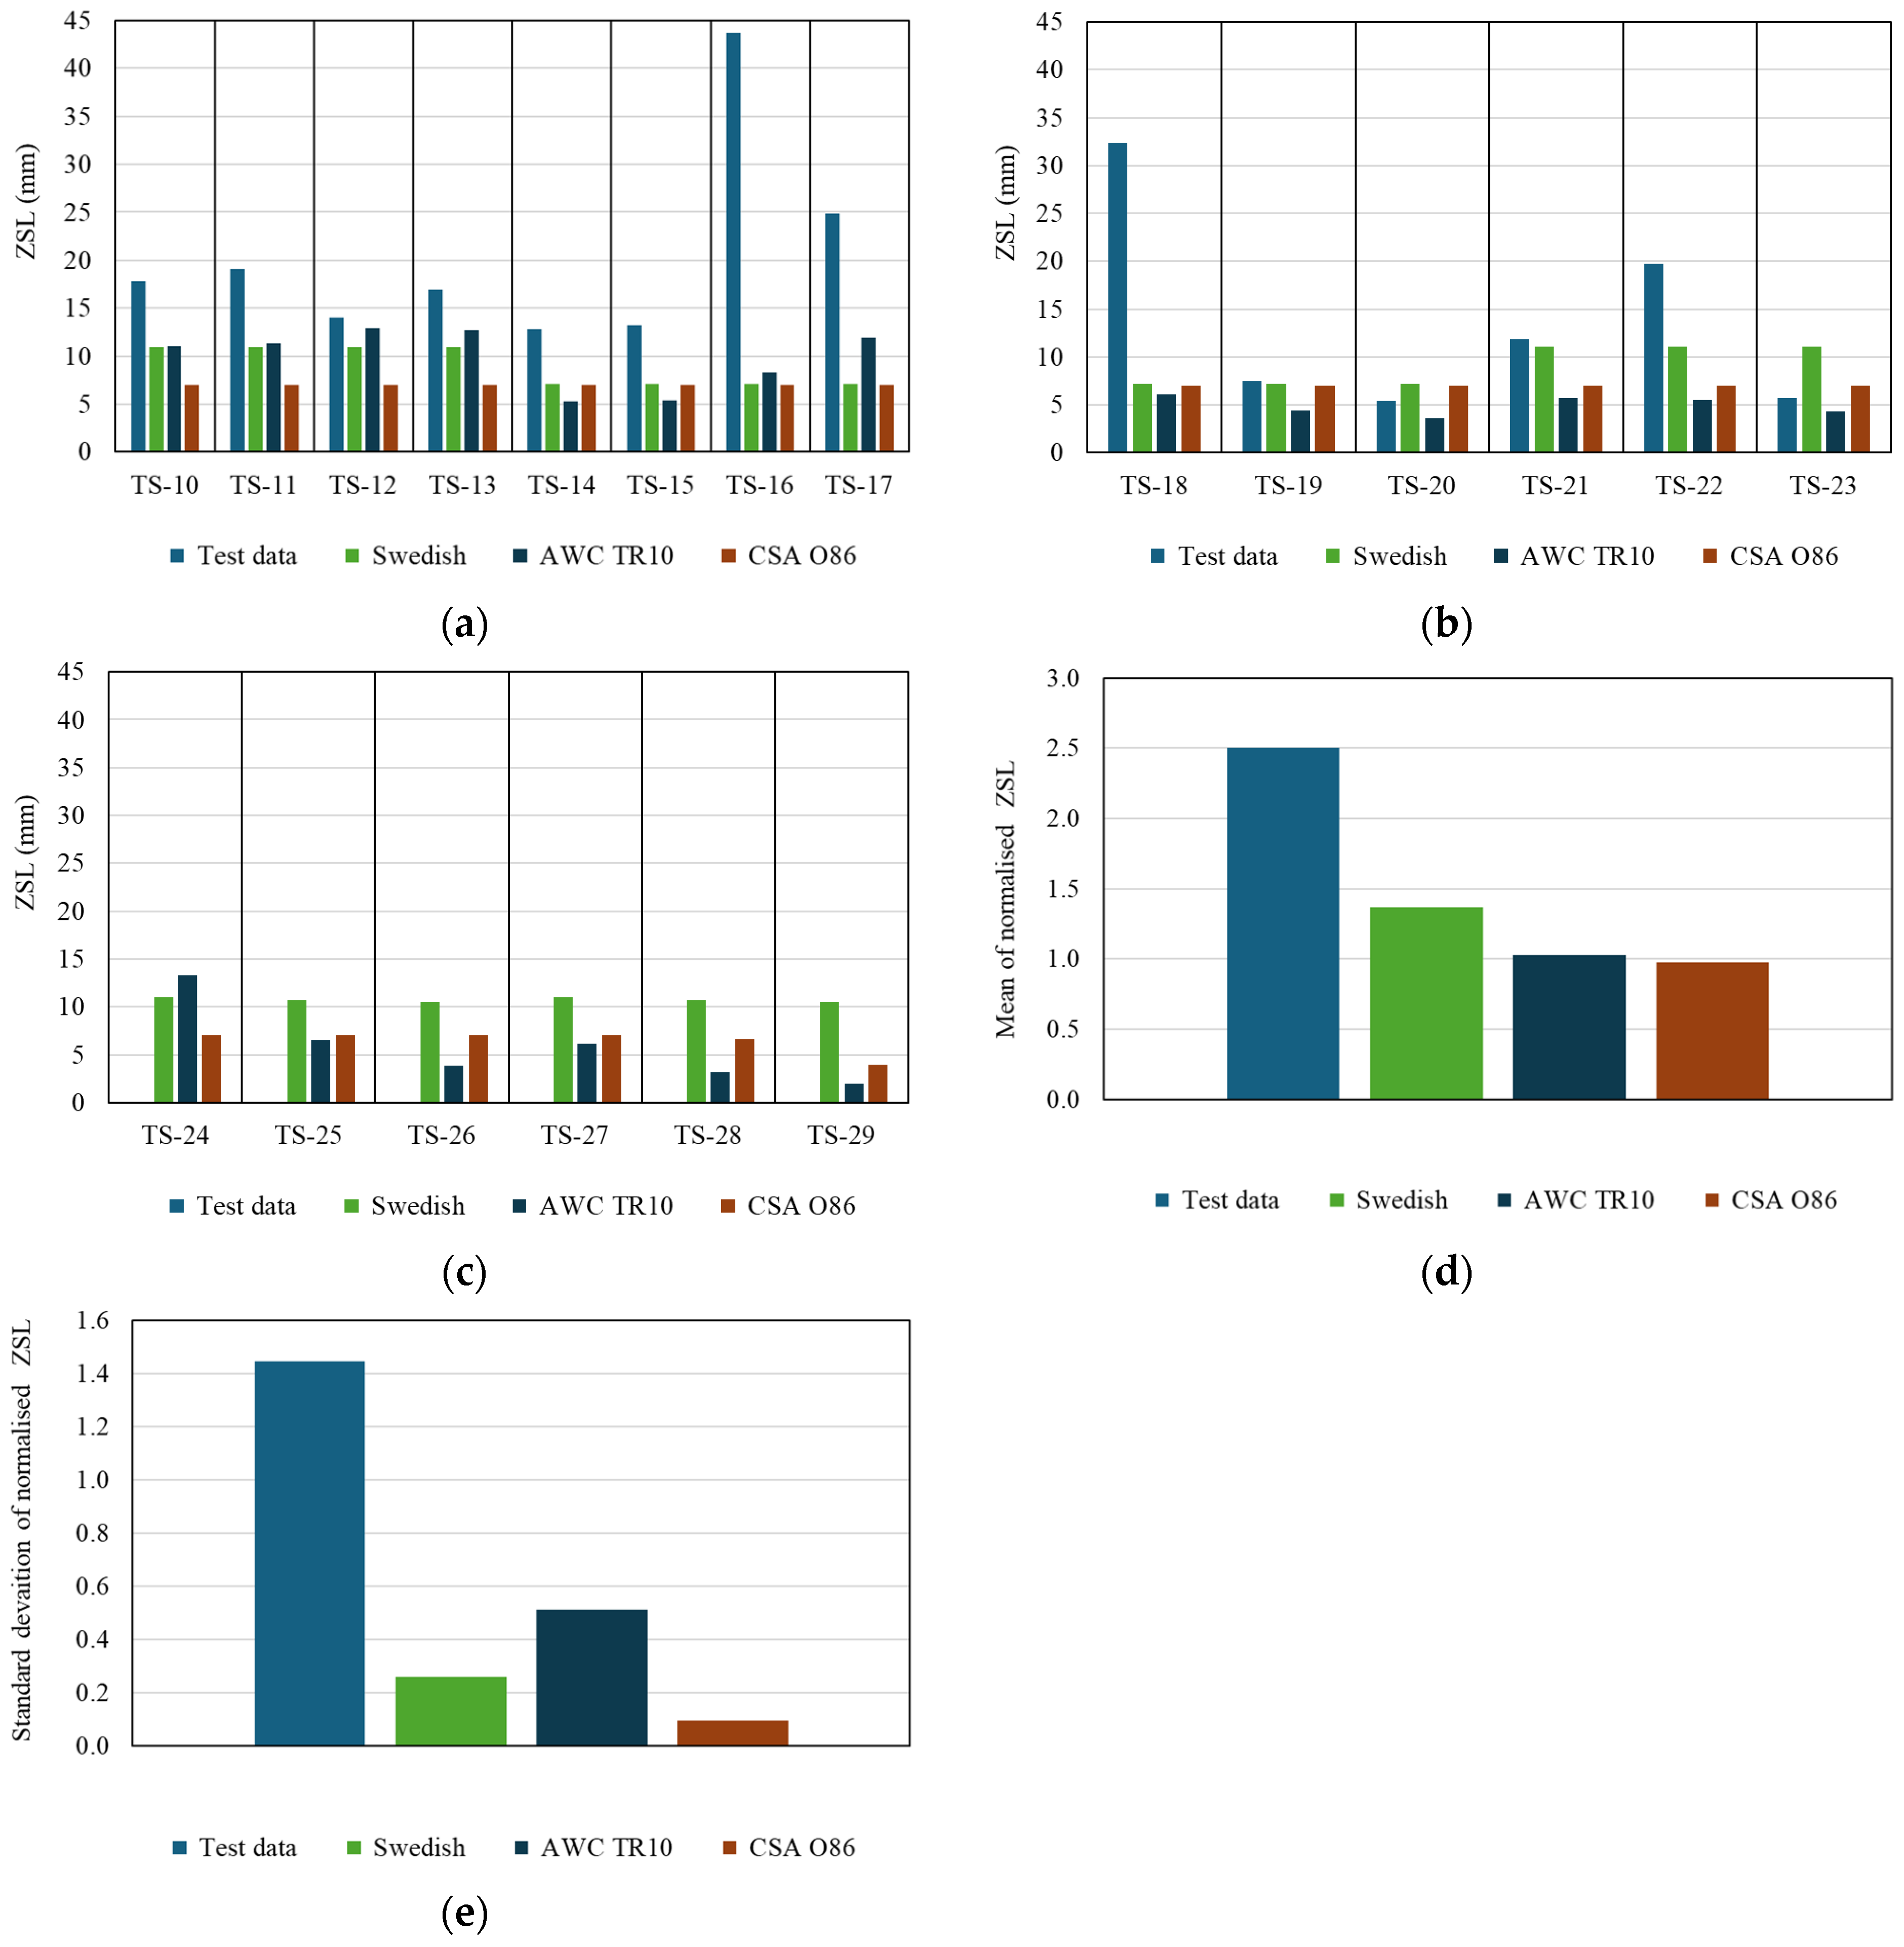
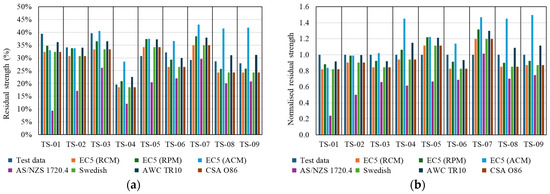
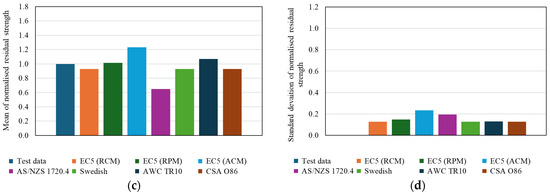
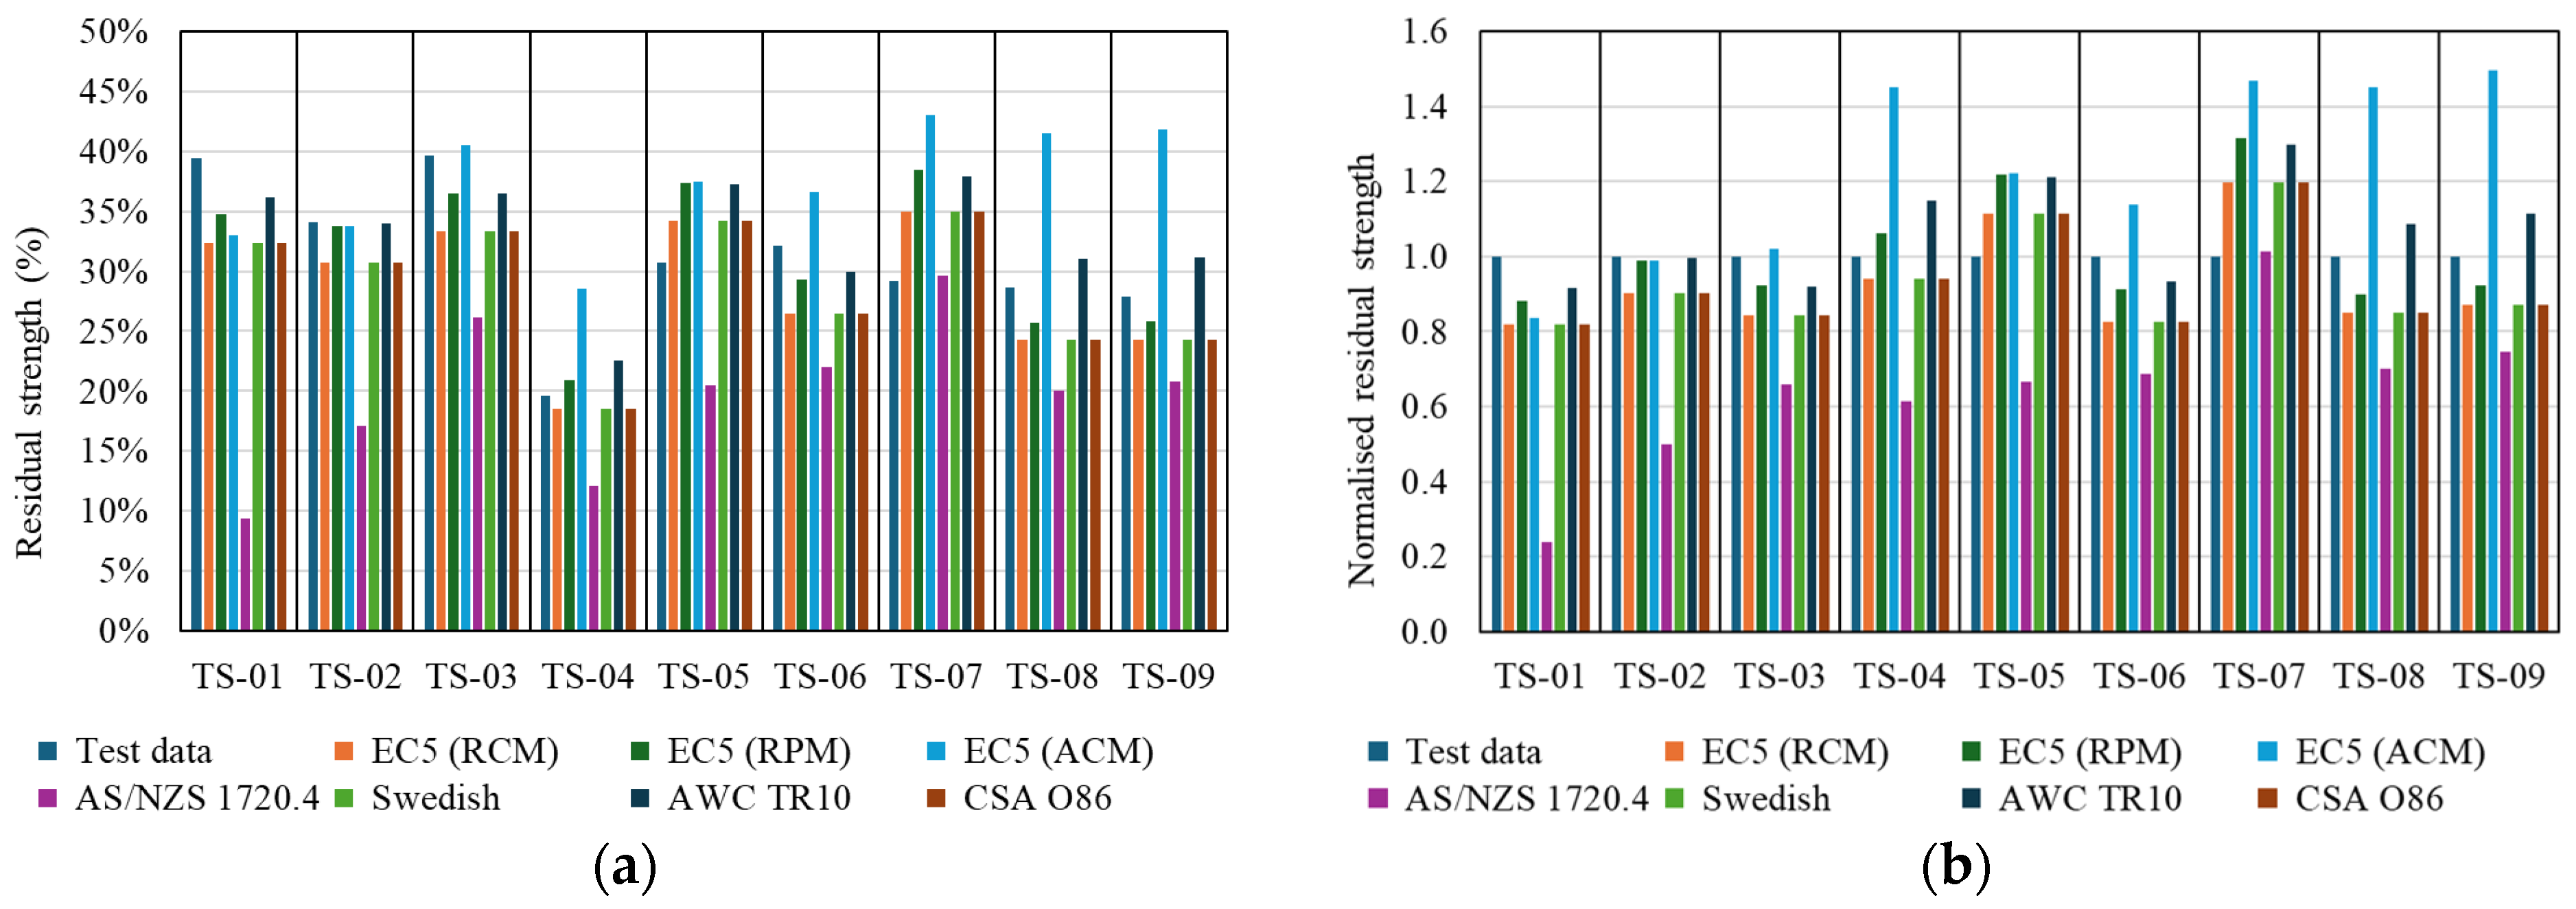
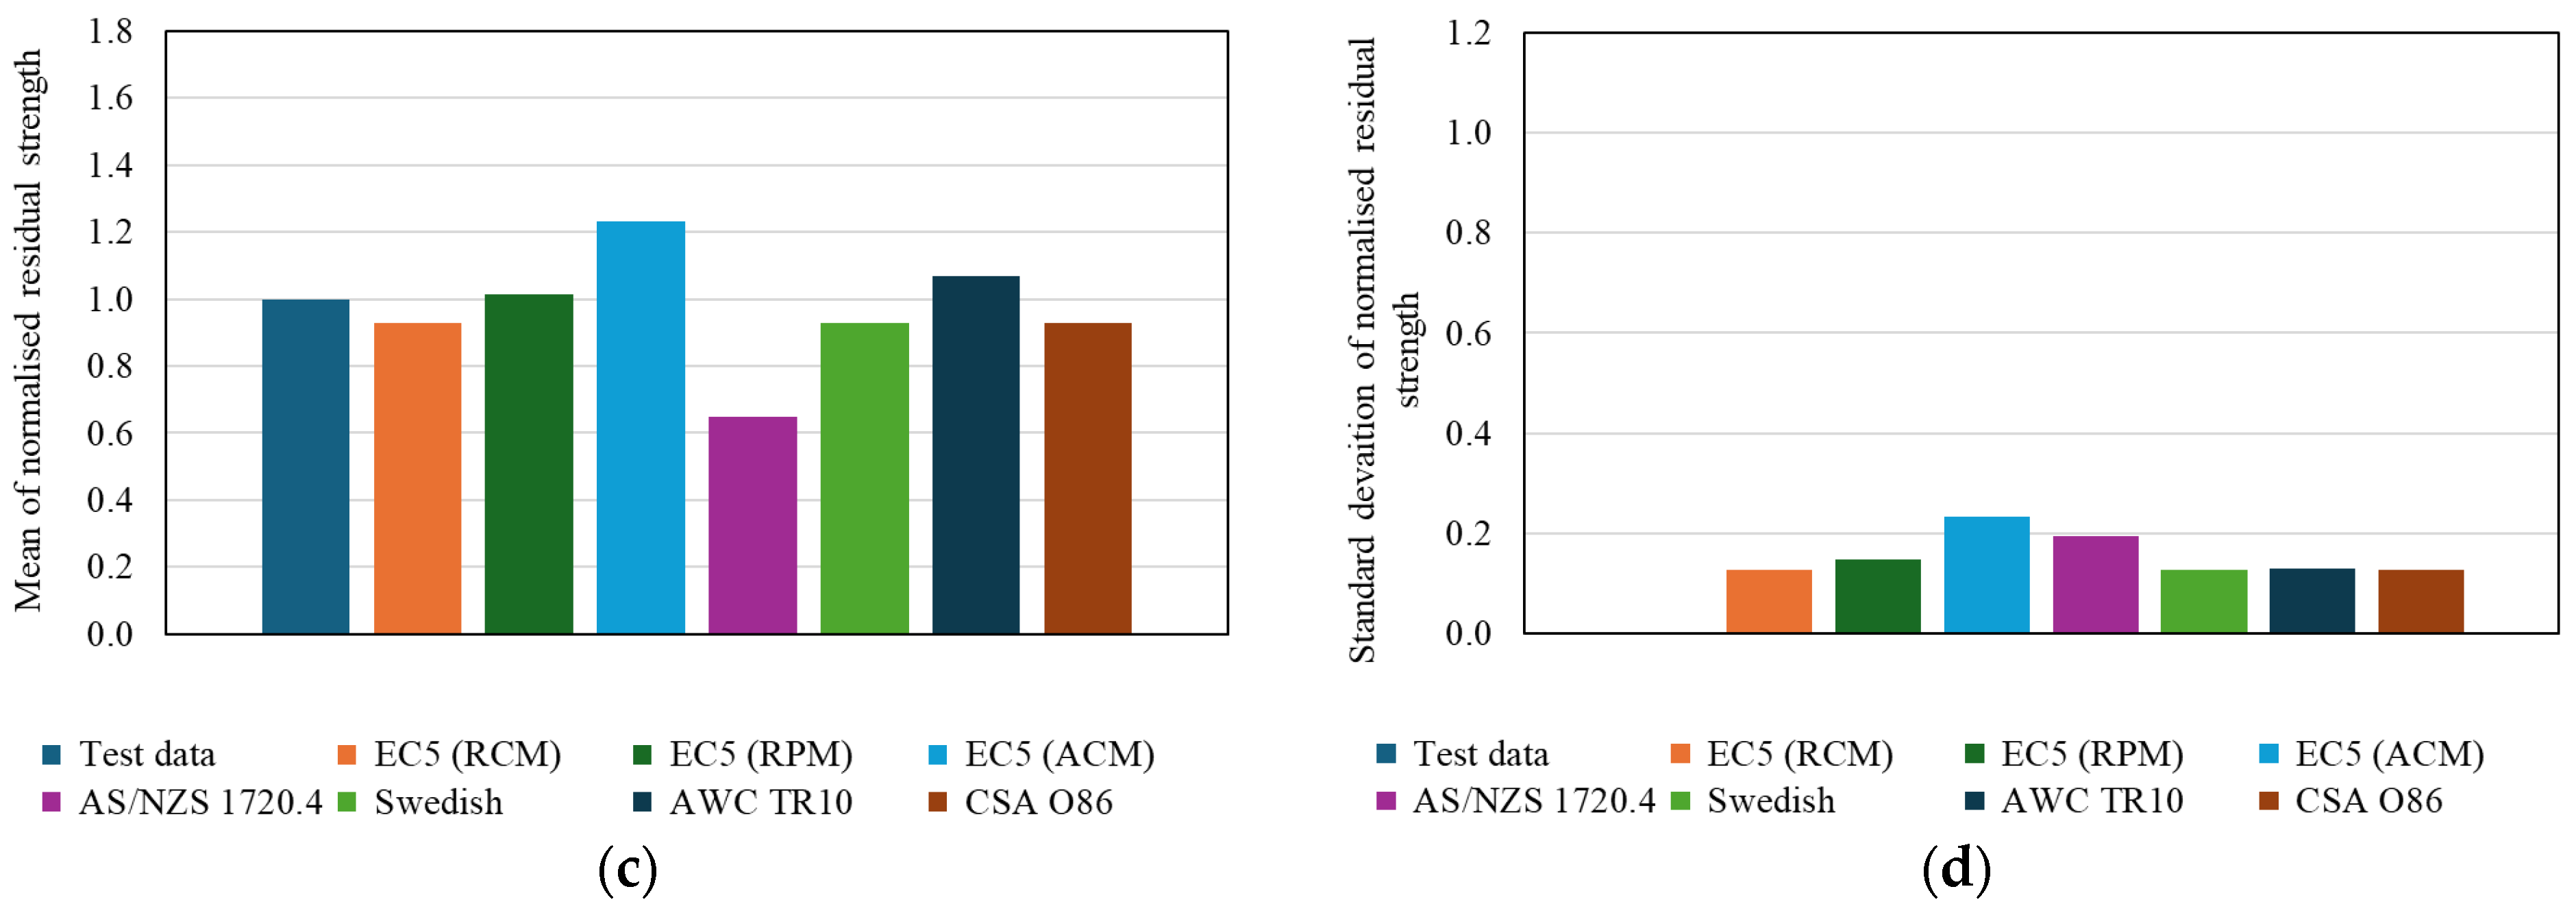
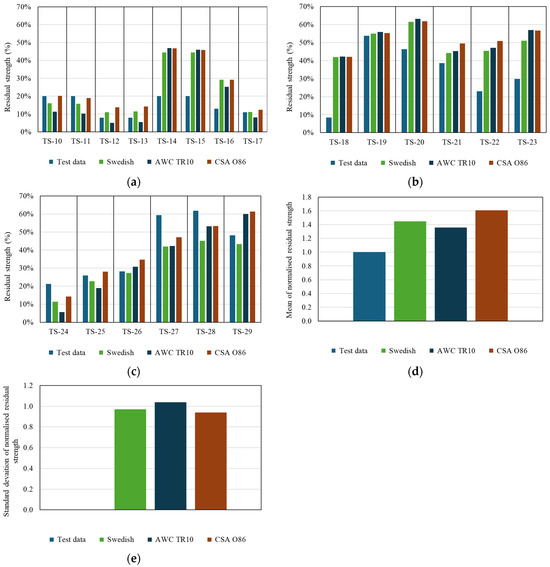
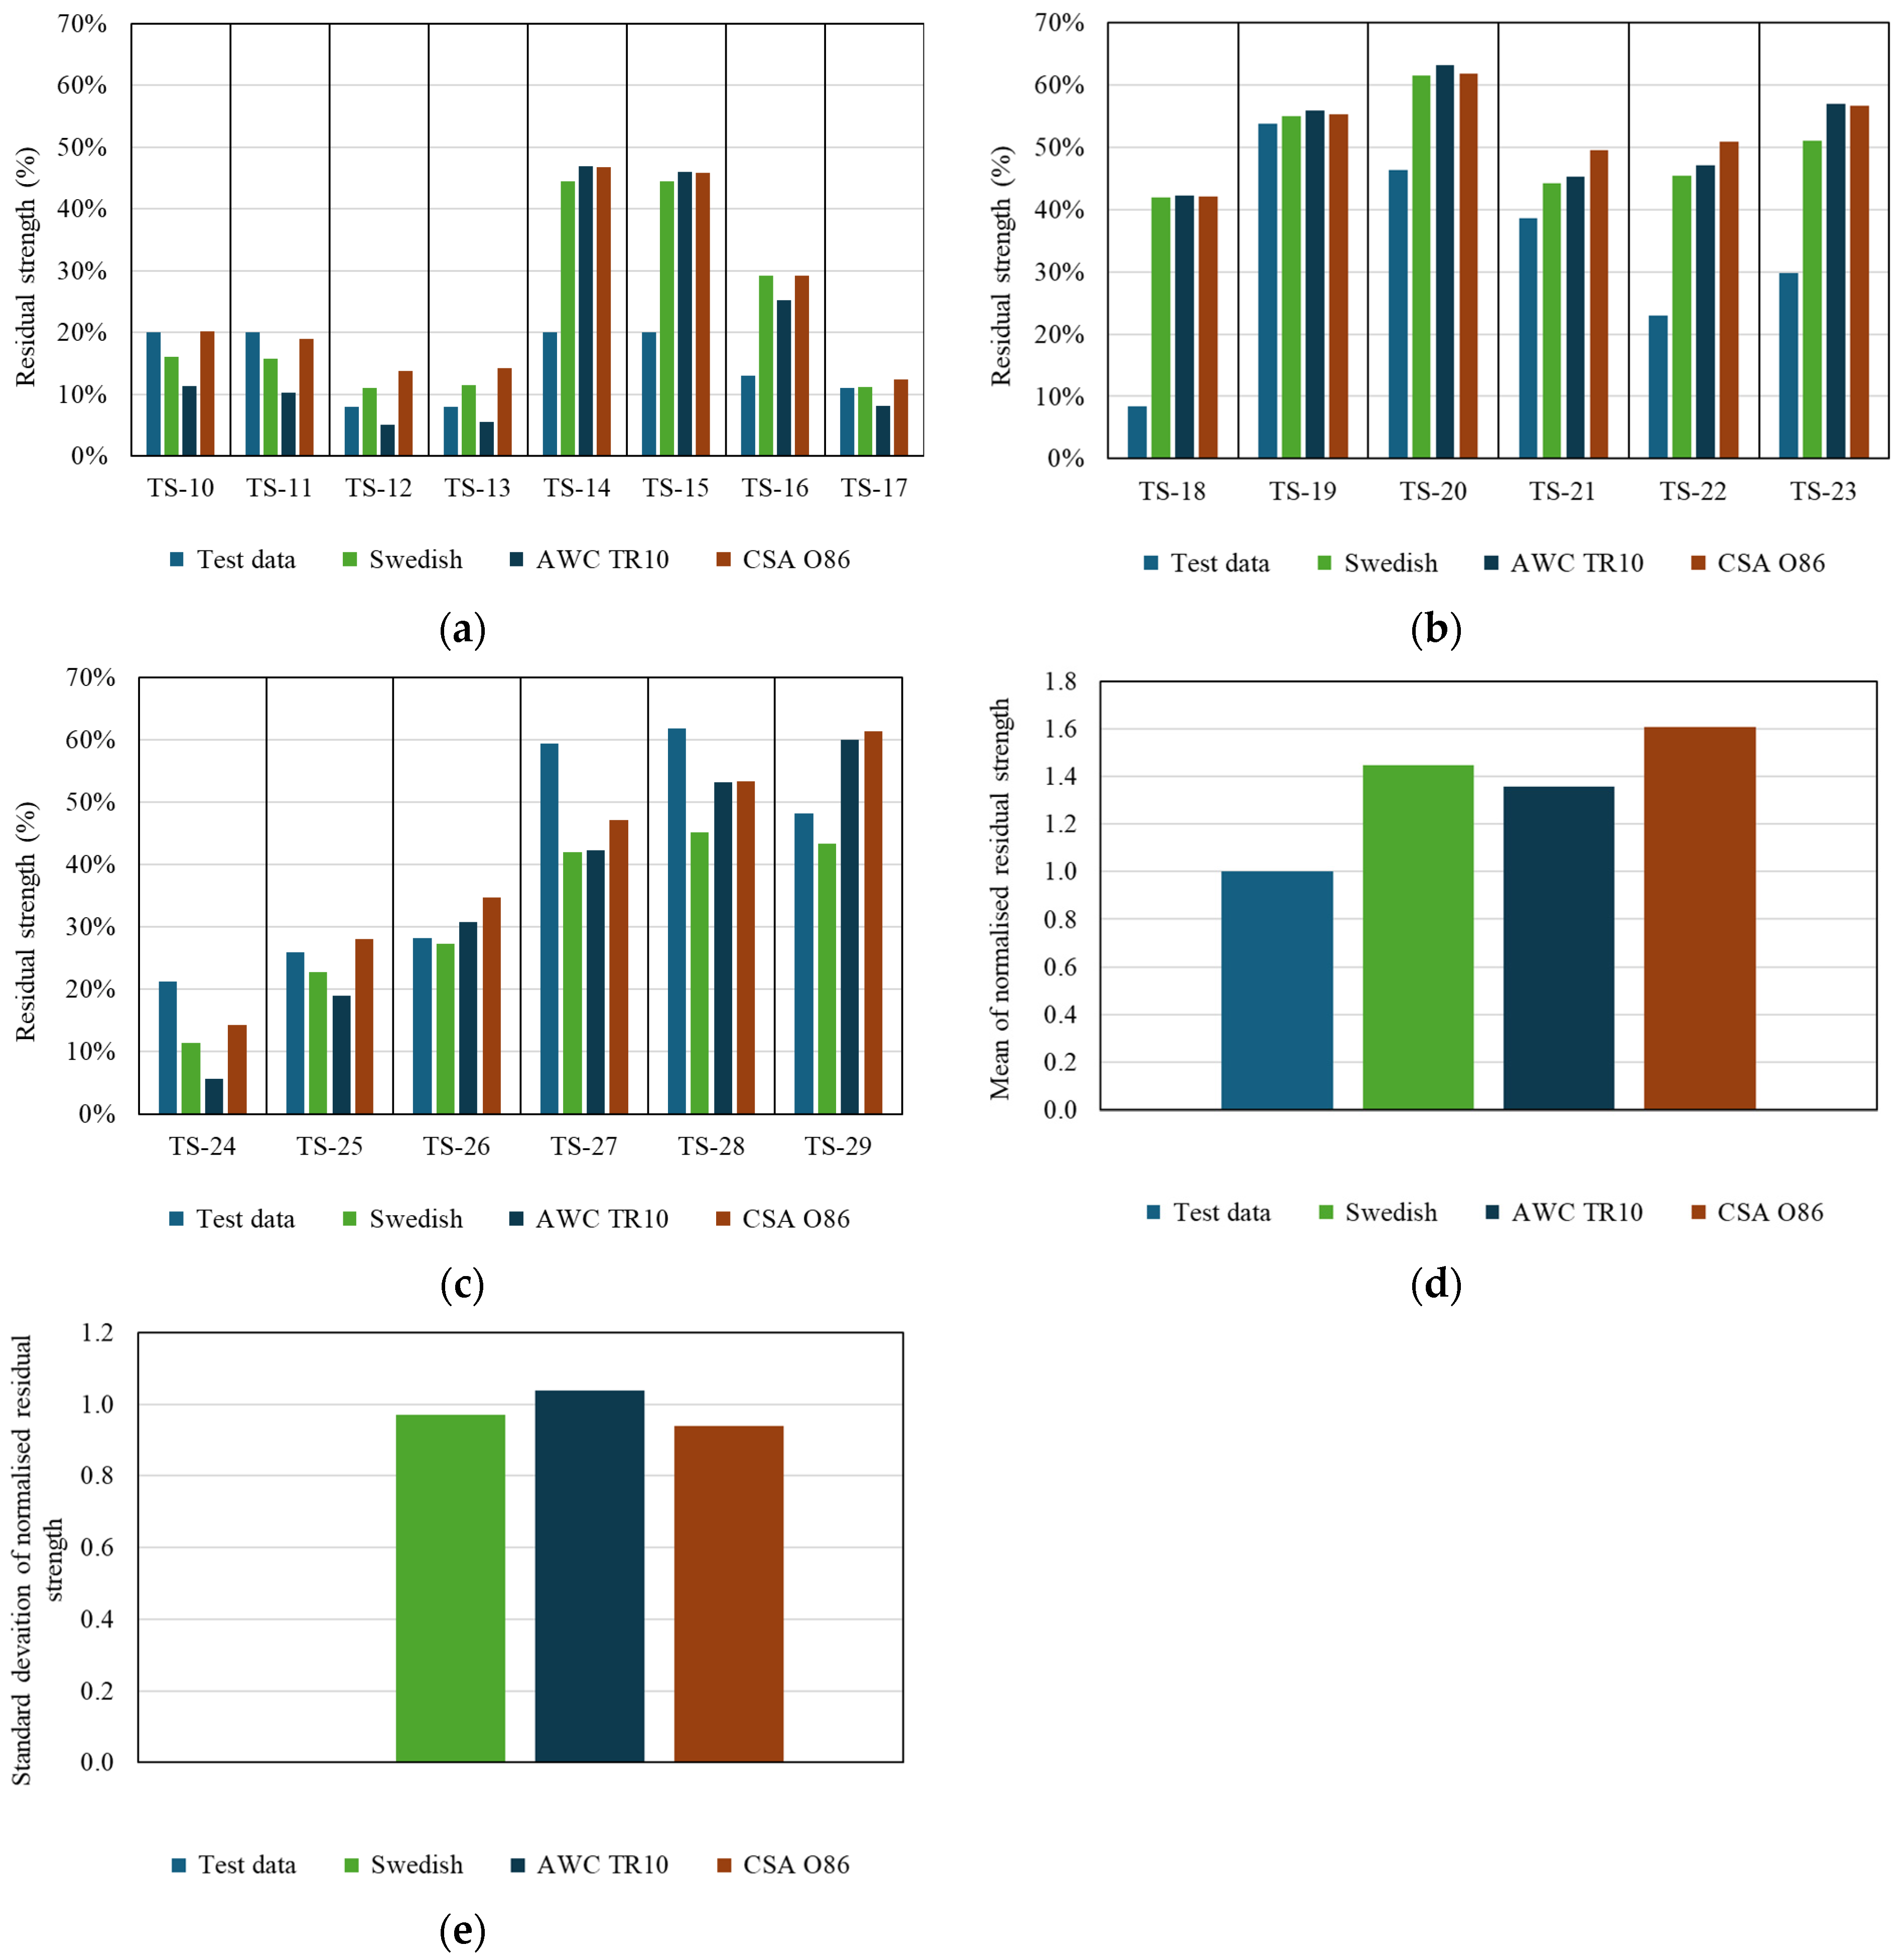
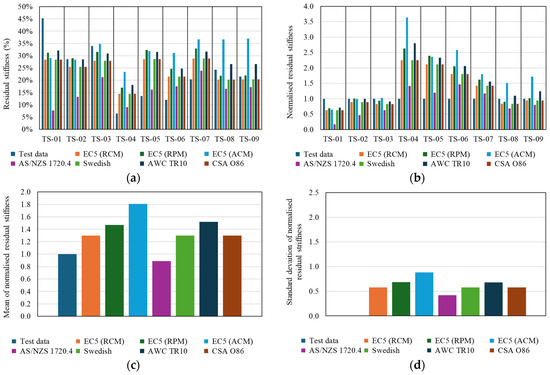
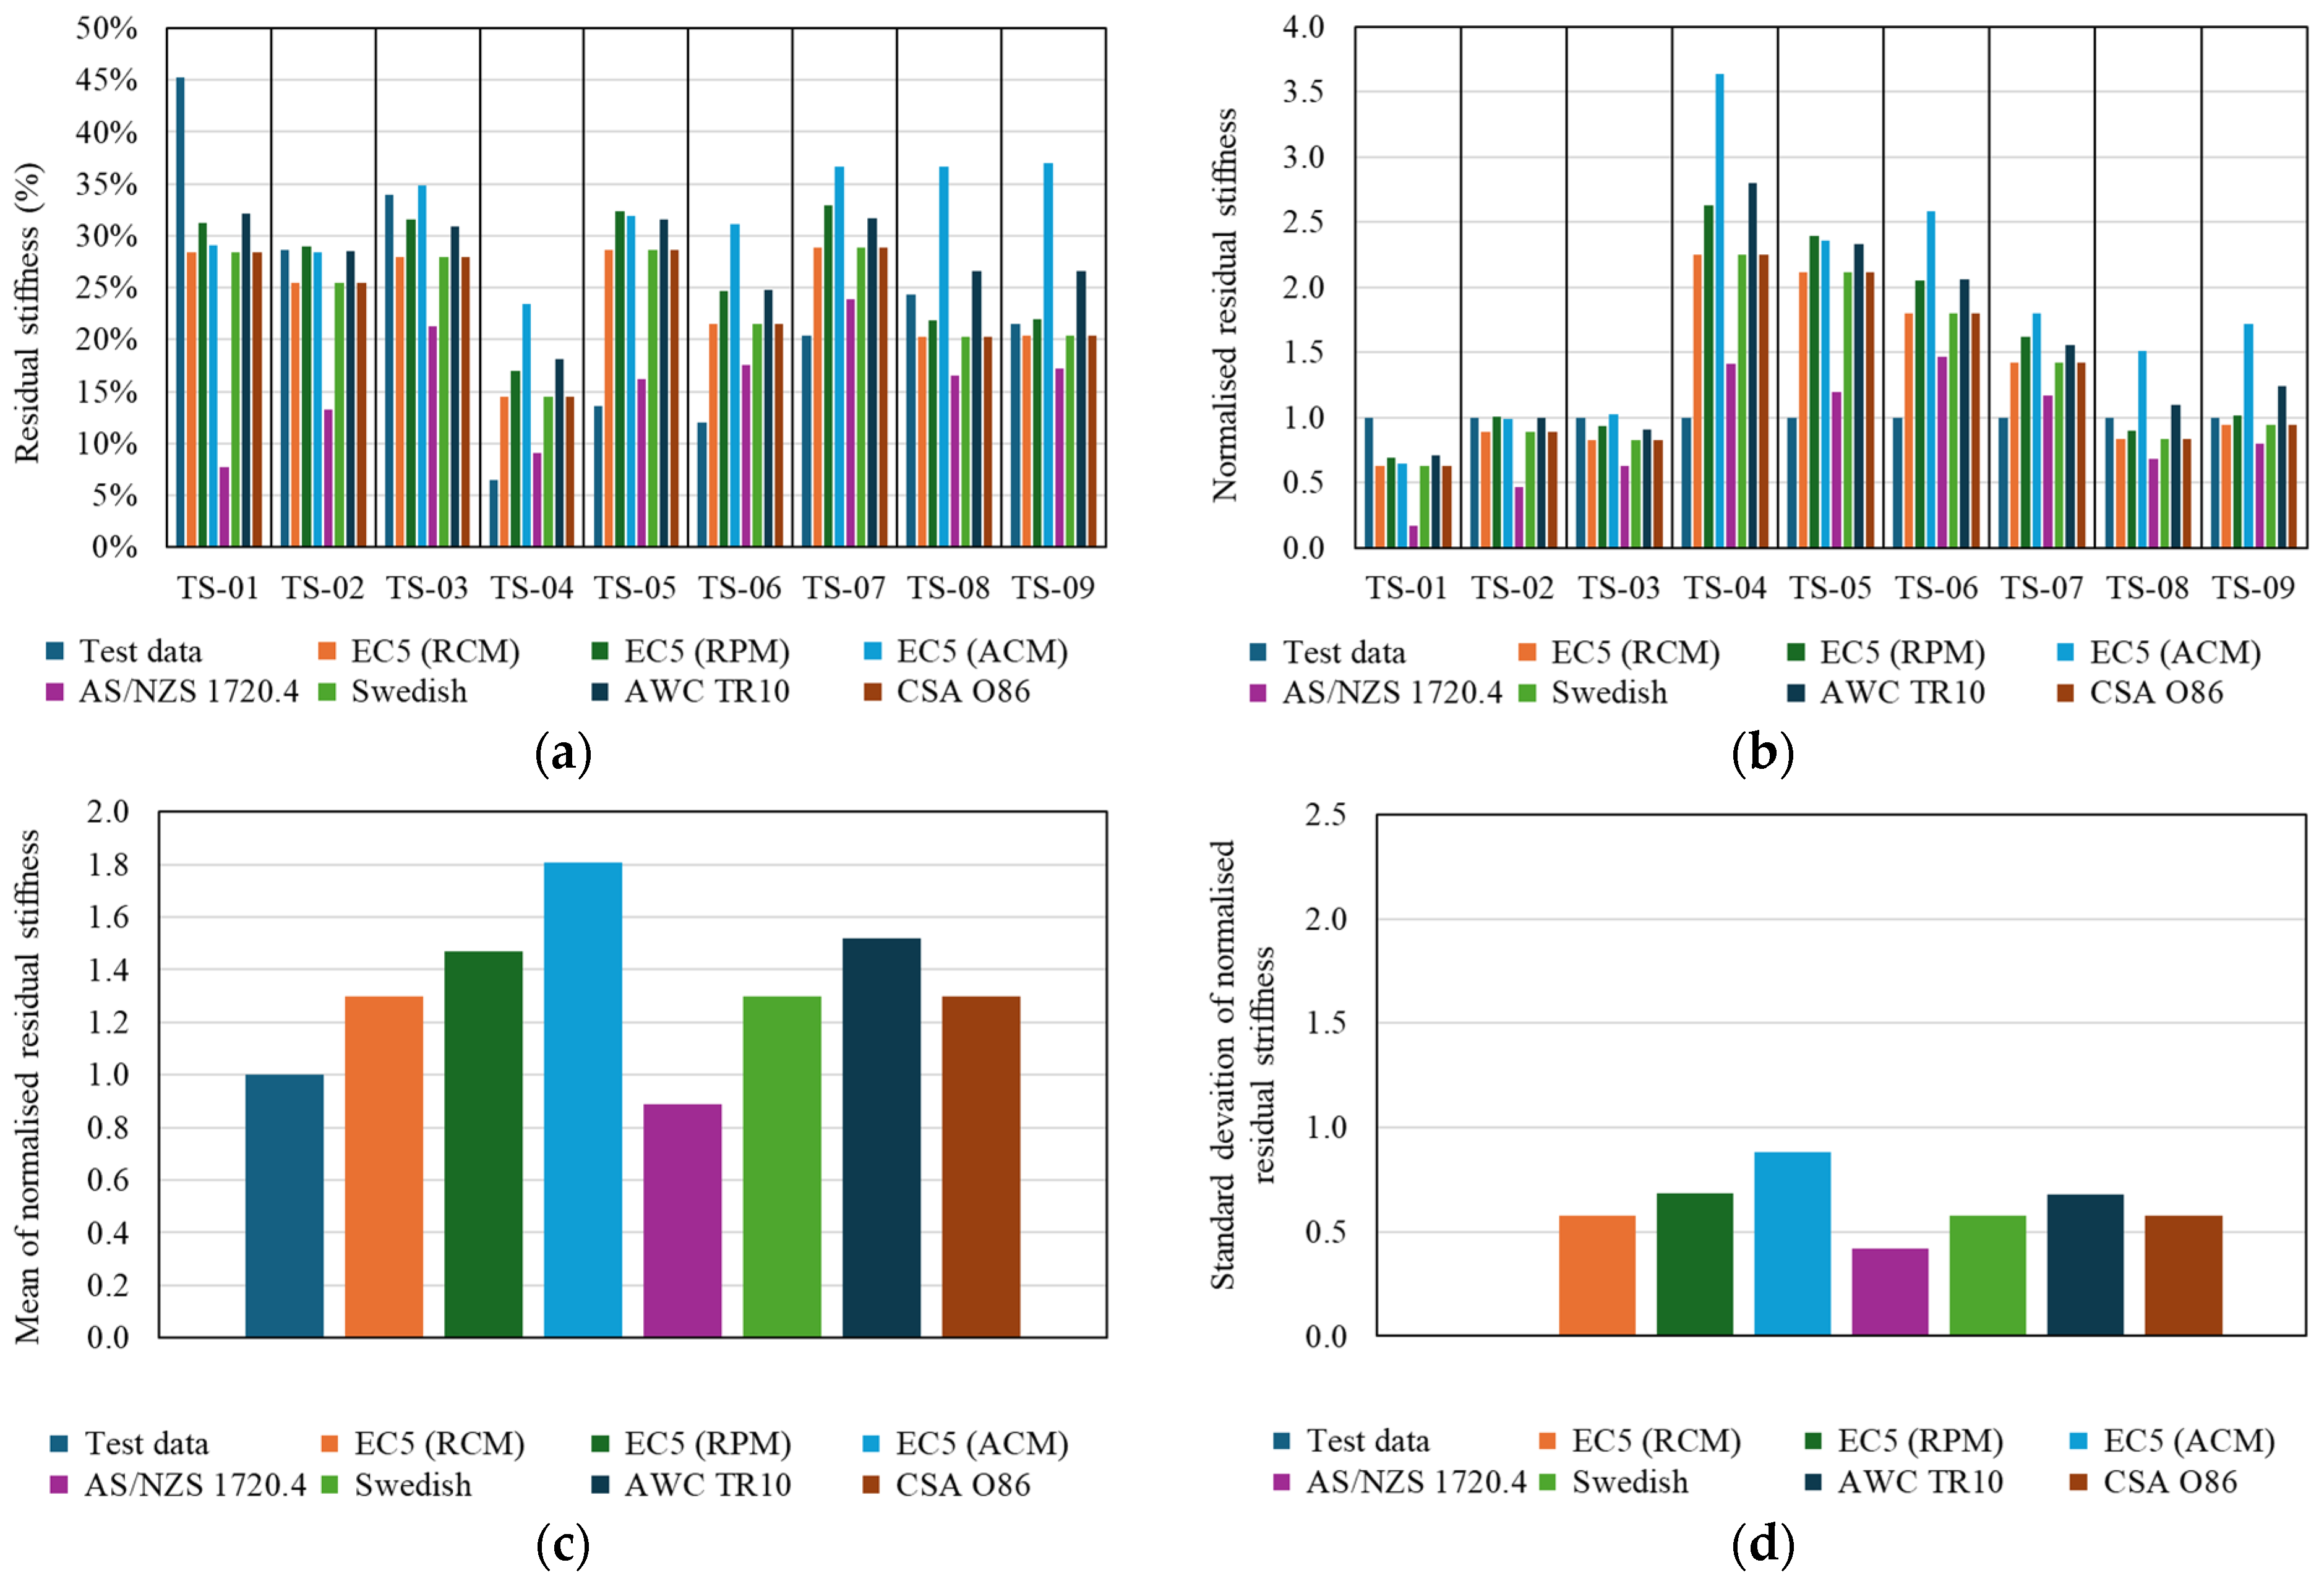
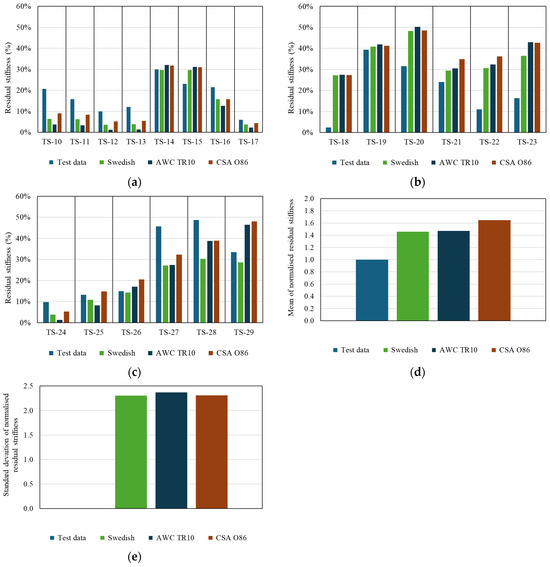
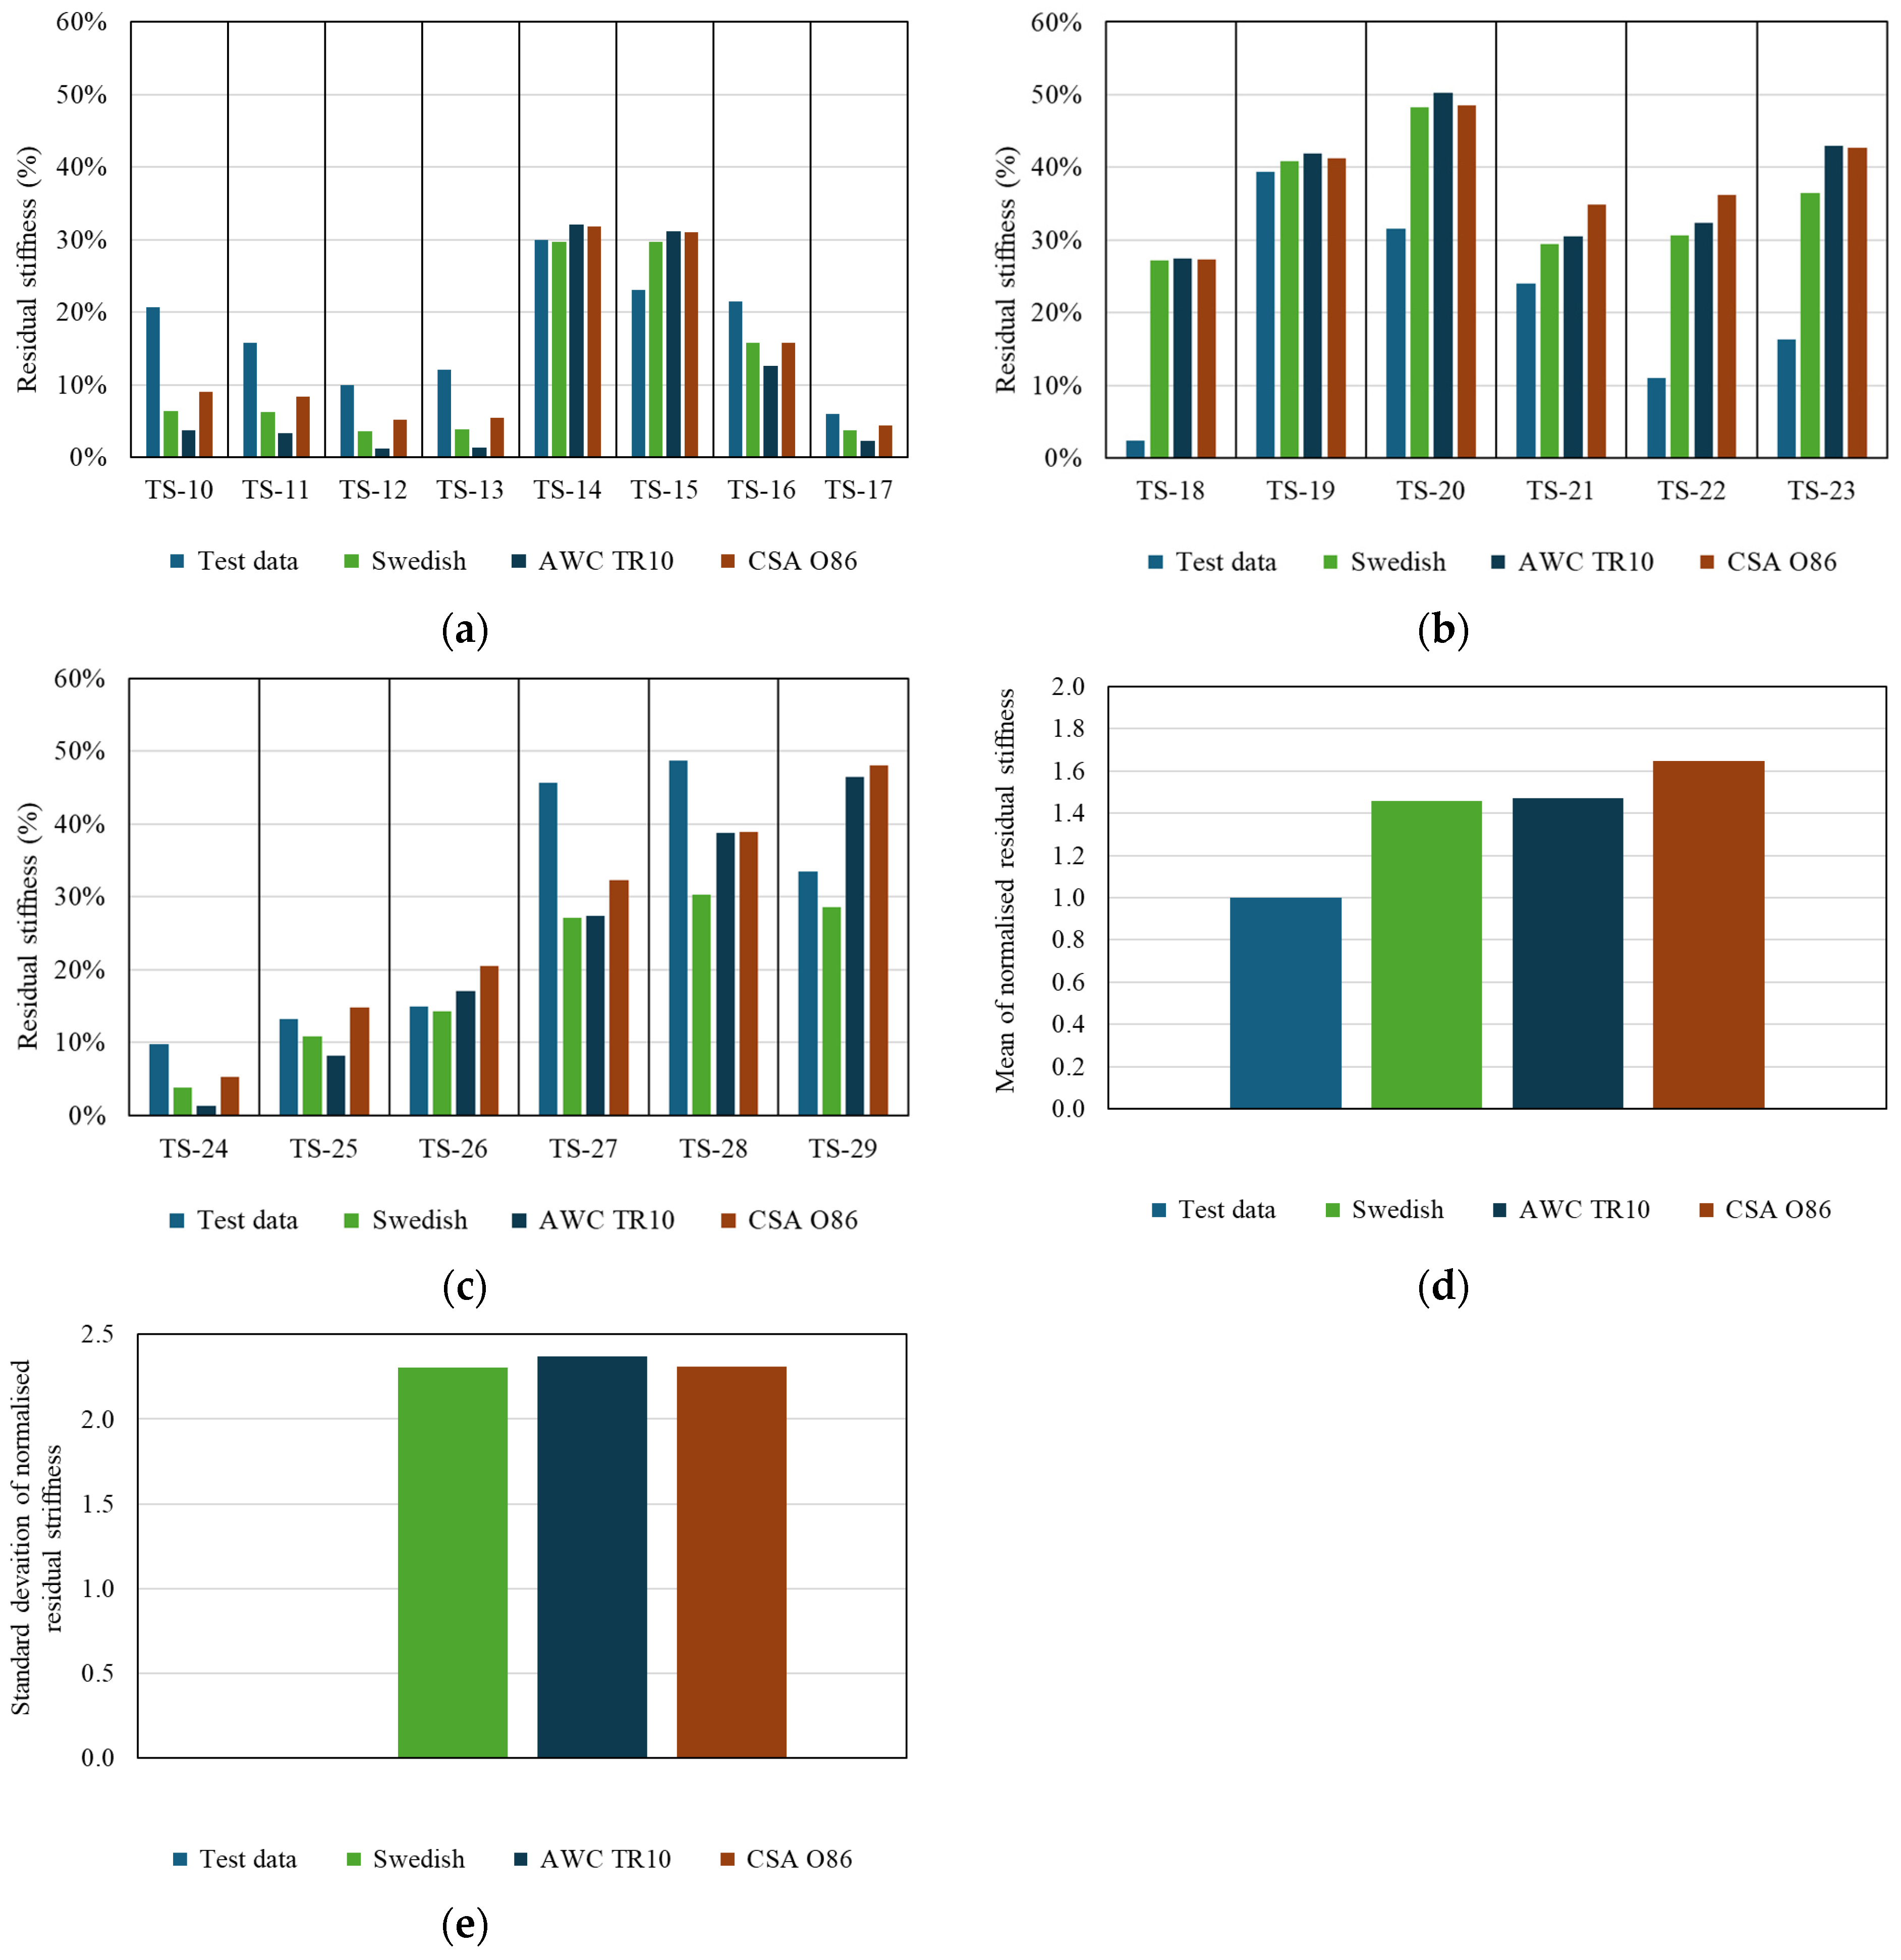

Disclaimer/Publisher’s Note: The statements, opinions and data contained in all publications are solely those of the individual author(s) and contributor(s) and not of MDPI and/or the editor(s). MDPI and/or the editor(s) disclaim responsibility for any injury to people or property resulting from any ideas, methods, instructions or products referred to in the content. |
© 2026 by the authors. Licensee MDPI, Basel, Switzerland. This article is an open access article distributed under the terms and conditions of the Creative Commons Attribution (CC BY) license.