


Abstract
Post-quench natural aging can alter the response of Al–Mg–Si alloys to further artificial aging, while post-artificial-aging hardness, Hpost-AA, may obscure changes in the retained artificial-aging response. Five high-purity alloys containing 0.95–0.99 mol% Mg + Si, with Mg/Si ratios of 0.52, 1.1, 1.9, 3.0, and 4.0, were solution-treated at 848 K for 3.6 ks, quenched, and artificially aged at 473 K. Under direct artificial aging, after a minimum practical delay of approximately 0.1 ks, the Mg/Si = 1.1 alloy showed the highest Hpeak of approximately 72–73 HV0.1, whereas Mg/Si = 4.0 reached approximately 53–55 HV0.1. The precipitate areal density was highest near Mg/Si = 1 and decreased markedly in Mg-rich alloys. Operational HRTEM classification indicated that β″-related precipitates predominated in the Si-excess alloys, whereas β′-like and parallelogram-type precipitates were more prominent in the Mg-rich alloy. For Mg/Si ratios of 0.52, 1.9, and 4.0, quench-to-aging delays of up to 6000 ks produced non-monotonic changes in Hpost-AA. However, the additional hardening increment, ΔHAA, decreased from 38.5 to 26.1 HV0.1 at Mg/Si = 0.52 and from 33.5 to 26.9 HV0.1 at Mg/Si = 1.9. These results show that both Hpost-AA and ΔHAA are required to evaluate quench-to-aging delays.
1. Introduction
Al–Mg–Si alloys combine formability, corrosion resistance, and a substantial precipitation-hardening response, making them important for extruded and sheet products whose final properties are developed through thermal processing. After solution treatment and quenching, the supersaturated solid solution evolves through solute clustering and metastable precipitates before forming equilibrium Mg2Si. The commonly reported sequence includes Mg- and Si-rich clusters; co-clusters or Guinier–Preston zones; needle-shaped β″, β′ and related intermediate structures; and, finally, β-Mg2Si [1,2,3,4]. Among these products, finely dispersed coherent or semi-coherent β″-based precipitates provide the most efficient strengthening near peak age.
The Mg/Si ratio is a central composition variable because it changes the amount of Mg2Si-equivalent solute, the excess solute chemistry, and the precipitate classes selected during artificial aging. Prior microscopy and property studies have shown that deviations from the chemistry favorable for β″ can increase the fractions of β′, U-type, or disordered precipitates and alter peak hardness and overaging kinetics [5,6,7,8]. However, comparisons across commercial alloys often confound the Mg/Si ratio with total solute, Cu, Mn, Fe, or thermomechanical history. A controlled alloy series with nearly constant Mg + Si is therefore useful for isolating the composition effect. Total Mg + Si content also affects clustering and natural-aging kinetics [9] (see Section 4); therefore, the present design supports comparison within an approximately 1 mol% Mg + Si series rather than a universal Mg/Si-ratio dependence independent of total solute content.
A second difficulty arises from the unavoidable delay between quenching and artificial aging. Room-temperature natural aging consumes excess vacancies and builds solute clusters; depending on chemistry and thermal history, these clusters can assist, delay, or inhibit subsequent precipitation [10,11,12,13,14]. Banhart et al. [10] emphasized that these clustering and precursor processes are complex and can redirect subsequent β″-related precipitation rather than following a single universal pathway. The resulting “natural-aging effect” is often reported using the peak hardness after artificial aging, yet Hpost-AA combines the hardness already accumulated during storage with the additional increment created by the final artificial-aging step. This distinction is especially important for manufacturing workflows in which both incoming hardness and the retained response to a paint-bake or aging treatment matter [15,16,17,18]. Related tensile and forming studies show that natural aging can change yield strength, ductility, work hardening, springback, bake-hardening response, bendability, and formability and that these descriptors do not necessarily evolve in parallel [19,20,21,22,23].
In this study, we separate these effects in five high-purity Al–Mg–Si alloys containing approximately 1 mol% total Mg + Si and spanning Mg/Si ratios from 0.52 to 4.0. Direct artificial aging curves are combined with conventional TEM, HRTEM-based precipitate classification, and a natural-aging series for three representative compositions. The objectives are to (i) determine how the Mg/Si ratio changes direct age-hardening and precipitate selection, (ii) distinguish absolute post-aging hardness from the remaining artificial aging increment after natural aging, and (iii) identify microstructural descriptors that are more informative than total precipitate density alone.
2. Materials and Methods
Five laboratory Al–Mg–Si alloys were prepared from 99.99% Al and 99.9% Mg and Si. The nominal compositions were designed to maintain the total Mg + Si content near 1 mol% while varying the Mg/Si ratio. The measured compositions are listed in Table 1. MS0.5, MS1.0, MS2.0, MS3.0, and MS4.0 are alloy designations based on target nominal Mg/Si ratios of 0.5, 1.0, 2.0, 3.0, and 4.0, respectively; their measured Mg/Si ratios are 0.52, 1.1, 1.9, 3.0, and 4.0, respectively. The MS labels are used to identify specimens, whereas the measured ratios are used for quantitative composition-dependent comparisons. The Mg2Si-equivalent solute in Table 1 is a compositional bookkeeping quantity calculated from the limiting solute and does not imply that Mg2Si had precipitated in the as-processed material.
Table 1.
Measured composition of the alloy series (mol%, except the dimensionless Mg/Si ratio).
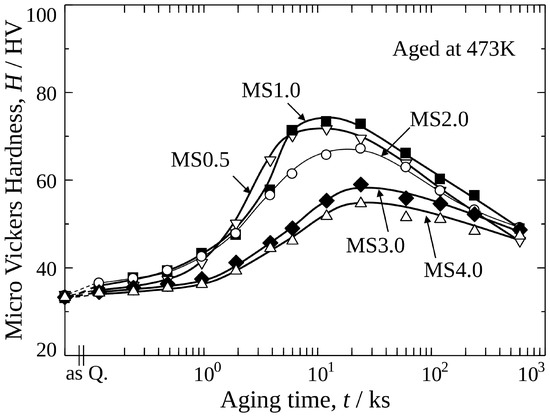
The cast alloys were homogenized, hot-extruded at 678 K (405 °C), and cold-rolled to a final thickness of 1.5 mm. The specimens were solution-treated at 848 K (575 °C) for 3.6 ks (1 h) and immediately quenched into ice water. Artificial aging was conducted at 473 K (200 °C). For direct-aging curves, hardness was measured over the aging times shown in Figure 1. The alloy-specific direct peak-aging times were 12 ks for MS0.5 and MS1.0 and 24 ks for MS2.0, MS3.0, and MS4.0.
Figure 1.
Evolution of Vickers microhardness during artificial aging at 473 K after solution treatment and quenching.
The quench-to-aging delay ranged from approximately 0.1 to 6000 ks (approximately 1667 h or 69.4 days at the longest condition). The condition at approximately 0.1 ks (approximately 100 s) represented direct artificial aging after the minimum practical specimen transfer time and was therefore designated as Direct AA. Longer delays were produced by intentional natural aging at approximately 293 K before artificial aging. The specimens were artificially aged at 473 K using the alloy-specific peak-aging times determined from the direct artificial-aging curves: 12 ks for MS0.5 and 24 ks for MS2.0 and MS4.0.
Vickers microhardness was measured on mechanically polished surfaces using an HM-101 microhardness tester (Mitutoyo, Kanagawa, Japan). A load of 0.98 N (HV0.1) and a dwell time of 15 s were used. Ten indents were made for each condition at positions sufficiently separated to avoid interaction between plastic zones. The reported values are arithmetic means; the source records indicate typical scatter of approximately ±1–2 HV.
The hardness quantities used throughout this study were defined as follows. HAQ denotes the as-quenched hardness, and Hpeak denotes the peak hardness reached during direct artificial aging. For the natural-aging series, Hpre-AA denotes the hardness immediately before the prescribed 473 K artificial-aging treatment, and Hpost-AA denotes the absolute hardness measured after that treatment. The direct age-hardening increment is ΔHdirect = Hpeak − HAQ, whereas the artificial-aging hardness increment was defined as ΔHAA = Hpost-AA − Hpre-AA. Thus, Hpost-AA describes the absolute hardness after the prescribed aging history, whereas ΔHAA isolates the additional response retained for the subsequent artificial-aging step.
Electron-transparent foils were prepared via twin-jet electropolishing in a methanol–nitric acid electrolyte at approximately 253 K. Conventional TEM and HRTEM were performed using a Topcon EM-002B microscope (Topcon, Tokyo, Japan) operated at 120 kV with a nominal point resolution of 0.18 nm. Precipitates were evaluated from cross-sectional images acquired near the Al [001] zone axis. The number of observed precipitate cross-sections was divided by the analyzed foil area to obtain a two-dimensional precipitate areal number density, NA, in µm−2. Because the supplied quantitative records report only areal density and foil-thickness information was not available, NA was not converted to a three-dimensional number density or precipitate volume fraction and was not interpreted as a direct measure of strengthening potency.
Individual precipitates were assigned to mutually exclusive β″, complex β″, β′, parallelogram-type, and disordered/random-type categories based on projected lattice characteristics, characteristic lattice spacings and angles, morphology, the orientation relationship with the Al matrix, and, where required, FFT/IFFT analysis. The term “complex β″” denotes β″-related projected structures that did not match the ideal β″ motif, and “disordered/random-type” denotes precipitates without a reproducible ordered projection under the imaging condition. The relative frequency of each category was calculated as its number fraction within the total classified precipitate population for that condition.
For HRTEM sampling, the observation position was moved across different electron-transparent regions of the foil. Precipitates were imaged when their lattice projections could be resolved sufficiently clearly for structural classification. Non-overlapping observation regions were used to minimize the possibility of counting the same precipitate more than once. All acquired images satisfying the predefined image-quality requirements for classification were included; no secondary selection of particularly representative precipitates was performed after image acquisition. Precipitates for which the lattice projection could not be resolved clearly were excluded. One HRTEM image could contain more than one counted precipitate, and each precipitate was assigned to only one category.
Because inclusion in the HRTEM statistics required a sufficiently resolved lattice projection, the reported fractions represent the population of HRTEM-resolvable precipitates rather than a strictly random sample of all precipitates in the foil. Classification uncertainty may arise from the two-dimensional projection of three-dimensional precipitate structures, local image quality, precipitate orientation, and similarities among projected structural motifs. Accordingly, the phase-class results are interpreted as descriptive within-study number fractions rather than absolute crystallographic phase fractions. The numbers of HRTEM images examined and precipitates classified for each condition are reported in Table 2.
Table 2.
Numbers of HRTEM images examined and precipitates included in the operational classification for each condition.
All numerical data were obtained from the authors’ original experimental records. No smoothing, fitted interpolation, or imputation was applied. The phase-class number fractions presented later in this article were recalculated from the source counts and normalized to 100% within each condition. “Total” means the number of HRTEM images and precipitates we checked to make this table.
3. Results
MS0.5, MS1.0, MS2.0, MS3.0, and MS4.0 denote the nominal alloy designations; the corresponding measured Mg/Si ratios are 0.52, 1.1, 1.9, 3.0, and 4.0, respectively (Table 1). The MS labels identify specimens, and measured ratios are used below when discussing quantitative composition trends. Under the Direct AA condition, the five alloys exhibited similar HAQ values of approximately 33–36 HV0.1 but markedly different artificial-aging responses. MS1.0 showed the highest Hpeak of approximately 72–73 HV0.1 at 12 ks. MS0.5 reached approximately 70–71 HV0.1 at 12 ks, whereas MS2.0 reached approximately 65–67 HV0.1 at 24 ks. The Mg-rich alloys MS3.0 and MS4.0 reached approximately 58–59 and 53–55 HV0.1, respectively, at 24 ks. Prolonged aging resulted in a gradual decrease in hardness, indicating overaging.
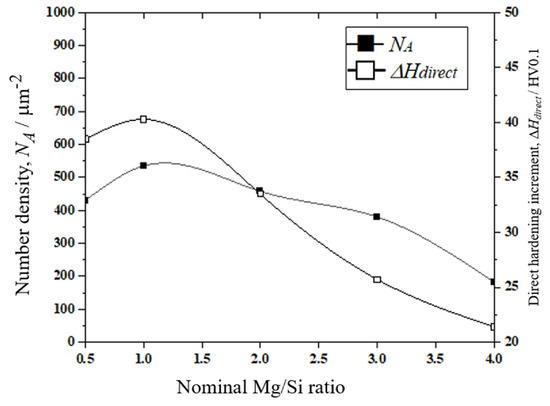
The direct-aging NA followed a composition trend similar to ΔHdirect (Figure 2). NA increased from approximately 4.30 × 102 µm−2 at Mg/Si = 0.52 to approximately 5.3 × 102 µm−2 at Mg/Si = 1.1 and then declined to 4.58 × 102 µm−2 at Mg/Si = 1.9, approximately 3.8 × 102 µm−2 at Mg/Si = 3.0, and 1.83 × 102 µm−2 at Mg/Si = 4.0. ΔHdirect decreased from approximately 38–40 HV0.1 at Mg/Si = 0.52–1.1 to approximately 21 HV0.1 at Mg/Si = 4.0.
Figure 2.
Two-dimensional precipitate areal number density, NA (filled symbols, left axis), and direct age-hardening increment, ΔHdirect (open symbols, right axis), as functions of the nominal alloy Mg/Si ratio. Measured Mg/Si ratios are listed in Table 1.
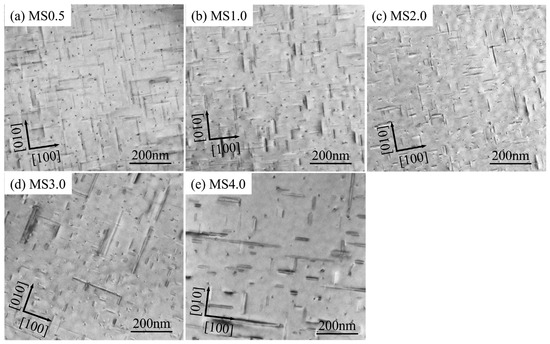
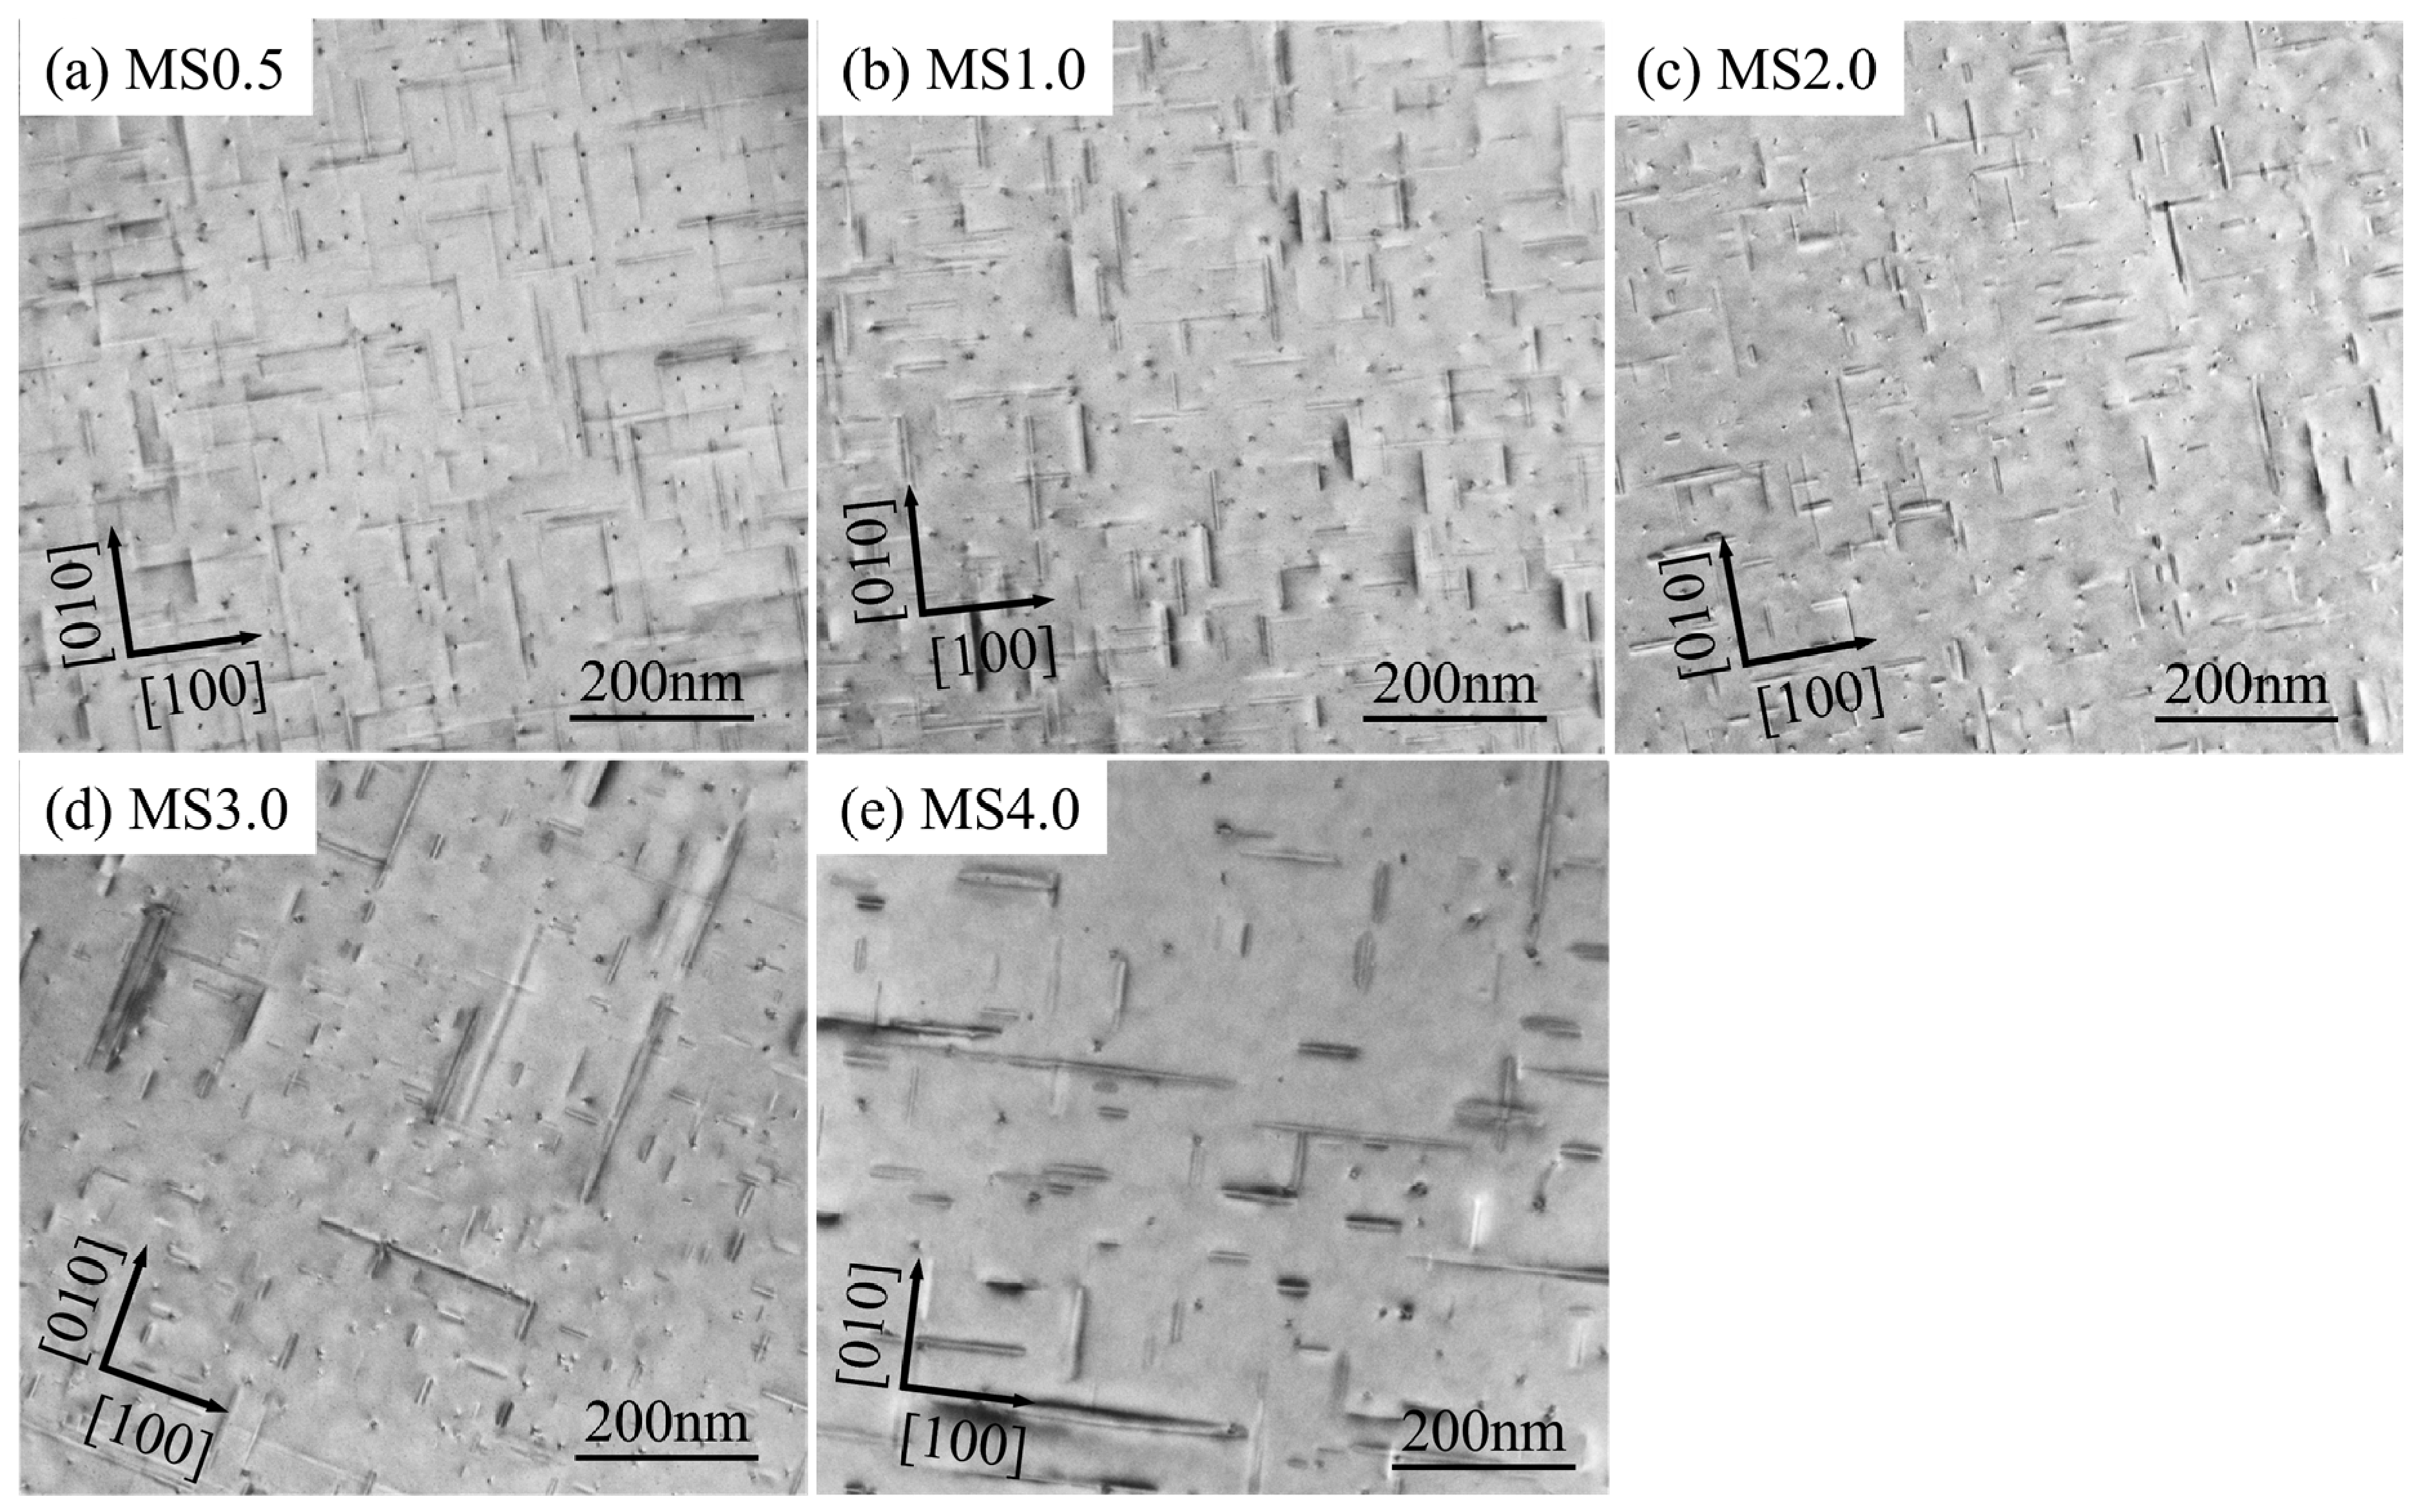
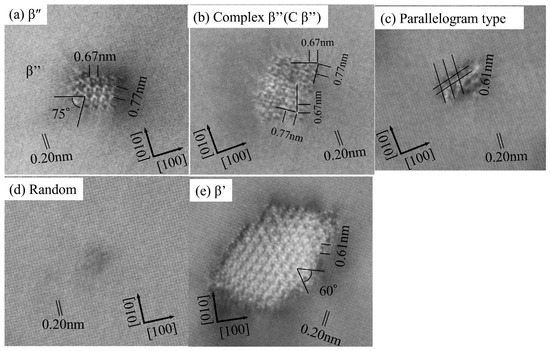
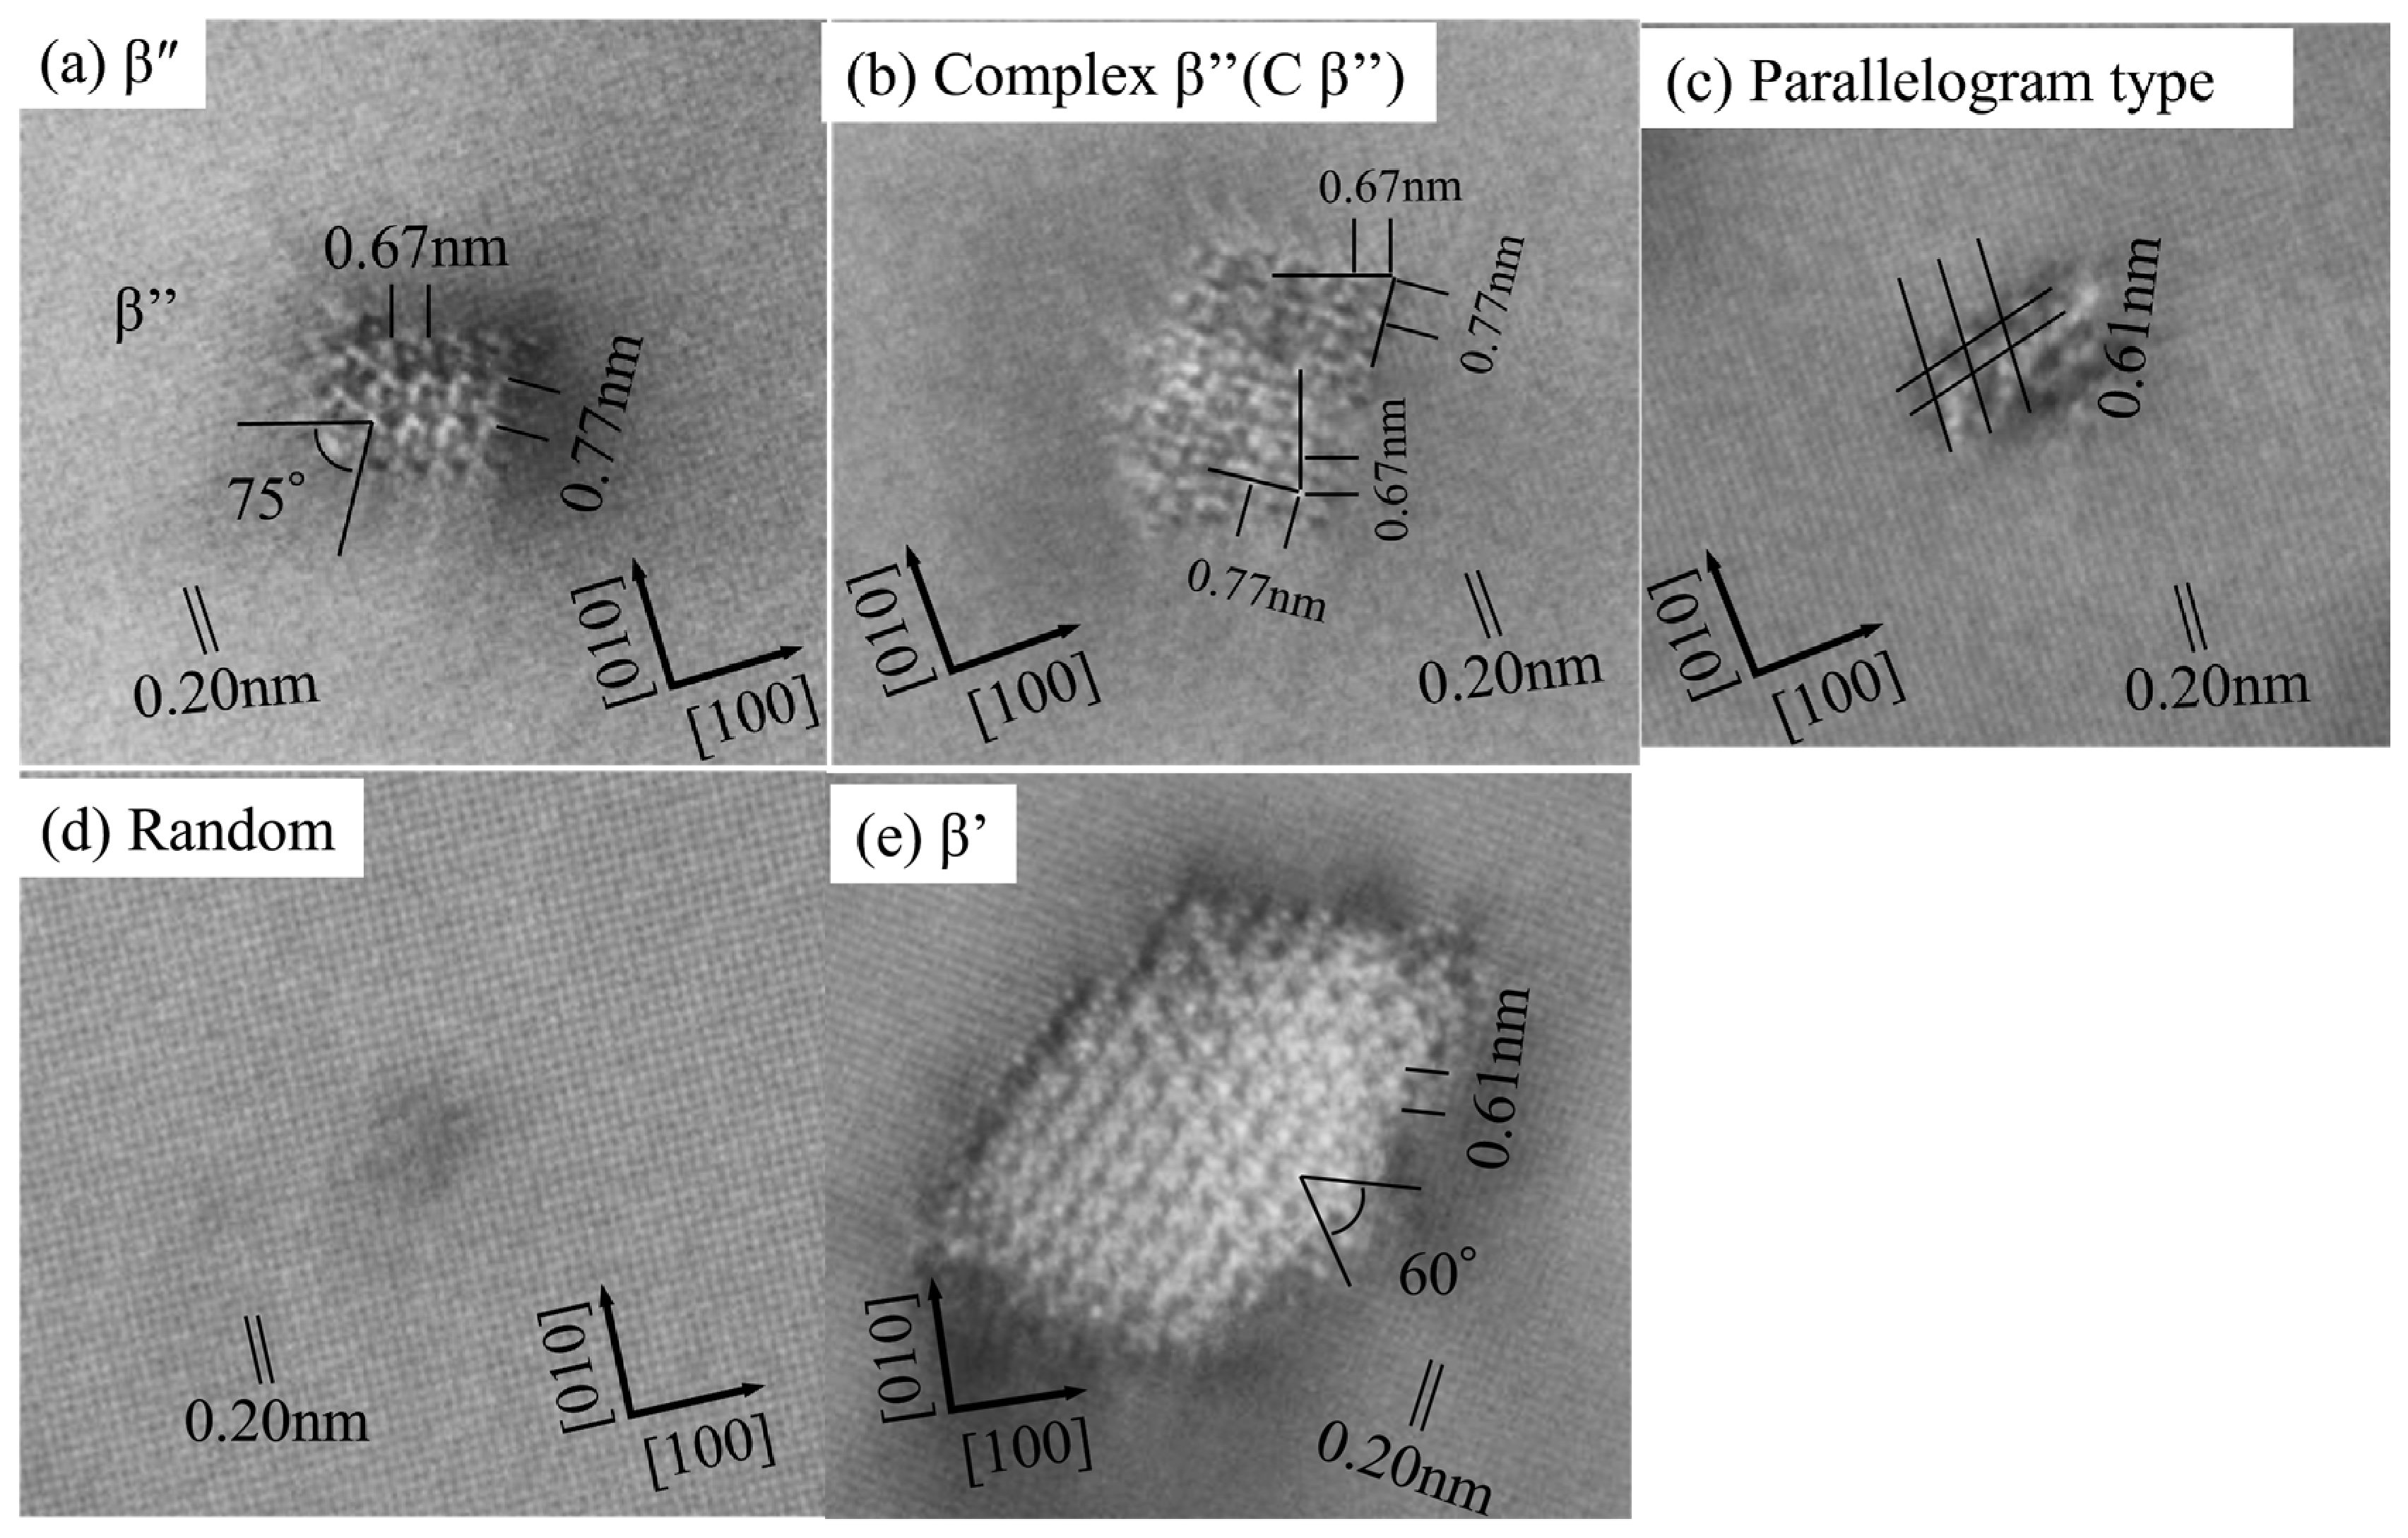
TEM images confirm a dense precipitate population in the Si-excess and intermediate-ratio alloys and a visibly coarser, less dense population in the Mg-rich material (Figure 3). The morphology also changes across the series, motivating phase-class analysis rather than treating every intercepted precipitate as equivalent. Representative HRTEM images used to define these operational precipitate classes are shown in Figure 4. The β″ phase is shown in Figure 4a, identified by its characteristic 0.67 and 0.77 nm lattice spacings and a 75° interplanar angle. A complex β″ variant is shown in Figure 4b, which retains the characteristic lattice spacings of the ideal β″ phase but exhibits a less ordered or intergrown projection. The parallelogram-type precipitate is shown in Figure 4c and is distinguished by a 0.61 nm lattice spacing and a characteristic parallelogram-shaped lattice arrangement. The disordered/random-type precipitate shown in Figure 4d exhibits no clearly resolved periodic structure. The β′ phase shown in Figure 4e is identified by a 0.61 nm lattice spacing and a 60° interplanar angle. All images share a 0.20 nm scale bar and are indexed along the [001] zone axes of the aluminum matrix. These classification criteria were applied consistently across all alloy compositions at their respective direct peak-aging times, namely 12 ks for MS0.5 and MS1.0 and 24 ks for MS2.0–MS4.0.
Figure 3.
Conventional TEM images of direct peak-aged alloys: (a) MS0.5, (b) MS1.0, (c) MS2.0, (d) MS3.0, and (e) MS4.0. Original scale bars are 200 nm. Images were resized and arranged for layout; no microscopy features were added or removed. The alloy-specific peak-aging times were 12 ks for MS0.5 and MS1.0 and 24 ks for MS2.0–MS4.0.
Figure 4.
Representative HRTEM projections used for operational precipitate classification: (a) β″, (b) complex β″, (c) parallelogram-type, (d) disordered/random-type, and (e) β′. The corresponding direct peak-aging times were 12 ks for MS0.5 and MS1.0 and 24 ks for MS2.0–MS4.0.
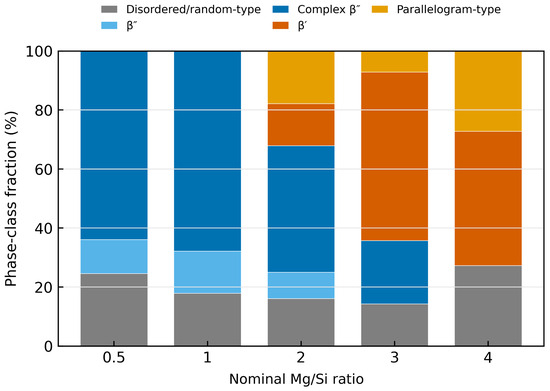
The phase-class distribution changed systematically with Mg/Si ratio (Figure 5). Complex β″ accounted for 63.9% and 67.9% of precipitates in MS0.5 and MS1.0, respectively; adding the ideal β″ class increased the β″-related fractions to 75.4% and 82.1%. MS2.0 contained a more heterogeneous population: 42.9% complex β″, 8.9% β″, 14.3% β′, 17.9% parallelogram-type, and 16.1% disordered/random-type. In MS3.0, β′ became the largest class (57.1%). No ideal or complex β″ was classified in MS4.0; β′ (45.5%), parallelogram-type (27.3%), and disordered/random-type (27.3%) comprised the population.
Figure 5.
Operational phase-class number fractions at the alloy-specific direct peak-aging conditions (12 ks for MS0.5 and MS1.0; 24 ks for MS2.0–MS4.0), shown by nominal alloy designation. Measured Mg/Si ratios are listed in Table 1. Each bar is normalized to 100%.
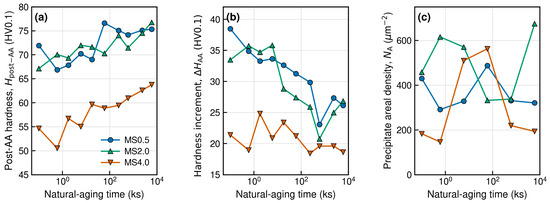
Hpost-AA did not decrease monotonically with natural-aging time (Figure 6a). At the practical short-delay condition of Direct AA (approximately 0.1 ks or 100 s), MS0.5, MS2.0, and MS4.0 had Hpost-AA values of 71.94, 67.13, and 54.65 HV0.1, respectively. After 6000 ks, the recorded values were 75.36, 76.77, and 63.78 HV0.1. The higher long-delay Hpost-AA reflects the combination of storage hardening and the subsequent 473 K increment; it must not be interpreted as evidence that the additional response represented by ΔHAA increased.
Figure 6.
Effects of natural-aging time at approximately 293 K on (a) Hpost-AA, (b) ΔHAA, and (c) the two-dimensional precipitate areal number density, NA. Panels (a,b) include Direct AA (approximately 0.1 ks) and natural-aging times of 0.6, 1.8, 6, 18, 60, 240, 600, 2400, and 6000 ks; panel (c) includes the six conditions for which NA data were available: Direct AA, 0.6, 6, 60, 600, and 6000 ks. The subsequent peak-aging treatments were 473 K for 12 ks for MS0.5 and 473 K for 24 ks for MS2.0 and MS4.0.
ΔHAA isolates the additional response to the prescribed artificial-aging treatment (Figure 6b). For MS0.5, ΔHAA decreased from 38.48 HV0.1 at Direct AA to 26.15 HV0.1 at 6000 ks, a reduction of approximately 32%. MS2.0 decreased from 33.48 to 26.85 HV0.1 (approximately 20%), with a minimum of 20.76 HV0.1 at 600 ks. MS4.0 retained a smaller and scattered increment over the measured range; its ΔHAA values at 2400 and 6000 ks were 19.60 and 18.62 HV0.1, respectively. Thus, the negative natural-aging effect is clear in ΔHAA for MS0.5 and MS2.0, even though Hpost-AA can recover or increase.
NA varied non-monotonically with natural-aging time (Figure 6c). MS0.5 ranged from 2.91 × 10² to 4.88 × 102 µm−2 and ended at 3.21 × 102 µm−2. MS2.0 increased initially to 6.15 × 102 µm−2, fell to approximately 3.3 × 102 µm−2 at 60–600 ks, and rose to 6.74 × 102 µm−2 at 6000 ks. MS4.0 reached 5.63 × 102 µm−2 at 60 ks but returned to 1.94 × 102 µm−2 by 6000 ks. These changes did not track ΔHAA one-to-one. For example, MS2.0 had its highest recorded NA at 6000 ks, while its ΔHAA remained below the Direct AA value.
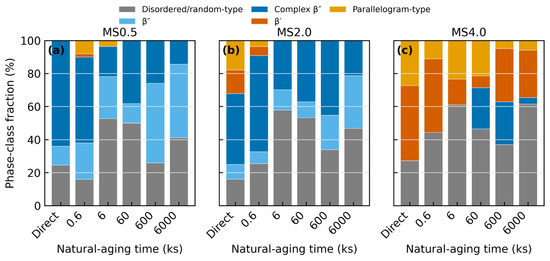
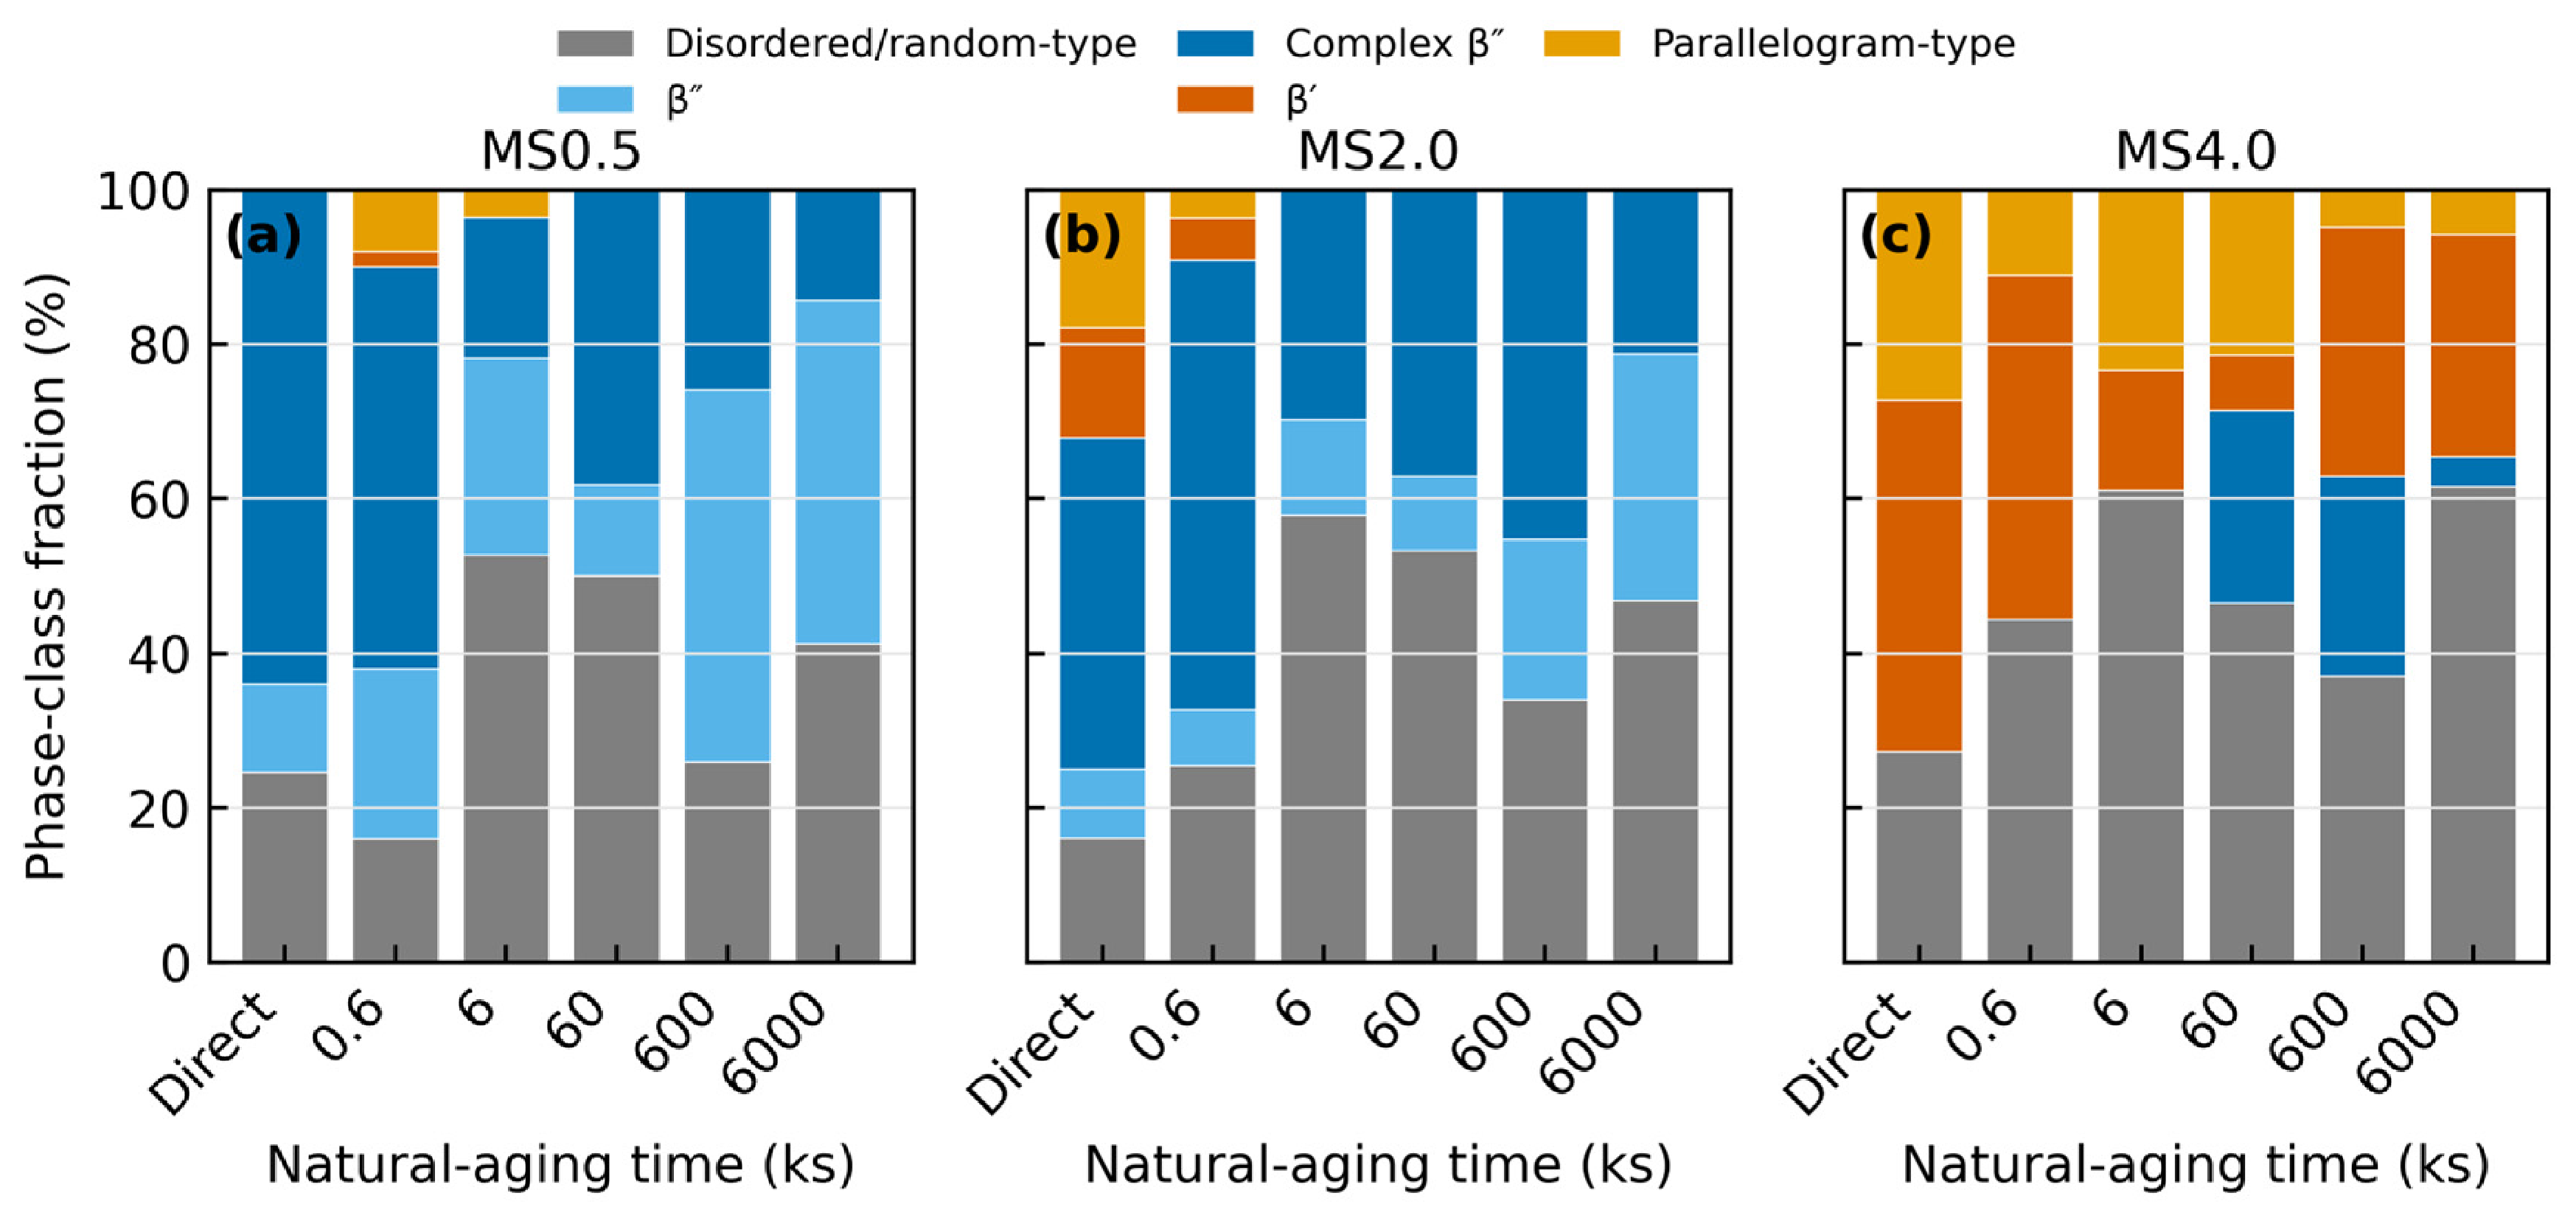
Natural aging also redistributed the classified precipitate population (Figure 7). In MS0.5, complex β″ decreased from 63.9% under Direct AA to 14.3% after 6000 ks, while ideal β″ and disordered/random-type fractions rose to 44.4% and 41.3%, respectively. In MS2.0, the β′ and parallelogram-type classes present under Direct AA were not identified after 6 ks or longer; at 6000 ks, the population comprised 46.8% disordered/random-type, 31.9% β″, and 21.3% complex β″. In MS4.0, the disordered/random-type fraction increased from 27.3% to 61.5%, a small complex β″ fraction (≈3.9%) was newly detected at 6000 ks that was absent under Direct AA, and the combined β′ and parallelogram-type fraction decreased from 72.7% to 34.6%, together accounting for the full classified population at each condition. The simultaneous changes in class fractions and NA were associated with the decoupling between precipitate count and ΔHAA, but they do not establish class-specific strengthening contributions.
Figure 7.
Operational phase-class number fractions after Direct AA and after natural aging at approximately 293 K for 0.6, 6, 60, 600, and 6000 ks for (a) MS0.5, (b) MS2.0, and (c) MS4.0. The subsequent alloy-specific peak-aging treatments were 473 K for 12 ks for MS0.5 and 473 K for 24 ks for MS2.0 and MS4.0. Each bar is normalized to 100%. “Direct AA” denotes artificial aging initiated after the minimum practical transfer delay of approximately 0.1 ks, without intentional natural aging.
4. Discussion
Maintaining Mg + Si within 0.95–0.99 mol% reduced variation in total solute concentration and enabled a controlled comparison across the nominal Mg/Si series. Nevertheless, changing Mg/Si at nearly constant total Mg + Si also changes the Mg2Si-equivalent solute content and the amount and identity of excess Mg or Si. Because total solute content itself affects clustering and natural-aging kinetics [9], the trends reported here apply to this approximately 1 mol% Mg + Si alloy series and should not be interpreted as a universal Mg/Si-ratio dependence independent of total solute content.
The controlled-composition series shows that the strongest direct response was not obtained at the atomic Mg2Si stoichiometry (Mg/Si = 2), but at the equal-atomic, Si-excess condition near Mg/Si = 1. This result is in accordance with the broader observation that precipitation in Al–Mg–Si is controlled by the chemistry of metastable clusters and precipitates rather than by equilibrium Mg2Si stoichiometry alone [5,6,7,8]. In MS1.0, the largest direct-aging NA and the largest fraction of β″-related structures were observed together with the highest Hpeak. Across the series, increasing the nominal ratio toward the Mg-rich side was associated with a progressive shift from complex β″ toward β′ and parallelogram-type structures and with a reduction in NA.
These observations indicate that NA and operational phase class should be considered together. The direct-aging NA at Mg/Si = 4.0 was only about one-third of that near Mg/Si = 1.1, and the classified population lacked the β″-related category that dominated the strongest alloys. The co-occurrence of these features was associated with the smaller ΔHdirect of MS4.0, but the present measurements do not isolate their individual strengthening contributions. The result also cautions against describing Mg/Si = 1 as “stoichiometrically balanced”: it is balanced only in the sense of equal atomic Mg and Si, while it remains Si-rich relative to Mg2Si.
The observed populations can be placed within the established Al–Mg–Si precipitation framework. Literature sequences generally describe evolution from solute clusters/co-clusters and GP-zone-related precursor structures toward β″, followed by β′ and other metastable or intermediate structures before equilibrium β-Mg2Si [1,2,3,4,5,10]. Within this framework, the β″ and complex β″ categories in the present work represent β″-related projected structures, whereas the β′ and parallelogram-type categories are consistent with a shift toward other metastable or intermediate precipitate structures. The disordered/random-type category describes unresolved ordered projections and is not assigned to a unique crystallographic phase. Because the HRTEM observations are selected post-aging structural states rather than a continuous time-resolved sequence, changes in these number fractions are interpreted as composition- and aging-dependent population differences that are consistent with established pathways, not as direct proof of a unique chronological transformation route.
Fine, coherent β″ precipitates are widely associated with strong precipitation hardening near peak aging because their coherency, dimensions, and close spacing can provide effective barriers to dislocation motion [3,8]. The other operational categories can differ in size, length, aspect ratio, morphology, coherency, crystallographic character, and interparticle spacing, all of which affect obstacle strength and the operative dislocation interaction. These parameters were not quantified independently for every class here. Therefore, the observed class fractions cannot be converted into class-specific strengthening contributions, and the discussion is limited to associations that are consistent with established strengthening mechanisms.
Natural aging can increase Hpre-AA while simultaneously reducing the solute and vacancy population available for efficient precipitation during the subsequent 473 K treatment. Cluster evolution at room temperature is known to depend on composition, vacancy trapping, and the thermal stability of the clusters [10,11,12,13,14]. Clusters that strengthen the naturally aged state are not necessarily effective nuclei for β″ during the subsequent high-temperature treatment. Consequently, Hpost-AA may remain constant or rise even as ΔHAA falls.
The present MS0.5 data illustrate this distinction most clearly: Hpost-AA after 6000 ks exceeded the short-delay value by approximately 3.4 HV0.1, yet ΔHAA was lower by 12.3 HV0.1. MS2.0 showed an even larger increase in Hpost-AA but a smaller ΔHAA. These trends are consistent with reports that the sign and magnitude of the natural-aging effect depend on both composition and the metric used to evaluate it [11,13,14,15,16,17,18]. For manufacturing decisions, a single Hpost-AA value can therefore conceal a loss of response during the prescribed final artificial-aging step.
Published tensile and forming studies provide broader mechanical context. Cuniberti et al. [19] reported that natural aging increased yield stress and reduced ductility while progressively decreasing the strengthening obtained during subsequent artificial aging. Simões et al. [20] examined the natural-aging-dependent forming behavior of a cylindrical cup, and Simões et al. [21] followed storage times of 1–18 months and reported that longer storage progressively increased yield stress and work hardening and, consequently, springback. Over a shorter (6-month) storage window, Hodžić et al. [22] found that natural aging can leave the formability of some Al–Mg–Si sheet compositions essentially stable while measurably degrading it in others, indicating that strength- and forming-related descriptors do not necessarily evolve together or at the same rate. Bake-hardening studies likewise show that processing history can alter the subsequent strength response [23]. These findings support interpreting the present hardness trends as one component of mechanical response, but they do not permit quantitative prediction of tensile or forming properties from the present data.
The natural-aging NA curves exhibit large maxima and minima that do not coincide with the extrema in ΔHAA. NA is a two-dimensional count of precipitate cross-sections and weights all counted particles equally. Precipitates with similar NA can nevertheless differ substantially in size, length, aspect ratio, morphology, spatial distribution, coherency, crystallographic character, and interparticle spacing. These factors change the obstacle strength and spacing experienced by moving dislocations. Because foil thickness, three-dimensional number density, precipitate volume fraction, complete size and length distributions, and spatial-distribution statistics were not available, NA cannot serve as a standalone quantitative predictor of hardness. It is therefore used only as a comparative microstructural descriptor and interpreted together with the operational phase-class fractions.
The HRTEM categories remain operational classifications of projected structures. Their uncertainty arises from two-dimensional projection, local image quality, precipitate orientation, and similarities among projected structural motifs. Because only sufficiently resolved projections entered the statistics, the reported fractions describe HRTEM-resolvable precipitates and not the absolute crystallographic phase fractions of all precipitates in the foil. A more complete identification would require systematic complementary diffraction, thickness calibration, and three-dimensional chemical or structural characterization. The present analysis is therefore strongest as a within-study comparison, demonstrating that the observed population character, not count alone, changes with both Mg/Si ratio and natural-aging time.
For a quench-to-aging manufacturing route, the direct-aging results favor an equal-atomic Mg/Si ratio near 1 when maximizing Hpeak at constant total solute is the primary objective. However, the selected alloy storage series shows that process robustness cannot be ranked from Hpost-AA alone. A practical control plan should record (i) quench-to-aging delay, (ii) Hpre-AA, and (iii) ΔHAA under the prescribed cycle. These values distinguish storage hardening from the additional response retained for the subsequent artificial-aging step.
The investigated delays cover different processing situations: Direct AA represents a short transfer or handling delay of approximately 100 s, the intermediate conditions represent storage from minutes to several days, and 6000 ks (approximately 1667 h or 69.4 days) represents prolonged room-temperature storage. The longest condition was included to determine whether the subsequent artificial-aging response continued to evolve during extended storage. Long-term studies have reported natural-aging effects on strength and forming-related behavior over periods of several months to 18 months [20,21,22] (up to 18 months in ref. [21] specifically; refs. [20,22] cover shorter multi-month windows), supporting the relevance of examining delays beyond an in-line transfer interval. Nevertheless, 6000 ks is not intended to represent a specific production schedule, and the controlled 473 K treatments used here do not directly simulate a particular industrial.
Vickers hardness provides only a partial assessment of mechanical performance. No tensile or electrical-conductivity tests were performed, and no quantitative conversion from hardness to yield strength, ultimate tensile strength, elongation, strain-hardening behavior, formability, or conductivity is attempted. Direct tensile and forming measurements are required to determine whether the composition- and natural-aging-dependent hardness trends translate into corresponding changes in strength–ductility balance and forming performance. Other limitations include examination of only three compositions over the full natural-aging schedule and the absence of direct cluster characterization and quantitative precipitate size, length, volume-fraction, and spatial-distribution measurements. The conclusions should therefore be interpreted as composition- and process-specific trends for the present high-purity alloy set.
5. Conclusions
- At near-constant Mg + Si content (0.95–0.99 mol%), the direct 473 K age-hardening response was maximized at an equal-atomic, Si-excess Mg/Si ratio of 1.1. Hpeak was approximately 72–73 HV0.1, compared with approximately 53–55 HV0.1 at Mg/Si = 4.0. This composition trend is specific to the present approximately 1 mol% Mg + Si alloy series.
- The strongest alloys showed high NA together with high fractions of β″-related projected structures. Complex β″ represented 63.9–67.9% of the direct-aged HRTEM-resolvable population at Mg/Si = 0.52–1.1, whereas β′ and parallelogram-type precipitates dominated the Mg-rich alloy. These associations do not quantify the separate strengthening contribution of each operational category.
- Natural aging changed Hpost-AA non-monotonically. Nevertheless, ΔHAA decreased from 38.48 to 26.15 HV0.1 in MS0.5 and from 33.48 to 26.85 HV0.1 in MS2.0 between Direct AA and 6000 ks.
- NA did not correlate monotonically with ΔHAA. Natural-aging-dependent redistribution among the operational β″, complex β″, β′, parallelogram-type, and disordered/random-type categories was associated with this decoupling, but NA and phase-class fractions are comparative descriptors rather than standalone quantitative predictors of strengthening.
- For manufacturing control, quench-to-aging delays should be evaluated using both Hpre-AA and ΔHAA under the prescribed final cycle. Hpost-AA alone can conceal a reduced additional artificial-aging response; tensile and forming tests are required for a complete assessment of mechanical performance.
Author Contributions
Conceptualization, K.M.; methodology, J.W., T.T. and K.M.; investigation, J.W. and T.T.; formal analysis, J.W., A.A. and S.L.; data curation, J.W.; visualization, J.W.; resources, K.M.; writing—original draft preparation, J.W.; writing—review and editing, J.W., T.T., S.L., A.A. and K.M.; supervision, T.T., S.L., A.A. and K.M.; project administration, K.M. All authors have read and agreed to the published version of the manuscript.
Funding
This research received no external funding.
Institutional Review Board Statement
Not applicable.
Informed Consent Statement
Not applicable.
Data Availability Statement
Additional raw hardness and microscopy data are available from the corresponding author upon reasonable request.
Acknowledgments
The authors acknowledge technical support and access to the experimental and microscopy facilities provided by the Division of Instrumental Analysis at University of Toyama.
Conflicts of Interest
The authors declare no conflicts of interest.
References
- Edwards, G.A.; Stiller, K.; Dunlop, G.L.; Couper, M.J. The precipitation sequence in Al–Mg–Si alloys. Acta Mater. 1998, 46, 3893–3904. [Google Scholar] [CrossRef] [Scilit]
- Murayama, M.; Hono, K. Pre-precipitate clusters and precipitation processes in Al–Mg–Si alloys. Acta Mater. 1999, 47, 1537–1548. [Google Scholar] [CrossRef] [Scilit]
- Andersen, S.J.; Zandbergen, H.W.; Jansen, J.; Træholt, C.; Tundal, U.; Reiso, O. The crystal structure of the β″ phase in Al–Mg–Si alloys. Acta Mater. 1998, 46, 3283–3298. [Google Scholar] [CrossRef] [Scilit]
- Vissers, R.; van Huis, M.A.; Jansen, J.; Zandbergen, H.W.; Marioara, C.D.; Andersen, S.J. The crystal structure of the β′ phase in Al–Mg–Si alloys. Acta Mater. 2007, 55, 3815–3823. [Google Scholar] [CrossRef] [Scilit]
- Marioara, C.D.; Andersen, S.J.; Zandbergen, H.W.; Holmestad, R. The influence of alloy composition on precipitates of the Al–Mg–Si system. Metall. Mater. Trans. A 2005, 36, 691–702. [Google Scholar] [CrossRef] [Scilit]
- Xu, X.; Yang, Z.; Ye, Y.; Wang, G.; He, X. Effects of various Mg/Si ratios on microstructure and performance property of Al–Mg–Si alloy cables. Mater. Charact. 2016, 119, 114–119. [Google Scholar] [CrossRef] [Scilit]
- Li, Y.; Gao, G.; Wang, Z.; Di, H.; Li, J.; Xu, G. Effects of the Mg/Si ratio on microstructure, mechanical properties, and precipitation behavior of Al–Mg–Si–1.0 wt.% Zn alloys. Materials 2018, 11, 2591. [Google Scholar] [CrossRef] [Scilit] [PubMed]
- Chen, J.H.; Costan, E.; van Huis, M.A.; Xu, Q.; Zandbergen, H.W. Atomic pillar-based nanoprecipitates strengthen AlMgSi alloys. Science 2006, 312, 416–419. [Google Scholar] [CrossRef] [Scilit] [PubMed]
- Ding, L.; Jia, Z.; Zhang, Z.; Sanders, R.E.; Liu, Q.; Yang, G. The natural aging and precipitation hardening behaviour of Al–Mg–Si–Cu alloys with different Mg/Si ratios and Cu additions. Mater. Sci. Eng. A 2015, 627, 119–126. [Google Scholar] [CrossRef] [Scilit]
- Banhart, J.; Chang, C.S.T.; Liang, Z.; Wanderka, N.; Lay, M.D.H.; Hill, A.J. Natural aging in Al–Mg–Si alloys—A process of unexpected complexity. Adv. Eng. Mater. 2010, 12, 559–571. [Google Scholar] [CrossRef] [Scilit]
- Chang, C.S.T.; Wieler, I.; Wanderka, N.; Banhart, J. Positive effect of natural pre-ageing on precipitation hardening in Al–0.44 at.% Mg–0.38 at.% Si alloy. Ultramicroscopy 2009, 109, 585–592. [Google Scholar] [CrossRef] [Scilit] [PubMed]
- Pogatscher, S.; Antrekowitsch, H.; Leitner, H.; Ebner, T.; Uggowitzer, P.J. Mechanisms controlling the artificial aging of Al–Mg–Si alloys. Acta Mater. 2011, 59, 3352–3363. [Google Scholar] [CrossRef] [Scilit]
- Tao, G.H.; Liu, C.H.; Chen, J.H.; Lai, Y.X.; Ma, P.P.; Liu, L.M. The influence of Mg/Si ratio on the negative natural aging effect in Al–Mg–Si–Cu alloys. Mater. Sci. Eng. A 2015, 642, 241–248. [Google Scholar] [CrossRef] [Scilit]
- Aruga, Y.; Kozuka, M.; Takaki, Y.; Sato, T. Effects of natural aging after pre-aging on clustering and bake-hardening behavior in an Al–Mg–Si alloy. Scr. Mater. 2016, 116, 82–86. [Google Scholar] [CrossRef] [Scilit]
- Poznak, A.; Thole, V.; Sanders, P.G. The natural aging effect on hardenability in Al–Mg–Si: A complex interaction between composition and heat treatment parameters. Metals 2018, 8, 309. [Google Scholar] [CrossRef] [Scilit]
- Cui, Z.; Jiang, H.; Zhang, D.; Song, Y.; Yan, D.; Rong, L. Effect of natural aging on precipitation strengthening behaviors in Al–Mg–Si alloy. Metals 2022, 12, 470. [Google Scholar] [CrossRef] [Scilit]
- Takaki, Y.; Masuda, T.; Kobayashi, E.; Sato, T. Effects of natural aging on bake hardening behavior of Al–Mg–Si alloys with multi-step aging process. Mater. Trans. 2014, 55, 1257–1265. [Google Scholar] [CrossRef] [Scilit]
- Pogatscher, S.; Antrekowitsch, H.; Werinos, M.; Moszner, F.; Gerstl, S.S.A.; Francis, M.F.; Curtin, W.A.; Löffler, J.F.; Uggowitzer, P.J. Diffusion on demand to control precipitation aging: Application to Al–Mg–Si alloys. Phys. Rev. Lett. 2014, 112, 225701. [Google Scholar] [CrossRef] [Scilit] [PubMed]
- Cuniberti, A.; Tolley, A.; Castro Riglos, M.V.; Giovachini, R. Influence of natural aging on the precipitation hardening of an AlMgSi alloy. Mater. Sci. Eng. A 2010, 527, 5307–5311. [Google Scholar] [CrossRef] [Scilit]
- Simões, V.M.; Laurent, H.; Oliveira, M.C.; Menezes, L.F. Natural aging effect on the forming behavior of a cylindrical cup with an Al–Mg–Si alloy. AIP Conf. Proc. 2016, 1769, 200021. [Google Scholar] [CrossRef] [Scilit]
- Simões, V.; Laurent, H.; Oliveira, M.; Menezes, L.F. The influence of warm forming in natural aging and springback of Al–Mg–Si alloys. Int. J. Mater. Form. 2019, 12, 57–68. [Google Scholar] [CrossRef] [Scilit]
- Hodžić, E.; Domitner, J.; Thum, A.; Shafiee Sabet, A.; Müllner, N.; Fragner, W.; Sommitsch, C. Influence of natural aging on the formability of Al–Mg–Si alloy blanks. J. Manuf. Process. 2023, 94, 228–239. [Google Scholar] [CrossRef] [Scilit]
- Xing, J.; Lei, G.; Wang, Y.; Bhatta, L.; Kong, C.; Yu, H. Effect of room-temperature pre-rolling and pre-cryorolling on natural aging and bake hardening response of an Al–Mg–Si alloy. Metall. Mater. Trans. A 2023, 54, 3709–3732. [Google Scholar] [CrossRef] [Scilit]

Disclaimer/Publisher’s Note: The statements, opinions and data contained in all publications are solely those of the individual author(s) and contributor(s) and not of MDPI and/or the editor(s). MDPI and/or the editor(s) disclaim responsibility for any injury to people or property resulting from any ideas, methods, instructions or products referred to in the content. |
© 2026 by the authors. Licensee MDPI, Basel, Switzerland. This article is an open access article distributed under the terms and conditions of the Creative Commons Attribution (CC BY) license.