


Abstract
Published comparisons of polymer additive manufacturing (AM) processes are usually assembled from different laboratories, geometries and test protocols, rarely include elastomers, and seldom report durability, biological response and environmental burden next to geometry and strength. Engineers therefore lack a consistent basis for choosing a process–material system for parts that combine rigid and compliant functions, such as soft-robotic grippers, housings with integrated seals, wearable devices and laboratory hardware. We benchmarked five systems—material extrusion (MEX) by fused filament fabrication (FFF) of PLA and ABS, vat photopolymerisation (VPP) by stereolithography (SLA) of Clear V4 and Tough 2000 resins, and extrusion-based direct ink writing (DIW) of a platinum-cure silicone (Ecoflex 00-30)—on 228 specimens made and tested with one protocol in one laboratory. Pairing two materials within each rigid process separated process-controlled from material-controlled properties: surface finish, dimensional accuracy, porosity, electricity, cost and cytotoxicity were governed by the process, whereas strength, ductility, fatigue ratio and ageing resistance were governed by the material. SLA gave the smoothest surfaces ( 1.2–1.6 μm, against 8.4–11.1 μm for FFF and 3.8–5.1 μm for DIW) and mean deviations of at most 0.052 mm on 20 mm cubes. Normalised by strength, the rigid materials had similar fatigue behaviour (-cycle fatigue ratios 0.34–0.42). Exposure to 500 h of UV reduced the strength of every material (82.7–91.0% retention). Both SLA resins fell below the 70% cell-viability threshold of ISO 10993-5, and SLA bars carried the largest carbon footprint (141–170 g CO2-eq per bar, against 54–94 g), an order that held for grid carbon intensities up to 800 g CO2-eq kWh−1. In an exploratory comparison of rigid–soft hybrid routes, integrating DIW into the FFF build shortened cycle time by 25–32%, and none of its six specimens failed adhesively. A TOPSIS analysis of 12 commensurable criteria, with criterion and weight sensitivity, showed that rankings across material classes depend on which criteria are included, so selection should apply class constraints first and rank within the admissible class second.
Keywords:
additive manufacturing; benchmarking; process selection; fused filament fabrication; material extrusion; vat photopolymerisation; stereolithography; direct ink writing; silicone elastomer; fatigue; accelerated ageing; cytotoxicity; life-cycle assessment; cost modelling; hybrid manufacturing; TOPSIS 1. Introduction
Material extrusion (MEX) of a thermoplastic filament, termed fused filament fabrication (FFF), and vat photopolymerisation (VPP) by stereolithography (SLA) are the two most widely used polymer additive manufacturing (AM) processes [1,2,3,4,5]. Process categories and their abbreviations follow ISO/ASTM 52900:2021 [1], which defines MEX as a process in which material is selectively dispensed through a nozzle or orifice, and VPP as a process in which liquid photopolymer in a vat is selectively cured by light-activated polymerisation. Their trade-offs are well documented. FFF parts are cheap and quick to make but anisotropic, because their properties depend on bonding between beads and layers [6,7,8]. SLA parts offer finer resolution and near-isotropic, densely crosslinked networks, but their properties depend on resin chemistry and on post-processing [9,10]. Published comparisons are usually made in different laboratories, on different geometries and under different protocols, so the numbers rarely line up [11]. Such cross-study comparisons have three drawbacks. Differences in machines, specimen geometry, conditioning and test standards are confounded with the effect of the process itself. The comparisons are nearly always limited to rigid materials, and they report geometric and quasi-static mechanical metrics, while durability, biological response, cost and environmental burden are assessed, if at all, in separate studies on other parts. Because the physics that sets part quality differs between process families [12], and because the properties obtained with one process remain sensitive to machine-level conditions [13], these drawbacks cannot be corrected after the fact by collating published data.
In earlier work, we compared FFF and SLA on identical geometries for surface finish, dimensional accuracy, tensile properties, cost, energy and waste [14]. That study found SLA roughly six times smoother and about three times more accurate, and FFF about 60% cheaper per part. It also had three limitations. It covered rigid thermoplastics and one general-purpose photopolymer only; it reported short-term, quasi-static properties only; and it expressed process trade-offs qualitatively.
Elastomeric AM serves applications that neither FFF thermoplastics nor SLA acrylates handle well, including soft robots, compliant seals and wearable sensors [15,16,17]. Direct ink writing (DIW) of two-part silicones is one of the most accessible routes to such parts [18,19,20,21], but the result depends strongly on ink rheology and cure kinetics [22,23]. DIW belongs to the same ISO/ASTM category (MEX) as FFF, but differs in feedstock and consolidation: a viscous ink is dispensed at room temperature and solidifies by chemical curing rather than by fusion of a molten filament. FFF, SLA and DIW therefore denote three process routes within two ISO/ASTM categories. Rigid–soft assemblies, such as housings with integrated gaskets or grippers with compliant pads, add a further reason to combine extrusion processes within one build [24,25,26]. Even so, silicone DIW is seldom benchmarked next to FFF and SLA on a common specimen set and measurement protocol. Durability under cyclic loading and weathering, biological compatibility and environmental burden are also rarely reported together with the usual geometric and mechanical metrics, although each can decide whether a process is fit for a given part.
The purpose of this benchmark is practical: to support the choice of a process–material system for small functional polymer parts in which rigid and compliant elements coexist and which may touch skin or cells. Examples are soft-robotic grippers with rigid bodies and silicone pads, sensor and instrument housings with integrated seals, wearable fixtures and bespoke laboratory hardware such as cell-culture inserts and fluidic holders. In such a selection, a designer does not choose a process in isolation, but a commercially available process–material system, and the process mechanism cannot be fully separated from the material, because each process admits only certain material classes [12]. We address this confounding in two ways. First, each rigid process is represented by two materials with contrasting behaviour, so that the spread within a process can be compared with the difference between processes: properties that change little within a process but strongly between processes are attributed to the process, and the opposite to the material. Second, the elastomer is treated as a separate material class, and the benchmark asks how such a class should enter a multicriteria selection, not whether it outperforms rigid materials.
The five materials were chosen to span this design space with widely available, well-documented products. PLA and ABS are the two most common FFF filaments; they represent a bio-based polyester with a low heat-deflection temperature (HDT) and a styrenic copolymer with a rubber phase and a higher HDT. Clear V4 is a general-purpose reference resin, and Tough 2000 is an engineering resin formulated for toughness, which gives a brittle–tough contrast within SLA. Ecoflex 00-30 is a platinum-cure silicone widely used in soft robotics and wearable devices [16,26]; its very low hardness (Shore 00-30) and a pot life long enough for syringe extrusion make it a representative DIW elastomer. A flexible FFF filament such as thermoplastic polyurethane (TPU) would have provided a second, extrusion-based elastomer route. It was not included because common TPU filaments have hardnesses of about Shore 85A to 95A and are roughly two orders of magnitude stiffer than Ecoflex 00-30, so they belong to a different functional class (semi-rigid seals and bumpers rather than highly compliant pads and actuators). A comparison of FFF-TPU and DIW silicone at matched hardness is left for future work (Section 7).
This paper extends the earlier benchmark to five material–process combinations: FFF of PLA and ABS, SLA of Clear V4 and Tough 2000, and DIW of Ecoflex 00-30. All 228 specimens were made from single material lots and tested in one laboratory. We report surface roughness, dimensional accuracy, porosity, hardness and quasi-static tensile behaviour (Section 3 and Section 4); tension–tension fatigue at three load or strain levels (Section 4.6); the effect of 500 h of UV and thermal ageing, with multiplicity-corrected statistics (Section 4.7); in vitro cytotoxicity according to ISO 10993-5 (Section 4.8); a per-part cost model driven by measured electricity and logged build times (Section 4.9); three routes to rigid–soft PLA/silicone hybrids (Section 4.10); a cradle-to-gate life-cycle assessment with a sensitivity analysis on grid carbon intensity and build-plate utilisation (Section 4.11); and an illustrative TOPSIS analysis, with criterion and weight sensitivity, that shows why rankings across material classes are unstable (Section 4.12). Figure 1 showshow these elements connect to the selection problem, and the Data Availability Statement describes the data and their availability.
Figure 1.
Study design and main line of the work. The selection problem defines the paired-material design; all specimens pass through one fabrication, conditioning and characterisation chain; the results feed a process–material attribution and a two-step classify-then-rank selection.
The novelty of the work lies in the following contributions:
- A single-protocol benchmark, on one specimen set made from single material lots, that places a silicone DIW route next to FFF and SLA and reports, for the same five systems, surface, dimensional, mechanical, fatigue, ageing, cytotoxicity, cost and cradle-to-gate life-cycle data, a combination that, to our knowledge, has not been reported before;
- A paired-material design that quantifies which properties are controlled by the process and which by the material (Section 5.2);
- A sensitivity analysis showing how criterion choice, correlated criteria and weights change multicriteria rankings across material classes, together with a two-stage classify-then-rank procedure demonstrated within the rigid class (Section 4.12);
- Measurement-practice recommendations for benchmarks that mix rigid and elastomeric parts, covering the roughness cut-off, contact metrology, strain measurement and the LCA functional unit (Section 5.4);
- An exploratory comparison of three FFF+DIW routes to rigid–soft hybrids (Section 4.10).
2. Related Work
2.1. FFF and SLA Benchmarks
Ahn et al. established the mechanical anisotropy of FFF ABS, showing that strength along the raster greatly exceeds strength across layers [6]; the study covered one material and quasi-static loading only. Sun et al. linked the bond quality between filaments to the thermal history of the deposited beads [7], and Turner et al. reviewed how process design and modelling govern the quality of melt-extruded parts [8]. Tymrak et al. showed that open-source FFF printers can reach tensile strengths comparable to commercial systems under realistic conditions [27], but reported tensile properties only. Ahn et al. predicted the roughness of inclined and vertical FFF walls from layer thickness and build angle [28]. Ben Said et al. recently showed that low-frequency vibration of the build bed raised the tensile and flexural strength of FFF PLA and reduced its pore size [13], which illustrates how sensitive FFF properties remain to machine-level conditions. For SLA, Melchels et al. [9] and Bagheri and Jin [10] reviewed resolution, surface quality and the role of post-cure in reaching final properties. Stavropoulos and Foteinopoulos classified the modelling approaches for AM processes and showed that the governing physics differs between process families [12], so that results obtained for one family do not transfer to another. Dizon et al. documented the heterogeneity of mechanical testing practice across the literature on printed polymers [11], and Minetola et al. used a common benchmark artefact to show how far geometric tolerances differ between polymer AM systems [29]. Our earlier study compared FFF and SLA on identical geometries for surface, accuracy, tensile, cost, energy and waste metrics [14]. Direct FFF–SLA comparisons on one specimen set therefore exist, but they are restricted to rigid materials and to short-term, quasi-static properties.
2.2. Silicone and Rigid–Soft Multi-Material Additive Manufacturing
Liravi and Toyserkani reviewed the available routes for silicone AM [18]. Plott and Shih extruded a moisture-cure silicone with minimal voids for pneumatic actuators [19], Roh et al. printed capillary silicone/water inks [20], and Muth et al. embedded strain sensors in highly stretchable matrices [17]. Yirmibeşoğlu et al. printed silicone soft robots directly and compared them with moulded counterparts [21], and Walker et al. obtained support-free printing of a platinum-cure silicone by controlling reaction kinetics and transient rheology together [23]. Mackay showed that printability in material extrusion depends on yield stress, shear thinning and structural recovery [22]. More recently, Stano et al. used electromagnetic assistance to extrude thin-walled, bioinspired silicone soft robots [30]. These studies characterise silicone printing in its own right; none measured silicone parts next to rigid AM parts under a common protocol. Truby and Lewis [15] and Wallin et al. [16] reviewed soft-matter printing and soft robotics, and Stano and Percoco reviewed AM routes for soft-robot fabrication [26]. For rigid–soft combinations, Vaezi et al. reviewed early multi-material AM [24], and Nazir et al. reviewed the design, properties, applications and challenges of multi-material AM, in which the bonding of dissimilar materials is a recurring issue [25]. Process routes that join an FFF thermoplastic to a DIW silicone have rarely been compared quantitatively in terms of time, cost and bond strength.
2.3. Durability: Fatigue and Environmental Ageing
Afrose et al. showed that the fatigue life of FFF PLA depends strongly on build orientation [31], and Ziemian et al. reported the same for ABS [32]. Safai et al. reviewed fatigue testing protocols and data across polymer AM technologies [33]. For elastomers, Mars and Fatemi surveyed strain- and energy-based approaches to fatigue, which are preferred because crack nucleation and growth are governed by the local deformation [34]. Mullins [35] and Diani et al. [36] described the softening of rubbers during the first load cycles, which complicates the interpretation of force-controlled tests. Copinet et al. showed that UV-driven chain scission in PLA is accelerated by temperature and humidity [37]; Santos et al. showed that ABS degrades mainly through photo-oxidation of its polybutadiene phase, with surface embrittlement [38]; and Pan et al. [39] and Struik [40] described the physical ageing of glassy polymers, which lowers ductility. Each of these studies addresses one material or one degradation mode, so the fatigue and weathering of different process–material systems have not been compared at matched relative load levels and under identical exposure.
2.4. Biological Evaluation of Printed Parts
ISO 10993-5 defines in vitro cytotoxicity tests; in the extract method, a reduction in cell viability to below 70% of the control is taken as evidence of cytotoxic potential [41]. Oskui et al. found SLA parts markedly more toxic to zebrafish embryos than FFF parts and showed that additional UV post-exposure reduced this toxicity [42]. Guttridge et al. reviewed the intended use, biocompatibility certification and post-processing guidance of resins marketed for medical applications [43]. General-purpose resins, FFF thermoplastics and silicones have seldom been screened together under one extraction protocol.
2.5. Cost, Life-Cycle Assessment and Decision Analysis
Baumers et al. allocated machine depreciation over utilised hours and showed that build-volume utilisation controls the cost per part, so that single-part and batch builds can give very different answers [44]. Faludi et al. compared the environmental impacts of FFF and inkjet AM with CNC machining [45], Kreiger and Pearce compared distributed FFF with conventional manufacturing [46], and Kellens et al. mapped the environmental dimensions of AM across application domains [47]. These assessments treat one process or one product at a time, and their results depend strongly on the functional unit and the electricity mix. Multicriteria decision methods, such as the Analytic Hierarchy Process [48] and TOPSIS [49], have long been proposed for selecting rapid prototyping and AM processes [50]. Opricovic and Tzeng showed that compromise rankings depend on the normalisation and aggregation used [51], and stochastic multicriteria acceptability analysis explores the whole weight space when weights are uncertain [52]. AM selection studies nevertheless usually report one ranking for one weight vector, without examining how criteria that define a material class, or criteria that duplicate one another, drive the result.
2.6. Research Gap
Table 1 summarises the evidence base and the gaps that this study addresses. No single study, to our knowledge, has measured rigid and elastomeric AM process–material systems on one specimen set for geometric, mechanical, durability, biological, economic and environmental performance, separated the process effect from the material effect, and examined how such mixed-class data should enter a multicriteria selection.
Table 1.
Evidence base, its typical scope and the gaps addressed in this work.
3. Materials and Methods
3.1. Study Design
Figure 1 shows the main line of the study. The selection problem defined in Section 1 sets the design: five process–material systems, two materials for each rigid process and the elastomer treated as its own class. All specimens pass through one fabrication and conditioning chain and one characterisation protocol. The results are then used in two ways: to attribute each property to the process or to the material (Section 5.2), and to examine a two-step selection in which material-class constraints are applied first, and alternatives are ranked within the admissible class second (Section 4.12).
3.2. Materials
Table 2 lists the five material–process combinations, the material lots and the supplier reference properties. One lot of each material was used for all specimens. The PLA and ABS filaments were Prusament products of Prusa Polymers (Prague, Czech Republic), Clear Resin V4 and Tough 2000 Resin were supplied by Formlabs (Somerville, MA, USA), and Ecoflex 00-30 was supplied by Smooth-On (Macungie, PA, USA). Ecoflex 00-30 is a two-part (1A:1B by weight) platinum-cure silicone with a nominal Shore hardness of 00-30 and a pot life of 45 min.
Table 2.
Materials, lots and supplier reference properties. Process categories (MEX, VPP) follow ISO/ASTM 52900:2021. Datasheet values are supplier typical values, given for reference only.
3.3. Equipment
FFF parts were printed on a Prusa i3 MK3S+ (Prusa Research, Prague, Czech Republic; firmware 3.13.0) inside a Prusa enclosure and sliced with PrusaSlicer 2.7.1. SLA parts were printed on a Formlabs Form 3B+ (Formlabs, Somerville, MA, USA; PreForm 3.33.0), washed in a Form Wash (2nd generation) and post-cured in a Form Cure.
DIW used a custom three-axis system on an OpenBuilds LEAD CNC 1515 frame (OpenBuilds, USA), controlled by a Duet 3 Mainboard 6HC with a Toolboard 1LC (Duet3D, Peterborough, UK). The ink was fed by a Nordson EFD Ultimus V pressure regulator (0.1–100 psi; Nordson EFD, East Providence, RI, USA) through a SmoothFlow tapered tip (Nordson EFD; 18 gauge, 0.84 mm internal diameter). Parts A and B were mixed in a Thinky ARE-250 planetary mixer (Thinky, Tokyo, Japan; 2000 rpm, 2 min) and degassed at 5 kPa for 10 min before the syringe was loaded.
Tensile tests used an Instron 5969 dual-column machine (Instron, Norwood, MA, USA) with a 10 kN load cell for the rigid materials and a 100 N load cell for the silicone. Strain on rigid bars was measured with an Instron 2630-102 clip-on extensometer (25 mm gauge length). Fatigue tests used an Instron ElectroPuls E10000 (Instron). Roughness was measured with a Mitutoyo Surftest SJ-410 profilometer (Mitutoyo, Kawasaki, Japan; 2 μm stylus tip radius), dimensions with a Mitutoyo 293-340-30 micrometre (0.001 mm resolution), and hardness with Shore D and Shore 00 durometers conforming to ASTM D2240 [53]. Ageing used a QUV/se chamber with UVA-340 lamps (Q-Lab, Westlake, OH, USA) and a Memmert UF110 oven (Memmert, Schwabach, Germany). Electricity was measured with a Yokogawa WT310E power meter (Yokogawa, Tokyo, Japan), and microstructure was imaged with a JEOL JSM-IT500HR scanning electron microscope (SEM; JEOL, Tokyo, Japan).
3.4. Specimens and Test Matrix
Six geometries were used (Table 3). Rigid tensile dumbbells had a 10 mm × 4 mm narrow section, the cross-section of ISO 527-2 Type 1A/1B specimens [54]. Silicone tensile dumbbells followed ISO 37 Type 1 (6 mm × 2 mm narrow section, 25 mm test length) [55]. Fatigue bars of all materials had an 8 mm × 3 mm narrow section. Plates of 40 × 40 × 3 mm served for roughness and hardness, cubes with a 20 mm edge for dimensional accuracy, and discs of 10 mm diameter and 2 mm thickness for cytotoxicity. Hybrid pull-off specimens consisted of a PLA base with an Ecoflex interface layer.
Table 3.
Test matrix. n is the number of specimens per material and per condition or level, where applicable.
Every specimen was individually identified with a sequential code from S0001 to S0229. Code S0199 was not assigned, so the 229 codes correspond to 228 specimens: S0001–S0198 for the tensile, fatigue, plate, cube and hybrid specimens, and S0200–S0229 for the cytotoxicity discs. The width and thickness of every tensile and fatigue bar were measured before testing, and stresses are engineering stresses on these measured cross-sections.
3.5. Fabrication Parameters
Table 4 summarises the process parameters. FFF parts were printed flat (XY), so that tensile and fatigue bars have their layers parallel to the loading axis, with a ±45° rectilinear raster. Tensile and fatigue bars used 100% infill; plates and cubes used 20% infill. SLA parts were oriented at 45° with auto-generated supports (density 1.0, 0.4 mm touch-points) on non-critical faces, then washed in isopropanol (IPA) for 10 min and post-cured for 60 min at 60 °C. Silicone was deposited along a continuous serpentine tool path with 10% line overlap and a 15 s dwell between layers, and was cured for 4 h at room temperature followed by 4 h at 60 °C.
Table 4.
Process parameters.
The DIW settings follow from the geometry of the deposited line. An 18-gauge tapered tip (0.84 mm internal diameter) was used because tapered tips need a much lower driving pressure than straight cylindrical needles for viscous inks, which keeps the extrusion pressure low and steady, and because this diameter produces a line about 0.9 mm wide at a 0.4 mm layer height. The resulting layer-to-nozzle ratio of about 0.5 presses each bead onto the previous layer while limiting slumping. At 8 mm s−1 these dimensions require a volumetric flow of about mm3 s−1, which an extrusion pressure of 18.5 psi (127.6 kPa) delivered through this tip. The Ultimus V regulator was chosen because its 0.1–100 psi range resolves such low pressures. A syringe load could thus be deposited well within the 45 min pot life of the silicone, and the 15 s dwell between layers allowed each layer to regain its yield stress before the next one was added [22].
3.6. Roughness Measurement
On each plate, five parallel traces were acquired on the top face and on a side face, in two directions (parallel and perpendicular to the layers), giving 20 traces per plate and 100 per material. The arithmetic mean roughness and the maximum height [56] were evaluated with a 0.8 mm cut-off over a 4.0 mm evaluation length. The stylus force was 0.75 mN for the rigid materials and 0.4 mN for the silicone to limit indentation. Specimen values are averages over traces, and material values are the mean ± standard deviation (SD) of the five specimen means.
The top face is the 40 × 40 mm face that faced upwards during printing, and the side face is a 40 × 3 mm edge face. For FFF and DIW, whose plates were printed flat, the top face is parallel to the layers; on it, the two trace directions run along the two plate edges, and both cross the ±45° FFF raster at the same angle. The SLA plates were tilted by 45° about one plate edge, so their layers intersect both measured faces along lines parallel to that edge; parallel traces ran along these lines and perpendicular traces across them. On the SLA plates, the supports were attached only to the downward-facing 40 × 40 mm face and to the lowest edge, so neither measured face carried support touch-points. Only the amplitude parameters and were evaluated; the material-ratio parameters , and of ISO 13565-2 [57] are discussed in Section 5.5.
3.7. Dimensional Measurement
Each cube was measured with the micrometre at five locations per axis, 24 h after printing, at 23 °C. The deviation is mm. Material values are the mean ± SD of the five specimen means. The cube measures global shrinkage along three axes; it does not capture feature-level accuracy, such as that of holes, thin walls or overhangs (Section 5.5).
3.8. Hardness Measurement
Hardness was measured with ASTM D2240 durometers [53] at five locations per plate, on the same plates used for roughness. The rigid materials were measured on the Shore D scale with a 1 s dwell on single 3 mm plates. The silicone was measured on the Shore 00 scale with a 15 s dwell on two stacked plates (6 mm). The single rigid plates are thinner than the 6 mm minimum of ASTM D2240, so the Shore D values are used for comparison between materials only (Section 5.5).
3.9. Tensile Testing
Rigid materials were tested at 5 mm min−1. Young’s modulus was taken as the chord modulus between 0.05% and 0.25% extensometer strain [58]. Silicone was tested at 500 mm min−1 [55], with strain computed from crosshead displacement over the 25 mm test length. Instead of a Young’s modulus, we report the stresses at 100% and 300% elongation (, ), as is customary for elastomers. For all materials, we report the ultimate tensile strength (UTS), the elongation at break and the failure location. Bars that failed near a shoulder were retained and are identified.
Because the clamped silicone dumbbell deforms over more than the 25 mm test length, crosshead-based strain overstates the strain in the narrow section. We bounded this bias from the specimen geometry. If only the 33 mm narrow portion of the ISO 37 Type 1 dumbbell deformed, the gauge strain would be times the crosshead value, which is an upper bound. A one-dimensional estimate that also includes the two transition regions, in which the nominal stress falls as the width grows from 6 to 25 mm, was obtained by assuming that the grips act at the ends of the transitions and that the true and crosshead-based stress–strain curves differ only by a strain scale factor. It gives a factor of 0.38–0.44 over the loading range. The gauge-section strain is therefore estimated to lie between 0.40 and 0.76 times the crosshead-based values reported here, so that the reported values are nominal strains. Engineering stresses, which depend only on force and the measured cross-section, are not affected.
3.10. Fatigue Testing
Uniaxial tension–tension fatigue tests [59] were run on unaged bars with a stress ratio and a sinusoidal waveform. The rigid materials were tested in load control at 5 Hz and three peak stresses (Section 4.6), which correspond to 33–38%, 47–54% and 61–70% of the measured UTS. The silicone was tested in strain control at 2 Hz and peak nominal strains of 50%, 100% and 150% (crosshead basis; estimated gauge-section strains of about 20–38%, 40–76% and 60–114%, Section 3.9); its force was logged against cycle number. Tests were stopped at failure or at cycles (runout). Four bars per level were tested for each rigid material and five per level for the silicone. The failure location (gauge or fillet) and the surface temperature rise due to hysteretic heating were recorded.
3.11. Accelerated Ageing
UV ageing followed a modified ASTM G154 Cycle 1 [60], with a reduced irradiance of 0.68 W m−2 nm−1 at 340 nm. Each cycle comprised 8 h of UV at a black-panel temperature of 60 °C followed by 4 h of condensation at 50 °C, and exposure continued until 500 h had been completed. Thermal ageing was conducted at 50 °C for 500 h in forced-convection air. This temperature lies below the heat-deflection temperatures (HDTs) of all rigid materials (Table 2), but only 5 °C below that of PLA. Unaged control bars were stored in the dark at 23 °C and 50% relative humidity for the same period. After ageing, mass change, discolouration and warping were recorded before tensile testing.
The 500 h total exposure comprised about 333 h of irradiation, a radiant exposure of about 0.82 MJ m−2 nm−1 at 340 nm. A duration of 500 h is a common screening length for fluorescent-UV exposure of plastics, and it allowed the UV treatment, the thermal treatment and the dark-stored controls to run in parallel over the same period. Acceleration factors relative to outdoor exposure depend on location, season, temperature, moisture and material, and neither ASTM G154 nor ISO 4892-3 supports a general conversion [60,61]. No service-life equivalence is therefore claimed: the tests rank the relative sensitivity of the five materials to identical exposures. Assessment was limited to mass change, visual appearance, warping and tensile properties; surface chemistry (for example, infrared carbonyl indices) and instrumental colour measurement were not part of the protocol.
3.12. Electron Microscopy and Void Analysis
Fracture surfaces were produced by cryo-fracture in liquid nitrogen, and cross-sections by diamond-saw cutting and polishing. Samples were sputter-coated with 8 nm of Au and imaged with the secondary-electron detector at 10 kV and a 10 mm working distance, at 50×, 200× and 1000×. Void fractions were obtained by ImageJ 1.54f threshold analysis [62] of five cross-section images per material and cross-checked against Archimedes density. An accelerating voltage of 10 kV gives an adequate secondary-electron signal from the 8 nm Au coating while limiting charging and beam damage of the polymers, and a 10 mm working distance balances resolution and depth of field on uneven fracture surfaces. The three magnifications cover the relevant length scales: 50× shows several layers or beads (0.05–0.4 mm thick) in one field, 200× resolves individual inter-bead voids and trapped bubbles of tens to hundreds of micrometres, and 1000× shows void morphology and fracture features at the micrometre scale. For comparison between materials, cross-sections of all five materials are shown at the same magnification (200×).
3.13. Cytotoxicity Assay
Cytotoxicity was assessed with the indirect (extract) MTT assay of ISO 10993-5 [41] using L929 mouse fibroblasts, on six discs per material. SLA discs received the standard wash and post-cure described above, and FFF and DIW discs were wiped with 70% ethanol. Discs were extracted for 24 h at a ratio of 1 cm2 of surface per mL of medium, and cells were exposed to the extracts for 24 h. Absorbance was read at 570 nm, and viability was expressed as a percentage of the untreated control cultures. Following ISO 10993-5, a mean viability below 70% was taken to indicate cytotoxic potential.
3.14. Cost and Electricity Model
The cost of one tensile bar is
where m is the material used per bar including waste (8.5 g for FFF, 9.2 g for SLA and 5.5 g for DIW), and p is the material price in September 2024 (PLA 28, ABS 32 and Ecoflex 45 EUR kg−1; Clear V4 149 and Tough 2000 199 EUR L−1, converted to mass with the densities in Table 2). is the electricity measured for printing, washing, post-curing and oven curing, and EUR kWh−1 is the tariff. is the machine purchase price (EUR 1200, 6500 and 3500 for FFF, SLA and DIW), h is the assumed machine life, is the assumed utilisation and is the logged build time. Finally, EUR h−1 is the labour rate and the hands-on time from set-up to cleaning (15, 25 and 40 min for FFF, SLA and DIW). All values refer to single-bar builds.
3.15. Hybrid Specimen Fabrication and Pull-Off Testing
Hybrid specimens consisted of a PLA base, printed with the FFF parameters of Table 4 but with 100% infill as recorded in the specimen log, and an Ecoflex interface layer deposited by DIW. Three routes were compared. In R1 (manual transfer, ), the base was printed on the Prusa, transferred to the DIW bed and aligned with fiducials. In R2 (dual platform, ), FFF and DIW heads were used in sequence on a shared bed. In R3 (tool changer, ), a custom tool changer on the Duet controller switched automatically from FFF to DIW. The silicone was fully cured (4 h RT + 4 h at 60 °C) before pull-off testing at 5 mm min−1 in custom aluminium grips with a bonded area of 30 mm × 5 mm (150 mm2). We recorded the total process time, the itemised cost logged for each specimen, the peak force and the failure mode (cohesive within the silicone, or adhesive at the interface).
3.16. Life-Cycle Assessment Model
A cradle-to-gate LCA [63,64] was built in openLCA 2.0 with ecoinvent 3.9.1 (cut-off system model) [65], using the Portuguese medium-voltage electricity mix. Impacts were characterised with ReCiPe 2016 Midpoint (H) [66] and with cumulative energy demand (CED). The system boundary covers material production, printing and post-processing; transport was neglected because supply was local. The reference flow is one tensile bar, with the mass given in Section 3.14 and the electricity measured per bar (Section 4.9). The background datasets were market datasets for polylactide granulate, ABS copolymer, isopropanol and Portuguese electricity. No specific datasets exist for the photopolymers or the silicone, so liquid epoxy resin served as a proxy for Clear V4 and Tough 2000, and a generic silicone product for Ecoflex. These proxies carry an estimated GWP uncertainty of about ±25%. To test a load-based functional unit, results were also scaled to the number of bars needed to carry 500 N.
The sensitivity of the per-bar GWP to the electricity supply and to build-plate utilisation was examined with
where is the non-electricity part of the GWP taken from the contribution analysis, E is the measured single-bar electricity, c is the carbon intensity of the grid, and is the fraction of the single-bar electricity attributed to one bar ( for single-bar builds, when several parts share a build). The effective intensity I was varied from 0 to 800 g CO2-eq kWh−1, which spans carbon-free supply or fully shared builds at one end, and coal-dominated grids at the other, and break-even intensities at which two alternatives would swap places were computed.
3.17. Multicriteria Analysis
TOPSIS [49] was used as an illustrative tool to examine how ranking outcomes depend on analyst choices, not to produce a recommendation. The decision matrix contains the five alternatives and 12 measured criteria (listed in Section 4.12). Columns were vector-normalised, , and weighted, . The ideal solution and anti-ideal solution take, for each criterion, the best and worst weighted value according to its direction. The closeness coefficient is
Hardness and fatigue were not used as criteria, although both are reported in full (Section 4.4 and Section 4.6). Hardness was measured on two scales (Shore D and Shore 00) that have no common reference and cannot share one column, and within the rigid class it differed by only five points. Fatigue was run in load control for the rigid materials and in strain control for the silicone, so the lives are not commensurable; within the rigid class, the strength-normalised fatigue ratios (0.34–0.42) would add little discrimination.
No expert pairwise-comparison (AHP) data were collected, so the base case uses equal weights. Four criterion sets were evaluated. Set A contains all 12 criteria. Set B removes elongation at break (C4), on which one alternative differs from the others by up to two orders of magnitude. Cost (C7), electricity (C8), build time (C9) and GWP (C11) are not independent: machine depreciation in C7 is proportional to C9, and the electricity part of C11 is proportional to C8. Across the five alternatives, the Pearson correlations are 0.73–0.93 among C7, C8 and C11, and 0.83–0.85 between C9 and C8 or C11. With equal weights, this cluster carries one third of the total weight. Sets C and D therefore repeat Sets A and B without C8 and C9, whose information is already contained in C7 and C11. As a further check, the four cluster criteria were kept but given half weight each, so that together they weighed as much as two independent criteria.
Weight sensitivity was examined by stochastic multicriteria acceptability analysis [52]: 10,000 weight vectors were drawn uniformly from the weight simplex (a Dirichlet distribution with unit parameters, fixed random seed), and the share of draws in which each alternative ranked first (its rank-1 acceptability) was recorded. Robustness to individual criteria was checked by removing one criterion at a time. Finally, to implement a classify-then-rank procedure, all analyses were repeated for the four rigid materials alone, so that the normalisation and the ideal and anti-ideal points were computed within one material class.
3.18. Statistics
Values are reported as mean ± sample SD ( unless stated otherwise). Aged and unaged groups were compared with Welch’s t-test [67] (Welch–Satterthwaite degrees of freedom). The ten UTS comparisons (5 materials × 2 ageing conditions) were treated as one family and corrected with the Holm procedure [68] at . Hardness was compared between materials within a process with Welch’s test. Mean viabilities were compared with the 70% threshold by a one-sample t-test (). Fatigue lives are summarised by the median and range at each level, and Basquin-type power laws [69], , were fitted by least squares on log–log axes to failed specimens only. Because runouts were excluded, these fits are descriptive. Hybrid-route data () are reported descriptively.
4. Results
4.1. Microstructure and Porosity
Figure 2 and Table 5 summarise the microstructural observations; Figure 2 shows polished cross-sections of all five materials at the same magnification. Both FFF materials contain inter-layer voids and raster gaps, with void fractions of 2.8% (PLA) and 3.5% (ABS). Both SLA resins are nearly fully dense (0.4–0.6%). The DIW silicone contains occasional trapped air bubbles (1.9%), and filament boundaries remain visible on its free surfaces. The void fractions were measured on the same material lots as the mechanical specimens and entered the multicriteria analysis as criterion C10.
Figure 2.
Scanning electron micrographs of cross-sections at 200× magnification (secondary electrons, 10 kV, 8 nm Au) across all five benchmarked materials: (a) FFF-PLA; (b) FFF-ABS; (c) SLA-Clear V4; (d) SLA-Tough 2000; (e) DIW-Ecoflex 00-30. All panels share a standardised 200 μm scale bar. Microstructural features highlight process-specific characteristics: (a,b) inter-bead raster gaps and layer adhesion boundaries from material extrusion; (c,d) homogeneous, nearly fully dense matrices from vat photopolymerisation; and (e) stacked elastomeric beads with entrapped micro-voids from direct ink writing.
Table 5.
Void fraction from image analysis of five cross-sections per material, with qualitative observations.
4.2. Surface Roughness
Table 6 and Figure 3 report . SLA surfaces were six to seven times smoother than FFF surfaces on both faces: 1.22–1.27 μm against 8.40–8.50 μm on top faces, and 1.57 μm against 11.0–11.1 μm on side faces. The DIW silicone was intermediate, at 3.79 μm on the top face and 5.09 μm on the side face. followed the same order, at 44–58 μm for FFF, 23–29 μm for DIW and 9–11 μm for SLA.
Table 6.
Arithmetic mean roughness (μm). Direction columns (‖, ⊥ to the layers) are means of 25 traces. The “Mean” columns give the mean ± SD of five specimen means.
Figure 3.
Surface roughness by material and face (mean ± SD of five specimens).
For every material, side faces were 24–34% rougher than top faces. This reflects the layer staircase on vertical walls, which is the dominant roughness mechanism on FFF side walls [28] and is present, at a smaller scale, for the 0.05 mm SLA layers and the 0.4 mm DIW layers. Differences between trace directions were small: at most 0.7 μm for FFF and 0.07 μm for the other materials. On FFF top faces, this is expected, since with a ±45° raster, both measurement directions cross the rasters at the same angle. PLA and ABS were indistinguishable, as were Clear V4 and Tough 2000, so surface finish is set by the process rather than by the material within it.
4.3. Dimensional Accuracy
All materials produced undersized cubes (Table 7, Figure 4), and the largest deviation was always along Z. SLA mean deviations stayed within 0.052 mm (≤0.26%) on every axis. FFF in-plane deviations were to mm, and both PLA and ABS were 0.168 mm () undersized along Z. The DIW silicone showed the largest deviations, to mm in-plane and mm () along Z. The larger Z shrinkage of the DIW cubes is consistent with slumping of the uncured silicone under its own weight, which is expected unless the ink develops enough yield stress to hold its shape before gelation [22,23]. The in-plane deviations of the silicone also include some compression by the micrometre anvils (Section 5.5).
Table 7.
Dimensional deviations (mm) of 20 mm cubes (mean ± SD of five specimen means; 25 readings per axis). Relative deviations are given in parentheses.
Figure 4.
Mean dimensional deviation of 20 mm cubes by axis (mean ± SD, ).
4.4. Hardness
Table 8 gives the hardness results. On the Shore D scale, the two FFF materials were indistinguishable (PLA , ABS ; ), as were the two SLA resins (Clear V4 , Tough 2000 ; ). The FFF plates were about 5 Shore D points harder than the SLA plates (), although their bulk moduli overlap (Table 9) and the FFF plates had only 20% infill inside three perimeter walls. The durometer therefore responded mainly to the outer shell and to the local stiffness of the material, not to the sparse interior. The silicone measured Shore 00, close to its nominal 00-30 grade.
Table 8.
Durometer hardness (mean ± SD of five specimen means; 25 readings per material).
Table 9.
Unaged tensile properties (mean ± SD, ).
4.5. Quasi-Static Tensile Behaviour
Table 9 and Figure 5 summarise the unaged tensile behaviour. Among the rigid materials, Clear V4 was strongest ( MPa), followed by PLA ( MPa), Tough 2000 ( MPa) and ABS ( MPa), with moduli of 1.99–3.24 GPa. Strengths and moduli were within 6% of the datasheet values in Table 2: measured UTS was 96–101% and measured modulus 95–103% of the supplier values. The flat, 100%-infill FFF bars, whose layers lie parallel to the load and whose three perimeters run along the bar axis, and the fully post-cured SLA bars therefore reached their nominal properties, in line with earlier reports for well-tuned FFF [27].
Figure 5.
Representative unaged engineering stress–strain curves: for each material, the bar closest to the group median UTS, sub-sampled from the raw data files. Note the different axis ranges. Strain is from the extensometer in (a,b) and from crosshead displacement in (c).
Tough 2000 stands out among the rigid materials. After a yield-like transition at about 1.6% strain, it deformed plastically to , five to seven times the elongation of the other three.
Ecoflex reached MPa at elongation, with a nominal stress that was nearly proportional to strain up to failure ( MPa, MPa). Its strength is 6% below the supplier value of 1.38 MPa. Its elongation is well below the nominal 900%, and its is three times the supplier’s 100% modulus. These strains are crosshead-based; with the correction factor of 0.40–0.76 estimated in Section 3.9, the elongation at break in the gauge section is about 235–445%, and the true stress at 100% gauge strain is higher than the tabulated . The printed silicone was therefore stiffer and less extensible than the supplier’s moulded reference. Plausible causes are the bead interfaces and trapped bubbles of the DIW parts (Table 5), which act as flaws, and the 60 °C post-cure, which completes crosslinking more fully than room-temperature cure.
Across all 75 bars, 19 failed near a shoulder (3 PLA, 4 ABS, 4 Clear V4, 5 Tough 2000 and 3 Ecoflex). None was excluded, and their strengths fell within the scatter of the gauge failures.
Figure 6 places all 15 material–condition groups in strength–elongation space. The five materials occupy three distinct regions: brittle-rigid (PLA, ABS, Clear V4), tough-rigid (Tough 2000) and elastomeric (Ecoflex). Ageing moves each group along short trajectories that never cross from one region to another.
Figure 6.
Strength–elongation map of all material–condition groups (means, each). Ecoflex elongations are nominal (crosshead-based) values.
4.6. Fatigue
Table 10 and Figure 7 report the fatigue results. In absolute terms, Clear V4 sustained the highest stresses at each life. The picture changes once the peak stress is normalised by the measured UTS: the four rigid materials then fall close to a common band. Near half their strength (47–54% of UTS), median lives were – cycles. Near two-thirds of their strength (61–70% of UTS), they were 5– cycles. At the lowest level (33–38% of UTS), most bars reached or approached cycles. ABS and Clear V4 had three runouts out of four, and PLA and Tough 2000 one each.
Table 10.
Fatigue results (). Rigid materials: load control, 5 Hz, per level. Silicone: strain control, 2 Hz, per level; silicone strains are nominal (crosshead-based) values. Runouts ( cycles) are included in the medians and ranges.
Figure 7.
Fatigue results. (a) Rigid materials: peak stress normalised by the unaged UTS versus cycles to failure. (b) Ecoflex: peak nominal strain versus cycles to failure. Open circles mark runouts at cycles; overlapping runouts are drawn once.
The Basquin exponents fitted to failed specimens ranged from (Clear V4) to (ABS). The fitted curves give stresses at cycles of 20.0 MPa (PLA), 13.1 MPa (ABS), 24.1 MPa (Clear V4) and 16.2 MPa (Tough 2000), that is, fatigue ratios of 0.34–0.42. At the intermediate and high levels, the lives of individual bars differed by up to a factor of six. Two to five of the failed bars per material broke at the fillet rather than in the gauge section, so the results include some influence of stress concentration at the transition radius.
The ductility of Tough 2000 in monotonic tension did not translate into a longer normalised fatigue life. Its fatigue ratio (0.35) was similar to that of ABS and below those of PLA and Clear V4. The tough, yielding behaviour at large strain matters little in the small-strain, high-cycle regime, where crack initiation at defects controls life.
The silicone, cycled in strain control, survived close to cycles at 50% nominal peak strain (an estimated 20–38% in the gauge section) (two runouts out of five, the others failing between and cycles). Median life fell to cycles at 100% and to cycles at 150%, with very little scatter at the highest level. The force logs showed progressive softening under constant strain amplitude, as expected from the Mullins effect in silicone elastomers [35,36]. Strain-based life description, the usual approach for elastomers [34], gave .
Hysteretic self-heating of the specimen surface ranged from 1.1 to 12.0 °C. Rigid bars tested at 5 Hz heated by 6–8 °C on average, and the silicone at 2 Hz by about 3 °C. Even the warmest bars therefore stayed well below the HDTs of the rigid materials (Table 2).
4.7. Effect of UV and Thermal Ageing
Table 11 and Figure 8 report properties after ageing. UV reduced the UTS of every material, and all five reductions remained significant after Holm correction. Strength retention was lowest for Clear V4 (82.7%, ) and PLA (83.9%), intermediate for Ecoflex (88.5%) and ABS (89.4%), and highest for Tough 2000 (91.0%).
Table 11.
Tensile properties, mass change and appearance after 500 h of ageing (mean ± SD, ). Retention is relative to the unaged group. p: Welch t-test on UTS against the unaged group; : Holm-adjusted across the ten UTS comparisons (* significant at ).
Figure 8.
Property retention after 500 h of ageing, relative to unaged controls: (a) ultimate tensile strength, with error bars showing propagated standard deviations; (b) elongation at break, shown as the ratio of group means.
The effect of UV on ductility was more selective. Clear V4 retained only 72.7% of its elongation at break and PLA only 73.7%; both lost 18% of their modulus and turned visibly yellow. The loss of stiffness together with strength and elongation suggests chain scission within the exposed surface layer rather than additional crosslinking. For PLA, this matches the known photolytic degradation of the ester backbone, which condensation cycles at elevated temperature accelerate [37]. Tough 2000 and ABS retained more than 93% of their elongation and lost 9–10% of their modulus. For ABS, the moderate losses and slight dulling agree with photo-oxidation confined to a thin surface layer of the rubber phase [38]. Ecoflex retained 81% of its elongation, and its rose by 8%. This may reflect some additional crosslinking of the silicone network under UV and heat. All UV-aged SLA and PLA specimens yellowed, while ABS and Ecoflex appeared slightly dulled. One PLA bar warped slightly. Mean mass changes were small, between and .
Ageing at 50 °C for 500 h was milder, with UTS retention of 91.6–97.4%. The reduction was significant after Holm correction for Ecoflex and Tough 2000, but not for PLA, ABS or Clear V4. No thermally aged specimen showed discolouration or warping.
At 50 °C, PLA was aged a few degrees below its glass transition. Physical ageing under these conditions densifies the glass through enthalpy relaxation and embrittles PLA [39,40]. The 14% loss of elongation observed here agrees with this. The 9% loss of modulus does not, since physical ageing normally raises modulus. It points to an additional process, such as relaxation of residual stresses frozen in during printing or slight hydrolysis, that calorimetry and molecular-weight measurements could resolve.
4.8. Cytotoxicity
Table 12 and Figure 9 give the cell-viability results. PLA (), ABS () and Ecoflex () were clearly non-cytotoxic, with every replicate above 86%. Both SLA resins fell below the 70% threshold. Clear V4 averaged , with all six replicates below 70% (one-sample t-test against 70%, ). Tough 2000 averaged , with five of six replicates below 70% and one at 70.3%. Its mean was below the threshold, but not significantly so at (). By the ISO 10993-5 criterion, both resins therefore show cytotoxic potential after the manufacturer’s standard wash and post-cure. This agrees with earlier findings that residues leaching from general-purpose SLA resins are toxic and that additional post-treatment reduces the effect [42].
Table 12.
In vitro cytotoxicity (ISO 10993-5, extract method, L929 cells, MTT; discs per material).
Figure 9.
Cell viability of L929 fibroblasts exposed to extracts (mean ± SD, ). The dashed line marks the 70% threshold of ISO 10993-5.
4.9. Build Time, Electricity and Cost
Table 13 gives the electricity use and build time. Per bar, FFF used 0.21–0.22 kWh. SLA used 0.64–0.67 kWh, of which printing accounted for about 74% and washing and post-curing for the rest. DIW used 0.34 kWh, of which 73% went to oven curing. DIW also had the shortest logged build time (1.53 h), ahead of FFF (2.36–2.49 h) and SLA (4.14–4.38 h).
Table 13.
Measured electricity (kWh) and build time per tensile bar (single-bar builds).
With the model of Equation (1), a single tensile bar cost EUR 9.75 (PLA), EUR 9.81 (ABS), EUR 22.65 (Clear V4), EUR 23.48 (Tough 2000) and EUR 25.00 (Ecoflex) (Table 14, Figure 10). FFF bars were thus 57–58% cheaper than SLA bars, close to the 60% difference found in our earlier study [14]. Hands-on labour made up 62–93% of the totals. Without labour the order changes: DIW (EUR 1.66) moves close to FFF (EUR 1.00–1.06), while SLA stays highest (EUR 8.07–8.89) because of machine depreciation. Material cost was below EUR 0.30 per bar for FFF and DIW and EUR 1.19–1.63 for SLA, and electricity cost did not exceed EUR 0.15 in any case.
Table 14.
Cost per tensile bar (EUR), single-bar builds (Equation (1)).
Figure 10.
Cost breakdown per tensile bar for single-bar builds.
4.10. Rigid–Soft Hybrid Fabrication
Table 15 and Figure 11 compare the three hybrid routes. Relative to manual transfer (R1, min), the dual-platform route (R2) shortened total time by 25% ( min) and the tool changer (R3) by 32% (123 min). The logged itemised costs were similar across routes (EUR 4.31–4.51), so removing the transfer step saved time but not consumables.
Table 15.
Hybrid PLA/Ecoflex routes (mean ± SD; for R3, mean and range). Nominal stress refers to the 150 mm2 bonded area.
Figure 11.
Pull-off force of individual hybrid specimens by route and failure mode (30 mm × 5 mm bonded area).
Mean pull-off force rose from N for R1 to N for R2 and 43.7 N for R3. All six specimens of the integrated routes failed cohesively within the silicone. Two of the four R1 specimens failed adhesively, including the weakest one (28.5 N). Handling and re-registration between machines therefore seem to compromise the interface, possibly through contamination or cooling of the PLA surface before the silicone is deposited.
Over the 150 mm2 bonded area, the mean nominal pull-off stresses were 0.24 MPa (R1), 0.31 MPa (R2) and 0.29 MPa (R3), or 18–24% of the bulk UTS of Ecoflex. A thin, bonded, nearly incompressible elastomer layer loaded in tension is constrained laterally, which creates hydrostatic tension in its interior. Failure then tends to start by internal cavitation at stresses of the order of the elastic modulus, well below the uniaxial strength [70]. The pull-off test therefore ranks interface quality but does not measure the tensile strength of the silicone.
4.11. Life-Cycle Assessment
Table 16 lists the foreground inventory per tensile bar, and Table 17 gives the characterised impacts. Per bar, the global warming potential (GWP100) was lowest for PLA (53.6 g CO2-eq), followed by ABS (82.8 g), Ecoflex (94.2 g), Clear V4 (141.1 g) and Tough 2000 (170.0 g). The SLA bars therefore carried 2.6–3.2 times the footprint of a PLA bar. CED followed the same order, from 1.77 MJ (PLA) to 4.30–4.36 MJ (SLA), and so did the other midpoint categories in Table 17. Freshwater ecotoxicity, for example, ranged from 7.7 to 39.3 g 1,4-DCB-eq.
Table 16.
Foreground inventory per tensile bar, with the reference flow implied by a 500 N load-capacity functional unit (FU). = measured UTS × nominal narrow-section area.
Table 17.
Characterised cradle-to-gate impacts per tensile bar (ReCiPe 2016 Midpoint (H) and CED; Portuguese electricity mix), GWP100 contribution analysis, and GWP100 per 500 N functional unit for the rigid materials.
Material production dominated the footprint of every bar (56.9–73.8% of GWP100), electricity contributed 18.4–38.3%, and IPA and other inputs 3.7–7.8%. The relatively small electricity share reflects the low carbon intensity of the Portuguese mix. Electricity varies by a factor of 3.2 between processes (Table 13), so a more carbon-intensive grid would widen the gap between SLA and the other processes. The resin and silicone results rely on proxy datasets, with an estimated GWP uncertainty of about ±25%. Even at the edge of that band, however, the SLA bars would still exceed the FFF bars.
Scaling to a 500 N load capacity reverses nothing among the rigid materials. PLA remains lowest (12.9 g CO2-eq per functional unit), followed by ABS (26.9 g), Clear V4 (30.6 g) and Tough 2000 (45.6 g), because the stronger materials need fewer bars. For the silicone, however, one bar carries only about 16 N. Read literally, the load-based unit would require 32 silicone bars (176 g of silicone and about 3.0 kg CO2-eq), 66 to 230 times the burden of the rigid materials. A load-based functional unit suits structural parts. It does not suit elastomeric parts, whose function is compliance, sealing or damping rather than load capacity. We therefore report per-part results for all materials and apply the load-based unit to the four rigid materials only.
Figure 12 shows how the per-bar GWP changes with the effective carbon intensity of the electricity, Equation (2). At , which corresponds to a carbon-free supply or to the limit of a fully shared build, only material production and other inputs remain: 41.5 g CO2-eq (PLA), 65.9 g (ABS), 74.6 g (Ecoflex), 87.1 g (Clear V4) and 138.7 g (Tough 2000). At g CO2-eq kWh−1, representative of coal-dominated grids, the footprints rise to 221, 230, 348, 620 and 650 g. The order PLA < ABS < Ecoflex < Clear V4 < Tough 2000 holds over the whole range. The closest pairs would swap only above break-even intensities of 1285 g CO2-eq kWh−1 (PLA and ABS) and 1913 g CO2-eq kWh−1 (Clear V4 and Tough 2000), well above any national grid average. The ratio of the SLA footprints to the PLA footprint stays between 2.1 and 3.3. Higher plate utilisation in production lowers every footprint and narrows the absolute gap between SLA and the other processes, whereas a more carbon-intensive grid widens it; neither changes the ranking.
Figure 12.
Sensitivity of the per-bar GWP100 to the effective carbon intensity of the electricity, (Equation (2)), combining grid intensity c and the fraction of single-bar electricity attributed to one bar. Lines use the non-electricity GWP from the contribution analysis and the measured single-bar electricity.
4.12. Multicriteria Ranking
Table 18 gives the decision matrix, and Table 19 and Figure 13 give the TOPSIS results. With all 12 criteria and equal weights (Set A), Ecoflex ranks first (), followed by Clear V4 (0.490), Tough 2000 (0.474), PLA (0.436) and ABS (0.385). With elongation removed (Set B), the order inverts. Clear V4 (0.612) and Tough 2000 (0.574) lead, followed by PLA (0.546) and ABS (0.473), and Ecoflex falls to last (0.442). The same inversion occurs with the ten criteria that exclude GWP and cell viability (Ecoflex first at 0.553 with elongation; Clear V4 first at 0.645 without it).
Table 18.
TOPSIS decision matrix (measured means). ↑: benefit criterion; ↓: cost criterion.
Table 19.
TOPSIS closeness coefficients (rank) with equal weights. Set A: C1–C12; Set B: C1–C12 without C4; Set C: Set A without C8 and C9; Set D: Set B without C8 and C9. Upper part: all five alternatives; lower part: rigid class only, with normalisation within the class.
Figure 13.
Equal-weight TOPSIS closeness coefficients (Equation (3)) for the two criterion sets.
The inversion comes from vector normalisation. Ecoflex’s elongation of 588% has a normalised value of 0.997 in the elongation column. On that criterion, every rigid material therefore sits essentially at the anti-ideal point and Ecoflex at the ideal point. The criterion rewards membership of the elastomer class rather than discriminating within it, and this would remain true with the gauge-corrected elongation of 235–445%. Removing criteria one at a time confirmed this: in Set A, only the removal of elongation displaced Ecoflex from first place. In Set B, Clear V4 ranked first in 9 of 11 runs, and PLA overtook it only when roughness or void fraction was removed. Among the rigid materials, Clear V4 ranked above Tough 2000 and PLA above ABS in every run.
Removing the correlated criteria C8 and C9 (Sets C and D) did not change the leading alternative: Ecoflex still ranked first with elongation (0.540) and Clear V4 without it (0.710). Halving the weights of the four cluster criteria gave the same leaders (Ecoflex at 0.555 with elongation; Clear V4 at 0.743 without it). The double counting of the economic and energy criteria therefore changes the margins, not the direction of the result, which is set by C4.
Weight sensitivity (Table 20) shows that no alternative is a robust first choice across material classes. Over 10,000 random weight vectors with Set A, Ecoflex ranked first in 42.5% of draws, Clear V4 in 30.2% and PLA in 22.7%; with Set B, Clear V4 led in 47.2% and PLA in 40.7% of draws. ABS ranked first in fewer than 0.5% of draws in every set.
Table 20.
Rank-1 acceptability (%): share of 10,000 random weight vectors (uniform on the weight simplex) for which each alternative ranks first.
Ranking within the rigid class (lower part of Table 19) gives a different picture. Elongation now discriminates between one tough and three brittle materials rather than between classes, and with it, Tough 2000 ranked first (0.606), followed by Clear V4 (0.492), PLA (0.415) and ABS (0.374). Tough 2000 stayed first in 11 of 12 leave-one-out runs and lost first place only when elongation was removed, in which case Clear V4 led (0.580). Weights still mattered within the class: Tough 2000 ranked first in 50.9% of draws with Set A and Clear V4 in 52.4% with Set B, while PLA led in 29.0% and 42.9% of draws, respectively. ABS ranked first in fewer than 2% of draws and last in 59% of draws with both sets. Within one class, a ranking therefore reflects which functional requirement is weighted most (ductility, strength and precision, or cost and footprint) rather than an effect of class membership.
5. Discussion
5.1. Comparison with the Earlier Benchmark and the Literature
The present results confirm the main contrasts of our earlier FFF–SLA comparison [14] on new lots and a larger specimen set. SLA was again about six to seven times smoother than FFF. It was again about three times more accurate: mean deviations were at most 0.052 mm, against up to 0.17 mm for FFF, compared with ±0.05 and ±0.15–0.20 mm previously. FFF was again close to 60% cheaper per part. Absolute roughness values were lower here for both processes ( 1.2–1.6 and 8.4–11.1 μm, against about 2 and 12–13 μm). This probably reflects the different printers, layer heights and cut-off settings, and shows that absolute roughness values transfer poorly between studies even when the ranking is stable [11]. The 24–34% higher roughness of side faces follows the layer-staircase mechanism described for FFF [28].
On the mechanical side, the rigid materials came within 6% of their datasheet strength and stiffness. This is expected for FFF bars printed flat, with their layers parallel to the load and three perimeters along the bar axis, which is the favourable build orientation for strength [6,27], and for fully post-cured SLA resins [10]. The printed silicone behaved differently. It was about three times stiffer at 100% strain than the supplier’s moulded reference and reached only about two-thirds of the nominal elongation on a crosshead basis, and about a quarter to a half once the estimated strain bias is taken into account (235–445% against 900%). For extrusion-printed silicones, the interfaces between filaments and the residual porosity act as defects that limit extensibility. This is one reason why printed and moulded soft actuators can differ in performance [19,21].
Normalised by strength, the fatigue behaviour of the four rigid materials was similar. The estimated fatigue ratios at cycles were 0.34–0.42, with Basquin exponents of about to . Only flat, ±45°, 100%-infill bars were tested. Fatigue life of FFF parts is known to depend strongly on build and raster orientation [31,32], so the FFF values here are best-case values and should not be transferred to other orientations. The notably tougher Tough 2000 did not outlast the brittle materials in normalised terms. Monotonic ductility is therefore a poor proxy for high-cycle fatigue resistance. For the silicone, strain rather than stress is the appropriate life parameter [34]. The data show that a nominal peak strain of about 50% (an estimated 20–38% in the gauge section) can be sustained for about cycles, which is the relevant design information for seals and actuators.
UV ageing affected strength, stiffness and ductility most in the two materials whose chemistry is most photosensitive, PLA and the general-purpose Clear V4 resin. The losses in PLA agree with UV-driven chain scission accelerated by heat and moisture [37], conditions that the condensation phase of the UV cycle supplies. ABS lost less ductility than PLA over the same exposure, consistent with degradation confined to a surface layer of the rubber phase [38]; longer exposures are known to embrittle ABS further. Thermal ageing at 50 °C reduced the elongation of PLA as physical ageing predicts [39], but also its modulus, which physical ageing alone does not explain.
The cytotoxicity results separate the processes more sharply than any mechanical property did. The FFF thermoplastics and the silicone passed with a wide margin. Both SLA resins failed after the standard wash and cure, as reported for other general-purpose photopolymers [42]. The extraction ratio used here (1 cm2 mL−1) should be considered when comparing with studies that use the surface-area ratios of ISO 10993-12 [71].
The life-cycle results agree with the observation that material production and electricity together dominate the footprint of polymer AM parts [45,47]. The SLA bars were the most burdensome because they combine the most impact-intensive material with the largest electricity demand. Because the non-electricity part of the footprint already ranks the systems in the same order, neither a cleaner nor a more carbon-intensive grid, nor better use of the build plate, changes the ranking (Figure 12); these factors change only the size of the gaps. Hardness added little discriminating information within each class. Its value lies mainly in confirming the grade of the silicone. Durometer readings are, in any case, only loosely related to modulus across different material classes [72].
5.2. Process-Controlled and Material-Controlled Properties
Because each rigid process was represented by two materials, the difference between processes can be compared with the spread within each process. For each property, Table 21 gives the difference between the FFF and SLA means (B), the mean difference between the two materials of a process (W) and the index , which approaches 1 when the process dominates and 0 when the material dominates. Surface roughness (), cost (0.97), dimensional deviation (0.95), electricity (0.95), hardness (0.91), build time (0.91), cell viability (0.91) and void fraction (0.85) were controlled by the process. Strength, modulus, elongation, fatigue ratio and retention after UV and thermal ageing (–) were controlled by the material. The carbon footprint was mixed (), because resin chemistry and electricity both contribute.
Table 21.
Attribution of properties to process or material for the four rigid materials. FFF and SLA columns: mean of the two materials of each process. B: difference between the process means; W: mean difference between the two materials within a process; . Process-controlled: ; material-controlled: .
This partition defines what a comparison of processes run with different materials can and cannot show. Statements about surface quality, accuracy, porosity, energy and cost can be read as statements about the process, at least for the material families tested. Statements about strength, ductility, fatigue and weathering cannot: they describe the particular materials and would change with another filament or resin in the same process. Cytotoxicity needs care. Both SLA resins are methacrylate-based photopolymers, so process and material class cannot be separated, and the result reflects residual species left by the standard SLA wash-and-cure route for this resin family [42,43]. The elastomer has no within-process partner here, so its results describe the DIW–silicone system as a whole.
5.3. Implications for Process Selection
The results support selecting the material class first and ranking within it second. SLAis the choice when surface finish and dimensional fidelity dominate, with below 1.6 μm and mean deviations of at most 0.052 mm on 20 mm features. Clear V4 combined the highest strength and fatigue strength with this precision. However, after 500 h of UV it had lost more than a quarter of its elongation and a sixth of its strength, so it is unsuited to unprotected outdoor or UV-exposed service. Tough 2000 gave up 11 MPa of strength relative to Clear V4 but was five times more ductile and more tolerant of UV. Neither resin should be used in contact with tissue or cells without additional post-processing and a new biological evaluation, and SLA carried the largest carbon footprint per part.
FFF offered the lowest cost and carbon footprint per part. The price for this was a surface about seven times rougher, as well as about 0.17 mm of Z shrinkage on 20 mm parts. PLA was stronger and stiffer than ABS, had the lowest GWP of all materials and passed the cytotoxicity test. It was also the most UV-sensitive of the thermoplastics, and its HDT is only 5 °C above the thermal ageing temperature, which limits its use in warm environments. ABS was the more UV-tolerant FFF material but carried a 55% higher footprint than PLA.
DIW silicone is not a substitute for either process but opens a separate design space. It combined large, fatigue-resistant deformability with retention of 88–92% of strength after both ageing treatments, good cytocompatibility, an intermediate surface finish and the largest shrinkage.
In this study, per-part cost was governed by hands-on labour rather than by material or electricity, because every part was built individually. This finding is specific to single-part laboratory builds. In batch production, labour and machine time are spread over many parts, and the SLA–FFF cost gap would be expected to narrow [44]. The DIW cost is also sensitive to the 40 min of hands-on mixing, degassing and syringe loading. Measured against the 45 min pot life of Ecoflex, this makes batch sizing an operational constraint.
In the exploratory hybrid comparison, integrating DIW into the FFF build removed the manual transfer step. Two of the four manually transferred specimens failed adhesively, whereas all six specimens of the integrated routes failed cohesively, and the mean pull-off force was 23–30% higher. With four and two specimens per integrated route, these results indicate, but do not establish, that in-build integration improves interface reliability; a larger series is needed to confirm the effect.
Table 22 summarises the advantages and disadvantages of the five systems established by these measurements, together with the applications they suit.
Table 22.
Advantages, disadvantages and indicated uses of the benchmarked systems (single-part builds; values from Section 4.1, Section 4.2, Section 4.3, Section 4.4, Section 4.5, Section 4.6, Section 4.7, Section 4.8, Section 4.9, Section 4.10 and Section 4.11).
5.4. Methodological Observations
Five methodological points emerged that are relevant to comparative AM benchmarks. First, a single 0.8 mm roughness cut-off was applied to all materials for comparability, whereas ISO 4288 [73] recommends 2.5 mm for non-periodic profiles with between 2 and 10 μm. The FFF and DIW values are therefore conservative, because they under-represent longer-wavelength components, while the SLA values were obtained at the recommended cut-off.
Second, contact metrology on soft materials is biased. Stylus profilometry, even at reduced force, and micrometre measurement can indent or compress a Shore 00-30 elastomer. The DIW roughness and in-plane dimensions should therefore be read as upper-bound smoothness and lower-bound size. Non-contact methods, such as optical profilometry or structured-light or CT scanning, would remove this bias.
Third, strain measurement on elastomers needs a defined gauge length. Normalising crosshead displacement by the 25 mm test length overstated the gauge strain by an estimated factor of 1.3–2.5 here (Section 3.9); optical extensometry should be the default for soft specimens in mixed benchmarks.
Fourth, the choice of functional unit matters. A load-based functional unit penalises elastomers by about two orders of magnitude (Table 17) for a function they are not designed to deliver.
Fifth, criterion design drives multicriteria rankings. Including a criterion on which one alternative differs from the others by a factor of 13–90 inverts the ranking (Table 19). Correlated criteria inflate the weight of one aspect (here, cost, energy and time), but in this dataset, they changed the margins, not the leaders. Random weights showed that no alternative is a robust first choice across classes (Table 20). Rankings across material classes should therefore apply hard class constraints, such as a required elongation or compliance, before ranking within the admissible class; within the rigid class, the ranking then expressed a genuine trade-off between ductility, strength, precision, cost and footprint. Weights, when used, should be elicited and reported with consistency checks [48,50], and their sensitivity should be reported as acceptability indices rather than a single ranking [52].
5.5. Limitations
One build orientation per process, one material lot and five specimens per group (four per fatigue level for the rigid materials) were used. The FFF results refer to flat, ±45°, 100%-infill bars loaded in-plane, parallel to the layers. They represent a favourable orientation and do not capture inter-layer strength or inter-layer fatigue. Edge-on and upright orientations, which load the bead and layer interfaces differently and are known to change FFF strength and fatigue life [6,31,32,33], were not tested, and the SLA bars were built at one tilt only. The FFF values are therefore best-case values that should not be transferred to other orientations.
Silicone strain was derived from crosshead displacement, which includes deformation outside the narrow section and therefore overstates the true gauge strain. This affects both the tensile elongation and the nominal strain amplitudes of the fatigue tests. The bias was bounded geometrically (gauge strain 0.40–0.76 times the crosshead value; Section 3.9), but the estimate rests on a one-dimensional model; video or laser extensometry would be needed to measure the silicone strain directly.
Roughness was characterised by and only. The material-ratio parameters , and of ISO 13565-2 [57], which distinguish the load-bearing core from peaks and valleys and are relevant to sealing and wear, were not evaluated. Because the FFF, SLA and DIW profiles have very different peak and valley structures, these parameters could differentiate the processes beyond what shows.
Dimensional accuracy was assessed on 20 mm cubes, which capture global shrinkage but not feature-level accuracy, such as that of holes, thin walls, small bosses and overhangs, where the processes are expected to differ most. A benchmark artefact with features of graded size, as used by Minetola et al. [29], would be needed for that.
The archived Tough 2000 curves are sampled at intervals of about 0.13% strain because of their long strain range. The reported chord moduli were computed by the acquisition software and cannot be recomputed exactly from the archived curves.
The Shore D readings were taken on single 3 mm plates, below the 6 mm minimum thickness of ASTM D2240, and the FFF plates had 20% infill. The Shore D values are therefore suitable for comparison between the materials tested here, but not as absolute material hardness values.
The fatigue tests were run at 5 Hz on the rigid materials, which produced surface self-heating of up to 12 °C. Although the temperatures remained well below the HDTs, hysteretic heating may have shortened the lives at the highest level, and lower frequencies would be preferable for polymers near their glass transition.
The 50 °C ageing temperature was chosen to avoid distorting the rigid materials. It does not probe the high-temperature stability often attributed to silicones, and no conclusions on service above 50 °C should be drawn from these data. The UV and thermal exposures were not correlated with outdoor or service exposure, and the degradation was characterised through mass, appearance, warping and tensile retention only, without surface-chemistry analysis.
Cost results refer to single-part builds under the assumptions stated in Section 3.14. The hybrid itemised costs were logged on a different basis and are comparable only among the hybrid routes.
The resin and silicone inventories rely on proxy datasets, and the LCA excludes use and end-of-life. The cytotoxicity results cover one extraction condition and one cell line. They are a screening result, not a biocompatibility assessment, and no biocompatibility claims are made.
6. Conclusions
This study benchmarked five process–material systems spanning FFF, SLA and silicone DIW on 228 specimens with one protocol. Its novelty is threefold. A silicone DIW route was placed on the same specimen set and test protocol as FFF and SLA, with fatigue, ageing, cytotoxicity, cost and life-cycle data alongside the usual geometric and mechanical metrics. Paired materials within each rigid process separated process-controlled from material-controlled properties. A sensitivity analysis showed when multicriteria rankings across material classes can and cannot be trusted. The main conclusions are as follows.
- Surface finish, dimensional accuracy, porosity, hardness, electricity, cost and cytotoxicity were controlled by the process; strength, stiffness, ductility, fatigue ratio and ageing resistance were controlled by the material. Process comparisons made with different materials are informative for the first group only.
- SLA gave the best surface ( 1.2–1.6 μm) and dimensional fidelity (mean deviations of at most 0.052 mm on 20 mm cubes). FFF gave of 8.4–11.1 μm and mm along Z. DIW silicone was intermediate in roughness (3.8–5.1 μm) but shrank most ( mm along Z).
- Unaged strength ranged from 57.6 MPa (Clear V4) to 1.30 MPa (Ecoflex). Normalised by strength, the rigid materials had similar fatigue behaviour, with -cycle fatigue ratios of 0.34–0.42, and the ductility of Tough 2000 gave it no fatigue advantage. The printed silicone reached 588% elongation on a crosshead basis (an estimated 235–445% in the gauge section), was stiffer and less extensible than its moulded datasheet reference, and withstood about cycles at 50% nominal peak strain.
- UV exposure of 500 h significantly reduced the strength of all five materials (82.7–91.0% retention) and cut the ductility of Clear V4 and PLA by more than a quarter, whereas Tough 2000 and ABS retained over 93% of their elongation. Thermal ageing at 50 °C for 500 h retained 91.6–97.4% of strength.
- Both SLA resins showed cytotoxic potential (63.9% and 65.3% viability) after standard post-processing, whereas PLA, ABS and Ecoflex exceeded 90%.
- Per bar, SLA carried the largest carbon footprint (141–170 g CO2-eq) and PLA the smallest (54 g), with material production contributing 57–74%. This order held for effective grid intensities from 0 to 800 g CO2-eq kWh−1, that is, for cleaner or dirtier grids and for shared builds. A load-based functional unit is unsuitable for elastomers.
- For single-part builds, labour accounted for most of the cost (62–93%). Excluding labour, DIW (EUR 1.66 per bar) was close to FFF (EUR 1.00–1.06) and well below SLA (EUR 8.07–8.89).
- In an exploratory comparison with four and two specimens, the integrated FFF+DIW routes shortened the hybrid process by 25–32%, and all six of their specimens failed cohesively, against two adhesive failures among four manually transferred specimens. This indicates, but does not yet establish, that in-build integration improves interface reliability.
- Rankings across material classes inverted when elongation was included or removed and varied widely with the weights, whereas removing the correlated cost and energy criteria changed the margins but not the leading alternative. Process selection should therefore apply class constraints first and rank within the admissible class second, where the ranking expresses genuine trade-offs between ductility, strength, precision, cost and footprint.
The advantages and disadvantages of each system, and the applications they suit, are summarised in Table 22.
7. Outlook
Several extensions follow from the scope and limitations of this benchmark. First, inter-layer behaviour should be characterised by testing FFF bars on edge and upright, and SLA bars at several tilts, in tension and in fatigue, because these orientations govern the weakest load paths of real parts. Second, soft specimens call for non-contact metrology: optical or laser extensometry for strain, optical profilometry with material-ratio parameters (, , ) for surfaces, and structured-light or CT scanning of a feature-based artefact for geometric accuracy. Third, a flexible FFF filament such as TPU, together with the softest printable grades available, would allow an elastomer to be compared across two processes at matched hardness. Fourth, extended washing and post-curing of the SLA resins should be followed by repeated cytotoxicity testing under the extraction conditions of ISO 10993-12, to establish whether the resins can be brought above the 70% threshold. Fifth, ageing should be extended with surface-chemistry analysis and calibrated against outdoor exposure. Sixth, primary inventory data for photopolymers and silicones are needed to reduce the LCA uncertainty, and cost and LCA should be repeated for batch builds with measured plate utilisation. Finally, decision weights should be elicited from designers for defined applications, and the hybrid routes tested on larger series, so that the classify-then-rank procedure can be validated against real selection decisions.
Author Contributions
Conceptualization, M.A. and P.M.; methodology, P.M.; investigation (DIW fabrication), P.V. and J.S.; investigation (tensile, ageing, roughness and dimensional testing), M.A.; cost model and life-cycle assessment, P.V.; formal analysis (statistical and multicriteria analysis), P.M.; writing—original draft preparation, M.A. and P.M.; writing—review and editing, P.V. and J.S.; supervision, P.M. All authors have read and agreed to the published version of the manuscript.
Funding
This work is supported by national funds through FCT—Fundação para a Ciência e a Tecnologia, I.P., in the framework of project UID/04019/2025—CIAC (DOI: 10.54499/UID/04019/2025).
Data Availability Statement
The dataset supporting this article is available from the corresponding author upon reasonable request. It comprises the material and equipment records, printing parameters and specimen log; all 500 roughness traces, all 375 dimensional readings and all 125 hardness readings; the tensile summary and the 75 raw tensile curves; the fatigue records; the ageing protocols and observations; the cytotoxicity records; the cost, energy and build-time logs; the hybrid-route records; the life-cycle inventory and characterised results; and the porosity analysis. The TOPSIS computation of Section 4.12 can be reproduced directly from Table 18, and the LCA sensitivity analysis from Table 13 and Table 17 with Equation (2).
Conflicts of Interest
The authors declare no conflicts of interest.
References
- ISO/ASTM 52900:2021; Additive Manufacturing—General Principles—Fundamentals and Vocabulary. International Organization for Standardization: Geneva, Switzerland, 2021.
- Crump, S.S. Apparatus and Method for Creating Three-Dimensional Objects. US Patent 5,121,329, 9 June 1992. [Google Scholar]
- Hull, C.W. Apparatus for Production of Three-Dimensional Objects by Stereolithography. US Patent 4,575,330, 11 March 1986. [Google Scholar]
- Gibson, I.; Rosen, D.; Stucker, B. Additive Manufacturing Technologies: 3D Printing, Rapid Prototyping, and Direct Digital Manufacturing, 2nd ed.; Springer: New York, NY, USA, 2015. [Google Scholar]
- Ngo, T.D.; Kashani, A.; Imbalzano, G.; Nguyen, K.T.Q.; Hui, D. Additive manufacturing (3D printing): A review of materials, methods, applications and challenges. Compos. Part B Eng. 2018, 143, 172–196. [Google Scholar] [CrossRef] [Scilit]
- Ahn, S.-H.; Montero, M.; Odell, D.; Roundy, S.; Wright, P.K. Anisotropic material properties of fused deposition modeling ABS. Rapid Prototyp. J. 2002, 8, 248–257. [Google Scholar] [CrossRef] [Scilit]
- Sun, Q.; Rizvi, G.M.; Bellehumeur, C.T.; Gu, P. Effect of processing conditions on the bonding quality of FDM polymer filaments. Rapid Prototyp. J. 2008, 14, 72–80. [Google Scholar] [CrossRef] [Scilit]
- Turner, B.N.; Strong, R.; Gold, S.A. A review of melt extrusion additive manufacturing processes: I. Process design and modeling. Rapid Prototyp. J. 2014, 20, 192–204. [Google Scholar] [CrossRef] [Scilit]
- Melchels, F.P.W.; Feijen, J.; Grijpma, D.W. A review on stereolithography and its applications in biomedical engineering. Biomaterials 2010, 31, 6121–6130. [Google Scholar] [CrossRef] [Scilit] [PubMed]
- Bagheri, A.; Jin, J. Photopolymerization in 3D printing. ACS Appl. Polym. Mater. 2019, 1, 593–611. [Google Scholar] [CrossRef] [Scilit]
- Dizon, J.R.C.; Espera, A.H.; Chen, Q.; Advincula, R.C. Mechanical characterization of 3D-printed polymers. Addit. Manuf. 2018, 20, 44–67. [Google Scholar] [CrossRef] [Scilit]
- Stavropoulos, P.; Foteinopoulos, P. Modelling of additive manufacturing processes: A review and classification. Manuf. Rev. 2018, 5, 2. [Google Scholar] [CrossRef] [Scilit]
- Ben Said, L.; Alhadar, F.; Hentati, H.; Wali, M.; Ayadi, B.; Alharbi, S.; Alhadri, M. Enhancing PLA strength and layer adhesion: Physical and microstructural insights from vibration-assisted FFF/FDM. Polymers 2026, 18, 1767. [Google Scholar] [CrossRef] [Scilit] [PubMed]
- Abbasi, M.; Váz, P.; Silva, J.; Martins, P. Head-to-head evaluation of FDM and SLA in additive manufacturing: Performance, cost, and environmental perspectives. Appl. Sci. 2025, 15, 2245. [Google Scholar] [CrossRef] [Scilit]
- Truby, R.L.; Lewis, J.A. Printing soft matter in three dimensions. Nature 2016, 540, 371–378. [Google Scholar] [CrossRef] [Scilit] [PubMed]
- Wallin, T.J.; Pikul, J.; Shepherd, R.F. 3D printing of soft robotic systems. Nat. Rev. Mater. 2018, 3, 84–100. [Google Scholar] [CrossRef] [Scilit]
- Muth, J.T.; Vogt, D.M.; Truby, R.L.; Mengüç, Y.; Kolesky, D.B.; Wood, R.J.; Lewis, J.A. Embedded 3D printing of strain sensors within highly stretchable elastomers. Adv. Mater. 2014, 26, 6307–6312. [Google Scholar] [CrossRef] [Scilit] [PubMed]
- Liravi, F.; Toyserkani, E. Additive manufacturing of silicone structures: A review and prospective. Addit. Manuf. 2018, 24, 232–242. [Google Scholar] [CrossRef] [Scilit]
- Plott, J.; Shih, A. The extrusion-based additive manufacturing of moisture-cured silicone elastomer with minimal void for pneumatic actuators. Addit. Manuf. 2017, 17, 1–14. [Google Scholar] [CrossRef] [Scilit]
- Roh, S.; Parekh, D.P.; Bharti, B.; Stoyanov, S.D.; Velev, O.D. 3D printing by multiphase silicone/water capillary inks. Adv. Mater. 2017, 29, 1701554. [Google Scholar] [CrossRef] [Scilit] [PubMed]
- Yirmibeşoğlu, O.D.; Morrow, J.; Walker, S.; Gosrich, W.; Cañizares, R.; Kim, H.; Daalkhaijav, U.; Fleming, C.; Branyan, C.; Mengüç, Y. Direct 3D printing of silicone elastomer soft robots and their performance comparison with molded counterparts. In Proceedings of the 2018 IEEE International Conference on Soft Robotics (RoboSoft), Livorno, Italy, 24–28 April 2018. [Google Scholar] [CrossRef] [Scilit]
- Mackay, M.E. The importance of rheological behavior in the additive manufacturing technique material extrusion. J. Rheol. 2018, 62, 1549–1561. [Google Scholar] [CrossRef] [Scilit]
- Walker, S.; Daalkhaijav, U.; Thrush, D.; Branyan, C.; Yirmibeşoğlu, O.D.; Olson, G.; Mengüç, Y. Zero-support 3D printing of thermoset silicone via simultaneous control of both reaction kinetics and transient rheology. 3D Print. Addit. Manuf. 2019, 6, 139–147. [Google Scholar] [CrossRef] [Scilit]
- Vaezi, M.; Chianrabutra, S.; Mellor, B.; Yang, S. Multiple material additive manufacturing—Part 1: A review. Virtual Phys. Prototyp. 2013, 8, 19–50. [Google Scholar] [CrossRef] [Scilit]
- Nazir, A.; Gokcekaya, O.; Billah, K.M.M.; Ertugrul, O.; Jiang, J.; Sun, J.; Hussain, S. Multi-material additive manufacturing: A systematic review of design, properties, applications, challenges, and 3D printing of materials and cellular metamaterials. Mater. Des. 2023, 226, 111661. [Google Scholar] [CrossRef] [Scilit]
- Stano, G.; Percoco, G. Additive manufacturing aimed to soft robots fabrication: A review. Extreme Mech. Lett. 2021, 42, 101079. [Google Scholar] [CrossRef] [Scilit]
- Tymrak, B.M.; Kreiger, M.; Pearce, J.M. Mechanical properties of components fabricated with open-source 3-D printers under realistic environmental conditions. Mater. Des. 2014, 58, 242–246. [Google Scholar] [CrossRef] [Scilit]
- Ahn, D.; Kweon, J.-H.; Kwon, S.; Song, J.; Lee, S. Representation of surface roughness in fused deposition modeling. J. Mater. Process. Technol. 2009, 209, 5593–5600. [Google Scholar] [CrossRef] [Scilit]
- Minetola, P.; Calignano, F.; Galati, M. Comparing geometric tolerance capabilities of additive manufacturing systems for polymers. Addit. Manuf. 2020, 32, 101103. [Google Scholar] [CrossRef] [Scilit]
- Stano, G.; Pricci, A.; Pavone, A.; Percoco, G. Electromagnetic assistance enables 3D printing of silicone-based thin-walled bioinspired soft robots. Addit. Manuf. 2024, 81, 104028. [Google Scholar] [CrossRef] [Scilit]
- Afrose, M.F.; Masood, S.H.; Iovenitti, P.; Nikzad, M.; Sbarski, I. Effects of part build orientations on fatigue behaviour of FDM-processed PLA material. Prog. Addit. Manuf. 2016, 1, 21–28. [Google Scholar] [CrossRef] [Scilit]
- Ziemian, S.; Okwara, M.; Ziemian, C.W. Tensile and fatigue behavior of layered acrylonitrile butadiene styrene. Rapid Prototyp. J. 2015, 21, 270–278. [Google Scholar] [CrossRef] [Scilit]
- Safai, L.; Cuellar, J.S.; Smit, G.; Zadpoor, A.A. A review of the fatigue behavior of 3D printed polymers. Addit. Manuf. 2019, 28, 87–97. [Google Scholar] [CrossRef] [Scilit]
- Mars, W.V.; Fatemi, A. A literature survey on fatigue analysis approaches for rubber. Int. J. Fatigue 2002, 24, 949–961. [Google Scholar] [CrossRef] [Scilit]
- Mullins, L. Softening of rubber by deformation. Rubber Chem. Technol. 1969, 42, 339–362. [Google Scholar] [CrossRef] [Scilit]
- Diani, J.; Fayolle, B.; Gilormini, P. A review on the Mullins effect. Eur. Polym. J. 2009, 45, 601–612. [Google Scholar] [CrossRef] [Scilit]
- Copinet, A.; Bertrand, C.; Govindin, S.; Coma, V.; Couturier, Y. Effects of ultraviolet light (315 nm), temperature and relative humidity on the degradation of polylactic acid plastic films. Chemosphere 2004, 55, 763–773. [Google Scholar] [CrossRef] [Scilit] [PubMed]
- Santos, R.M.; Botelho, G.L.; Machado, A.V. Artificial and natural weathering of ABS. J. Appl. Polym. Sci. 2010, 116, 2005–2014. [Google Scholar] [CrossRef] [Scilit]
- Pan, P.; Zhu, B.; Inoue, Y. Enthalpy relaxation and embrittlement of poly(L-lactide) during physical aging. Macromolecules 2007, 40, 9664–9671. [Google Scholar] [CrossRef] [Scilit]
- Struik, L.C.E. Physical Aging in Amorphous Polymers and Other Materials; Elsevier: Amsterdam, The Netherlands, 1978. [Google Scholar]
- ISO 10993-5:2009; Biological Evaluation of Medical Devices—Part 5: Tests for In Vitro Cytotoxicity. International Organization for Standardization: Geneva, Switzerland, 2009.
- Oskui, S.M.; Diamante, G.; Liao, C.; Shi, W.; Gan, J.; Schlenk, D.; Grover, W.H. Assessing and reducing the toxicity of 3D-printed parts. Environ. Sci. Technol. Lett. 2016, 3, 1–6. [Google Scholar] [CrossRef] [Scilit]
- Guttridge, C.; Shannon, A.; O’Sullivan, A.; O’Sullivan, K.J.; O’Sullivan, L.W. Biocompatible 3D printing resins for medical applications: A review of marketed intended use, biocompatibility certification, and post-processing guidance. Ann. 3D Print. Med. 2022, 5, 100044. [Google Scholar] [CrossRef] [Scilit]
- Baumers, M.; Dickens, P.; Tuck, C.; Hague, R. The cost of additive manufacturing: Machine productivity, economies of scale and technology-push. Technol. Forecast. Soc. Change 2016, 102, 193–201. [Google Scholar] [CrossRef] [Scilit]
- Faludi, J.; Bayley, C.; Bhogal, S.; Iribarne, M. Comparing environmental impacts of additive manufacturing vs. traditional machining via life-cycle assessment. Rapid Prototyp. J. 2015, 21, 14–33. [Google Scholar] [CrossRef] [Scilit]
- Kreiger, M.; Pearce, J.M. Environmental life cycle analysis of distributed three-dimensional printing and conventional manufacturing of polymer products. ACS Sustain. Chem. Eng. 2013, 1, 1511–1519. [Google Scholar] [CrossRef] [Scilit]
- Kellens, K.; Baumers, M.; Gutowski, T.G.; Flanagan, W.; Lifset, R.; Duflou, J.R. Environmental dimensions of additive manufacturing: Mapping application domains and their environmental implications. J. Ind. Ecol. 2017, 21, S49–S68. [Google Scholar] [CrossRef] [Scilit]
- Saaty, T.L. The Analytic Hierarchy Process: Planning, Priority Setting, Resource Allocation; McGraw-Hill: New York, NY, USA, 1980. [Google Scholar]
- Hwang, C.-L.; Yoon, K. Multiple Attribute Decision Making: Methods and Applications; Springer: Berlin/Heidelberg, Germany, 1981. [Google Scholar]
- Byun, H.S.; Lee, K.H. A decision support system for the selection of a rapid prototyping process using the modified TOPSIS method. Int. J. Adv. Manuf. Technol. 2005, 26, 1338–1347. [Google Scholar] [CrossRef] [Scilit]
- Opricovic, S.; Tzeng, G.-H. Compromise solution by MCDM methods: A comparative analysis of VIKOR and TOPSIS. Eur. J. Oper. Res. 2004, 156, 445–455. [Google Scholar] [CrossRef] [Scilit]
- Lahdelma, R.; Hokkanen, J.; Salminen, P. SMAA—Stochastic multiobjective acceptability analysis. Eur. J. Oper. Res. 1998, 106, 137–143. [Google Scholar] [CrossRef] [Scilit]
- ASTM D2240-15; Standard Test Method for Rubber Property—Durometer Hardness. ASTM International: West Conshohocken, PA, USA, 2015.
- ISO 527-2:2012; Plastics—Determination of Tensile Properties—Part 2: Test Conditions for Moulding and Extrusion Plastics. International Organization for Standardization: Geneva, Switzerland, 2012.
- ISO 37:2017; Rubber, Vulcanized or Thermoplastic—Determination of Tensile Stress–Strain Properties. International Organization for Standardization: Geneva, Switzerland, 2017.
- ISO 4287:1997; Geometrical Product Specifications (GPS)—Surface Texture: Profile Method—Terms, Definitions and Surface Texture Parameters. International Organization for Standardization: Geneva, Switzerland, 1997.
- ISO 13565-2:1996; Geometrical Product Specifications (GPS)—Surface Texture: Profile Method; Surfaces Having Stratified Functional Properties—Part 2: Height Characterization Using the Linear Material Ratio Curve. International Organization for Standardization: Geneva, Switzerland, 1996.
- ISO 527-1:2019; Plastics—Determination of Tensile Properties—Part 1: General Principles. International Organization for Standardization: Geneva, Switzerland, 2019.
- ASTM D7791-17; Standard Test Method for Uniaxial Fatigue Properties of Plastics. ASTM International: West Conshohocken, PA, USA, 2017.
- ASTM G154-16; Standard Practice for Operating Fluorescent Ultraviolet (UV) Lamp Apparatus for Exposure of Materials. ASTM International: West Conshohocken, PA, USA, 2016.
- ISO 4892-3:2016; Plastics—Methods of Exposure to Laboratory Light Sources—Part 3: Fluorescent UV Lamps. International Organization for Standardization: Geneva, Switzerland, 2016.
- Schneider, C.A.; Rasband, W.S.; Eliceiri, K.W. NIH Image to ImageJ: 25 years of image analysis. Nat. Methods 2012, 9, 671–675. [Google Scholar] [CrossRef] [Scilit] [PubMed]
- ISO 14040:2006; Environmental Management—Life Cycle Assessment—Principles and Framework. International Organization for Standardization: Geneva, Switzerland, 2006.
- ISO 14044:2006; Environmental Management—Life Cycle Assessment—Requirements and Guidelines. International Organization for Standardization: Geneva, Switzerland, 2006.
- Wernet, G.; Bauer, C.; Steubing, B.; Reinhard, J.; Moreno-Ruiz, E.; Weidema, B. The ecoinvent database version 3 (part I): Overview and methodology. Int. J. Life Cycle Assess. 2016, 21, 1218–1230. [Google Scholar] [CrossRef] [Scilit]
- Huijbregts, M.A.J.; Steinmann, Z.J.N.; Elshout, P.M.F.; Stam, G.; Verones, F.; Vieira, M.; Zijp, M.; Hollander, A.; van Zelm, R. ReCiPe2016: A harmonised life cycle impact assessment method at midpoint and endpoint level. Int. J. Life Cycle Assess. 2017, 22, 138–147. [Google Scholar] [CrossRef] [Scilit]
- Welch, B.L. The generalization of `Student’s’ problem when several different population variances are involved. Biometrika 1947, 34, 28–35. [Google Scholar] [CrossRef] [Scilit]
- Holm, S. A simple sequentially rejective multiple test procedure. Scand. J. Stat. 1979, 6, 65–70. [Google Scholar]
- Basquin, O.H. The exponential law of endurance tests. Proc. Am. Soc. Test. Mater. 1910, 10, 625–630. [Google Scholar]
- Gent, A.N.; Lindley, P.B. Internal rupture of bonded rubber cylinders in tension. Proc. R. Soc. Lond. A 1959, 249, 195–205. [Google Scholar] [CrossRef] [Scilit]
- ISO 10993-12:2021; Biological Evaluation of Medical Devices—Part 12: Sample Preparation and Reference Materials. International Organization for Standardization: Geneva, Switzerland, 2021.
- Qi, H.J.; Joyce, K.; Boyce, M.C. Durometer hardness and the stress-strain behavior of elastomeric materials. Rubber Chem. Technol. 2003, 76, 419–435. [Google Scholar] [CrossRef] [Scilit]
- ISO 4288:1996; Geometrical Product Specifications (GPS)—Surface Texture: Profile Method—Rules and Procedures for the Assessment of Surface Texture. International Organization for Standardization: Geneva, Switzerland, 1996.
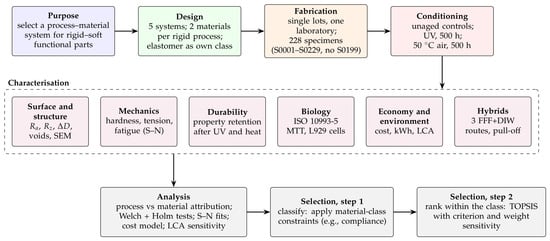
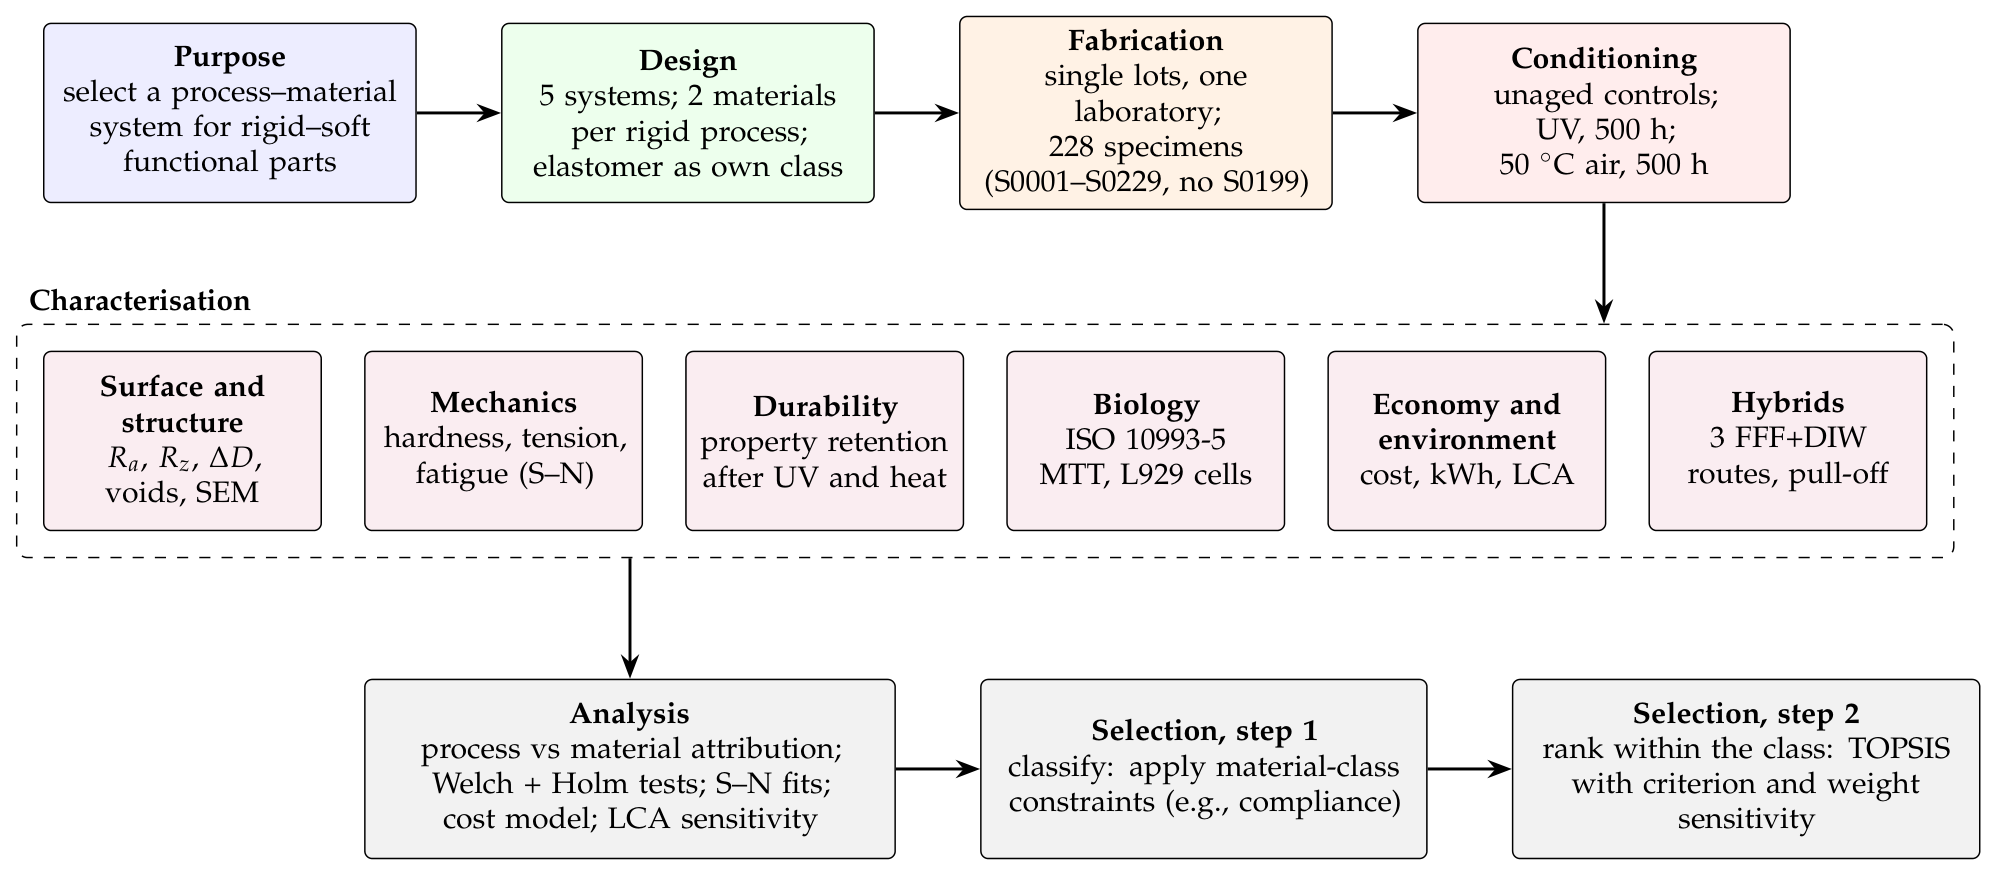
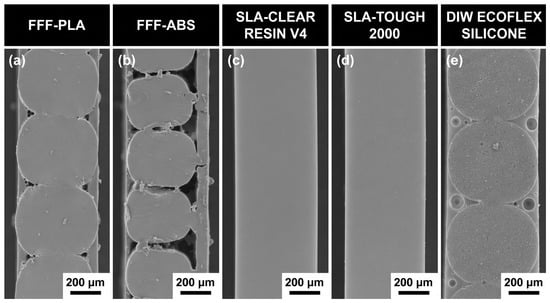
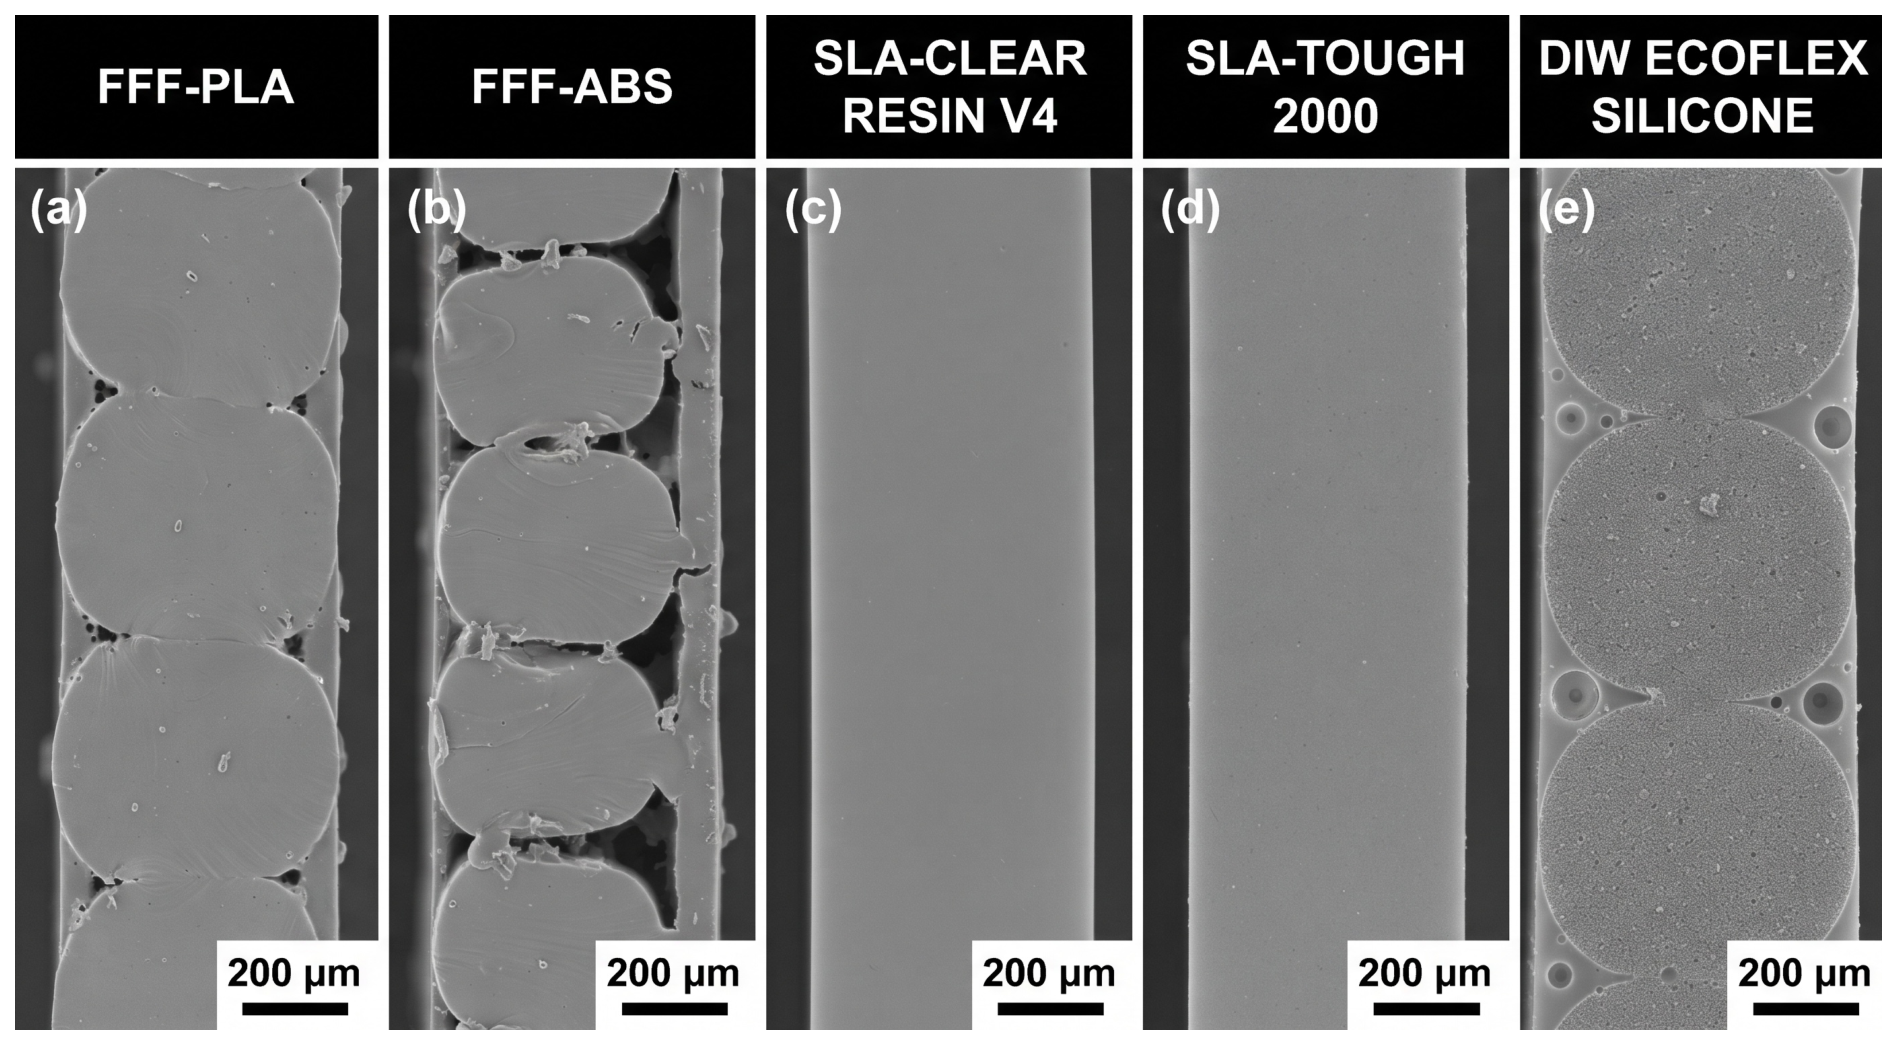
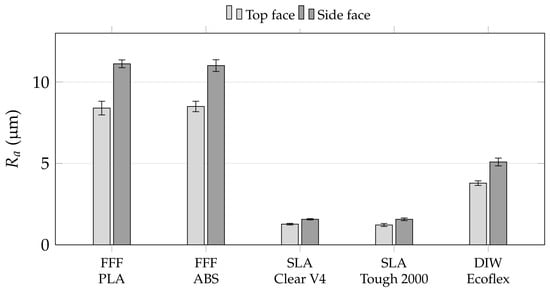
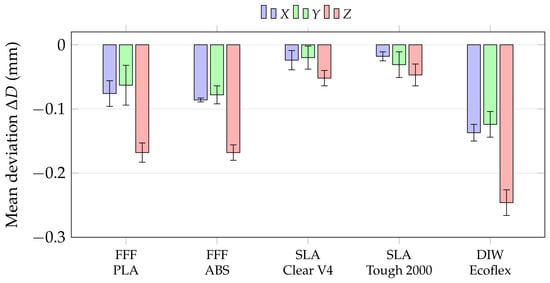
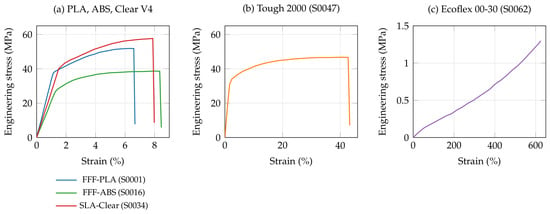
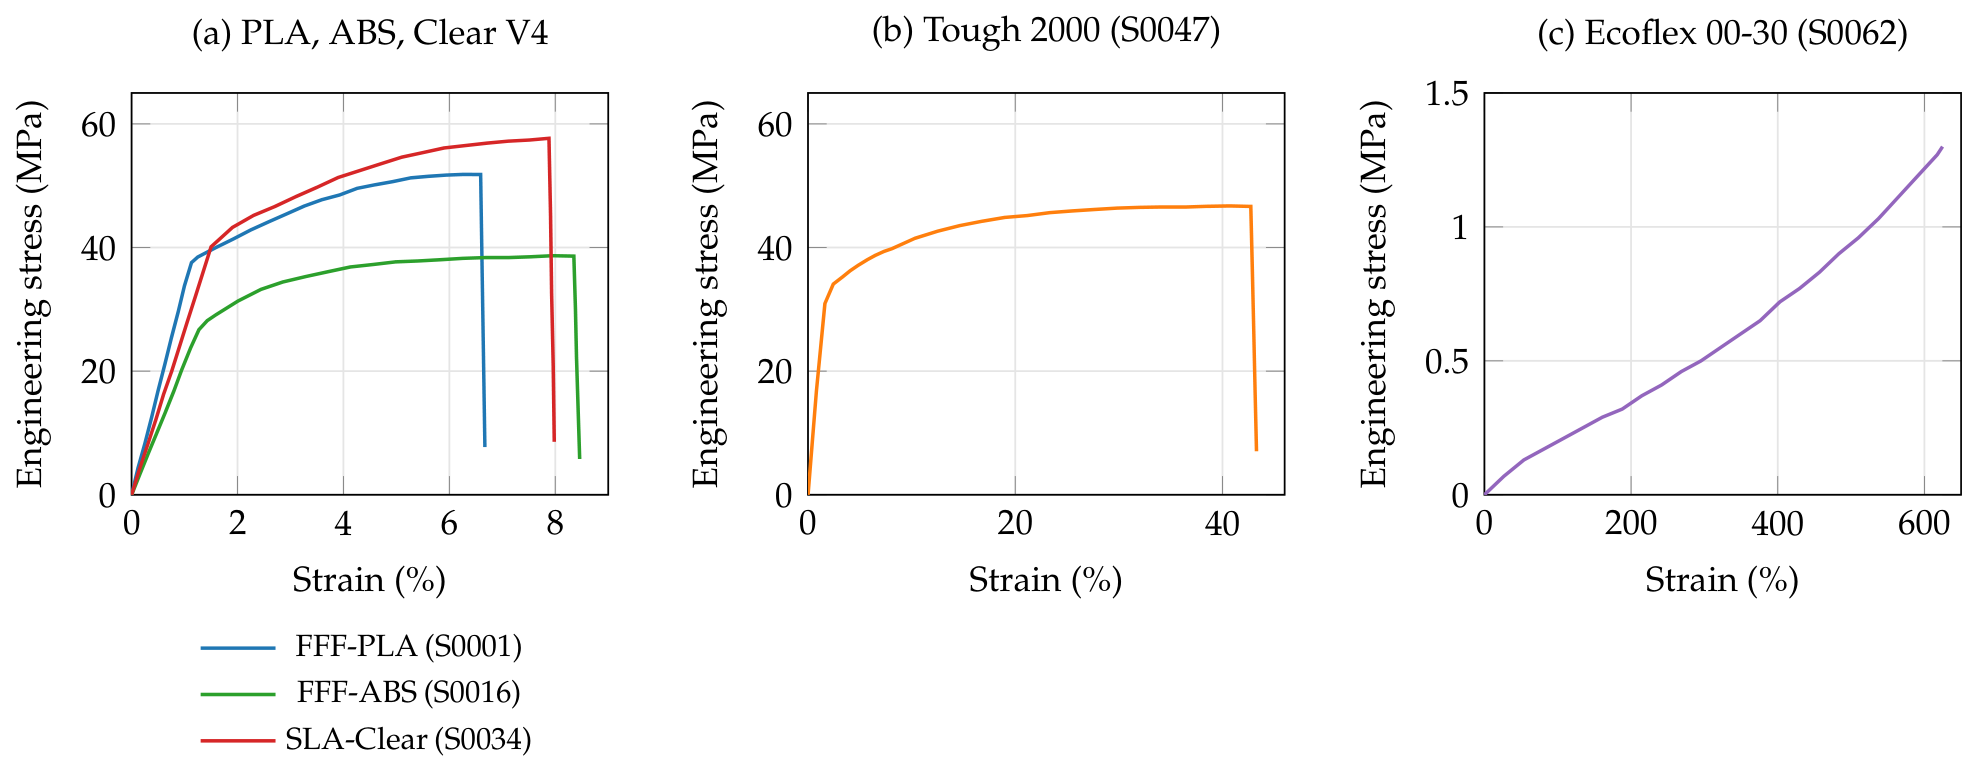
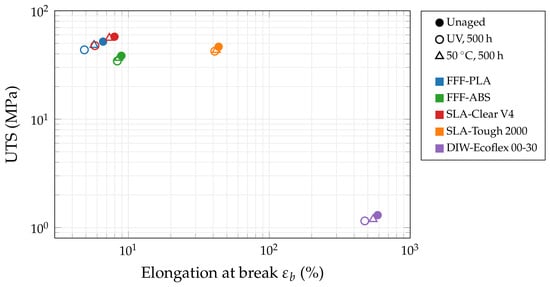
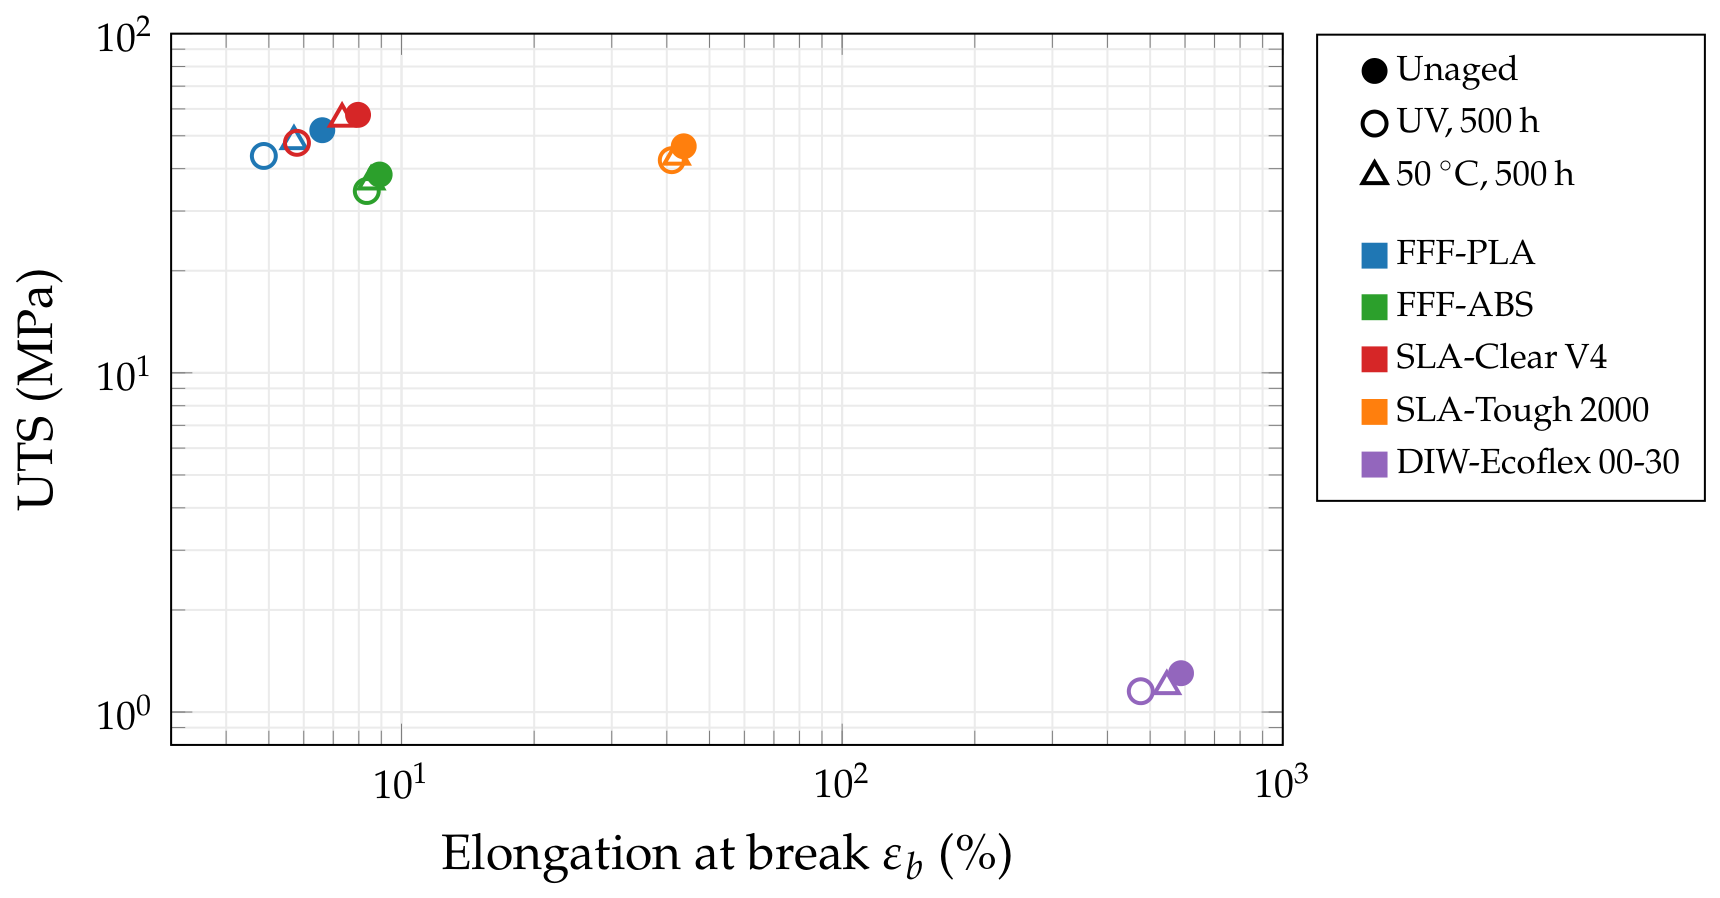
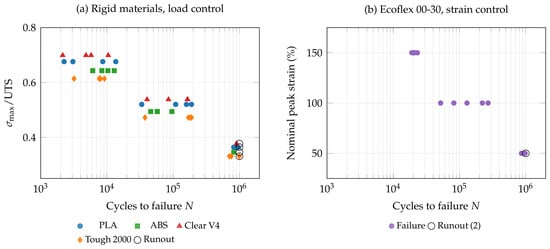
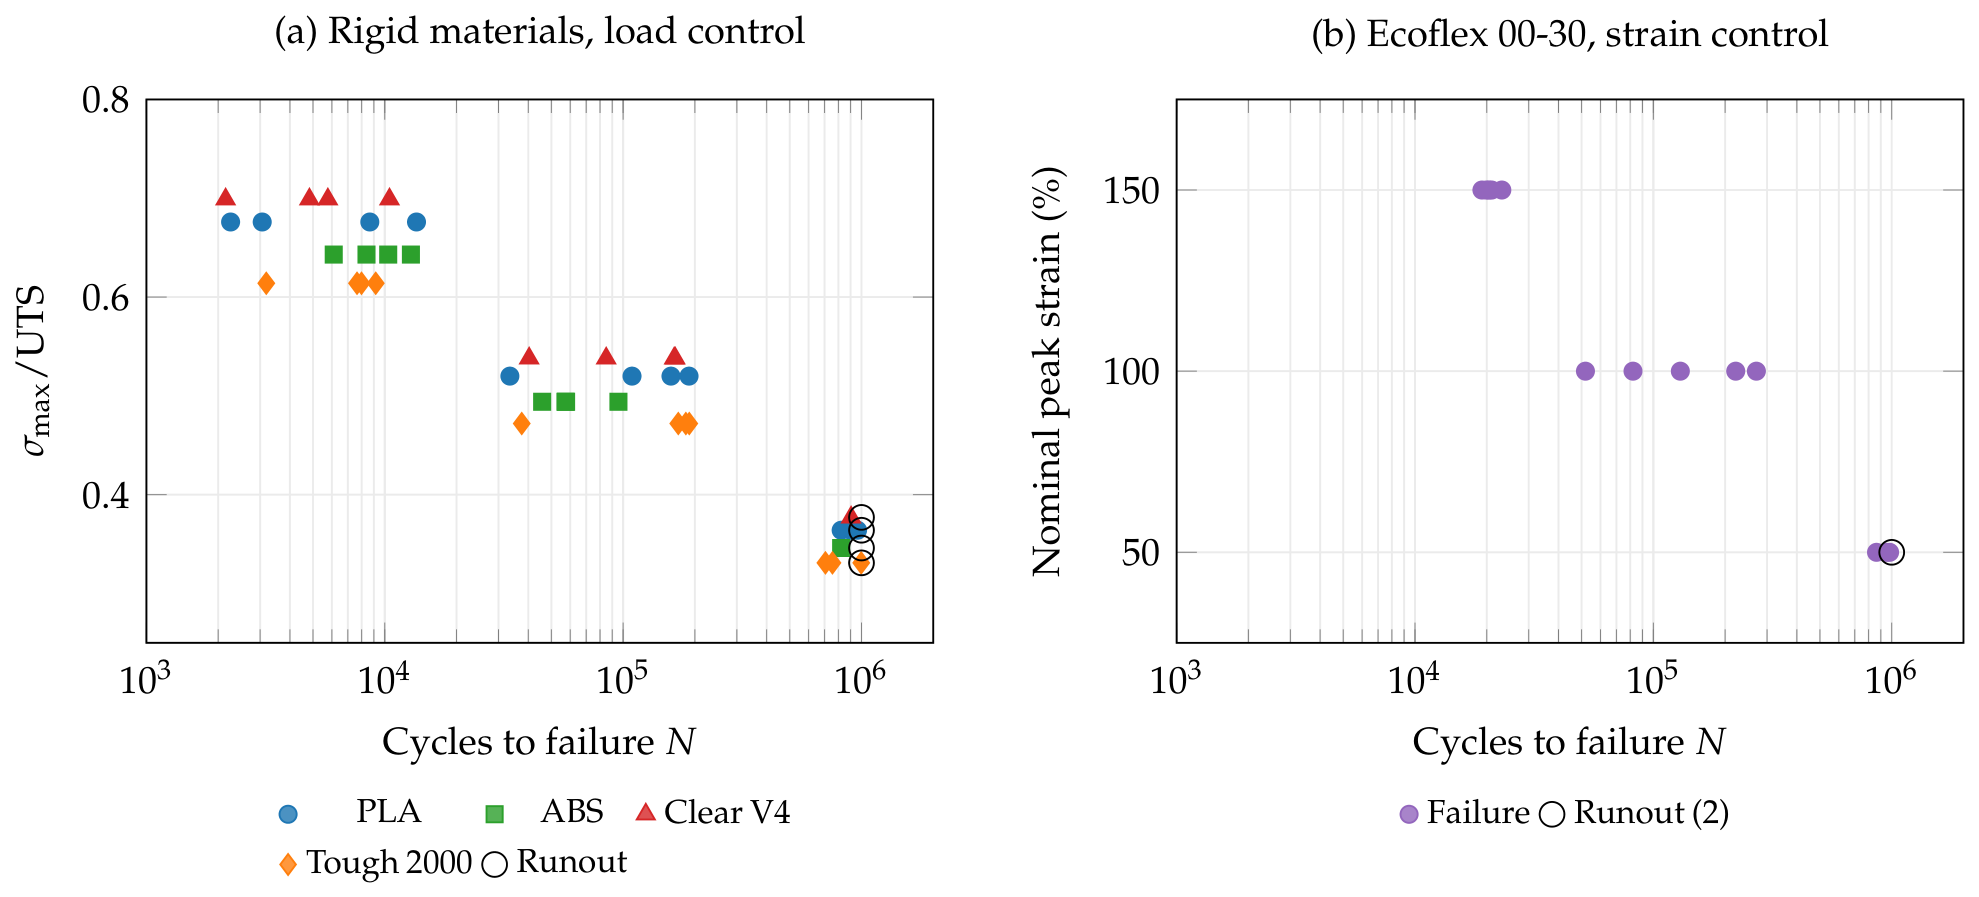
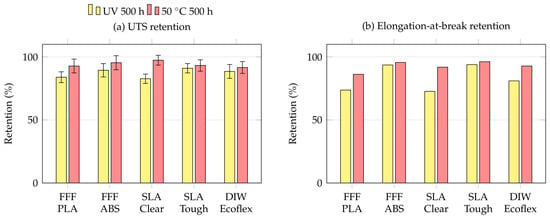
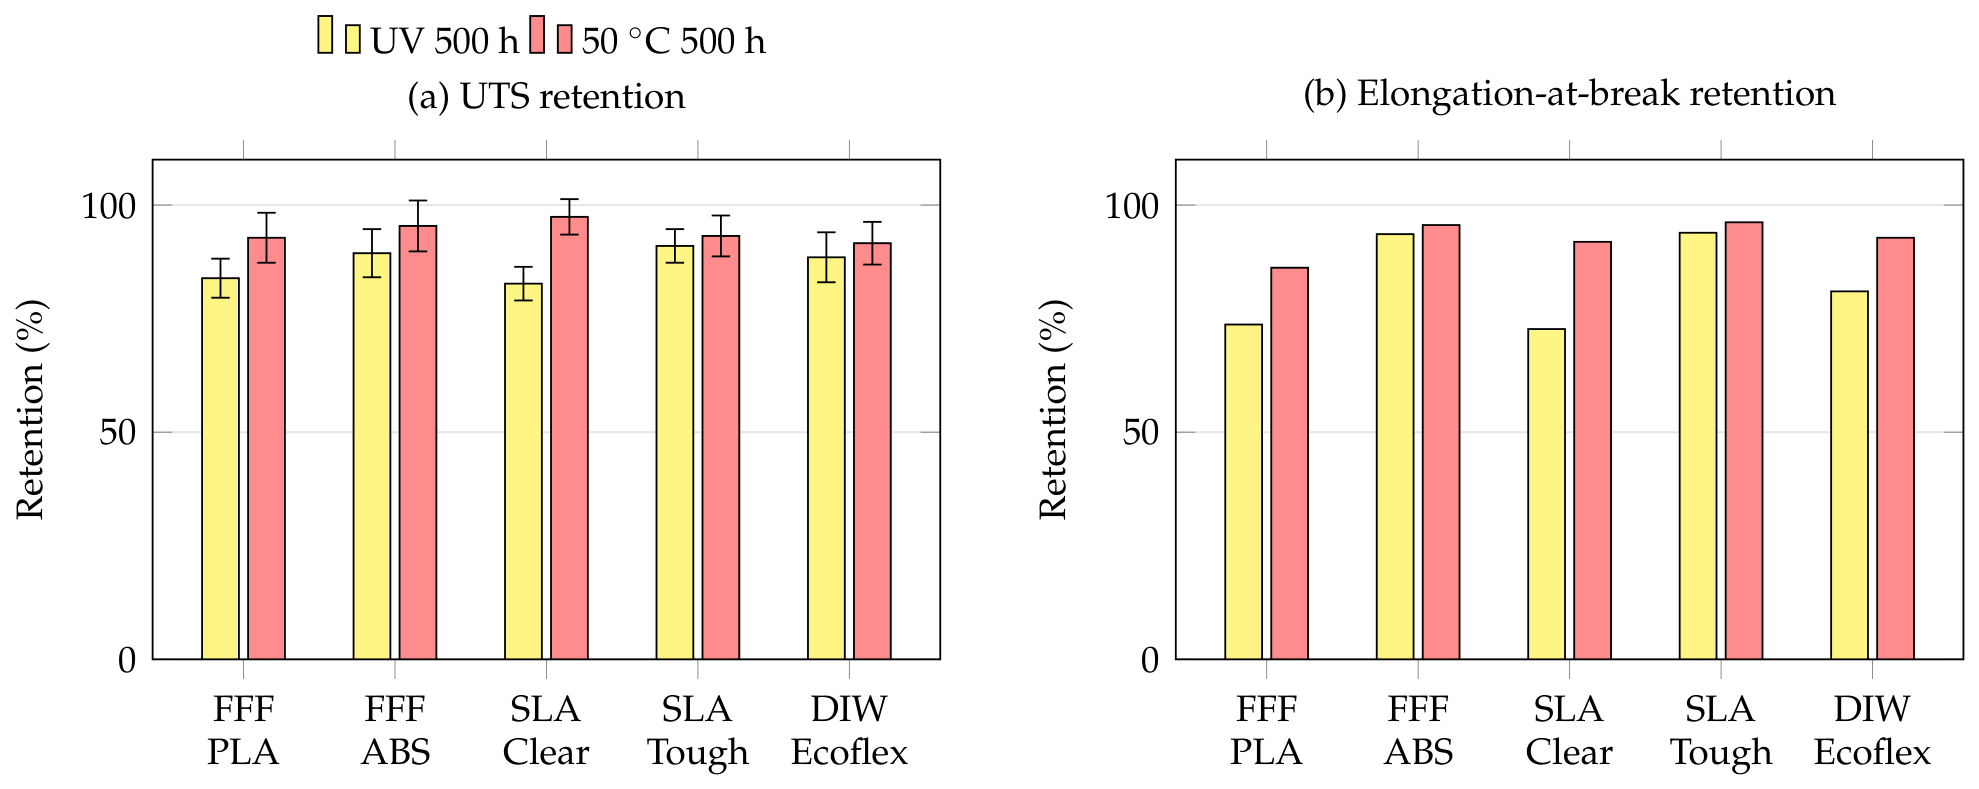
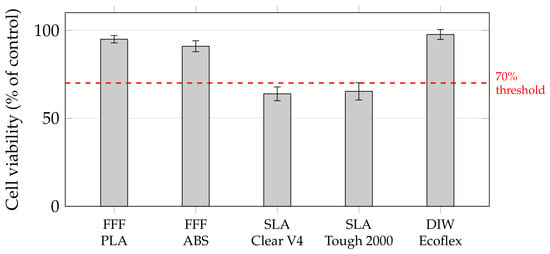
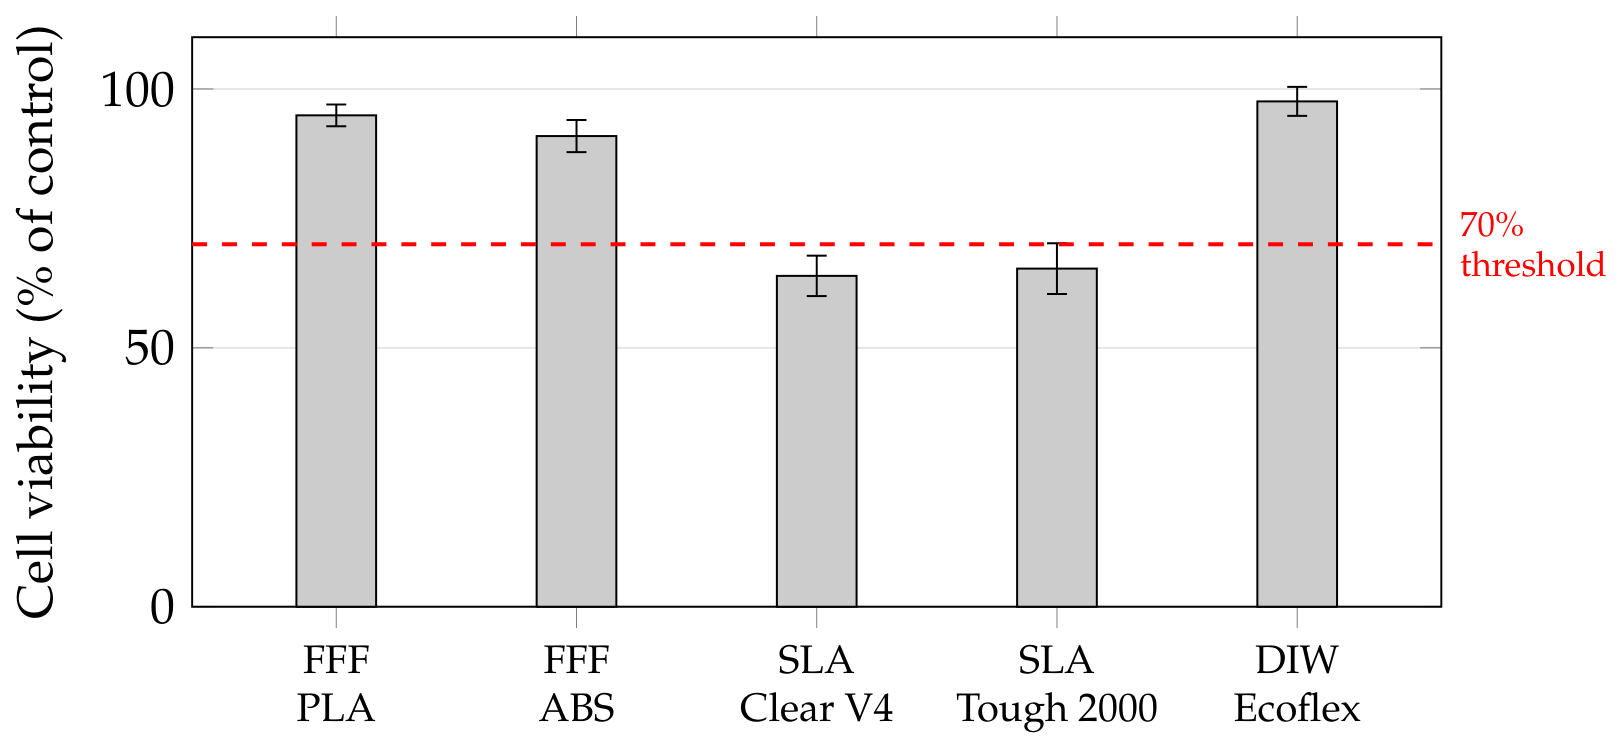
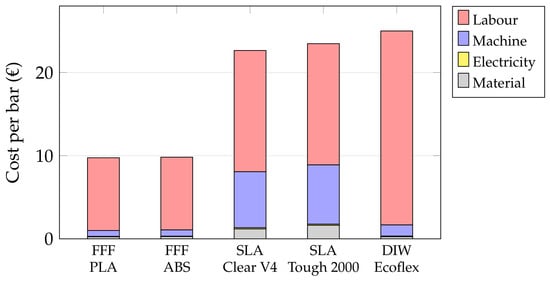
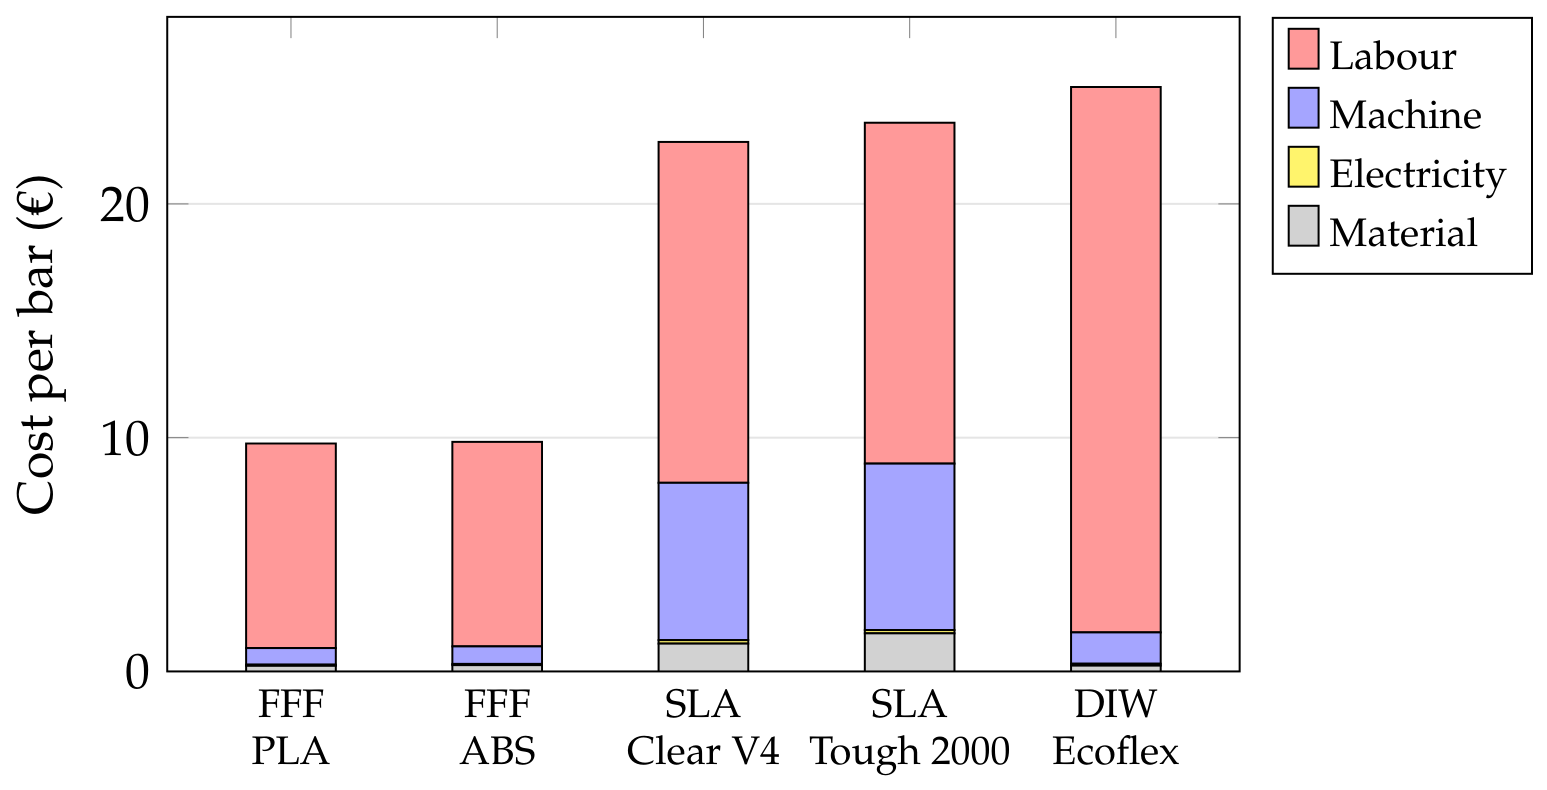
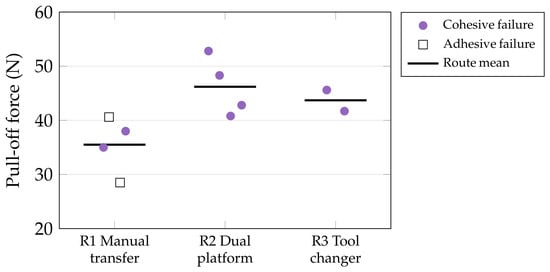
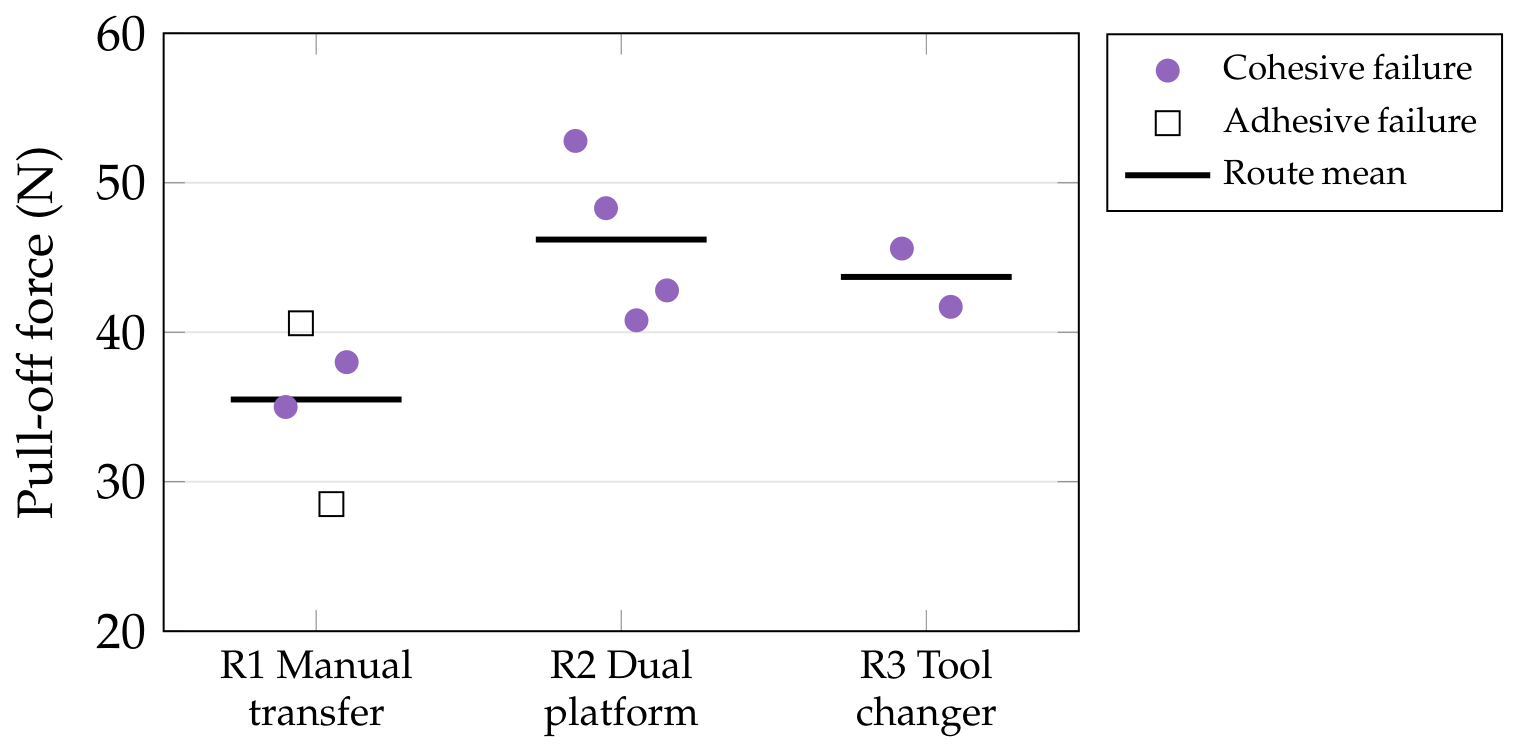
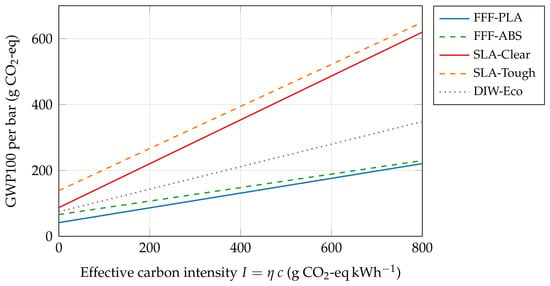
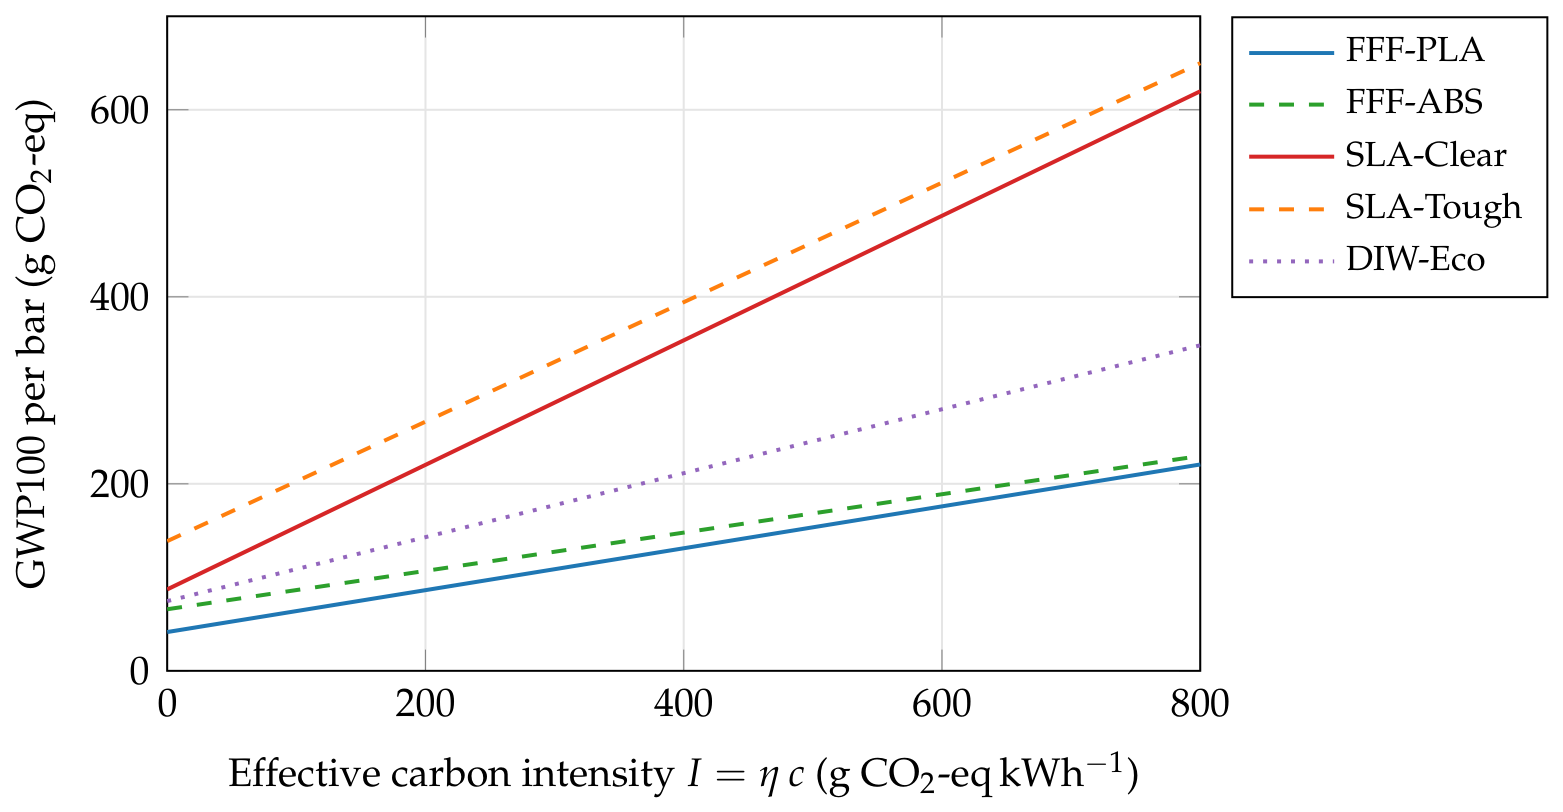
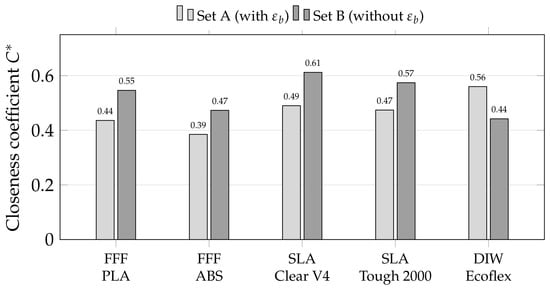
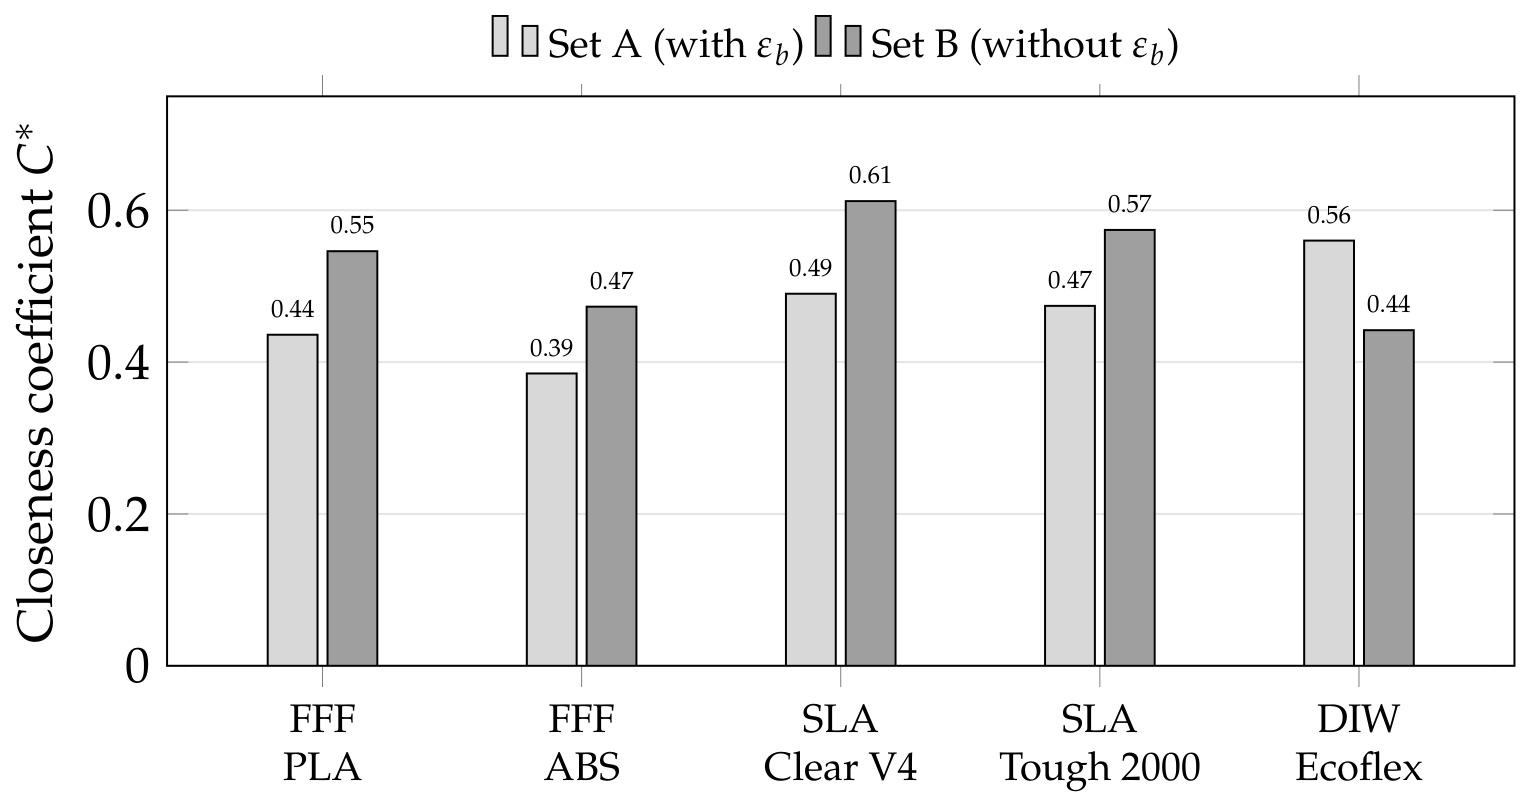

Disclaimer/Publisher’s Note: The statements, opinions and data contained in all publications are solely those of the individual author(s) and contributor(s) and not of MDPI and/or the editor(s). MDPI and/or the editor(s) disclaim responsibility for any injury to people or property resulting from any ideas, methods, instructions or products referred to in the content. |
© 2026 by the authors. Licensee MDPI, Basel, Switzerland. This article is an open access article distributed under the terms and conditions of the Creative Commons Attribution (CC BY) license.